
An Algorithm for Delimiting Rural Areas According to Soil Classes

Department the Faculty of Environmental, Geomatic and Energy Engineering, Kielce University of Technology, 25-314 Kielce, Poland
Land 2022, 11(2), 158; https://0-doi-org.brum.beds.ac.uk/10.3390/land11020158
Submission received: 17 November 2021
/
Revised: 30 December 2021
/
Accepted: 4 January 2022
/
Published: 19 January 2022
(This article belongs to the Topic Frontier Studies in Composition of Humic Substances and Soil Organic Matter)
Abstract
:For many years and all over the world, agricultural production has been observed to slow down on low-quality soils in territories featuring difficult topography and poor spatial structure (land fragmentation, excessive elongation of plots, plots without direct access to public roads, and land scattering). This paper proposes a new, self-designed algorithm for delimiting rural areas that allows the clustering of villages featuring low soil productivity, based on three factors used for determining the overall value of the area of land (Wcag), i.e., the overall area of the village (ha), share of specific type of land in the overall area of the village (%), and mean score for specific soil type (pts.), which allows the villages to be grouped according to classes of land occurring in the examined district. The results of the surveys provide a basis for further detailed studies into efficient management of areas featuring low soil classes during land consolidation works. Further surveys will involve a detailed analysis of the identified clusters of villages to ensure that their potential is used to the optimum extent. As a consequence, these areas will potentially become more competitive and operations conducted there will be beneficial to the local inhabitants and contribute to improving their living standard.
1. Introduction
For decades, many countries of the European Union or Asia have been challenged by problems of abandoned agricultural land. Reasons for discontinuing agricultural production have been investigated by many researchers [1,2,3,4]. Such a state of affairs is due to multiple factors, including land fragmentation, excessive elongation of plots, presence of plots without direct access to public roads, and land scattering. It should be remembered that agricultural land is an important and necessary factor in food production, so preventing the abandonment of land is an important element of food security [5,6]. Agricultural production is carried out mostly in areas generating high yield at a low workload by using specialist agricultural equipment, including land with good-quality soils intensively used for farming. Areas that require a high workload are exposed to a decreasing surface area of crops or to changes in agricultural production trends and are, in addition, adversely affected by the accelerated rate of climate change, including demographic processes [7,8,9], as well as social and economic processes [10]. This is corroborated by studies [11] revealing a clear demographic trend connected to the migration of the younger population to cities and their unwillingness to take over relatively small farms generating low income. Discontinuation of agricultural production refers mainly to areas with difficult topography [12,13] that also feature low-quality soils [14] and very unfavourable fragmentation of land [15]. Climate change is a factor that significantly contributes to abandoning agricultural production. Small resources of water and uneven distribution of atmospheric precipitation, together with low water-retention capacity, constitute obstacles to agricultural production. It has a significant impact on the natural conditions, and in particular on access to water in many areas where traditional agriculture is practised [16]. Central and Eastern Europe is a region in which agricultural land is intensively abandoned. This fact is associated with attempts at aligning agriculture with changes after the collapse of socialism in the 1990s [17,18,19,20,21,22]. Decreased production in rural areas leads to an intensive increase in forest cover due to natural forest succession. The immediate neighbourhood of plots overgrown with forests, in particular in areas featuring adverse fragmentation of land, is an additional adverse element decreasing crop yield due to limited access to light, water, and nutrients. With time, this leads to afforestation or discontinuation of farming activities on plots adjoining forestland [23].
In connection with the fact that for many years agricultural production has been observed to be discontinued in areas featuring low soil classes [24,25,26], and in particular, in sub-mountainous or mountainous areas [27,28,29,30], it is necessary to work out solutions for the reasonable management of these grounds. Land consolidation as a space-ordering tool leads to desired changes in land categories. Consolidation and exchange works should be comprehensive, and they should be connected to post-consolidation management. However, to be able to properly spend the money and efficiently manage areas not suitable for agriculture, it is necessary to do several surveys regarding soil quality, as soil is what determines the options for post-consolidation management of the consolidated object, with a particular focus on areas with limited production potential. Therefore, during land consolidation works, attempts should be made to ensure the best possible management of land with the lowest production capabilities.
In previous studies, among other authors, Wójcik-Leń [31] designed a two-stage computational algorithm calculating—in the first place—a so-called land-quality measure of a specific village as a mean of the score for the class of land weighted by its percentage share in the surface area. Such a measure allowed a village to be placed in a hierarchy according to an adopted criterion. Next, using two tested statistical methods [32], i.e., Ward’s method and the complete-linkage method, rural areas were clustered according to the values of arable land, meadows, and pastures. Studies carried out provided a response to the question of whether land with poor class soils formed a part of the tested object. The studies were supplemented by determining the measure comprising a mean of the scores for a land-quality class weighted with the registered surface area of land in hectares. Afterwards, analogously to the first part, clusters were determined for villages featuring agricultural problem areas.
The method employed in identifying useless agricultural land [31] proved satisfactory in terms of evaluating the actual level of defectiveness of land in the study area. High consistency between the results of each group of selected statistical methods guarantees the right decisions in the development strategy for the specific area. However, a modified algorithm was developed for such analyses to be conducted in a big area (district, voivodeship, or the whole country). Using previously calculated cadastral data (overall area of the village in ha, percentage share of respective type of land in the overall area of the village, and mean score for respective type of land), a self-designed new algorithm was proposed that allowed the overall value of the agricultural area (Wcag) to be determined. This method is faster, more efficient, and allows precise identification of groups of villages featuring the poorest quality of land.
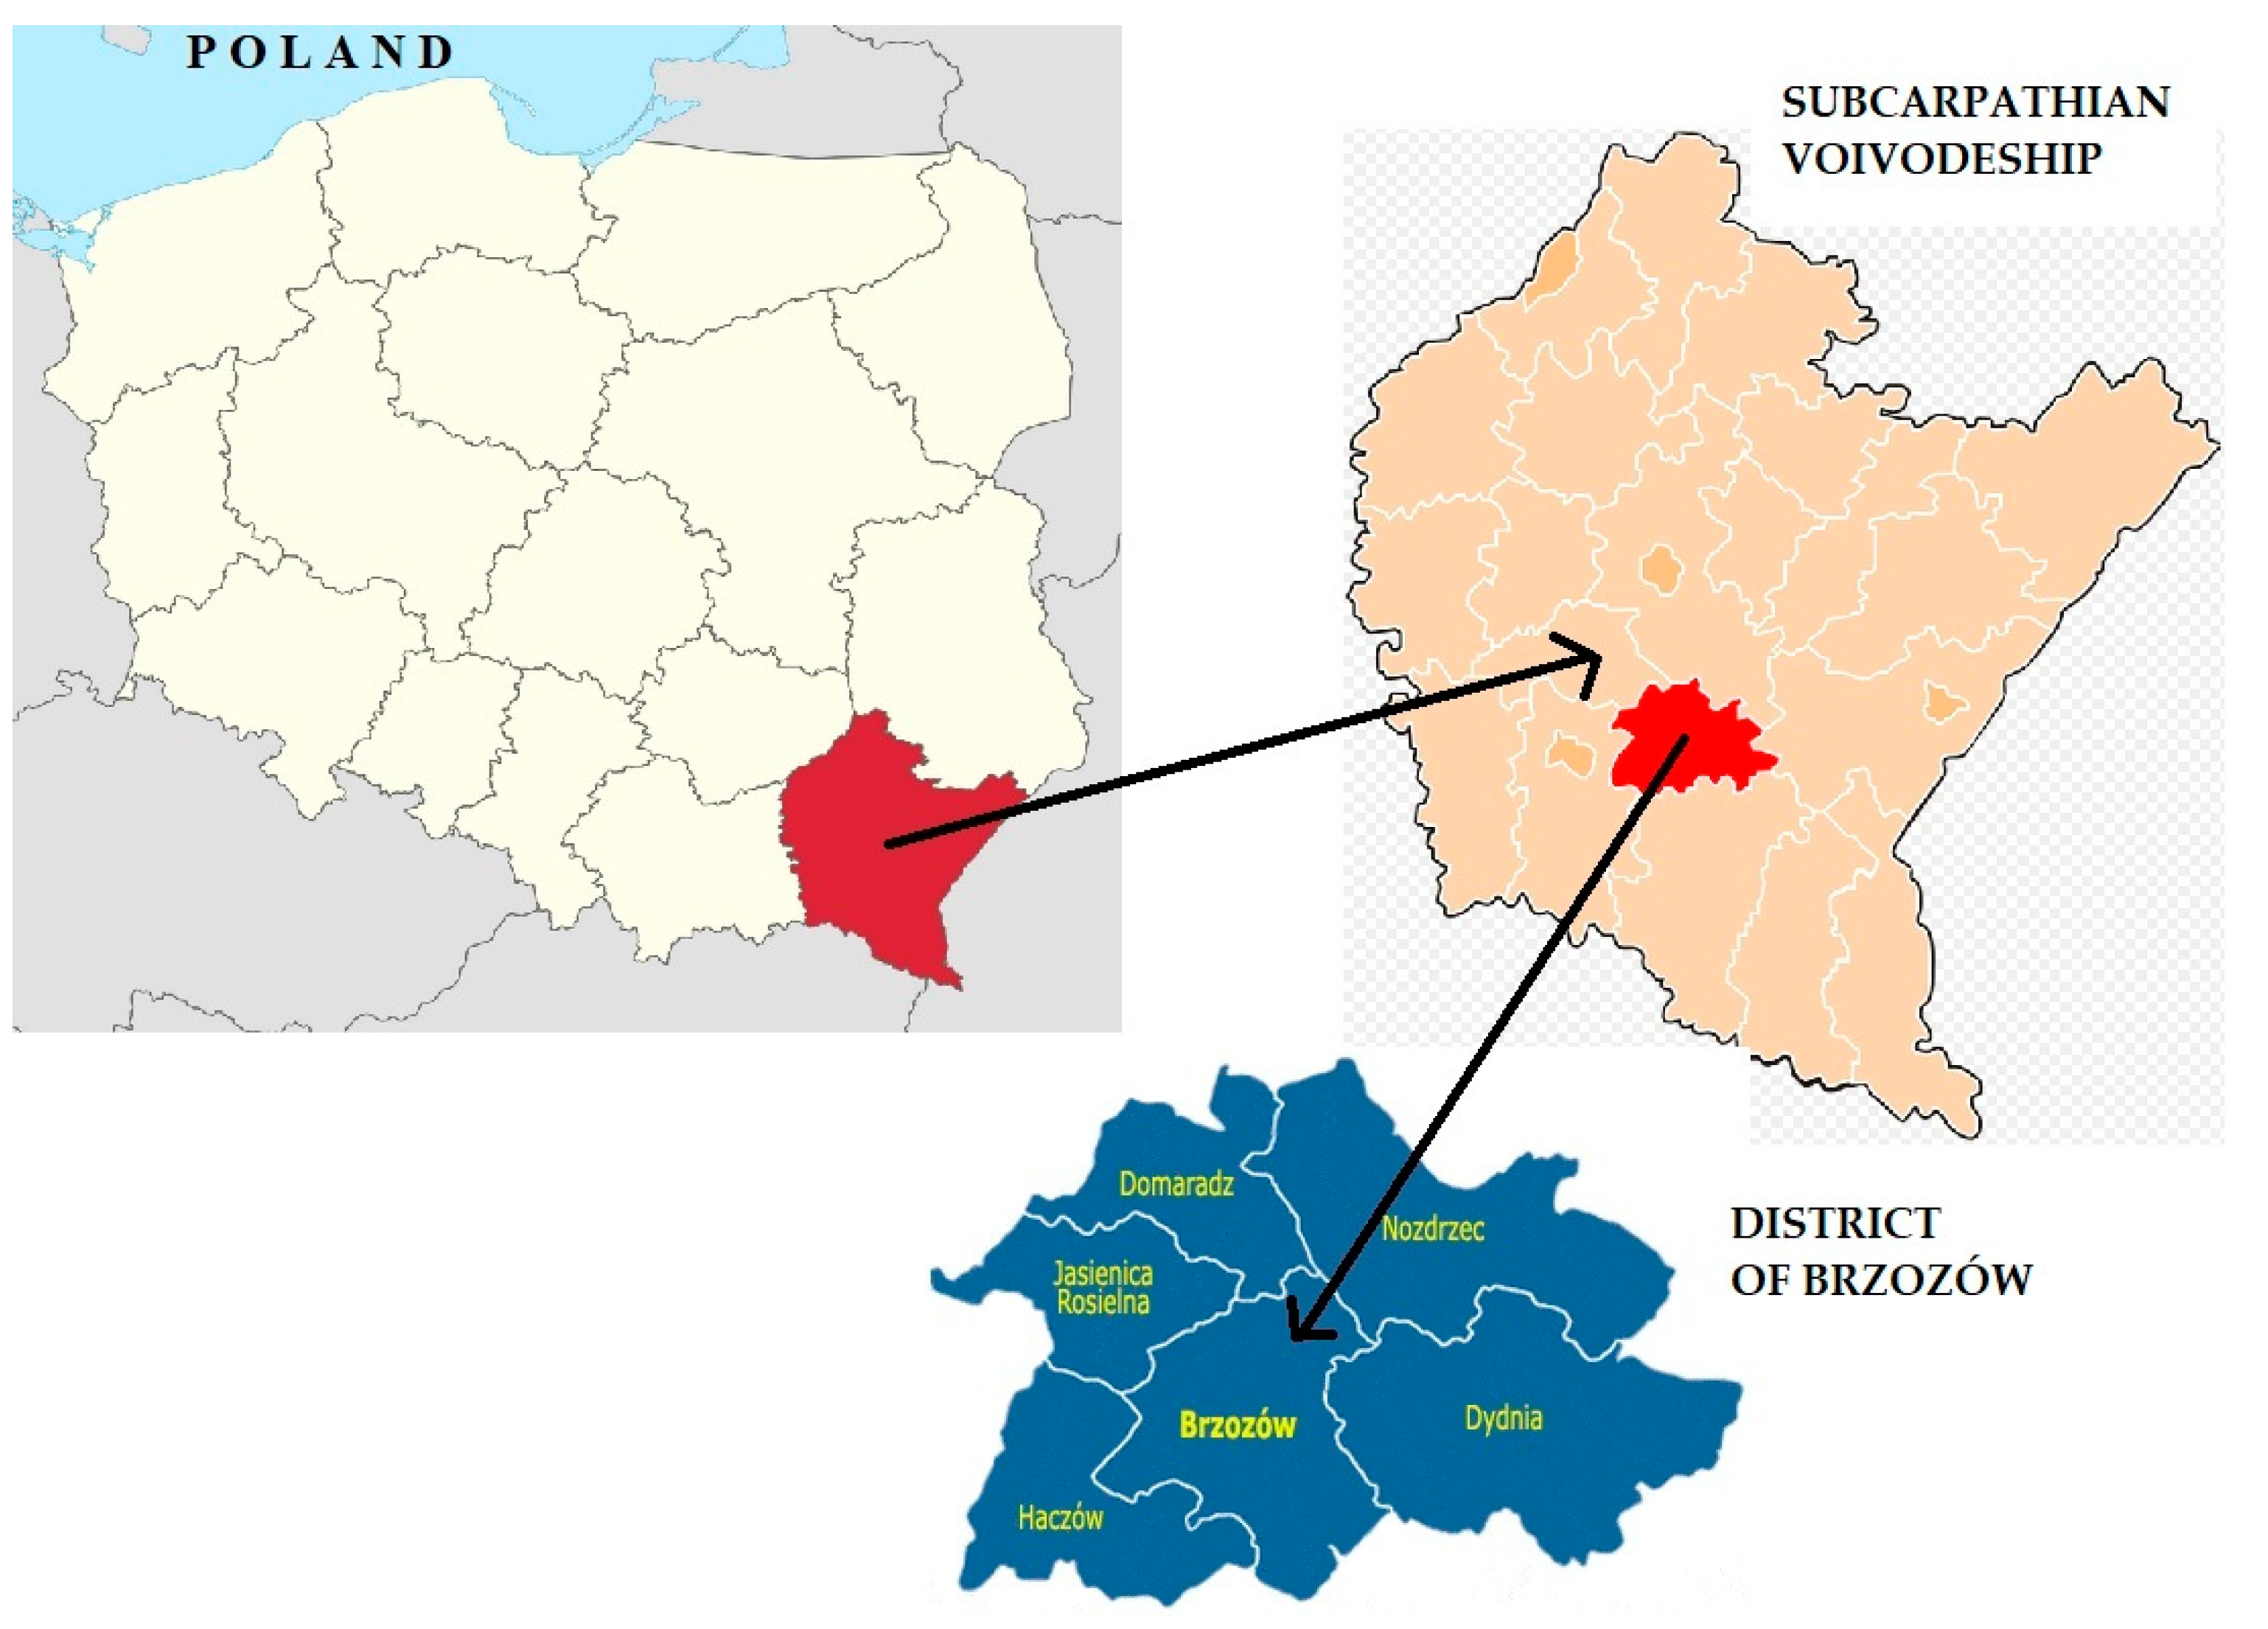
This study aims to use the designed modification of the algorithm to delimit (cluster) rural areas of low use for agriculture, based on three factors that allow the overall value of the area of land (Wcag) to be determined, i.e., the overall area of the village (ha), the share of agricultural land (arable land, meadows, pastures) in the overall area of the village (%), and the mean score for land-use types (arable land, meadows, pastures) (pts.). The study covered 44 villages featuring diversified terrain relief, with a registered surface area totalling 53,941.00 ha, situated in the district of Brzozów, Subcarpathian voivodeship, in southeastern Poland.
2. Materials and Methods
The study area is a complex of 44 villages forming an administrative part of six communes (gminas) in the district (poviat) of Brzozów, situated in southeastern Poland, in the Subcarpathian voivodeship (Figure 1).
Studies carried out in this area [31,32] allowed the authors to collect study material in the form of data from a real property register referring to types and classes of three major uses of land in terms of their share, i.e., arable land, meadows, and pastures. The overall value of the area of land (Wcag) was determined using three factors, i.e., total area of the village (ha), share of the respective type of land (separately for arable land, meadows, and pastures) in the overall area of the village (%), and the mean score for the respective type of land (pts.). The value of the last factor was calculated based on the scores for soil-quality classes of arable land and grassland adopted after [33], whose studies referred to four cereals and potato crop yield. Those studies resulted in determining the production value of arable land and grassland according to soil-quality classes using a 100-point scale (Table 1).
The methods of research comprised calculations for three factors, i.e., overall area of the village in hectares; percentage share (in relation to the overall area of the village) of arable land, meadows, and pastures and the mean score for the respective types of land; and a comparison of results and their presentation as a dendrogram illustrating the process of merging the areas with similar features. The whole computational algorithm provided for clustering separately for arable land, meadows, pastures, and collectively for all agricultural land (arable land, meadows, pastures). Village clustering used the previously tested Ward’s method [31,32] and the distance matrix was squared as Euclidean distances. It should be mentioned that Ward’s method provided very good clustering results that in previous studies [31] were controlled using a different clustering method—the complete-linkage method—leading to 80% concurrence of the results. The studies were carried out using the STATISTICA PLUS programme from StatSoft Polska.
Since the diagnostic features used for clustering are expressed in different units, and—in the first place—have a different order of magnitude, it is necessary to standardise their value. The selected standardisation procedure was classical standardisation according to the formula:
where i is the object number, is the mean value, and s is the standard deviation.
Such converted values have a mean value equalling 0 and standard deviation equalling 1.
Clustering is performed separately for arable land, meadows, pastures, and all agricultural land. It makes use of Ward’s method and the distance matrix squared as Euclidean distances.
3. Results
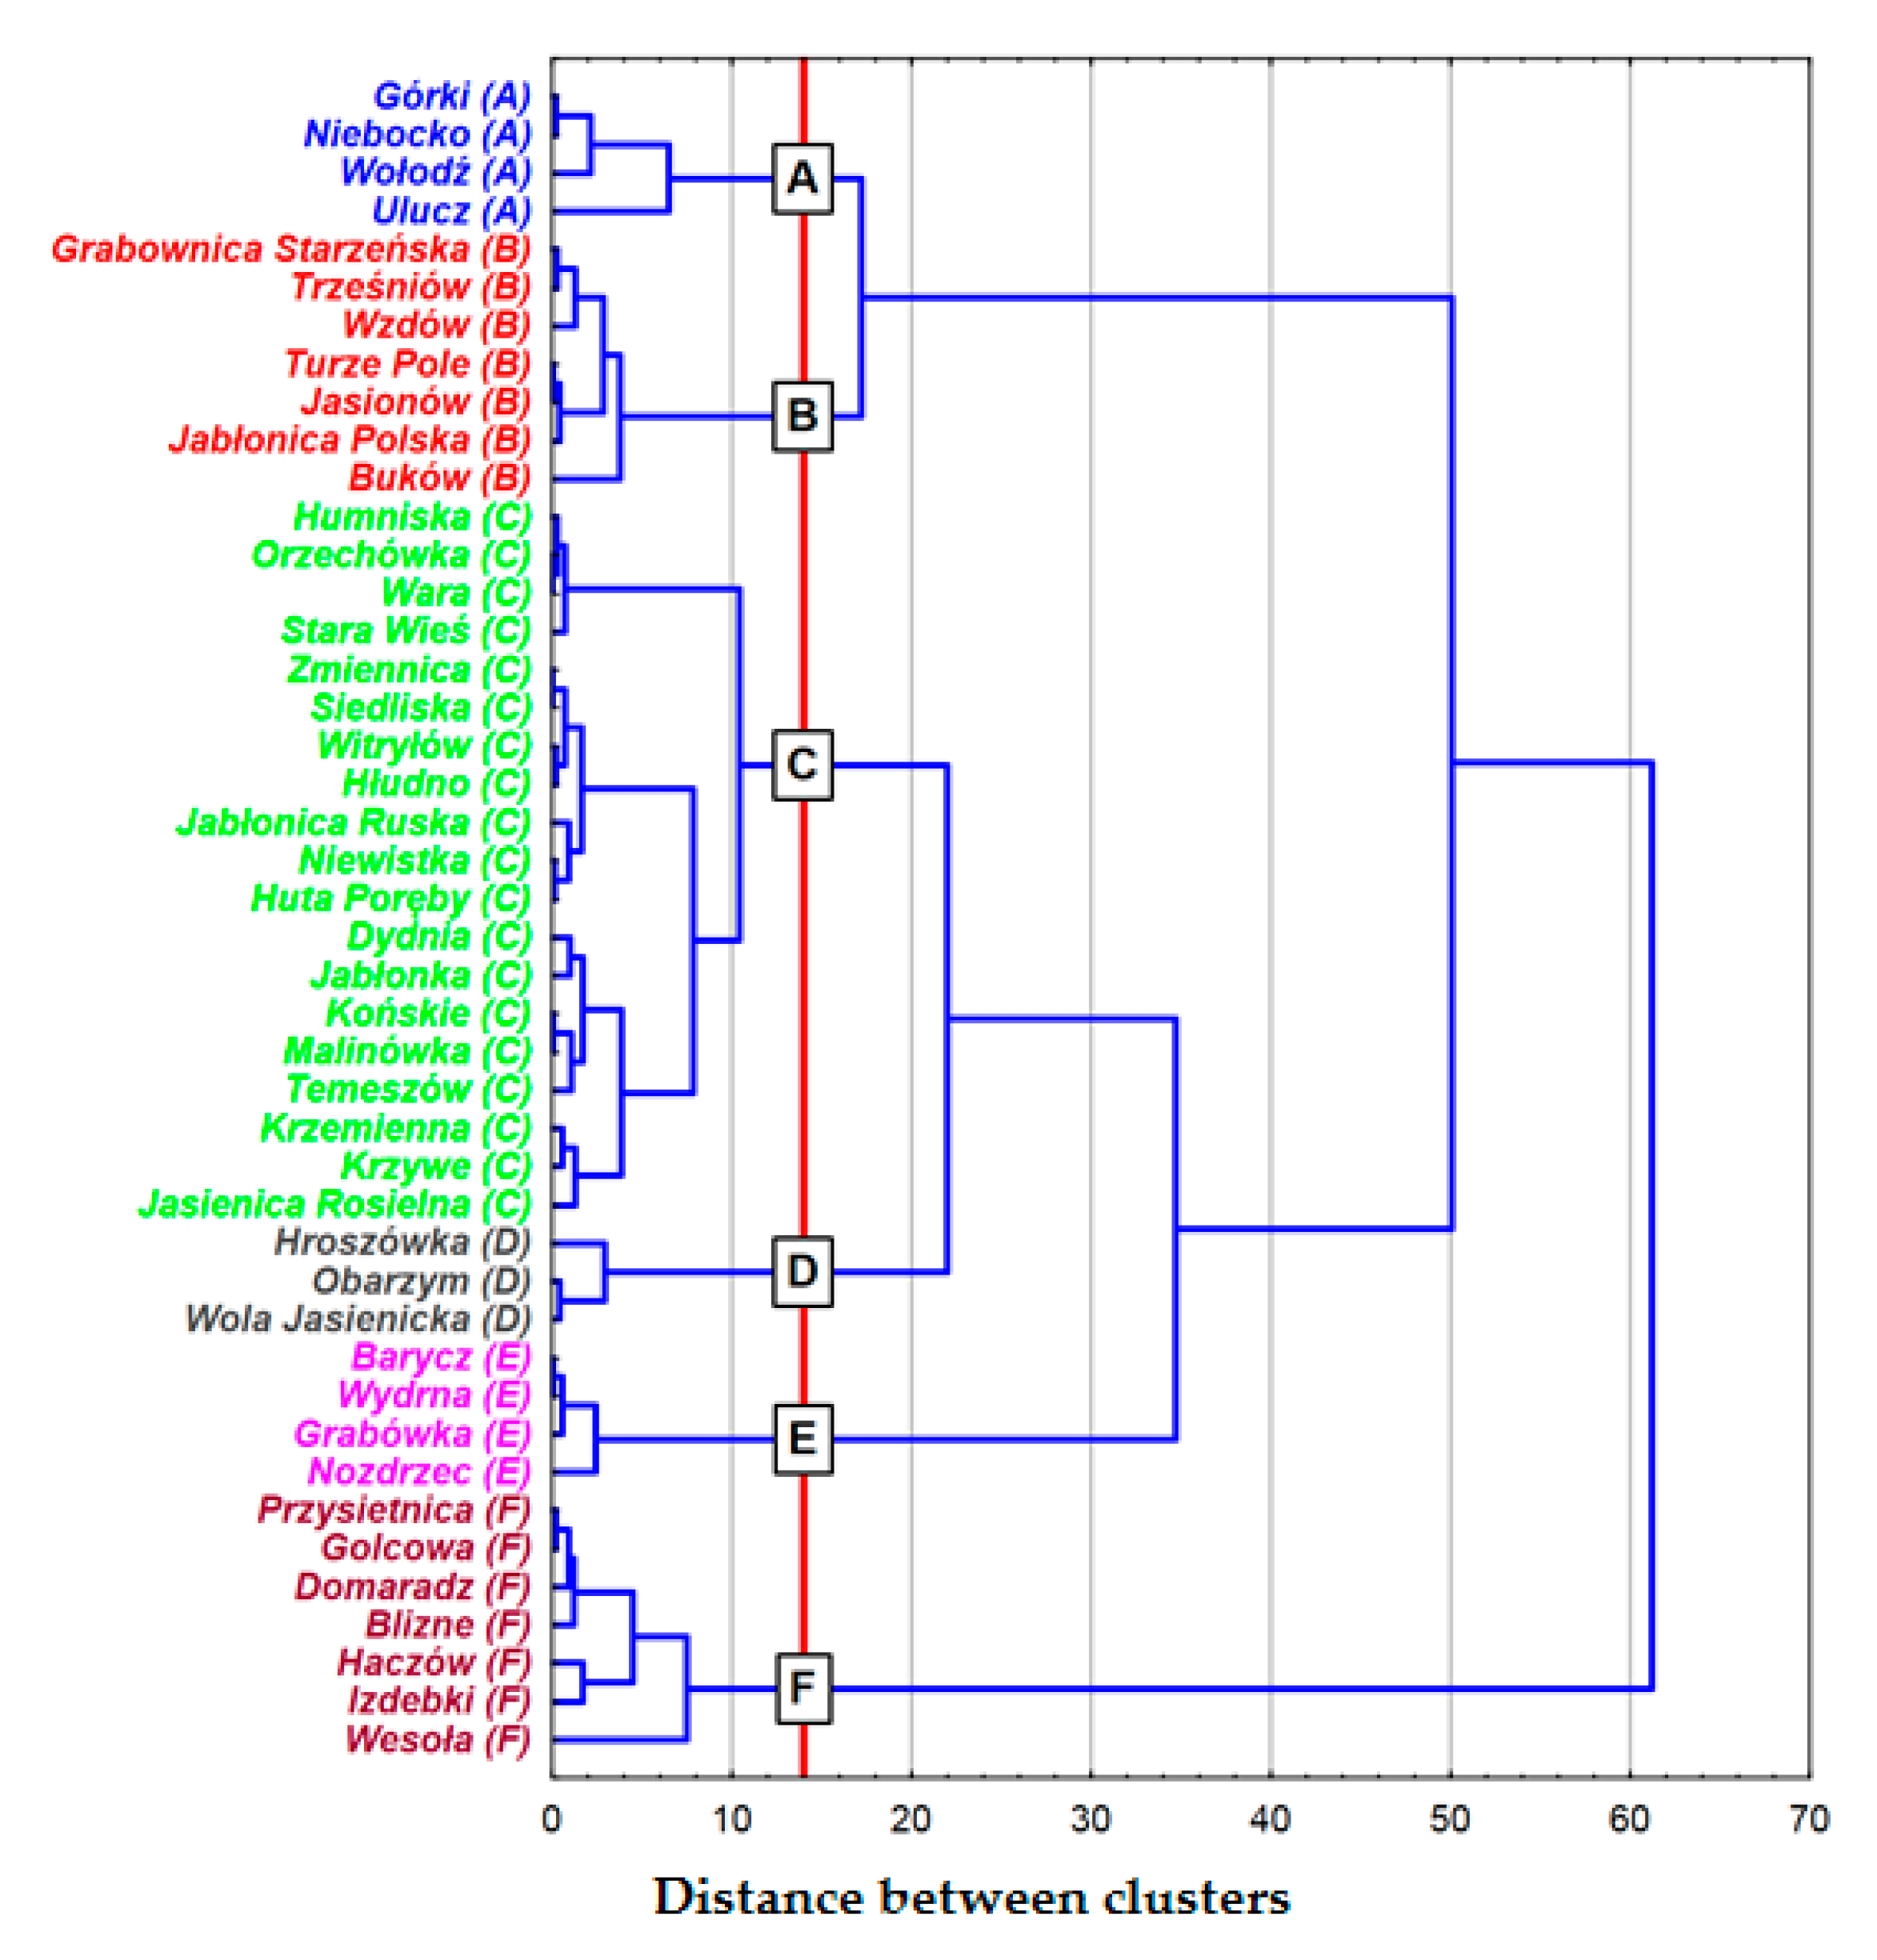
3.1. Clustering of Rural Areas—Arable Land
The results of clustering derived from surveys compiled in Table 2 (mean values for clusters), Table 3 (indicators of mean values for clusters—allows the level of specific mean values for clusters to be compared with the overall mean value), and Table 4 (general characteristics of the distribution of quality measures) made it possible to provide a precise description of six clearly identified clusters (Figure 2).
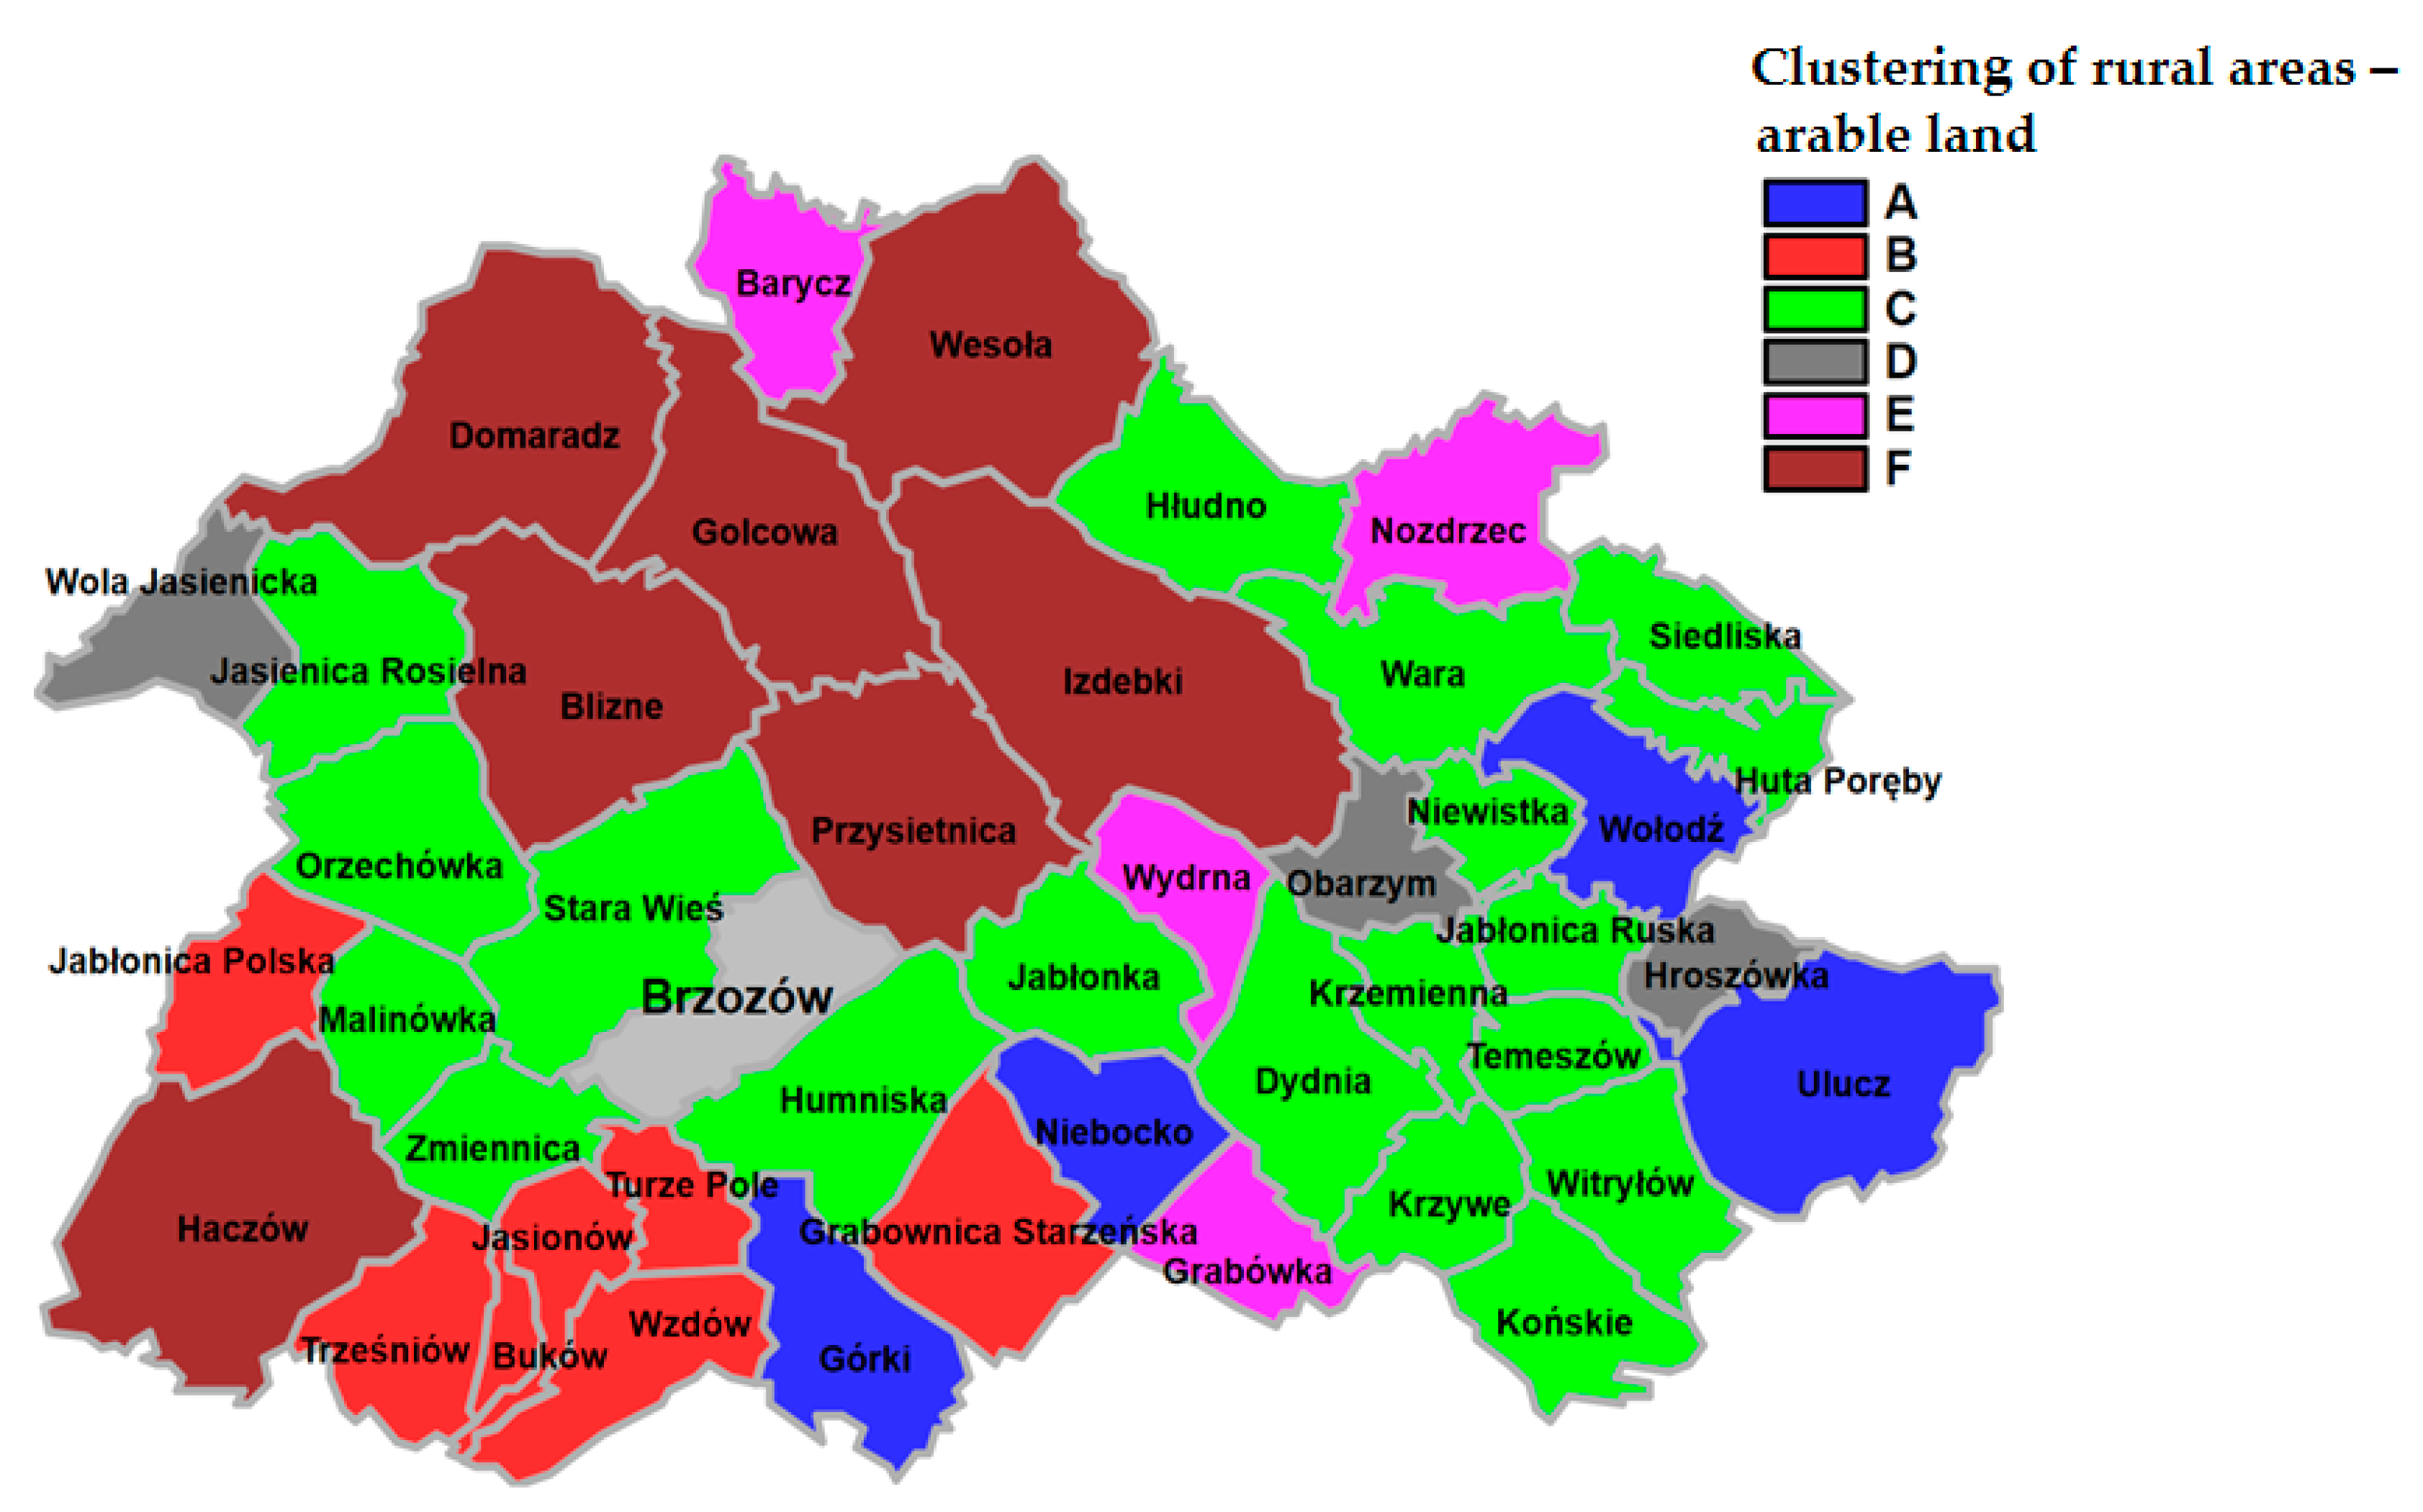
Considering the study in terms of delimiting areas featuring the worst soil classes, the arrangement of these characteristics was clearly the worst in Group D, featuring the smallest area of land, the lowest share of arable land, and definitely the poorest soil quality. These villages had a very diverse terrain relief as well as high (Obarzym 53.3%, Wola Jasienicka 52.0%) and very high share of forestland (Hroszówka 97.0%). Group E corresponded to areas with poor soil quality but featuring a high-percentage share of land in the overall area of the village. In turn, villages from Group A featured the highest quality of arable land but the percentage share in the overall area was low. The spatial distribution of clusters is illustrated by Figure 3 and the number of villages in respective clusters is presented in Table 5.
3.2. Clustering of Rural Areas—Meadows
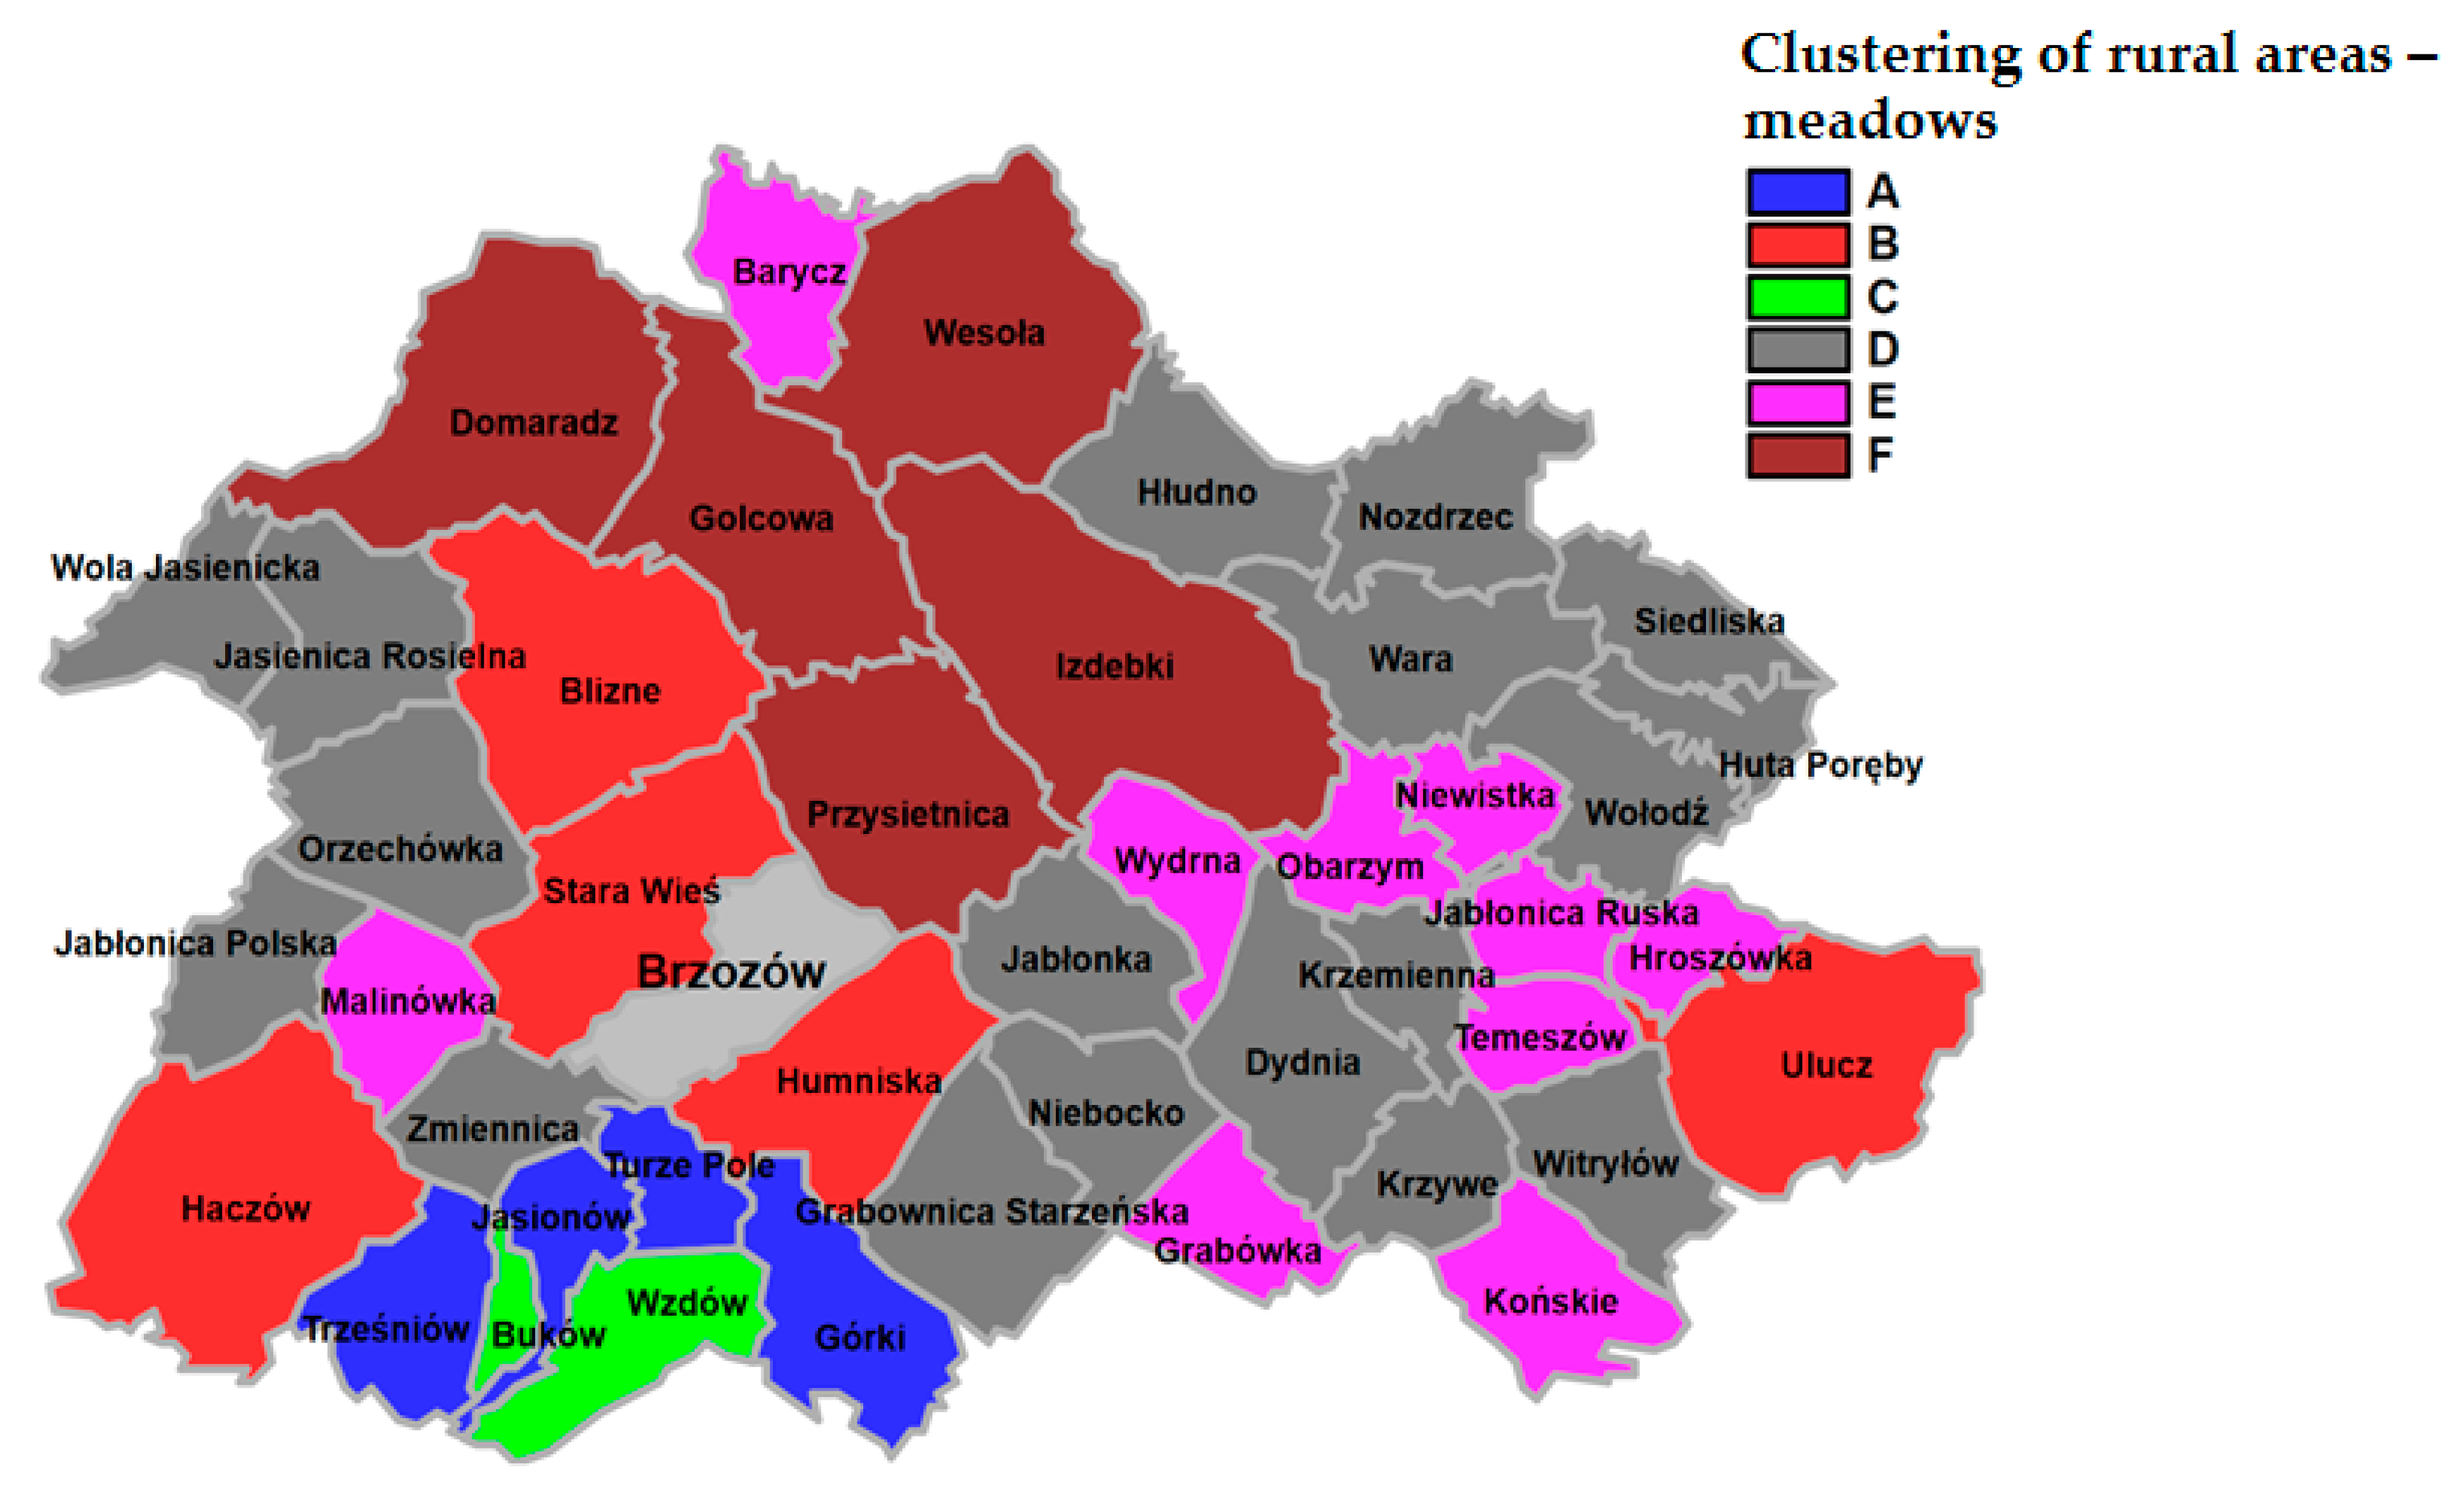
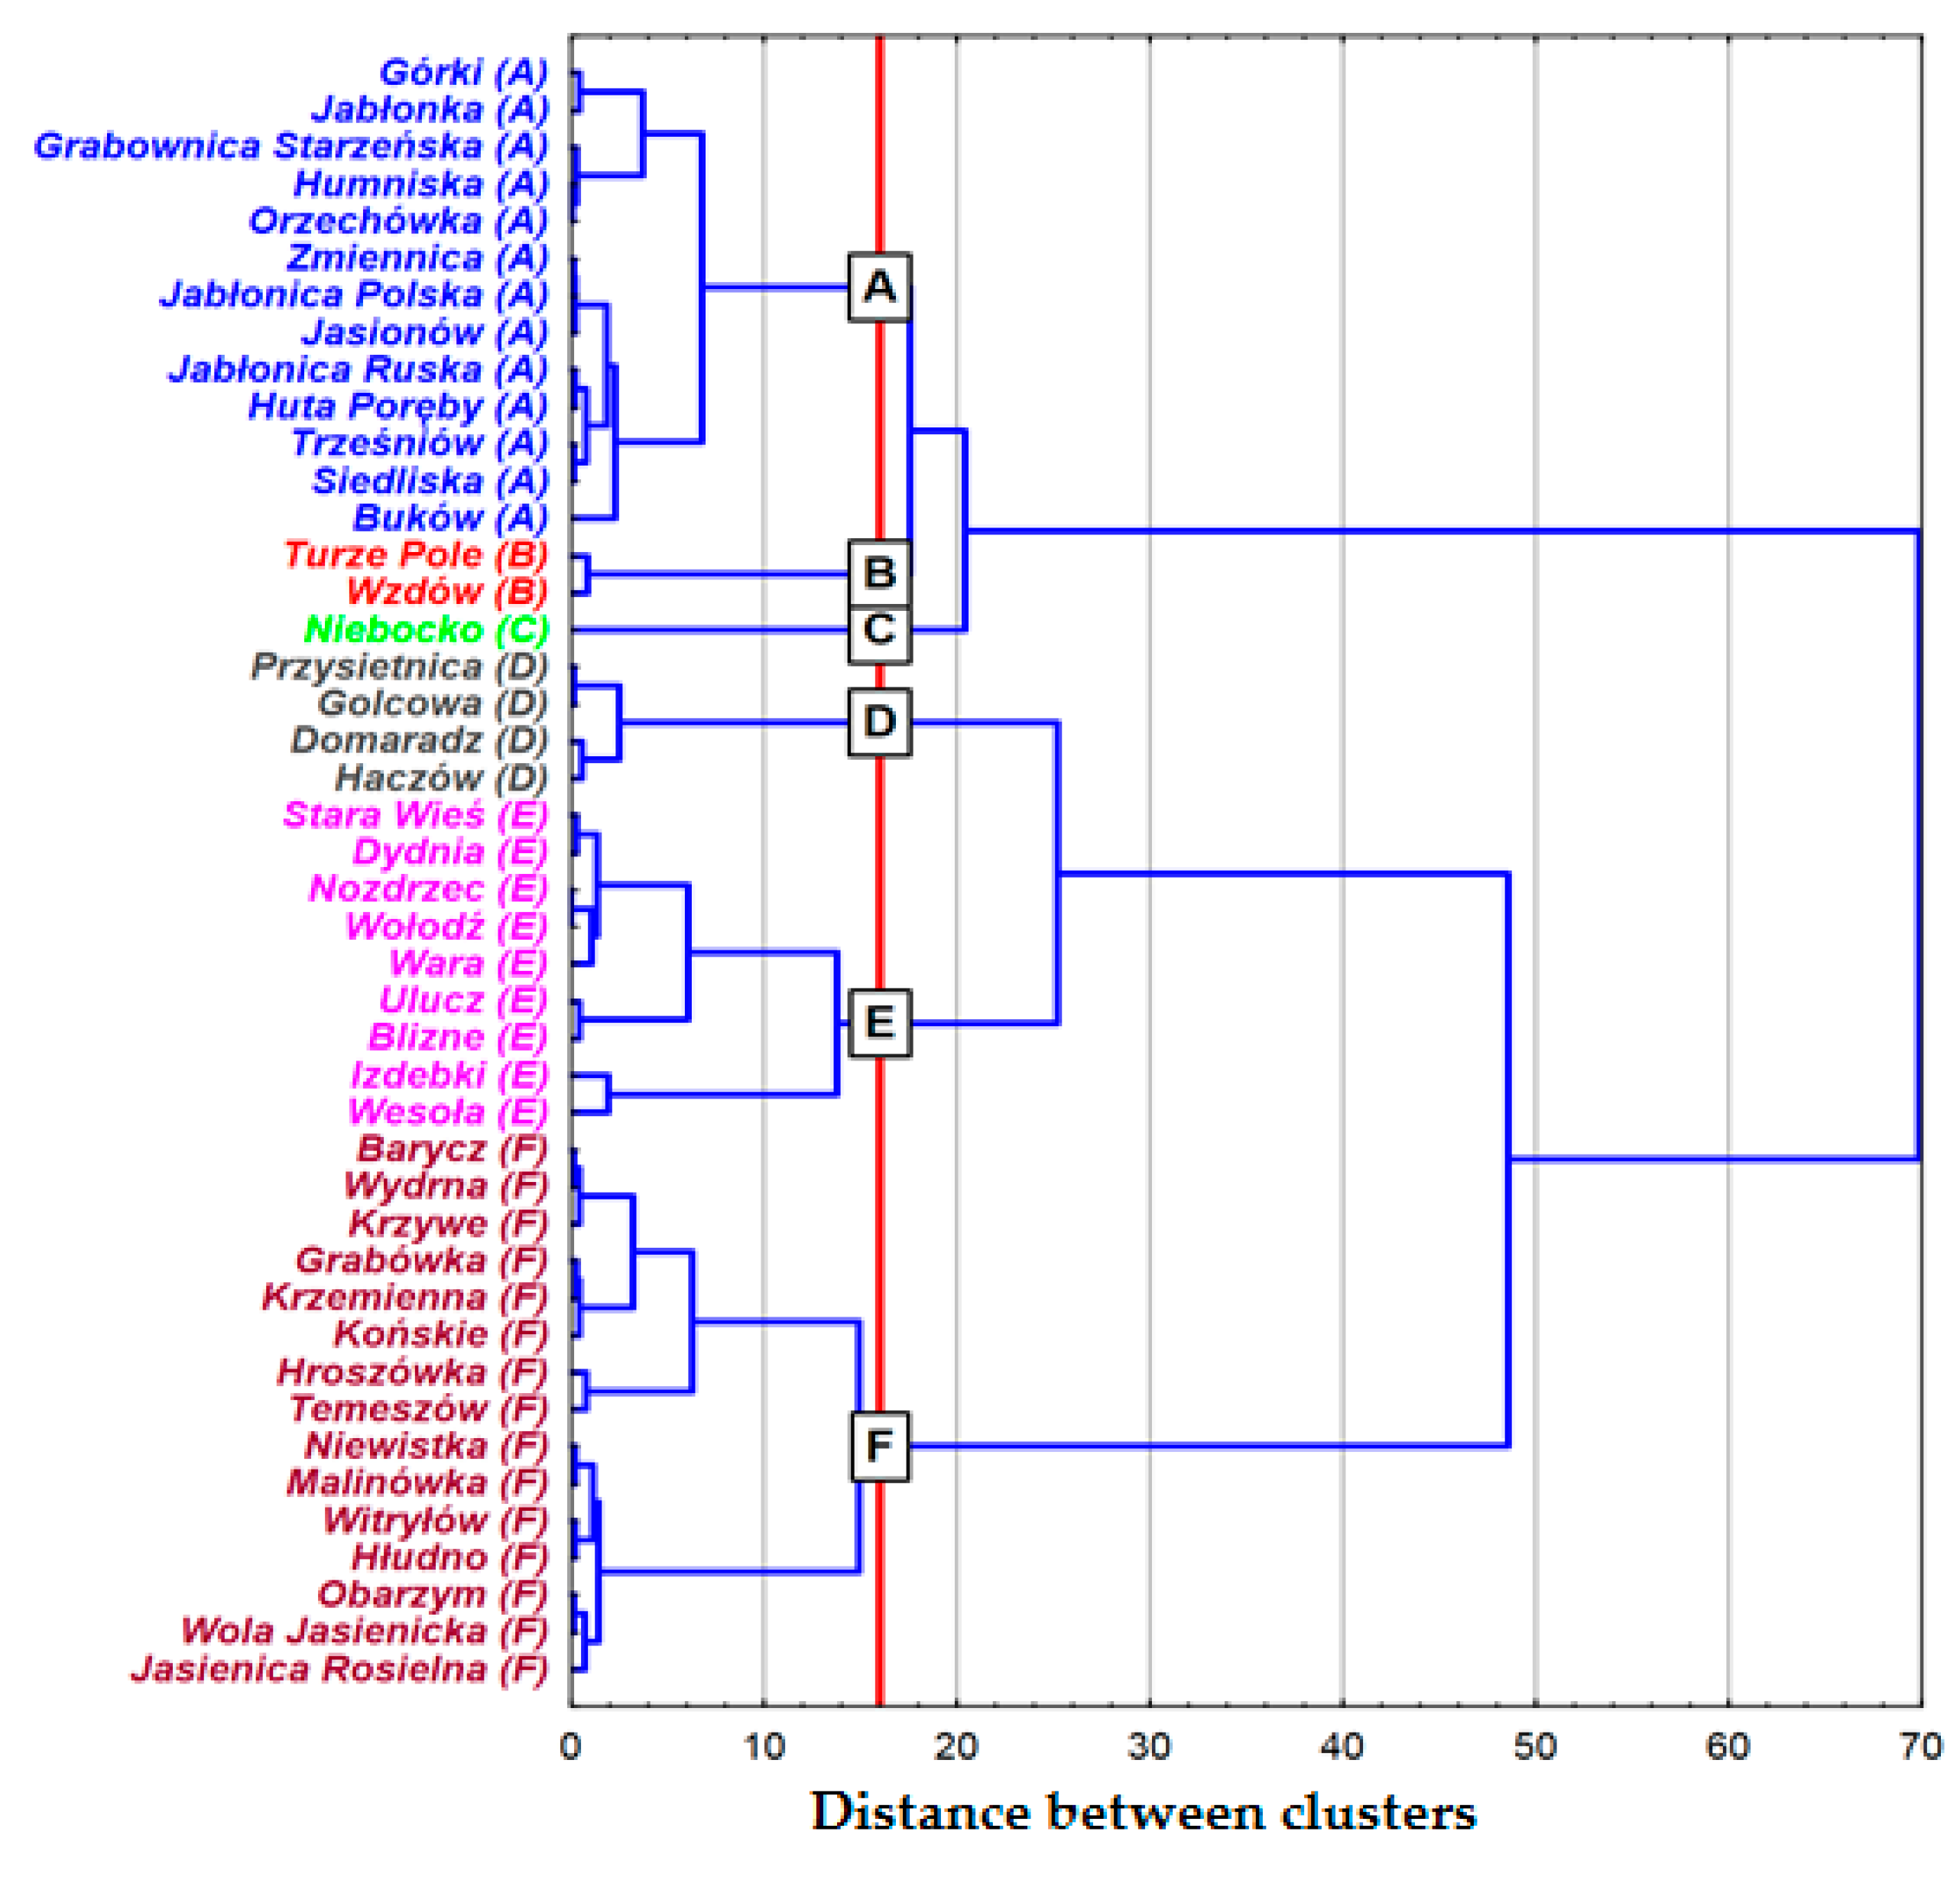
A quite clear division into six groups was proposed for clustering rural areas according to the characteristics, as well as the occurrence and quality of meadows (Figure 4). In view of the purpose of the study, 10 villages in Group E featured the worst characteristics of meadows and had a small overall area. Group D did not look good either, and Group F had one big advantage only—the biggest overall area.
The results of clustering derived from surveys compiled in Table 6, Table 7 and Table 8 made it possible to provide a precise description of six clearly identified clusters.
Table 9 presents the elements and size of the respective groups. Group D was dominant, as it was associated with 18 villages, whereas Group C had only two—and these were villages with small registered area and very good-quality meadows.
Figure 5 illustrates the spatial distribution. It is worth noting that the study area featured quite a high spatial coherence between the clusters, which is primarily due to the natural conditions.
3.3. Clustering of Rural Areas—Pastures
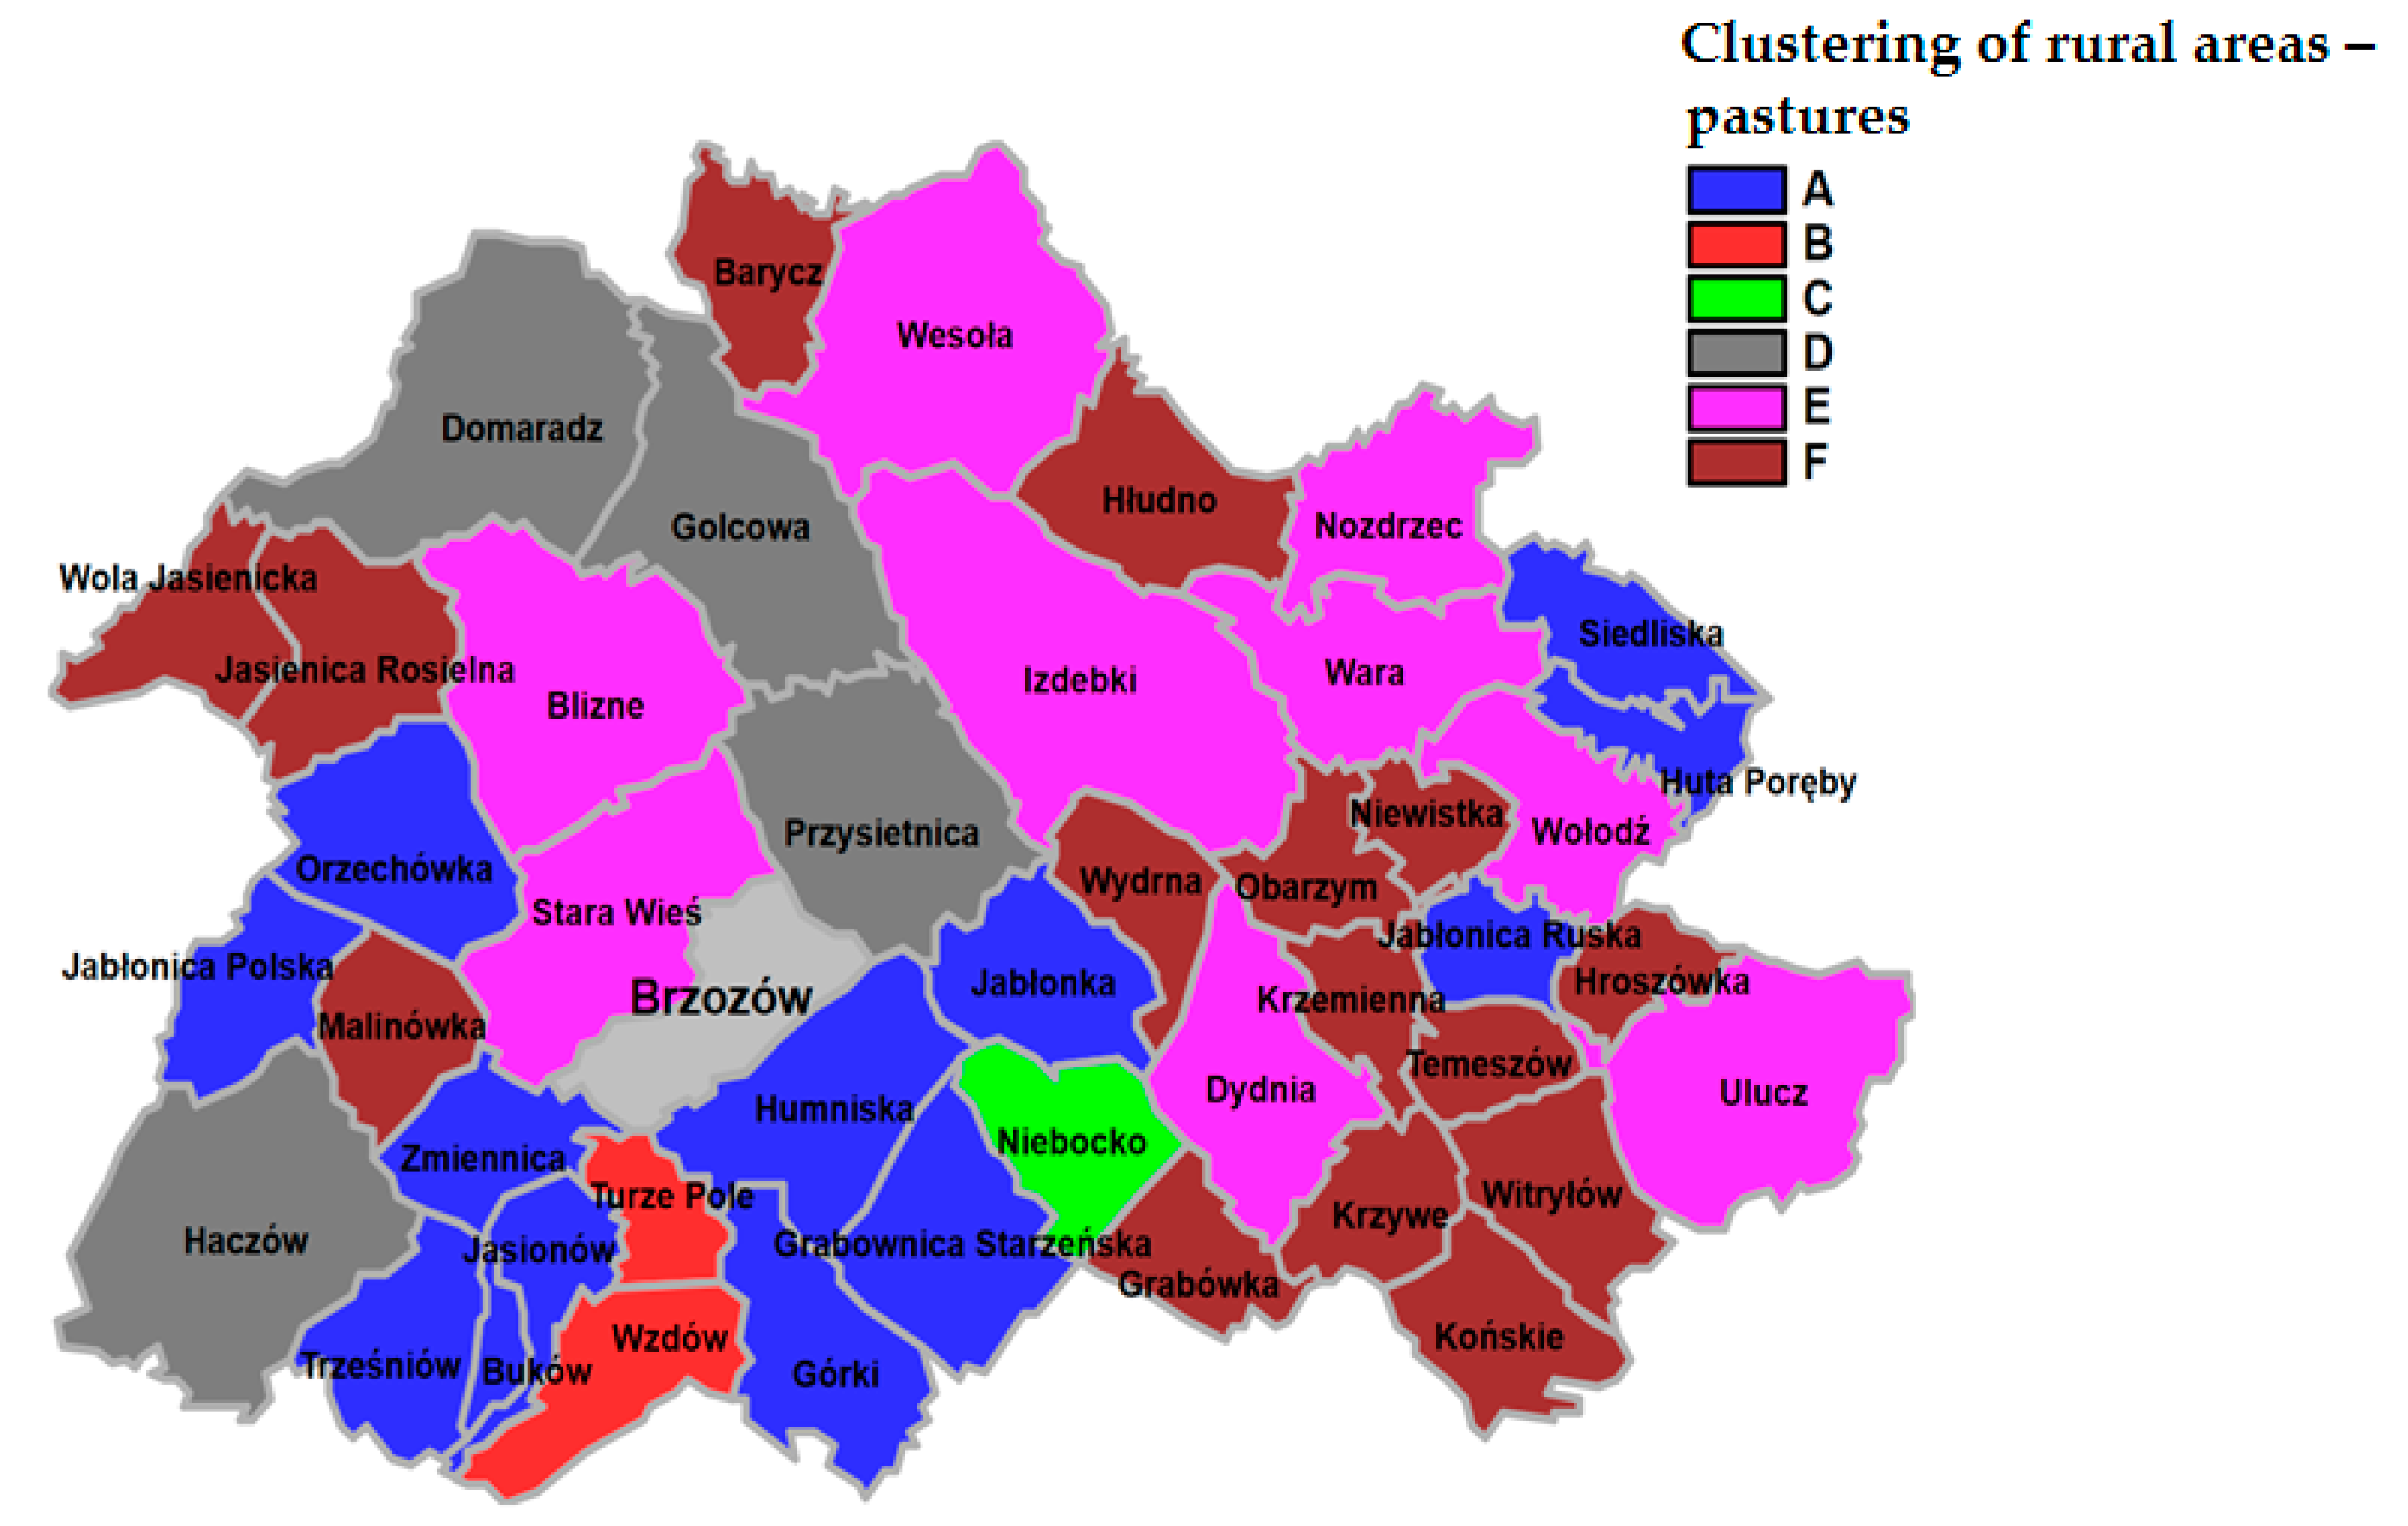
The third analysed land-use type was pastures. Figure 6 shows a clear division into eight groups, which afterwards were agglomerated for similar distances, and only then could a clearer division into three or two clusters be made. Despite these reservations, I decided to show the results of the division into six groups, according to the results of classification for arable land and meadows.
The data (Table 10, Table 11, Table 12 and Table 13) show that the most numerous group, Group F, had the least favourable characteristics—small area, and low share and poor quality of pastures. Among other groups, Groups E and B showed the worst results, although the latter had pastures of the highest quality even though the villages had a small registered area and a small percentage share of pastures in the overall area.
3.4. Clustering of Rural Areas—All Agricultural Land
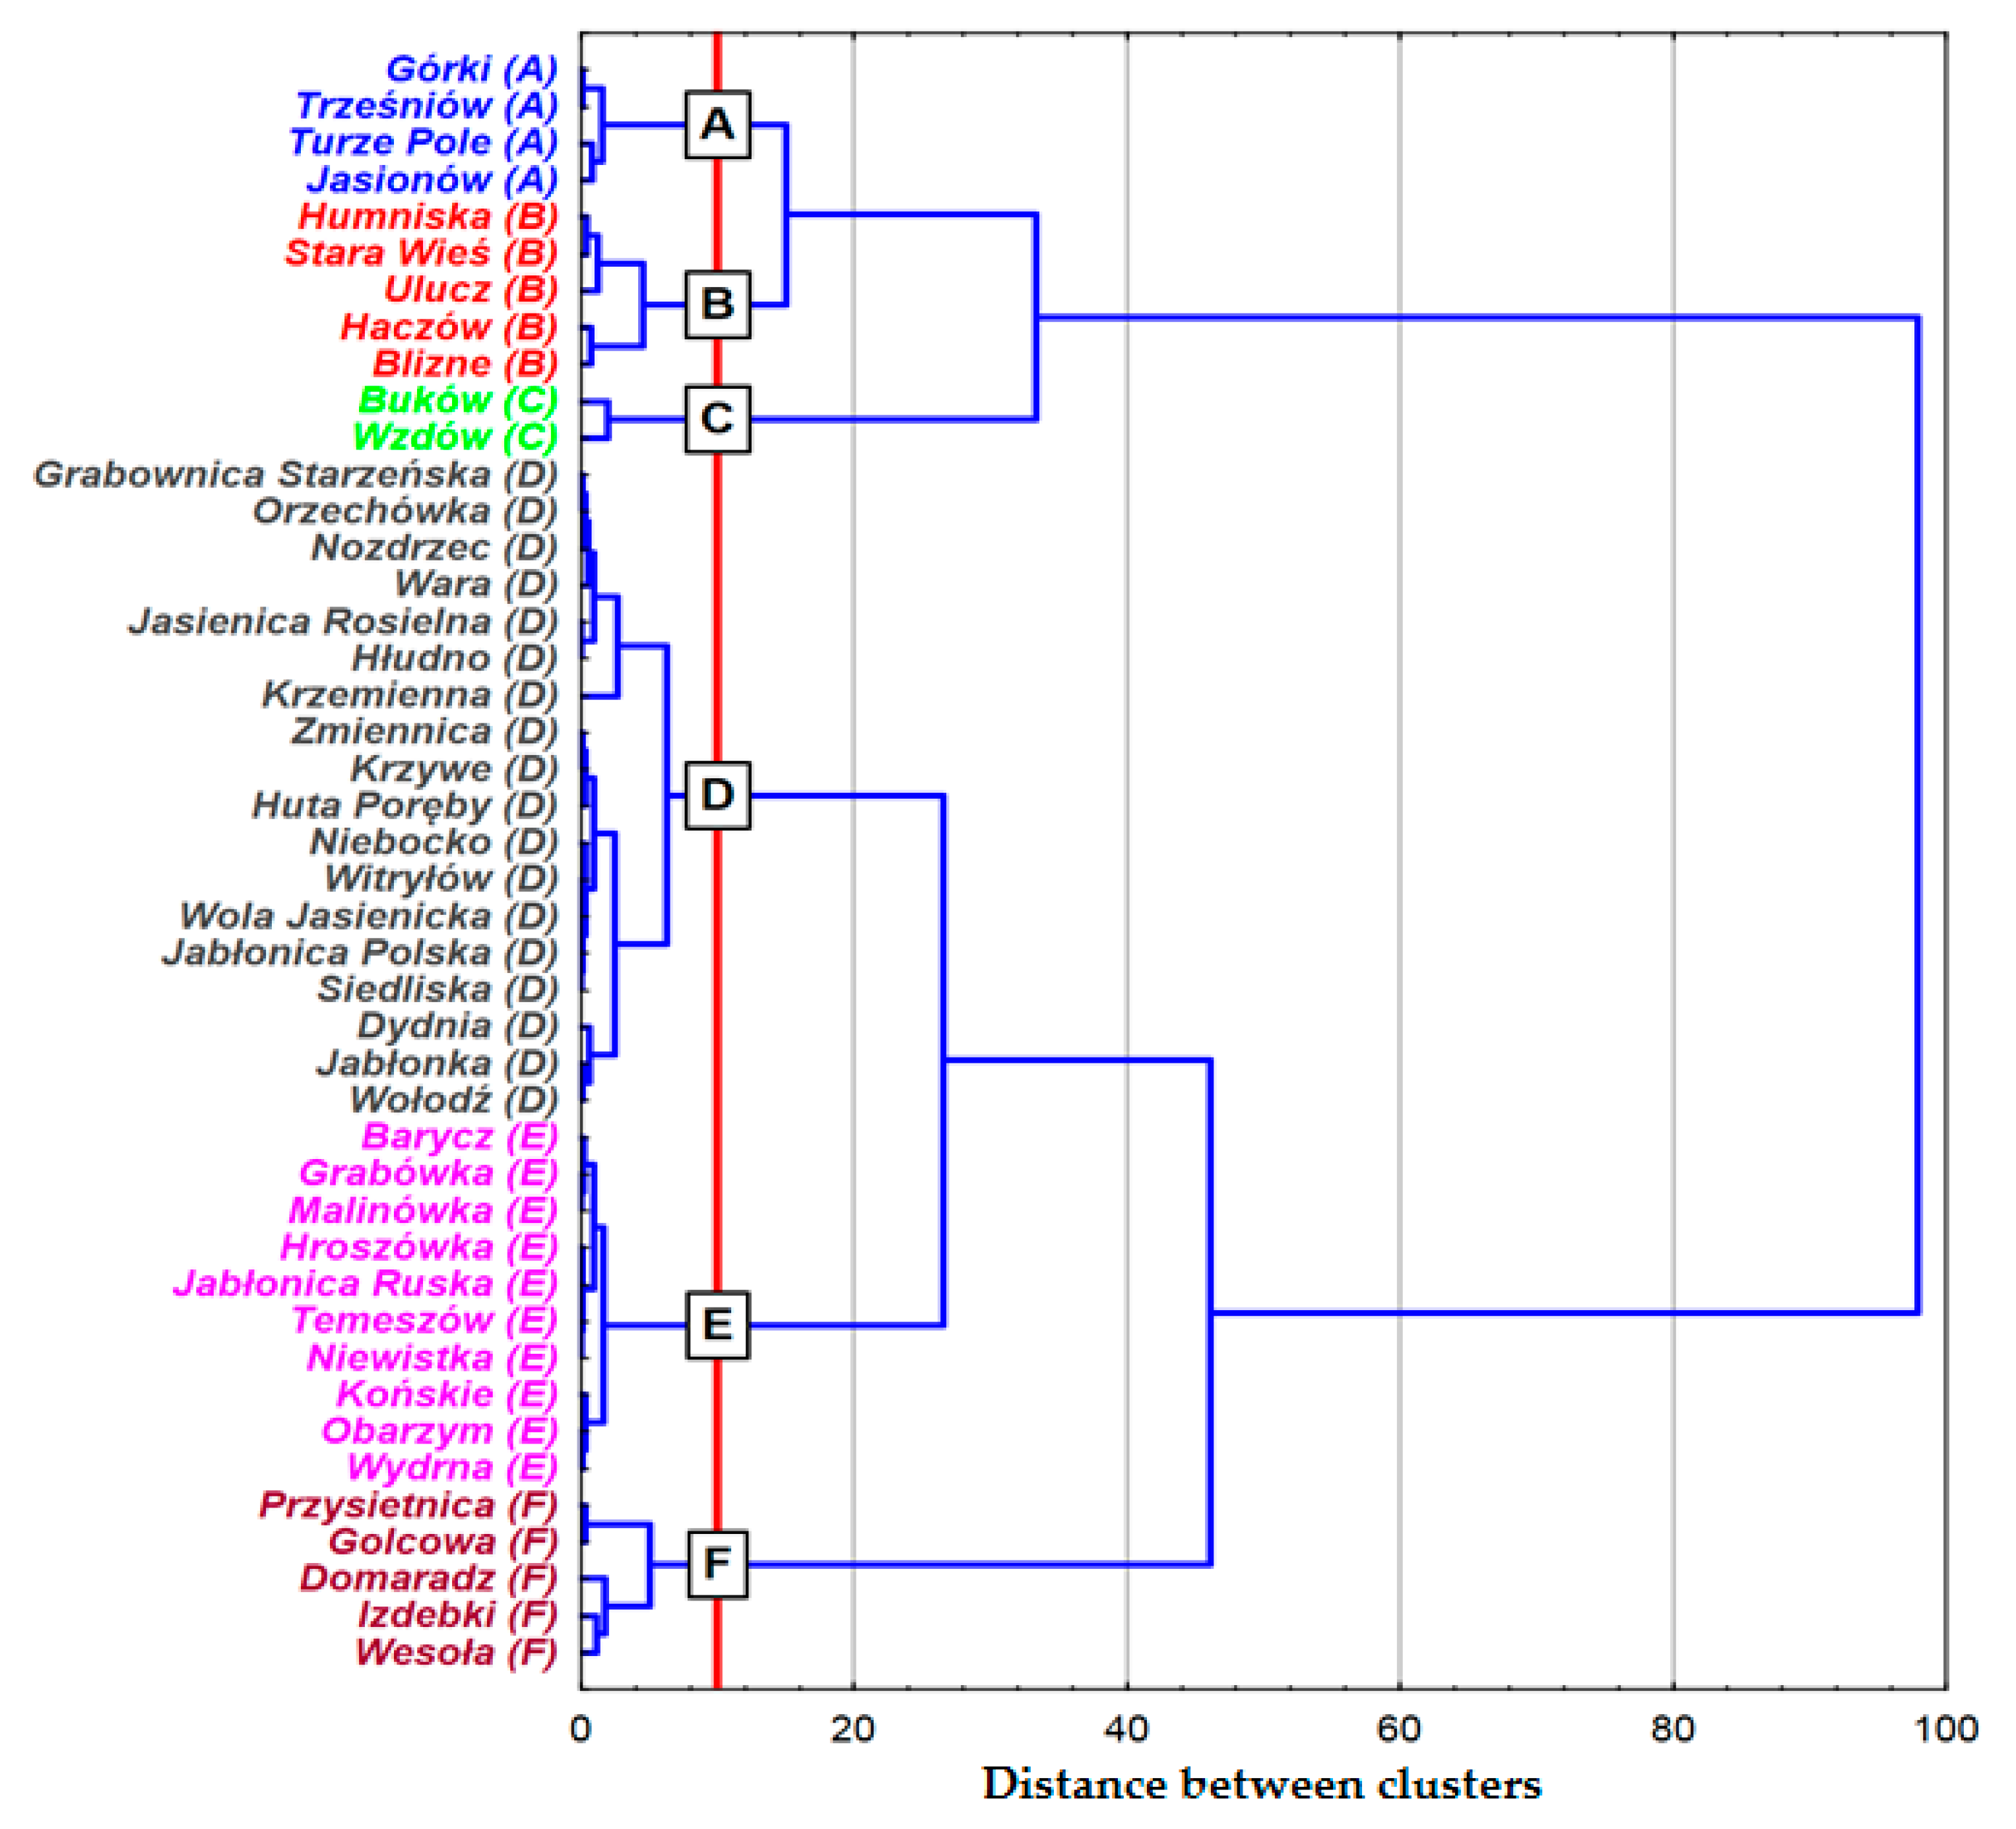
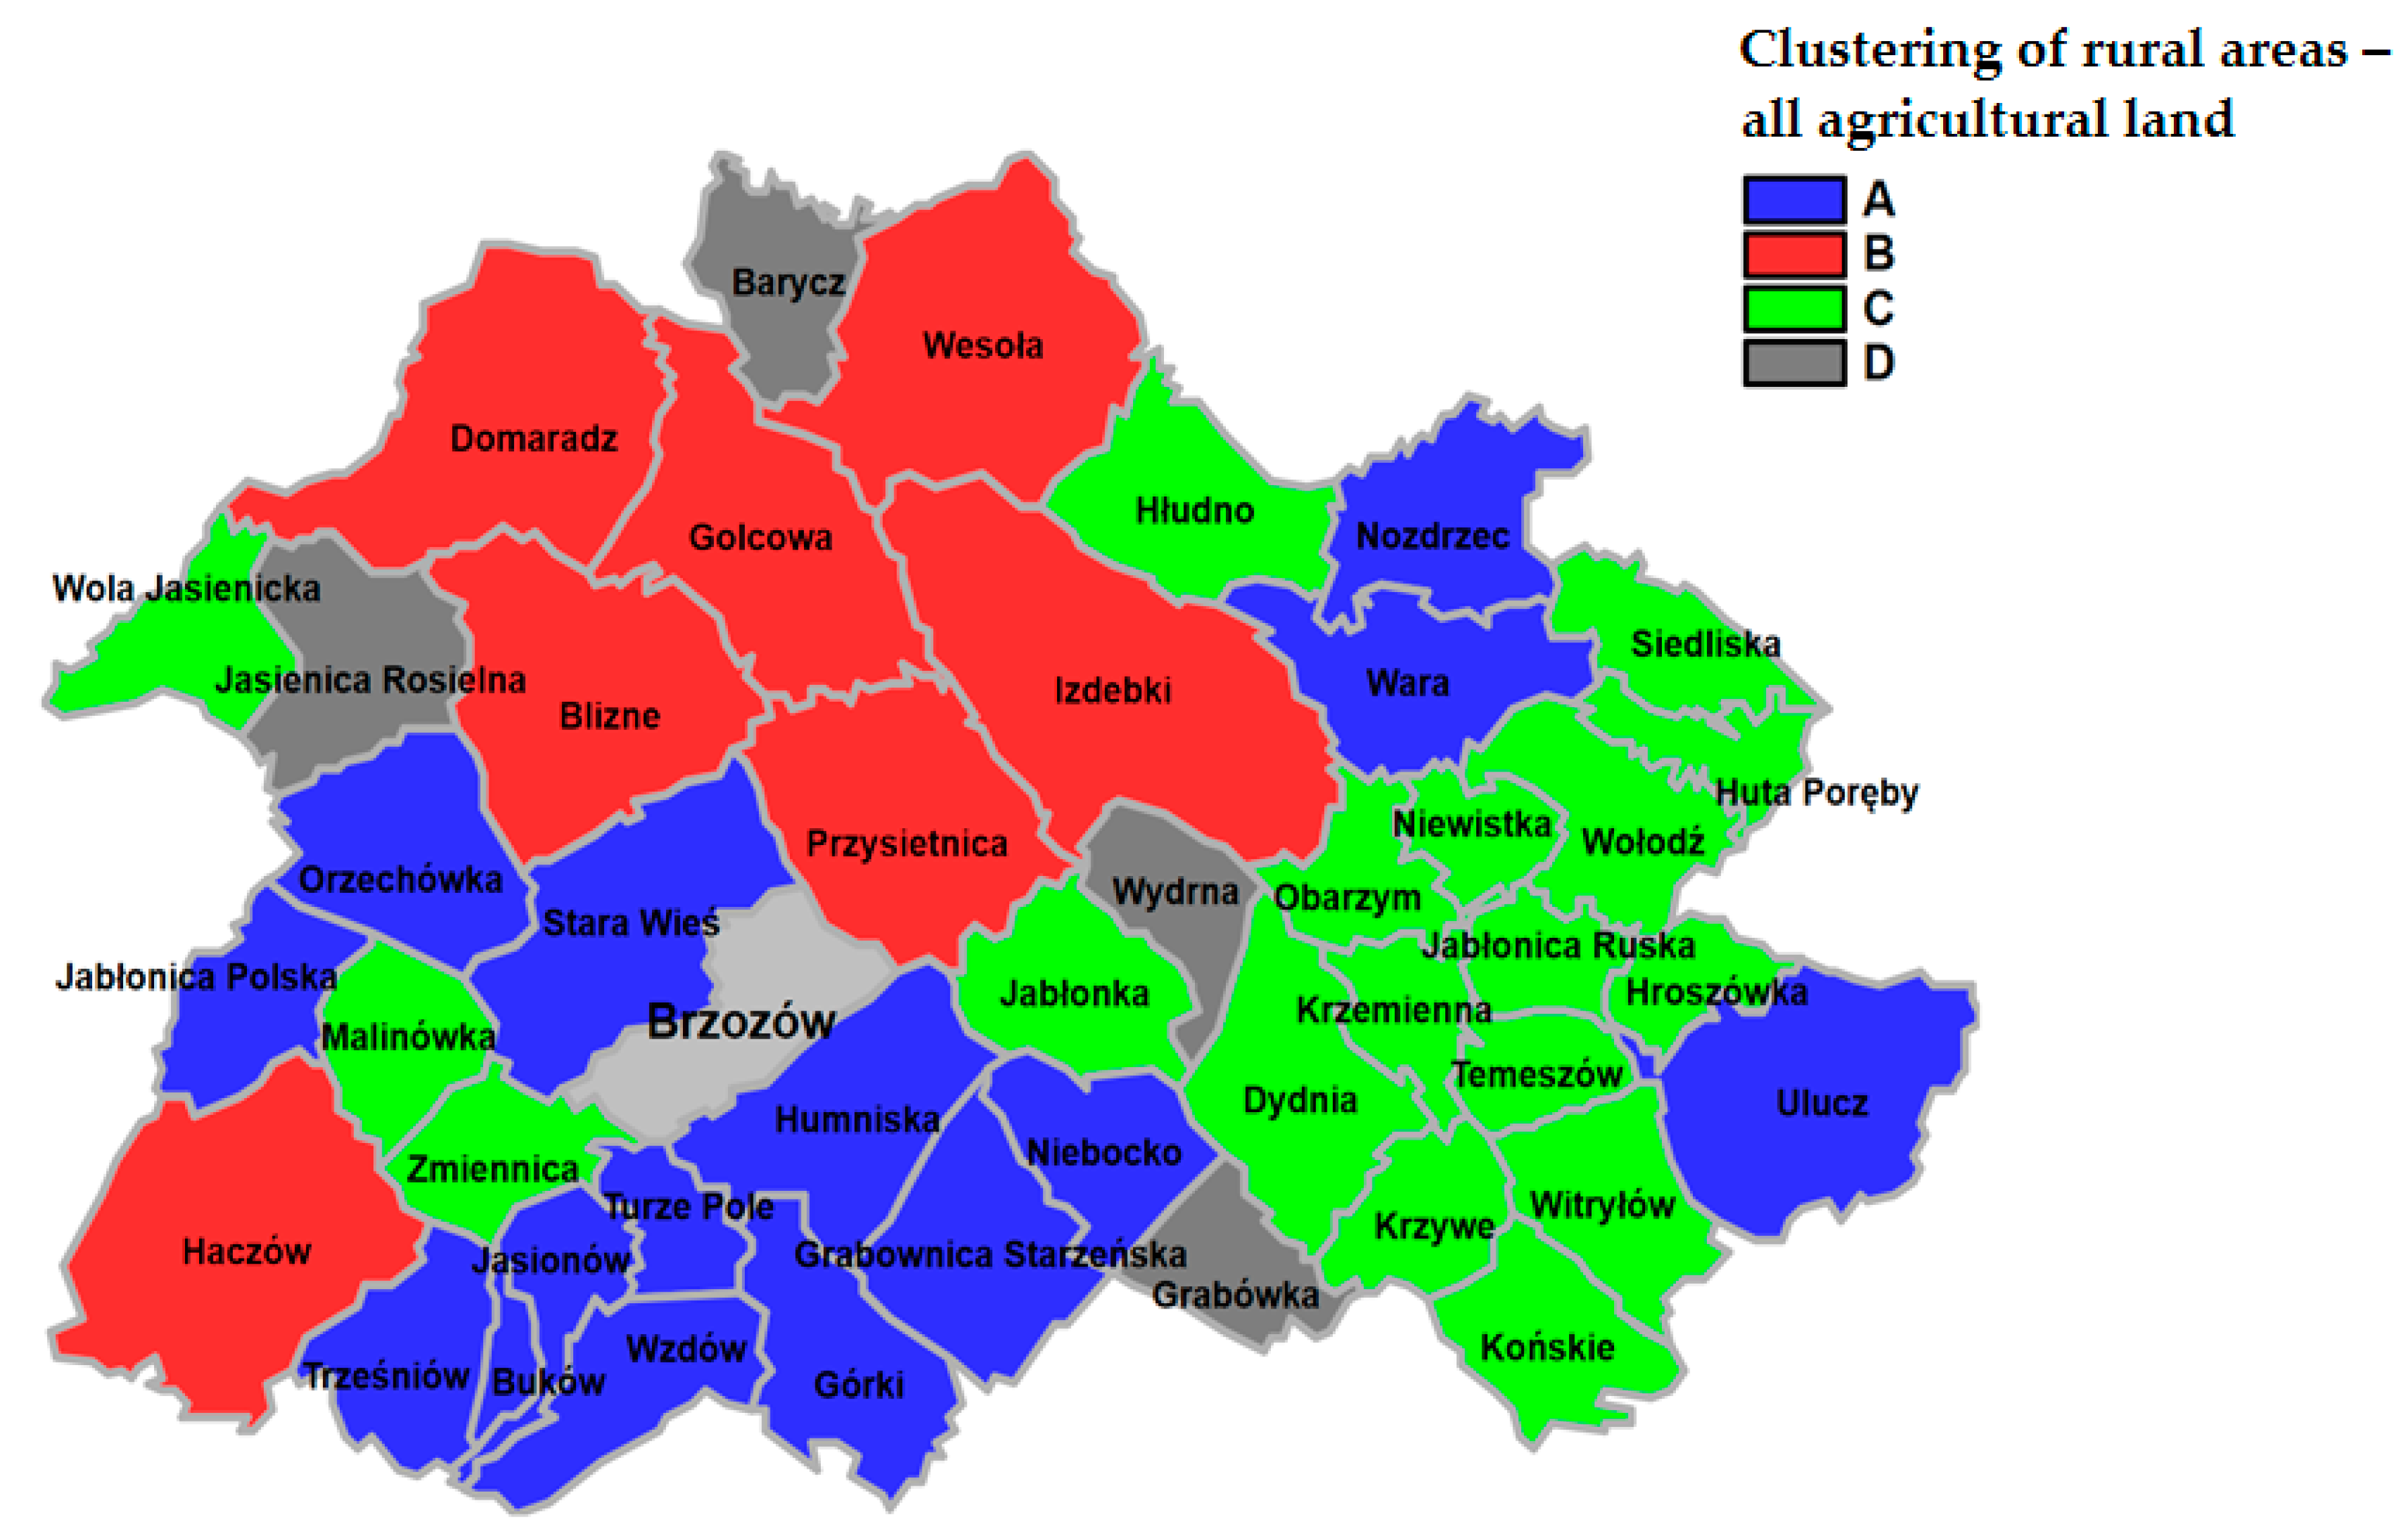
The studies concerning the clustering of rural areas in 44 villages of the district of Brzozów (Figure 8) identified four types of villages. The results of clustering according to surface area, total share of arable land, meadows, and pastures, plus their mean score, should have been naturally closer to the results of analysis for arable land (they occupy the largest area, so they have the largest impact on the mean quality of land).
Considering this issue in terms of land least suitable for agricultural use, the cluster of villages marked as C clearly showed the worst characteristics. Cluster D also featured low values of the analysed characteristics—the highest share of agricultural land in the overall area only partially mitigated the problem of a smaller area and worse quality of land in relation to Cluster A. The best results were observed for Cluster B—mostly due to its area, which, on average, was two times bigger than in other groups. Table 14, Table 15 and Table 16 show detailed results of clustering.
4. Discussion
World literature contains various pieces of information on marginal land. This term denotes land that has never or hardly ever been used for agricultural purposes, is not entered into the register of agricultural land, and is too barren to be used as agricultural land. At the Rio the Janeiro Earth Summit Janeiro in 1992, it was suggested that marginal land should not be allocated for agricultural use since this would hardly improve the food balance. In addition, it should be noted that allocating it for agricultural use usually reduces the forest cover of the continents, which leads to increasing risk to the environment [34].
The problem of marginal land was investigated in detail in Asian countries. Shi et al. [35] employed GIS-processed data and multiple regression analysis for factor analysis of such land in the mountainous regions of China, but they did not consider a sufficient number of socio-economic factors and related policies in their analysis.
By contrast, in Japan, most surveys regarding marginal land make use of the agricultural census data. In 2011, Takayama and Nakatani [36] carried out a survey using a set of data covering six Japanese prefectures. Previous studies in 1998 investigating marginal land in Japan, for instance, Senda [37], employed data of respective farmers also derived from an agricultural census. Moreover, those surveys did not take into account variables related to regional agrarian structure; hence, there were no implications for regional policies. In 2018, Su [38] analysed the determinants of marginal land based on GIS data, and in 2014, Matsui [39] developed a machine learning estimation model for these areas (generalised linear models, random forest, and multivariate adaptive regression splines). However, data input for those surveys was also based on a population census. At present, such analyses employ objective data and involve GIS data processing (ArcGIS 10.8 software) to estimate the marginal land rate model accurately.
By contrast, in Poland, a definition of marginal land was formulated in 1990, after the commercialisation of agriculture. The costs of labour and materials considerably exceeded the value of the crop yield. Therefore, the Agricultural Property Agency of the State Treasury—which acquired the lands formerly owned by the State Agricultural Farms—delineated 57,400 ha of marginal lands with no agricultural value.
Institutions responsible for agricultural and non-agricultural management of marginal lands are the Ministry of Agriculture and Food Economy and the Institute of Soil Science and Plant Cultivation in Puławy. In 1992, the Ministry’s Department of Land and Rural Management specified the notion of marginal land, defining it as land remaining under agricultural use or entered in the register of agricultural land that—due to adverse natural, anthropogenic, and economic conditions—has a relatively low productivity or is not suitable for producing healthy food [40]. This definition provided a basis for the “Rationalisation of Marginal Lands” grant awarded by the Ministry of Agriculture and Food Economy.
The project was commissioned by three agricultural institutions: the Institute of Soil Science and Plant Cultivation in Puławy, the Institute for Land Reclamation and Grassland Farming in Falenty, and the Institute of Agricultural and Food Economics in Warsaw.
In 1996, the Institute of Soil Science and Plant Cultivation in Puławy prepared detailed guidelines regarding the delineation of marginal lands from the utilised agricultural area [40]. According to the adopted criteria, land can be classified into four groups [40,41]:
- Infertile agricultural land where production is not profitable due to unfavourable natural conditions and erosion;
- Land representing different soil classes and featuring chemical contamination as a result of human activity;
- Degraded or mechanically transformed soils devoid of humus;
- Land with unfavourable natural and territorial conditions, i.e., hardly accessible agricultural land or obstacles to tillage.
The quality and suitability of land is determined based on soil-quality classes [34]. The uniform classification of land throughout Poland takes into account the physical and morphological features of land, constituting cartographic materials in the form of classification cadastral-scale maps [42,43].
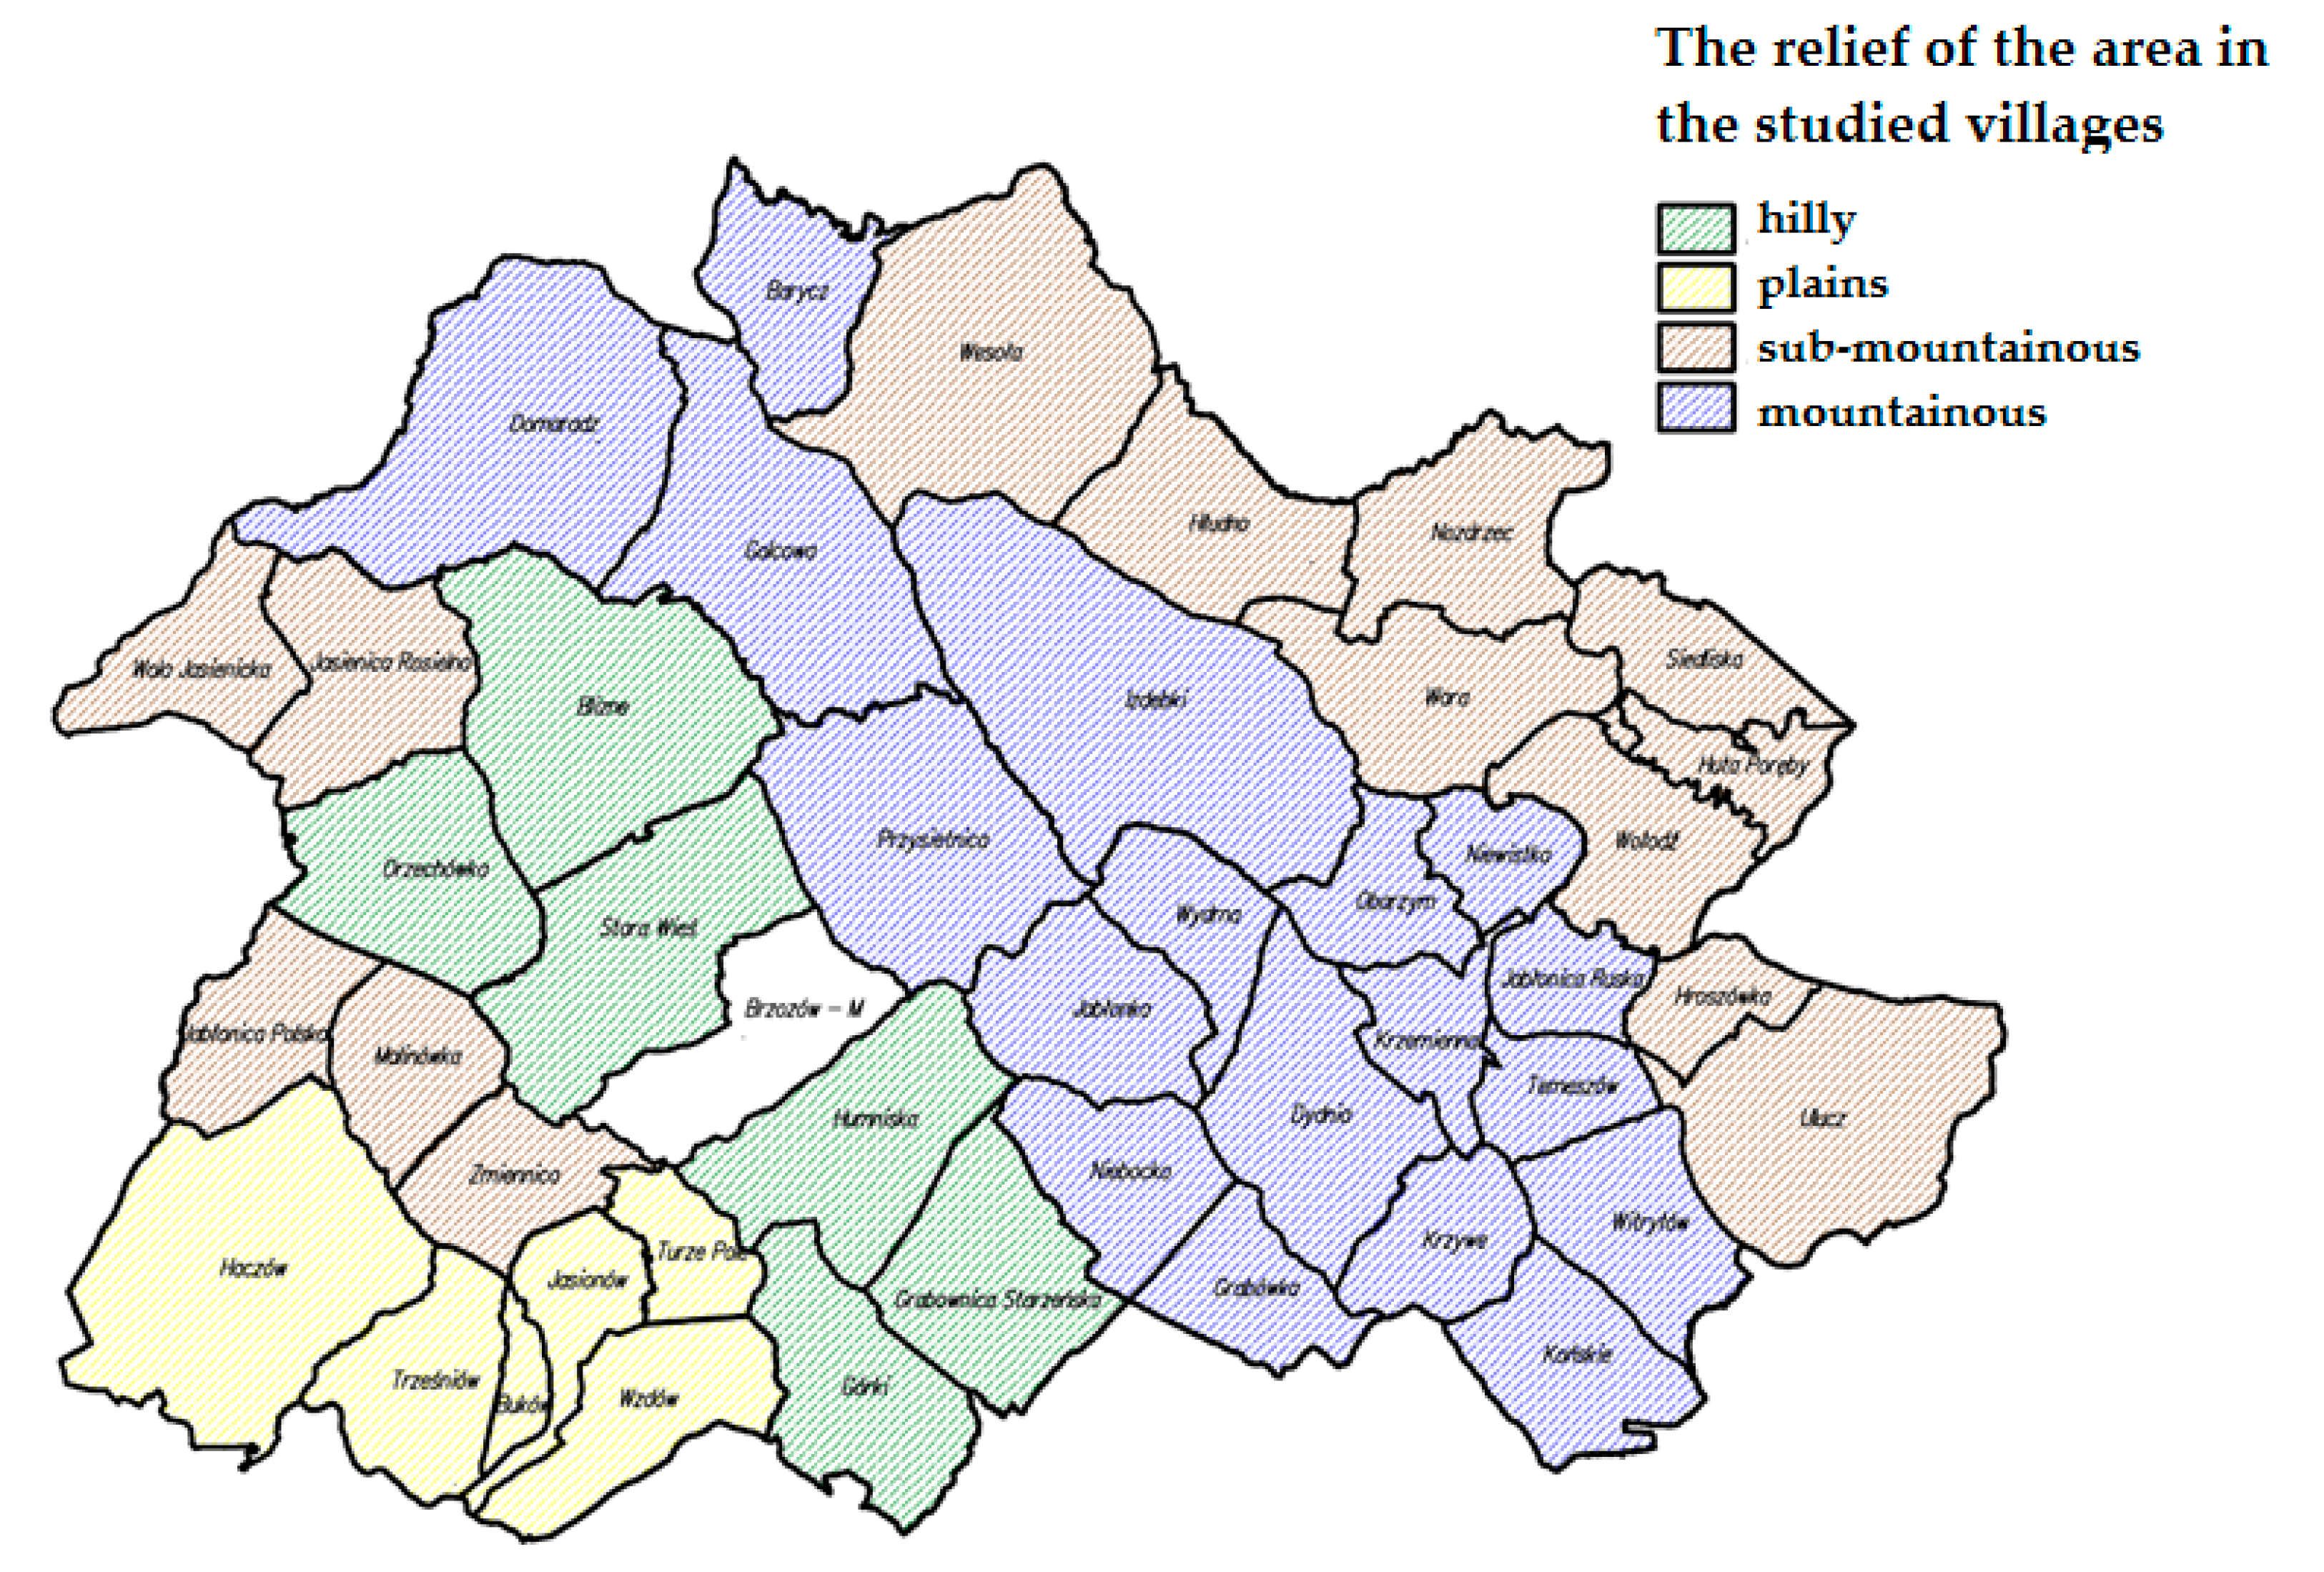
Therefore, there is still a need to survey and analyse marginal lands in Poland. This paper presents the results of surveys using the algorithm of clustering villages according to their surface area, total share of arable land, meadows, and pastures, and their mean score, which allowed the villages to be grouped according to soil quality in the villages of the analysed district. Spatial distribution of villages in the groups is determined by terrain relief and natural conditions (Figure 10) with a decisive impact on future proposals of management of the analysed area, taken into account at the stage of developing design documentation, that is, assumptions for the land consolidation project, which at a later stage of the works is also related to management of marginal lands.
The villages featuring the worst quality of land (Groups C, D) are mostly situated in the eastern part of the district (Dydnia, Hroszówka, Jabłonica Ruska, Jabłonka, Końskie, Krzemienna, Krzywe, Niewistka, Obarzym, Temeszów, Witryłów, Malinówka, Hłudno, Huta Poręby, Siedliska, Wołodź, Barycz, Grabówka, and Wydrna), and in its western (Jasienica Rosielna, Wola Jasienica, Malinówka, and Zmiennica) and northern parts (Barycz). These are mountainous villages (Barycz, Dydnia, Jabłonica Ruska, Jabłonka, Końskie, Krzemienna, Krzywe, Niewistka, Obarzym, Temeszów, Witryłów, Grabówka, and Wydrna) and sub-mountainous villages (Hroszówka, Jasienica Rosielna, Wola Jasienicka, Zmiennica, Malinówka, Hłudno, Huta Poręby, Siedliska, and Wołodź). On the other hand, villages from Groups A and B—featuring good-quality land–are situated on plains or hills. Detailed analysis of the results showed that five villages (Hroszówka, Obarzym, Barycz, Grabówka, and Wydrna) at each level of the survey were in the weakest of the identified village groups. In turn, Końskie, Niewistka, Temeszów, Malinówka, and Wola Jasienicka were classified in three out of four of the weakest groups. By contrast, Huta Poręby, Siedliska, Wołodź, Zmiennica, Dydnia, and Jabłonka—despite their absence at respective stages of the calculation (for arable land, meadows, and pastures)—were classified together in the weakest group in terms of arable land.
To sum up, the new algorithm for identifying land useless for agriculture showed very good results in terms of evaluating the actual level of defectiveness of the land in the study area. A comparison of results obtained using the previous and the modified algorithm showed 69.5% compatibility of the analysed villages, which is a satisfactory result. A high level of compatibility with the results obtained using the previous method is a guarantee of good decision-making, which can be an element of broad development strategies in specific areas.
5. Conclusions
The spatial structure of rural areas has been transformed dynamically, which is mostly due to changes in the lifestyle of the inhabitants. The increasingly better accessibility of cities leads to suburbanisation. The intensity and forms of space management affect its shape and contribute to preserving its natural and cultural values. Not only do the inhabitants and increasing building development in villages affect the forms of space management, but also new forms of using agricultural space. The area structure of farms can be improved through consolidation and exchange of land. This is one of the most efficient rural management procedures. Rational shaping of land contributes to improving the working and living conditions of its inhabitants. Such works facilitate reasonable management of areas of land featuring soils of the poorest grade, since these are the areas most at risk of environmental degradation processes. It should be emphasised that every rural area is unique; therefore, it is particularly important to find solutions matching the natural and landscape status of each area on a case-by-case basis. In Poland, there are many areas where agricultural production run by private farms owned by individuals is on the verge of or falls below the limit of profitability. The main factors contributing to the formation of problem areas include unreasonable utilisation of natural resources, which intensifies erosive degradation and soil acidity.
The self-designed algorithm accurately identifies locations featuring the poorest-quality soil, which is particularly significant in developing strategies for larger areas such as communes, districts, and voivodeships. The new, modified algorithm allows areas with the poorest-quality soil to be identified, which is extremely important for further studies since delimiting areas is an element of further analyses. The identified groups of villages will be studied and analysed in detail to ensure the optimum use of their potential, thereby increasing the competitiveness of such areas, with the activity in those areas having a favourable effect and improving the living standard of their inhabitants.
Funding
This research received no external funding.
Institutional Review Board Statement
Not applicable.
Informed Consent Statement
Not applicable.
Data Availability Statement
The data presented in this study are available on request.
Conflicts of Interest
The authors declare no conflict of interest.
References and Note
- Renwick, A.; Jansson, T.; Verburg, P.H.; Revoredo-Giha, C.; Britz, W.; Gocht, A.; McCracken, D. Policy reform and agricultural land abandonment in the EU. Land Use Policy 2013, 30, 446–457. [Google Scholar] [CrossRef]
- Li, S.; Li, X. Global understanding of farmland abandonment: A review and prospects. J. Geogr. Sci. 2017, 27, 1123–1150. [Google Scholar] [CrossRef]
- Ustaoglu, E.; Collier, M.J. Farmland abandonment in Europe: An overview of drivers, consequences, and assessment of thesustainability implications. Environ. Rev. 2018, 26, 396–416. [Google Scholar] [CrossRef]
- Ito, J.; Feuer, H.N.; Kitano, S.; Asahi, H. Assessing the effectiveness of Japan’s community-based direct payment scheme for hillyand mountainous areas. Ecol. Econ. 2019, 160, 62–75. [Google Scholar] [CrossRef]
- Zavalloni, M.; D’Alberto, R.; Raggi, M.; Viaggi, D. Farmland abandonment, public goods and the CAP in a marginal area of Italy. Land Use Policy 2019, 107, 104365. [Google Scholar] [CrossRef]
- Xu, D.; Deng, X.; Guo, S.; Liu, S. Labor migration and farmland abandonment in rural China: Empirical results and policyimplications. J. Environ. Manag. 2019, 232, 738–750. [Google Scholar] [CrossRef] [PubMed]
- Taylor, M. Climate change, relational vulnerability and human security: Rethinking sustainable adaptation in agrarian environments. Clim. Dev. 2013, 5, 318–327. [Google Scholar] [CrossRef]
- Gavalas, V.S.; Rontos, K.; Salvati, L. Who becomes an unwed mother in Greece? Sociodemographic and geographical aspects of an emerging phenomenon. Popul. Space Place 2014, 20, 250–263. [Google Scholar] [CrossRef]
- Smiraglia, D.; Ceccarelli, T.; Bajocco, S.; Salvati, L.; Perini, L. Linking trajectories of land change, land degradation processes and ecosystem services. Environ. Res. 2016, 147, 590–600. [Google Scholar] [CrossRef]
- Lambin, E.F.; Geist, H.J.; Lepers, E. Dynamics of Landscape and Land Cover Change in Tropical Regions. Annu. Rev. Environ. Resour. 2003, 28, 205–241. [Google Scholar] [CrossRef] [Green Version]
- Janus, J.; Markuszewska, I. Land consolidation–a great need to improve effectiveness. A case study from Poland. Land Use Policy 2017, 65, 143–153. [Google Scholar] [CrossRef]
- Sikor, T.; Müller, D.; Stahl, J. Land Fragmentation and Cropland Abandonment in Albania: Implications for the Roles of State and Community in Post-Socialist Land Consolidation. World Dev. 2009, 37, 1411–1423. [Google Scholar] [CrossRef]
- Wójcik-Leń, J.; Leń, P.; Sobolewska-Mikulska, K. The proposed algorithm for identifying agricultural problemareas for the needs of their reasonable management under land consolidation works. Comput. Electron. Agric. 2018, 152, 333–339. [Google Scholar] [CrossRef]
- Janus, J. Measuring land fragmentation considering the shape of transportation network: A method to increase the accuracy of modeling the spatial structure of agriculture with case study in Poland. Comput. Electron. Agric. 2018, 148, 259–271. [Google Scholar] [CrossRef]
- Postek, P.; Leń, P.; Stręk, Z. The proposed indicator of fragmentation of agricultural land. Ecol. Indic. 2019, 103, 581–588. [Google Scholar] [CrossRef]
- Bożek, P.; Janus, J.; Mitka, B. Analysis of Changes in Forest Structure using Point Clouds from Historical Aerial Photographs. Remote Sens. 2019, 11, 2259. [Google Scholar] [CrossRef] [Green Version]
- Kuemmerle, T.; Hostert, P.; Radeloff, V.C.; Linden, S.; Perzanowski, K.; Kruhlov, I. Cross-Border Comparison of Post-Socialist Farmland Abandonment in the Carpathians. Ecosystems 2008, 11, 614–628. [Google Scholar] [CrossRef]
- Munteanu, C.; Kuemmerle, T.; Boltiziar, M.; Butsic, V.; Gimmi, U.; Halada, L.; Kaim, D.; Király, G.; Konkoly-Gyuró, É.; Kozak, J.; et al. Forest and Agricultural Land Change in the Carpathian Region—A Meta-Analysis of Long-Term Patterns and Drivers of Change. Land Use Policy 2014, 38, 685–697. [Google Scholar] [CrossRef]
- Cegielska, K.; Noszczyk, T.; Kukulska, A.; Szylar, M.; Hernik, J.; Dixon-Gough, R.; Jombach, S.; Valánszki, I.; Filepné Kovács, K. Land use and land cover changes in post-socialist countries: Some observations from Hungary and Poland. Land Use Policy 2018, 78, 1–18. [Google Scholar] [CrossRef]
- Goga, T.; Feranec, J.; Bucha, T.; Rusnák, M.; Sackov, I.; Barka, I.; Kopecká, M.; Papco, J.; Otahel’, J.; Szatmári, D. A Review of the Application of Remote Sensing Data for Abandoned Agricultural Land Identification with Focus on Central and Eastern Europe. Remote Sens. 2019, 11, 2759. [Google Scholar] [CrossRef] [Green Version]
- Săvulescu, I.; Mihai, B.-A.; Vîrghileanu, M.; Nistor, C.; Olariu, B. Mountain Arable Land Abandonment (1968–2018) in theRomanian Carpathians: Environmental Conflicts and Sustainability Issues. Sustainability 2019, 11, 6679. [Google Scholar] [CrossRef] [Green Version]
- Petrisor, A.I.; Sirodoev, I.; Ianos, I. Trends in the National and Regional Transitional Dynamics of Land Cover and Use Changesin Romania. Remote Sens. 2020, 12, 230. [Google Scholar] [CrossRef] [Green Version]
- Janus, J.; Bożek , P. Land abandonment in Poland after the collapse of socialism: Over a quarter of a century of increasing tree cover on agricultural land. Ecol. Eng. 2019, 138, 106–117. [Google Scholar] [CrossRef]
- Dax, T.; Hellegers, P. Policies for Less-Favoured Areas. In CAP Regimes and the European Countryside, Prospects for Integration between Agricultural, Regional and Environmental Policies; Brouwer, F., Lowe, P., Eds.; Centre for Agriculture and Bioscience International: Wallingford, UK, 2000; pp. 179–197. [Google Scholar]
- Van Leeuwen, E.S.; Strijker, D.; Terluin, I. Regional Concentration and Specialisation in Agricultural Activities in EU-9 Regions (1950–2000). Eur. Spat. Res. Policy 2010, 17, 23–39. [Google Scholar] [CrossRef] [Green Version]
- Vesco, P.; Kovacic, M.; Mistry, M.; Croicu, M. Climate variability, crop and conflict: Exploring the impacts of spatial concentration in agricultural production. J. Peace Res. 2021, 58, 98–113. [Google Scholar] [CrossRef]
- Otero, I.; Marull, J.; Tello, E.; Diana, G.L.; Pons, M.; Coll, F.; Boada, M. Land abandonment, landscape, and biodiversity: Questioning the restorative character of the forest transition in the Mediterranean. Ecol. Soc. 2015, 20, 7. [Google Scholar] [CrossRef] [Green Version]
- Van der Zanden, E.H.; Carvalho-Ribeiro, S.M.; Verburg, P.H. Abandonment landscapes: User attitudes, alternative futures and land management in Castro Laboreiro, Portugal. Reg. Environ. Chang. 2018, 18, 1509–1520. [Google Scholar] [CrossRef] [PubMed] [Green Version]
- Van der Sluis, T.; Pedroli, B.; Frederiksen, P.; Kristensen, S.B.P.; Gravsholt Busck, A.; Pavlis, V.; Cosor, G.L. The impact of European landscape transitions on the provision of landscape services: An explorative study using six cases of rural land change. Landsc. Ecol. 2019, 34, 307–323. [Google Scholar] [CrossRef] [Green Version]
- Martín-López, B.; Leister, I.; Cruz, P.L.; Palomo, I.; Grêt-Regamey, A.; Harrison, P.A.; Lavorel, S.; Locatelli, B.; Luque, S.; Walz, A. Nature’s contributions to people in mountains: A review. PLoS ONE 2019, 14, e0217847. [Google Scholar] [CrossRef] [Green Version]
- Wójcik-Leń, J.; Leń, P. Proposed algorithm for the identification of rural areas with regard to variability of soil quality. Comput. Electron. Agric. 2021, 188, 106318. [Google Scholar] [CrossRef]
- Wójcik-Leń, J.; Leń, P. Evaluation of the Symmetry of Statistical Methods Applied for the Identification of Agricultural Areas. Land 2021, 10, 664. [Google Scholar] [CrossRef]
- Witek, T.; Górski, T. Przyrodnicza bonitacja rolniczej przestrzeni produkcyjnej w Polsce. IUNG 1977, 1–21. (In Polish) [Google Scholar]
- Michna, W. Racjonalizacja wykorzystania gleb marginalnych. Inst. Ekon. Rol. I Gospod. Żywieniowej 1998, 145–156. (In Polish) [Google Scholar]
- Shi, T.; Li, X.; Xin, L.; Xu, X. The spatial distribution of farmland abandonment and its influential factors at the township level: A case study in the mountainous area of China. Land Use Policy 2018, 70, 510–520. (In Japanese) [Google Scholar] [CrossRef]
- Takayama, T.; Nakatani, T. Evaluating Factors Affecting the Occurrence of Abandoned Cultivated Lands in Rural Communities. 2011. Available online: https://ci.nii.ac.jp/naid/10030395462/ (accessed on 25 May 2021). (In Japanese).
- Senda, T. An Econometric Analysis for Farmer’s Behavior of Abandoned Cultivated Land in Japan: Microdata Evidence from “The Census of Agriculture” in 1990. Statistics 1998, 75, 26–40. (In Japanese) [Google Scholar]
- Su, G.; Okahashi, H.; Chen, L. Spatial Pattern of Farmland Abandonment in Japan: Identification and Determinants. Sustainability 2018, 10, 3676. (In Japanese) [Google Scholar] [CrossRef] [Green Version]
- Matsui, T.; Ugata, T.; Machimura, T.A. Development of Factor Analyzing and Predicting Model of Abandoned Agricultural Land with Machine Learning Algorithms. J. Environ. Syst. Res. 2014, 70, II_131–II_139. (In Japanese) [Google Scholar]
- Józefaciuk, C.Z.; Józefaciuk, A.; Kern, H.; Szczepań, L.; Strzelec, J. Racjonalizacja wykorzystanie gleb marginalnych. Inst. Upraw Nawożenia I Glebozn. W Puławach 1996, 336–341. (In Polish) [Google Scholar]
- Kotańska, K. Gleby marginalne w Polsce i ich wykorzystanie. AR W Poznaniu 1999, 399–410. (In Polish) [Google Scholar]
- Leń, P. Podział przestrzeni rolniczej powiatu brzozowskiego pod względem wartości produkcyjnej gruntów ornych oraz użytków zielonych. Infrastrukt. I Ekol. Teren. Wiej. 2010, Nr 12/2010, 37–44. (In Polish) [Google Scholar]
- Rozporządzenie Rady Ministrów z dnia 4 czerwca 1956 r. w sprawie klasyfikacji gruntów 1956 [Regulation of the Council of Ministers of June 4, 1956 on land classification] (Dz. U. 1956 Nr 19, poz. 97).
Figure 1.
Spatial location of the study area.

Figure 2.
Ward’s clustering results.

Figure 3.
Division of the study area using Ward’s method.

Figure 4.
Ward’s clustering results.

Figure 5.
Division of the study area using Ward’s method.

Figure 6.
Ward’s clustering results.

Figure 7.
Division of the study area using Ward’s method.

Figure 8.
Ward’s clustering results.

Figure 9.
Division of the study area by means of Ward’s method.

Figure 10.
Terrain relief of the analysed villages.


Table 1.
Scores assigned to soil classes for arable land and grassland.
| Soil Class | Arable Land | Grassland |
|---|---|---|
| I | 100 | 90 |
| II | 92 | 80 |
| IIIa | 83 | 65 |
| IIIb | 70 | |
| IVa | 57 | 45 |
| IVb | 40 | |
| V | 30 | 38 |
| VI | 18 | 15 |
Table 2.
Scores for the analysed agricultural land.
| Variables Used in Clustering | Mean Values in Clusters | p | |||||
|---|---|---|---|---|---|---|---|
| A | B | C | D | E | F | ||
| Area of the village (ha) | 1313 | 785 | 998 | 677 | 891 | 2503 | 0.0007 *** |
| Arable land (%) | 18.61 | 43.30 | 36.50 | 15.28 | 66.88 | 41.82 | 0.0001 *** |
| Score for arable land | 65.9 | 67.1 | 54.1 | 42.6 | 50.4 | 53.3 | 0.0000 *** |
p-value of test probability calculated using the Kruskal–Wallis test (statistically significant differences, significance level 0.05, 0.01 and 0.001 marked with *, **, and ***).
Table 3.
Scores for the analysed agricultural land.
| Variables Used in Clustering | Indicators of Mean Values for Clusters | |||||
|---|---|---|---|---|---|---|
| A | B | C | D | E | F | |
| Area of the village (ha) | 1.09 | 0.65 | 0.83 | 0.56 | 0.74 | 2.09 |
| Arable land (%) | 0.49 | 1.14 | 0.96 | 0.40 | 1.75 | 1.10 |
| Score for arable land | 1.18 | 1.20 | 0.97 | 0.76 | 0.90 | 0.95 |
Table 4.
General characteristics of the distribution of quality measures.
| Clustering according to Characteristics of Arable Land | Total Score for Arable Land | |||||
|---|---|---|---|---|---|---|
| Me | s | min | max | V | ||
| A | 16.7 | 16.4 | 10.5 | 4.1 | 29.9 | 63% |
| B | 22.9 | 26.5 | 10.0 | 4.5 | 33.2 | 44% |
| C | 20.3 | 15.6 | 11.1 | 7.2 | 48.7 | 55% |
| D | 4.7 | 5.8 | 3.7 | 0.6 | 7.8 | 79% |
| E | 30.2 | 27.0 | 9.6 | 23.1 | 43.8 | 32% |
| F | 56.0 | 55.9 | 17.9 | 35.3 | 77.1 | 32% |
Table 5.
List of villages in respective clusters.
| Groups (Size) | Elements of the Group |
|---|---|
| A (4) | Górki, Niebocko, Ulucz, Wołodź |
| B (7) | Grabownica Starzeńska, Turze Pole, Buków, Jabłonica Polska, Jasionów, Trześniów, Wzdów |
| C (19) | Humniska, Stara Wieś, Zmiennica, Dydnia, Jabłonica Ruska, Jabłonka, Końskie, Krzemienna, Krzywe, Niewistka, Temeszów, Witryłów, Malinówka, Jasienica Rosielna, Orzechówka, Hłudno, Huta Poręby, Siedliska, Wara |
| D (3) | Hroszówka, Obarzym, Wola Jasienicka |
| E (4) | Barycz, Grabówka, Wydrna, Nozdrzec |
| F (7) | Przysietnica, Domaradz, Golcowa, Haczów, Blizne, Izdebki, Wesoła |
Table 6.
Scores for the analysed agricultural land.
| Variables Used in Clustering | Mean Values in Clusters | p | |||||
|---|---|---|---|---|---|---|---|
| A | B | C | D | E | F | ||
| Area of the village (ha) | 828 | 2060 | 612 | 1027 | 690 | 2519 | 0.0000 *** |
| Meadows (%) | 12.65 | 9.34 | 31.66 | 2.66 | 1.10 | 3.54 | 0.0001 *** |
| Score for permanent meadows | 60.9 | 59.4 | 61.9 | 49.5 | 37.9 | 46.3 | 0.0000 *** |
p—value of test probability calculated using the Kruskal–Wallis test (statistically significant differences, significance level 0.05, 0.01 and 0.001 marked with *, **, and ***).
Table 7.
Scores for the analysed agricultural land.
| Variables Used in Clustering | Indicators of Mean Values for Clusters | |||||
|---|---|---|---|---|---|---|
| A | B | C | D | E | F | |
| Area of the village (ha) | 0.69 | 1.72 | 0.51 | 0.86 | 0.57 | 2.10 |
| Meadows (%) | 2.35 | 1.73 | 5.87 | 0.49 | 0.20 | 0.66 |
| Score for permanent meadows | 1.24 | 1.21 | 1.26 | 1.01 | 0.77 | 0.94 |
Table 8.
General characteristics of the distribution of quality measures.
| Clustering according to the Characteristics of Meadows | Total Score for Permanent Meadows | |||||
|---|---|---|---|---|---|---|
| Me | s | Min | Max | V | ||
| A | 6.4 | 6.6 | 2.6 | 3.0 | 9.2 | 41% |
| B | 12.2 | 10.9 | 8.4 | 3.4 | 24.6 | 69% |
| C | 12.2 | 12.2 | 11.4 | 4.1 | 20.3 | 94% |
| D | 1.5 | 0.9 | 1.3 | 0.0 | 4.6 | 91% |
| E | 0.3 | 0.3 | 0.3 | 0.0 | 0.9 | 87% |
| F | 4.4 | 2.7 | 3.7 | 1.4 | 10.6 | 84% |
Table 9.
List of villages in respective clusters.
| Groups (Size) | Elements of the Group |
|---|---|
| A (4) | Górki, Turze Pole, Jasionów, Trześniów |
| B (5) | Humniska, Stara Wieś, Ulucz, Haczów, Blizne |
| C (2) | Buków, Wzdów |
| D (18) | Grabownica Starzeńska, Zmiennica, Dydnia, Jabłonka, Krzemienna, Krzywe, Niebocko, Witryłów, Jabłonica Polska, Jasienica Rosielna, Orzechówka, Wola Jasienicka, Hłudno, Huta Poręby, Nozdrzec, Siedliska, Wara, Wołodź |
| E (10) | Barycz, Grabówka, Hroszówka, Jabłonica Ruska, Końskie, Niewistka, Obarzym, Temeszów, Wydrna, Malinówka |
| F (5) | Przysietnica, Domaradz, Golcowa, Izdebki, Wesoła |
Table 10.
Scores for the analysed agricultural land.
| Variables Used in Clustering | Mean Values in Clusters | p | |||||
|---|---|---|---|---|---|---|---|
| A | B | C | D | E | F | ||
| Area of the village (ha) | 908 | 746 | 939 | 2358 | 1897 | 805 | 0.0002 *** |
| Pastures (%) | 13.17 | 8.18 | 29.43 | 16.13 | 5.78 | 9.74 | 0.0001 *** |
| Score for permanent pastures | 49.4 | 60.7 | 54.2 | 42.6 | 45.0 | 41.1 | 0.0000 *** |
p-value of test probability calculated using the Kruskal–Wallis test (statistically significant differences, significance level 0.05, 0.01 and 0.001 marked with *, **, and ***).
Table 11.
Scores for the analysed agricultural land.
| Variables Used in Clustering | Indicators of Mean Values for Clusters | |||||
|---|---|---|---|---|---|---|
| A | B | C | D | E | F | |
| Area of the village (ha) | 0.76 | 0.62 | 0.78 | 1.96 | 1.58 | 0.67 |
| Pastures (%) | 1.21 | 0.75 | 2.70 | 1.48 | 0.53 | 0.89 |
| Score for permanent pastures | 1.08 | 1.33 | 1.19 | 0.93 | 0.99 | 0.90 |
Table 12.
General characteristics of the distribution of quality measures.
| Clustering according to the Characteristics of Pastures | Total Score for Permanent Pastures | |||||
|---|---|---|---|---|---|---|
| Me | s | Min | Max | V | ||
| A | 6.0 | 5.1 | 3.2 | 1.5 | 12.2 | 53% |
| B | 3.8 | 3.8 | 2.3 | 2.2 | 5.4 | 60% |
| C | 15.0 | 15.0 | × | 15.0 | 15.0 | × |
| D | 16.3 | 15.8 | 3.4 | 13.2 | 20.5 | 21% |
| E | 4.6 | 4.9 | 1.5 | 2.7 | 6.7 | 32% |
| F | 3.4 | 3.1 | 2.1 | 0.0 | 7.2 | 61% |
Table 13.
List of villages in the respective clusters.
| Groups (Size) | Elements of the Group |
|---|---|
| A (13) | Górki, Grabownica Starzeńska, Humniska, Zmiennica, Jabłonica Ruska, Jabłonka, Buków, Jabłonica Polska, Jasionów, Trześniów, Orzechówka, Huta Poręby, Siedliska |
| B (2) | Turze Pole, Wzdów |
| C (1) | Niebocko |
| D (4) | Przysietnica, Domaradz, Golcowa, Haczów |
| E (9) | Stara Wieś, Dydnia, Ulucz, Blizne, Izdebki, Nozdrzec, Wara, Wesoła, Wołodź |
| F (15) | Barycz, Grabówka, Hroszówka, Końskie, Krzemienna, Krzywe, Niewistka, Obarzym, Temeszów, Witryłów, Wydrna, Malinówka, Jasienica Rosielna, Wola Jasienicka, Hłudno |
Table 14.
Scores for the analysed agricultural land.
| Variables Used in Clustering | Mean Values in Clusters | p | |||
|---|---|---|---|---|---|
| A | B | C | D | ||
| Area of the village (ha) | 1130 | 2503 | 821 | 892 | 0.0001 *** |
| Agricultural land (%) | 61.87 | 59.42 | 41.50 | 75.75 | 0.0000 *** |
| Averaged score | 60.9 | 51.3 | 49.4 | 47.4 | 0.0000 *** |
p-value of test probability calculated using the Kruskal–Wallis test (statistically significant differences, significance level 0.05, 0.01 and 0.001 marked with *, **, and ***).
Table 15.
Scores for the analysed agricultural land.
| Variables Used in Clustering | Indicators of Mean Values for Clusters | |||
|---|---|---|---|---|
| A | B | C | D | |
| Area of the village (ha) | 0.94 | 2.09 | 0.68 | 0.74 |
| Agricultural land (%) | 1.14 | 1.09 | 0.76 | 1.39 |
| Averaged score | 1.14 | 0.96 | 0.92 | 0.89 |
Table 16.
General characteristics of the distribution of quality measures.
| Clustering according to the Characteristics of All Land | Total Score for Agricultural Land | |||||
|---|---|---|---|---|---|---|
| Me | s | min | max | V | ||
| A | 39.4 | 38.4 | 13.4 | 10.1 | 66.3 | 34% |
| B | 76.6 | 83.6 | 22.0 | 53.7 | 114.3 | 29% |
| C | 17.0 | 16.0 | 8.0 | 0.6 | 31.5 | 47% |
| D | 31.7 | 30.1 | 6.8 | 26.2 | 40.5 | 21% |
Table 17.
List of villages in their respective clusters.
| Groups (Size) | Elements of the Group |
|---|---|
| A (15) | Górki, Grabownica Starzeńska, Humniska, Stara Wieś, Turze Pole, Niebocko, Ulucz, Buków, Jabłonica Polska, Jasionów, Trześniów, Wzdów, Orzechówka, Nozdrzec, Wara |
| B (7) | Przysietnica, Domaradz, Golcowa, Haczów, Blizne, Izdebki, Wesoła |
| C (18) | Zmiennica, Dydnia, Hroszówka, Jabłonica Ruska, Jabłonka, Końskie, Krzemienna, Krzywe, Niewistka, Obarzym, Temeszów, Witryłów, Malinówka, Wola Jasienicka, Hłudno, Huta Poręby, Siedliska, Wołodź |
| D (4) | Barycz, Grabówka, Wydrna, Jasienica Rosielna |
Publisher’s Note: MDPI stays neutral with regard to jurisdictional claims in published maps and institutional affiliations. |
© 2022 by the author. Licensee MDPI, Basel, Switzerland. This article is an open access article distributed under the terms and conditions of the Creative Commons Attribution (CC BY) license (https://creativecommons.org/licenses/by/4.0/).
Share and Cite
MDPI and ACS Style
Wójcik-Leń, J. An Algorithm for Delimiting Rural Areas According to Soil Classes. Land 2022, 11, 158. https://0-doi-org.brum.beds.ac.uk/10.3390/land11020158
AMA Style
Wójcik-Leń J. An Algorithm for Delimiting Rural Areas According to Soil Classes. Land. 2022; 11(2):158. https://0-doi-org.brum.beds.ac.uk/10.3390/land11020158
Chicago/Turabian StyleWójcik-Leń, Justyna. 2022. "An Algorithm for Delimiting Rural Areas According to Soil Classes" Land 11, no. 2: 158. https://0-doi-org.brum.beds.ac.uk/10.3390/land11020158
Note that from the first issue of 2016, this journal uses article numbers instead of page numbers. See further details here.