
Combining MSPA-MCR Model to Evaluate the Ecological Network in Wuhan, China


1
School of Architecture and Urban Planning, Huazhong University of Science and Technology, Wuhan 430074, China
2
School of Architecture and Urban Planning, Nanjing University, Nanjing 210093, China
3
Institute of Geographic Sciences and Natural Resources Research, Chinese Academy of Sciences, Beijing 100101, China
*
Author to whom correspondence should be addressed.
†
These authors contributed equally to this work.
Land 2022, 11(2), 213; https://0-doi-org.brum.beds.ac.uk/10.3390/land11020213
Submission received: 6 January 2022
/
Revised: 27 January 2022
/
Accepted: 27 January 2022
/
Published: 29 January 2022
(This article belongs to the Topic Climate Change and Environmental Sustainability)
Abstract
:Rapid urbanization development and construction has seriously threatened the connectivity of habitat patches in cities and hindered the construction of ecological networks in highly urbanized areas. Among them, China is affected by early compressed urbanization, and the broken ecological space in cities and towns has attracted the extensive interest of researchers. To avoid the subjective randomness and single analysis of ecological space in urbanization areas, this paper takes the central urban area of Wuhan as the main research area. It comprehensively evaluates the ecological network space by combining the MSPA-MCR model. The main conclusions are as follows: (1) Identifying the ecological landscape types with important ecological significance in the study area: Core (88.29%), Islet (0.25%), Perf (0.63%), Edge (9.74%), Loop (0.22%), and Bridge (0.14%). Through the dPC landscape index, seven important ecological sources south of the middle reaches of the Yangtze River were identified. (2) According to the comprehensive factors of natural and human factors constructed by the MCR model, the minimum cumulative ecological resistance surface was established, with an average value of 2.65, a maximum value of 4.70, and a minimum value of 1.00, showing a trend that the ecological resistance values in the central and eastern parts are lower than those in the western part. (3) According to the standard deviation ellipse, the distribution direction of NE–SW in ecological sources was analyzed. The ecological sources distributed in the north were less, and the spatial distribution was scattered on the whole. The strong global positive correlation and local spatial aggregation characteristics of ecological resistance surface were evaluated according to spatial autocorrelation. Based on the gravity model, the interaction intensity of ecological corridors between source areas was evaluated, and the importance of ecological corridor protection and restoration was quantitatively analyzed. The research results provide scientific and reasonable references and a basis for ecological planning of Wuhan central city.
1. Introduction
More than 50% of the world’s population currently lives and works in urbanized areas, and the number of such migrations will continue to increase in developing countries [1,2]. It is predicted that 65% of the population will live in urban areas by 2025 [3]. However, the above transformation process has significantly impacted the environment and gradually evolved into one of the critical issues in the study of worldwide change [4]. Under the influence of early compressed urbanization in China, the natural ecological elements in cities and towns are decreasing year by year. The environmental landscape patches show significant fragmentation characteristics [5,6]. At present, this has posed significant challenges and threats to the protection of biodiversity, the maintenance of ecosystem stability and operational security [7,8,9], and reduced the local climate suitability and quality of life [10,11,12].
Since the 1990s, many scholars have built models and methods of multilevel spatial scale ecological networks based on landscape ecology principles. Generally speaking, the construction of scientific ecological networks relies on two aspects: ecological sources and ecological corridors. At present, there are principally two methods to identify ecological sources: the first is the direct method, for example, by selecting nature reserves [13,14], urban green space [15,16], and land cover types [17] as ecological sources; the second is a comprehensive method, such as studying the supply and demand of ecosystem services (ES) [18], the granularity reverse method [19], the principal component analysis [20], the ecological network research method of landscape pattern analysis [15], etc. However, the above research methods have some shortcomings: the former process is subjective and does not consider the internal differences of the same land type. In contrast, the latter method selects various kinds of indicators for case studies due to the significant local differences in the environment. Considering the above reasons, this paper adopts the morphological spatial pattern analysis (MSPA) method, widely used to identify ecological source areas in recent years [21,22,23]. MSPA is an imaging method based on grid pixels of land use in the study area for calculation, identification, and segmentation. Compared with the previous two methods, MSPA can objectively define the nature and structure of the landscape and quantitatively identify the ecological source [23].
The identification of the ecological corridor needs to be based on the resistance surface constructed [21], and the ecological resistance surface is usually corrected by giving moderate weights to factors such as land cover and elevation [24]. Therefore, the extracted potential ecological corridor can be used as the best channel for regional material and energy circulation [25]. However, previous studies often face the defect that it is difficult to reflect the influence of natural and artificial superimposed factors on ecological resistance value, so this paper creatively constructs the “natural–humanistic comprehensive resistance factor”. The Minimum cumulative resistance (MCR) model plays a vital role in building ecological corridors. Dong and other scholars have also proved that this model is significant for exploring ecological corridors [26]. However, the above methods will disregard the ecological forces between ecological sources. Therefore, the gravity model used in this study effectively evaluates landscape connectivity and quantitatively determines the priority of ecological corridors [27].
In recent years, China’s land spatial planning has progressively highlighted the importance of ecological space, and fully dividing urban ecological areas has become a pressing need for policies such as delineating the red line of ecological protection and the boundary of urban development and implementing space control [28,29]. As the only national central city in Central China, Wuhan is a highly urbanized area built along the Yangtze River with a large population, prosperous economy, and limited space. However, with the rapid development of the social economy and the continuous expansion of the construction scale, important ecological habitats in the city face significant challenges and threats [30,31].
Given the above careful consideration, this study takes Wuhan central city as an example. It constructs the ecological network of Wuhan central city using MSPA-MCR model, focusing on determining the ecological network of Wuhan central city by identifying ecological sources, ecological resistance surfaces, and ecological corridors. This study attempts to solve the following three tasks: (1) Construct a quantitative framework of ecological network: accurately identify ecological sources based on morphological spatial pattern analysis (MSPA) and landscape connectivity, and avoid subjective selection of ecological sources. The ecological resistance surface constructed using multi-source data of nature and humanities considers the influence of multiple factors. Ecological corridors are built by the minimum cumulative resistance (MCR) model. (2) Assess the spatial distribution and current characteristics of the ecological source, ecological resistance surface, and ecological corridor in Wuhan central city. (3) To optimize the ecological network in the central city of Wuhan, provide solutions corresponding to biodiversity conservation, and provide a scientific and reliable basis for special ecological planning such as ecological restoration planning of land space in Wuhan, and protection planning of the ecological framework in Wuhan.
2. Materials and Methods
2.1. Study Area
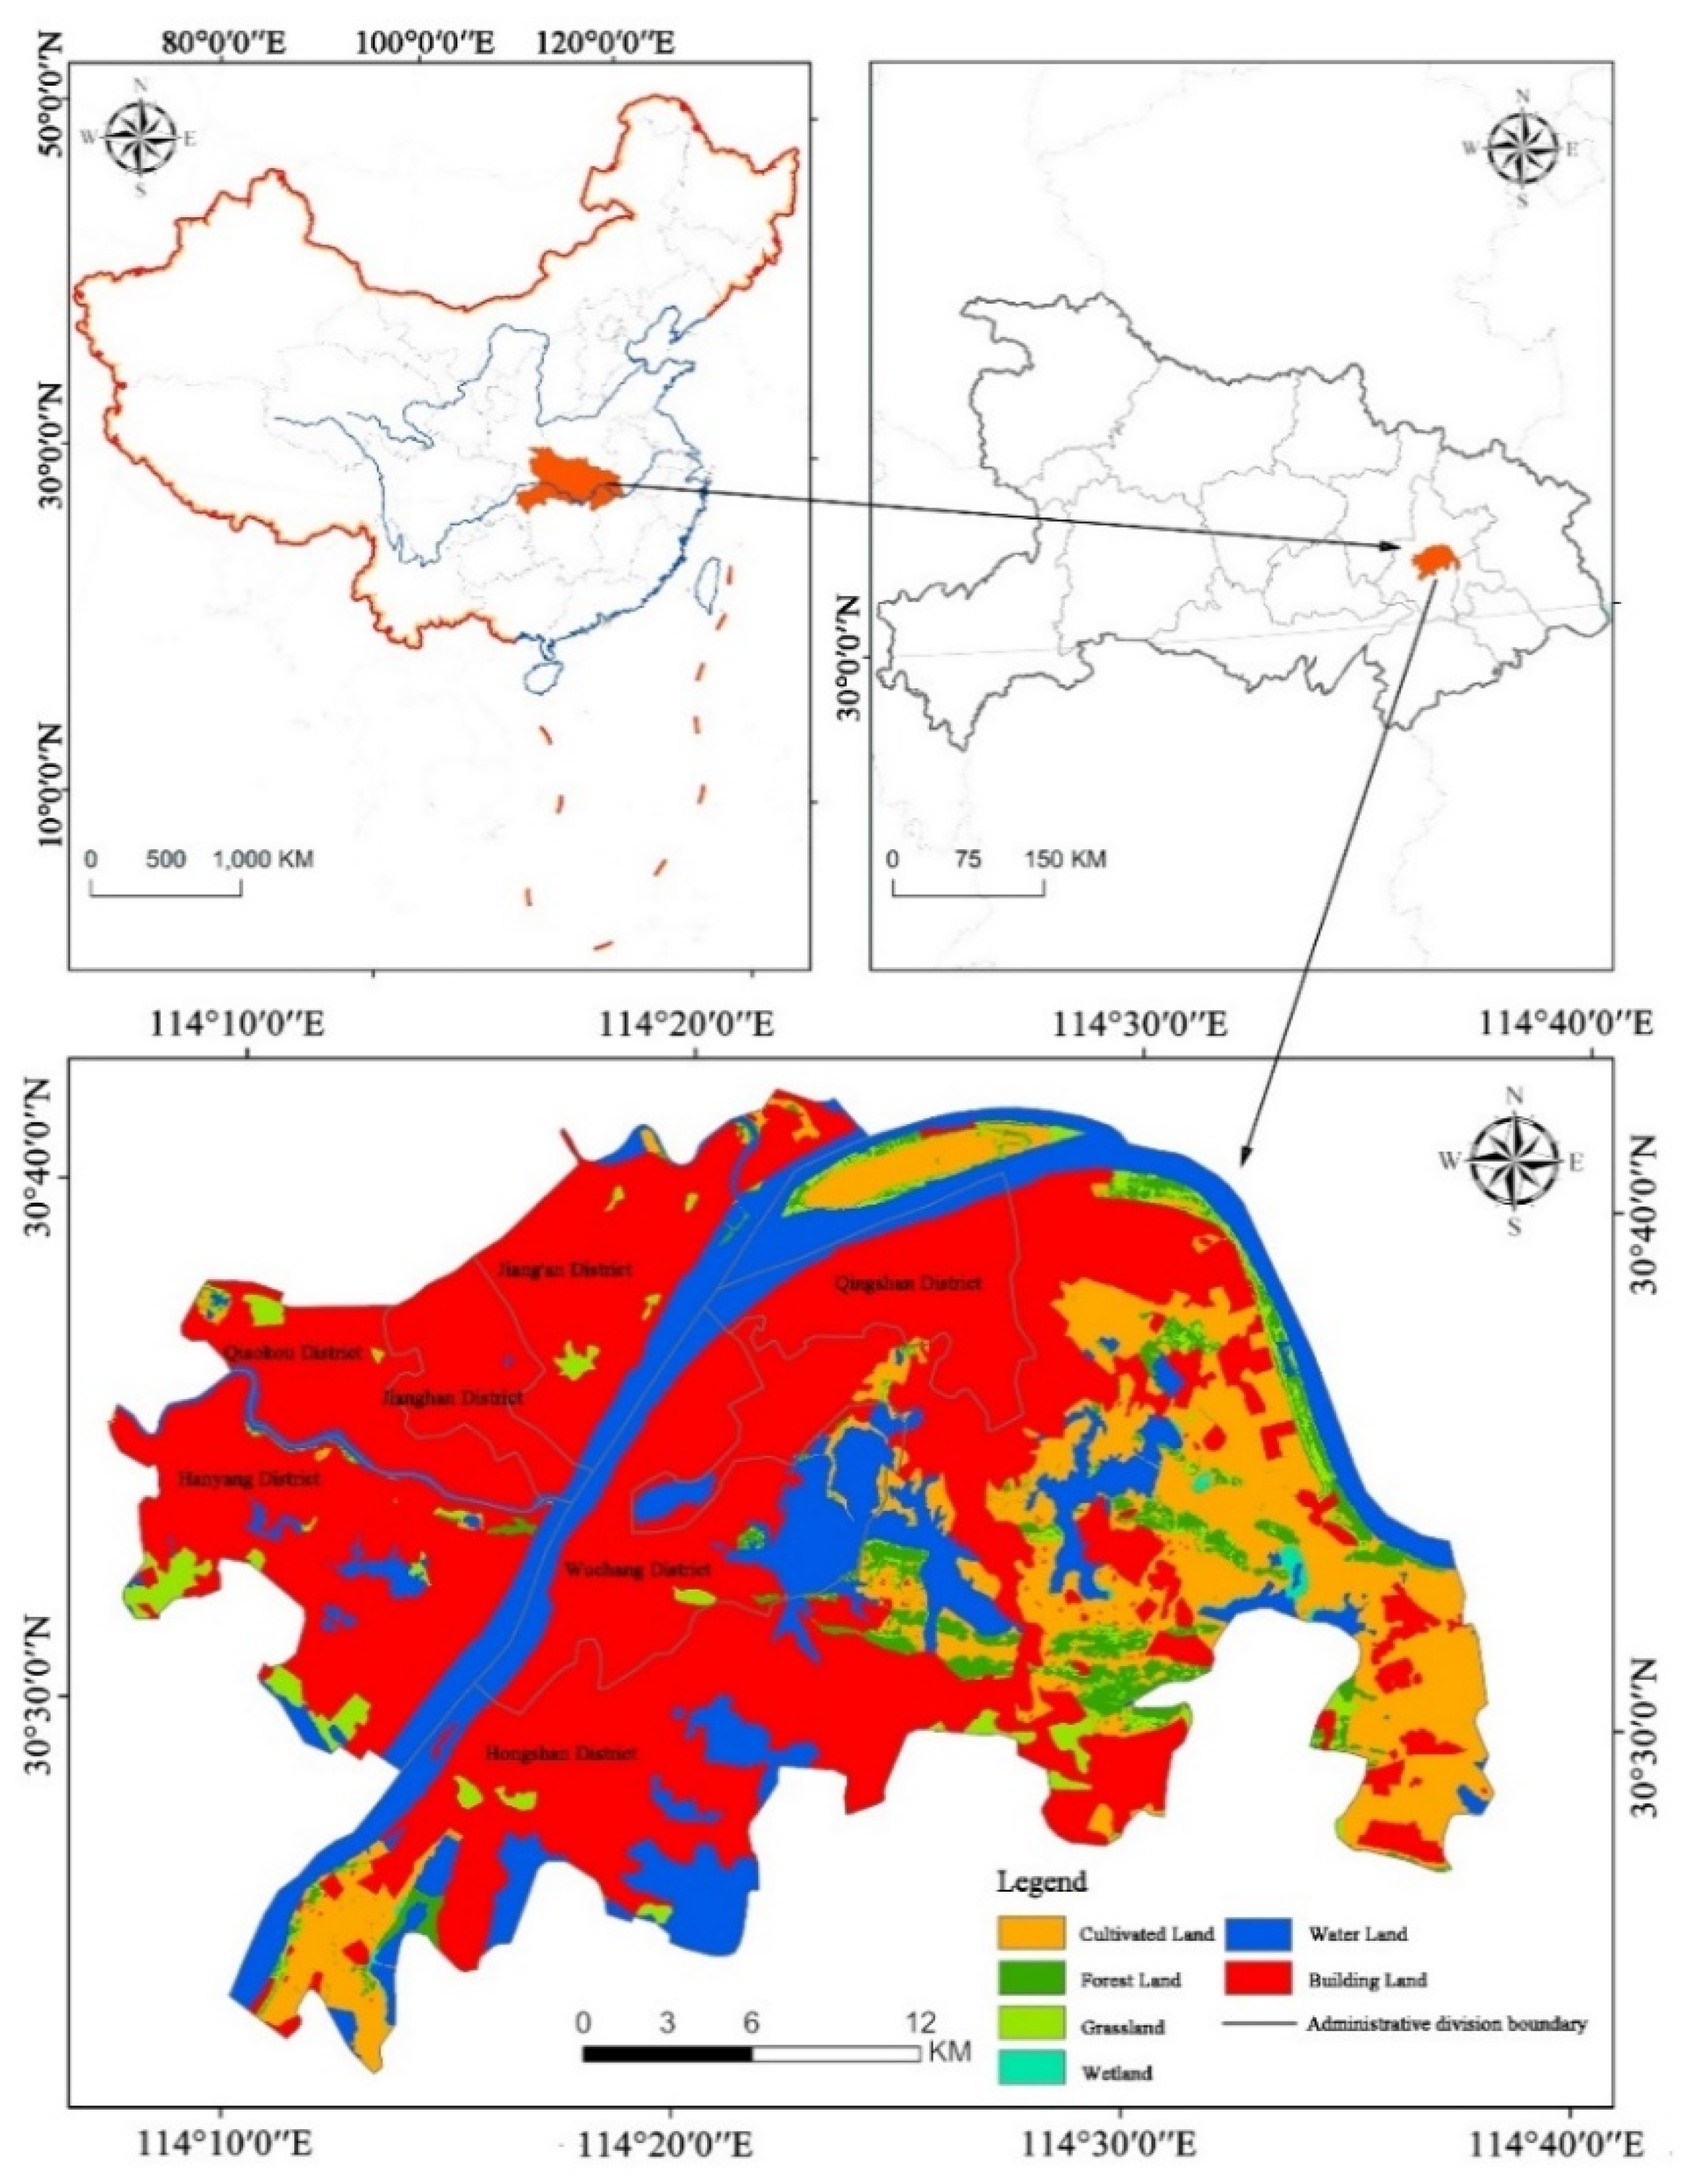
As shown in Figure 1, the central urban area of Wuhan is constituted of seven regions and is situated at the intersection of the Yangtze River (middle reaches) and the Han River. It belongs to a characteristic subtropical humid monsoon climate with an excellent environment. The average annual temperature is 15.8 °C to 17.5 °C, and the average annual rainfall is 1269 mm. On the other hand, Wuhan has experienced rapid urbanization since the beginning of the 21st century. According to the results of Wuhan’s seventh national census, the urbanization rate is as high as 84.31%, yet it has triggered a series of significant deteriorations of the ecological environment [32]. In particular, the ecological patches in the central urban area of Wuhan have been gradually occupied, and the sharp decrease in biodiversity has seriously threatened the ecological security pattern of the central urban area of Wuhan and hindered the healthy and sustainable development of the central urban area of Wuhan in the future.
2.2. Research Framework and Data Preprocessing
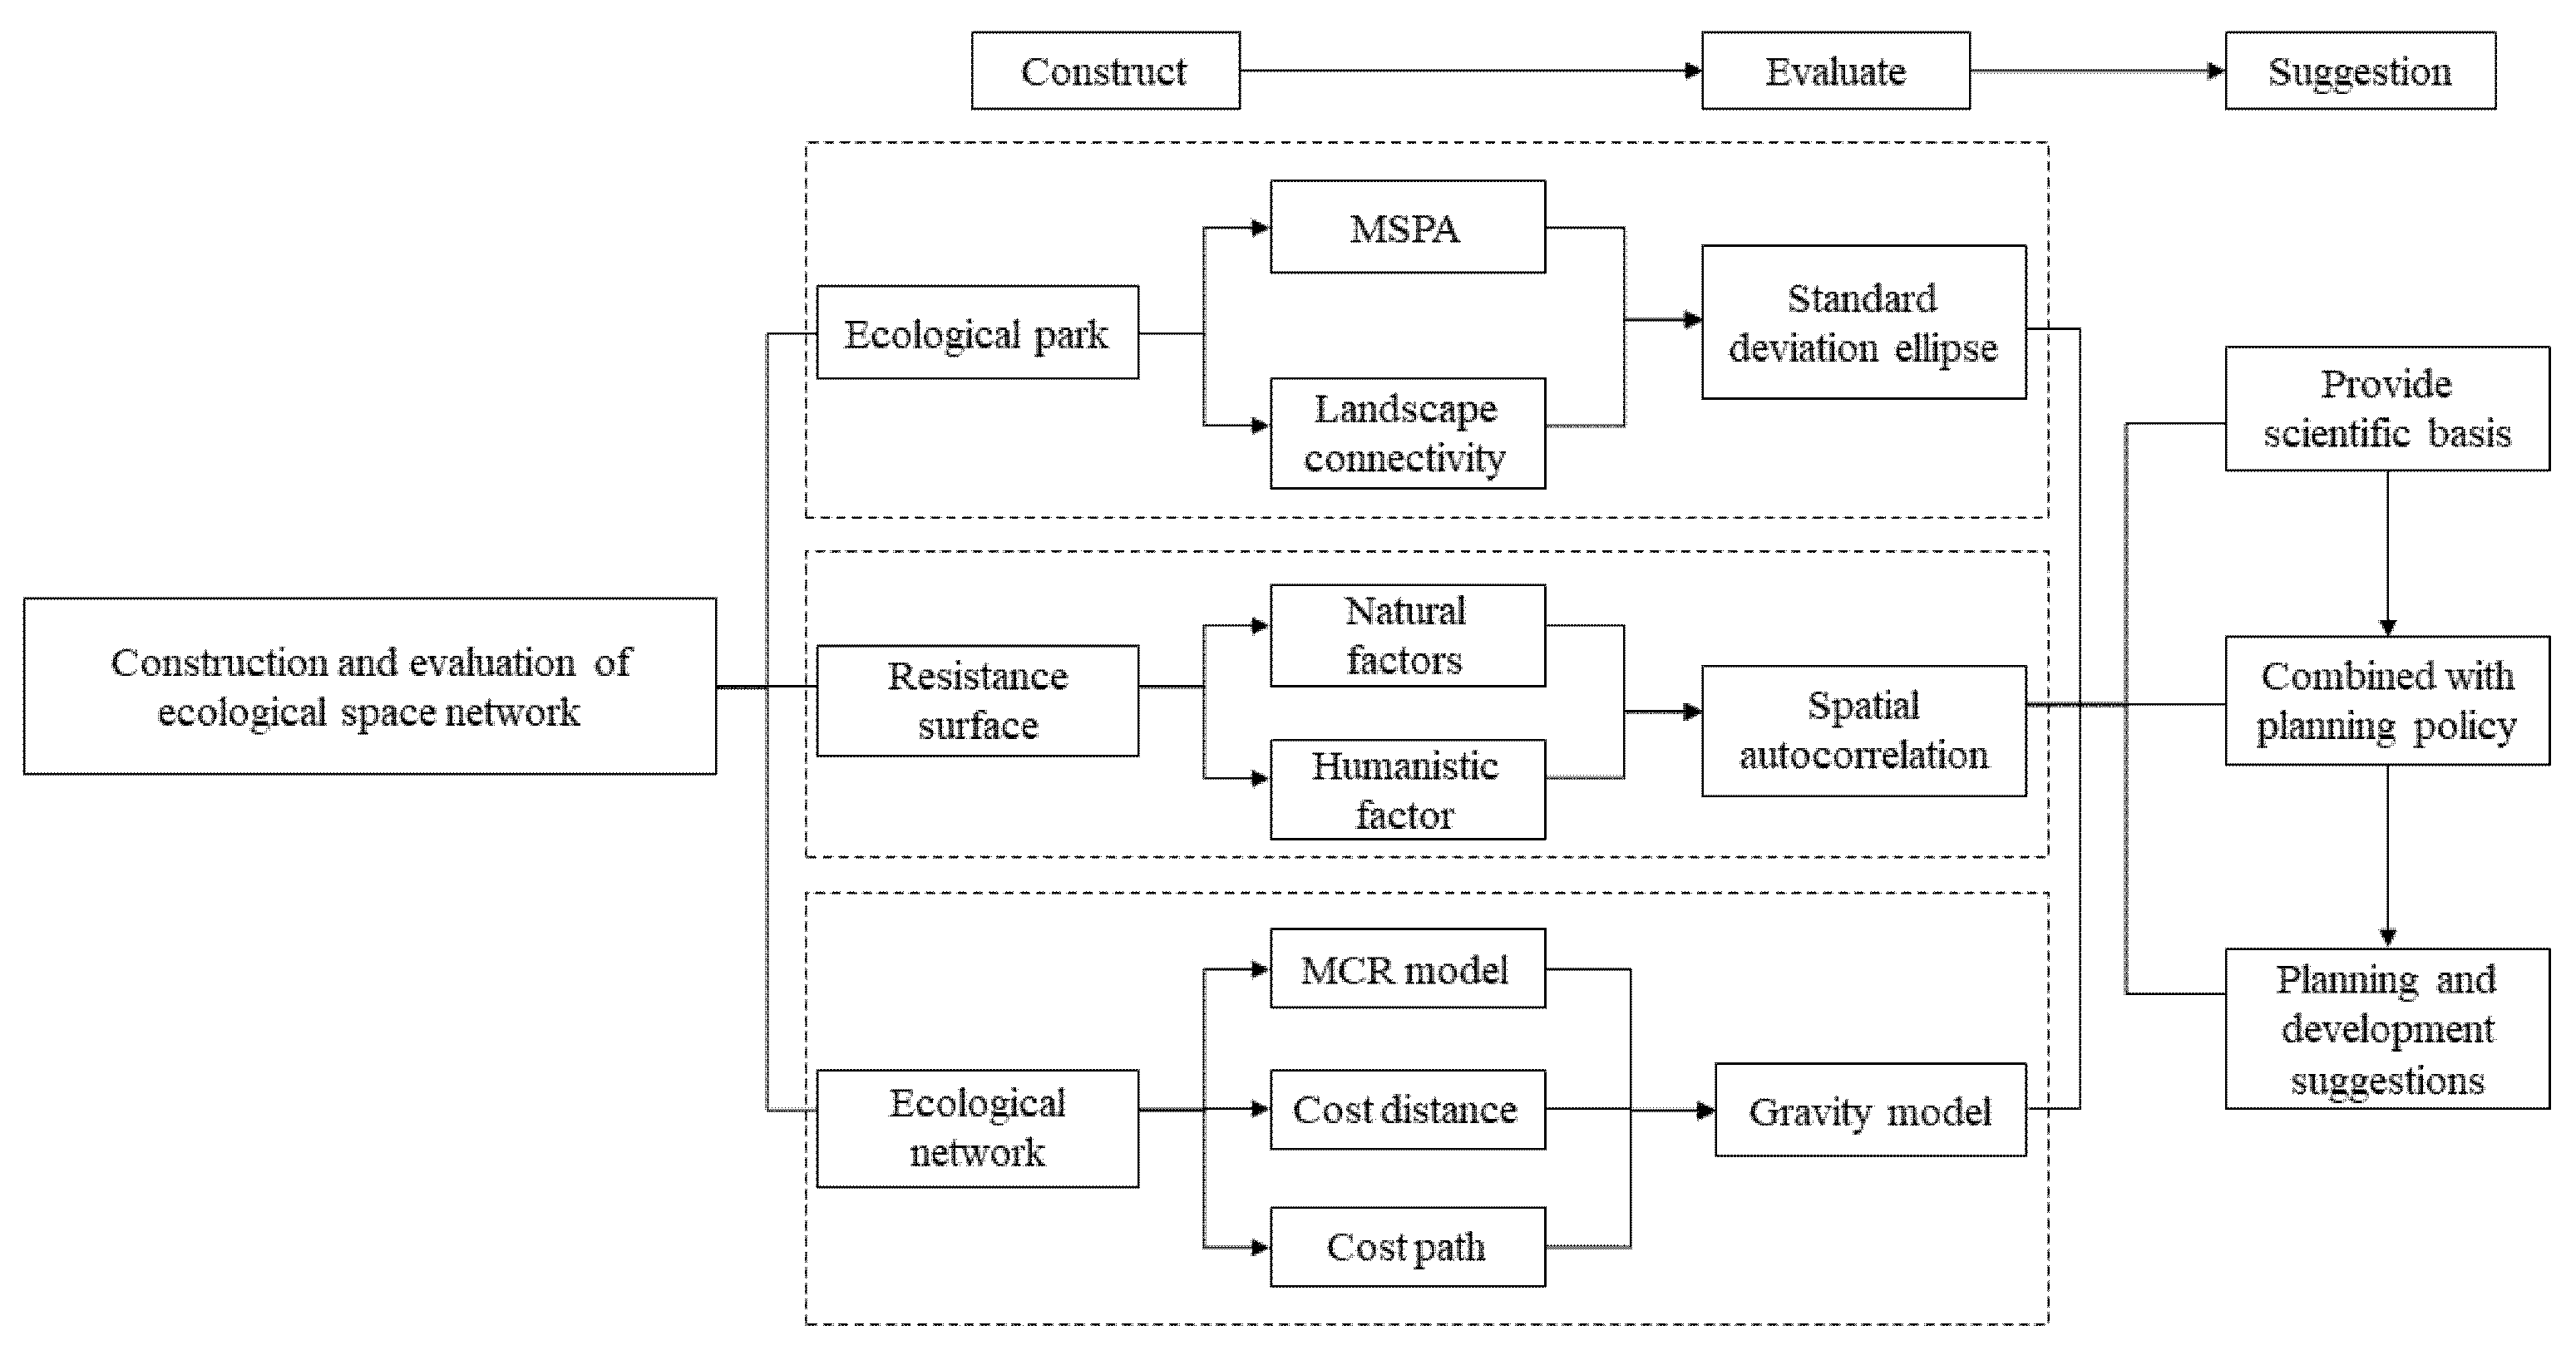
Figure 2 summarizes constructing and evaluating the ecological network in Wuhan central city. The following sections expand on the steps that describe each phase in detail. Specifically, morphological spatial pattern analysis (MSPA) is an image-processing method based on the morphological principles of corrosion, expansion, opening, and closing operations by Peter Vogt and other researchers [33], which calculates, identifies, and divides the matrix of land-use raster images, to effectively identify critical habitat patches in the study area [34,35,36].
The data used in this study mainly include land-use data, SLOPE data (obtained by DEM), night light, etc.: (1) land-use data: from GLOBELAND30, a 30 m-resolution global land cover data set established by a Chinese scientific team. Available online: http://www.globallandcover.com/ (accessed on 15 October 2021). (2) DEM data: 30 m-resolution ASTERGDEM digital elevation data from the Chinese Academy of Sciences geospatial data cloud, and these data will be used to extract slope. Available online: http://www.gscloud.cn/ (accessed on 15 October 2021). (3) Night-lighting data: these come from the first professional luminous remote sensing satellite in the world—Luojia-1 Scientific Experimental Satellite. At present, night lighting data have been proved to be the scientific basis for reflecting the intensity and scope of human activities such as regional urbanization level, social and economic status, environmental energy consumption, etc. [37]. At the same time, to reduce the errors, we convert all the generated grid maps into a general spatial coordinate system (WGS1984, UTM Zone 50N) and divide them into 30 m × 30 m grid units by using a grid calculator [38].
Considering the relatively flat topography of Wuhan central city, the DEM value ranges from −40 to 174, so using ArcGIS to preprocess DEM data to calculate the slope can better measure the ecological spatial value characteristics of Wuhan central city. The calculation formula is as follows:
In the formula, and represent partial derivatives in x and y directions, respectively, and P is a slope.
2.3. Ecological Source Construction and Evaluation
2.3.1. Morphological Spatial Pattern Analysis (MSPA)
To be specific, firstly, raster images are reclassified into two types: foreground and background images, in which natural ecological resources such as water, forest land, grassland, and wetland in land use with a raster size of 30 m × 30 m are set as foreground with an assignment of 2, land types such as cultivated land and construction land are designated as background with a selection of 1, and the remaining missing values are set as 0. Then, using Guidos Toolbox analysis software, seven categories of landscape functions, namely, core, bridge, loop, branch, edge, perforation, and islet, are divided by different image processing methods (Table 1). The landscape classification results with different ecological meanings are statistically analyzed and strengthened. Finally, the connectivity of the extracted core areas is analyzed to prepare for screening of the important ecological source areas in Wuhan central city.
2.3.2. Landscape Connectivity Evaluation
Landscape connectivity indicates that landscape promotes or hinders the diffusion process of species among ecological patches [39,40]. Precisely, it can effectively judge the connectivity between ecological patches from the macroscopic quantitative point of view [41]. The connectivity probability (PC) value in the results can also identify ecological patches with important connectivity [42], and the formula is as follows:
In the formula, n is the number of patches, and are the area of patches and , AL is the total landscape area, and is the maximum probability of species dispersion in patches and . The value of PC ranges from 0 to 1, and the larger the value, the higher the connectivity value of a regional ecological landscape. The increment of PC (dPC) can measure the contribution of each ecological patch to the overall connectivity value of the ecological network [43]. The formula is as follows:
In the formula, indicates the importance of removing elements, is the calculation result of connectivity, and indicates the connectivity calculation result after removing a certain element. The higher the dI value, the higher the importance between features [44]. We use Conefor software. Available online: http://www.conefor.org/ (accessed on 15 October 2021). We set the threshold of connectivity distance and connectivity probability of ecological patches to 2500 and 0.5, and finally determined the ecological source of the study area according to dPC value. Therefore, in this study, seven ecological patches with dPC value greater than 5 were selected as important ecological sources for species survival and reproduction in the study area, while other patches were general ecological sources.
2.3.3. Standard Deviation Ellipse Analysis
The standard deviation ellipse method is a spatial econometric analysis method, proposed by Lefever (1926) [45] and gradually widely used, which can reflect the distribution characteristics and direction trend of spatial data [46], in which the length of the principal axis indicates the spatial distribution direction and the degree of aggregation and dispersion of data. The angle of rotation reflects the dominant trend of spatial data change. Therefore, this study uses the standard deviation ellipse method to evaluate the 200 ecological sources identified in the early stage and explore the spatial development direction of ecological sources in the study area. The calculation formula is as follows:
In the formula, xi and yi are the coordinates of element i, represents the average center of elements, and n represents the total number of elements.
2.4. Construction and Evaluation of Ecological Resistance Surface
2.4.1. Ecological Resistance Surface Based on Natural–Human Factors
Due to the different stages of natural land cover and human intervention, the ecological spatial movement process of species in other regions presents different characteristics, including the mobility and transferability of ecological functions [47,48], which shows that ecological land is influenced by both natural and human factors [49]. Therefore, combined with Wuhan central city’s unique ecological spatial pattern, this paper constructs a natural–humanistic composite element based on land-use type, slope, and night light data. When evaluating the resistance value of each index, it is divided into five levels from 1 to 5. The higher the value, the more excellent the ecological resistance in the process of species diffusion. According to the evaluation system (Table 2), the resistance value given by each factor is determined as the cost data of the MCR model [15,23,50,51,52,53].
2.4.2. Spatial Autocorrelation Analysis
According to the first law of geography, geographical elements are interrelated in space, and the correlation decreases with the increase in spatial distance, called spatial autocorrelation. Therefore, spatial autocorrelation analysis can analyze the spatial correlation and spatial difference of ecological resistance surface in Wuhan central city. Moran’s I index is used as a statistical index to measure the global spatial autocorrelation degree. The calculation formula is as follows:
in which n is the sample size, and are the observed values of spatial positions and , respectively, represents the relationship between spatial positions and , and when and are adjacent, = 1; otherwise, it is 0. The global Moran’s I index ranges from −1 to 1. When the value is greater than 0, it represents spatial positive correlation, when it is less than 0, it represents negative correlation, and when it is equal to 0, it represents no correlation.
The local spatial autocorrelation value represents the correlation degree of the same attribute value between a spatial unit and its adjacent spatial units. The Local Moran’s I statistics can measure the spatial correlation and heterogeneity of spatial elements in adjacent areas [54]. The calculation formula is as follows:
in which and are the attribute values of research units and , respectively, represents the spatial weight matrix, and represents the local correlation index of unit.
This paper calculates Moran’s I index based on GeoDa and ArcGIS 10.5. A LISA distribution map is drawn because LISA can distinguish four types with statistical significance (p = 0.05): high and high agglomeration (HH), high and low agglomeration (HL), low and low agglomeration (LL), and low and high agglomeration (LH) [55], thus showing the spatial agglomeration characteristics of ecological resistance surface in Wuhan central city.
2.5. Construction and Evaluation of Ecological Network
2.5.1. Minimum Cumulative Resistance Model (MCR)
MCR (minimum cumulative resistance model) was proposed by Knaapen and other researchers [56], and can simulate the species in the study area by calculating the minimum path between source and target, and better describe the trend and potential of material and energy flowing between ecological patches [57,58]. The calculation formula is as follows:
in which represents the species spatial distance from source point j to ecological patch i, and is the movement from the resistance coefficient of landscape unit i to a certain patch.
2.5.2. Cost Distance and Cost Path Analysis
Based on the generated ecological sources and resistance surfaces, the lowest-cost path between important ecological sources is simulated by ArcGIS software. Firstly, the Cost Distance module measures the minimum cumulative cost distance between each pixel in the ecological source and the adjacent area on the comprehensive resistance surface. Then, the Cost Path module is used to calculate the minimum-cost path from the ecological source to the target patch, which is used to create the potential ecological corridor in the study area.
2.5.3. Gravity Model Analysis
The gravity model can quantify the interaction force between ecological sources by measuring the interaction matrix between important ecological sources [27], and then scientifically and reasonably evaluating the relative importance of potential ecological corridors and draw the ecological network map of the study area according to the actual situation of the study area [27,59]. The formula is as follows:
In the formula, represents the degree of interaction between plaque and ; and are the weight coefficients of patch and , respectively; is the standardized resistance value of potential ecological corridor between patches and ; is the overall resistance value of plaque ; is the area of plaque ; represents the cumulative resistance value of the potential corridor between patches and , and; is the maximum resistance value of all corridors in the study area.
3. Results
3.1. Ecological Sources
As shown in Figure 3a and Table 3, the study area comprises 200 regional core landscapes with a total area of 22,901.31 hm2, accounting for 88.29% of the total foreground area, primarily distributed in woodland, river, and other places in the south-central part. At the same time, the spatial distribution in the north is rare. On the whole, the core landscape space is broken, which signifies the weak connection between patches. The marginal area next to the core landscape is 2526.57 hm2, accounting for 9.74% of the total foreground area, indicating that the prospect of the study area has an excellent marginal effect. The connecting branch lines and pore areas account for 0.73% and 0.63% of the foreground area, respectively. The area of the connecting bridge only accounts for 0.14% of the total area of the foreground, so it is impossible to construct the ecological flow channel of energy and material in the central city of Wuhan. The isolated island patch area only accounts for 0.25% of the foreground area. The loop line supporting the circulation of species in ecological patches only accounts for 0.22% of the total area of the prospect.
Seven important ecological sources were selected according to the dPC value being greater than 5. The critical ecological patches with connectivity in Wuhan central city were concentrated in the Yangtze River (middle reaches) and its south (Figure 3b). Although they basically covered the ecological core zone of the study area (Table 4), there were no patches with important connectivity in the north of the Yangtze River (middle reaches), resulting in poor connectivity between the north and south of ecological sources, which led to uneven spatial distribution. On the other hand, dPC values vary greatly among ecological sources, so it is urgent to build an ecological network to improve ecological suitability and landscape connectivity in Wuhan central city.
As shown in Figure 3b, the ecological source areas principally distributed in the eastern part of the study area have scattered and blocky distribution characteristics, leading to the development direction of NE–SW. However, ecological sources in the north are less distributed and spread in space. The ecological source-classification map and land-use map were superimposed and analyzed. It was found that the ecological sources were mainly waters, woodland, and grassland with good habitat quality, accounting for 75.43%, 12.66%, and 11.24% of the total ecological source area, respectively.
3.2. Improved Ecological Resistance Surface
Based on the ecological resistance-factor assignment standard of the “comprehensive weighted index method”, the comprehensive ecological resistance surface of the study area was shaped, as shown in Figure 4. Figure 4a shows the reclassified land-use classification, Figure 4b shows the reclassified slopes, showing noticeable north–south differences along the banks of the Yangtze River, and Figure 4c shows the reclassified night lights, reflecting that the human social activities in Wuhan downtown are mainly concentrated along the Yangtze River and its radiation-driven areas. Figure 4d is a comprehensive ecological resistance surface corrected based on natural–human factors. The average ecological resistance value is 2.65, the maximum value is 4.70, and the minimum value is 1.00. The ecological resistance in the middle-east is lower than that in the west.
The Moran’s I index is 0.763, the z value is 153.159, and the p-value is 0.000. The results show that ecological resistance has a strong positive correlation in space. The spatial aggregation was analyzed by local autocorrelation LISA analysis. As shown in Figure 5, the areas with prominent human activities on both sides of the Yangtze River (middle reaches) predominantly show the characteristics of high concentration (HH), covering six administrative regions, including Hanyang District, Qiaokou District, Jianghan District, Jiang’an District, Qingshan District, and Wuchang Districts. Among them, Hongshan District also has some HH districts. However, in the Yangtze River (middle reaches), East Lake Eco-tourism Scenic Area, Yanxi Lake, and other areas rich in natural resources, it mainly shows the characteristics of low concentration (LL).
3.3. Ecological Network
Based on the ecological source and comprehensive resistance surface determined above, the MCR model was used to construct Wuhan central city’s entire minimum cumulative resistance surface (Figure 6a). The results show a spatial pattern of “one axis block”, the central axis in the northeast–southwest direction is formed in the middle due to the action of crossing the Yangtze River Basin. At the same time, there are six blocks of low-resistance areas in lakes and scenic spots in the south.
By analyzing the cost path of important ecological sources in the central city of Wuhan, 21 potential ecological corridors are generated, and the interaction matrix (Table 5) used to quantitatively measure the relationship between ecological patches is calculated by gravity model to determine the importance of different connected corridors in the region to the ecosystem. Therefore, those with gravity model values greater than 30 are divided into essential corridors, and the rest are taken as general corridors, including five critical corridors and sixteen general corridors (Figure 6b).
The results show that the gravity model values greater than 50 include patches 1 and 2, patches 1 and 3, and patches 2 and 7, indicating that the interaction between the two patches is strong. It is more probable to overcome the resistance of species migration, which is conducive to the exchange and dissemination of material and energy. Therefore, destructive human activities should be avoided, and the protection of the above corridors should be strengthened. Since the distance between plaque two and plaque five is the farthest, the possibility of communication is the smallest. Generally speaking, due to the lack of significant ecological sources in the north of the Yangtze River in the study area, the spatial distribution of critical ecological sources is highly uneven, and the connection between the north and the south is weak. Therefore, it is of great practical significance to link species migration and energy exchange between the north and the south to ensure the overall connectivity of the ecological landscape in the study area.
4. Discussion
4.1. Characteristics of Ecological Sources
Ecological origin refers to large and relatively complete patches which can protect biodiversity and be conducive to the survival, reproduction, and migration of species [19]. In this study, different from the previous direct and comprehensive methods, we used land-use data based on the MSPA method, image processing, and morphological analysis to identify the ecological source of the central urban area of Wuhan, and extract habitat patches that play an essential role in connecting the landscape at the pixel level [21]. The identified ecological source of the Wuhan central urban area is the result of natural action and covers the artificial landscape formed according to the specific needs of human beings. The composition of landscape patches is complex and diverse, accounting for 88.29% of the total prospect area. The results are consistent with the spatial distribution of natural ecological elements such as water and forest land in the central urban area of Wuhan and artificial landscapes such as East Lake Eco-tourism Scenic Area. This result is similar to previous research results [11,15] which show that MSPA is more objective and reasonable than the commonly used ecological source-identification methods.
At the same time, according to the fact that the dPC value in landscape connectivity is greater than 5, which is regarded as the source of biological species development and proliferation, seven important ecological sources are selected, indicating that the core patches with good connectivity are mainly distributed in the south of the study area, with poor overall connectivity and north–south severe faults. Therefore, it is necessary to strengthen the protection and restoration of the northern region, build ecological patches suitable for species survival, promote the ecological network of material and energy flow between the north and south regions, and promote the healthy and sustainable development of the ecosystem. On the other hand, the Yangtze River Basin and East Lake Eco-tourism Scenic Area have the most significant patch area and the highest aggregation index in the ecological source areas of Wuhan central city, which are suitable for aquatic organisms and aquatic amphibians to multiply and survive in them, and only 12.66% of the land types of ecological source areas are woodland and 11.24% grassland, so there is less activity space suitable for terrestrial organisms than aquatic organisms. Therefore, it is necessary to shape the green land further and create the land-use function of the urban forest in Wuhan central city.
4.2. Analysis of Ecological Resistance Surface
In the method of ecological resistance assignment, the comprehensive resistance surface is constructed through the “comprehensive weighted index sum method”, and the natural–human resistance factors are determined according to the biodiversity needs of the specific study area. While reflecting the ecological value of different land functions in the central urban area of Wuhan, the interference effect of human factors is introduced based on the night light data; although there is no recognized standard for the selection of ecological resistance surface at home and abroad [60,61], it has a particular reference significance for the future study of ecological resistance surface in densely populated urban areas. The results show that, especially in recent years of rapid urbanization, the artificial surface areas of residential land, industrial and mining land, and transportation facilities in the central urban area of Wuhan are expanding, which makes the value of ecological resistance surface in this area larger [62]. This result is the same as that of the former [63]. At the same time, the ecological resistance shows a strong positive correlation in the global space. The areas with solid human activities show the characteristics of high–high agglomeration (HH). In contrast, the areas with rich ecological resources such as rivers and woodlands show the attributes of low–low aggregation (LL).
4.3. Construction of Ecological Network
In this study, the minimum cumulative resistance model was used to construct the “one-axis block” spatial basic framework of the Wuhan major urban ecological network, in which the “one-axis” is the Yangtze River basin located in the northeast–southwest direction in the middle. “Blocky” refers to six areas with low block resistance distributed in the south. At the same time, the ecological network is evaluated by the gravity model. The results show that there are five critical corridors in the central city of Wuhan, and the interaction between patches 5 and 6 and other patches is weak. Therefore, it is necessary to strengthen the protection and restoration of ecological corridors between patches 5 and 6 and other patches in future ecological planning to ensure the connectivity of matter and energy between patches. On the other hand, the existing corridors are mainly concentrated in the south of the Yangtze River Basin, which is consistent with the research results of previous researchers [64]. From the perspective of maintaining the stability and integrity of the ecosystem, it is necessary to plan the ecological source areas and ecological corridors in the north to protect the ecological network system and repair the habitat fragmentation caused by rapid urbanization, which is the critical area in the future development and construction of Wuhan central city. Combining with the ecological pattern of “two-mountains, two-waters, and one-piece” advocated in “Wuhan Ecological Framework Protection Plan”, the ecological framework structure of “two-axes, two-rings, six-wedges, and multiple-corridors” was implemented at the city level. It was proposed to break the city’s administrative boundary and build a flaky ecological outer ring of “internal introduction and external connection”, which further demonstrated the viewpoint of this study and provided significant reference value for future planning. At the same time, according to the requirements of Wuhan’s “14th five-year plan” for ecological and environmental protection, the research results can be applied to the boundary and distinction of the ecological-protection red line, and to explore the establishment of an ecological-protection red-line supervision system, the eco-environment management and control unit and the eco-environment access list are taken as the essential basis of industry layout, structure adjustment, resource development, town construction, primary project-site selection, planning environmental assessment, eco-environment governance, and supervision.
4.4. Research Limitations and Future Research Directions
The limitations and future research directions of this study are mainly reflected in the following three points: (1) since the differentiated research scale will impact the analysis results of MSPA [65], we should choose the appropriate regional research scale. However, larger granularity usually leads to missing small ecological patches with better connectivity, so this study limited the size of the grid research scale to 30 m. Different research scales for comparative study can be set in the future. (2) In this study, the dPC threshold was set concerning previous studies, the connected distance threshold was set at 2500 m, and the connection probability was 0.5. The PC index would change with the set threshold. If the distance between two ecological sources exceeds the set threshold, the two places are not connected, reflecting the biological diffusion distance [44]. Therefore, a scientific threshold will be set according to the actual research situation in the future for more detailed research, such as using the target-species method to meet the requirements of local wetland animal migration and diffusion [66]. (3) The constructed ecological resistance surface does not consider the influence of other human interference factors and the living habits of certain organisms in the study area [67]. It lacks effective indicators that can be used to evaluate specific target ecological functions [68], which has certain limitations. It can be comprehensively analyzed with more multi-source data in the future.
5. Conclusions
In this study, the central city of Wuhan was taken as the main research area. Aiming at the key problem of quantitatively constructing and evaluating the ecological source and ecological network, MSPA-MCR model were used to provide a scientific basis for the planning scheme of protecting ecological patches and focal-species living environment in the city. The main conclusions of the study are as follows:
- (1)
- Based on the morphological principle, this study identified various ecological landscape types with important ecological significance in the central urban area of Wuhan: Core (88.29%), Islet (0.25%), Perf (0.63%), Edge (9.74%), Loop (0.22%), Bridge (0.14%), and Branch (0.73%). Through the dPC landscape index, the seven core patches in the south of the middle reach of the Yangtze River in the study area were scientifically and accurately identified, which avoids the randomness and subjectivity of manual selection to a great extent.
- (2)
- The comprehensive ecological resistance factors of natural–human factors were constructed according to the MCR model to establish the complete minimum cumulative ecological resistance surface between ecological sources in the study area. The average ecological resistance value is 2.65, the maximum value is 4.70, and the minimum value is 1.00. Spatially, the ecological resistance value in the middle-east is lower than that in the west; this reflects the fact that human social activities in the central urban area of Wuhan are concentrated along the Yangtze River and its radiation-driven areas.
- (3)
- The ecological source, resistance surface, and ecological corridor were evaluated quantitatively. According to the standard deviation ellipse, the NE–SW distribution direction of ecological sources was analyzed. There are few ecological sources in the north, and the spatial distribution is scattered. According to the spatial autocorrelation evaluation, the ecological resistance surface in the central urban area of Wuhan has a solid global positive correlation and local spatial aggregation characteristics. Based on the gravity model, the interaction intensity of ecological corridors between sources was evaluated, and the importance of ecological corridor protection and restoration was quantitatively analyzed. Since the use of these focal species can guide the ecological protection and utilization planning of the Wuhan central urban area, the focal indicators for these sensitive species can be considered in the future.
Author Contributions
C.H.: writing—original draft, data curation, software. Z.W.: data curation, software. Y.W.: editing. D.S.: supervision, writing—review and editing. J.Z.: supervision. All authors have read and agreed to the published version of the manuscript.
Funding
This work was supported by the Natural Science Foundation of China under grants 41971162 and 52078245.
Institutional Review Board Statement
Not applicable.
Informed Consent Statement
Not applicable.
Data Availability Statement
The data presented in this study are available on request from the author.
Conflicts of Interest
The authors declare no conflict of interest.
References
- Brockerhoff, M.; Nations, U. World Urbanization Prospects: The 1996 Revision. Popul. Dev. Rev. 1998, 24, 883. [Google Scholar] [CrossRef] [Green Version]
- Peng, J.; Liu, Y.; Liu, Z.; Yang, Y. Mapping spatial non-stationarity of human-natural factors associated with agricultural landscape multifunctionality in Beijing–Tianjin–Hebei region, China. Agric. Ecosyst. Environ. 2017, 246, 221–233. [Google Scholar] [CrossRef]
- Raschid-Sally, L.; Carr, R.; Buechler, S. Managing wastewater agriculture to improve livelihoods and environmental quality in poor countries. Irrig. Drain. 2005, 54, S11–S22. [Google Scholar] [CrossRef]
- Lemos, M.C.; Morehouse, B.J. The co-production of science and policy in integrated climate assessments. Glob. Environ. Chang. 2005, 15, 57–68. [Google Scholar] [CrossRef]
- Battisti, C. Habitat fragmentation, fauna and ecological network planning: Toward a theoretical conceptual framework. Ital. J. Zool. 2003, 70, 241–247. [Google Scholar] [CrossRef]
- Hüse, B.; Szabo, S.; Deák, B.; Tóthmérész, B. Mapping an ecological network of green habitat patches and their role in maintaining urban biodiversity in and around Debrecen city (Eastern Hungary). Land Use Policy 2016, 57, 574–581. [Google Scholar] [CrossRef]
- Zhang, X.H.; Huang, Q.L.; Zhang, C. Analysis of forest landscape dynamics based on Forest Landscape Restoration: A case study of Yong’an city, Fujian province, China. Eur. J. For. Res. 2010, 129, 975–980. [Google Scholar] [CrossRef]
- Kim, K.-H.; Pauleit, S. Landscape character, biodiversity and land use planning: The case of Kwangju City Region, South Korea. Land Use Policy 2007, 24, 264–274. [Google Scholar] [CrossRef]
- Tan, P.Y.; Bin Abdul Hamid, A.R. Urban ecological research in Singapore and its relevance to the advancement of urban ecology and sustainability. Landsc. Urban Plan. 2014, 125, 271–289. [Google Scholar] [CrossRef]
- Kempen, G.; Ormel, J.; Brilman, E.I.; Relyveld, J. Adaptive responses among Dutch elderly: The impact of eight chronic medical conditions on health-related quality of life. Am. J. Public Health 1997, 87, 38–44. [Google Scholar] [CrossRef]
- Yang, J.; Yang, Y.; Sun, D.; Jin, C.; Xiao, X. Influence of urban morphological characteristics on thermal environment. Sustain. Cities Soc. 2021, 72, 103045. [Google Scholar] [CrossRef]
- Guo, A.; Yang, J.; Xiao, X.; Xia, J.; Jin, C.; Li, X. Influences of urban spatial form on urban heat island effects at the community level in China. Sustain. Cities Soc. 2020, 53, 101972. [Google Scholar] [CrossRef]
- Yan, L.; Yu, L.; An, M.; Su, H.; Li, H.; Yuan, C. Explanation of the Patterns, Spatial Relationships, and Node Functions of Biodiversity and Island: An Example of Nature Reserves in Guizhou, Southwest China. Sustainability 2019, 11, 6197. [Google Scholar] [CrossRef] [Green Version]
- Xu, J.; Fan, F.; Liu, Y.; Dong, J.; Chen, J. Construction of Ecological Security Patterns in Nature Reserves Based on Ecosystem Services and Circuit Theory: A Case Study in Wenchuan, China. Int. J. Environ. Res. Public Health 2019, 16, 3220. [Google Scholar] [CrossRef] [Green Version]
- Li, H.; Chen, W.; He, W. Planning of Green Space Ecological Network in Urban Areas: An Example of Nanchang, China. Int. J. Environ. Res. Public Health 2015, 12, 12889–12904. [Google Scholar] [CrossRef] [Green Version]
- Cui, L.; Wang, J.; Sun, L.; Lv, C. Construction and optimization of green space ecological networks in urban fringe areas: A case study with the urban fringe area of Tongzhou district in Beijing. J. Clean. Prod. 2020, 276, 124266. [Google Scholar] [CrossRef]
- Yao, H. Characterizing landuse changes in 1990–2010 in the coastal zone of Nantong, Jiangsu province, China. Ocean Coast. Manag. 2013, 71, 108–115. [Google Scholar] [CrossRef]
- Shi, X.; Qin, M. Research on the Optimization of Regional Green Infrastructure Network. Sustainability 2018, 10, 4649. [Google Scholar] [CrossRef] [Green Version]
- Chen, C.; Shi, L.; Lu, Y.; Yang, S.; Liu, S. The Optimization of Urban Ecological Network Planning Based on the Minimum Cumulative Resistance Model and Granularity Reverse Method: A Case Study of Haikou, China. IEEE Access 2020, 8, 43592–43605. [Google Scholar] [CrossRef]
- Wei, S.; Pan, J.; Liu, X. Landscape ecological safety assessment and landscape pattern optimization in arid inland river basin: Take Ganzhou District as an example. Hum. Ecol. Risk Assess. Int. J. 2018, 26, 782–806. [Google Scholar] [CrossRef]
- Ye, H.; Yang, Z.; Xu, X. Ecological Corridors Analysis Based on MSPA and MCR Model—A Case Study of the Tomur World Natural Heritage Region. Sustainability 2020, 12, 959. [Google Scholar] [CrossRef] [Green Version]
- Wickham, J.D.; Riitters, K.H.; Wade, T.G.; Vogt, P. A national assessment of green infrastructure and change for the conterminous United States using morphological image processing. Landsc. Urban Plan. 2010, 94, 186–195. [Google Scholar] [CrossRef]
- Chang, Q.; Liu, X.; Wu, J.; He, P. MSPA-Based Urban Green Infrastructure Planning and Management Approach for Urban Sustainability: Case Study of Longgang in China. J. Urban Plan. Dev. 2015, 141, 141. [Google Scholar] [CrossRef]
- Keeley, A.T.H.; Beier, P.; Gagnon, J.W. Estimating landscape resistance from habitat suitability: Effects of data source and nonlinearities. Landsc. Ecol. 2016, 31, 2151–2162. [Google Scholar] [CrossRef]
- Santos, J.S.; Leite, C.C.C.; Viana, J.C.C.; dos Santos, A.R.; Fernandes, M.M.; Abreu, V.D.S.; Nascimento, T.P.D.; dos Santos, L.S.; Fernandes, M.R.D.M.; da Silva, G.F.; et al. Delimitation of ecological corridors in the Brazilian Atlantic Forest. Ecol. Indic. 2018, 88, 414–424. [Google Scholar] [CrossRef]
- Dong, J.; Peng, J.; Liu, Y.; Qiu, S.; Han, Y. Integrating spatial continuous wavelet transform and kernel density estimation to identify ecological corridors in megacities. Landsc. Urban Plan. 2020, 199, 103815. [Google Scholar] [CrossRef]
- Zhang, Z.; Meerow, S.; Newell, J.P.; Lindquist, M. Enhancing landscape connectivity through multifunctional green infrastructure corridor modeling and design. Urban For. Urban Green. 2019, 38, 305–317. [Google Scholar] [CrossRef]
- Gaaff, A.; Reinhard, S. Incorporating the value of ecological networks into cost–benefit analysis to improve spatially explicit land-use planning. Ecol. Econ. 2012, 73, 66–74. [Google Scholar] [CrossRef]
- Zhang, Y.; Xia, L.; Fath, B.D.; Yang, Z.; Yin, X.; Su, M.; Liu, G.; Li, Y. Development of a spatially explicit network model of urban metabolism and analysis of the distribution of ecological relationships: Case study of Beijing, China. J. Clean. Prod. 2016, 112, 4304–4317. [Google Scholar] [CrossRef]
- Zhang, C.; Yang, Y.; Li, W.; Zhang, C.; Zhang, R.; Mei, Y.; Liao, X.; Liu, Y. Spatial distribution and ecological risk assessment of trace metals in urban soils in Wuhan, central China. Environ. Monit. Assess. 2015, 187, 556. [Google Scholar] [CrossRef]
- Miao, Z.; Pan, L.; Wang, Q.; Chen, P.; Yan, C.; Liu, L. Research on Urban Ecological Network Under the Threat of Road Networks—A Case Study of Wuhan. ISPRS Int. J. Geo-Inf. 2019, 8, 342. [Google Scholar] [CrossRef] [Green Version]
- Ding, L.; Chen, K.-L.; Cheng, S.-G.; Wang, X. Water ecological carrying capacity of urban lakes in the context of rapid urbanization: A case study of East Lake in Wuhan. Phys. Chem. Earth Parts A/B/C 2015, 89–90, 104–113. [Google Scholar] [CrossRef]
- Vogt, P.; Riitters, K.H.; Estreguil, C.; Kozak, J.; Wade, T.G.; Wickham, J.D. Mapping Spatial Patterns with Morphological Image Processing. Landsc. Ecol. 2007, 22, 171–177. [Google Scholar] [CrossRef]
- Saura, S.; Vogt, P.; Velázquez, J.; Hernando, A.; Tejera, R. Key structural forest connectors can be identified by combining landscape spatial pattern and network analyses. For. Ecol. Manag. 2011, 262, 150–160. [Google Scholar] [CrossRef]
- Carlier, J.; Moran, J. Landscape typology and ecological connectivity assessment to inform Greenway design. Sci. Total Environ. 2019, 651, 3241–3252. [Google Scholar] [CrossRef] [PubMed]
- Soille, P.; Vogt, P. Morphological segmentation of binary patterns. Pattern Recognit. Lett. 2009, 30, 456–459. [Google Scholar] [CrossRef]
- Bennett, M.M.; Smith, L.C. Advances in using multitemporal night-time lights satellite imagery to detect, estimate, and monitor socioeconomic dynamics. Remote Sens. Environ. 2017, 192, 176–197. [Google Scholar] [CrossRef]
- Yang, J.; Wang, Y.; Xiao, X.; Jin, C.; Xia, J.C.; Li, X. Spatial differentiation of urban wind and thermal environment in different grid sizes. Urban Clim. 2019, 28, 100458. [Google Scholar] [CrossRef]
- Taylor, P.D.; Fahrig, L.; Henein, K.; Merriam, G. Connectivity Is a Vital Element of Landscape Structure. Oikos 1993, 68, 571. [Google Scholar] [CrossRef] [Green Version]
- Forman, R.T.; Collinge, S.K. Nature conserved in changing landscapes with and without spatial planning. Landsc. Urban Plan. 1997, 37, 129–135. [Google Scholar] [CrossRef]
- Clergeau, P.; Burel, F. The role of spatiotemporal patch connectivity at the landscape level: An example in a bird distribution. Landsc. Urban Plan. 1997, 38, 37–43. [Google Scholar] [CrossRef]
- Saura, S.; Estreguil, C.; Mouton, C.; Rodríguez-Freire, M. Network analysis to assess landscape connectivity trends: Application to European forests (1990–2000). Ecol. Indic. 2011, 11, 407–416. [Google Scholar] [CrossRef]
- Saura, S.; Torné, J. Conefor Sensinode 2.2: A software package for quantifying the importance of habitat patches for landscape connectivity. Environ. Model. Softw. 2009, 24, 135–139. [Google Scholar] [CrossRef]
- Saura, S.; Pascual-Hortal, L. A new habitat availability index to integrate connectivity in landscape conservation planning: Comparison with existing indices and application to a case study. Landsc. Urban Plan. 2007, 83, 91–103. [Google Scholar] [CrossRef]
- Lefever, D.W. Measuring Geographic Concentration by Means of the Standard Deviational Ellipse. Am. J. Sociol. 1926, 32, 88–94. [Google Scholar] [CrossRef]
- Wong, S. The limitations of using activity space measurements for representing the mobilities of individuals with visual impairment: A mixed methods case study in the San Francisco Bay Area. J. Transp. Geogr. 2018, 66, 300–308. [Google Scholar] [CrossRef]
- Spear, S.F.; Balkenhol, N.; Fortin, M.-J.; Mcrae, B.H.; Scribner, K. Use of resistance surfaces for landscape genetic studies: Considerations for parameterization and analysis: Resistance Surfaces in Landscape Genetics. Mol. Ecol. 2010, 19, 3576–3591. [Google Scholar] [CrossRef]
- Tang, T.; Stevenson, R.J.; Grace, J.B. The importance of natural versus human factors for ecological conditions of streams and rivers. Sci. Total Environ. 2020, 704, 135268. [Google Scholar] [CrossRef]
- Xie, H.L.; He, Y.F.; Xie, X. Exploring the factors influencing ecological land change for China’s Beijing–Tianjin–Hebei Region using big data. J. Clean. Prod. 2017, 142, 677–687. [Google Scholar] [CrossRef]
- Kong, F.; Yin, H.; Nakagoshi, N.; Zong, Y. Urban green space network development for biodiversity conservation: Identification based on graph theory and gravity modeling. Landsc. Urban Plan. 2010, 95, 16–27. [Google Scholar] [CrossRef]
- Gurrutxaga, M.; Rubio, L.; Saura, S. Key connectors in protected forest area networks and the impact of highways: A transnational case study from the Cantabrian Range to the Western Alps (SW Europe). Landsc. Urban Plan. 2011, 101, 310–320. [Google Scholar] [CrossRef]
- Jin, G.; Shi, X.; He, D.; Guo, B.; Li, Z.; Shi, X. Designing a spatial pattern to rebalance the orientation of development and protection in Wuhan. J. Geogr. Sci. 2020, 30, 569–582. [Google Scholar] [CrossRef]
- Zhu, K.-W.; Chen, Y.-C.; Zhang, S.; Yang, Z.-M.; Huang, L.; Lei, B.; Li, L.; Zhou, Z.-B.; Xiong, H.-L.; Li, X.-X. Identification and prevention of agricultural non-point source pollution risk based on the minimum cumulative resistance model. Glob. Ecol. Conserv. 2020, 23, e01149. [Google Scholar] [CrossRef]
- Liu, N.; Liu, C.; Xia, Y.; Da, B. Examining the coordination between urbanization and eco-environment using coupling and spatial analyses: A case study in China. Ecol. Indic. 2018, 93, 1163–1175. [Google Scholar] [CrossRef]
- Martinho, V.J.P.D. Forest fires across Portuguese municipalities: Zones of similar incidence, interactions and benchmarks. Environ. Ecol. Stat. 2018, 25, 405–428. [Google Scholar] [CrossRef]
- Knaapen, J.P.; Scheffer, M.; Harms, B. Estimating habitat isolation in landscape planning. Landsc. Urban Plan. 1992, 23, 1–16. [Google Scholar] [CrossRef]
- Dai, L.; Liu, Y.; Luo, X. Integrating the MCR and DOI models to construct an ecological security network for the urban agglomeration around Poyang Lake, China. Sci. Total Environ. 2021, 754, 141868. [Google Scholar] [CrossRef] [PubMed]
- Cook, E.A. Urban landscape networks: An ecological planning framework. Landsc. Res. 1991, 16, 7–15. [Google Scholar] [CrossRef]
- Wanghe, K.; Guo, X.; Wang, M.; Zhuang, H.; Ahmad, S.; Khan, T.U.; Xiao, Y.; Luan, X.; Li, K. Gravity model toolbox: An automated and open-source ArcGIS tool to build and prioritize ecological corridors in urban landscapes. Glob. Ecol. Conserv. 2020, 22, e01012. [Google Scholar] [CrossRef]
- Li, F.; Ye, Y.; Song, B.; Wang, R. Evaluation of urban suitable ecological land based on the minimum cumulative resistance model: A case study from Changzhou, China. Ecol. Model. 2015, 318, 194–203. [Google Scholar] [CrossRef]
- Teng, M.; Wu, C.; Zhou, Z.; Lord, E.; Zheng, Z. Multipurpose greenway planning for changing cities: A framework integrating priorities and a least-cost path model. Landsc. Urban Plan. 2011, 103, 1–14. [Google Scholar] [CrossRef]
- Xin, X.; Liu, B.; Di, K.; Zhu, Z.; Zhao, Z.; Liu, J.; Yue, Z.; Zhang, G. Monitoring urban expansion using time series of night-time light data: A case study in Wuhan, China. Int. J. Remote Sens. 2017, 38, 6110–6128. [Google Scholar] [CrossRef]
- Tang, Y.; Gao, C.; Wu, X. Urban Ecological Corridor Network Construction: An Integration of the Least Cost Path Model and the Invest Model. ISPRS Int. J. Geo-Inf. 2020, 9, 33. [Google Scholar] [CrossRef] [Green Version]
- Sun, H.; Liu, C.; Wei, J. Identifying Key Sites of Green Infrastructure to Support Ecological Restoration in the Urban Agglomeration. Land 2021, 10, 1196. [Google Scholar] [CrossRef]
- Ostapowicz, K.; Vogt, P.; Riitters, K.H.; Kozak, J.; Estreguil, C. Impact of scale on morphological spatial pattern of forest. Landsc. Ecol. 2008, 23, 1107–1117. [Google Scholar] [CrossRef]
- Amici, V.; Battisti, C. Selecting Focal Species in Ecological Network Planning following an Expert-Based Approach: A Case Study and a Conceptual Framework. Landsc. Res. 2009, 34, 545–561. [Google Scholar] [CrossRef]
- Van Strien, M.J.; Grêt-Regamey, A. How is habitat connectivity affected by settlement and road network configurations? Results from simulating coupled habitat and human networks. Ecol. Model. 2016, 342, 186–198. [Google Scholar] [CrossRef] [Green Version]
- Boitani, L.; Falcucci, A.; Maiorano, L.; Rondinini, C. Ecological Networks as Conceptual Frameworks or Operational Tools in Conservation: Ecological Networks. Conserv. Biol. 2007, 21, 1414–1422. [Google Scholar] [CrossRef] [PubMed]
Figure 1.
Geographical location and land-use map of the study area.

Figure 2.
Research framework. (MSPA: morphological spatial pattern analysis; MCR: minimum cumulative resistance.).
Figure 2.
Research framework. (MSPA: morphological spatial pattern analysis; MCR: minimum cumulative resistance.).

Figure 3.
Construction and evaluation of ecological sources in the study area. (Note: (a) spatial distribution of landscape types; (b) ecological sources based on MSPA).
Figure 3.
Construction and evaluation of ecological sources in the study area. (Note: (a) spatial distribution of landscape types; (b) ecological sources based on MSPA).

Figure 4.
Comprehensive Ecological Resistance Surface Based on “Comprehensive Weighted Index Method”. (Note: (a) land-use classification; (b) slope; (c) night lighting; (d) comprehensive resistance surface).
Figure 4.
Comprehensive Ecological Resistance Surface Based on “Comprehensive Weighted Index Method”. (Note: (a) land-use classification; (b) slope; (c) night lighting; (d) comprehensive resistance surface).

Figure 5.
Local autocorrelation distribution of ecological resistance surface.

Figure 6.
Construction and evaluation of ecological network in the study area. (Note: (a) comprehensive minimum cumulative resistance surface; (b) potential ecological corridor).
Figure 6.
Construction and evaluation of ecological network in the study area. (Note: (a) comprehensive minimum cumulative resistance surface; (b) potential ecological corridor).


Table 1.
Landscape types and ecological significance of MSPA.
| Landscape Types | Ecological Significance |
|---|---|
| Core | As a larger habitat patch in the landscape element, the former is of great significance to protecting biodiversity and can be used as the “source” of the ecological process. |
| Bridge | The narrow and long area connecting patches in different core areas has the characteristics of an ecological corridor. Most of them are banded green belts, conducive to species migration and the connection of the domestic landscape. |
| Edge | The transition area between the edge of the core area and the peripheral nongreen landscape area can reduce the impact of the external environment and human interference. It is usually the peripheral forest belt of forest parks and large forest farms. |
| Loop | The internal channel connecting the same core area is a shortcut for material and energy exchange in the same core area. |
| Perforation | As a transition area with edge effect between core area and nongreen ecological patch. |
| Branch | The area with only one end connected to the main patch is the extension area of green space, which is the channel for species diffusion and energy exchange with the peripheral landscape. |
| Islet | In small fragmented patches that are not connected, the possibility of material and energy exchange between patches is slight, and this is mostly urban or rural small green space. |
Table 2.
Grading assignment and weight of resistance factor.
| Resistance Factor | Grading Index | Resistance Value | Weight | Division Basis | |
|---|---|---|---|---|---|
| Natural condition | Land-use type | Water body | 1 | 0.4 | Chang et al., 2015 H. Li et al., 2015 |
| Woodland | 2 | ||||
| Grassland/Wetland | 3 | ||||
| Cultivated land | 4 | ||||
| Artificial surface | 5 | ||||
| Slope (°) | <3 | 1 | 0.3 | Jin et al., 2020 Zhu et al., 2020 | |
| 3~8 | 2 | ||||
| 8~15 | 3 | ||||
| 15~25 | 4 | ||||
| >25 | 5 | ||||
| Human interference | Night light data | <15,925 | 1 | 0.3 | Natural fracture method |
| 15,925~36,303 | 2 | ||||
| 36,303~97,532 | 3 | ||||
| 97,532~408,251 | 4 | ||||
| >408,251 | 5 | ||||
Table 3.
Statistical results of MSPA classification.
| Landscape Type | Total Area (hm2) | Percentage in the Forest | Percentage in the Study Area |
|---|---|---|---|
| Core | 22,901.31 | 88.29% | 2.63% |
| Islet | 65.97 | 0.25% | 0.01% |
| Perf | 162.27 | 0.63% | 0.02% |
| Edge | 2526.57 | 9.74% | 0.29% |
| Loop | 57.87 | 0.22% | 0.01% |
| Bridge | 35.64 | 0.14% | 0.01% |
| Branch | 190.17 | 0.73% | 0.02% |
Table 4.
Importance ranking of landscape connectivity index of ecological source areas.
| Patch Number | Main Current Location | dPC |
|---|---|---|
| 1 | Yan Xihu | 10.82 |
| 2 | Yandong Lake (North Section) | 5.41 |
| 3 | East Lake Eco-tourism Scenic Area | 22.17 |
| 4 | Shimenfeng Memorial Park | 5.44 |
| 5 | Huangjiahu (North Section) | 5.23 |
| 6 | Townsend Lake (North Section) | 6.17 |
| 7 | Yangtze River (middle reaches) | 82.06 |
Table 5.
Interaction matrix between patches based on Gravity Model.
| Plaque Number | 1 | 2 | 3 | 4 | 5 | 6 | 7 |
|---|---|---|---|---|---|---|---|
| 1 | - | 54.27883 | 51.09392 | 14.03559 | 0.406291 | 0.722196 | 18.45795 |
| 2 | 54.27883 | - | 3.29616 | 17.05193 | 0.207414 | 0.234004 | 53.48612 |
| 3 | 51.09392 | 3.29616 | - | 32.59876 | 1.209842 | 3.245129 | 6.399567 |
| 4 | 14.03559 | 17.05193 | 32.59876 | - | 0.223802 | 0.437447 | 3.474232 |
| 5 | 0.406291 | 0.207414 | 1.209842 | 0.223802 | - | 30.22772 | 11.65011 |
| 6 | 0.722196 | 0.234004 | 3.245129 | 0.437447 | 30.22772 | - | 3.728914 |
| 7 | 18.45795 | 53.48612 | 6.399567 | 3.474232 | 11.65011 | 3.728914 | - |
Publisher’s Note: MDPI stays neutral with regard to jurisdictional claims in published maps and institutional affiliations. |
© 2022 by the authors. Licensee MDPI, Basel, Switzerland. This article is an open access article distributed under the terms and conditions of the Creative Commons Attribution (CC BY) license (https://creativecommons.org/licenses/by/4.0/).
Share and Cite
MDPI and ACS Style
Hu, C.; Wang, Z.; Wang, Y.; Sun, D.; Zhang, J. Combining MSPA-MCR Model to Evaluate the Ecological Network in Wuhan, China. Land 2022, 11, 213. https://0-doi-org.brum.beds.ac.uk/10.3390/land11020213
AMA Style
Hu C, Wang Z, Wang Y, Sun D, Zhang J. Combining MSPA-MCR Model to Evaluate the Ecological Network in Wuhan, China. Land. 2022; 11(2):213. https://0-doi-org.brum.beds.ac.uk/10.3390/land11020213
Chicago/Turabian StyleHu, Chunguang, Ziyi Wang, Yu Wang, Dongqi Sun, and Jingxiang Zhang. 2022. "Combining MSPA-MCR Model to Evaluate the Ecological Network in Wuhan, China" Land 11, no. 2: 213. https://0-doi-org.brum.beds.ac.uk/10.3390/land11020213
Note that from the first issue of 2016, this journal uses article numbers instead of page numbers. See further details here.