1. Introduction
The urban form is the physical configuration of elements that make up cities (land use patterns, population density and construction, infrastructure and equipment, transport and communication networks), which is the result of demographic processes, and socio-economic and politico-cultural developments over time and space. The characterization and morphological measurement of an urban environment enables a deeper investigation into its patterns and functions [
1].
The first studies that analysed the forms of urban growth were mainly developed in the United States and in the United Kingdom in the 1960s and 1970s. In these countries, suburban expansion occurred across the board in the surroundings of the cities. Among those studies, the morphogenetic methodology by Conzen [
2], the Buchanan report [
3], and the studies carried out by Berry can be identified as the most significant [
4]. These studies became more complex over time in their attempt to characterize the attributes of the expansion zones: the so-called suburban zones. Suburbanism became the dominant and preferred mode of urban existence—a dispersed growth with new problems that were answered with new proposals to modernize and redesign modern cities [
5,
6]. In the 1980s, these studies were extended to Northern Europe, with an increasingly less compact, sprawl-type of urbanization. In the 2000s, experts began to pay attention to European Mediterranean countries, where scattered patterns became evident and rapidly growing, in part due to phenomena such as the development of touristic areas [
7]. In general, the European studies have focused on quantifying expansion at a city–region scale, or by comparing expansion in cities across Europe [
8,
9]. Urban environmental studies have become more sophisticated with the introduction of new techniques of spatial and statistical analysis, as observed in the studies by Abrantes et al. [
10] at an urban scale, or in those by Weston [
11] or Xu et al. [
12] at an intra-urban scale. As a consequence of these new forms of urban growth, the classification of urban landscape units must be adjusted to their increased complexity.
In general, from a methodological perspective, nowadays, three types of approaches are identified for the quantitative delimitation of the urban units, as collected by Abrantes et al. [
10]:
A classical demographic and econometric perspective based on the bivariate and multivariate analysis of statistical indicators, where the commonly used indicators are the population variation, the transport costs, the changes in the employment and in the income distribution in the city [
13], and the population density gradient [
14].
A stricter, morphological perspective based on Geographic Information Systems (GIS) and remote sensing, which has been rising, especially since the 1990s with the spread of GIS. Remote sensing is used to map urban variables and types of land use from which the degree of construction and other socio-economic parameters can be obtained [
15,
16]. Some studies have been based on the use of remote sensing together with spatial metrics [
17,
18,
19], i.e., quantitative indices that characterize the geometry of landscape units (e.g., constructive density of an urban environment) and their spatial relationships [
15], or considering the components of the geospatial metrics, with indicators of centrality, shape and linearity, evaluating the types of urban spatial growth according to whether they are edge expansion, infill or leapfrog [
20], establishing them as a priority for urban planning. Apart from these scientific studies, the European Urban Atlas project must be considered. The information provided by the Atlas is based on the processing of data obtained from remote sensing and open access resources such as Open Street Map. The result is a land use map with a greater accuracy than the conventional Corine Land Cover.
A multidimensional perspective that links spatial metrics to analyse patterns and configurations in association with classical statistical indicators [
21,
22]
This methodological heterogeneity not only translates into the influence of the selected metric according to particular urban conditions and the spatial scale of the scope of analysis, but also conditions the objective of the analysis [
22].
One of the variables that can provide more direct and indirect information about the quality of life in urbanized spaces is the presence or absence of vegetation cover [
23]. In recent years, there have been numerous studies that have used urban morphologies, including green spaces, as an indicator of the environmental quality of the city [
24,
25,
26] or that, directly, have based the classification of urban forms on the extent and density of their vegetation cover [
27].
The study provides new perspectives and scales of analysis. It includes areas covered by vegetation, differentiated by its size (trees and shrubs). Unlike other procedures [
10], the methodology allows using a local scale with a level of detail that enables us to distinguish urban types per block. Whereas some authors analyse urban areas from a pedestrian perspective [
28], the proposed methodology also includes zones in private properties that may not be observed from the street. Additionally, it may be considered that the analysis of the results following abstract territorial approaches [
10] may hinder the landscape perspective of the results, so the procedure proposes a photointerpretation approach by using orthoimages. Further limitations based on the use of several variables that are not easily accessible or do not reach the desired scale of format are also observed in areas such as Portugal [
10].
As a land surface analysis tool, satellite remote sensing provides a synoptic view of large areas, thus, offering the opportunity to monitor the spatial-temporal dynamics of the vegetation cover efficiently, as other Land Cover classification (LULC) [
28]. In this regard, the spatial resolution of common photogrammetric products for the whole territory of Spain, offered by the Spanish National Plan of Aerial Orthophotography, also allows a classification of objects as elements of their corresponding landscape unit, such as trees and other plants. As Myint et al. [
29] p. 1146 point out, the spatial resolution of the images "must be at least half the diameter of the smallest object".
The recent implementation of GIS explains that some territorial aspects are still under-explored, easing the development of more precise methodological tools suitable to be implemented in urban and territorial management. This is the case regarding the estimation of urban landscape units, especially in suburban-areas. The improvement of the current lack of a proper delimitation of the vegetation cover, which enables characterizing urban zones according to the surrounding private recreation areas (e.g., golf courses, private gardens, parks, etc.), would allow distinguishing an urban model of suburban zones. The methodology would be useful to develop urban green plans as well as to implement a zonal urban management (e.g., urban ecology, resources for gardens in each neighbourhood, etc).
In this context, the main objective of the present study is (a) to add the vegetation cover to the quantitative methods (multivariate analysis) to classify urban landscape types. In addition, the secondary objectives are (b) to draw up a classification of the urban units in the three study areas at an intra-urban scale, using landscape variables and, (c) to design a methodology that can be extrapolated to other urban spaces of a similar scale, especially in Mediterranean coastal urban areas.
2. Materials and Methods
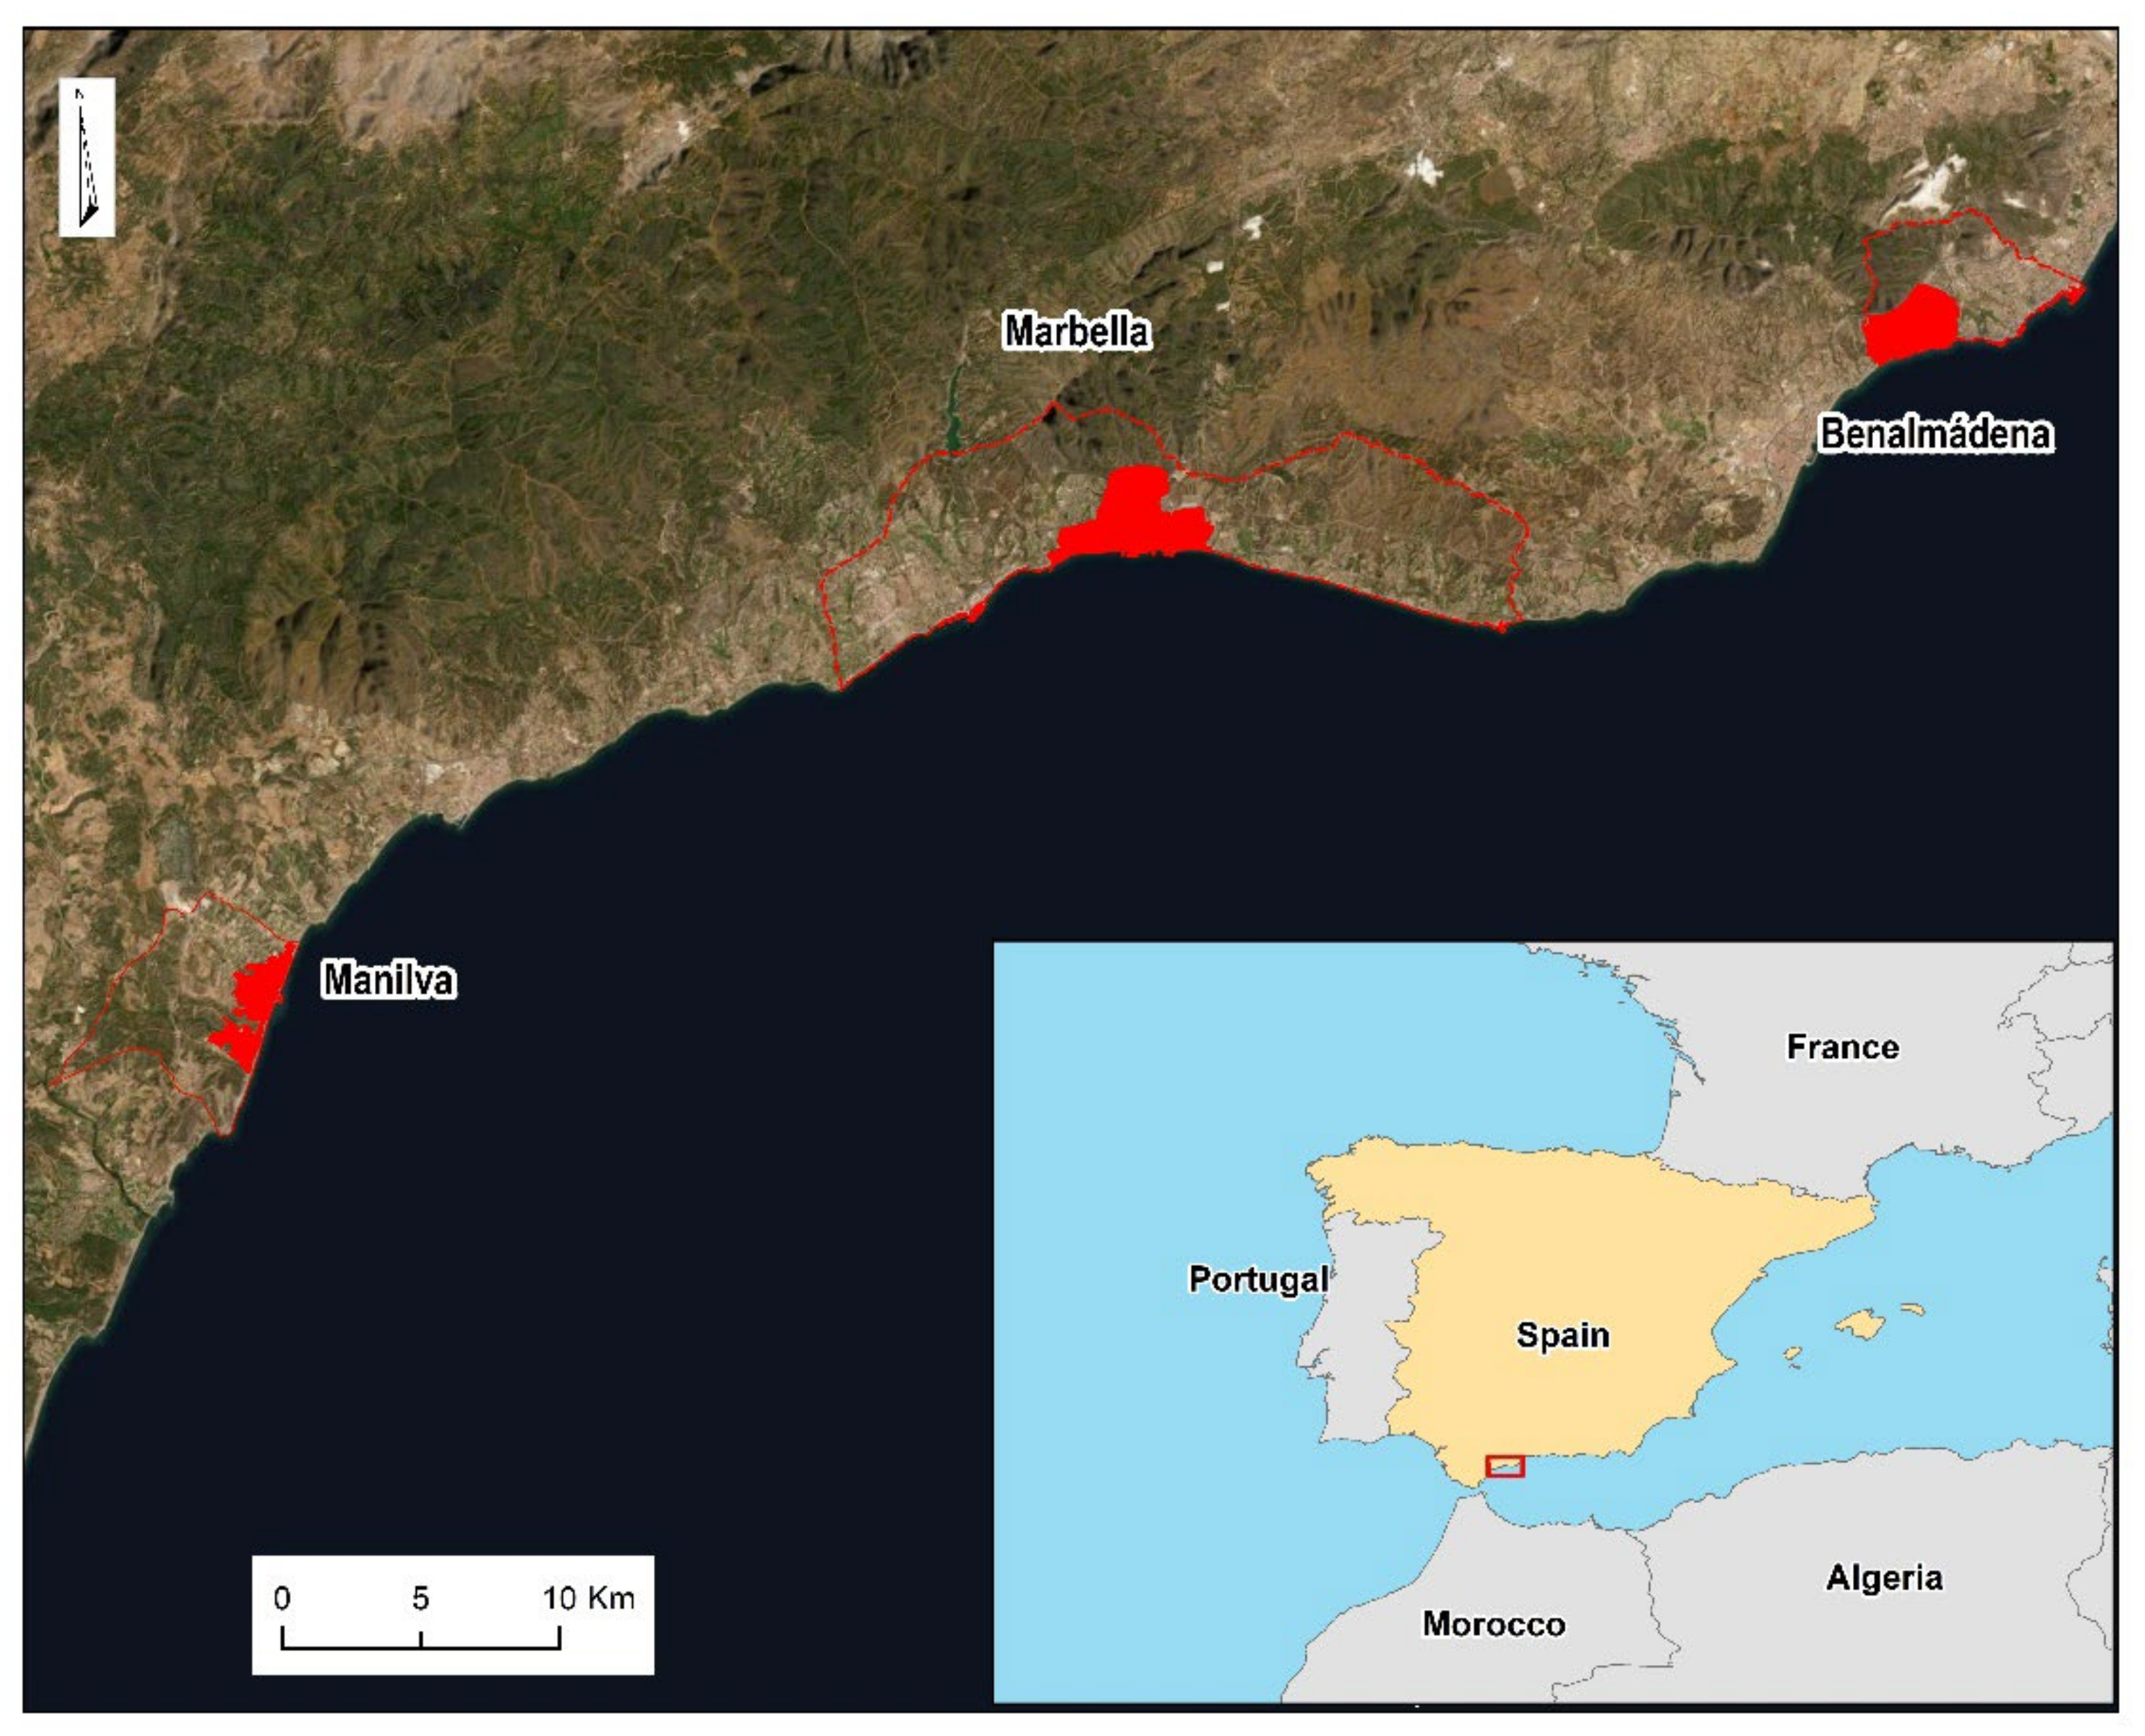
2.1. Study Area
The study area is made up of Benalmádena, Marbella and Manilva, three coastal Mediterranean municipalities in western Costa del Sol, in the province of Málaga, in southern Spain (see
Figure 1).
Until the 1950s, this coastal zone was a rural area, based on a traditional agricultural and fishing production model. In the middle of the 20th century, from the first appearance of high-level hotels, the implementation of a productive model focused on tourism and construction began. It was promoted by businessmen linked to the Franco dictatorship, who played a leading role in the tourism business and Costa del Sol politics [
30]. The area had great tourist potential supported by the coast, based on the existence of an attractive landscape, with forests, trees and plants, a very comfortable climate and the near international airport of Malaga [
31]. This change in its economic model broke with the traditional configuration of the area and was linked to an urban development process marked by rapid urban growth that led to a real estate boom, often associated with episodes of political-business corruption [
32]. The expansion of tourism was associated with the hypertrophic and uncontrolled urban development of the pre-existing core [
33], which has hardly taken into account the conservation or creation of green areas within the cities.
Nowadays, the municipalities of this coastal area form a conurbation, as the result of the intense urban development experienced during the last half of the century. Among them, Marbella, despite having a production model similar to the municipalities around, has its own brand that keeps it on the market as a luxury tourist destination. This is due, on the one hand, to the legacy that still remains of the glamour of the first luxury hotels, followed by the construction, in the 1970s, of Puerto Banús, a high-quality marina that would become one of the main local tourist landmarks. On the other hand, its tourist image was enhanced by the election of a distinctive model of lesser building density, with the introduction of landscape resources for the real estate business, such as the numerous golf courses [
34]. Regarding Benalmádena, its urban model is considerably denser, although not compact, as it was urbanized in patches. It had its greatest expansion in the 1970–1980s, with the urbanization of its coastline for tourist development, directly related to the beach, although in recent decades it has incorporated powerful urban and suburban development linked to its proximity to Málaga. Finally, Manilva, on the western edge of the region, keeps a more rural character, although many plots have lost their agricultural function and are expected to become urban land. It has experienced a recent urban growth, between the 1990s and the present, preserving an important agricultural sector (vineyards), which is a singularity in this spatial context.
2.2. Selection of the Variables to be Analysed
The variables selected for the classification of urban units were the following: (1) the average height of the buildings, (2) the constructive density, defined as the relationship between the plot and the built area, (3) the road density, defined as road length per km2 with a weighted assessment of the track hierarchy, (4) the presence of tree and high shrub cover (high cover), and (5) the low shrub and herbaceous cover (low cover), both of them defined in percentage cell area. The main criterion applied for the choice of the variables, with the exception of the variables related to vegetation, is the open access to the data. In the case of vegetation, it has been decided to establish two variables with the objective of being able to differentiate parks and forests, with a higher biomass index and a greater capacity to cast shadow, and gardens and other green areas, where species of low size and without capacity to cast shadows predominate. For the road density variable, a three-level hierarchy was designed: highways and freeways were considered to be at the highest level, as they are roads that cannot be used by pedestrians and are the largest; at the second level are avenues and boulevards, streets with two-way roads and greater width; finally, the rest of the roads open to vehicular traffic and those that are purely pedestrian.
These variables have been empirically analysed by remote sensing.
Table 1 shows a summary of the variables used and their units of measurement.
2.3. Assessment of the Presence of Vegetation Cover
Three alternatives were considered to process information on vegetation cover. First, we analysed the open-access information from satellites such as Sentinel-2ª, Spot-4 and similar data sources [
35], which were discarded for having a resolution of 10 meters, which is insufficient to detect numerous components of the urban ecosystem such as private gardens or rows of trees on some roads. Second, the digital aerial orthophotography of the Spanish National Plan for Aerial Orthophotography (PNOA) was considered, with a resolution of 0.5 meters. In this case, the problems were the limitations of the Red, Green and Blue (RGB) spectrum, where surfaces of different characteristics (vegetable, urban, aquatic) can share colour scheme. One of the more problematic factors were the shadows, which altered the identification of vegetation surrounded by other larger volumes. The third option was based on the supervised classification of LiDAR information [
36] of the PNOA project, with a point density of 0.5 points/m² in the first coverage and 0.5-4 points/m² in the second coverage, although the information is then exposed with a pixel resolution of 3-3.5 m on the side. In this case, the main drawback stemmed from the introduction of non-vegetative cover in the Digital Vegetation Model, since it introduced artificial elements with a similar volumetric character. Finally, the fourth option was to develop a mixed methodology of orthophotography area corrected with LiDAR [
37], which was estimated, after a test, inefficient by the increase in the procedure time.
Among all these sources, the second option was then chosen, using the most recent PNOA orthophoto for its highest resolution. Once the basis of the remote sensing analysis had been chosen, it remained to be determined whether to carry out an unsupervised classification, where the operational program is automatically allowed to estimate the number of classes and their limits, or a supervised procedure, with the previous categorization of pixels, first creating a layer of dots with a vegetation value in ArcGIS 10.3. In this second case, each point or series of points received the corresponding class based on human interpretation. After comparing both methods, we opted for the supervised classification. It must be added the consideration of the minimum unit of analysis, which in this case is the pixel. The traditional LULC classification, which assigns each pixel to a single type of soil cover (LULC), assumes that the spatial extent of the LULC components must be greater than the pixel size. In this case, a LULC type is represented by a group of pixels. As Song [
38] points out, the assumption that each pixel is composed of a single type of LULC was not valid for most remote sensing data due to the complexity of the urban landscape structure. Spectral mixing analysis (SMA), devised by Adams and Adams [
39], has often been used to derive vegetation information within a pixel, at a subpixel scale, from remote sensing images in urban areas. However, the increased resolution of spectral images has ceased to be a problem to represent elements of greater detail, to the point that if they are not represented separately. This is because they are of an invaluable scale, with a negligible impact for vegetation cover studies. In this methodology, the density of the vegetation cover is assessed based on its horizontal extension.
Finally, due to the limitations of the RGB colour spectrum, some pixels share codes but represent surfaces other than the vegetation cover. Through specific photointerpretation works, the imperfections of the model were corrected, mainly shadows and some anthropic elements, such as some paved sections and, exceptionally, roofs or inland water bodies.
2.4. Preparation of the Dataset
Apart from the two vegetation variables, in the case of the rest of the variables, the raw information was available, so some numerical calculations and processes had to be performed prior to their analysis. For example, for the variable average construction height, the information offered by the Spanish Cadastre on the maximum height of the construction units was decoded in order to convert the information on the number of floors into numerical, in meters above ground. From this variable, the constructive density variable was calculated, multiplying the maximum height by the surface of the footprint of the building unit itself (volumetry) and dividing the result by the surface of the plot.
With regard to the variable road density, a hierarchical classification of the road network was carried out. Greater weight was given to wider roads with more traffic, which act as a perceptive limit for the pedestrian, unlike the roads for pedestrians, as streets and avenues [
40]. Subsequently, the ArcGIS 10.3 Line Density tool was applied, and the resulting information was transformed into a vector format
2.5. Grouping and Standardization of the Information
In order to enter the information in the black box of variables, areas have been calculated, both of the joint vegetation cover and of the high cover and low cover separately. To do so, the following steps have been taken:
- 1.
Creation of the grid: a 1 ha cell size has been considered, which allows obtaining an equivalent view of the surrounding area perceived by the potential observers. It was developed with the ArcGIS 10.3 Create Fishnet tool. The new layer forms a rectangular grid over the reference layer (study area boundaries).
- 2.
The surface of vegetation cover is calculated in the grid, and the layer is joined with the information of the five variables, using the Spatial Join tool in ArcGIS 10.3.
2.6. Multivariate Analysis
Once the table had been obtained with the information of all the variables for each grid cell, a multivariate analysis of the data was performed. The objective was to create a series of clusters that bring together cells with similar characteristics to spatially distinguish different construction types. To do this, a grid with 2479 cells with information of the five variables was used, from which 1201 cells belong to Marbella, 668 to Benalmádena and 610 to Manilva. For the cluster analysis, the validation of the starting data and its graphical representation the clusterSim (data normalization), ggpubr (number of clusters), factoextra (cluster validation), cluster tend (cluster validation) and cluster libraries (graphical representation) of the R code [
41] were employed in RStudio.
First, the ordinal data for all the variables were standardized between 0 and 1 following Equation.
where
x normalized is the value of the variable normalized between 0 and 1,
min (x) is the minimum value of the variable, and
max (x) is the maximum value of the variable.
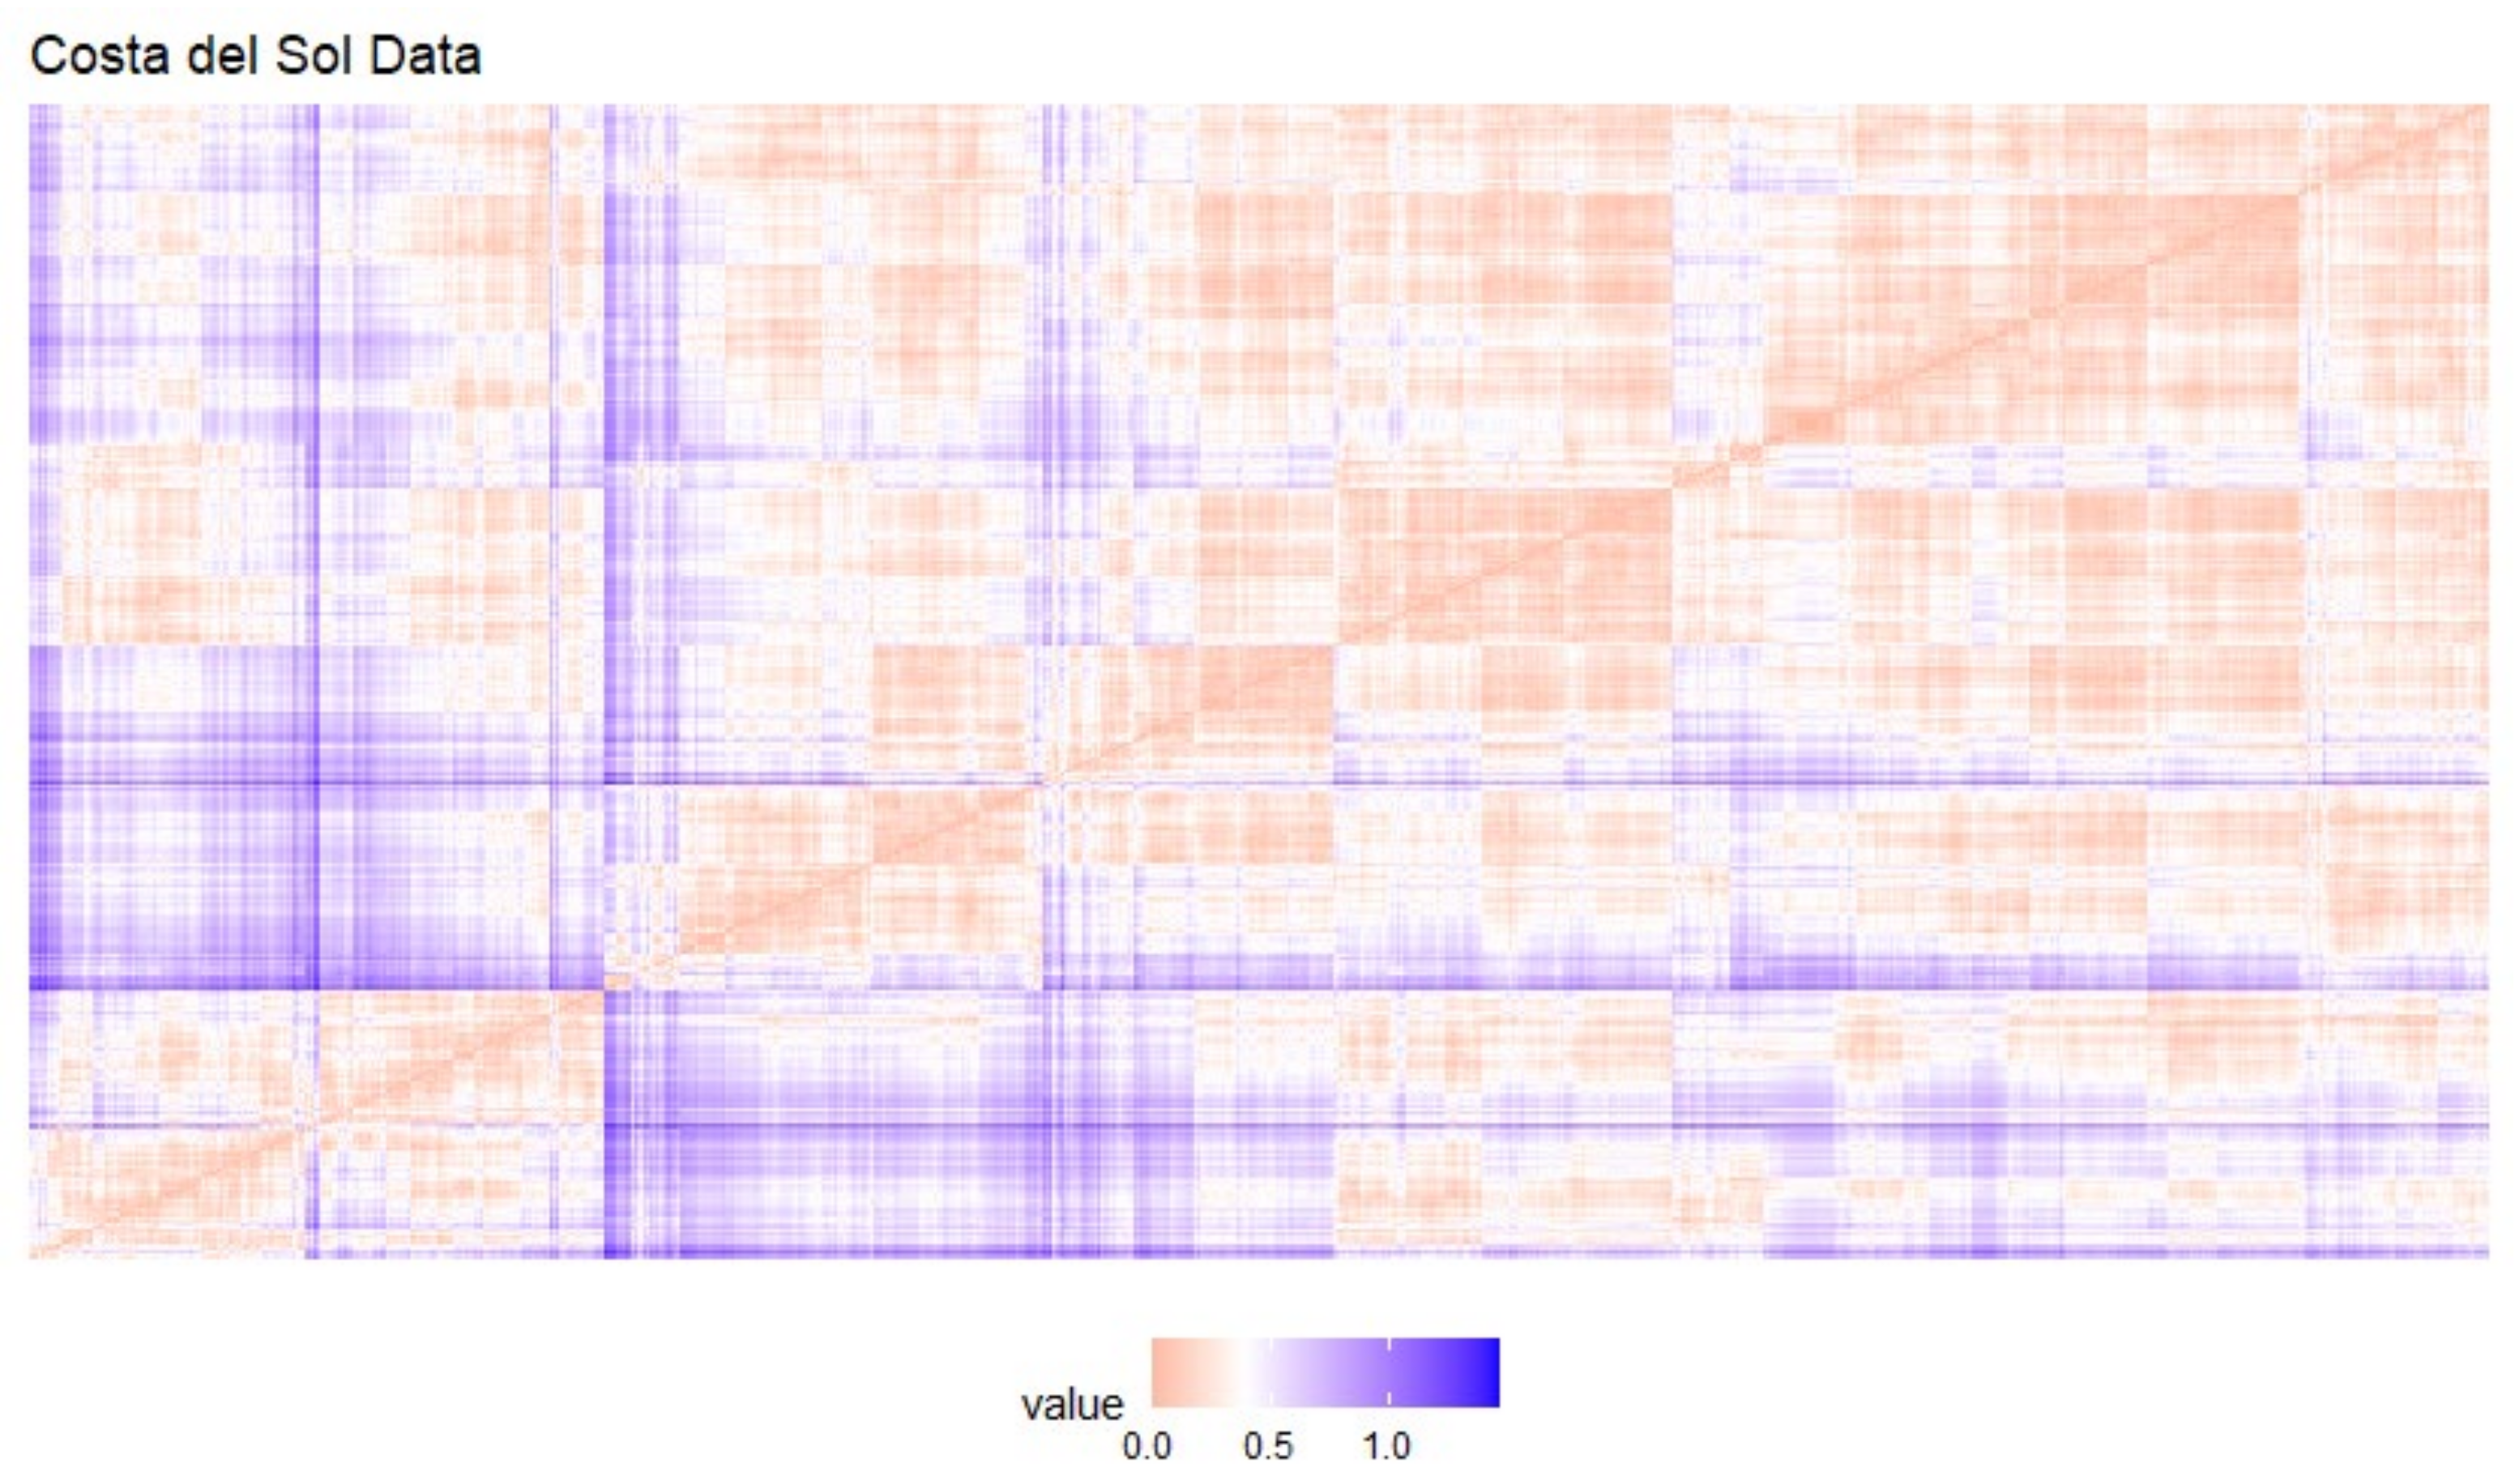
Once the data had been standardized, it was assessed whether the data showed signs of grouping through the Visual Assessment of Cluster Tendency (
Figure 2) and the Hopkins index (H = 0.05), which measures the clustering trend of a data set from the calculation of the probability that those data are uniform. In this way, values close to 0 show that there are groups within the data, so it was considered appropriate to perform a cluster analysis, whereas values close to 0.5 show that data are uniformly distributed, so clustering is not observed
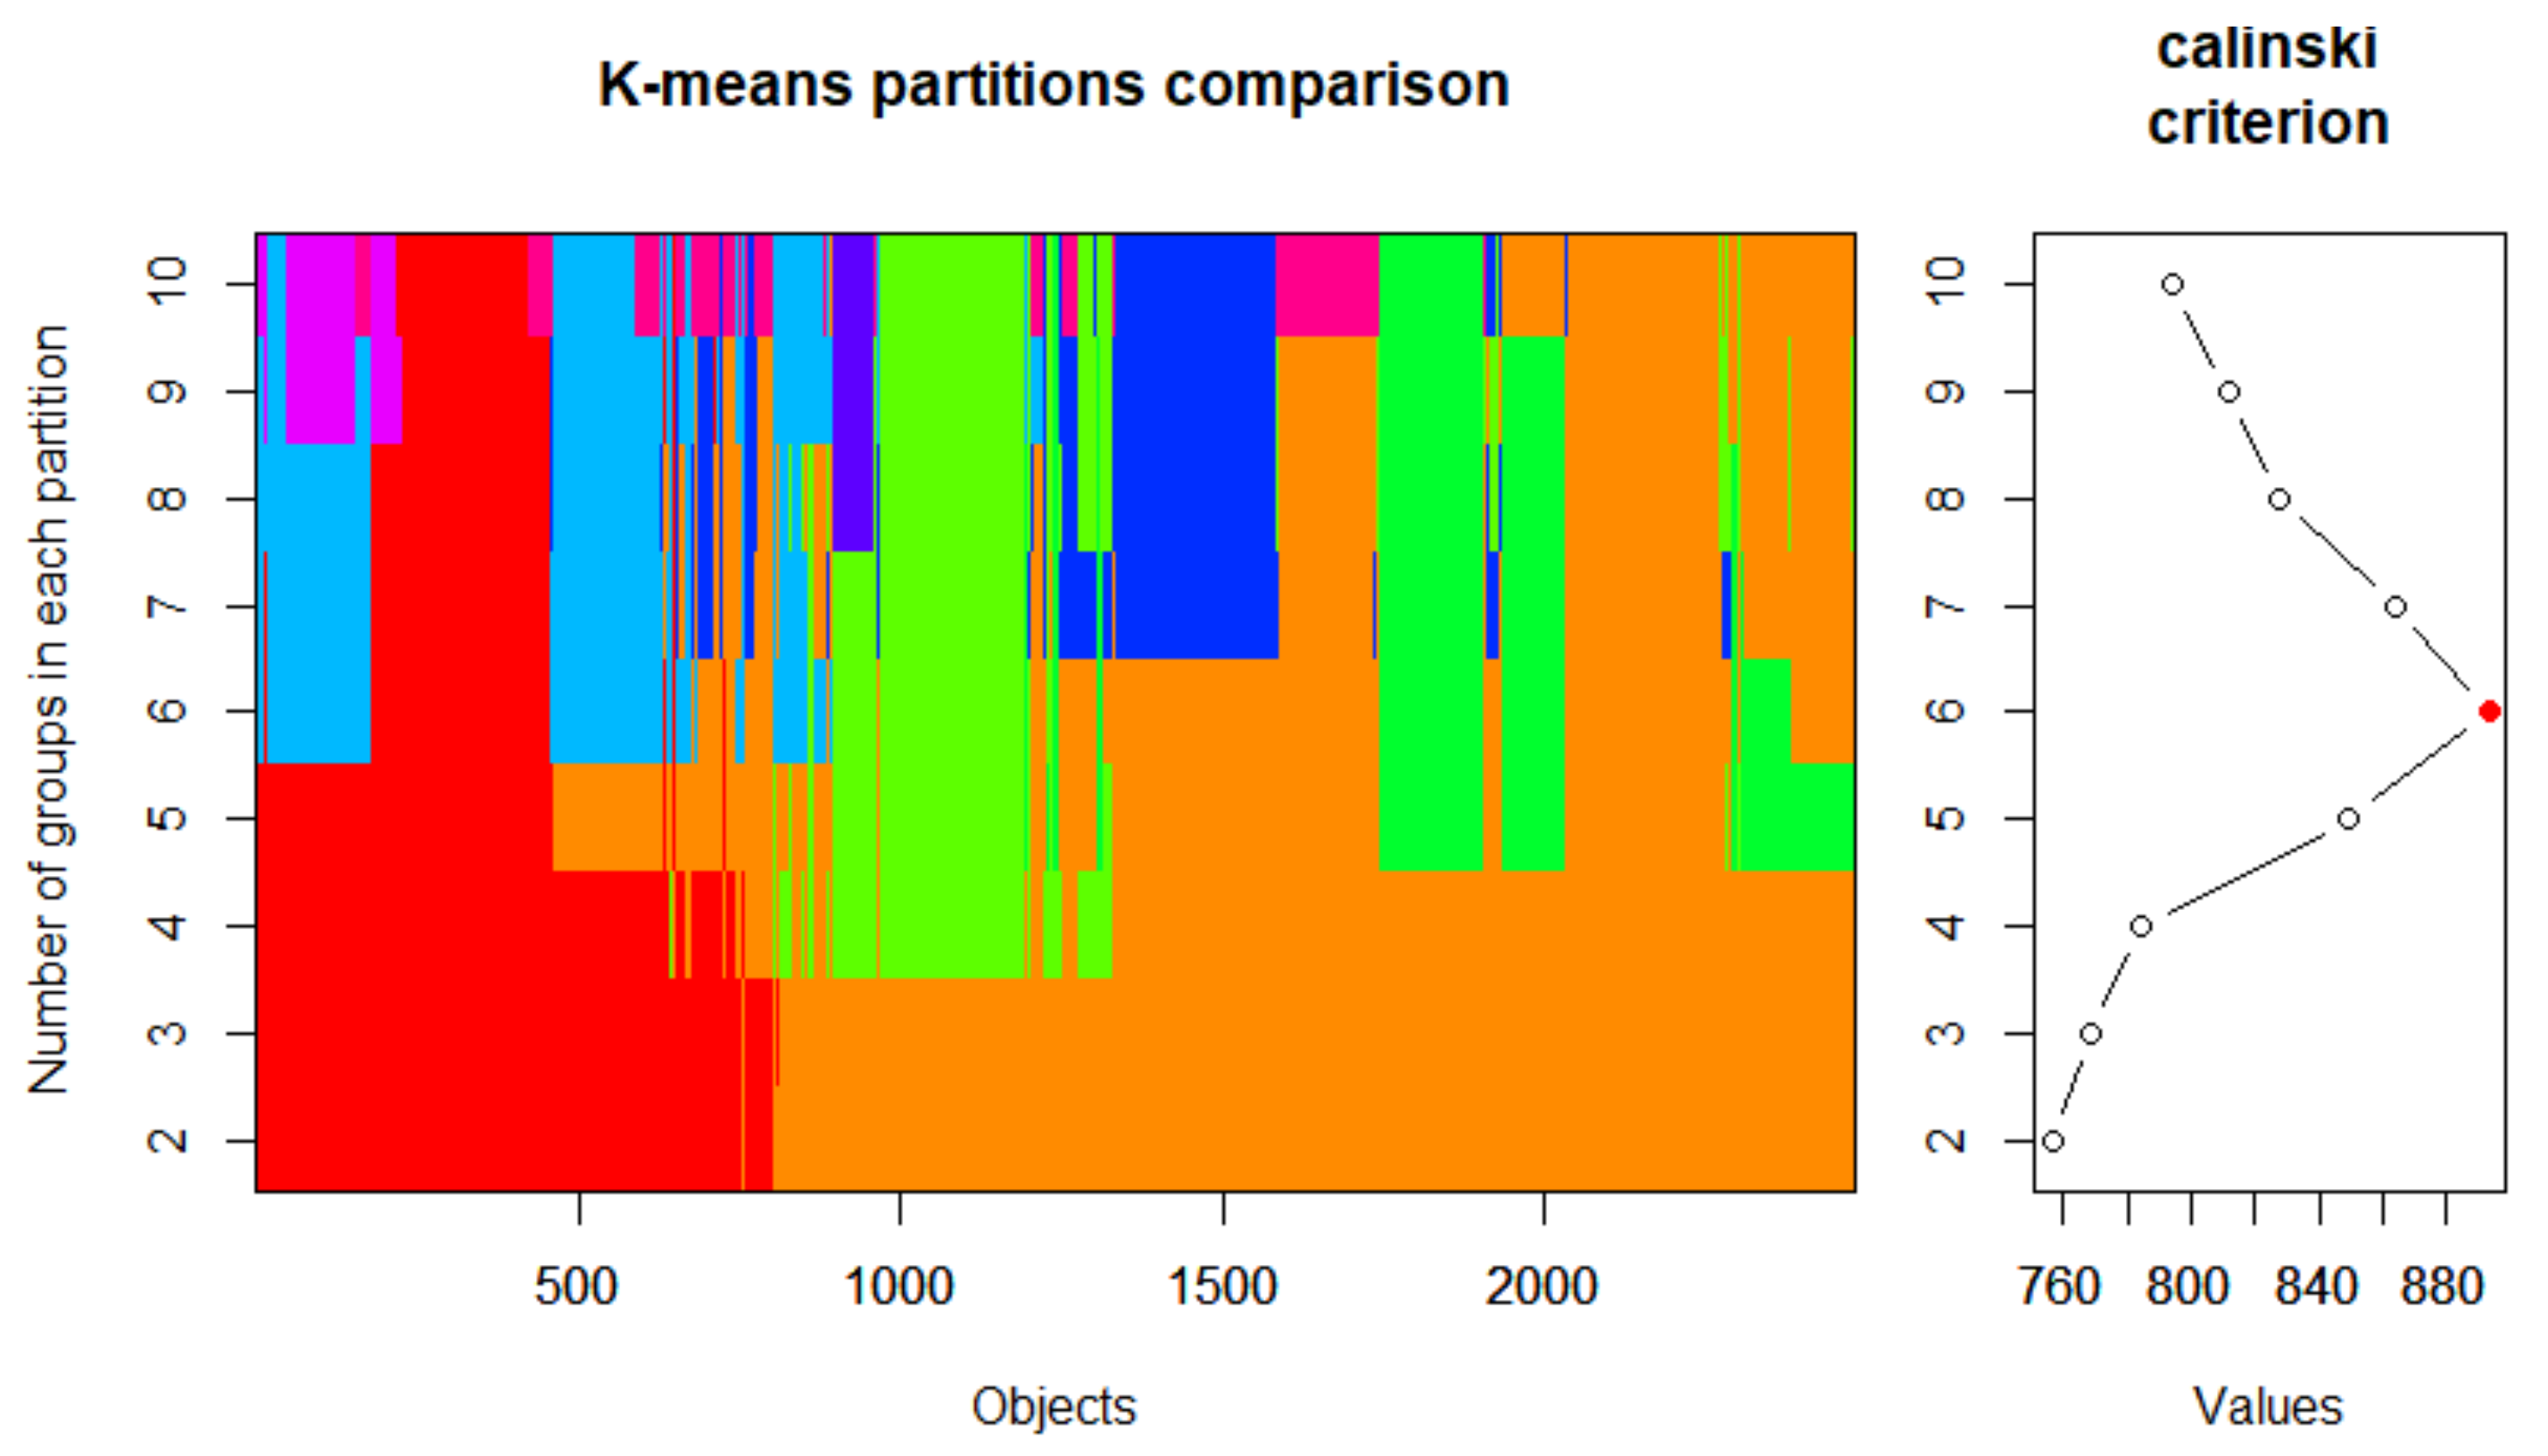
For Cluster analysis, the K-Means method [
42], which is widely used in this type of analysis, was selected. In this method, the number of clusters in which the data should be classified is previously determined by the analyst, so that the sum of the internal variance of the clusters (intra-cluster variation) is as small as possible. The optimal selection of the number of clusters was based on the Calinski–Harabasz [
43] method, which distinguished six groups (
Figure 3). The criterion is a measure of how similar an observation is to its own cluster (cohesion) compared to other clusters (separation), and it is a common approach for diagnosing how many clusters suit the data.
Then, the operation was repeated using the same number of classes, but excluding both vegetation variables, to be able to observe the statistical and spatial differences they imply and the quantitative improvement they can bring to the territorial analysis.
2.7. Spatial and Statistical Assessment of the Results
This phase consists of a double verification process of the cluster classification. First, the results obtained in the cluster analysis were mapped, being verified by photointerpretation that the clusters created by the algorithm fit the reality in all the study areas. Subsequently, its statistical reliability was checked to be replicated in other similar territories by means of the silhouette plot and the Dunn Index in Rstudio.
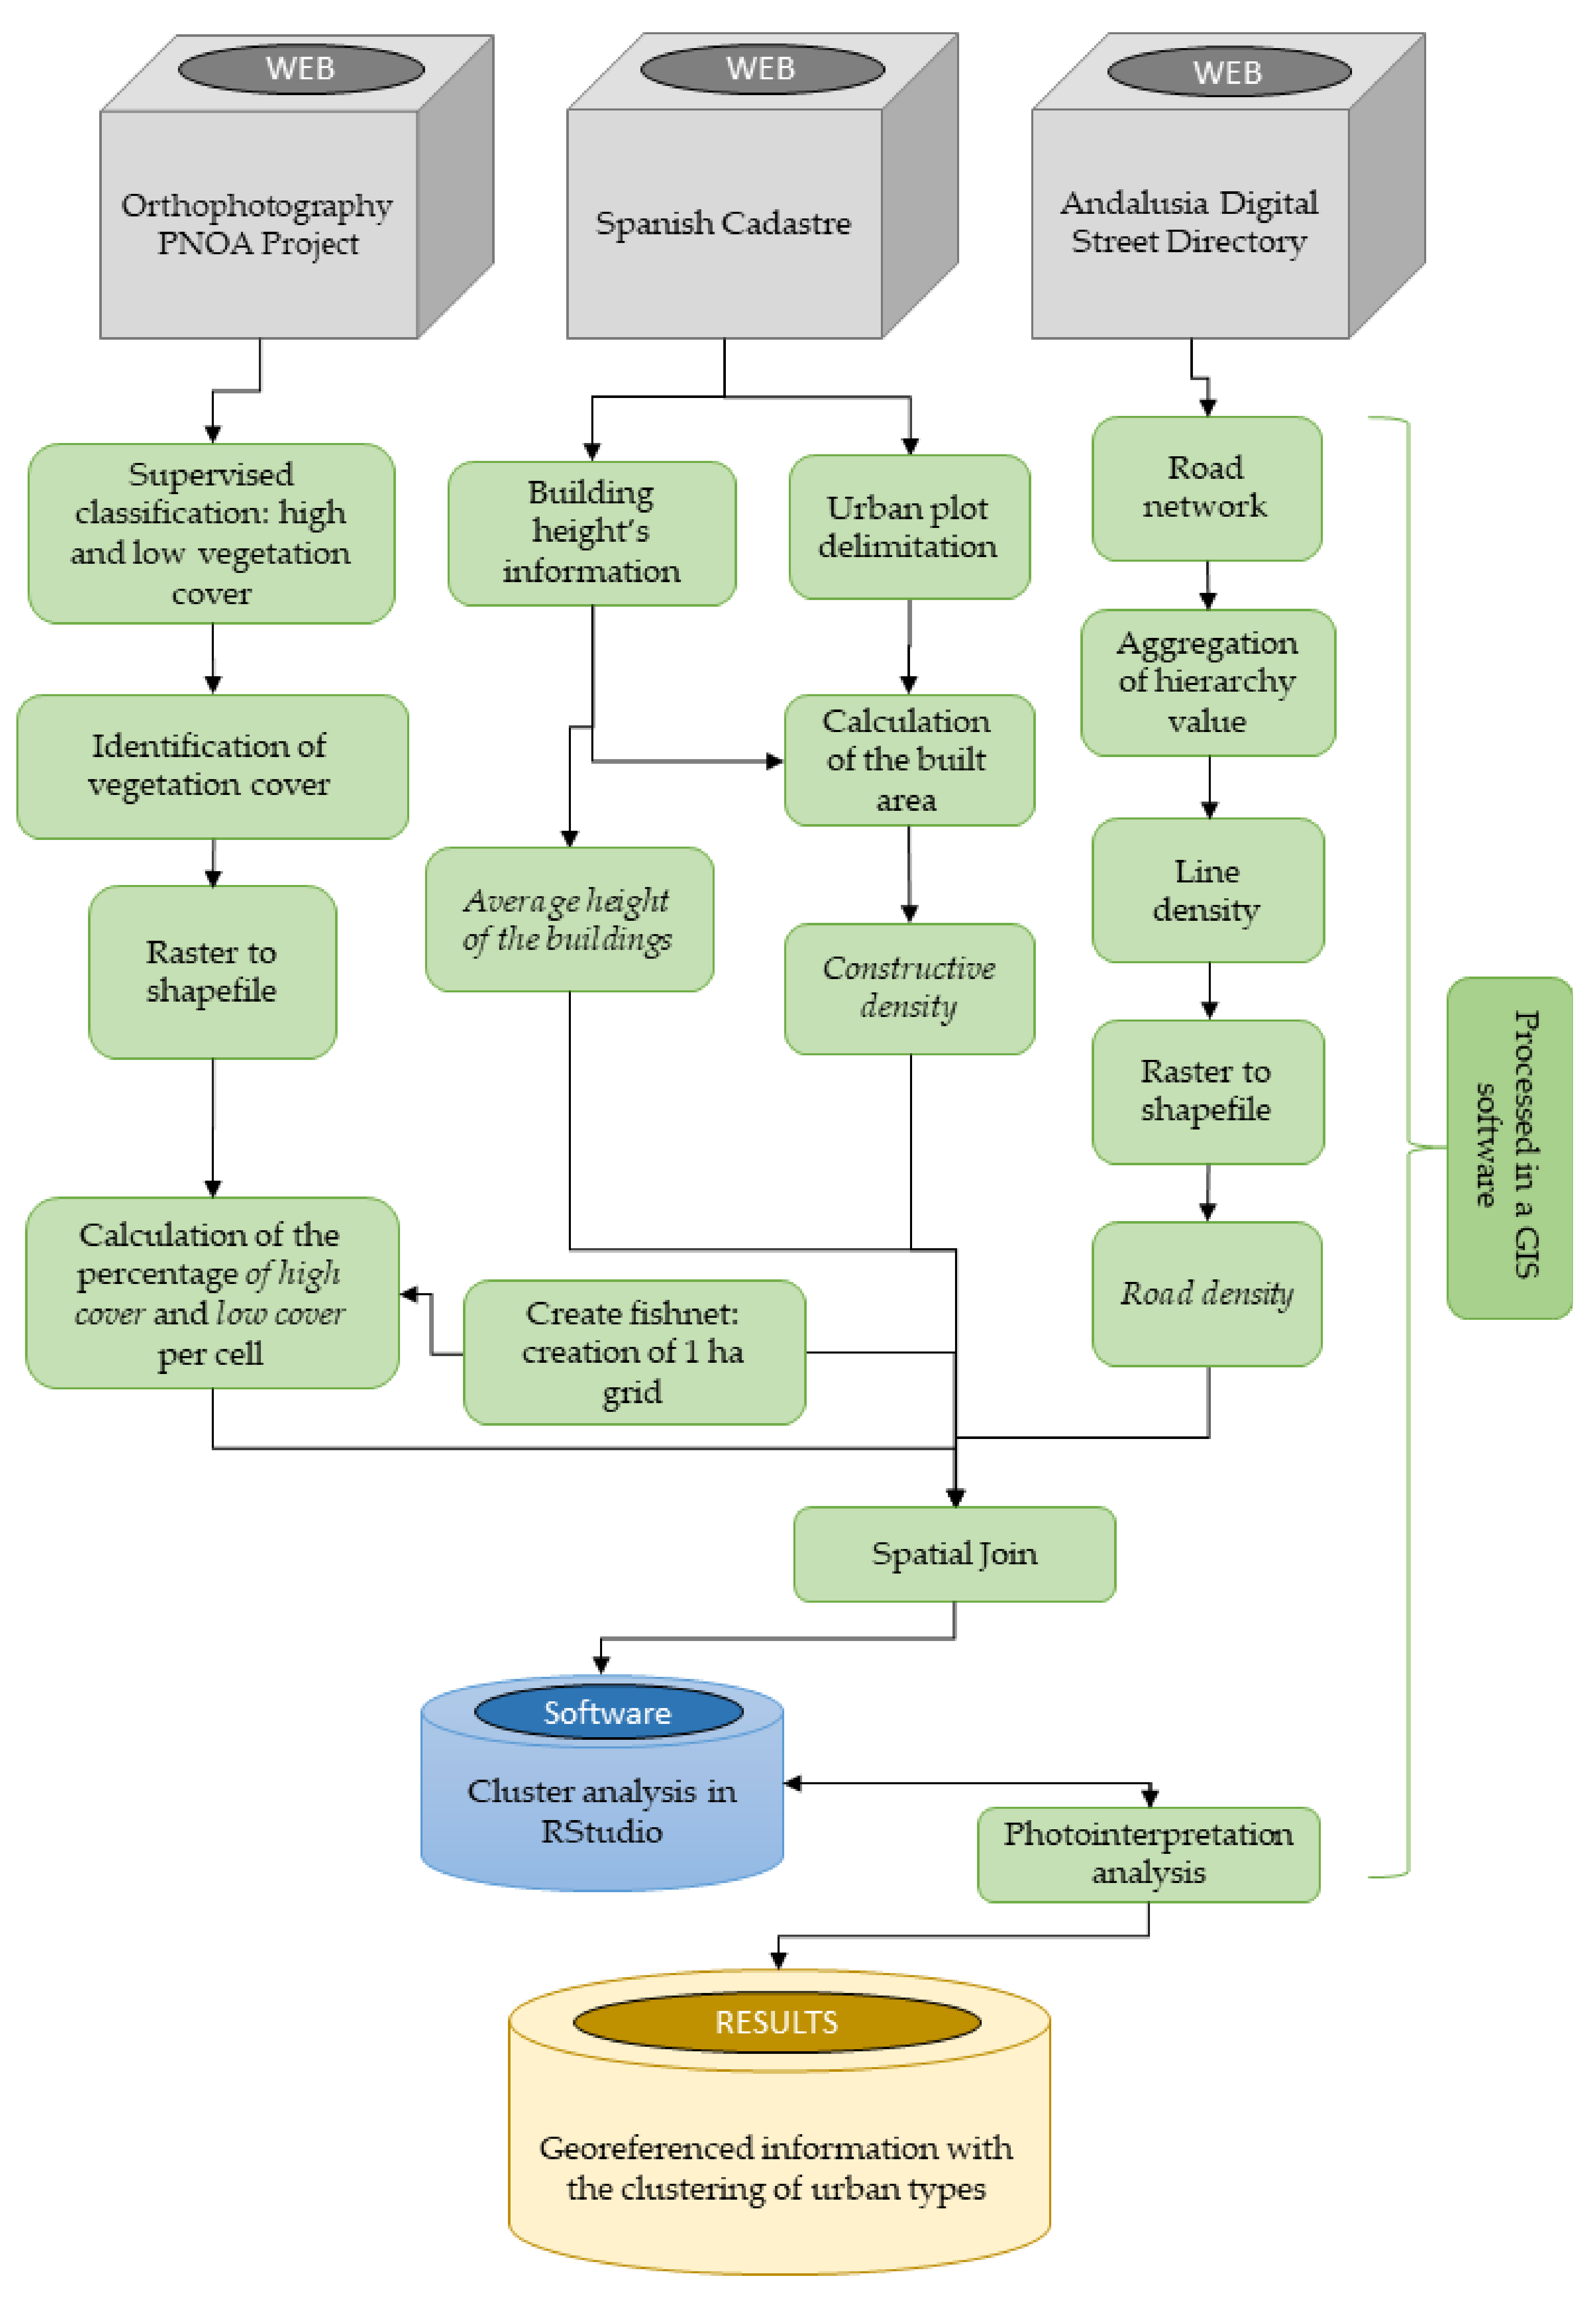
In a synthetic way, the designed methodology is clarified in
Figure 4:
3. Results
First, the results obtained from the analysis of the vegetation cover are shown, indicating the ability to distinguish between high cover and lower cover. Subsequently, the results generated with the complete methodological procedure were analysed, including the contribution of high and low cover, estimated by remote sensing to the delimitation of urban landscape units. The statistical robustness of the method was evaluated and, subsequently, the characteristic features of the created clusters were analysed. To conclude, in order to be able to estimate the influence of the vegetation variables, the results are compared with those generated in a multivariate analysis focused on the most urban and construction variables, without including those vegetation variables.
3.1. Analysis of the Vegetation Cover
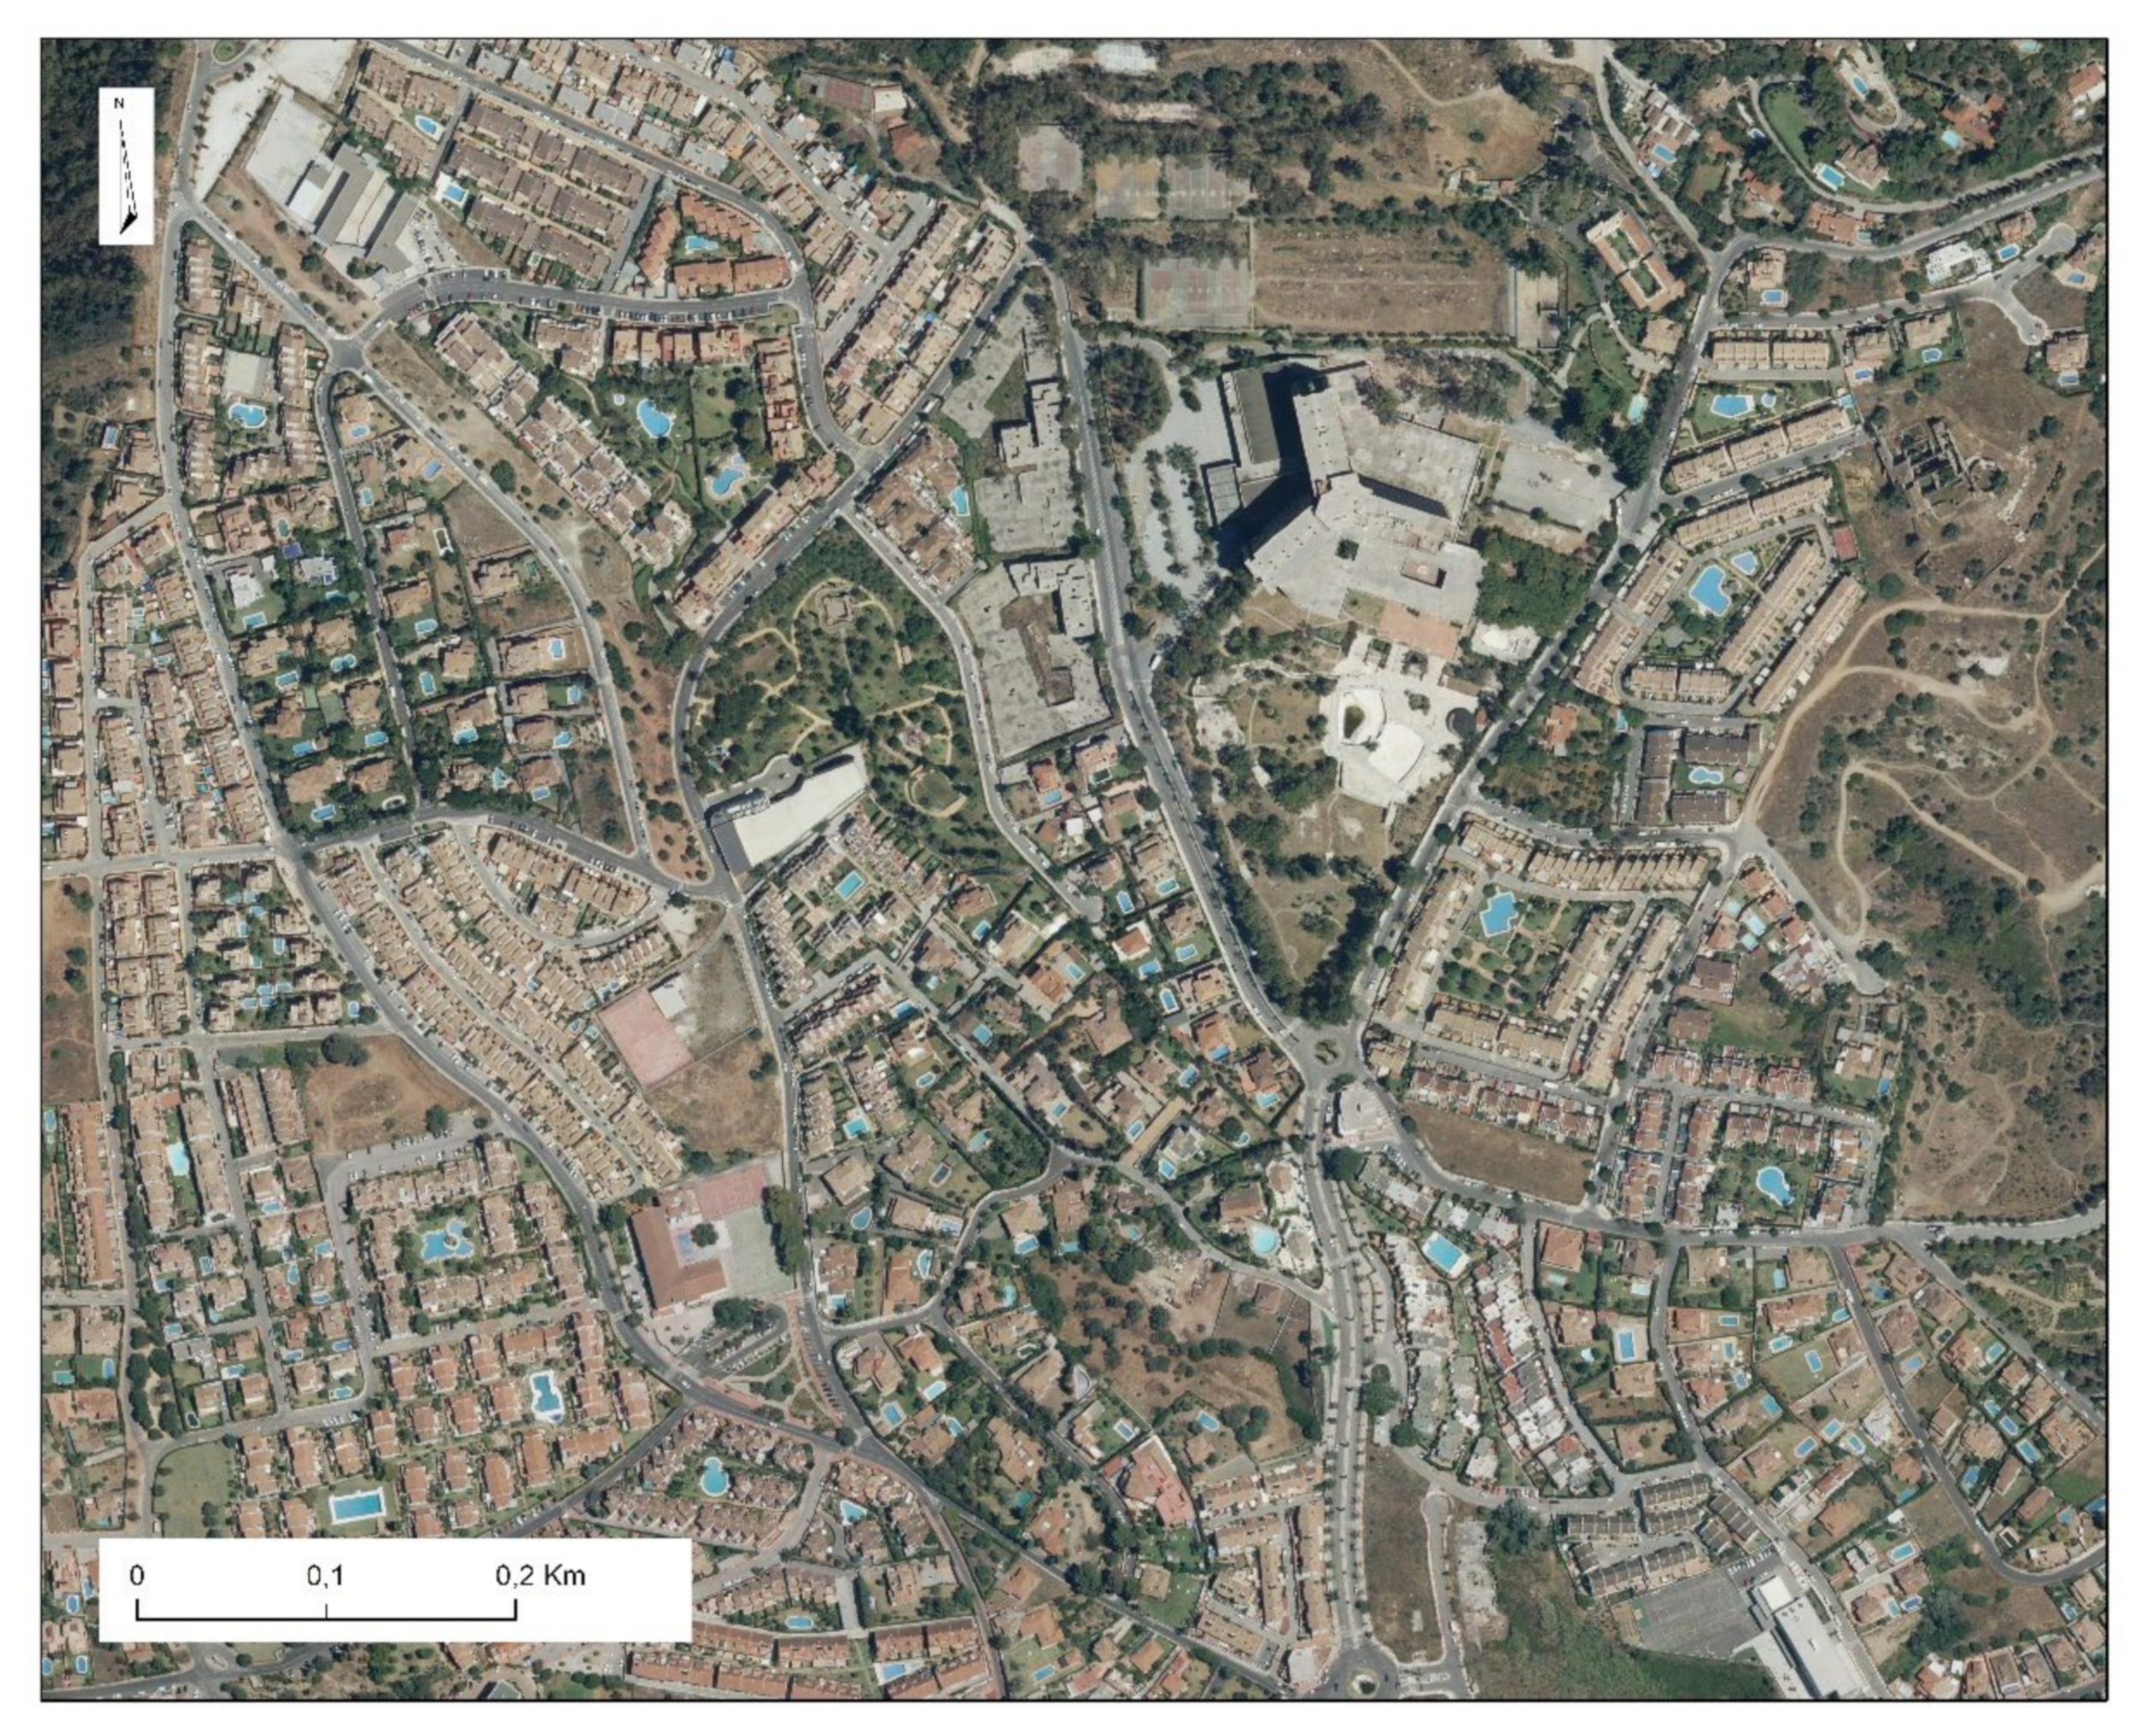
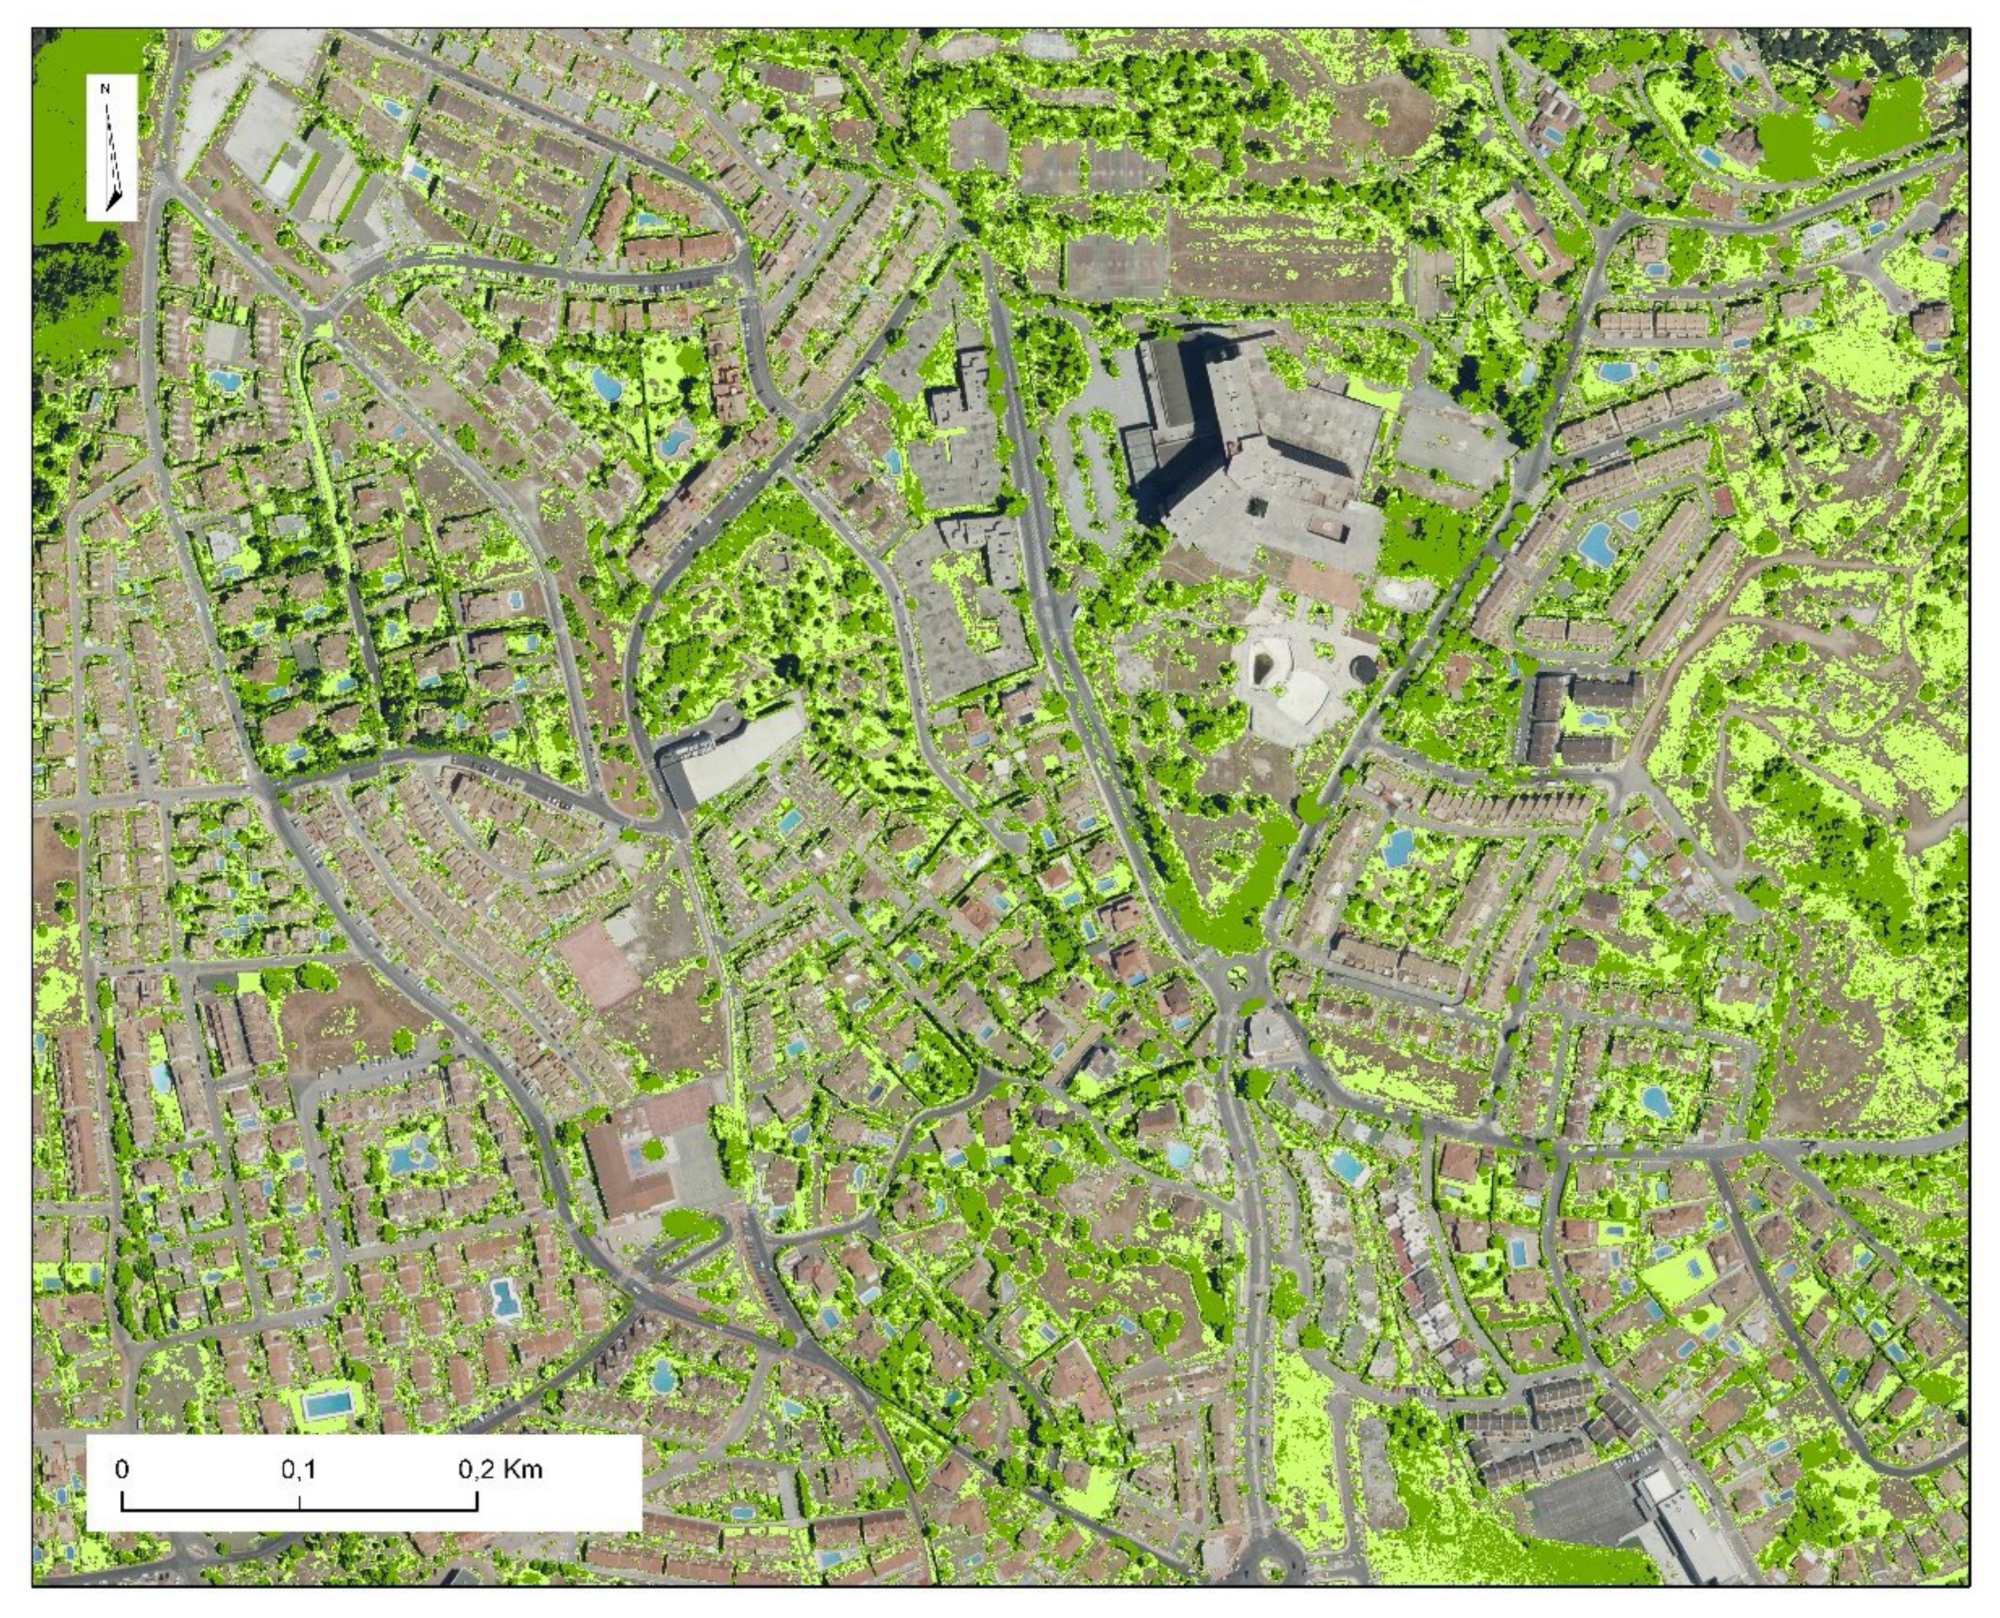
The detection of the vegetation cover by measuring orthophotographs provides very satisfactory results after a photo-interpretation process (
Figure 5). The image resolution allows to delimit both urban parks and smaller private gardens. In addition, the discrimination between arboreal and herbaceous vegetation facilitates the identification of different types of green spaces, since a meadow does not have the same landscape and ecological features as a leafy park with high trees.
At the current scale, this information allows to characterize the different types of private spaces in suburban areas of horizontal urbanism, mainly composed of sports courts, swimming pools and gardens. which can help to classify urban types both in a qualitative or quantitative research.
3.2. Statistical Validity and Cluster Characterisation
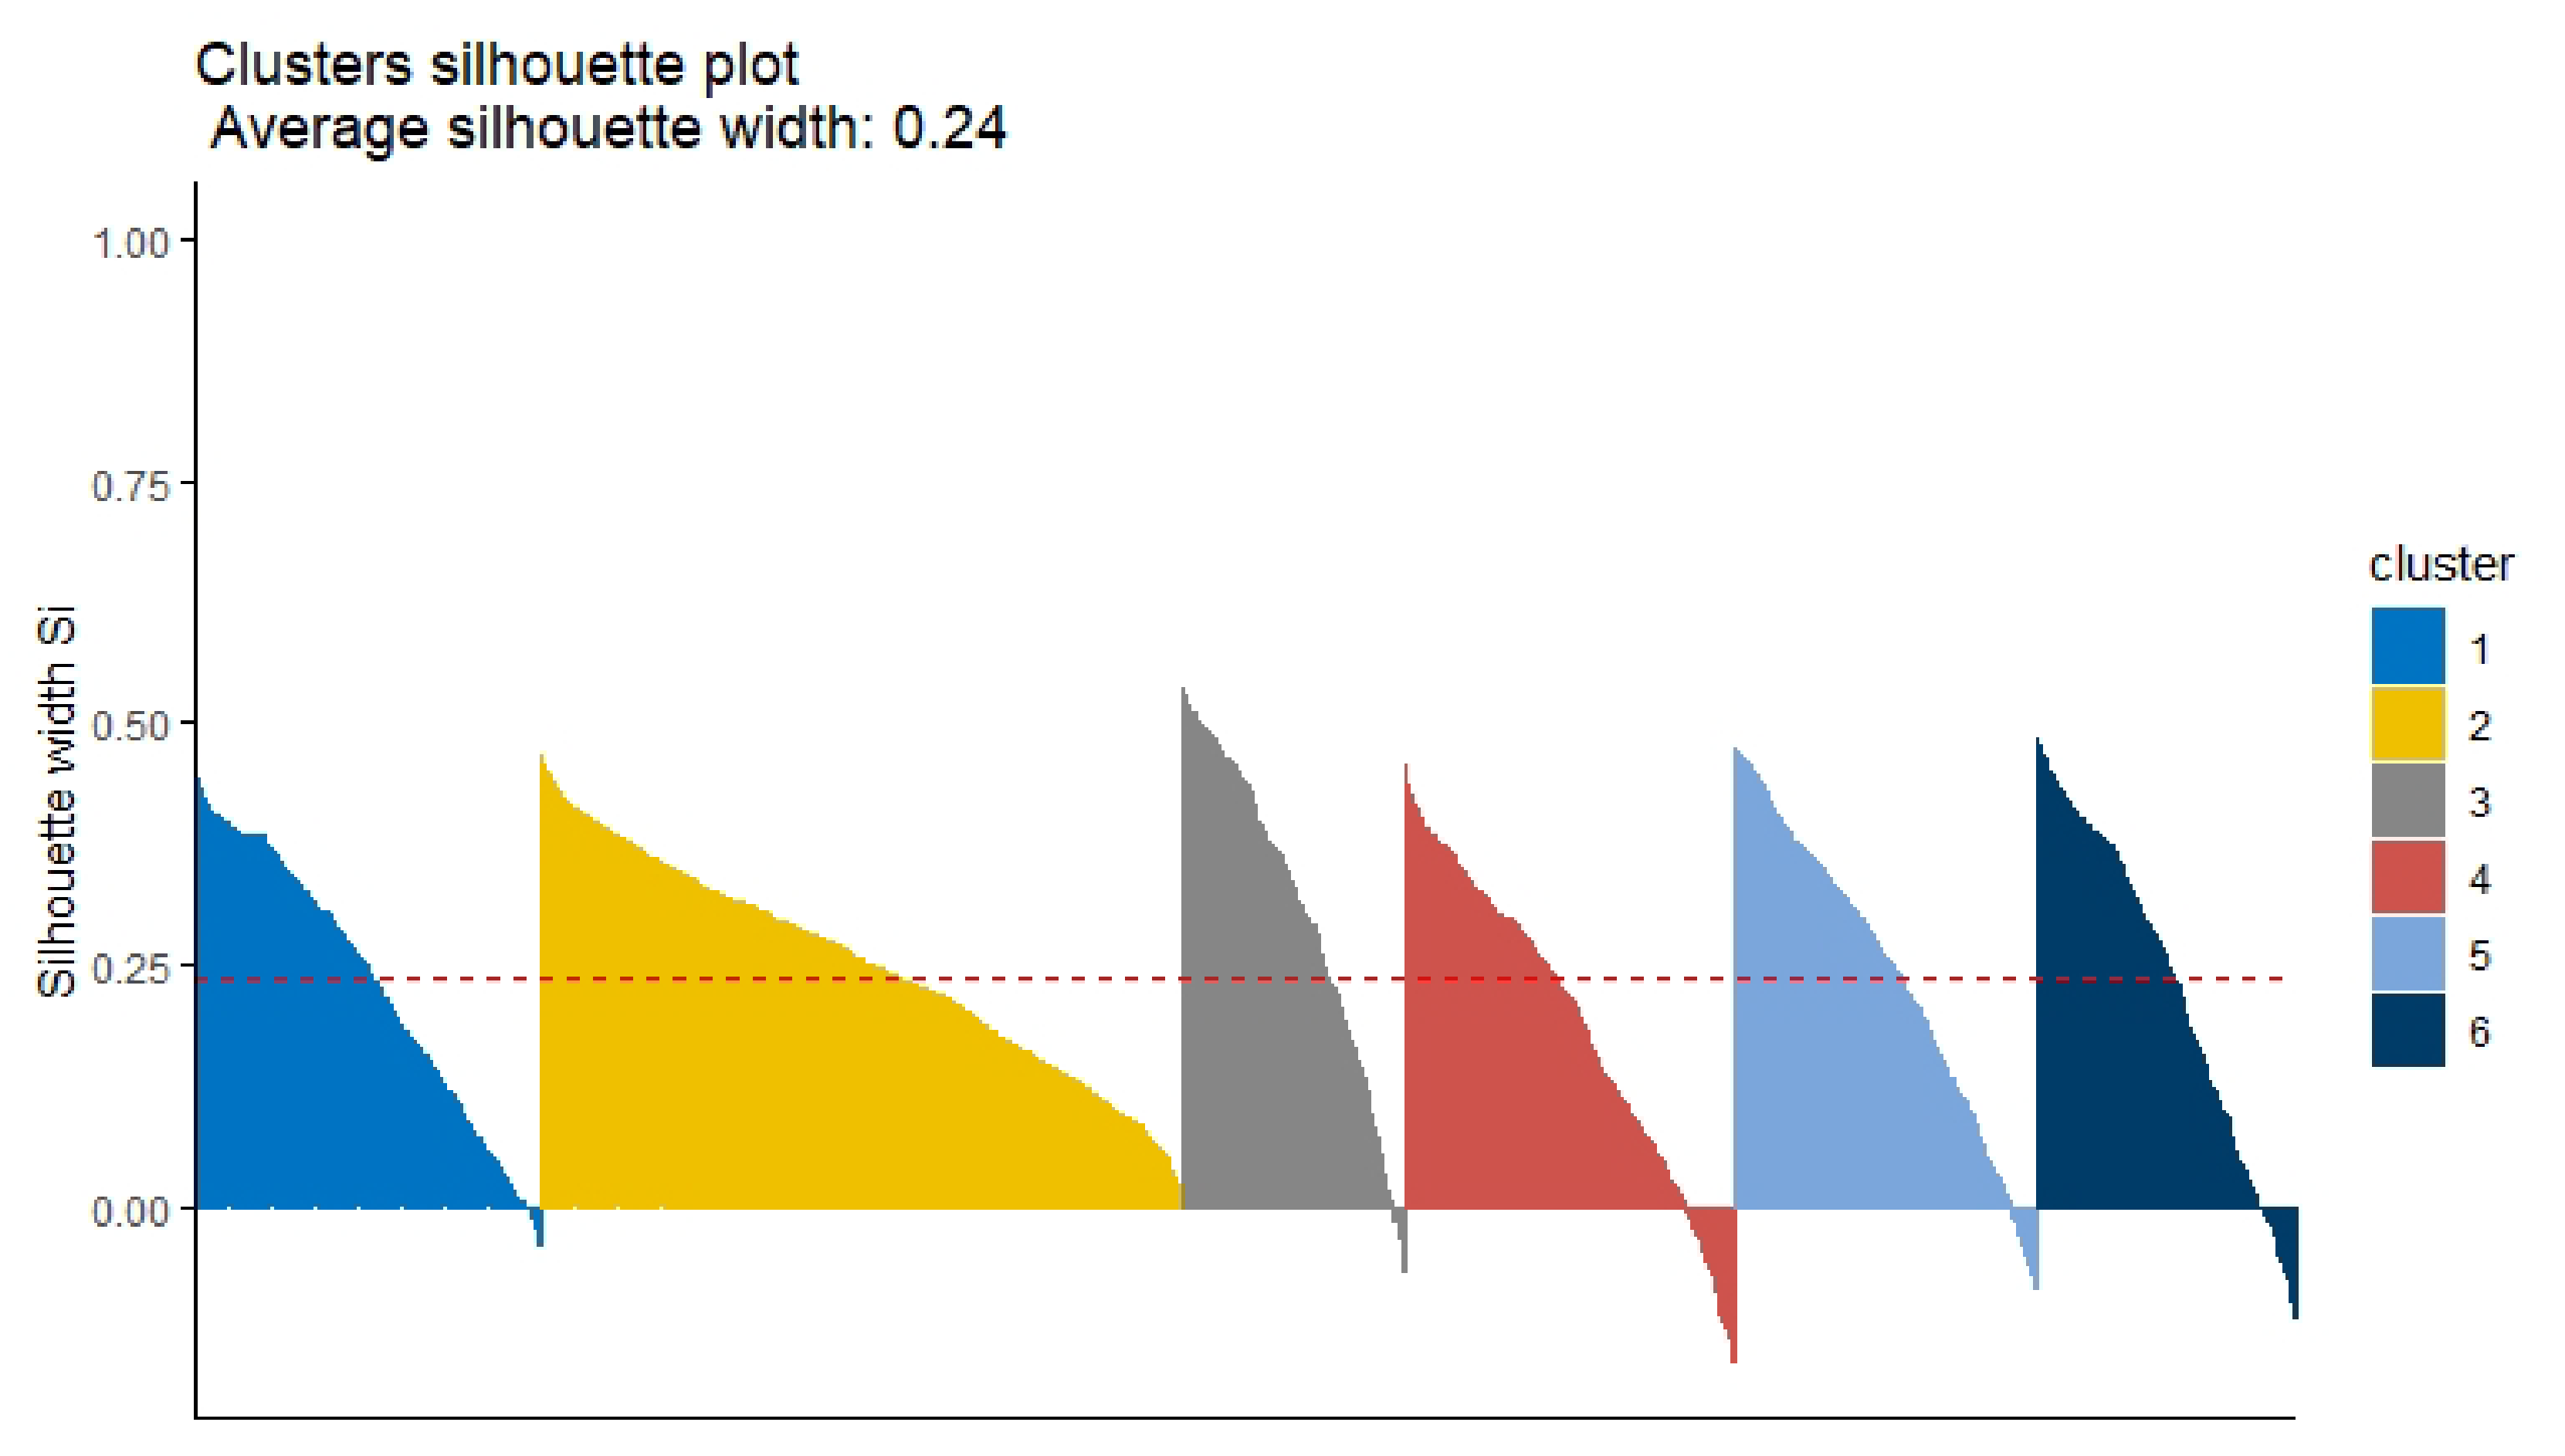
The clusters are statistically reliable, as it can be seen graphically with the silhouette plot, where most of the 1 ha grid cells remain within the statistically appropriate cluster (
Figure 6). This plot displays how well the clustering works by comparing the similarity of an observation with the rest of observations within the same cluster. The values range between -1 and 1, and high values (1) indicate that the observation has been classified in the correct cluster. If values are close to 0, the observation could be included in other clusters, whereas negative values may indicate an incorrect classification of the observation in a certain cluster.
Specifically, as can be seen in
Table 2, the homogeneity of the cluster 2 is absolute, while only clusters 4 and 6 drop below 90%, because they characterize peripheral urban areas with heterogeneous land uses and spatially discontinuous urban models. In total, a 93.3% of the cells are included in their statistically ideal cluster.
However, the complexity and heterogeneity of the variables require clusters that are not completely compact (Dunn index = 0.01), in the same way that the territorial reality is not characterized by hermetic urban landscape units. The Dunn Index is the ratio of the smallest distance between observations in different clusters to the largest intra-cluster distance. The Dunn Index ranges between zero and infinity and should be maximized.
Below, the results shown in
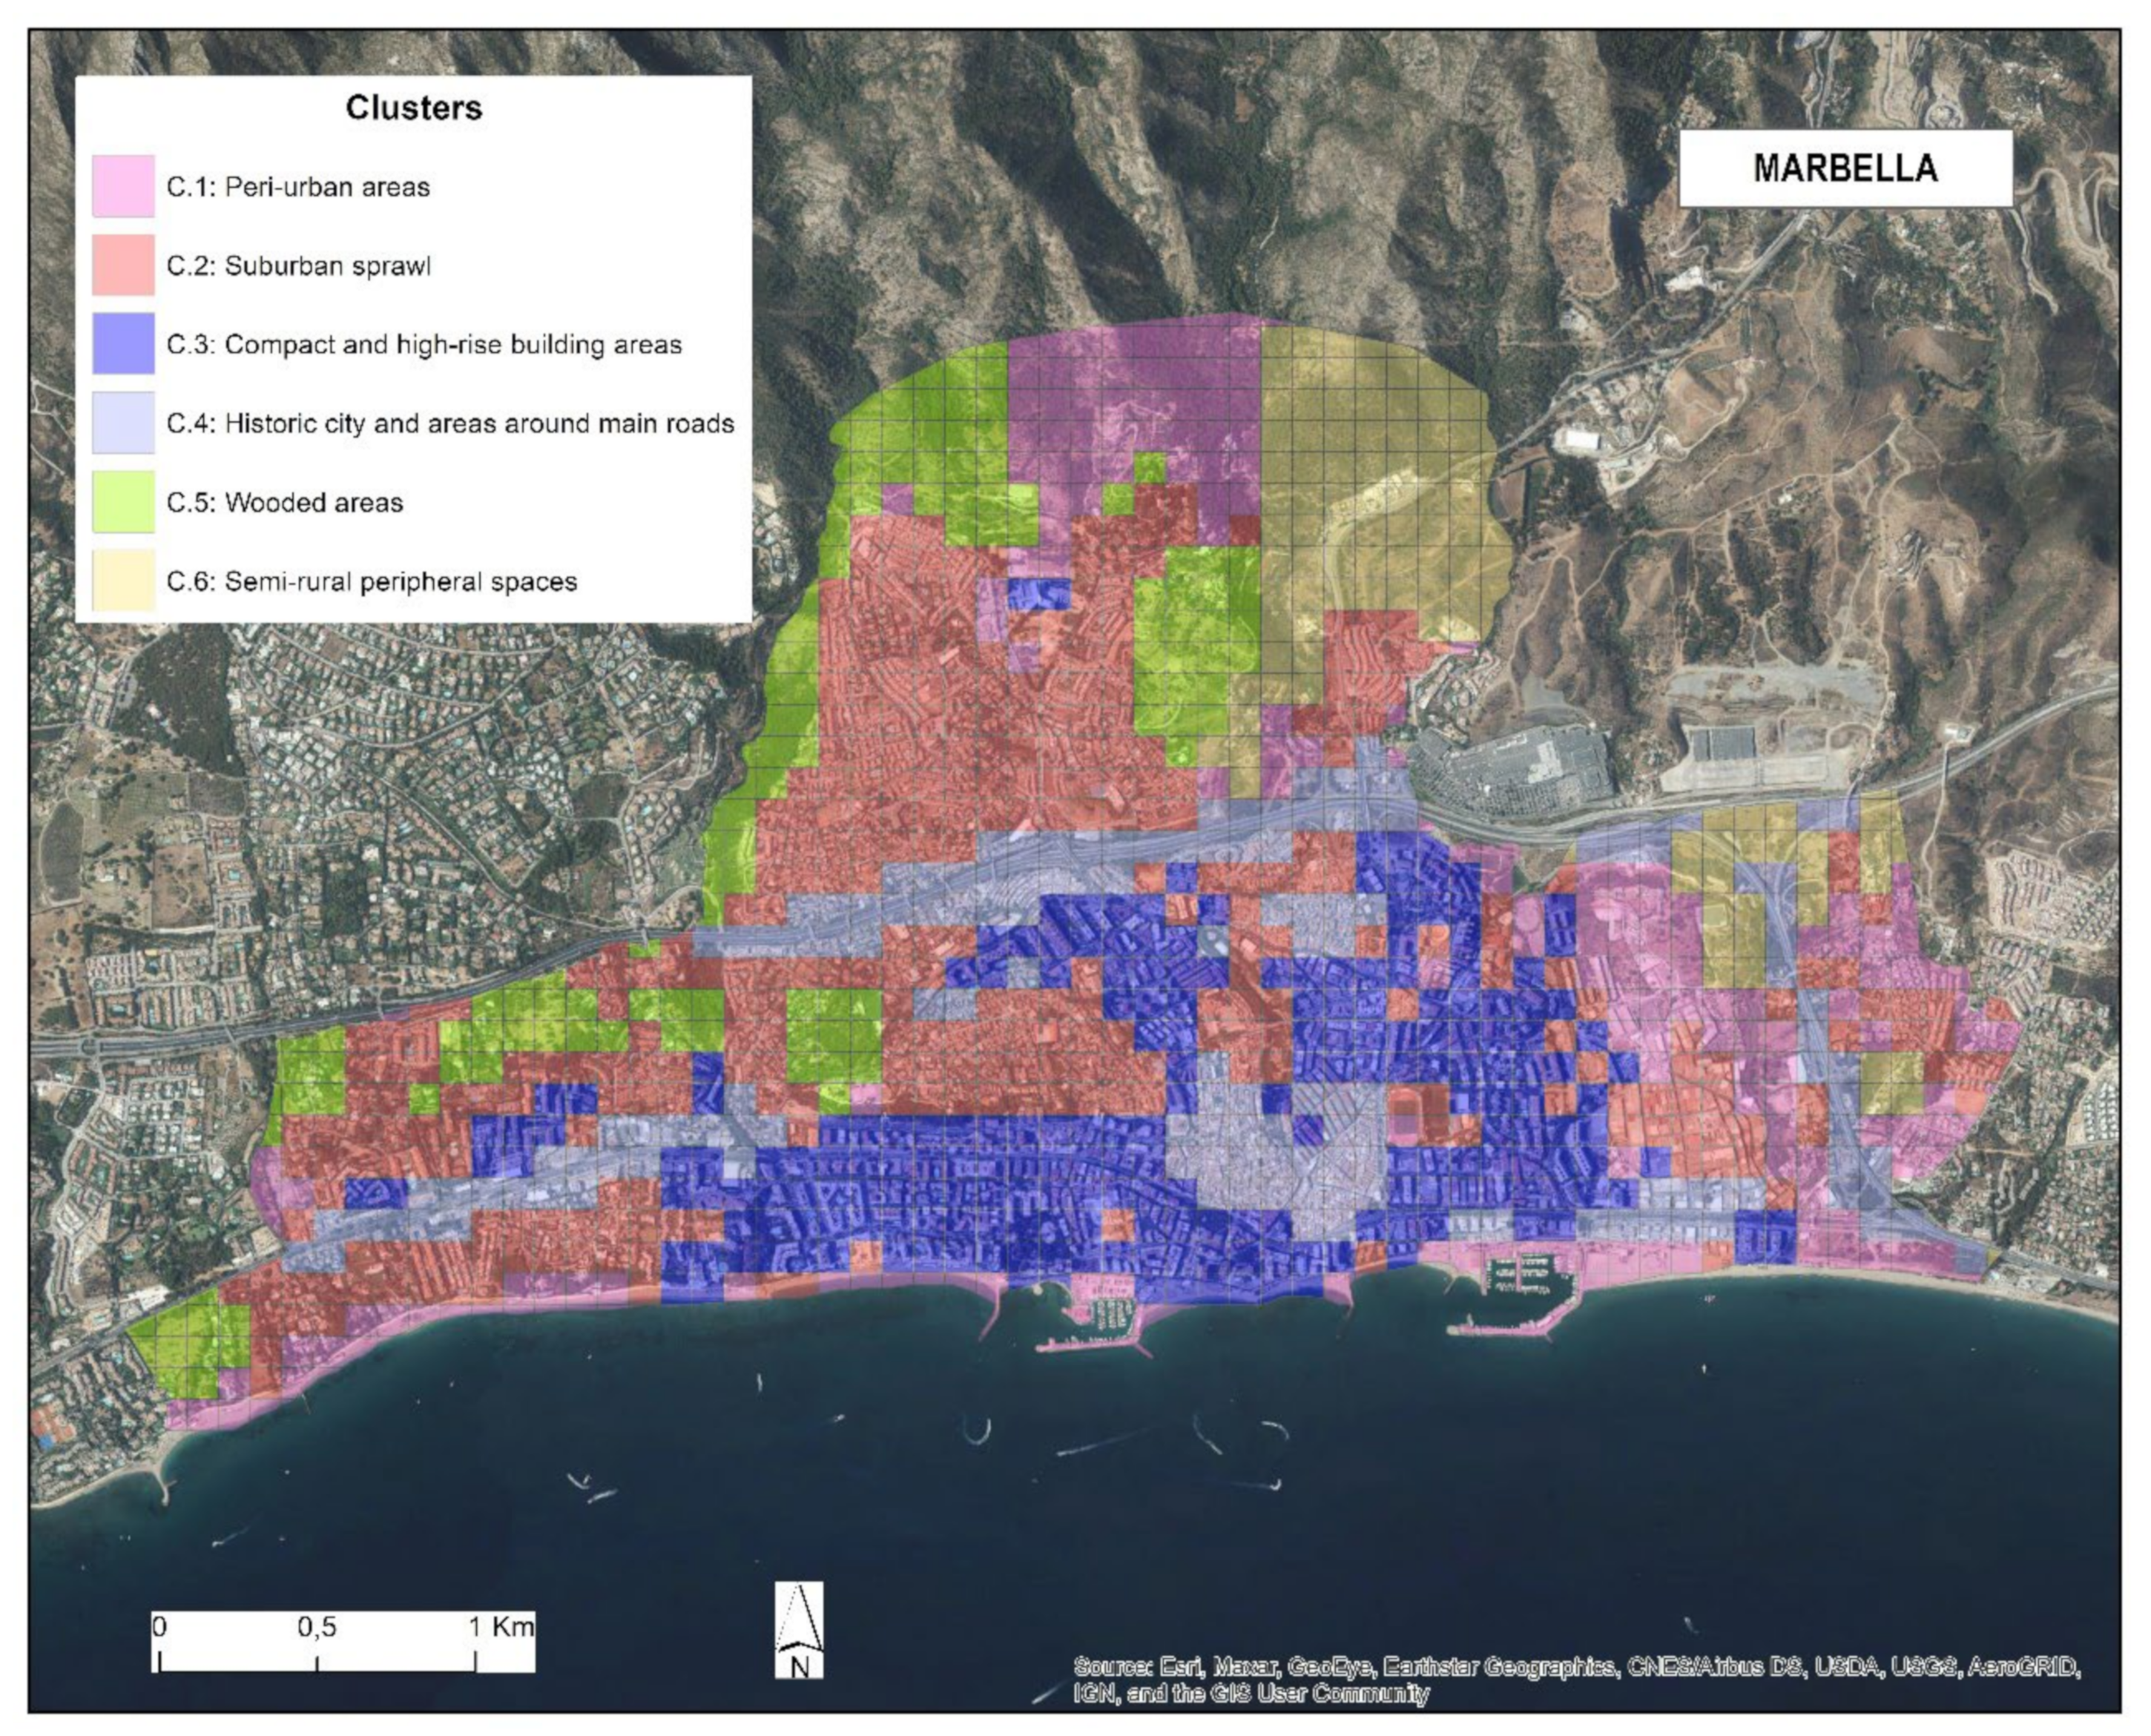
Figure 7 (Marbella case),
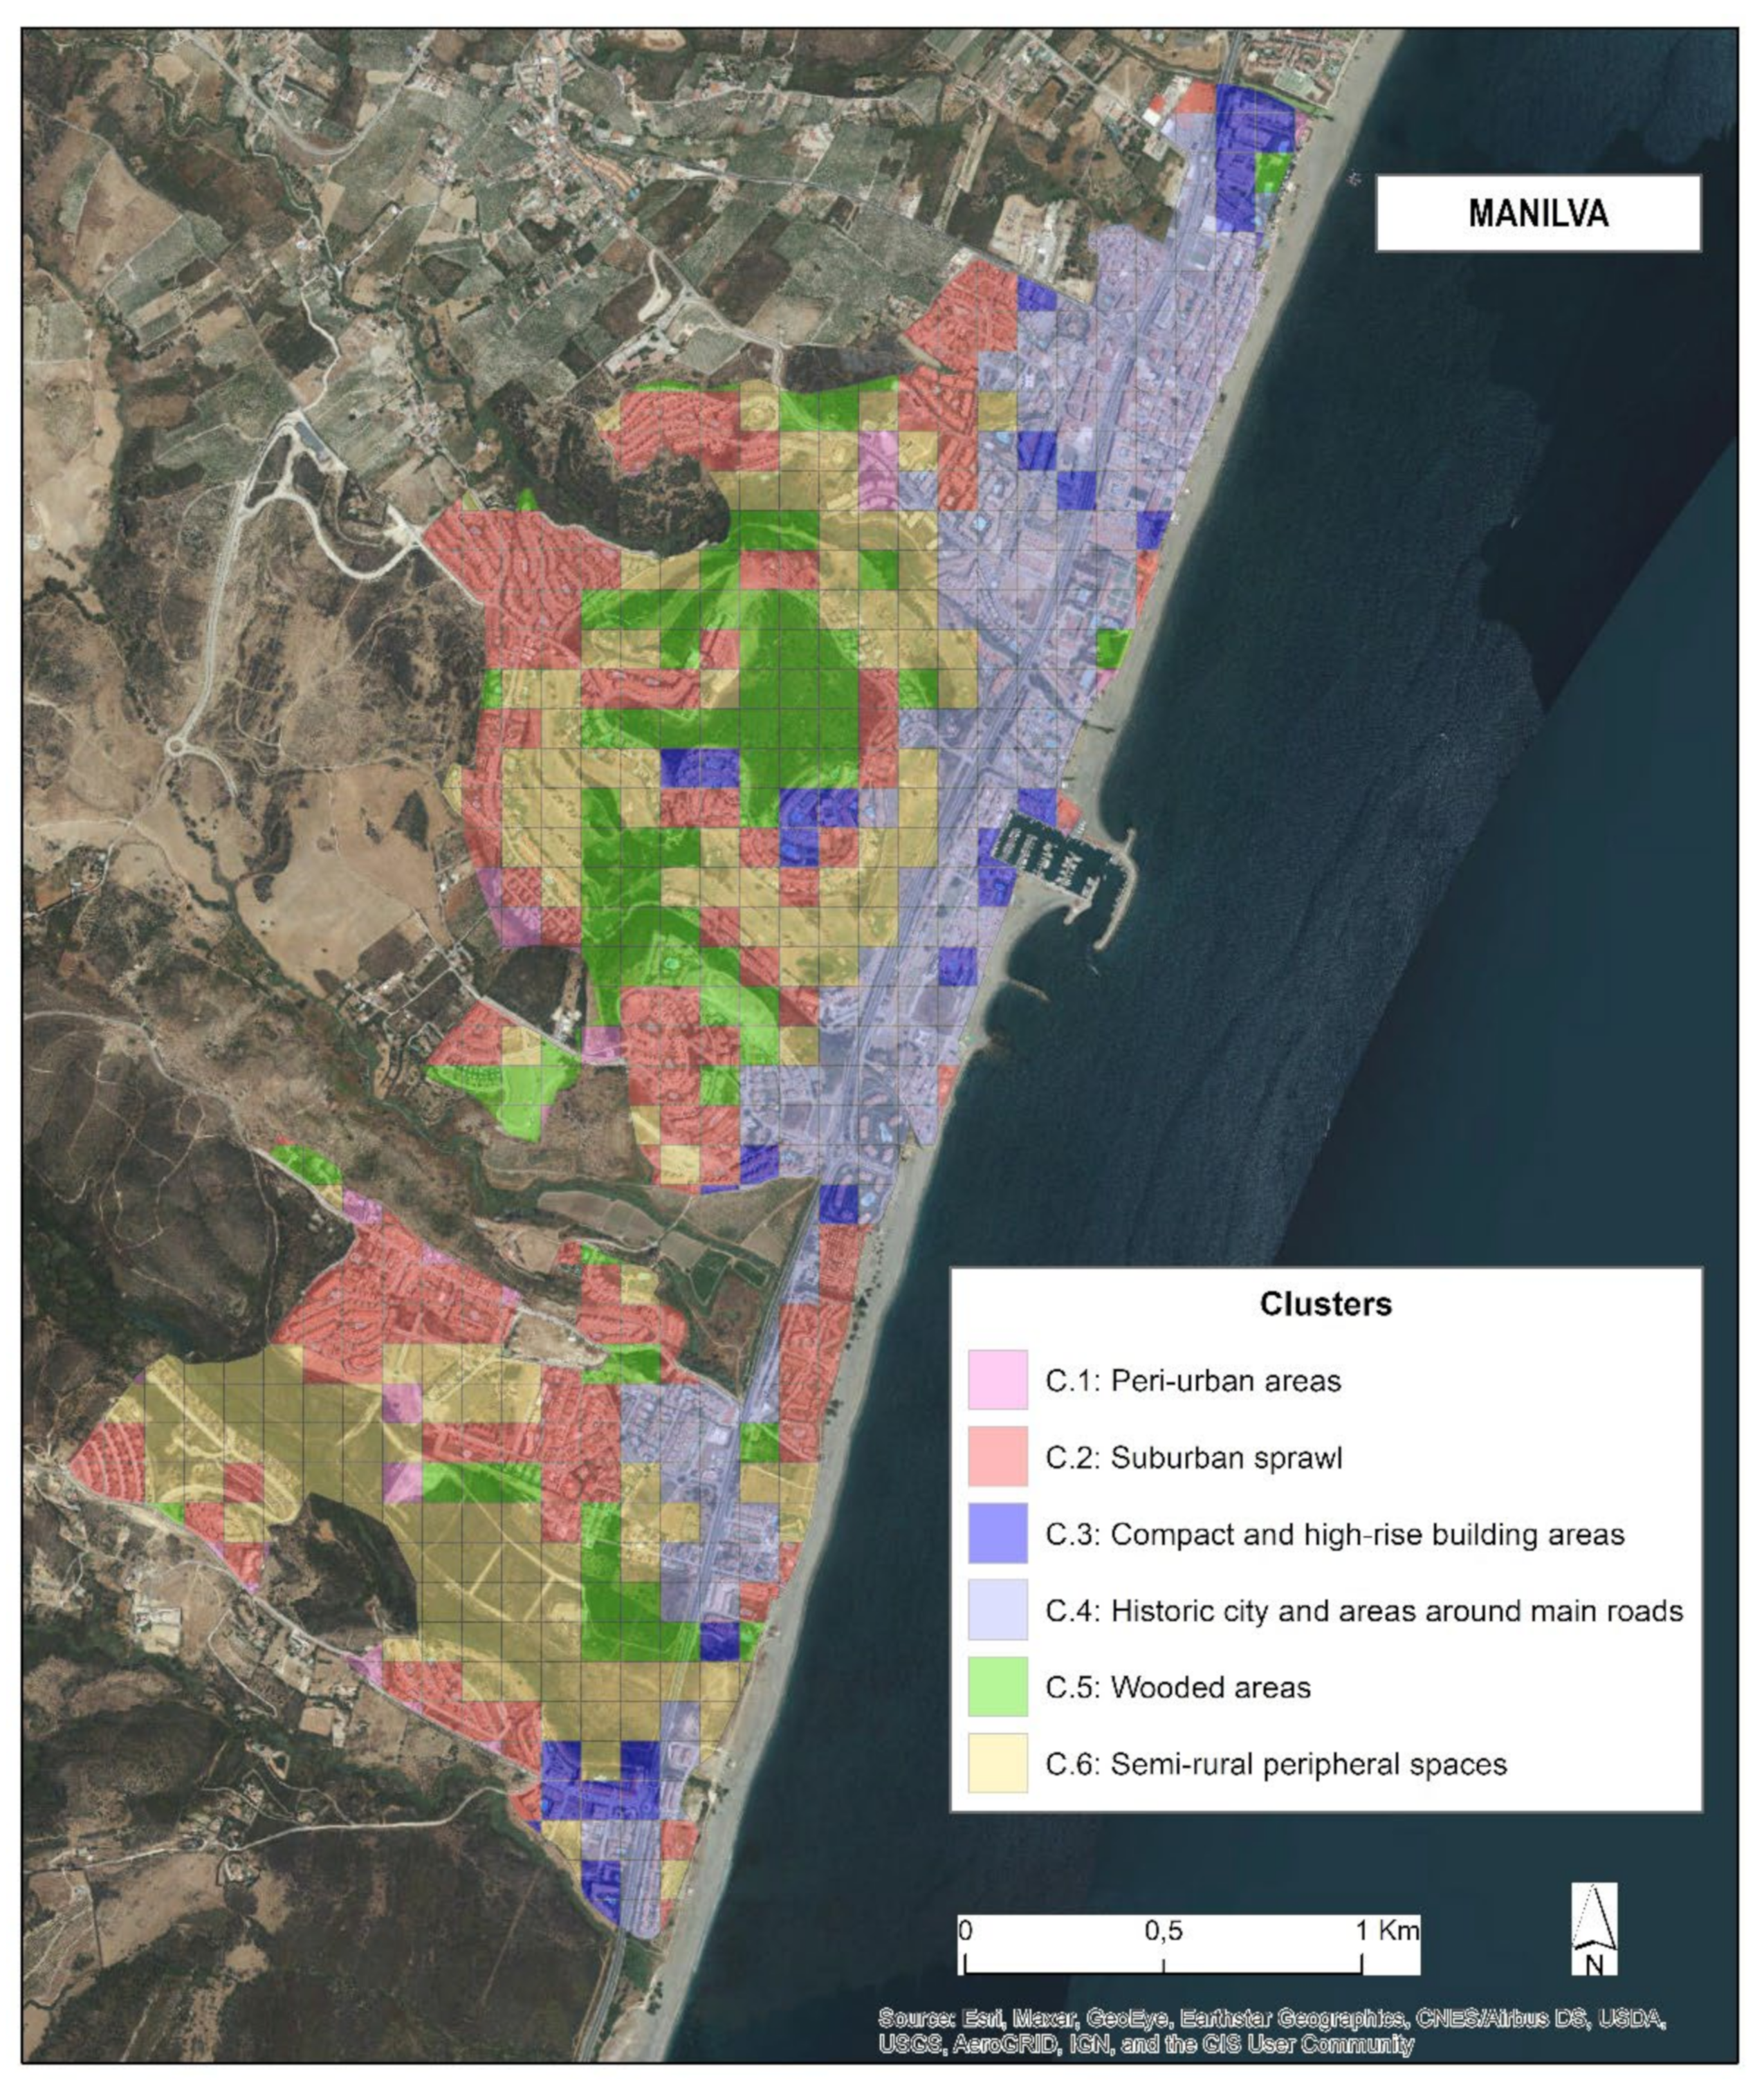
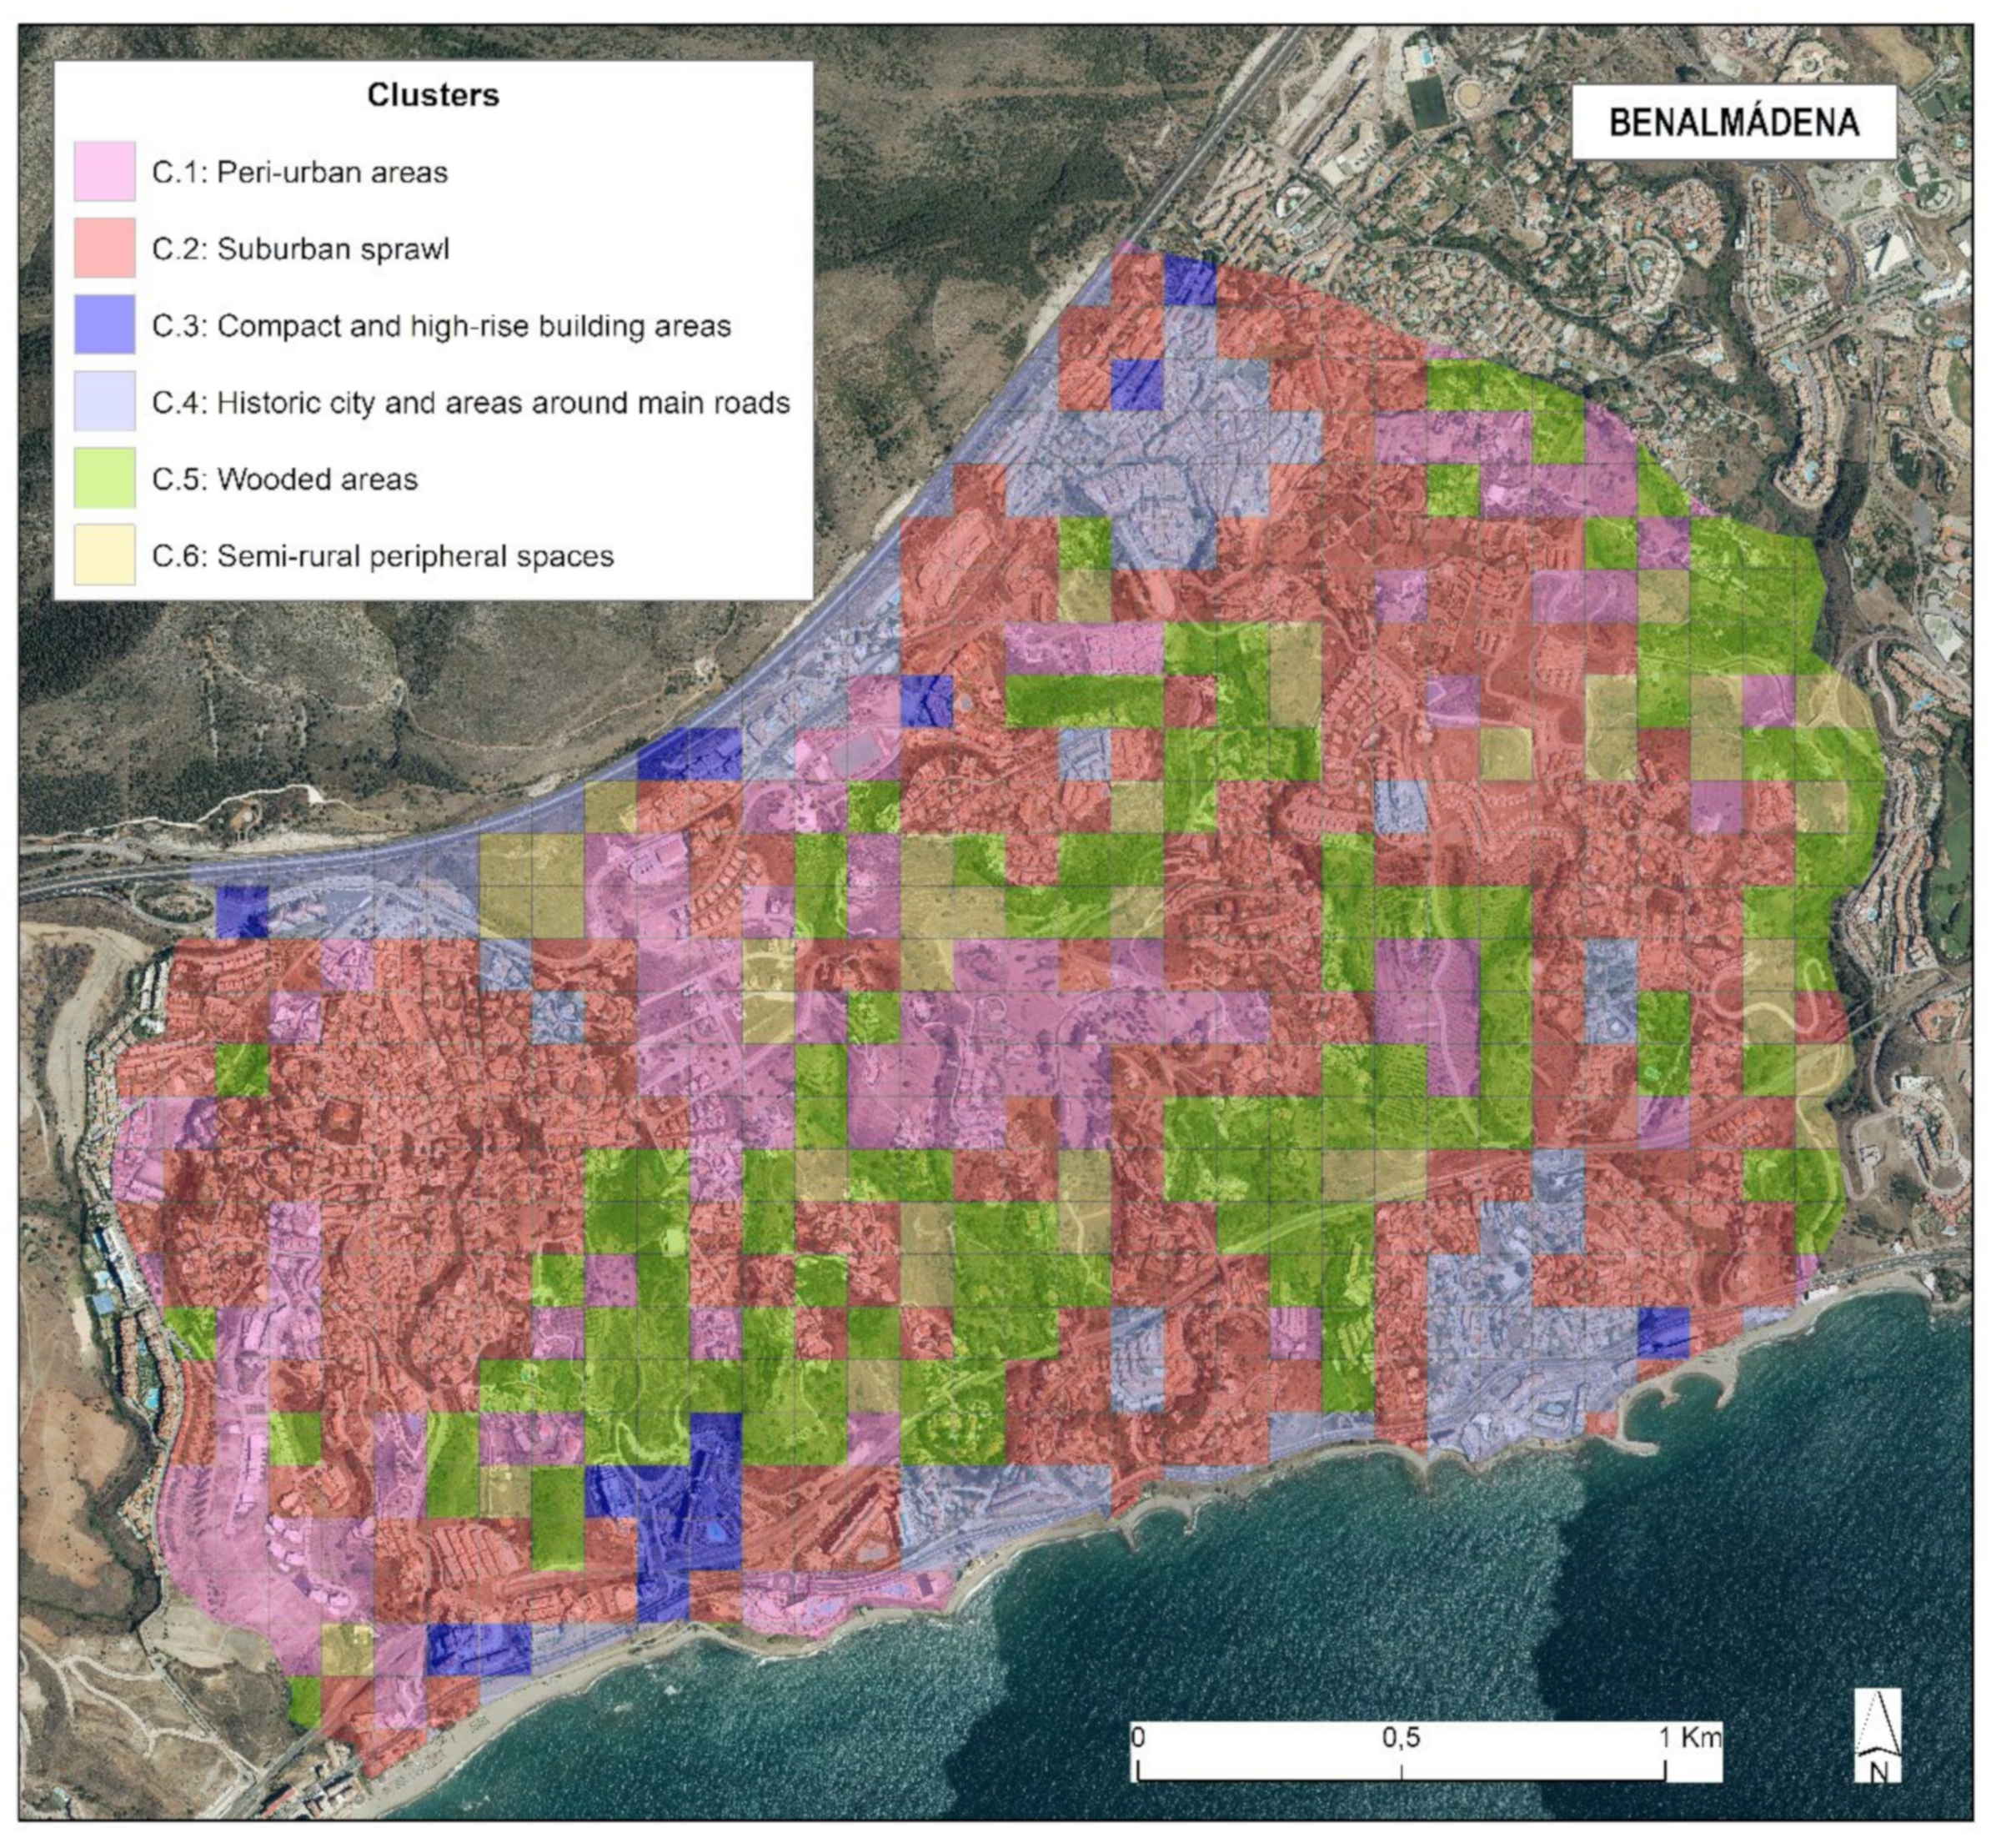
Figure 8 (Manilva case) and
Figure 9 (Benalmádena case) are described and interpreted, following a territorial approach:
Cluster 1 corresponds to areas of low vegetation density, low building density, one- or two-story buildings and medium-low road density. This category includes peri-urban spaces with a process of urbanization already under way, made up of scattered residential areas and lots, as well as the coastline belt and, occasionally, industrial and commercial uses. This cluster is represented, above all, in the cases of Marbella and Benalmádena.
Cluster 2 includes the areas with moderate vegetation density of high and low covers, medium constructive density, low building height and medium road density. It clearly identifies the horizontal expansion of the last few decades, with villas, townhouses and apartments covering a few floors, which include private spaces with gardens, and which are connected with a dense, though dendritic, network of streets. As previously observed in
Table 1, it is the most representative class in the study areas, having a greater presence in the municipalities of Benalmádena and Marbella.
Cluster 3 considers spaces with variable vegetation density, medium-high construction density, high-rise buildings and medium-high road density. It refers to the areas where hotel, residential and/or office buildings are predominant, in many cases arranged in open planning, with an open environment that usually includes some landscaped or wooded spaces. They are mainly located in central areas of the city, appearing less frequently in the periphery. In this sense, the case of Marbella, with a compact area, contiguous in the space that surrounds the historic centre (cluster 4), contrasts with the cases of Benalmádena and Manilva, where this urban model is more spatially dispersed, mainly due to the fact that the urbanization process was later, with a different urban paradigm of reference.
Cluster 4 comprises areas with medium and low vegetation density, medium and high building density, medium and low buildings and high road density. Within this cluster there are two differentiable landscape units, which share a high road density: the historic centres, with a dense grid of narrow streets and a dense land occupation by buildings, and the urban peripheries that are connected to the bypass roads. These have little space for gardens and parks. The second landscape unit is more recent, and it often includes more open spaces, to which must be added the bonded areas around the highways. In the three case studies, this cluster appears elongated due to the influence of the main transport axes, and concentrically in the historic centres of Marbella and Benalmádena. In both cases, this typology shares the character of a perceptual edge for vehicles in historic centres and for pedestrians on the margins of motorized transport routes.
Cluster 5 corresponds to high density areas of herbaceous and shrub vegetation and very high arboreal cover, always above the 21% of the total area. Other features are the frequent very low construction density, buildings of one or two floors and low road density. This group brings together peripheral areas, which are either urbanized by low-density residential areas and large private green spaces, or it directly corresponds to public urban parks, river corridors and golf courses. Again, the Marbella pattern differs from that of the other two cases. In Marbella, a crowded urban area, the tree green spaces are concentrated in an isolated way in non-urbanizable areas, mainly in the western area, while in the cases of Manilva and Benalmádena they are distributed more heterogeneously throughout the territory. It happens particularly in the western area of Benalmádena, a hilly area with numerous narrow valleys with a steep slope.
Finally, cluster 6 comprises areas with medium arboreal density and a very high herbaceous and shrubby cover density. The building density is low or null, while the height of the buildings is usually low, rarely higher than one floor. The road density varies between non-existent and medium. This category includes semi-rural peripheral spaces where the use of residential land still coexists with agricultural activities. We can highlight the presence of this cluster in Manilva in the transition zone towards the interior, a rural area that is gradually becoming urban.
For a synthetic analysis that allows the comparison of the clusters, the information is presented in the following
Table 3:
The spatial distribution of the clusters in the three study areas reflects the diversity of dominant urban morphologies in each municipality and the territorial processes that have generated them. For example, cluster 3, which is particularly observed in urban centres, is especially evident in Marbella, the most populous of the three cases considered. The same occurs with the areas included in cluster 4: historic centres and communication axes. Although communication axes are observed in all the study areas, they are especially highlighted in Manilva, whose expansion has been largely around the old N340 road.
The suburban areas, collected in cluster 2, are very widespread in Benalmádena and follow a concentric pattern around the central areas of Marbella. The cluster more defined by the vegetation (Cluster 5), appears interspersed with urbanized areas in Benalmádena and Manilva, linked to the golf courses, while in the core of Marbella, with a more compact urbanization, it is linked to natural peripheral areas. Finally, the two peripheral clusters are associated in a relatively opposite way: while in Manilva cluster 6 occupies large areas, linked to the mixture of urban and agricultural land, in Benalmádena and Marbella the undeveloped areas (usually waiting for upcoming urbanization) are related to cluster 1, clearly peri-urban.
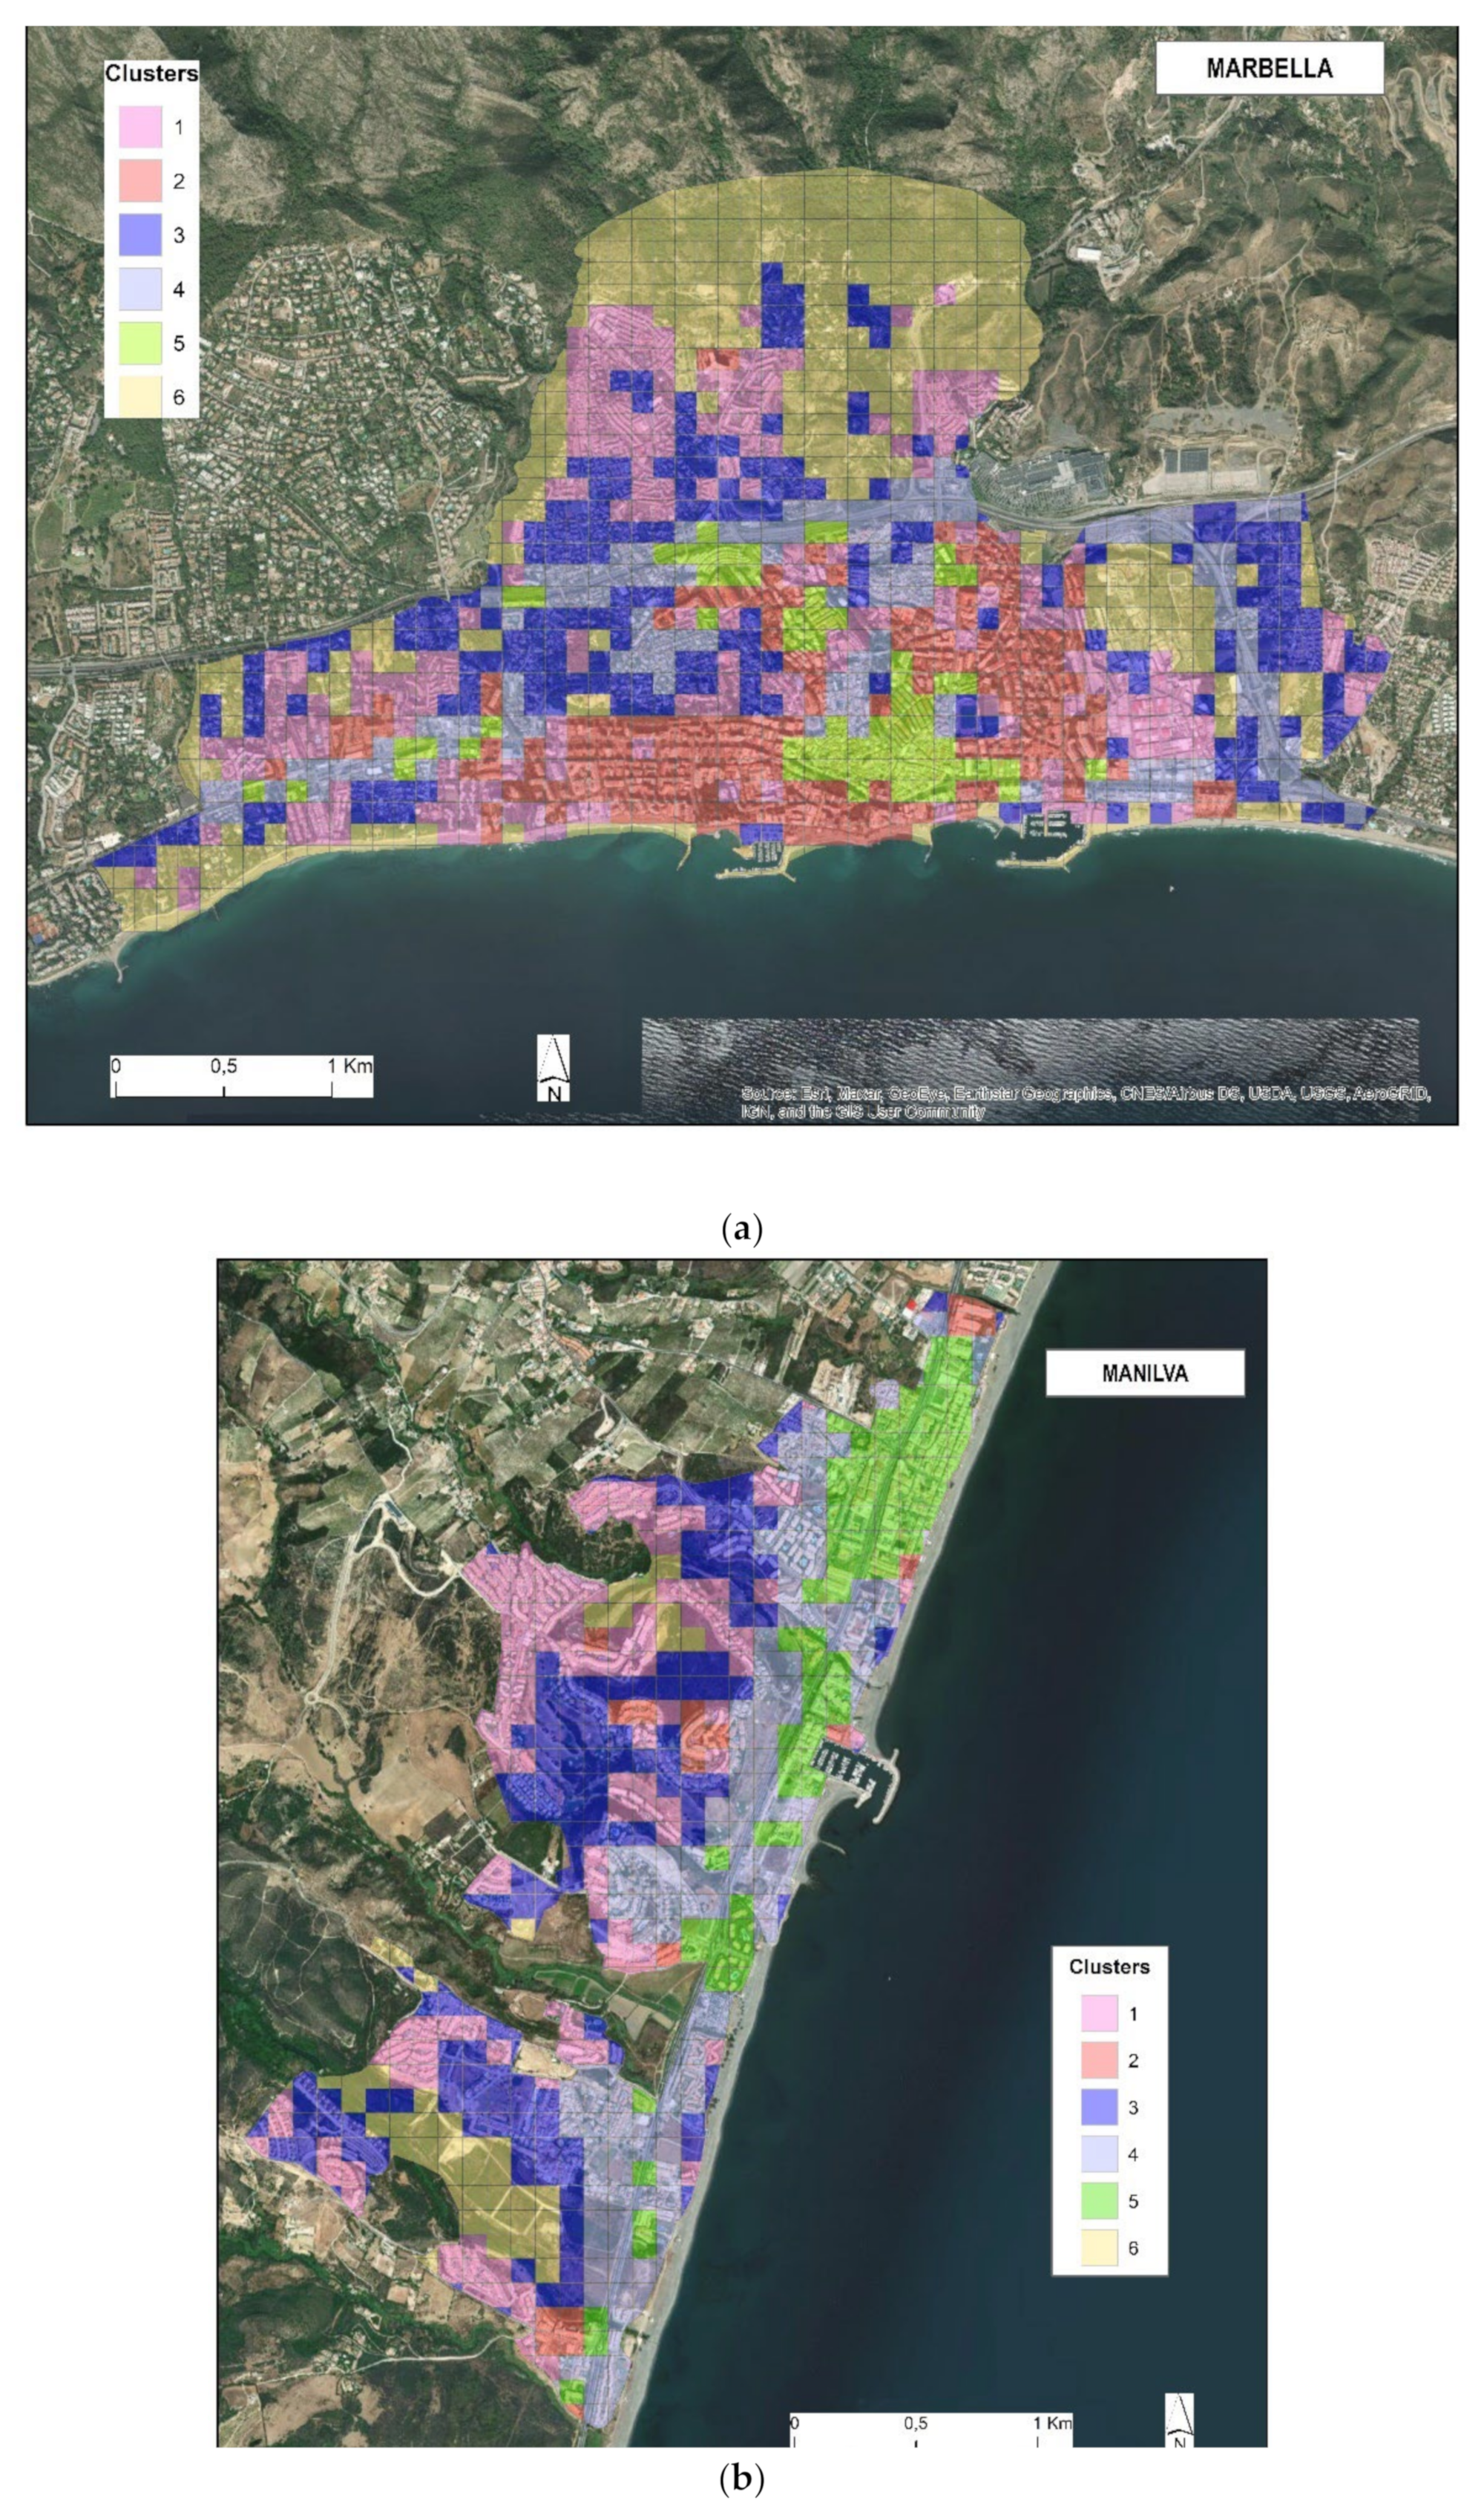
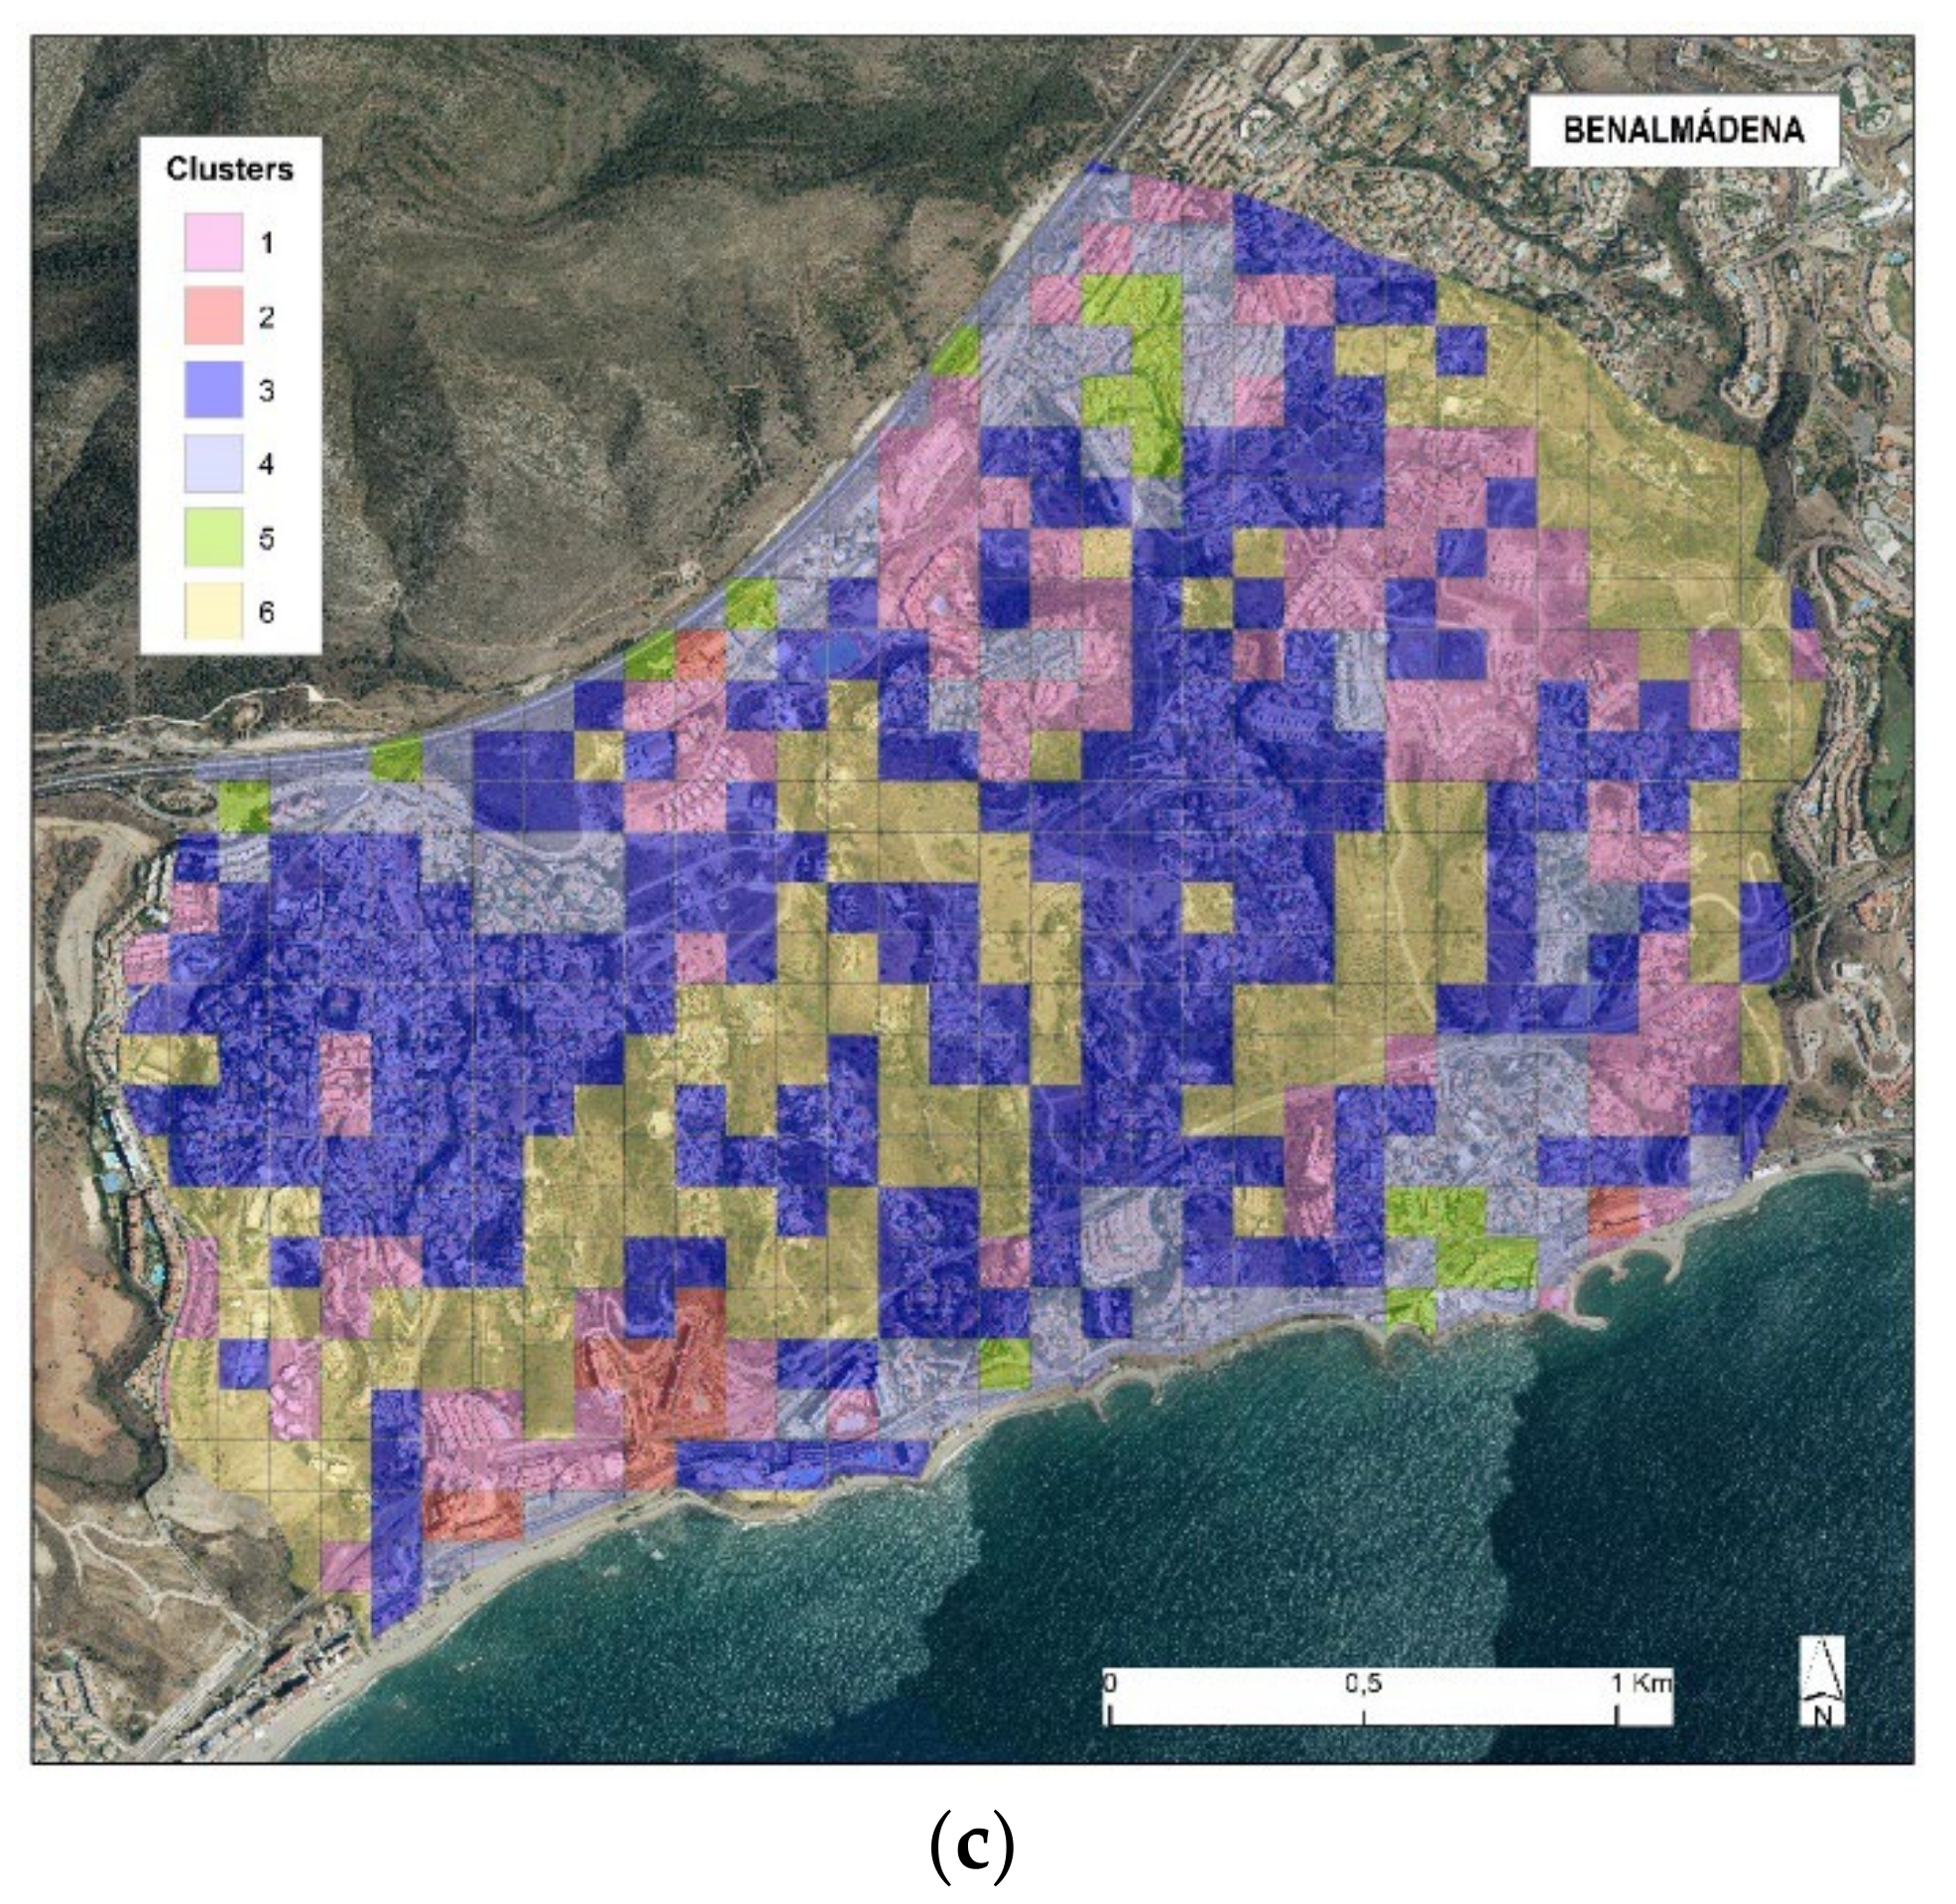
3.3. Spatial Comparison of the Results: With and Without the Vegetation Cover Variables
At the general level of the three municipalities, the first thing that draws attention in the results that do not include vegetation variables is the spatial discontinuity of the clusters, which distinguishes urban units with unclear patterns from the territorial point of view. Evidently, the meaning of each cluster changes completely with respect to the results originated with the inclusion of vegetation. Cluster 6 covers all interstitial peripheral spaces where the importance of the construction and road variables are low, without differentiating them. Within the urban area, it can be observed how the methodology without vegetation is unable to distinguish urban facilities such as parks or golf courses, as can be observed in the central area of Manilva (
Figure 8 and
Figure 9). Nor it is able to distinguish between different models of horizontal urbanism, as can be seen in Benalmádena (
Figure 9 and
Figure 10), where cluster 3 unifies both compact single-family and relatively scattered areas from a more peri-urban context. Finally, without the inclusion of vegetation, the methodology generates some clusters with an unclear pattern, as it is the case of cluster 5, which collects areas of dense, but disparate building structure. This is clearly seen in the cases of Marbella and, specially, Benalmádena (
Figure 9), where this cluster brings together both areas of the historic centre (upper right of the image) and areas of multi-family buildings of various heights near the motorway (specific cases in the northern part of the study area) or to the coast.
4. Discussion
The introduction of the vegetation cover enriches the analysis of the urban types, especially if it is approached from a landscape perspective, and has allowed us to delimit six large classes of urban spaces. The results are very positive, as they reflect the common logic of heavily urbanized coastal territories such as the Costa del Sol, although the three study areas are different from each other. In those heavily urbanized areas, urban types have been changing during the last few decades, associated with socioeconomic processes, spatial availability and cultural aspects. The spatial distribution of the clusters reproduces the predominance of purely urban forms in municipalities such as Marbella, with a more suburban character, as in Benalmádena, or with a rural character expanded around large roads (Manilva). More precisely this heterogeneity allows us to be optimistic about the translation of this methodology to other urban areas of a similar scale.
On the other hand, the segmentation of vegetation cover into two sub-variables, tree and shrub, allows urban delimitations at different scales. At the urban scale, it makes it possible to distinguish the different zones of the city: historic centre, residential areas, unconsolidated urban expansions, etc. At the intra-urban scale, it makes it possible to differentiate the features of the different urban models from a landscape point of view, by discriminating urban areas according to their open spaces, or considering the predominance and spatial distribution of arboreal or herbaceous vegetation, as well as distinguishing similar leisure areas, such as golf courses and forest parks. In suburban areas, vegetation plays a very important role, so that the use of this methodology can make it possible to distinguish different urban models.
The specificity of this study for Mediterranean areas needs to be underlined. Firstly, because of the spectral signatures focused on the Mediterranean flora, with perennial arboreal vegetation, abundant scrubland, and scarce lawn areas, beyond the private gardens and golf courses. Secondly, because of the characteristics of the urban morphological units in this region, where it is common to find historical centres with more than 500 years, with the influence of cultures such as Roman or Arabic, with disparate urban patterns that overlap, and that contrast with subsequent urban expansions, fundamentally between the mid XX century and the present. In these contemporary urban expansions, there are three main models: the multi-family residential neighbourhoods, the horizontal and scattered urbanism of suburban areas of the second half of the XX century and, more recently, multi-family developments in private areas. On the other hand, industrial activities and their impact on the landscape are not considered priorities because they are not as common as in other territories.
Unlike the study by Abrantes et al. [
10], this methodology delves into an intra-urban scale of greater detail, so it allows us to know with great precision the common urban patterns in areas of different municipalities. Whereas those authors follow a more abstract territorial approach, which it works at a national scale, the application of photointerpretation techniques in the analysis of the results implies a classification with a landscape basis, useful in intra-urban units of analysis
The classification obtained allows to interpret the differences existing between the study cases and the territorial processes that have generated them. In Marbella, with a greater urban tradition, it distinguishes both the historic centre and the sectors of the first urban expansion that surround it, developed from the mid-twentieth century. In the three areas of study the suburban areas are recognized, linked to the tourist development of the last few decades, although its extension is greater in Benalmádena, where, for several decades, this territorial process converged with a metropolitan development. Additionally, in all the three cases, but especially in Manilva, the consolidated urban units appear directly linked to the coastal communication axes, reproducing the form of urban growth experienced by the development of tourism activity along the coast. Likewise, Manilva also includes the agrarian lands, which are practically absent in the fully urban spaces of Marbella and Benalmádena, whose undeveloped areas are mostly plots that await their upcoming urbanization. Finally, the relationship between urbanization and golf courses, very close in this area, is also reflected in the clusters.
On the contrary, the main limitation of the methodology is that it is not properly adjusted to non-urban areas, as some land uses have not been considered, such as agricultural or industrial land. Compared to the methodological proposal by Guyot et al. [
27], which requires up to 17 indicators to perform the categorization, an easily and quickly replicable methodology is provided. On the other hand, although the Proximity Band (PB) that they apply (developed by Araldi and Fusco) [
44] is very interesting, it tends to generate excessively detailed units, which do not correspond to the real landscape units, but more to an architectural analysis [
45]. Something similar happens in the case of the European Urban Atlas of 2018 [
46], since it excessively fragments urban units, due to a perspective related to land use instead of landscape characterization.
The same conclusion is reached in the studies by Hermosillas et al. [
47] in Valencia, or Guyot et al. [
27], in Brussels, who proved that the distribution of vegetation allows distinguishing suburban fabrics from other urban fabrics. However, its efficiency is low for characterising compact urban fabrics, such as historic centres. As observed in the study by Guyot et al. [
27], our study proves the utility of the spatial distribution of the vegetation in the clustering, since it increases the accuracy in the characterization of different types of suburban fabrics. However, in this study, the differentiation between trees and shrubs enriches the results and allows nuancing the different urban models.
The territorial complexity of the Costa del Sol has created difficulties for its spatial grouping in only six clusters. This means that different urban areas are included into the same category, since they share urban characteristics. The upcoming improvements are focused on cluster 4, where the areas crossed by the main road axes and the historic centres are grouped together, with a dense but pedestrian road network. This will include further treatment of the variable road network. However, the creation of more clusters would imply problems of statistical reliability, which would affect the replicability of the methodology in other territorial units and would generate an unrealistic fragmentation of the territory. In addition, the inclusion of more categories would mean the loss of the synthesis process and an increase in the difficulty of interpreting the results. Fortunately, photointerpretation allows an easy detection of the urban landscape types that are included within the same cluster.
The methodological proposal is designed to consider a series of limitations of basic information. To carry out the remote sensing analysis, the optimal information would have been the one marketed by Pléiades 1A and Pléiades 1B, with images of 0.5 m/px, or the one offered by SPOT-6 and SPOT-7 with a resolution of 1.5 m/px. In short, these are multispectral images that have a greater precision in the distinction of the surfaces and, in turn, a high resolution. The orthophotography-based analysis, which considers the visible area of the electromagnetic spectrum, requires a process of edition and correction of the resulting layer, mainly shadows, inland water bodies and some anthropic elements, as some artificial surfaces (asphalt, roofs). The rest of the variables generated fewer difficulties, although they require a prior treatment of the information. The average height of the buildings variable has the disadvantage of not clearly showing areas where there is a strong difference in height between nearby buildings, while the inclusion of road density in the statistical analysis could consider the distinction between pedestrian roads, mixed and road traffic.
The methodology is considered as a very useful tool for the planning and management of green spaces in urban areas. Given its detailed scale, its usefulness goes beyond the designation of urban areas as green zones or the projection of green corridors in urban green space planning. It can be used to incorporate vegetation into the urban structure, whether in public spaces (e.g., rows of trees in streets, planters in squares, tree wells in boulevards, etc) or private areas, being able to characterize the environmental quality of residential zones. In this case, it should be also indicated that the method can be used to delimit gardens of the buildings’ roof. In any case, the methodology can be very useful in Mediterranean areas, where the role of vegetation is fundamental for climatic reasons.
5. Conclusions
The presence of vegetation is a perceptual variable, but it also plays an important role in the value and functionality of the city. Regarding the environmental quality, it improves air quality [
48], regulates rainwater [
49] and urban microclimate [
50], and establishes links with nature [
51], in addition to other beneficial aspects, such as the use of trees to increase the privacy of dwellings, an aspect highly valued in the luxury real estate segment or the reduction of insolation in private and public spaces and the thermal regulation of the environment, especially in Mediterranean areas.
Another benefit that it offers, especially in Mediterranean environments, is the reduction of insolation in private and public spaces and the thermal regulation of the environment.
The methodological proposal provides an effective way to generate urban landscape types in large territorial areas on a neighbourhood scale. The importance of the vegetation cover to identify urban units is verified, since the distinction of vegetation cover improves the results, which show a high coherence between the statistical reliability and the spatial classification of the cells in the three municipalities.
The good results in three localities with slightly different features (an urban area, a coastal suburban area and an area where popular construction is predominant linked to major roads) allow us to confirm that the methodology is well adapted to the study of regions with a certain degree of heterogeneity within the Mediterranean urban area. The usefulness of this procedure lies in the possibility of reproducing it in other Mediterranean urban regions, with the advantages of being a methodology that does not require very complex base information to obtain and that it can be applied simultaneously to relatively large territorial units such as a municipality, without requiring computer equipment of exceptional capacity. However, this procedure may be complemented with techniques that allow measuring the vertical vegetation cover, since the new urban designs are increasingly including forms such as vertical gardens.
The main future line of research will be based on the improvement of the methodology, including the information of viewsheds perceived from each of the grid cells. In addition, the inclusion of other variables, such as orography or socioeconomic variables, will be explored. In this regard, the proposed method can be implemented onto a spatial analysis research focused on place attachment, as mapping methods, and it can help to delimit and characterize the relationship between urban types and the sense of belonging, particularly in the case of extensive typologies, which have become a new sign of identity of the urban landscape. On the other hand, the split of vegetation cover into two categories may allow for new types of analysis in the context of territorial planning. Regarding the detection of vegetation cover, other means for its measurement are not ruled out, although at the moment they are less economically and technically feasible.


