Article

Forest Ecosystem Fragmentation in Ecuador: Challenges for Sustainable Land Use in the Tropical Andean

1
Laboratorio de Cambio Global, Universidad Regional Amazónica Ikiam, Tena 150101, Ecuador
2
Laboratorio de Ecología de Paisaje, Facultad de Ciencias Forestales, Universidad de Concepción, Concepción 41, Chile
3
Departamento de Recursos Hídricos y Ciencias Ambientales, Universidad de Cuenca, Av.12 de Abril, Cuenca 010203, Ecuador
4
Department of Sustainable Landscape Development, Institute for Geosciences and Geography, Martin-Luther-University Halle-Wittenberg, Von-Seckendorff-Platz 4, 06120 Halle (Saale), Germany
5
German Centre for Integrative Biodiversity Research (iDiv) Halle-Jena-Leipzig, Puschstr. 4, 04103 Leipzig, Germany
6
Grupo de Investigación Ecosistemas Tropicales y Cambio Global, Universidad Regional Amazónica Ikiam, Tena 150101, Ecuador
*
Author to whom correspondence should be addressed.
Submission received: 9 December 2021 / Revised: 2 February 2022 / Accepted: 9 February 2022 / Published: 13 February 2022
(This article belongs to the Special Issue Identifying Endangered Terrestrial Ecosystems)

Abstract

:
Natural ecosystems are declining and fragmenting globally at unprecedented rates. Fragmentation of natural ecosystems leads to decline in functions and services with severe impact on people. In Ecuador, despite establishment of the nationwide ecosystem classification, this baseline information has not been fully exploited to generate a monitoring system for ecosystem changes. Forest ecosystems are altered daily in Ecuador by human impact, but the relationship between forest fragmentation and human land use has not been adequately explored. To provide an overview of how recent forest fragmentation at the national and ecosystem level was affected by practices in human land use, we quantified the degree of forest fragmentation using the forest fragmentation index (FFI). The relationship between the degree of forest ecosystem fragmentation and human land use of 64 natural forest ecosystems was analyzed during the time period 1990 to 2014. At the national level, the expansion of pasture and inhabited area significantly increased forest fragmentation. The regression models based on the FFI value indicated that the forest fragmentation was highly correlated to pastures in forest ecosystems with low, moderate, and high fragmentation in 2014 due to a progressive increase in pastures. This study showed the critical gaps between forest conservation strategies and actual practices in human land use.

1. Introduction

Over the past 50 years, humans have altered ecosystems more rapidly and extensively than in any comparable period in human history, mostly in order to meet the fast growing demand for food, fresh water, timber, fiber, and fuel [1]. These global changes have huge implications for ecosystem functioning and services [2]. Some of these pressures on ecosystems cause ecosystem fragmentation which can initiate novel landscape elements and functions, whereas larger changes could result in ecosystem collapse and replacement [3].
In forest ecosystems, the impact of system fragmentation can be manifested as biotic or abiotic changes, or a combination of both, including species extinction, disruption of trophic interactions, and increased susceptibility to disturbances [4,5,6,7]. Forest fragmentation induced by land use is occurring at an alarming rate, which highly impacts ecological functions and services, and negatively affects natural recovery processes after disturbances as catalysts of rapid environmental change [8,9,10]. Furthermore, it can lead to the exacerbation of poverty for people who heavily rely on natural resources and products [11].
Forest fragmentation is usually defined as a landscape-scale process of land cover changes in the patterns of forest that are independent of forest loss [12]. Results of empirical studies on forest fragmentation led to ambiguous conclusions regarding the limitations of interpretation because (1) many researchers measure the degree of fragmentation at the patch level, not the landscape level [13,14], and (2) most studies measured fragmentation without differentiating meanings between forest loss and forest fragmentation per se [15,16]. Because many studies advocate that forest fragmentation, per se, mitigates negative effects on biodiversity than forest loss, forest fragmentation must be measured independently of forest loss.
The effect of land use on forest fragmentation has been widely studied, which was analyzed and interpreted by using landscape metrics, such as mean patch size, edge density, and mean shape index [17]. As not all landscape metrics can capture the entire extent of forest fragmentation in a particular landscape [18], most studies about forest fragmentation have described the relationship with human land use using landscape metrics. For instance, regarding the studies on ecosystem fragmentation, an increase in the number of patches, a decrease in patch size, and increased patch isolation were used as quantitative measures of fragmentation [10,19,20]. Although these studies have often magnified the controversy due to correlations between different landscape metrics (e.g., edge, isolation, and area), together with these correlative observations, Ibáñez et al. [21] revealed that fragmentation has multiple simultaneous effects that are interwoven in complex ways and potentially operate across longer time periods [22,23,24].
Some studies have received much attention to understand forest fragmentation and human activities over the last three decades [22,23,24]. However, only a few studies showed the relationship at the ecosystem level. One of the main reasons is related to a lack of universally accepted global taxonomy of ecosystems [25]. Specifically, the classification and delimitation of ecosystems have been rarely investigated and are not available in many countries. In addition, studies on analyzing the relationship between fragmentation and land use are lacking in a commonly accepted method for quantifying fragmentation [26]. For example, Butler et al. [26] have produced a forest fragmentation index for western Oregon and western Washington that combined measures of forested area, percentage edge, and interspersion. Likewise, Abdullah and Nakagoshi [27] developed a single forest fragmentation index based on a combination of three landscape metrics, (i) non-forest area, (ii) forest edge, and (iii) patch size coefficient of variation, in the state of Selangor, Malaysia. A main benefit of quantifying forest fragmentation through a single index is that it is feasible to be statistically correlated to different human land use types. Such identification of the impact of human land use on specific forest ecosystem fragmentation can support political justifications for sustainable landscape planning and management [28].
Studies of forest ecosystem fragmentation conducted in the tropical Andes were initiated in the late 1980s [29,30,31,32]. For example, Armenteras et al. [29] have incorporated the degree of fragmentation for ecosystem conservation planning, using five landscape metrics, patch number, largest patch index, mean patch size, mean nearest neighbor distance, and landscape shape index, in the eastern Andes of Colombia.
Ecuador is located in the tropical Andes and known to have one of the largest biodiversity per surface units on Earth, with up to 1250 plant species/km2 belonging to 136 different families [33,34]. Ecuador also covers highly diverse terrestrial ecosystems that exhibit high levels of endemism [35]. Despite its ecological importance, the rate of forest decline and fragmentation has been reported to be the highest in the last 30 years, induced by man-made structures including cities, agricultural land, and oil derricks [36,37,38,39]. The awareness of this situation is promoting a collective shift in empirical studies on biodiversity and biological conservation in the country [40,41,42,43]. From the perspective of natural conservation, one of the most remarkable achievements in Ecuador might be the establishment of an official identification, classification, and delimitation of ecosystems at the national level [44], after an initial framework of the ecosystem classification by Sierra et al. [45] and Josse et al. [46]. However, existing studies indicate that this baseline information regarding the ecosystem classification has not yet fully been exploited, for instance, for generating a monitoring system of national ecosystem changes. Specifically, Cuesta et al. [42] used this ecosystem map and species distribution models to identify focus areas for biodiversity protection in Ecuador. Likewise, MAE [47] attempted to assess ecosystem fragmentation and risk based on the ecosystem map [44], using patch numbers, mean patch size, and a coefficient of variation of patch size. These studies can support current conservation efforts but cannot provide any information regarding the relationship between the degree of forest ecosystem fragmentation and human land use at the ecosystem level, which is useful for the better design of conservation strategies integrated into land use planning and management in Ecuador.
Against this background, we aimed to (i) quantify and schematize the degree of forest fragmentation of 64 natural forest ecosystems in mainland Ecuador during 1990–2000–2008–2014 and (ii) relate the degree of forest fragmentation to human land use at the ecosystem level on different spatial scales. In this study, “ecosystem” was considered as a standard reporting unit for national level assessment, and landscape metrics were utilized to analyze forest fragmentation. This study focused on addressing the following research questions: (i) How has forest fragmentation in the tropical Andes occurred at the ecosystem level over recent decades? (ii) What types of human land use led to the current forest ecosystem fragmentation in the tropical Andes?
By understanding the knowledge gaps between forest conservation strategies and actual practices employed in human land use, we suggested ecosystem-level conservation implementation for land-use-related planning and sustainable development.

2. Materials and Methods

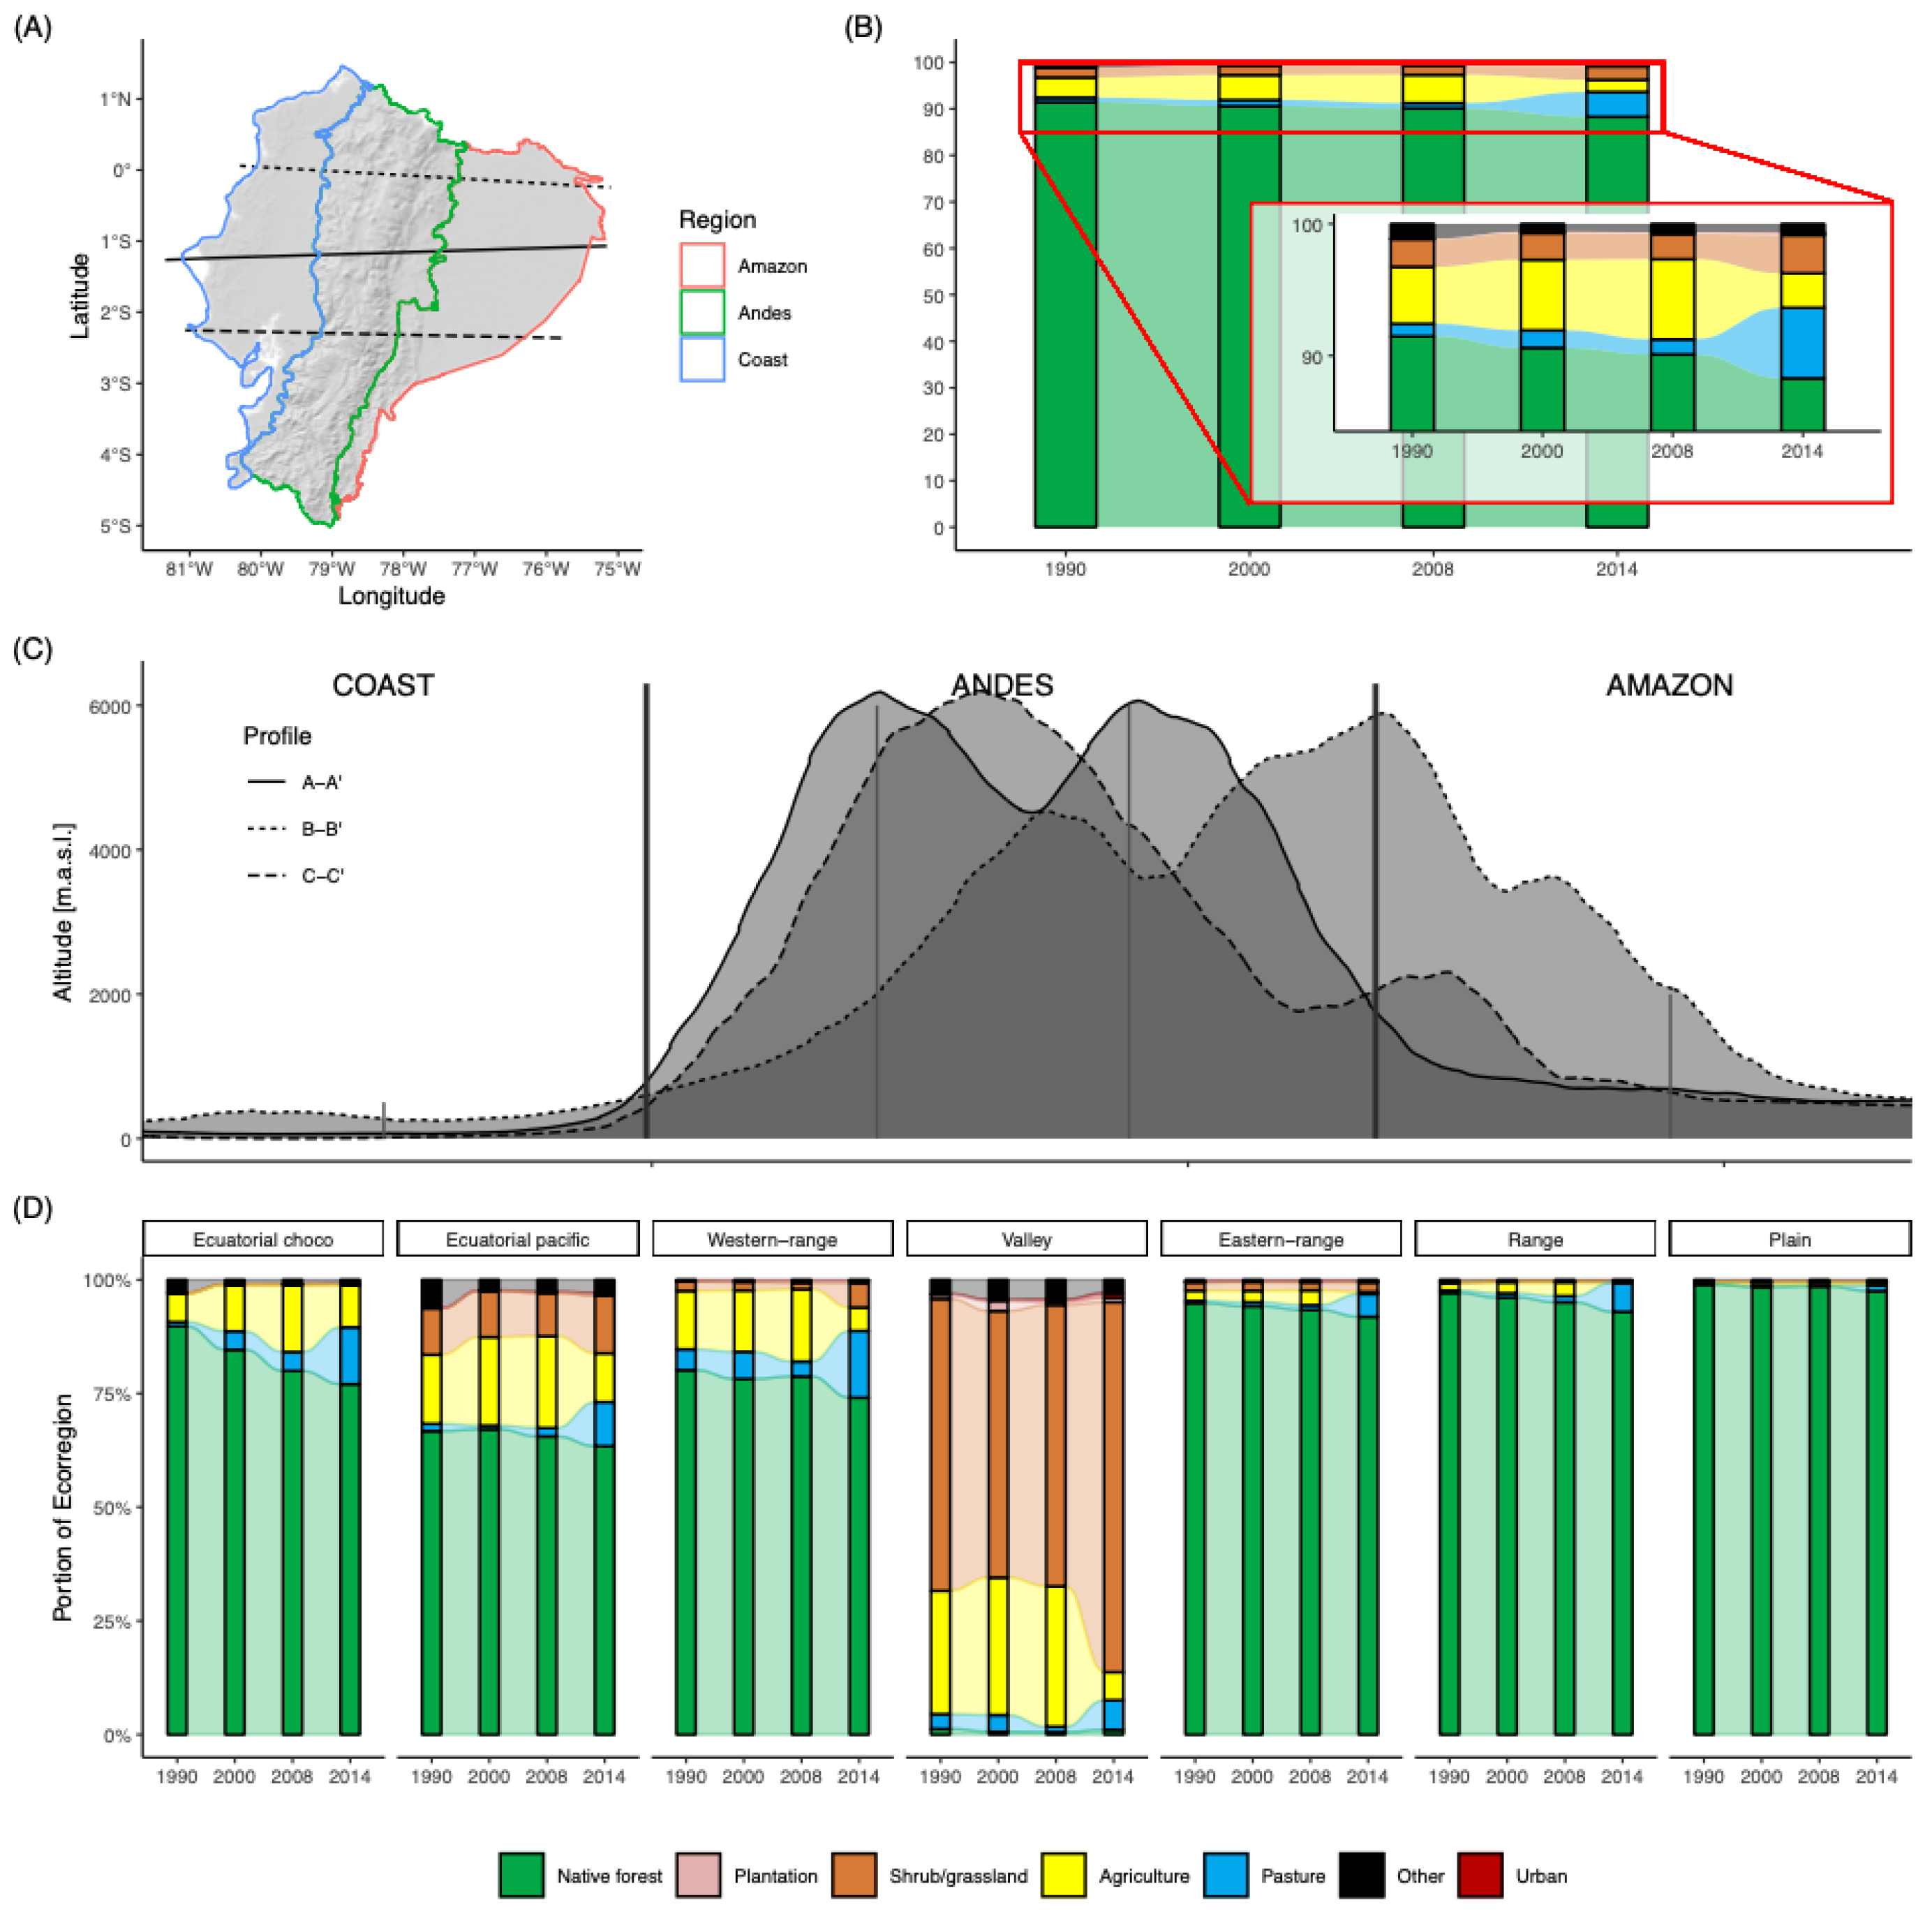
2.1. Dataset for the Ecosystems and Land Cover Classification

The baseline information applied in this study is based on satellite images (Landsat–5 TM) obtained in 1990, 2000, 2008, and 2014. They were classified by the Ecuadorian Ministry of Agriculture (MAGAP), Ministry of the Environment and Water (MAE; renamed in 2021 to the Ministry of Environment, Water and Ecological Transition - MAATE), and National Spatial Institute (IEE), using LANDSAT 4 and 5 TM for 1990, LANDSAT ETM+ for 2000, LANDSAT ETM+ and ASTER for 2008 [48], and LANDSAT 8 OLI, LANDSAT ETM+, and RapidEye satellite images for 2014 [49]. The maps of 1990, 2000, and 2008 were generated by unsupervised classification [50], except the thematic map of 2014, which was classified by supervised classification using field survey data regarding monitoring results of land use types in at least 30 sites. The supervised classification was carried out by the MAE, which contemplated the grouping procedures of the pixels of an image according to their spectral similarity, the level of detail, and the thematic legend established a priori. For this purpose, pixels of a group were selected and delimited on the original image, which represented the patterns of the different thematic classes. The error was minimized by editing the classes that grouped values belonging to others by comparing the classification with the image. Finally, the vegetation cover layers and ecosystems obtained from the satellite images were validated in the field through 421 calibration and validation points in the years 2011 and 2012 [44].
In a large scale, continental Ecuador is divided into the three natural regions (biomes): Coast, Andes, and Amazon [51] (Figure 1). In each region, the livelihood strategies and land use patterns vary according to the climate and vegetation [52,53]. In this study, 15 land cover types were considered for the land use change analysis (Table 1). Furthermore, human land uses were distinguished by seven different land cover types: industrial plantation (PLT), pasture (PST), annual crops (AFM), permanent crops (PFM), semi-permanent crops (SFR), inhabited area (HBT), and infrastructure (IFR). In this study, land use was considered as a categorical variable that describes the main activity type. Due to separating pasture from natural grassland and/or abandoned agricultural land, uncertainty in the results might have occurred due to classification errors or shifts in categories. To conduct the analysis of ecosystem-level deforestation and forest fragmentation, this study included four sub-classes of native forest, which cover about 14 million hectares:
  • Higher mountain forest: The height of trees reaches 10–15 m with thick and sometimes gnarled trunks and adventitious roots occupying up to 70 m2 [45,54].
  • Cloud mountain forest: The height of trees reaches 15–25 m. The underwood is very rich, and epiphytes and mosses are very abundant. Persistent presence of fog at the vegetation level significantly reduces incident solar radiation and evapotranspiration [55].
  • Lower mountain forest: The height of canopy can reach 20–35 m and trees of 40 m are sporadically located. The forest is composed of different layers such as canopy, sub-canopy, shrub, and herbaceous species [34].
  • Foothill forest: Forest transition occurs between the foothills of eastern and western ranges and Amazonian forests. Substrate is mainly composed of volcanic rock and sediment of recent origin. The height of the canopy reaches 30 m and sub-canopy and understory are very dense [56].
Table 1. Description and source of land cover types defined in the study area.
Main Land UseNo.Land Cover TypeDescriptionSource
Forest1Native forestVegetation with native tree species, including higher mountain forest, cloud mountain forest, lower mountain forest, and foothill forest.[44,57]
Shrub/Grassland2ShrublandArea with a substantial component of non-tree native woody species. It includes degraded areas in transition to dense shrub layer.[44,57]
3GrasslandNative grassland with spontaneous growth which do not receive special care, and use for sporadic grazing or protection.[44,58]
4PáramoTypical ecosystem of the tropical Andes, located above 3400 m.a.s.l. Vegetation can reach 50 cm in height.[44,58]
Industrial plantation5Industrial plantation (PLT)Vegetation with exotic/non-native species, including young and harvested plantations.[58]
Pasture6Pasture (PST)Cultivated grassland, dominated by introduced species of Gramineas and Legunimosas, for feeding livestock.[58]
Agriculture7Annual crops (AFM)Cultivated land for annual crops.[58]
8Permanent crops (PFM)Mainly orchards and permanent crops and vegetables.[58]
9Semi-permanent crops (SFM)Cultivated land for 2- or 3-year-cycle crops.[58]
Urban10Inhabited area (HBT)Land mainly occupied by housing and buildings for communities and public services. [58]
11Infrastructure (IFR)Land occupied by roads, industry, and other anthropogenic surfaces (e.g., shrimp fishery).[58]
Others12Natural waterLand occupied by natural water bodies such as small lakes and ponds.[58]
13Artificial waterLand or flowing water associated with anthropic activities and water resource management.[58]
14Bare groundCleared land, rocks, and river beds.[58]
15GlacierSnow and ice.[58]
We followed the selection of forest ecosystems as described in Noh et al. [8]. The definition, classification, and delimitation of a total 91 national territorial ecosystems were established and completed on the basis of the following factors (87 natural ecosystems with 4 other systems such as areas of human intervention, water, other areas, and no information): (1) physiognomy, (2) bioclimate, (3) biogeography, (4) geoform, (5) general flooding, (6) phenology, (7) bioclimatic floor, and (8) substratum [44].
According to the vegetation physiognomic classification (forest, shrubland, and grassland), we selected 64 forest ecosystems, including 2 mangroves (Table 2), among the 87 natural territorial ecosystems in all of Ecuador.

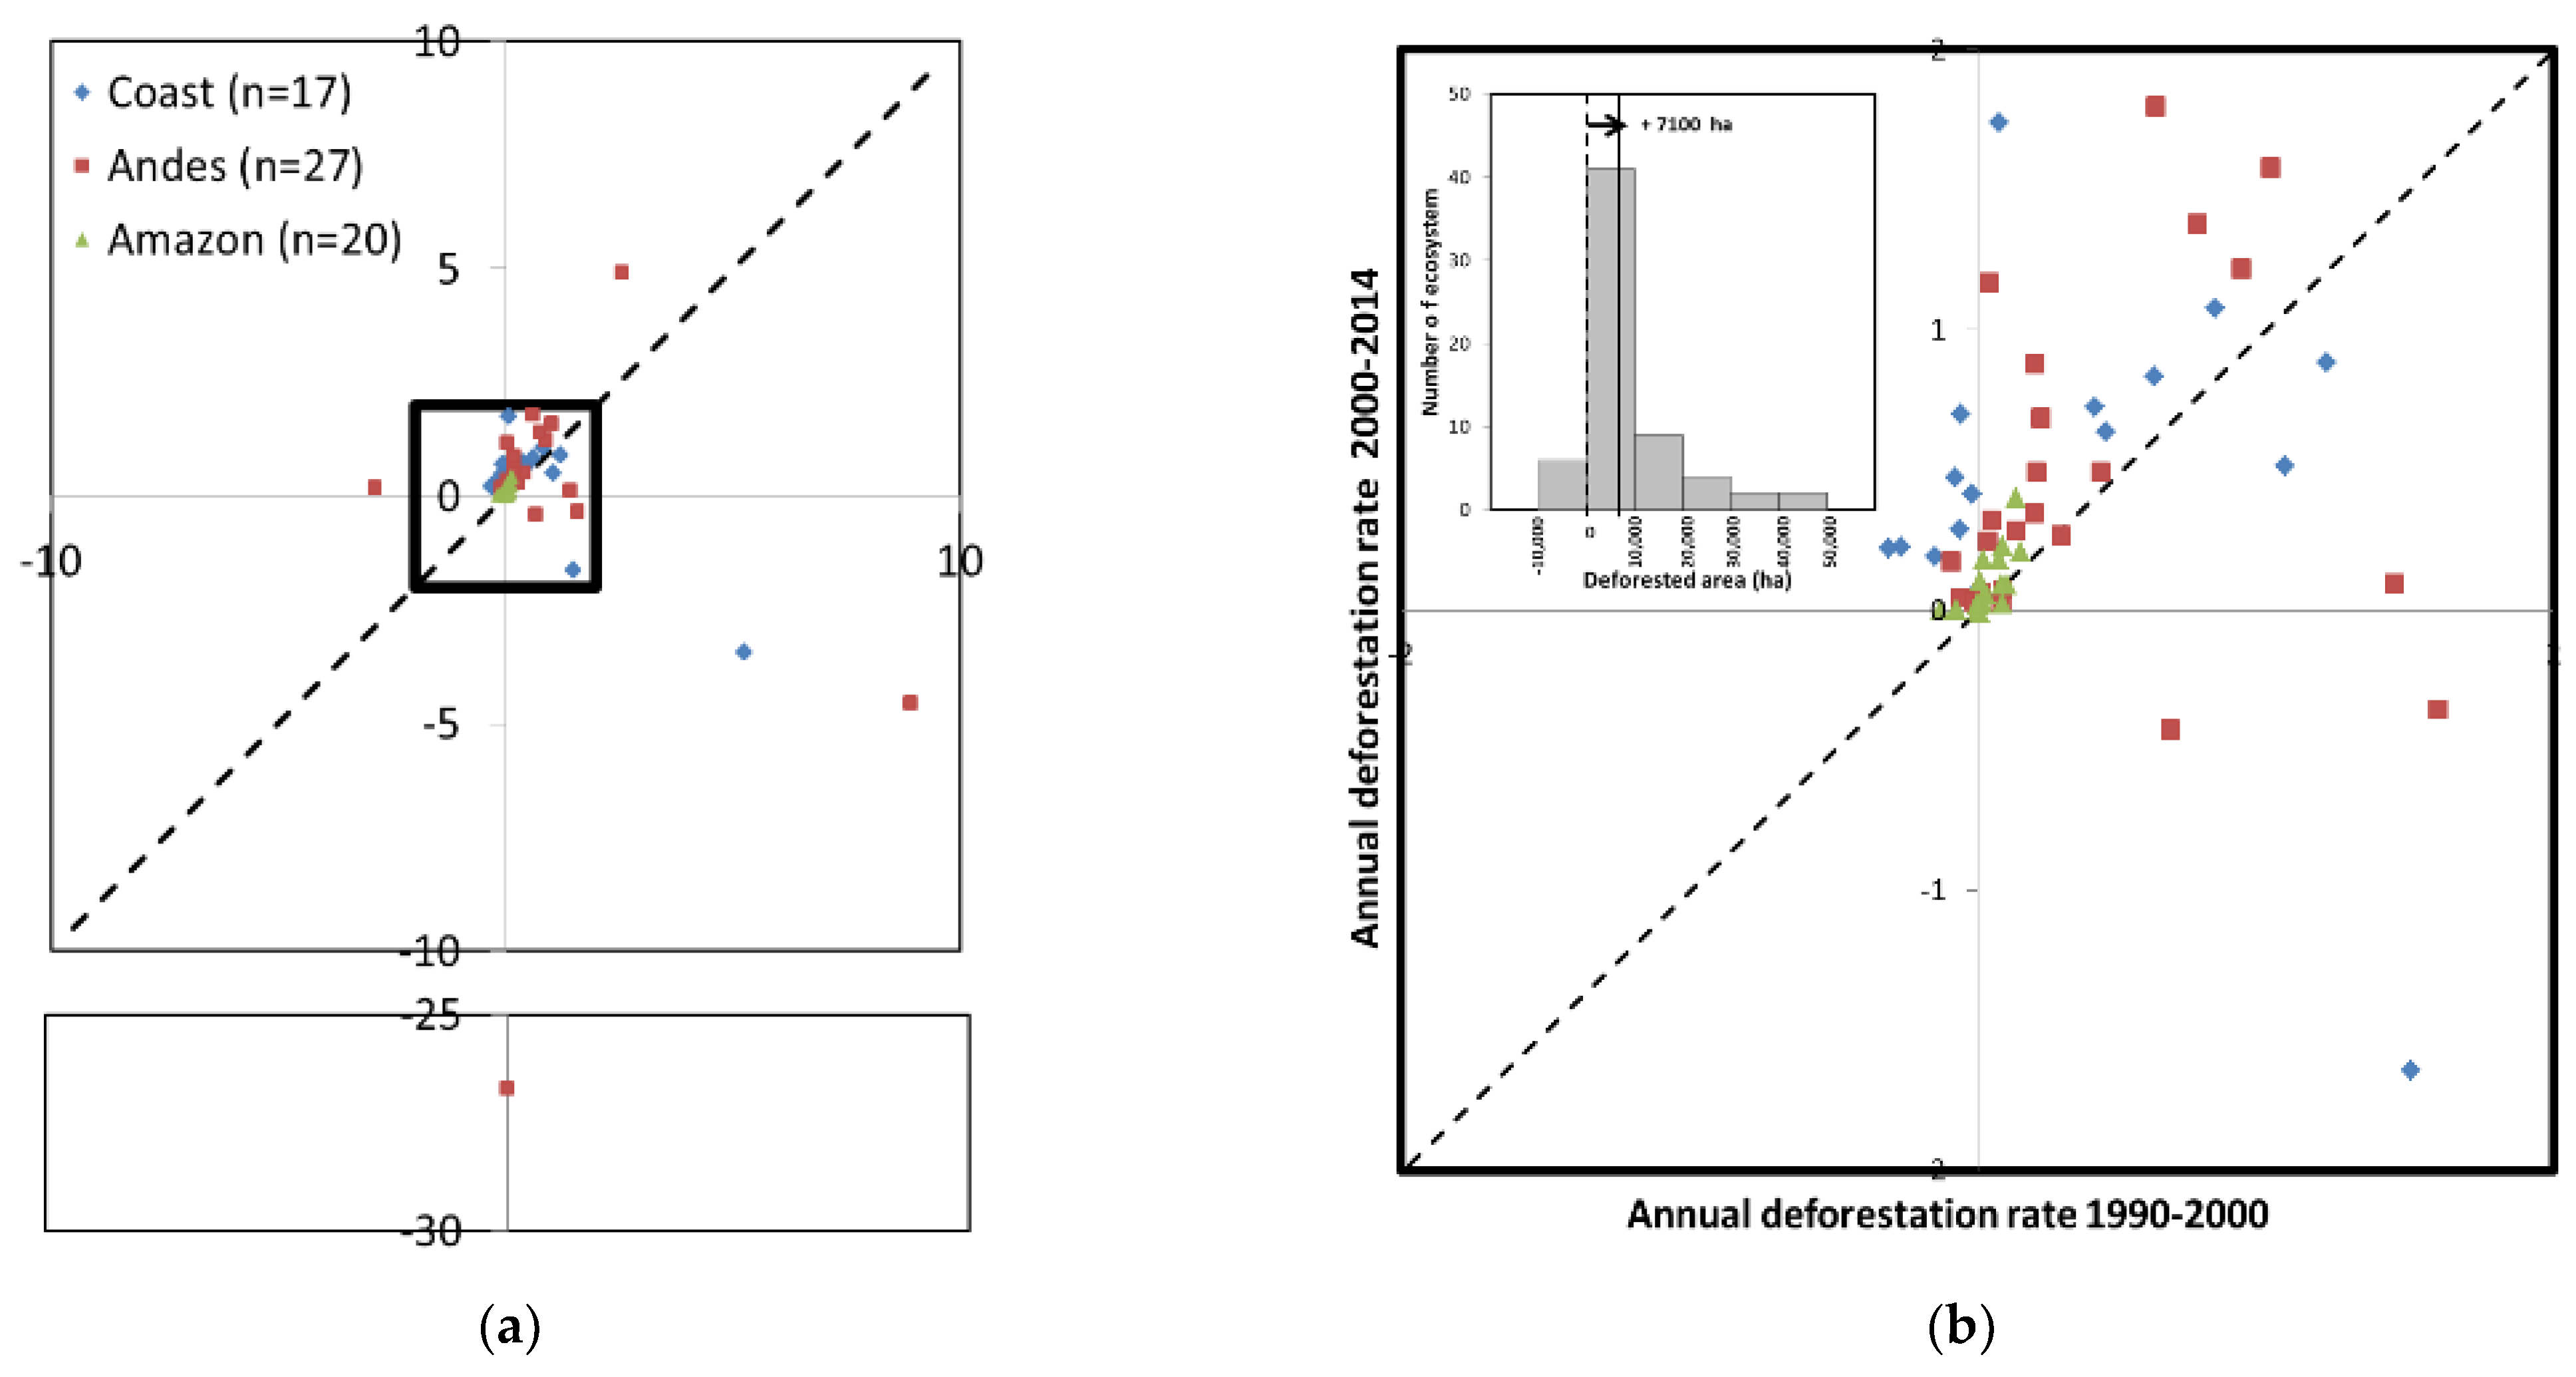
2.2. Deforestation Rate, Land Cover Change Rate, and Forest Fragmentation

The annual deforestation rate was calculated by the formula proposed by Puyravaud [59]:
P = 100 t 2 t 1 l n A 2 A 1
where P is the annual deforestation rate (in%/year), A 1 and A 2 are the forest cover at time t 1 and t 2 .
In order to calculate the change rate of land cover types, a cross-tabulation procedure between the different land cover types was processed with ArcGIS 10.5; gains and losses were calculated as proposed by Pontius et al. [60]. Fragmentation analyses were performed using the approach presented in existing studies [61,62]. Specifically, Forest Area Density (FAD) is a simple metric of fragmentation which is calculated as the percentage of forest pixels in a fixed-area neighborhood. In the present study, we evaluated FAD with a moving window size of 27 × 27 pixels and the FAD values were classified into the following five classes (Table 3).
To characterize forest fragmentation in each forest ecosystem, we redefined the thresholds for the continuous forest (≥40%) and non-continuous forest (<40%) [63]. Accordingly, forest fragmentation index (FFI) was defined as a proportion of non-continuous forest in each ecosystem.

2.3. Analysis

The relationship between FFI and current human land use was tested through a regression analysis based on Abdullah and Nakagoshi [27]. The independent variables were the percentage of the 7 human land use types in each forest ecosystems in 2014 (Table 1). The dependent variables were FFI of grouping ecosystems that share a common set of the following biogeographic characteristics and forest fragmentation rate: (1) region and (2) FFI degree in 2014. All statistical analyses were conducted by using the open-source software R (version 3.2.2).

3. Results

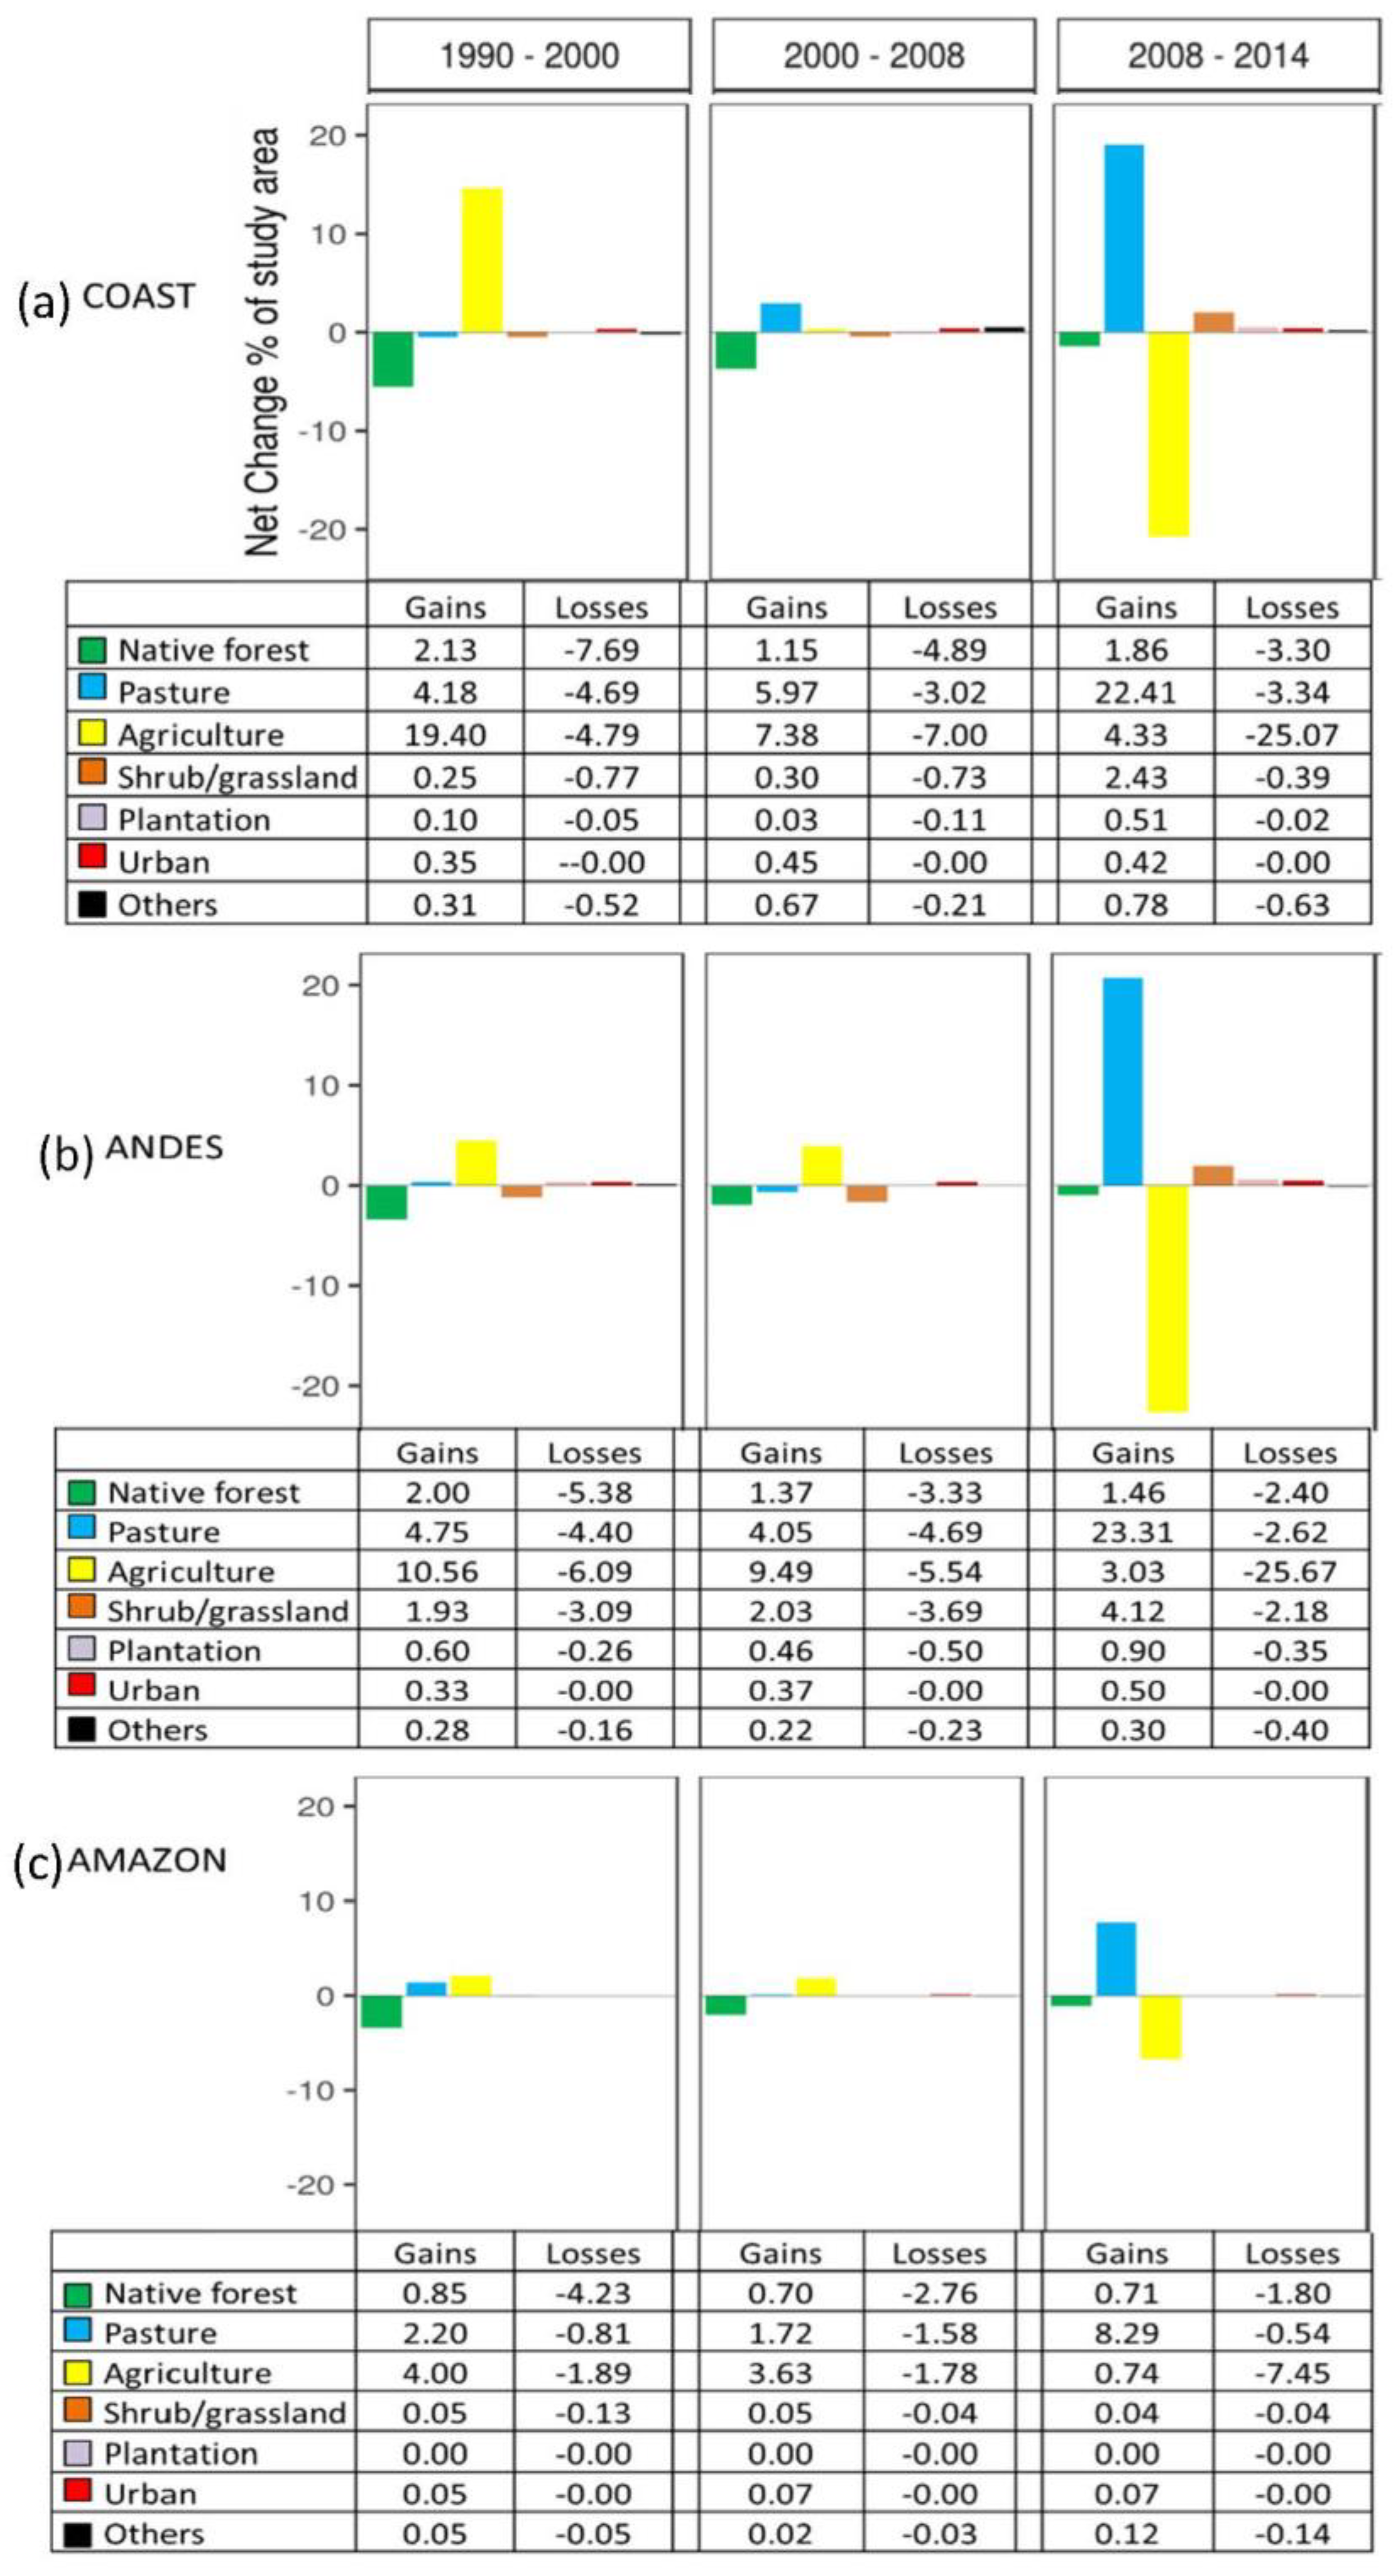
3.1. Land Use Change in Forest Ecosystems

Between 1990 and 2014, approximately 454,000 hectares of native forests were cleared in the analyzed 64 forest ecosystems of mainland Ecuador, averaging 7100 hectares per single ecosystem (Figure 2b). An increase in the deforestation rate between 1990–2000 and 2000–2014 in the 64 forest ecosystems was statistically significant. The mean difference in deforestation rate was 0.6%, 95% CI for mean = −0.15, 0.45; student’s paired sample t test, t = 2.18, df = 63, ρ < 0.01. In the 64 forest ecosystems, E44 showed the highest annual deforestation rate of 3.95%, followed by 1.34% in E23 and 1.30% in E32. In 2014, the percentage of forest cover was below 10% in six forest ecosystems: E33 (0.11%), E35 (1.7%), E34 (3.44%), E32 (5.65%), and E17 (7.4%) (A.2). During the whole study period, forest area was recovered in five forest ecosystems: E4 (8.3%), E33 (1700%), E35 (29.69%), E56 (0.70%), and E64 (0.03%).
In forest ecosystems, human land use (agriculture, industrial plantation, urban, and pasture) showed a rapid increase of 54% over 24 years (Figure 1B). Agriculture was the major anthropogenic land use in 1990 (4.3%), 2000 (5.4%), and 2008 (6.1%), but it declined to 2.6% by 2014. In 2014, pasture, rising from 1.1% in 2008 to 5.4% in 2014, became the largest single human land cover class. The other notable features of the data are the relatively stable proportion of the natural shrubland/grassland (≈2%) during 1990 to 2008 and an increase (≈3%) in 2014. A slowly increased tendency over the whole study period was shown for industrial plantation and urban area.
Land cover changes did not occur at equal rates during all time intervals in the three regions (Figure 3). The most intensive changes were observed in the Coast, where frequent exchanges between pasture and agricultural land as well as pasture, shrubland, and agricultural land (particularly rotations between pastures, herbaceous crops, and fallow cycles) were found. The most consistent trend of inter-class changes between 2008 and 2014 was a progressive increase in pasture at the expense of agriculture and native forest. On the other hand, a slight increase in urban area was shown in all regions over the entire study period.

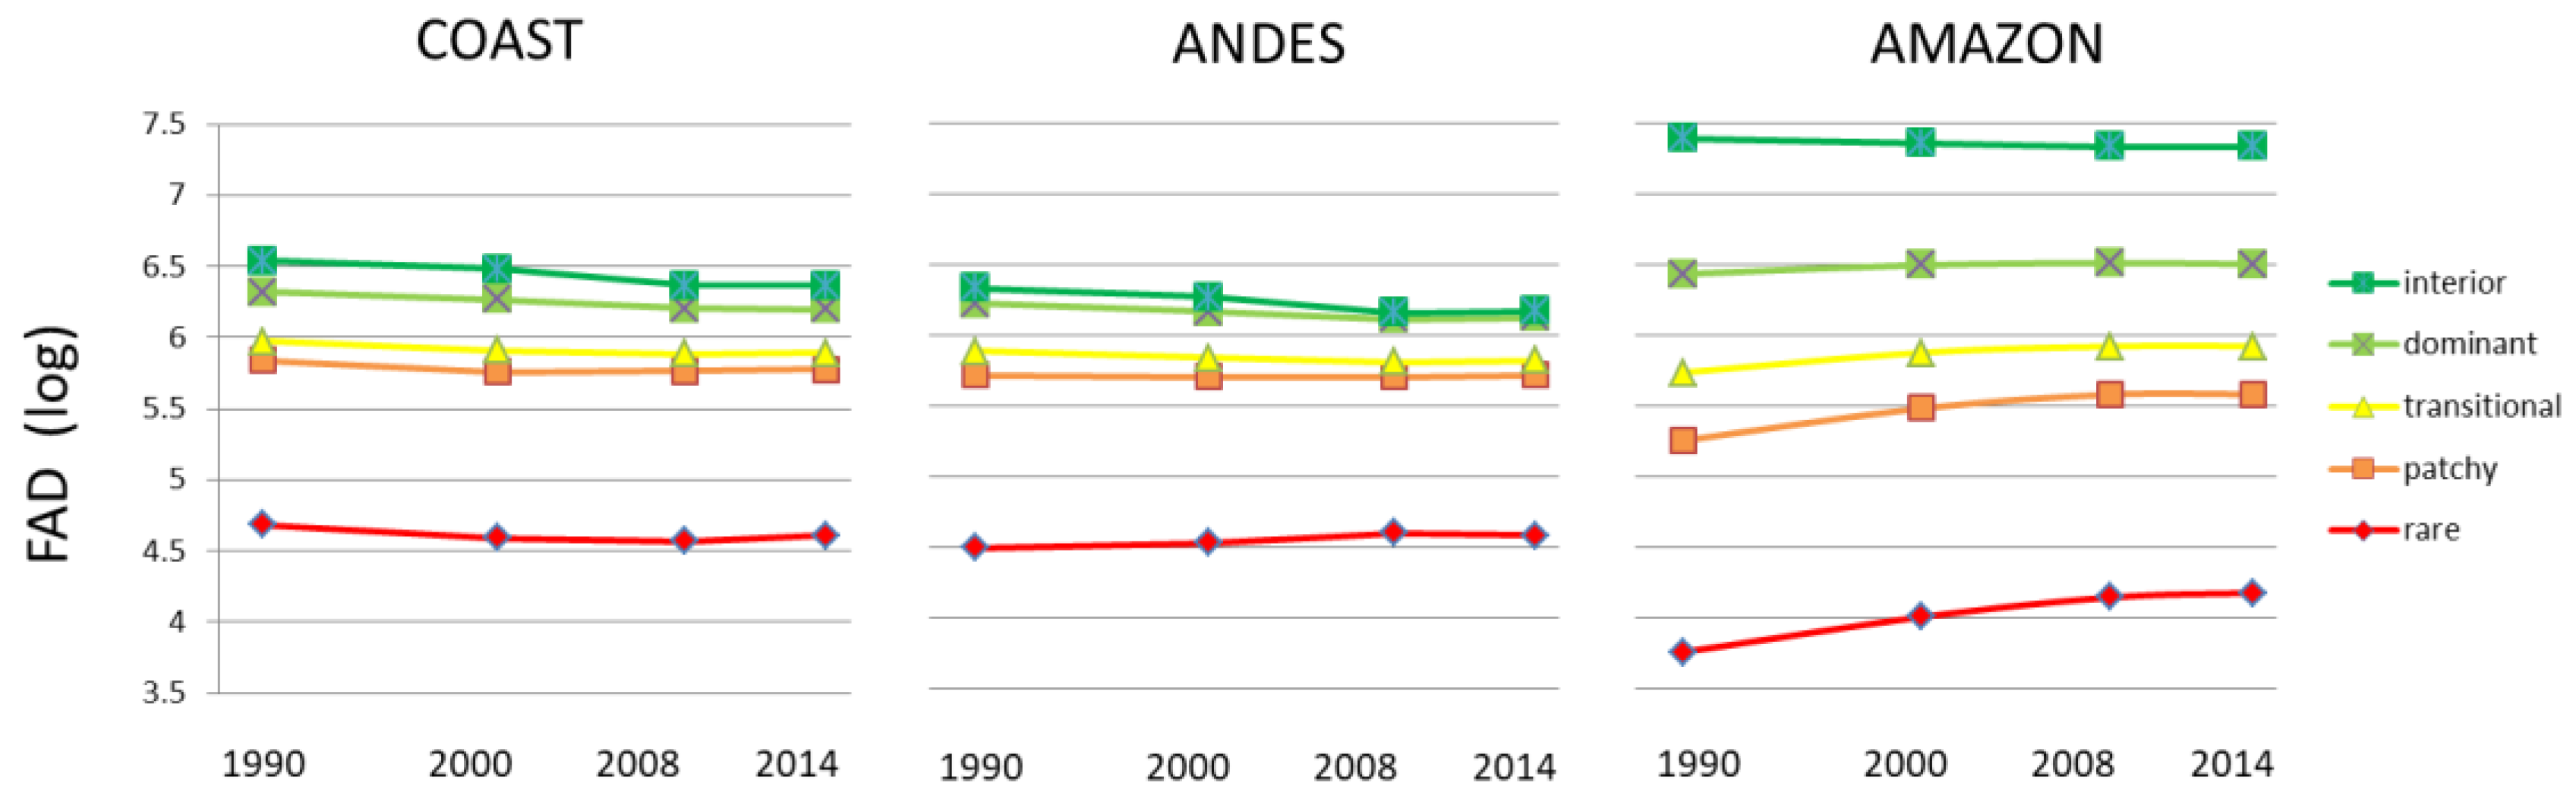
3.2. Degree of Forest Fragmentation

By 2014, continuous fragmentation became the dominant process, owing to a decline in the number of interiors, dominant FAD, and a slight increase in patchy and rare FAD in the Coast and Andes (Figure 4). In the Amazon, forest fragmentation was accompanied by the rapid increase in the number of patchy and rare FAD. Amount of interior FAD decreased following the introduction of these disturbed fragments into the matrix.
According to the different degree of forest fragmentation across 64 forest ecosystems (A.1 in Annex), the FFI varied between 0.67 (non-fragmented) and 68.76 (highly fragmented) in 2014. The FFI in 2014 was highest for the Semideciduous forest and shrubland of the North Valleys (E33), while the lowest FFI was observed in Evergreen bamboo forest of the Amazonian lowland (E62).

3.3. Relationship between Forest Fragmentation and Human Land Use

Increasing human land use had a significantly positive correlation on forest fragmentation in all forest ecosystems of Ecuador (Table 4). At the national level, a significantly positive relationship was constantly found between forest fragmentation and two human land uses: pasture (PST) and inhabited area (HBT). Additional results at the regional level were presented in more detail because of its practical utility for conservation management (Table 4). In the Andes, we could detect a statistically robust effect of pasture (PST) and inhabited area (HBT) in forest ecosystems. The regional regression model indicated that forest fragmentation was mostly explained by permanent (PFM) and semi-permanent crops (SFM), and inhabited area (HBT) in the Andes, and pasture (PST) in the Amazon, respectively.
The regression models based on the FFI value indicated that forest fragmentation had a mostly positive relationship with pasture (PST) in forest ecosystems with low, moderate, and high fragmentation in 2014 (Table 5). Forest fragmentation in highly fragmented ecosystems was additionally explained by permanent (PFM) and semi-permanent crops (SFM) and infrastructure (IFR). Forest ecosystems with low fragmentation also showed a positive significant relationship between forest fragmentation and several additional human land uses, industrial plantation (PLT) and annual crops (AFM).

4. Discussion

The understanding of the interactions between forest structure changes in forest ecosystems and land use should be based on the information regarding what changes happen as an initial step [65]. This study aimed at providing some of this relevant information using comparative analyses across different spatial scales of the forest ecosystems in Ecuador.

4.1. Forest Fragmentation at Regional Level

With respect to the three regions of mainland Ecuador, the coastal forest ecosystems showed the most severe changes from significant forest conversion by land use in this study, even though we could not detect any statistically robust effect of land use on forest structure change (Figure 1 and Figure 3). This region is characterized by the agriculture expansion and the increase in urban area [45,66,67]. Specifically, the equatorial pacific is under higher transformation trends from native forest to human land use than the equatorial Chocó. The Andes is the region which showed the largest gap between human land use and conservation efforts. Even though many studies set priorities for forest conservation efforts in the tropical Andes [35,68], we observed that natural forest ecosystems in Andean valley and alpine (paramo) have a very low proportion of native forests due to land use changes [69]. Because the western Andes areas are less protected than the eastern Andes, human land use occupied the west more than the east Andes where forest fragmentation was caused by cattle grazing which resulted in pastures (Table 1). The expansion of agropastoral land use was recognized as the main reason for deforestation and forest conversion in the Andes [70,71]. Because a higher rate of deforestation was recently reported in the Amazonian region [49], we expected a significant impact of human land use on native forest ecosystems in this region. In our analysis, human land use was observed less than expected in the Amazon region. This unpredictability of human land use in forest ecosystems in the Amazon may be explained by the larger forest extension of the region compared to the Coast and the Andes.
Results using species as conservation targets may differ from the studies using an ecosystem level approach. For example, from a species-based perspective, Lessmann et al. [43] suggested that more conservation efforts are needed in the northern Amazon that represents high species richness. Since not all areas with high conservation importance are under the same level of threat from transformation or degradation [72,73], it is noteworthy that ecosystem level conservation should be acknowledged apart from a species-only approach (e.g., based on richness or endemism). Based on these considerations, our results show that mainly natural ecosystems on the Coast and in the Andes are at risk.

4.2. Patterns of Forest Ecosystem Changes

Our most remarkable finding is identifying the different patterns and rates of forest ecosystem changes at the nationwide ecosystem level. Although slight forest loss and fragmentation was observed between 1990 and 2014 in the 64 natural forest ecosystems of Ecuador, we identified seriously modified systems among them. For example, the share of native forest in several ecosystems is alarming: only 0.11% of native forest in Semideciduous forest and shrubland of the North Valleys remained in 2014 (Table S1). Along with the decline of forest distribution, the ecosystem seems to have undergone a transformation of identity over the entire range. Likewise, the results revealed non-linear dynamic changes in forest structure in many ecosystems of Ecuador (Table S2). Importantly, Suding and Hobbs [74] addressed that such a critical threshold of rapid and unexpected change in natural ecosystems could be observed when, for the most part, human activities cause frequent land-use changes. As Ecuador is dominated by patterns of small-holder land use that reflects fragmented and heterogeneous livelihood strategies, our results seem to be explained by frequent land use change by human activities. These non-linearly changing ecosystems (Table S2) can be characterized by pressure on resource use and short fallow shifting cultivation as a type of rotational land use (e.g., forest–pasture–shrubland or forest–shrubland–pasture-crop) [75]. Forest conversion to pasture for cattle grazing has been one of the main reasons for deforestation in tropical forests [76,77,78,79]. In southern Ecuador, a high deforestation rate is reported by the conversion to pastures, despite its highly diverse forest ecosystems. Although these cultivated or fallow lands are abandoned after several years, the very slow natural regeneration is detected by increasing forest fragmentation [80,81]. Zahawi and Augspurger [82] found that herbaceous species dominated in early plant succession of abandoned pastures in the Ecuadorian Andes, whereas a successional trajectory toward a forested condition (secondary forests) was estimated between 20 and 30 years. Therefore, in most Ecuadorian forest ecosystems, losses and gains of native forests are treated as equal when calculating net change, but the loss of primary native forest is qualitatively different from the gain of early-successional secondary forests.

4.3. Conservation Implications and Recommendations

Bearing in mind the above, Ecuadorian policies were developed in response to the issue of forest loss and change from the 2000s. Although Ecuador is a relatively small country, it has 44 nationally protected areas that cover approximately 19% of the entire surface [36,83]. Ecuador is also known as a leader in the debate to have avoided deforestation credits “recognized by international climate-change conventions” [9]. In addition, the Ecuadorian government has invested approximately 56 million USD in the direct payment program “Socio Bosque” to achieve native forest conservation. Regarding the government´s goal of avoiding deforestation, there are three important lessons that can be learned from this study. First, it is important to optimize the protection efficiency in forest ecosystems. We observed a lack of protection in ecosystem types with small extension and/or high fragmentation, which may result in conservation gaps for species and ecosystems in the country [43]. Although establishing a new area under protection is a long and difficult process linking to conflicting interests of all relevant stakeholders, it will be necessary to create appropriate conditions for the participation and cooperation of the private sector in the planning and implementation of conservation initiatives in these forest ecosystems. Secondly, the main conservation challenge in the highly fragmented forest ecosystems is the extensive transformation of the natural ecosystems by human activities. However, small patches of native forest remain in these ecosystems. Therefore, forest structure in highly fragmented ecosystems could improve by following landscape approaches: (1) creating buffers around native forests to mitigate forest fragmentation trends, (2) connecting fragments of native forests in order to enhance landscape connectivity, and (3) identifying and developing adapted land use plans based on the remnant small-size patches to enhance ecosystem persistence and resilience [84]. Finally, multilateral collaboration among relevant ministries is vitally important to provide a national strategic opportunity, not only to share ideas but to identify critical issues for sustainable development. For example, results of this study, which indicated the forest transition to pasture, can be related to the establishment of regulation of payment for quality of raw milk (RPQM) issued and implemented in Ecuador by Regulation 1042 from 2008 [85]. Because the implementation of the RPQM defined fixed payment per liter [86], this economic opportunity may have caused unintended deforestation due to small and medium producers’ land use decisions in recent decades.

5. Conclusions

This study is based on a broad analysis of how forest fragmentation at the ecosystem level has been affected by land use on different spatial scales. Our analysis provides a better understanding the changes in ecosystems influenced by human land use in Ecuador. By illuminating the critical gaps between forest conservation strategies and actual practices employed in human land use, we suggested implementation of conservation efforts at ecosystem level for adapted land use planning and sustainable development in Ecuador, which requires significant changes in present policies, institutions, and practices that are not currently under way.

Supplementary Materials

The following supporting information can be downloaded at: https://0-www-mdpi-com.brum.beds.ac.uk/article/10.3390/land11020287/s1, Table S1: The major land cover types and changes of ecosystem (n = 64) in 1990, 2000, 2014, and 2014, Table S2: Forest fragmentation patterns used fragmentation index value of 1990, 2000, 2008, and 2014 in 64 forest ecosystems.

Author Contributions

Conceptualization, J.K.N., P.C. and C.E.; methodology, J.K.N., P.C. and C.E.; investigation, J.K.N.; data curation, G.G., J.K.N. and P.C.; formal analysis, J.K.N., P.C. and G.G.; supervision, J.K.N., P.C. and C.E.; writing—original draft, J.K.N., P.C. and C.E.; writing—review and editing, J.K.N., P.C., J.K., H.K. and C.F.; project administration, J.K., H.K., P.C. and J.K.N.; funding acquisition, J.K., J.K.N., P.C. and C.F. All authors have read and agreed to the published version of the manuscript.

Funding

This research was conducted in the project Ecu-MAES “A National Ecosystem Services Assessment and Mapping for the status and future development of ecosystem services and biodiversity”. The project was funded by the German Academic Exchange Service (DAAD) from funds of the German Society for International Cooperation (GIZ) GmbH on behalf of the Federal Ministry for Economic Cooperation and Development (BMZ).

Data Availability Statement

The data presented in this study are available at http://www.geoportaligm.gob.ec/portal/ (accessed on 21 August 2020), http://ide.ambiente.gob.ec/mapainteractivo/ (accessed on 21 August 2020).

Acknowledgments

We would like to thank the Ministry of the Environment, Water and Ecological Transition (MAATE) of Ecuador for providing several data sources and Global Change Laboratory of the University Ikiam for their valuable assistance. J.K. Noh acknowledges financial support from CONICYT (Comisión Nacional de Investigación Científica y Tecnológica) of Chile, KOICA (Korea International Cooperation Agency), and KNA (Korea National Arboretum).

Conflicts of Interest

The authors declare no conflict of interest.

References

  1. Millennium Ecosystem Assessment. Ecosytems and Human Well-Being: Policy Responses; Island Press: Washington, DC, USA, 2005. [Google Scholar]
  2. Díaz, S.; Settele, J.; Brondízio, E.S.; Ngo, H.T.; Agard, J.; Arneth, A.; Balvanera, P.; Brauman, K.A.; Butchart, S.H.M.; Chan, K.M.A.; et al. Pervasive human-driven decline of life on Earth points to the need for transformative change. Science 2019, 366, eaax3100. [Google Scholar] [CrossRef] [Green Version]
  3. Hobbs, R.J.; Higgs, E.; Harris, J.A. Novel ecosystems: Implications for conservation and restoration. Trends Ecol. Evol. 2009, 24, 599–605. [Google Scholar] [CrossRef]
  4. Holl, K.D.; Aide, T.M. When and where to actively restore ecosystems? For. Ecol. Manag. 2011, 261, 1558–1563. [Google Scholar] [CrossRef]
  5. Laurance, W.F.; Lovejoy, T.E.; Vasconcelos, H.L. Ecosystem Decay of Amazonian Forest Fragments: A 22-Year Investigation. Conserv. Biol. 2002, 16, 605–618. [Google Scholar] [CrossRef] [Green Version]
  6. Letcher, S.G.; Chazdon, R.L. Lianas and self-supporting plants during tropical forest succession. For. Ecol. Manag. 2009, 257, 2150–2156. [Google Scholar] [CrossRef]
  7. Turner, M.G. Disturbance and landscape dynamics in a changing world. Ecology 2010, 91, 2833–2849. [Google Scholar] [CrossRef] [Green Version]
  8. Noh, J.K.; Echeverria, C.; Kleemann, J.; Koo, H.; Fürst, C.; Cuenca, P. Warning about conservation status of forest ecosystems in tropical Andes: National assessment based on IUCN criteria. PLoS ONE 2020, 15, e0237877. [Google Scholar] [CrossRef]
  9. Cuenca, P.; Robalino, J.; Arriagada, R.; Echeverría, C. Are government incentives effective for avoided deforestation in the tropical Andean forest? PLoS ONE 2018, 13, e0203545. [Google Scholar] [CrossRef] [Green Version]
  10. Taubert, F.; Fischer, R.; Groeneveld, J.; Lehmann, S.; Müller, M.S.; Rödig, E.; Wiegand, T.; Huth, A. Global patterns of tropical forest fragmentation. Nature 2018, 554, 519–522. [Google Scholar] [CrossRef]
  11. Duraiappah, A.K.; Naeem, S. The Role of Soil Microbiology in Restoration. Millennium Ecosystem Assessment; Cranfield University: Bedford, UK, 2005. [Google Scholar]
  12. Wilcove, D.S.; McLellan, C.H.; Dobson, A.P. Habitat fragmentation in the temperate zone. Conserv. Biol. 1986, 6, 237–256. [Google Scholar]
  13. Wang, X.; Blanchet, F.G.; Koper, N. Measuring habitat fragmentation: An evaluation of landscape pattern metrics. Methods Ecol. Evol. 2014, 5, 634–646. [Google Scholar] [CrossRef]
  14. Midha, N.; Mathur, P. Assessment of forest fragmentation in the conservation priority Dudhwa landscape, India using FRAGSTATS computed class level metrics. J. Indian Soc. Remote Sens. 2010, 38, 487–500. [Google Scholar] [CrossRef]
  15. Hargis, C.D.; Bissonette, J.A.; David, J.L. The behavior of landscape metrics commonly used in the study of habitat fragmentation. Landsc. Ecol. 1998, 13, 167–186. [Google Scholar] [CrossRef]
  16. Fahrig, L. Effect of Habitat Fragmentation on the Extinction Threshold: A Synthesis. Ecol. Appl. 2002, 12, 346–353. [Google Scholar] [CrossRef]
  17. Echeverria, C.; Coomes, D.; Salas, J.; Rey-Benayas, J.M.; Lara, A.; Newton, A. Rapid deforestation and fragmentation of Chilean Temperate Forests. Biol. Conserv. 2006, 130, 481–494. [Google Scholar] [CrossRef]
  18. Cain, D.H.; Riitters, K.; Orvis, K. A multi-scale analysis of landscape statistics. Landsc. Ecol. 1997, 12, 199–212. [Google Scholar] [CrossRef]
  19. Hermosilla, T.; Wulder, M.A.; White, J.C.; Coops, N.C.; Pickell, P.D.; Bolton, D.K. Impact of time on interpretations of forest fragmentation: Three-decades of fragmentation dynamics over Canada. Remote Sens. Environ. 2019, 222, 65–77. [Google Scholar] [CrossRef]
  20. Fischer, R.; Taubert, F.; Müller, M.S.; Groeneveld, J.; Lehmann, S.; Wiegand, T.; Huth, A. Accelerated forest fragmentation leads to critical increase in tropical forest edge area. Sci. Adv. 2021, 7, eabg7012. [Google Scholar] [CrossRef]
  21. Ibáñez, I.; Katz, D.S.W.; Peltier, D.; Wolf, S.M.; Connor Barrie, B.T. Assessing the integrated effects of landscape fragmentation on plants and plant communities: The challenge of multiprocess–multiresponse dynamics. J. Ecol. 2014, 102, 882–895. [Google Scholar] [CrossRef] [Green Version]
  22. Arroyo-Rodríguez, V.; Melo, F.P.L.; Martínez-Ramos, M.; Bongers, F.; Chazdon, R.L.; Meave, J.A.; Norden, N.; Santos, B.A.; Leal, I.R.; Tabarelli, M. Multiple successional pathways in human-modified tropical landscapes: New insights from forest succession, forest fragmentation and landscape ecology research. Biol. Rev. 2017, 92, 326–340. [Google Scholar] [CrossRef]
  23. Batar, A.K.; Watanabe, T.; Kumar, A. Assessment of Land-Use/Land-Cover Change and Forest Fragmentation in the Garhwal Himalayan Region of India. Environments 2017, 4, 34. [Google Scholar] [CrossRef] [Green Version]
  24. de Oliveira, B.R.; Carvalho-Ribeiro, S.M.; Maia-Barbosa, P.M. Rio Doce State Park buffer zone: Forest fragmentation and land use dynamics. Environ. Dev. Sustain. 2021, 23, 8365–8376. [Google Scholar] [CrossRef]
  25. Keith, D.A.; Rodríguez, J.P.; Rodríguez-Clark, K.M.; Nicholson, E.; Aapala, K.; Alonso, A.; Asmussen, M.; Bachman, S.; Basset, A.; Barrow, E.G.; et al. Scientific Foundations for an IUCN Red List of Ecosystems. PLoS ONE 2013, 8, e62111. [Google Scholar] [CrossRef] [Green Version]
  26. Butler, B.J.; Swenson, J.J.; Alig, R.J. Forest fragmentation in the Pacific Northwest: Quantification and correlations. For. Ecol. Manag. 2004, 189, 363–373. [Google Scholar] [CrossRef]
  27. Abdullah, S.A.; Nakagoshi, N. Forest fragmentation and its correlation to human land use change in the state of Selangor, peninsular Malaysia. For. Ecol. Manag. 2007, 241, 39–48. [Google Scholar] [CrossRef]
  28. Wu, J. Landscape sustainability science: Ecosystem services and human well-being in changing landscapes. Landsc. Ecol. 2013, 28, 999–1023. [Google Scholar] [CrossRef]
  29. Armenteras, D.; Gast, F.; Villareal, H. Andean forest fragmentation and the representativeness of protected natural areas in the eastern Andes, Colombia. Biol. Conserv. 2003, 113, 245–256. [Google Scholar] [CrossRef]
  30. Armenteras, D.; Rudas, G.; Rodriguez, N.; Sua, S.; Romero, M. Patterns and causes of deforestation in the Colombian Amazon. Ecol. Indic. 2006, 6, 353–368. [Google Scholar] [CrossRef]
  31. Gómez Mora, A.M.; Anaya, J.A.; Álvarez Dávila, E. Análisis de fragmentación de los ecosistemas boscosos en una región de la cordillera central de los andes colombianos. Rev. Ing. Univ. Medellín 2005, 4, 13–27. [Google Scholar]
  32. Rodríguez Eraso, N.; Armenteras-Pascual, D.; Alumbreros, J.R. Land use and land cover change in the Colombian Andes: Dynamics and future scenarios. J. Land Use Sci. 2013, 8, 154–174. [Google Scholar] [CrossRef]
  33. León, J.D.; González, M.I.; Gallardo, J.F. Ciclos biogeoquímicos en bosques naturales y plantaciones de coníferas en ecosistemas de alta montaña de Colombia. Rev. Biol. Trop. 2011, 59, 1883–1894. [Google Scholar] [CrossRef]
  34. Valencia, R.; Balslev, H.; Paz, Y.; Miño, C.G. High tree alpha-diversity in Amazonian Ecuador. Biodivers. Conserv. 1994, 3, 21–28. [Google Scholar] [CrossRef]
  35. Olson, D.M.; Dinerstein, E. The Global 200: Priority Ecoregions for Global Conservation. Ann. Mo. Bot. Gard. 2002, 89, 199–224. [Google Scholar] [CrossRef]
  36. Cuenca, P.; Arriagada, R.; Echeverría, C. How much deforestation do protected areas avoid in tropical Andean landscapes? Environ. Sci. Policy 2016, 56, 56–66. [Google Scholar] [CrossRef]
  37. Mena, C.F. Trajectories of Land-use and Land-cover in the Northern Ecuadorian Amazon: Temporal Composition, Spatial Configuration, and Probability of Change. Photogramm. Eng. Remote Sens. 2008, 6, 737–751. [Google Scholar] [CrossRef]
  38. Sierra, R.; Stallings, J. The Dynamics and Social Organization of Tropical Deforestation in Northwest Ecuador, 1983–1995. Hum. Ecol. 1998, 26, 135–161. [Google Scholar] [CrossRef]
  39. Tapia-Armijos, M.F.; Homeier, J.; Espinosa, C.I.; Leuschner, C.; de la Cruz, M. Deforestation and Forest Fragmentation in South Ecuador since the 1970s–Losing a Hotspot of Biodiversity. PLoS ONE 2015, 10, e0133701. [Google Scholar] [CrossRef] [PubMed] [Green Version]
  40. Cadilhac, L.; Torres, R.; Calles, J.; Vanacker, V.; Calderón, E. Desafíos para la investigación sobre el cambio climático en Ecuador. Neotrop. Biodivers. 2017, 3, 168–181. [Google Scholar] [CrossRef]
  41. Cuenca, P.; Echeverria, C. How do protected landscapes associated with high biodiversity and population levels change? PLoS ONE 2017, 12, e0180537. [Google Scholar] [CrossRef] [Green Version]
  42. Cuesta, F.; Peralvo, M.; Merino-Viteri, A.; Bustamante, M.; Baquero, F.; Freile, J.F.; Muriel, P.; Torres-Carvajal, O. Priority areas for biodiversity conservation in mainland Ecuador. Neotrop. Biodivers. 2017, 3, 93–106. [Google Scholar] [CrossRef]
  43. Lessmann, J.; Muñoz, J.; Bonaccorso, E. Maximizing species conservation in continental Ecuador: A case of systematic conservation planning for biodiverse regions. Ecol. Evol. 2014, 4, 2410–2422. [Google Scholar] [CrossRef]
  44. Ministerio del Ambiente del Ecuador. Sistema de Clasificación de los Ecosistemas del Ecuador Continental; Subsecretaría de Patrimonio Natural: Quito, Ecuador, 2013.
  45. Sierra, R.; Palacios, W.; Cern, C.; Valencia, R. Las Formaciones Naturales de la Amazonía del Ecuador; EcoCiencia: Illes Balears, Spania, 1999. [Google Scholar] [CrossRef]
  46. Josse, C.; Navarro, G.; Comer, P.; Evans, R.; Faber, D. Ecological Systems of Latin America and the Caribbean a Working Classification of Terrestrial Systems; NatureServe: Arlington County, VA, USA, 2003. [Google Scholar]
  47. MAE. Fragmentación de los Ecosistemas del Ecuador Continental; Ministerio del Ambiente de Ecuador: Quito, Ecuador, 2015.
  48. MAE. Línea Base de Deforestación del Ecuador Continental; Ministerio del Ambiente de Ecuador: Quito, Ecuador, 2012; p. 32.
  49. MAGAP-MAE. Cobertura del Uso Actual Actual del Suelo del Ecuador Continental 1990–2000–2008–2014; Subsecretaría de Patrimonio Natural: Quito, Ecuador, 2015.
  50. MAE. Estadística de Patrimonio Natural; Ministerio del Ambiente de Ecuador: Quito, Ecuador, 2015.
  51. IGM. Geoportales y Visores Geográficos; Subsecretaría de Patrimonio Natural: Quito, Ecuador, 2018.
  52. Bremer, L.L.; Farley, K.A.; Lopez-Carr, D.; Romero, J. Conservation and livelihood outcomes of payment for ecosystem services in the Ecuadorian Andes: What is the potential for ‘win–win’? Ecosyst. Serv. 2014, 8, 148–165. [Google Scholar] [CrossRef]
  53. Viteri Salazar, O.; Ramos-Martín, J.; Lomas, P.L. Livelihood sustainability assessment of coffee and cocoa producers in the Amazon region of Ecuador using household types. J. Rural. Stud. 2018, 62, 1–9. [Google Scholar] [CrossRef]
  54. Buytaert, W.; Iiguez, V.; Bivre, B.D. The effects of afforestation and cultivation on water yield in the Andean páramo. For. Ecol. Manag. 2007, 251, 22–30. [Google Scholar] [CrossRef]
  55. Célleri, R.; Feyen, J. The Hydrology of Tropical Andean Ecosystems: Importance, Knowledge Status, and Perspectives. Mt. Res. Dev. 2009, 29, 350–355. [Google Scholar] [CrossRef]
  56. Bendix, J.; Trachte, K.; Cermak, J.; Rollenbeck, R.; Naub, T. Formation of convective clouds at the foothills of the tropical eastern Andes (South Ecuador). J. Appl. Meteorol. Climatol. 2009, 48, 1682–1695. [Google Scholar] [CrossRef]
  57. MAE. Informe del Aporte del Programa Socio Bosque en la Conservación; Ministerio del Ambiente: Quito, Ecuador, 2016.
  58. MAGAP. Mapa de Cobertura y Uso de la TIerra del Ecuador Continental Escala 1:100 000: Temporalidad: 2013–2014; 2016. Available online: http://ide.ambiente.gob.ec/geonetwork/srv/spa/catalog.search;jsessionid=66D82E3F6D48F054363C8A0447861702#/search?facet.q=topicCat%2FimageryBaseMapsEarthCover (accessed on 21 August 2021).
  59. Puyravaud, J.-P. Standardizing the calculation of the annual rate of deforestation. For. Ecol. Manag. 2003, 177, 593–596. [Google Scholar] [CrossRef]
  60. Pontius, R.G.; Shusas, E.; McEachern, M. Detecting important categorical land changes while accounting for persistence. Agric. Ecosyst. Environ. 2004, 101, 251–268. [Google Scholar] [CrossRef]
  61. Riitters, K.H.; Wickham, J.D. Decline of forest interior conditions in the conterminous United States. Sci. Rep. 2012, 2, 653. [Google Scholar] [CrossRef] [Green Version]
  62. Riitters, K.H.; Wickham, J.D.; O’Neill, R.V.; Jones, K.B.; Smith, E.R.; Coulston, J.W.; Wade, T.G.; Smith, J.H. Fragmentation of continental United States forests. Ecosystems 2002, 5, 815–822. [Google Scholar] [CrossRef]
  63. Vogt, P. Measuring Forest Area Density to Quantify Forest Fragmentation. (Available in the Free JRC Software GuidosToolbox); European Commission: Brussels, Belgium, 2018. [Google Scholar]
  64. Noh, J.K. Effects of forest fragmentation on biodiversity in the Andes region. PH. D. Thesis, Universidad de Concepción, Concepción, Chile, 2019. [Google Scholar]
  65. Lambin, E.F.; Geist, H.J.; Lepers, E. Dynamics of Land-Use and Land-Cover Change in Tropical Regions. Annu. Rev. Environ. Resour. 2003, 28, 205–241. [Google Scholar] [CrossRef] [Green Version]
  66. Lessmann, J.; Fajardo, J.; Muoz, J.; Bonaccorso, E. Large expansion of oil industry in the Ecuadorian Amazon: Biodiversity vulnerability and conservation alternatives. Ecol. Evol. 2016, 6, 4997–5012. [Google Scholar] [CrossRef] [Green Version]
  67. Sáenz, M.A.O. Preguntas Clave: Reporte de los Ecosistemas Terrestres Ecuatorianos. Indicadores de Biodiversidad para Uso Nacional; Ministerio del Ambiente del Ecuador/Fundación EcoCiencia: Quito, Ecuador, 2005; p. 61.
  68. Mittermeier, R.A.; Myers, N.; Tliomsen, J.B.; Olivieri, S. Biodiversity hotspots and major tropical wilderness areas: Approaches to setting conservation priorities. Conserv. Biol. 1998, 12, 516–520. [Google Scholar] [CrossRef]
  69. Rodriguez, J.P.; Keith, D.A.; Rodrguez-Clark, K.M.; Murray, N.J.; Nicholson, E.; Regan, T.J.; Miller, R.M.; Barrow, E.G.; Bland, L.M.; Boe, K.; et al. A practical guide to the application of the IUCN Red List of Ecosystems criteria. Philos. Trans. R. Soc. B Biol. Sci. 2015, 370, 20140003. [Google Scholar] [CrossRef] [PubMed]
  70. Brandt, J.S.; Townsend, P.A. Land use—Land cover conversion, regeneration and degradation in the high elevation Bolivian Andes. Landsc. Ecol. 2006, 21, 607–623. [Google Scholar] [CrossRef]
  71. Wunder, S. Deforestation: The Poor Man’s Lot? In The Economics of Deforestation; Macmillan: London, UK, 2000; pp. 141–163. [Google Scholar]
  72. Sierra, R.; Campos, F.; Chamberlin, J. Assessing biodiversity conservation priorities: Ecosystem risk and representativeness in continental Ecuador. Landsc. Urban Plan. 2002, 59, 95–110. [Google Scholar] [CrossRef]
  73. Balmford, A.; Mace, G.M.; Ginsberg, J.R. The challenges to conservation in a changing world: Putting processes on the map. In Conservation in a Changing World; Cambridge University Press: Cambridge, UK, 1998; pp. 1–28. [Google Scholar]
  74. Suding, K.N.; Hobbs, R.J. Threshold models in restoration and conservation: A developing framework. Trends Ecol. Evol. 2009, 24, 271–279. [Google Scholar] [CrossRef] [PubMed]
  75. Brown, D.; Schreckenberg, K. Shifting Cultivators as Agents of Deforestation: Assessing the Evidence; Overseas Development Institute: London, UK, 1998. [Google Scholar]
  76. Amelung, T.; Diehl, M. Deforestation of Tropical Rainforests: Economic Causes and Impact on Development; Institut für Weltwirtschaft: Kiel, Germany, 1992. [Google Scholar]
  77. Holl, K.D.; Loik, M.E.; Lin, E.H.V.; Samuels, I.A. Tropical montane forest restoration in Costa Rica: Overcoming barriers to dispersal and establishment. Restor. Ecol. 2000, 8, 339–349. [Google Scholar] [CrossRef]
  78. Pendrill, F.; Persson, U.M.; Godar, J.; Kastner, T. Deforestation displaced: Trade in forest-risk commodities and the prospects for a global forest transition. Environ. Res. Lett. 2019, 14, 055003. [Google Scholar] [CrossRef]
  79. Gaglio, M.; Aschonitis, V.G.; Mancuso, M.M.; Reyes Puig, J.P.; Moscoso, F.; Castaldelli, G.; Fano, E.A. Changes in land use and ecosystem services in tropical forest areas: A case study in Andes mountains of Ecuador. Int. J. Biodivers. Sci. Ecosyst. Serv. Manag. 2017, 13, 264–279. [Google Scholar] [CrossRef] [Green Version]
  80. Cubina, A.; Aide, T.M. The Effect of Distance from Forest Edge on Seed Rain and Soil Seed Bank in a Tropical Pasture. Biotropica 2001, 33, 260–267. [Google Scholar] [CrossRef]
  81. Myster, R.W. Post-Agricultural Invasion, Establishment, and Growth of Neotropical Trees. Bot. Rev. 2004, 70, 381–402. [Google Scholar] [CrossRef]
  82. Zahawi, R.A.; Augspurger, C.K. Early plant succession in abandoned pastures in Ecuador. Biotropica 1999, 31, 540–552. [Google Scholar] [CrossRef]
  83. MAE. Políticas y Plan Estratégico del Sistema Nacional de Áreas Protegidas del Ecuador 2007–2016; Ministerio del Ambiente del Ecuador, Proyecto GEF: Sistema Nacional de Áreas Protegidas: Quito, Ecuador, 2006; p. 154.
  84. Suding, K.N.; Gross, K.L.; Houseman, G.R. Alternative states and positive feedbacks in restoration ecology. Trends Ecol. Evol. 2004, 19, 46–53. [Google Scholar] [CrossRef] [PubMed]
  85. MAGAP. Decreto Ejecutivo No 1042. Reglamento Para Normar el Pago Por Calidad de la Leche y Sanidad Animal. Acuerdo Ministerial 077; Ministerio de Agricultura, Ganadería, Acuacultura y Pesca: Quito, Ecuador, 2008.
  86. Contero, R.; Requelme, N.; Cachipuendo, C.; Acurio, D. Calidad de la Leche Cruda i Sistema de Pago por Calidad en el Ecuador. LA GRANJA Rev. Cienc. Vida 2021, 33, 31–43. [Google Scholar] [CrossRef]
Figure 1. (A)Three natural regions of continental Ecuador. (B) The major land cover types within the mapped extent of 64 forest ecosystems in 1990, 2000, 2008, and 2014. (C) Distribution of each ecoregion’s elevation. (D) The major land cover types by ecoregions (n = 7) based on imagery from four time periods (1990, 2000, 2008, and 2014). The legend of land use types in Figure 1B correspond to colors of land use types in Figure 1D.
Land 11 00287 g001
Figure 2. Scatter diagrams of forest ecosystems annual deforestation rate for the periods 1990–2000 and 2000–2014. (a) Changes in annual deforestation rate of single forest ecosystem (n = 64) for the periods 1990–2000 and 2000–2014 (a). Each point represents one forest ecosystem. Solid black outline is zoomed out (b). (b) Changes in annual deforestation rate of single forest ecosystem (n = 59), excluding extreme data (n = 5). (Inset) The distribution of the ecosystem’s differences in deforested area between 1990 and 2014. The vertical dotted line marks zero shifts, and the vertical solid line marks the median shift. The arrow describes the direction of the shift. This figure is based on the previous study Noh [64].
Land 11 00287 g002
Figure 3. Net change, gains, and losses for each land cover class as a percentage of three regions: (a) Coast, (b) Andes, and (c) Amazon, for the periods 1990–2000, 2000–2008 and 2008–2014. This figure is based on the previous study Noh [64].
Land 11 00287 g003
Figure 4. Temporal variation of a number of different Forest Area Density (FAD) (log) in the three regions of Ecuador. This figure is based on the previous study Noh [64].
Land 11 00287 g004
Table 2. Spatial scale (region–ecoregion–ecosystem) and altitudinal range of 64 natural forest ecosystems.
RegionEcoregionCodeForest Ecosystems (Forest Vegetation Type)Altitudinal Range (m)
COASTEquatorial-ChocóE1Flood alluvial plain forest of the Equatorial Chocó 50–200
E2Equatorial Chocó mangrove0–20
E3Evergreen forest of the Equatorial Chocó lowland0–300
E4Flood intertidal plain forest of the Equatorial Chocó 0–50
E5Seasonal evergreen forest of Equatorial Chocó lowlands 0–300
E6Piedmont seasonal evergreen forest of the Chocó coastal range200–400
E7Low montane evergreen forest of Chocó coastal range >400
Equatorial-PacificE8Semideciduous forest of the Jama-Zapotillo lowland 0–300
E9Semideciduous forest of the Equatorial Pacific coastal range >200
E10Low forest and deciduous shrubland of the Jama-Zapotillo lowland 0–400
E11Piedmont seasonal evergreen forest of the Equatorial Pacific coastal range200–400
E12Low montane seasonal evergreen forest of the Equatorial Pacific coastal range400–860
E13Seasonal evergreen forest of the Jama-Zapotillo lowland 0–400
E14Deciduous forest of the Jama-Zapotillo lowland0–400
E15Deciduous forest of the Equatorial Pacific coastal range>200
E16Jama-Zapotillo mangrove 0–10
E17Seasonal flood alluvial plain evergreen forest of the Jama-Zapotillo 0–300
ANDESWestern-range E18Piedmont evergreen forest of the western Andean range 300–1400
E19Low montane evergreen forest of the western Andean range 1400–2000
E20Montane evergreen forest of the western Andean range 2000–3100
E21High montane evergreen forest of the western Andean range 3100–3600
E22Piedmont seasonal evergreen forest of the western Andean range 300–1400
E23Piemontano seasonal evergreen forest of the Catamayo-Alamor400–1600
E24Low montane seasonal evergreen forest of the Catamayo-Alamor1600–2000
E25Montane evergreen forest of the Catamayo-Alamor2200–2900
E26High montane evergreen forest of the Catamayo-Alamor2900–3400
E27Low montane evergreen forest of the Catamayo- Alamor1600–2200
E28Piedmont evergreen forest of the Catamayo-Alamor400–1600
E29Piedmont semideciduous forest of the Catamayo-Alamor400–1600
E30Low montane semideciduous forest of the Catamayo-Alamor1600–2200
E31Piedmont deciduous forest of the Catamayo-Alamor400–1600
E32Low montane deciduous forest of the Catamayo- Alamor1600–2200
Valley, AlpineE33Semideciduous forest and shrubland of the North Valleys1200–2600
E34Semideciduous forest and shrubland of the South Valleys1200–2000
E35Páramo evergreen forest3200–4100
Eastern-rangeE36High montane evergreen forest of the north-eastern Andean range3000–3700
E37Montane evergreen forest of the north-eastern Andean range2000–3000
E38Low montane evergreen forest of the north-eastern Andean range1200–2000
E39Piedmont evergreen forest of the north-eastern Andean range400–1200
E40Low montane evergreen forest of the south-eastern Andean range1660–2200
E41Montane evergreen forest of the south-eastern Andean range2200–3000
E42High montane evergreen forest of the south-eastern Andean range3000–3400
E43Piedmont evergreen forest of the south-eastern Andean range400–1650
E44Piedmont semideciduous forest of the south-eastern Andean range500–1300
AMAZONRangeE45Low montane evergreen forest of Galeras1300–1700
E46Piedmont evergreen forest of Galeras600–1300
E47Piedmont evergreen forest of the Cóndor-Kutukú range350–1400
E48Low montane evergreen forest of the Cóndor-Kutukú range1400–1900
E49Montane evergreen forest of the Cóndor-Kutukú range1900–2400
E50Piedmont evergreen forest on sandstone plateaus of the Cóndor-Kutukú range350–1400
E51Montane evergreen forest on sandstone plateaus of the Cóndor range1900–2700
E52Piedmont evergreen forest on limestone outcrops of the Amazonian range600–1400
E53Low montane evergreen forest on sandstone plateaus of the Cóndor-Kutukú range1400–1900
E54Evergreen forest on sandstone plateaus of the Cóndor range in the lower Ecuadorian Amazon243–550
PlainE55Evergreen forest of the Aguarico-Putumayo-Caquetá lowland 168–350
E56Flood alluvial plain palm forest of the Amazon 171–350
E57Flood river (originated in the Andean and Amazonian ranges) alluvial-plain forest164–350
E58Lowland evergreen forest of the Napo-Curaray170–350
E59Flood alluvial plain forest of the Amazon158–350
E60Flood forest and lacustrine-riparian vegetation of the Amazonian black water170–350
E61Flood river (originated in the Amazon) alluvial plain forest 158–350
E62Evergreen bamboo forest of the Amazonian lowland196–500
E63Evergreen forest of the Tigre-Pastaza lowland166–350
E64Evergreen forest of the Pastaza fan-shaped lowland197–350
Table 3. Summary of Forest Area Density (FAD) fragmentation class thresholds, names, and color assignment according to Vogt [63].
FAD ClassColorFAD Range
1Rare Land 11 00287 i001FAD < 10%
2Patchy Land 11 00287 i00210% ≤ FAD < 40%
3Transitional Land 11 00287 i00340% ≤ FAD < 60%
4Dominant Land 11 00287 i00460% ≤ FAD < 90%
5Interior Land 11 00287 i00590% ≤ FAD ≤ 100%
Table 4. Standard coefficients of multiple regressions testing the relationship between forest fragmentation index (FFI) and human land use for 2014 in national and regional level.
Human Land Use/CoverAll Coast Andes Amazon
(n = 64, p < 0.001,
R2 = 0.646)
(n = 17, p < 0.05,
R2 = 0.572)
(n = 27, p < 0.01,
R2 = 0.854)
(n = 20, p < 0.01,
R2 = 0.003)
PLT2.520.1260.7-
PST1.30 ***−0.471.31 ***1.08 **
AFM1.45−5.640.44−26.97
PFM0.182.58 .−4.1−9.53
SFM1.234.61 .3.6716
HBT59.78 ***59.74 .106.48 **−87.06
IFR6.5754.47−358.21−98.74
PLT: industrial plantation; PST: pasture; AFM: annual crops; PFM: permanent crops; SFM: semi-permanent crops; HBT: inhabited area; IFR: infrastructure. . p < 0.1, ** p < 0.01, *** p < 0.001.
Table 5. Standard coefficients of multiple regressions testing the relationship between forest fragmentation index (FFI) and human land use for 2014 in forest ecosystems divided by FFI value (low: FFI ≤ 10, moderate: 10 < FFI ≤ 60, high: FFI > 60).
Human Land Use/CoverLow ModerateHigh
(n = 22, p < 0.001, R2 = 0.936)(n = 31, p < 0.1, R2 = 0.302)(n = 11, p < 0.01, R2 = 0.995)
PLT−2.08 *1.99.23
PST1.20 ***0.63 *0.37 *
AFM46.67 ***1.55 .0.43
PFM−3.510.43−0.61 *
SFM3.330.341.28 .
HBT−63.784.9210.3
IFR0.888.2193.33 *
PLT: industrial plantation; PST: pasture; AFM: annual crops; PFM: permanent crops; SFM: semi-permanent crops; HBT: inhabited area; IFR: infrastructure. . p < 0.1, * p < 0.05, *** p < 0.001.
Publisher’s Note: MDPI stays neutral with regard to jurisdictional claims in published maps and institutional affiliations.

