
The Different Impacts of Airports on the Ecological Environment under Distinct Institutional Contexts


1
School of Public Administration, Hainan University, Haikou 570100, China
2
School of Geographic Sciences, Key Laboratory of Geographic Information Science (Ministry of Education), East China Normal University, Shanghai 200241, China
3
School of Public Affairs, Zhejiang University, Hangzhou 310058, China
*
Author to whom correspondence should be addressed.
Land 2022, 11(2), 291; https://0-doi-org.brum.beds.ac.uk/10.3390/land11020291
Submission received: 13 January 2022
/
Revised: 9 February 2022
/
Accepted: 12 February 2022
/
Published: 15 February 2022
(This article belongs to the Special Issue Territory Spatial Planning toward High-Quality Development in China)
Abstract
:Few studies have attempted to investigate the impact of airports on the ecological environment. This paper compares the effects of airports in China and Germany on the surrounding ecological environment and discusses the underlying institutional mechanisms that lead to these impacts. We used remote-sensing ecological indicators to assess ecological environment quality. A buffer analysis was used to determine the influence scopes of airports on the ecological environment. The institutional analysis development framework was adopted to investigate the functions of different institutions on the influence scopes and intensities. The results showed that the Chinese airport had obvious negative effects and that its impact scope was wide, while the impact intensity of the German airport was weaker. These significant differences stem from the distinct institutional systems that structure the two airports. Our findings ultimately provide insight into how to improve the relationship between infrastructure construction and environmental protection in China.
1. Introduction
Transportation infrastructure, represented by airport investment plans, boosts financial development [1,2], which offers a direct and effective means of stimulating investment [3], increasing employment [4] and promoting economic growth [5,6]. However, the negative impacts of infrastructural development, including loss of land resources [7,8], pollution emissions [9] and destruction of ecological environments [10], are often ignored. In the context of accelerated airport construction, accurately assessing the impact of airports on the environment of surrounding areas is thus a crucial prerequisite for promoting research on green infrastructure.
The environmental impacts of airports can be categorized into direct and spillover effects based on the previous studies about transportation infrastructure [9,11,12]. Airport construction projects need to occupy a certain amount of certain space, which inevitably leads to changes in the properties of the surface land, vegetation and underground soil within the corresponding range. These changes cause a series of direct ecological and environmental effects [13,14,15], such as the destruction of animal and plant habitats [7], exposed topsoil, soil erosion and rising surface temperatures. Second, airports not only provide convenient transportation services for human societies but also typically grow to be a key economic node or link [16] for social and economic development within the region. These projects significantly improve the location pattern of the surrounding area by attracting people, goods and services [17], which increases the potential development value of the land. Industrial land and land that supports infrastructure by providing space for logistics and storage, hotels, high-tech and other industries are located in the valuable areas [18,19]. These land-use changes cause a large amount of agricultural land in the surrounding area to turn into impervious surfaces, which sparks a series of ecological and environmental problems that are referred to as the spillover effects of airports. Previous studies have primarily focused on the direct effects of airports on the surrounding ecological environment (e.g., noise pollution, air pollution, water pollution and changes in flora and fauna). However, less attention has been paid to changes in the ecological environment caused by spillover effects of airports.
The impacts of airports on the surrounding ecological environment are essentially the result of a series of interactions among different stakeholders, including airport construction managers, local governments, land developers and landowners/users [20,21,22]. First, local governments or airport construction managers convert agricultural land that is owned by landowners or land users into construction land through land acquisition or land purchases to meet the basic needs of the construction of airport projects. Then, local governments plan development zones around airport construction areas through urban master plans, which can effectively release the positive externalities of airports on social and economic growth and obtain the potential development value of land resources in the surrounding areas [17,23,24]. During this process, the local government still needs to acquire land resources from landowners/land users through land acquisition or land purchases. Finally, the local government trades these land resources to land developers for commercial, residential, or industrial land development under the guidance of the planning framework.
Meanwhile, the behavior selection and exchange process of the above-mentioned stakeholders are constrained by the local institutional environment [25,26]. For example, the implementation of airport projects and the development and construction of land-by-land developers must conform to the overall land-use plan or urban master plan. Moreover, while local governments expropriate or purchase land to promote economic development, they may also be constrained by related systems, such as the ecological compensation system [27,28] or the cultivated land requisition–compensation balance system [21]. Thus, institutional factors play an important role in the impact of airports on the ecological environments of surrounding areas. Theoretically, stakeholders who reside within distinct institutional environments perform differently, which results in different impacts of airports on the environment, but this topic has not been widely discussed.
In order to fill this research gap, we used the Hangzhou Xiaoshan International Airport in China and the Berlin Brandenburg International Airport in Germany as comparative cases in order to conduct a study on the direct and spillover effects of airports on the surrounding ecological environment. There are three main reasons why we selected these two airports for our study. First, as typical point transportation infrastructure, airports have a more concentrated impact on the surrounding area than linear transportation infrastructure, such as high-speed rail and roads. Second, to meet the needs of navigation, airports are often located on flat terrain in good geological conditions and are far away from main urban centers or other densely populated areas. Therefore, their effect on the ecological environment of the surrounding area is less affected by other factors and is relatively easy to identify [21]. Finally, while the two airports that we selected are similar in terms of their properties and the socio-economic environments in which they are located, the environmental protection systems in China and Germany are quite different, which provides ideal material for comparing the impacts of airport infrastructure on surrounding ecological environments within different institutional contexts.
Specifically, the remote sensing-based ecological index (RSEI) [29] was used to monitor and evaluate the ecological environment quality of the surrounding areas before and after the construction and operation of the two airports. With the help of the location theory, we also revealed the different scopes and extents of the environmental impact of these two airports. Then, we analyzed the institutional differences underlying the construction and operation of these two airports, paying particular attention to the types of ecological and environmental protection measures implemented in China and Germany. This paper aims to provide policy recommendations that can help coordinate the development and construction of airport infrastructure in ways that protect the environment and promote the greening of infrastructure development.
This paper is organized into six sections. Section 2, which follows this introduction, applies an analysis framework to better understand the potential drivers behind the effects of airports on surrounding ecological environments. We then provide an introduction to the two airport cases in Section 3 and overview the methodologies used in this study. Section 4 presents the ecological environmental changes that we recorded around the two airports and, in Section 5, we discuss the institutional reasons that underlie the different environmental effects of the airports. The paper ends with Section 6, in which we offer some final conclusions.
2. Theoretical Analysis
2.1. Institutional Analysis Development Framework
The impact of airports on the surrounding ecological environment is a process of natural surface changes that are the result of human–human interactions at the social level [30]. The institutional analysis development (IAD) framework [31,32] can be used to assess the impact of airports on their surrounding ecological environments and has been widely applied in the institutional analysis of water conservancy irrigation [33] and fishery [34], forest [35] and other forms of natural resource management. This paper used the IAD framework to explore the mechanisms and contributing factors of the impacts that airports have on the surrounding ecological environment. There are two main reasons for selecting the IAD framework. First, the IAD framework summarizes the internal transmission relationships [33,36] among institutional rules, socio-economic attributes, natural material conditions, action scenarios, interactions between actors and results, which allowed us to identify the internal connections among multi-dimension constraints (i.e., the system, society, economy and nature) and laid the foundation for our subsequent institutional analysis of the selected airport cases in China and Germany. Second, using the IAD framework allowed us to analyze the mechanism behind the impact of airports on the surrounding environment. It also provided theoretical support for the subsequent effective identification of the impact that these two airports have on the ecological environments of surrounding regions.
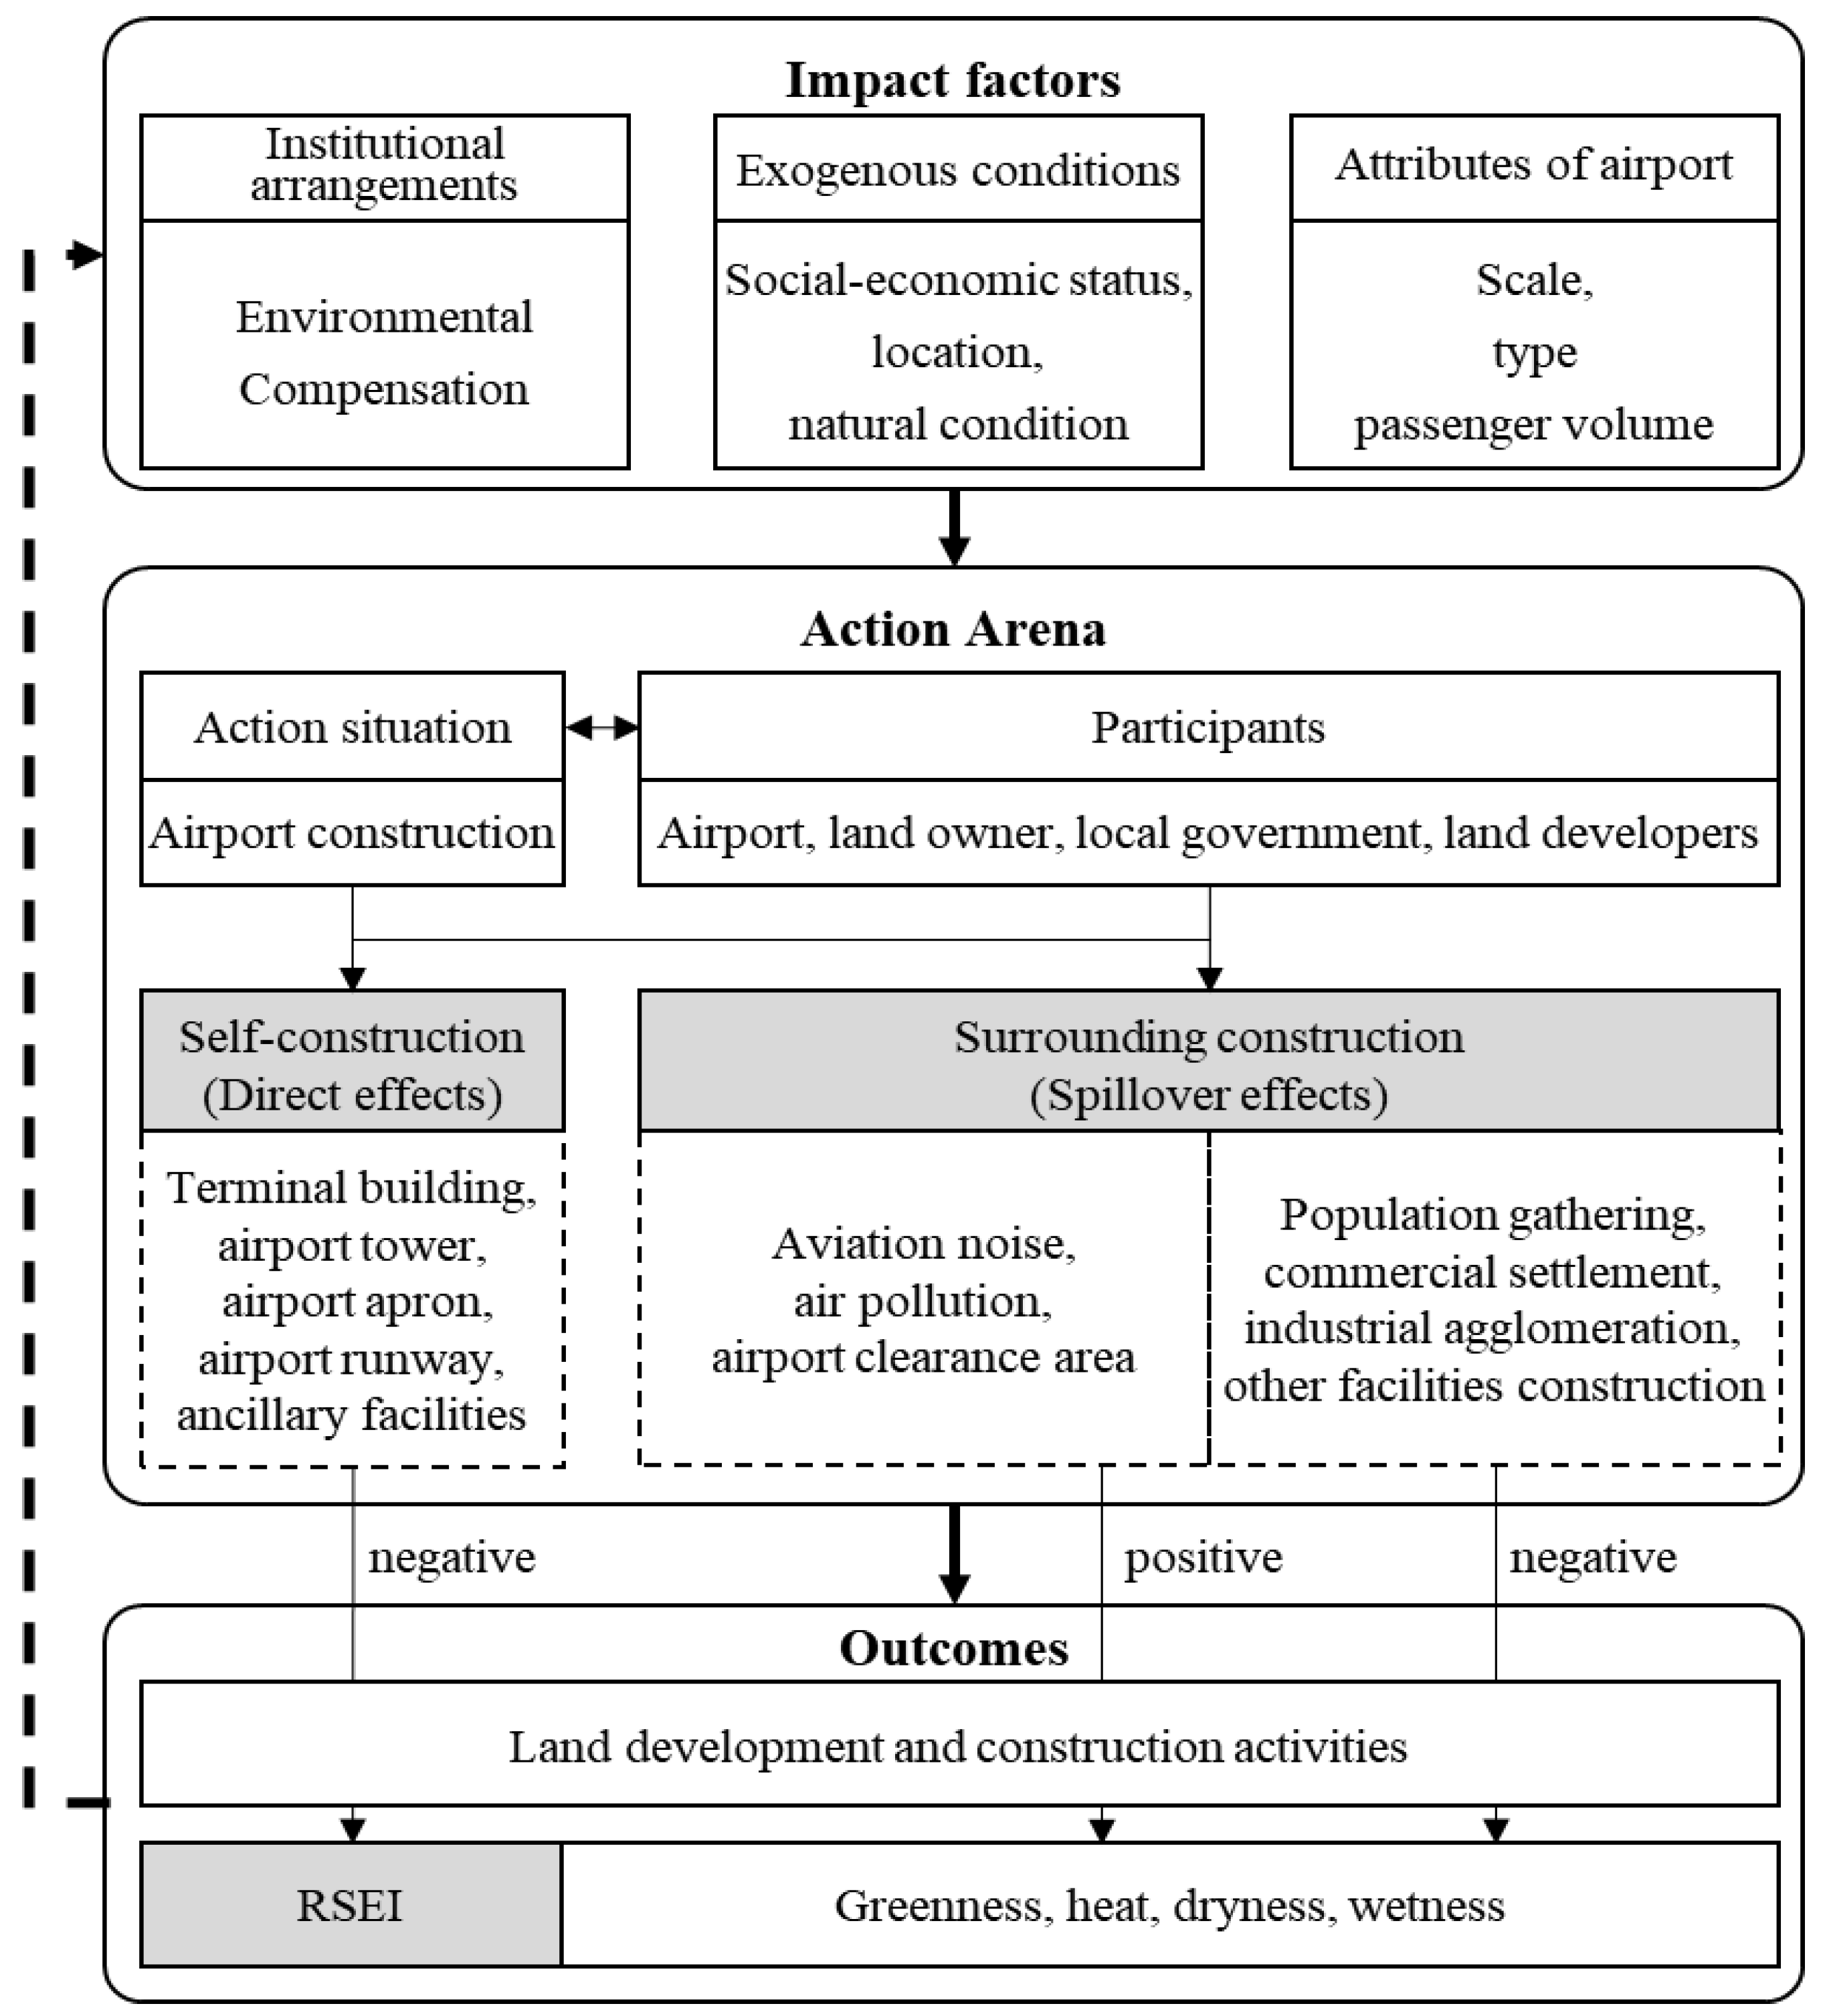
In this paper, we modified and refined the IAD framework to suit our research needs (Figure 1). First, this paper took the characteristics of the airports into consideration, including airport scale, airport type (hub airport or regional airport) and passenger volume [21,37]. Factors such as social-economic status, location conditions and natural conditions were also included in this paper. Second, we set the key system that affects the action arena and further results in the change in ecological environment as the institutional arrangements of environmental compensation, because the presence or absence of this institution is the biggest institutional difference between two airport cases in the study. Third, given the change in ecological environment majorly caused by the development of land resource, e.g., the transformation of vegetation land into impervious surfaces could result in the decrease in greenness and the increase in dryness, we set the outcomes as a decrease in greenness and wetness and an increase in dryness and heat, so as to reflect the change in ecological environment surround the airport.
In the Action Arena, the interest games that emerge around airport construction constitute the action situation of this paper and involve the interest participants, which include the airport management unit, land owners or land users, local governments and land developers. The behavioral interactions that take place between different subjects mainly occur around two aspects, the self-construction and the surrounding construction of the airport. The former refers to the changes in the ecological environment that take place within the airport due to the construction of facilities, such as terminal buildings, towers, aprons, airport runways and hangars. These transformations are the direct effects of the airport’s creation and typically lead to a reduction in greenness and wetness and an increase in heat and dryness. The noise pollution [38], exhaust emissions [39] and the establishment of airport clearance areas [40] that emerge as a result of the airport affect the normal production activities that take place around it and restrict the reduction in greenness and wetness and the increase in heat and dryness to a certain extent.
The surrounding construction of the airport refers to changes of land use that occur in the surrounding area as an indirect result of the typical external characteristics of the airport, namely, the spillover effects of the airport. While the airport construction changes the regional location pattern, it also has a siphon effect on surrounding areas [41] that leads to population gathering [37], commercial settlement, industrial agglomeration [42] and the construction expansion of supporting infrastructure [19]. These changes cause a growth of the demand for residential, commercial, industrial and infrastructure construction land and lead to the transformation of vegetation land into impervious surface [43], which could result in the further decrease in greenness and wetness and increase in heat and dryness.
2.2. The Mechanism of the Impact of the Airport on the Surrounding Ecological Environment
Airport construction and operation inevitably occupy a certain amount of green land and transform it into impervious surface, resulting in a decrease in greenness and humidity, an increase in heat and dryness and the deterioration of the ecological environment (Figure 1).
The spillover effect of airports on ecological environments is more complicated. First, during take-off and landing, aircrafts cause serious noise pollution [21,38] and emit nitrogen oxides and greenhouse gases [39]. Airport management departments must establish a wide range of airport clearance areas around the airport with the runway as the central axis for safety reasons. Moreover, the height, orientation and materials used for the construction of buildings in this area are often restricted [44]. These three factors inevitably limit local land development and construction activities [45], which can help prevent the decrease in vegetation land and the increase in impervious surface caused by development and construction. Therefore, the spillover effects of the airport have a positive impact on the ecological environment, which also decreases as the distance from the airport increases.
Second, airport construction changes the regional pattern and has a siphon effect on surrounding areas [41]. The construction and operation of the airport attract a large number of people and goods [37] and the population concentration, in turn, stimulates a demand for retail, commerce and service industries. The construction and operation of the airport also drive the development of related supporting industries, such as airport logistics, airport manufacturing, commerce and even high-tech [42], and accelerate the construction of supporting infrastructure and public service facilities, such as roads, gas stations and parking lots [19]. These factors inevitably lead to an increase in the demand for residential, commercial, industrial, infrastructure and construction land around the airport and lead to land development and construction activities in which a large number of vegetation land is transformed into impervious surface [43], which has negative effects on the surrounding ecological environment.
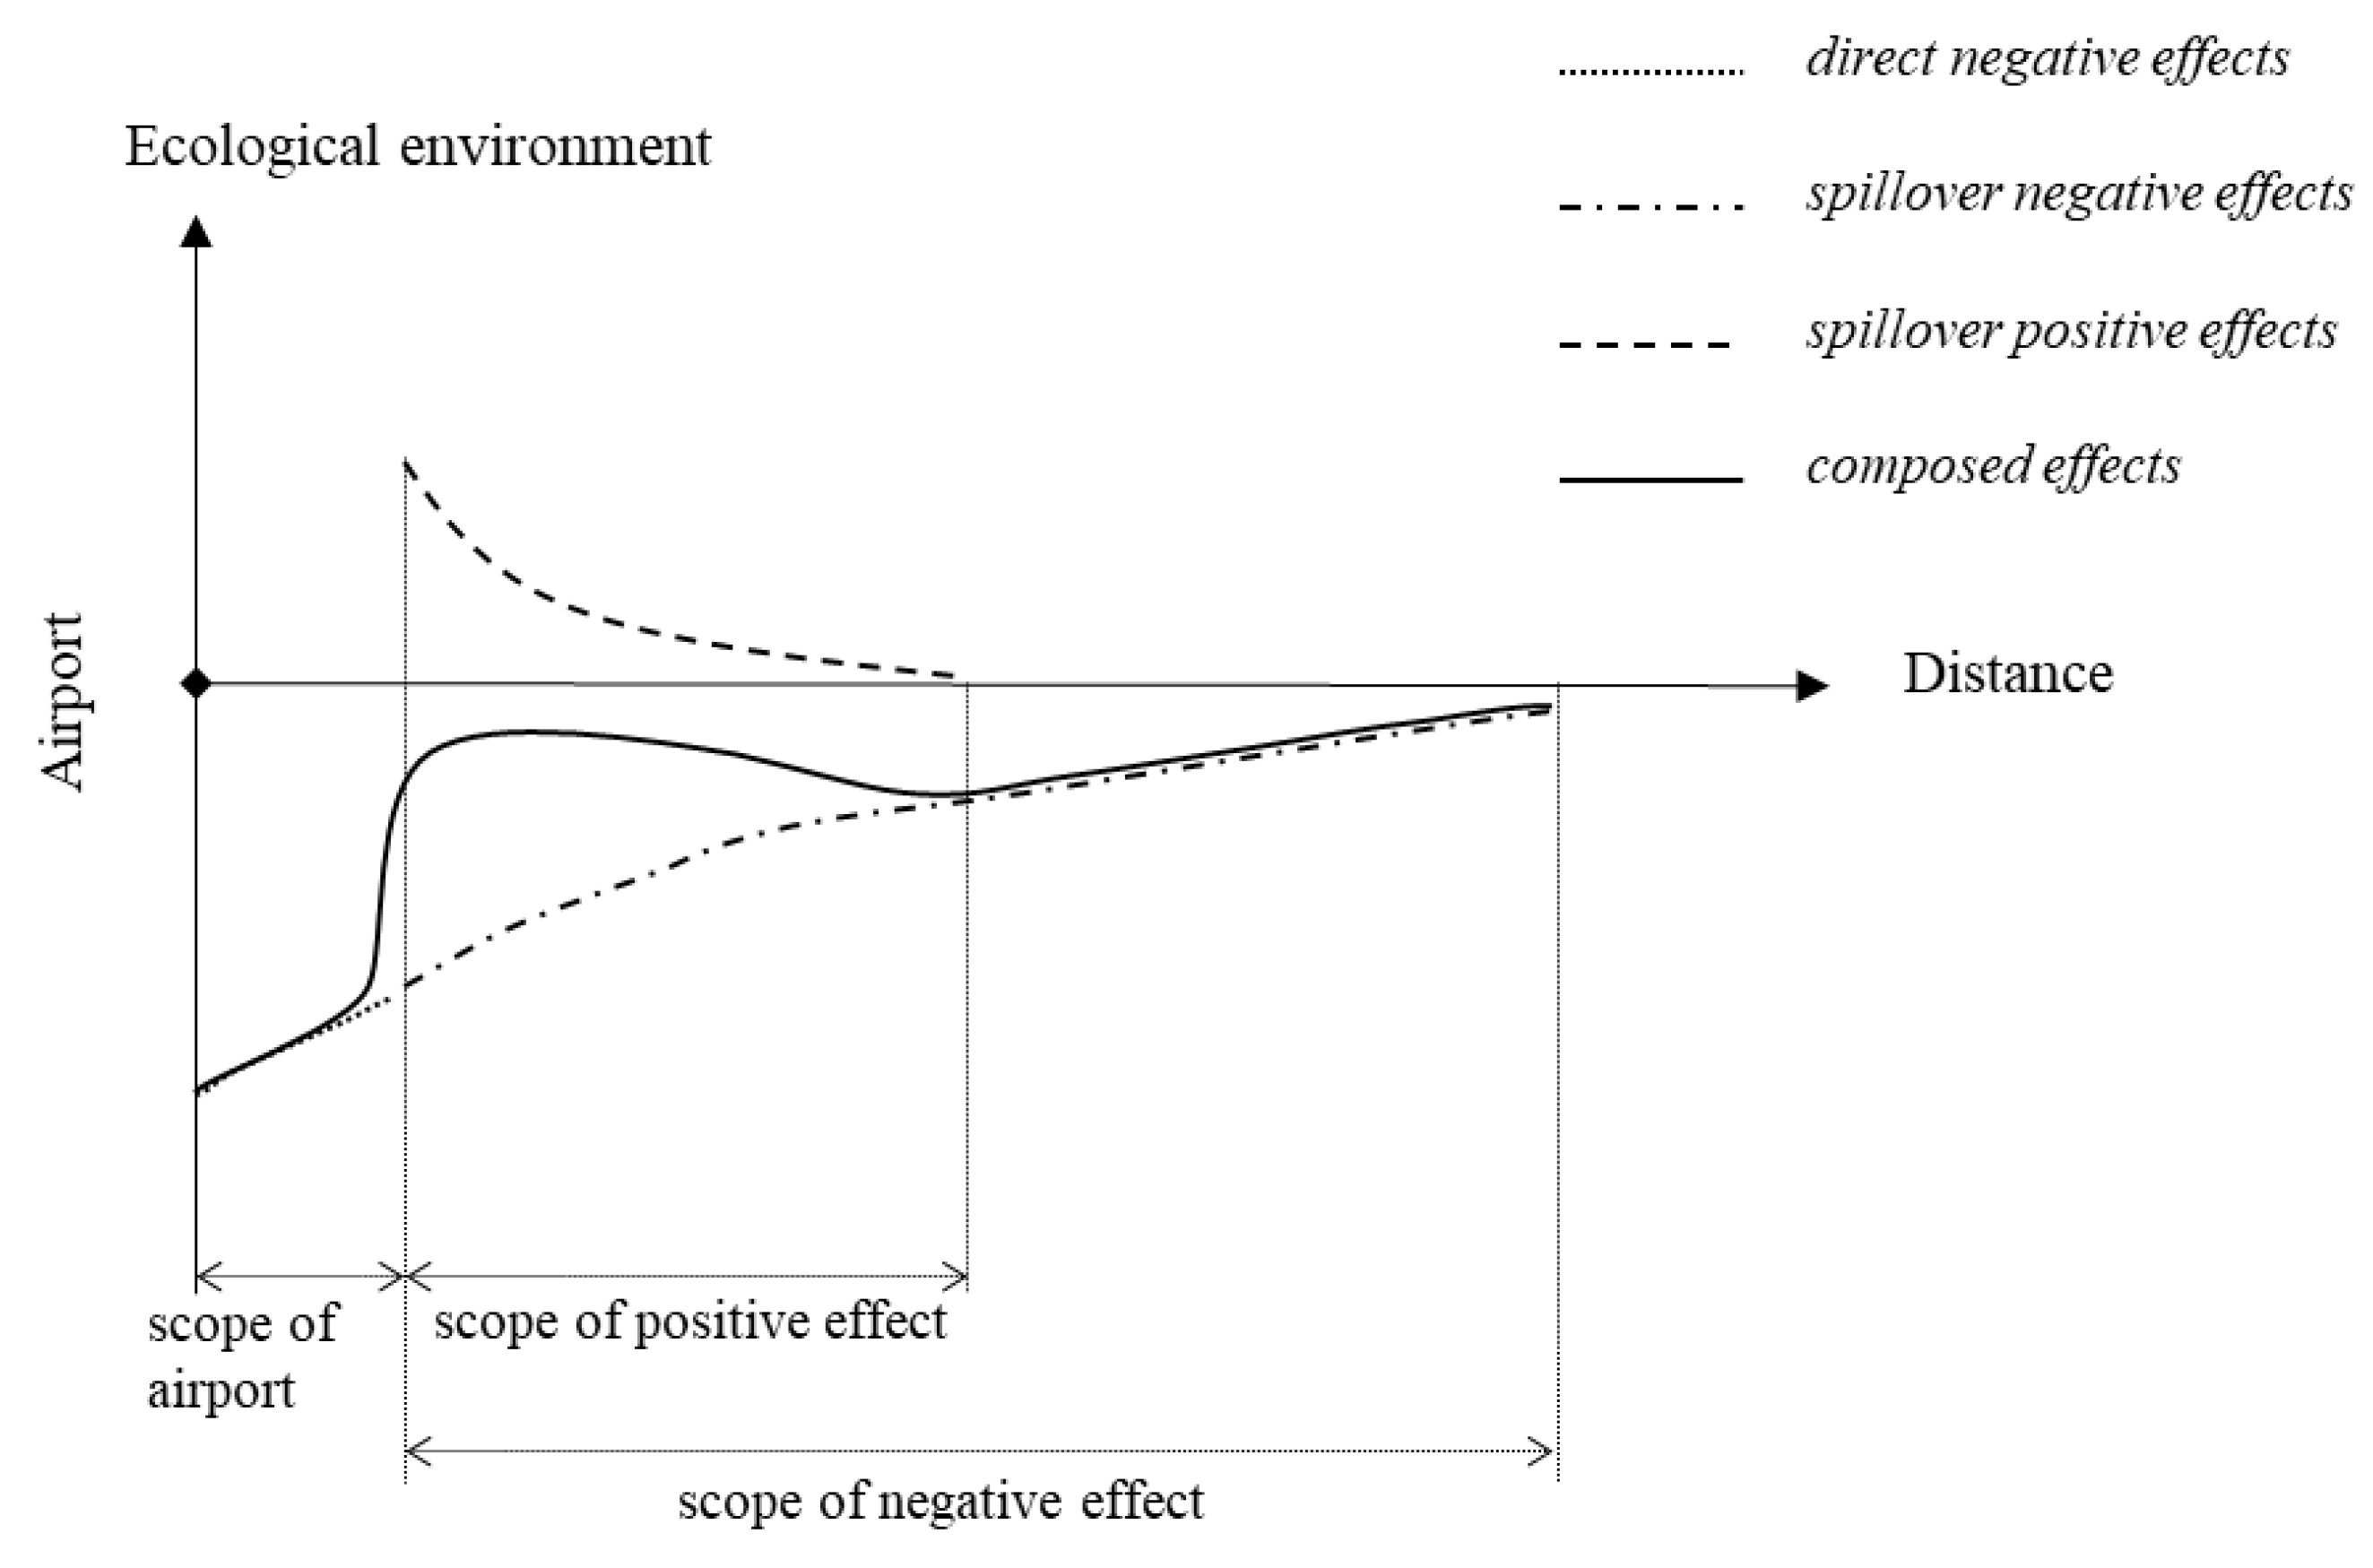
In reality, airport construction usually reserves a certain amount of green space on both sides of the airport runway, so the direct negative effects slightly diminish as the distance from the airport increases. Moreover, according to location theory, the spillover effect of the airport on the surrounding regional ecological environment gradually decreases with an increase in distance from the airport. The positive spillover effect of airport noise pollution, in particular, is more sensitive to distance. It weakens rapidly as the distance increases and is minimized at the critical point affected by the airport noise. However, the negative spillover effect represented by socio-economic development is less sensitive to distance. It gradually decreases with the increase in distance and will be minimized after reaching the maximum impact distance of the airport. In summary, the impact of the airport on the ecological environment of the surrounding area can be presented in the following way (Figure 2).
3. Date and Methodology
3.1. Overview of Airport Cases
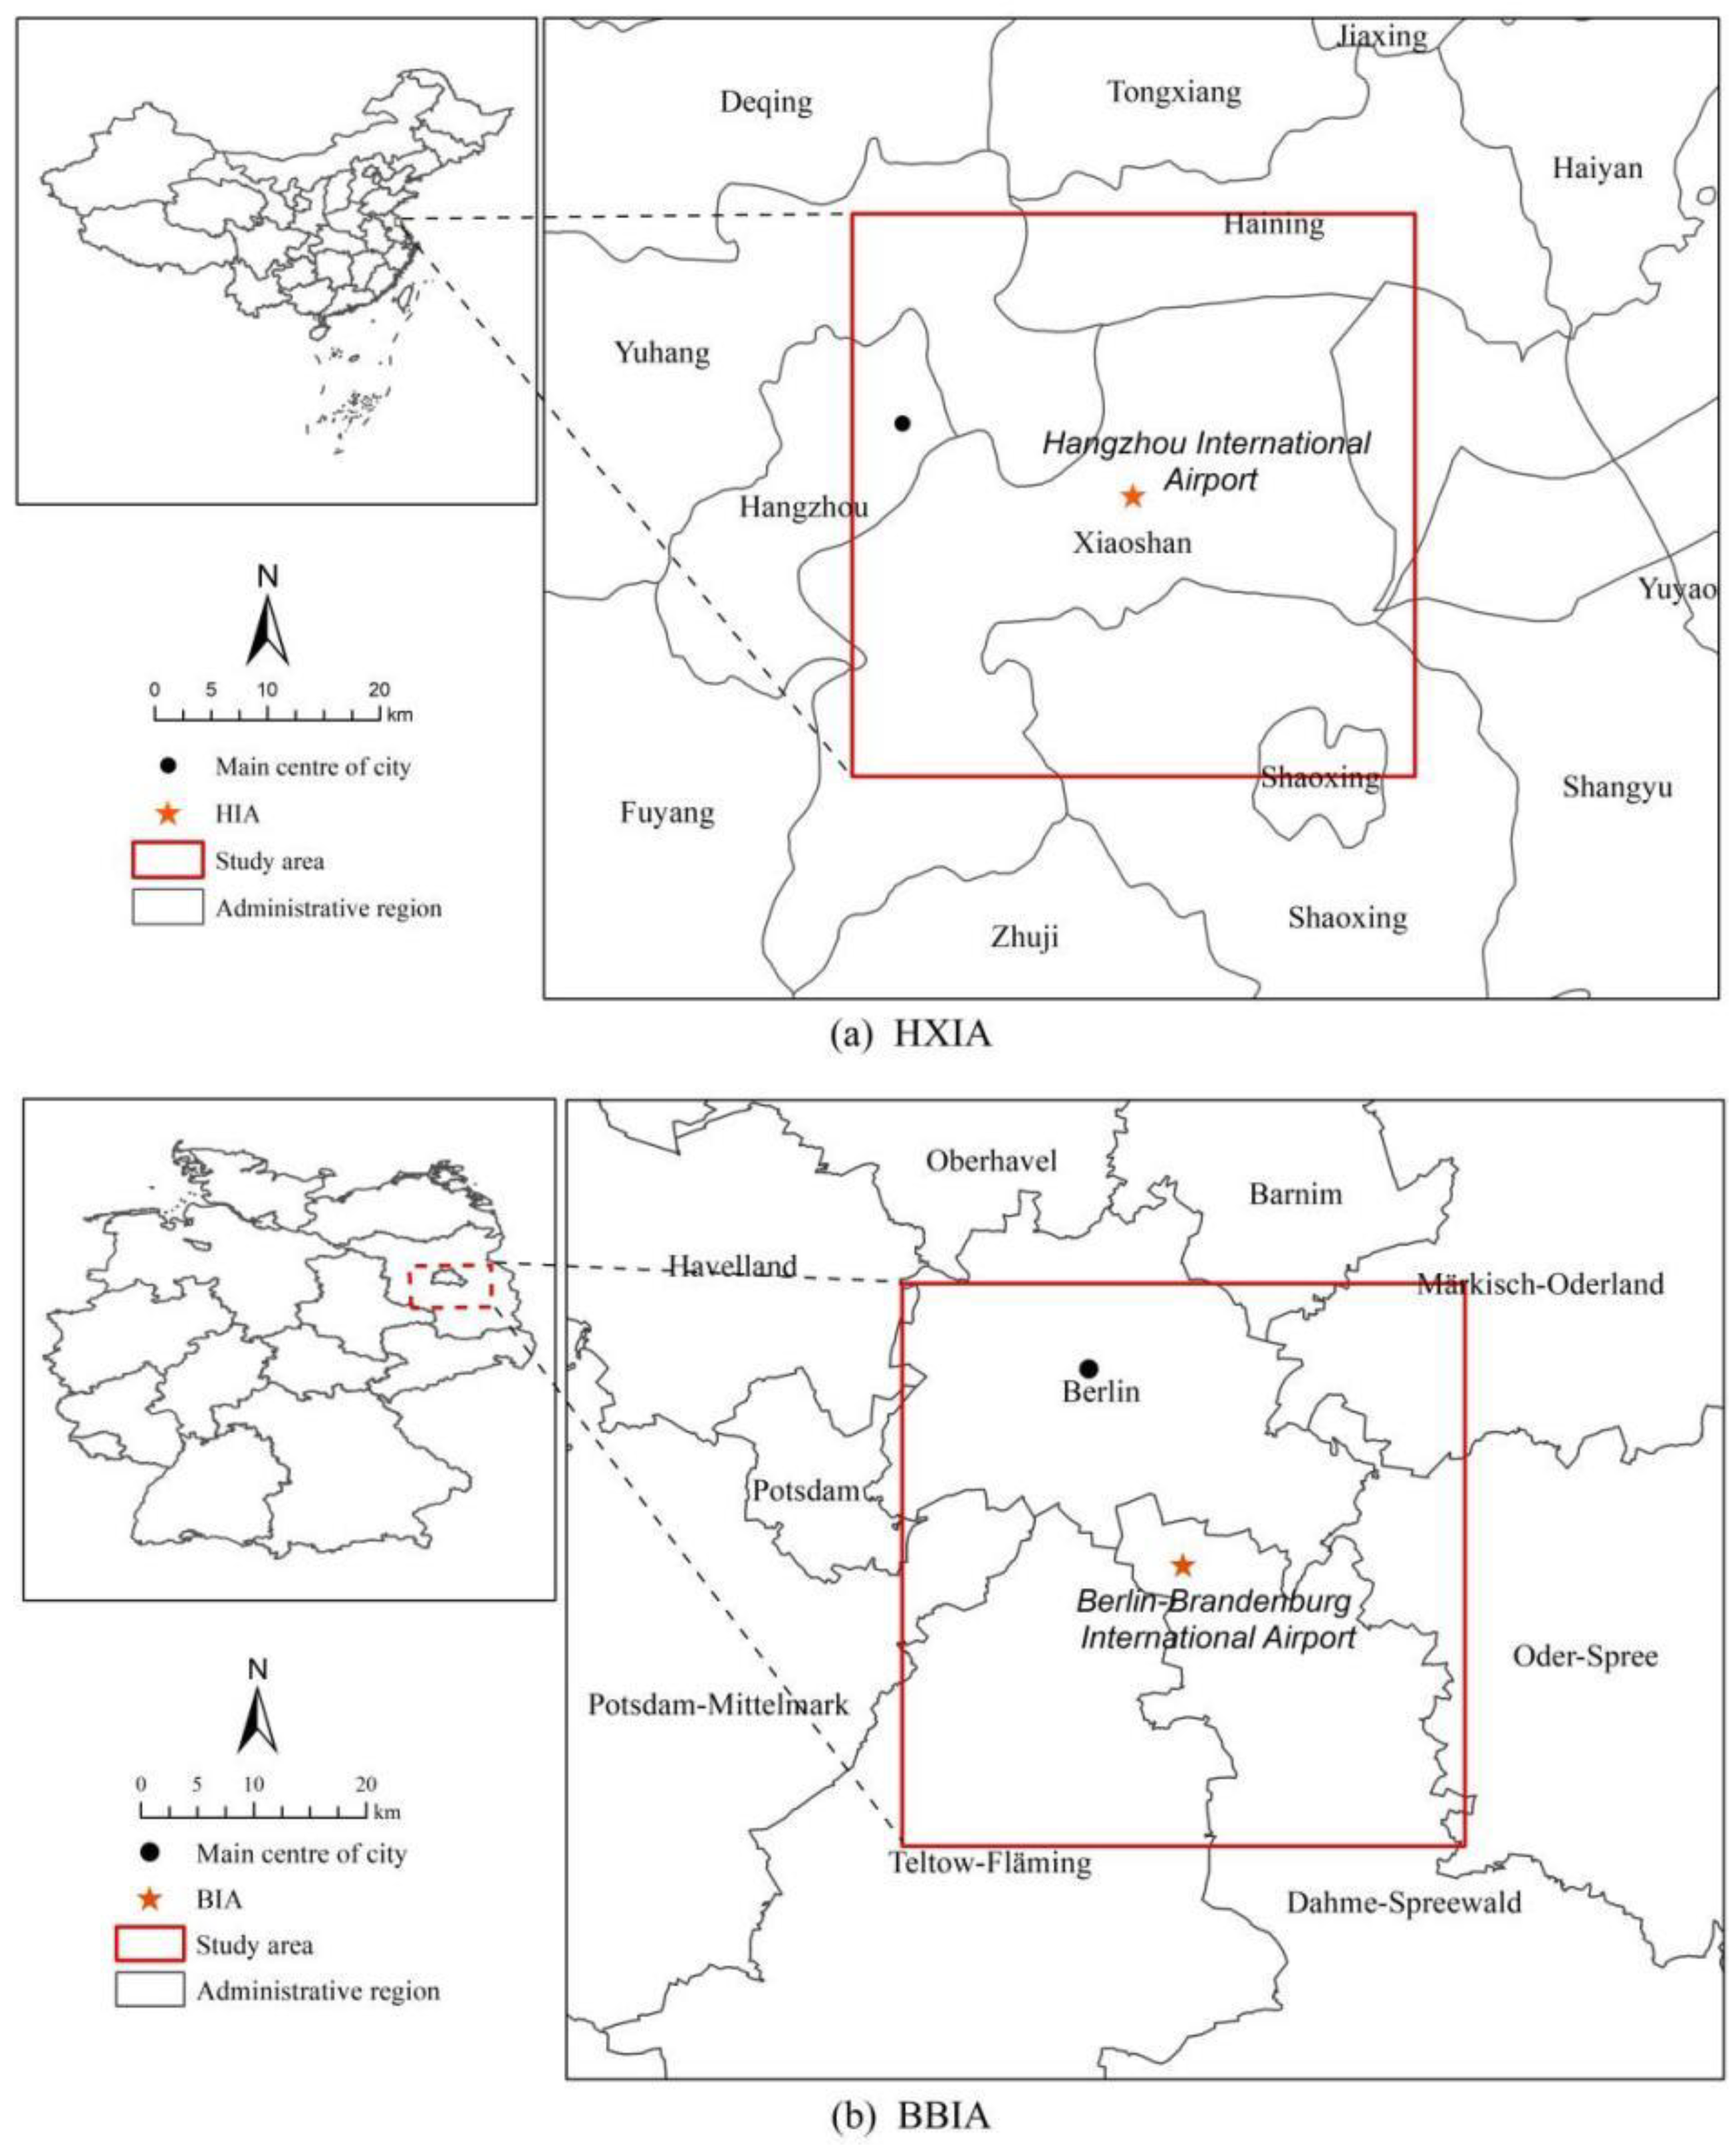
Hangzhou Xiaoshan International Airport (HXIA), an important regional hub for airport transportation, is located in the middle of Xiaoshan, Hangzhou, Zhejiang Province on the southern side of the Qiantang River and is 27 km away from the main center of Hangzhou. The length of the airport is about 4 km from east to west and its width is around 2.3 km from north to south. Officials plan for it to eventually cover 14.68 km2. The construction of HXIA can be divided into three phases. The first phase began in July 1997 and was completed in December 2000, when the airport was opened for navigation. At that point, HXIA covered 4.84 km2. The second phase, which covered 5.14 km, began in November 2007 and ended in December 2012. The third phase started in 2018 and, by the end of 2019, HXIA’s annual passengers reached 40 million. At that point, it was ranked as one of the busiest airports in the world.
Berlin Brandenburg International Airport (BBIA) was constructed on part of the facilities of the original Berlin Schoenfeld International Airport and then expanded to the south. It is located between Berlin and Brandenburg about 24 km away from the main center of Berlin. The length of BBIA is about 4.9 km from east to west and its width is around 2.3 km from north to south. Officials plan for it to eventually cover 14.7 km2. The construction of BBIA began in October 2020 and the annual passenger throughput was expected to reach 33 million when terminals T1 and T2 opened for service in October 2020. The annual passenger throughput was expected to increase to 43 million passengers a year, making BBIA the third busiest airport in Germany.
These two airports were selected as research cases because of the following similarities and differences: First, the occupation scale or passenger volume of the two airports is basically identical. Second, the population density and economic scale of the two regions are similar to each other. In 2015, the urban population density of Hangzhou was 543 people per km2 and the economic aggregate was RMB 1177.45 billion. In 2015, the population density of the Berlin–Brandenburg area was 205 people per squared kilometer and the economic aggregate was EUR 19017 billion, or about RMB 1707.73 billion, according to the exchange rate at that time. Third, the countries where the two airports are located have obvious differences in terms of their institutional arrangements for ecological protection. Land development and utilization in China prioritizes cultivated land requisition–compensation at the cost of environmental protection. Germany, however, has established an ecological requisition–compensation balance system around land development and ecological protection that includes landscape planning, an ecological account system and ecological compensation measures. The similarities between these airports in their attributes and external environments, as well as the differences between their institutional environments, provide ideal research material to study the impact of airports on the surrounding ecological environment and conduct institutional analyses.
3.2. Study Period and Study Area
According to the construction and operation time of the two airports in China and Germany, the study time points of the HXIA case were set from 2006 to 2016. The study time points for the BBIA case were set from 2005 to 2016.
We selected the center of the airports as the center of gravity for the airport construction scope and selected the smallest outer rectangle with a radius of 25 km as our research area based on previous studies (Figure 3) [46,47,48]. Our decision was made based on the following three reasons: First, selecting a larger influence radius to determine the research range can reserve adjustable space for the subsequent analysis of the actual action range of the airport. Second, the minimum outer rectangle was defined with a radius of 25 km, which contains the downtown of the cities where the two airports are located (see Figure 3). Objectively, this radius can cover the possible scope of action of the two airports. Third, the shape of HXIA and BBIA’s construction scopes are different. If a minimum outer rectangle of 25 km had been created by taking each airport as the boundary, the demarcation scope of the two study areas would have had differences in areas, which was not conducive to our analysis objectives. Therefore, the study area was established by expanding outward from the center of the airports’ gravity center.
3.3. Data and Preprocessing
Landsat satellite images were used to monitor the change in ecological environment quality around the two airports. Based on the determined research time points of the two airports, Landsat images with good vegetation growth, no clouds or minimal clouds and relatively close dates between different years were collected from May to September in the corresponding years to reduce monitoring errors caused by different time points as much as possible. Specifically, for HXIA, images on 1 August 2006 and 27 July 2016 were selected. For BBIA, images on 5 September 2005 and 12 September 2016 were selected. The Level 1TP Landsat image data had been geometrically corrected and had good characteristic radiation values. Moreover, in reference to the practices implemented by Xu et al. (2017), we carried out differential atmospheric correction and mosaic processing for Landsat image data from different sources. Finally, the Landsat images were cropped according to the vector range of the two study areas.
3.4. Ecological Environment Quality
The remote sensing ecological index (RSEI) was selected to represent the ecological environment quality. RSEI integrates four ecological indexes that are closely related to the ecological environment and human survival and can be directly perceived, Greenness, Heat, Wetness and Dryness. RSEI can conduct rapid, effective and large-scale dynamic monitoring and assessment of ecological environmental quality in different regions [29,49,50]. The RSEI is expressed as
where is used to reflect regional vegetation coverage. The higher the vegetation coverage, the better the ecological environment quality. Specifically, vegetation coverage can be characterized by the Normalized Difference Vegetation Index (NDVI) [51]. is used to reflect the surface thermal environment of the region. If the heat level is too high or too low, the ecological environment quality is relatively worse. Specifically, heat is reflected in the land-surface temperature (LST). is used to convey the moisture degree of the regional surface. The higher the moisture degree, the better the ecological environment quality. Specifically, moisture can be reflected by in the tasseled hat transformation [52]. is used to reflect the regional surface dryness. The drier the surface, the worse the ecological environment quality. The Normalized Difference Built-Up Index (NDBI) reflects the surface nudity and is the main embodiment of surface dryness [29]. Consequently, NDBI was used to reflect the dryness status. In our study, is a coupling function, which can be carried out by principal component analysis. Moreover, due to the fact that the dimensionality of each ecological index is not consistent, it needed to be normalized to unify its value from 0 to 1. Therefore, the RSEI also ranges from 0 to 1. The larger the value, the better the ecological environment quality and vice versa.
(1) Normalized Difference Vegetation Index inversion: NDVI is used to reflect Greenness, which is widely used to extract vegetation coverage information [53]. The NDVI can be calculated as
where and denote a near-infrared band and a red band, respectively. The ranges from −1 to 1. The higher the value, the higher the vegetation coverage and greenness and vice versa.
(2) Surface temperature inversion: LST is used to reflect the Heat condition. Specifically, LST is inversed by the radiative transfer equation. Its basic principle is to obtain the surface temperature through reverse calculation according to Planck’s law, after eliminating the influence of the atmosphere on the thermal radiation through the surface thermal radiation reflection information recorded in the thermal infrared remote sensing image. Studies have shown that this method can obtain an inversion accuracy of land surface temperature of less than 1 K when it uses TIRS band 10 in Landsat 8 to retrieve land-surface temperature [54]. However, when TM band 6 in Landsat 5 is adopted, inversion results that are consistent with or even better than other land-surface temperature inversion algorithms can also be obtained [55]. Its core equation is expressed as
where is the land-surface temperature (LST) and and are transformation parameters. and of TM band 6 are 607.76 W·m2·µm−1·sr−1 and 1260.56 K, respectively, and those of TIRS band 10 are 774.89 W·m2·µm−1·sr−1 and 1321.08 K, respectively. is the Blackbody thermal radiation value measured according to Planck’s law and is the radiation value of the top atmosphere. , and are the atmospheric upward radiation value, the atmospheric downward radiation value and the atmospheric transmittance in the thermal infrared band, respectively, and can be obtained from the Atmospheric Correction website published by NASA [56,57]. and are the gain and bias parameters of the thermal infrared band, respectively, and can be obtained by searching the specified band through the header file of Landsat image data or the Landsat user manual. is the DN brightness value on the thermal infrared band. Finally, is the specific emissivity of the land surface and its value varies with different land cover types. Specifically, land cover can be divided into three types, water body (), urban built-up area () and natural surface () and the of each type can be calculated according to the following formula [58]:
where is the vegetation coverage index and and are the values when the surface is covered by bare soil or pure vegetation, which are 0.05 and 0.7, respectively, according to the relevant literature [15]. It was specified that was 1 when was greater than 0.7 and that was 0 when was less than 0.05.
(3) Humidity component inversion: Wet, the humidity component of the tasseled cap transform, was used to reflect the of humidity. The calculation formulas of Wet are different based on different types of remote sensing images. For Landsat 5 images, the formula is [59]
For Landsat 8 images, the equation is [60]
In the above two formulas, is the corresponding band in the Landsat image.
(4) Normalized building index inversion: NDBI is used to reflect Dryness and its expression is
where is the mid-infrared band and is the near-infrared band.
3.5. Buffer Analysis
Drawing on critical conversations about the influence range of general roads and expressways on surrounding areas [61,62], this paper adopts a buffer analysis to judge the influence range of airports on the ecological environment of surrounding areas. First, a spatial overlay analysis was used to reveal the spatial and temporal changes in the remote sensing ecological inversion indexes before and after airport construction in the two study areas. Second, taking the airport gravity center as the center and 1 km as the interval, a multi-ring buffer analysis was carried out to calculate the average annual change rate of the above indexes in different buffers and draw the average annual change rate curve with the change in buffer distance. Finally, using the location theory for reference, the scope, degree and direction of the impact of the airport on the surrounding regional ecological environment was identified through the "crests" or "troughs" in the change curve of each index.
4. Results
4.1. The Changes in Ecological Environment Quality around the Two Airports
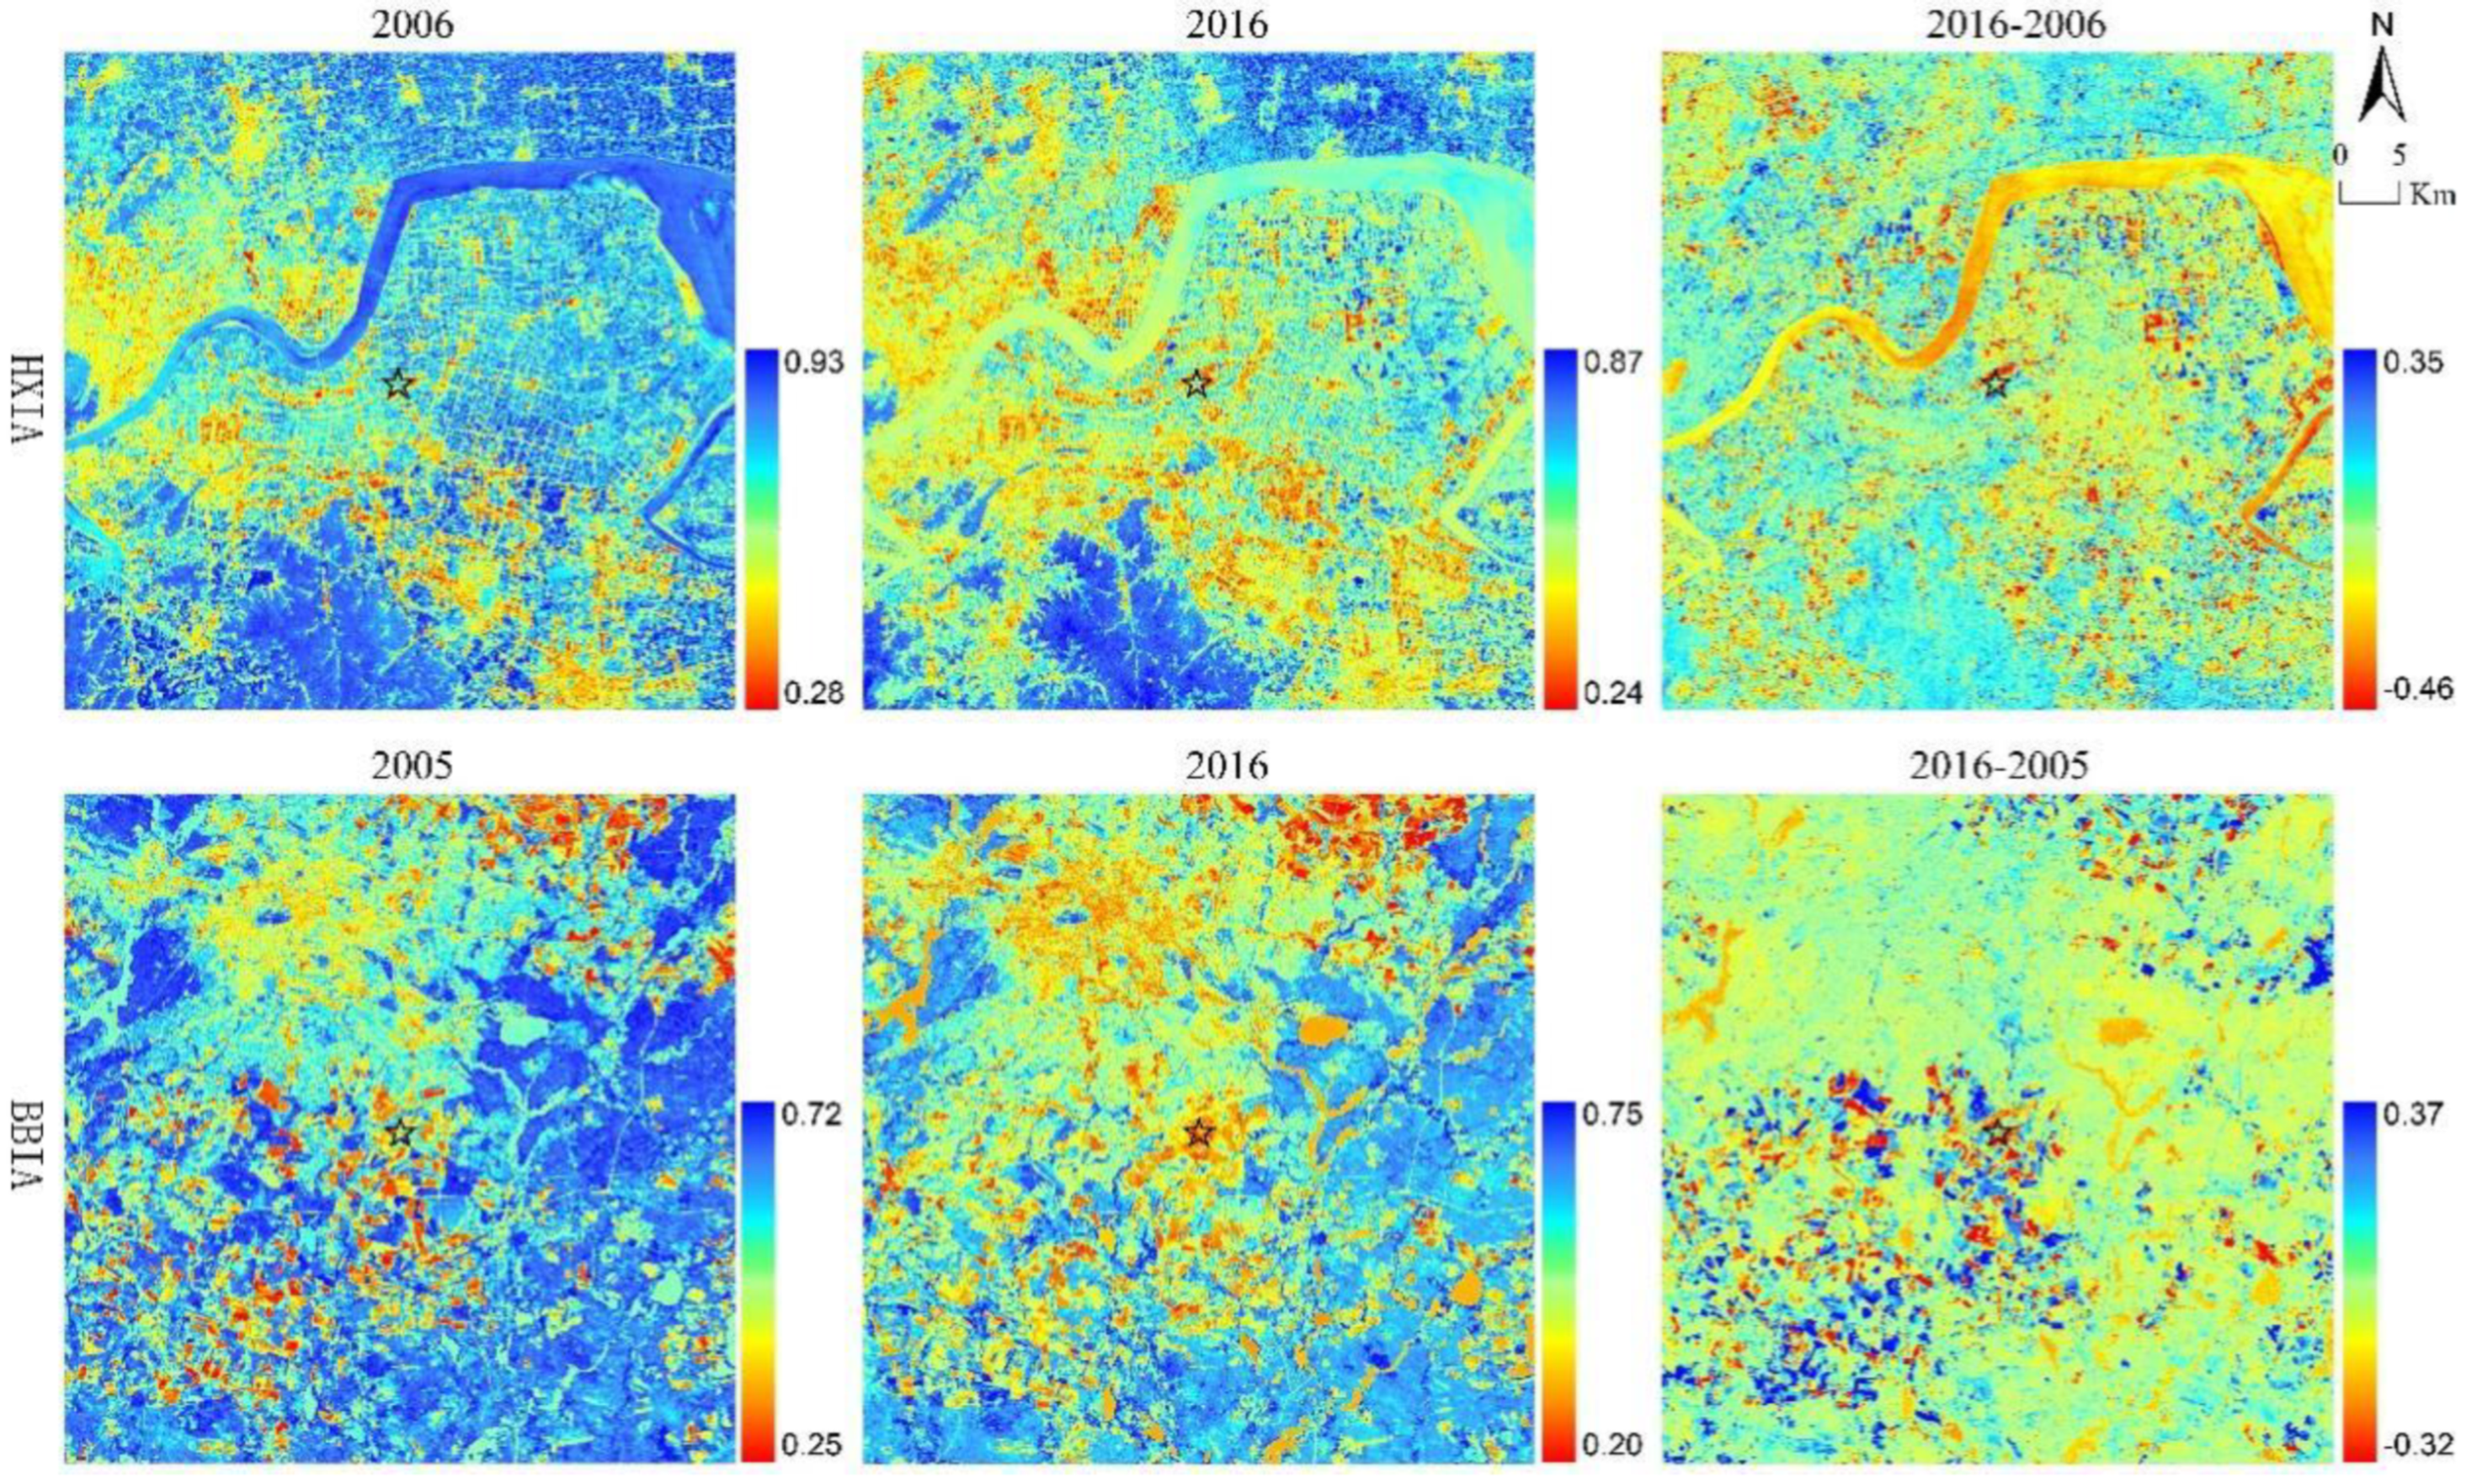
In the HXIA case, the RSEI value of the whole study area decreased significantly from 2006 to 2016, which indicates that the ecological environment quality of most areas declined (see Figure 4). The areas with decreasing RSEI values were mainly concentrated in the east of the study area and on both sides of the Qiantang River, while the areas with slightly improved ecological environments were concentrated in the main urban area of Hangzhou for the most part.
For the BBIA case, the changes in the RSEI values before and after the construction of the airport in the whole study area from 2005 to 2016 were relatively insignificant and the overall changes in ecological environmental quality were not very obvious. However, there was a large spatial variability. For example, the ecological environment quality in the southwest and northeast corner of the study area significantly improved, while the ecological environment quality change in other areas was not very obvious. The southwest portions of the BBIA research area were mostly natural ecological protection areas with little human social activities.
Further statistical analyses were conducted on the quantitative changes and differences between various ecological indicators and RSEI values in the two study areas (see Table 1). For the HXIA case, heat, wetness and dryness increased significantly, while greenness decreased significantly. These changes stemmed from the transformation of a large number of vegetated lands into impervious surface during this period, which led to the rapid decline in the ecological environment quality. For the BBIA case, the four component indexes of the study area increased to a certain extent during the study period, while the increase in wetness and greenness offset the negative impact on the ecological environment caused by the increase in heat and dryness to a certain extent, allowing the overall ecological environment quality (RSEI) of the study area to remain generally stable or slightly improve.
4.2. Influence Scopes on the Surrounding Ecological Environment
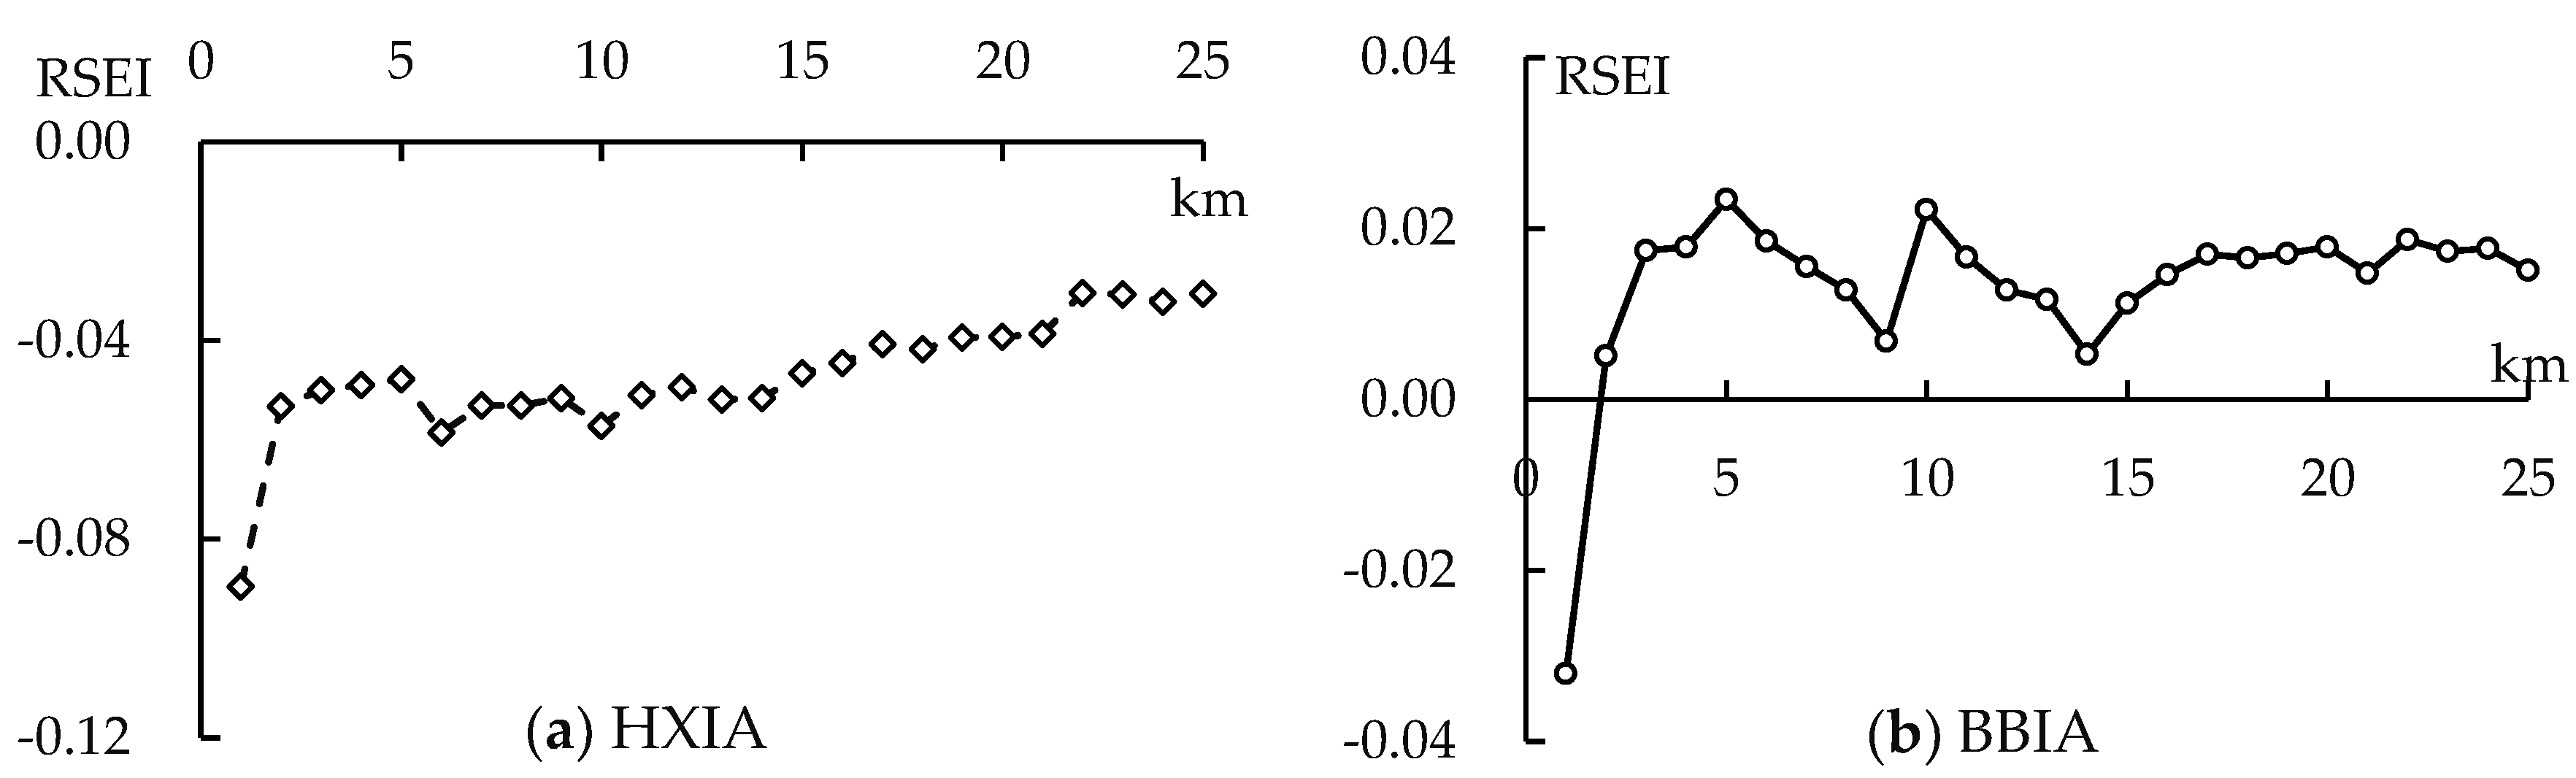
The mean value of the RSEI changes fluctuated and increased as the distance from the airport increased. Areas that were closer to the airport had a lower RSEI value, which indicates that HXIA had a negative impact on the ecological environment quality of surrounding areas (see Figure 5a). According to the change curve in the research period, there were three important inflection points, 2 km, 7 km and 10 km. Among them, the mean change value of RSEI within 2 km was significantly lower than the change value of the other buffer distances. Considering the size of the airport range and the length of the airport runway, this was obviously the result of the direct action of the airport. Within the range of 2–7 km, the mean change in RSEI increased slightly and reached a relative maximum at 7 km, which may be related to the setting of the airport isolation zone and its restriction on land development behavior, which restricted the ecological environment deterioration caused by opening activities. Within the range of 7–10 km, the mean change in RSEI decreased continuously and formed a relative minimum value at 10 km, which was closely related to the land development activities caused by the airport radiating influence and 10 km was the maximum distance of the airport’s influence. Looking at Figure 2, it can be determined that the spillover impact range of HXIA was approximately from 2 km to 10 km, with the direct impact area of the airport on the ecological environment being located within a 2 km radius.
In the case of BBIA, the mean change in RSEI in different buffer zones showed alternating changes (Figure 5b), but the overall level was relatively stable, which was basically consistent with the characteristics of small changes in RSEI and various ecological indicators in the research area. At the same time, the mean change in RESE decreased the closer an area was to the airport, which indicates that the Berlin airport had a negative impact on the ecological environment of the surrounding area. In the case of BBIA, the RSEI change curve also had three important inflection points, 2 km, 5 km and 9 km. Among them, the mean change in RSEI within the 2 km range was significantly lower than the overall level and the ecological environment quality in this area was relatively the worst. Considering the size of the airport and the length of the airport runway, this was obviously the direct effect of the airport. Within the range of 2–5 km, the mean change in RSEI increased continuously, formed a "crest" and reached the maximum value at 5 km, which may be related to the setting of the airport isolation zone, resulting in less land development activities and relatively better ecological environment quality in this area. However, within the range of 5–9 km, the mean change in RSEI decreased continuously. This was because the land development activities caused by the radiating influence of the airport had reduced the ecological environment quality, which reached its lowest level at 9 km and formed a "trough" at the farthest distance affected by the airport. Looking at Figure 2, it can be determined that the spillover effect range of the Berlin airport on the ecological environment was within 2–9 km and that the change in ecological environment that took place within 2 km was the direct result of the airport.
4.3. The Impacts of the Two Airports on the Surrounding Ecological Environment
The annual average RSEI changes in the area around the two airports within the scope of influence of 2 km, 9 km and 10 km were counted based on the influence scopes in Section 4.2 (Table 2). Within the range of 2 km, the mean change in RSEI and the annual average change in RSEI in the surrounding areas of both airports in different time periods were negative, which indicates that the two airports had a negative impact on the ecological environment of the surrounding areas and that the ecological environment quality had been reduced. In comparison, the values of the two indicators in the case of the Hangzhou airport are relatively lower, which means that the degree of negative impact on the ecological environment of the surrounding area was stronger than it was for the Berlin airport. Within the range from 2 km to 9 km, or 10 km, in the case of HXIA, the RSEI total annual average change and RSEI change in its surrounding areas during the study period were negative. This shows that HXIA had a large negative impact on the ecological environment of the surrounding region. These findings are consistent with previous research results. In the case of BBIA, both the mean change in RSEI and the annual average change in RSEI in the surrounding area were positive during the study period and the overall ecological environment quality improved to a certain extent, indicating that BBIA did not have a negatively spillover impact on the surrounding ecological environment but, instead, brought about an improvement in the ecological environmental quality.
5. Discussion
5.1. Institutional Analysis Based on the IAD Framework
Why do two airports with similar scales, location conditions and social-economic environments have significant differences in their impact on the ecological environment of surrounding regions? The answer may be connected to the different institutional arrangements for ecological environmental protection in China and Germany.
In China, the current ecological environmental protection measures in land utilization are reflected in two parts. The first is the policy that converts farmland into forests, lakes and grasslands; however, it cannot enact effective institutional constraints on the deterioration of the ecological environment caused by the construction and occupation of agricultural land [63]. The second is the cultivated land requisition–compensation balance system, which is more likely to consider the balance between the quantity and quality of cultivated land in the implementation process and does not pose any requirements for ecological requisition–compensation balance. For example, the occupation of woodland, wetland and grassland to supplement the amount of cultivated land can ensure the overall balance of the ecological value of the cultivated land ecosystem to a certain extent, but the loss of ecological value of natural resources has not been effectively controlled. This leads to a loss in the whole region’s ecological value or the deterioration of the ecological environment [64]. More importantly, the absence of environmental compensation institution reflects, to some extent, that China has paid more attention to the economic increase brought by the land development in the past and paid less attention to the ecological environmental protection and the ecological value of land resources is usually invisible and ignored in practice. Therefore, the land developer and local government, chasing the economic benefit, prefer to develop more land resources with lower cost, while the farmers have no incentives to protect the agricultural land and the ecological environment in reverse. Obviously, China’s current ecological environmental protection system cannot effectively control the behavior of land construction or stimulate the land protection among various interest groups and it would ultimately result in the deterioration of ecological environment quality. In the case of HXIA, a large amount of vegetation land in its surrounding area had been transformed into an impervious surface in the absence of a legal basis or institutional guarantee, especially one that controls the ecological requisition–compensation balance system, which would inevitably lead to the decline in regional ecological environment quality.
Meanwhile, Germany prioritizes ecological environmental protection and ecological value rebalance in land development and utilization [65]. As early as the 1970s, Germany began to incorporate land development compensation or environmental compensation policies into its spatial planning system and formed a land development compensation system that is guaranteed by law, based on planning, operated by the market and designed for public participation [66,67]. Two specific policy tools for the implementation of ecological compensation have been developed, namely, the ecological classification compensation system and the ecological compensation account system. Specifically, according to the nature-conservation law and the landscape-planning regulations of Germany [68], any ecological environment loss or damage caused by land development and utilization is required to be supplemented to maintain the same amount of farmland or ecological land. Corresponding ecological protection measures can also be taken to reduce its negative impact on the ecological environment [27], including restorative ecological compensation measures and alternative ecological compensation measures, but the ultimate goal is to ensure the relative stability of the ecological environment quality or the general balance of ecological value within a certain range. Furthermore, the ecological requisition–compensation balance system shows that Germany prefers to seek a balance between economic development and ecological protection and it makes the ecological value of land resource visible and tradable. Therefore, the cost of land development is higher and the behavior of land developers is limited, while the capital of land resource is raised and the preservation of land resources is activated for the farmers or land owners. Obviously, Germany’s ecological requisition–compensation balance system can restrain the behavior of land construction and activate the ecological protection among different actors and it would result in the dynamic balance between regional ecological environmental protection and ecological value. Under the restriction of this system, the negative impact of the Berlin airport on the ecological environment within 2–3 km of the surrounding area needs to be addressed through corresponding ecological compensation measures to make up for the loss of ecological value of the local area to ensure the overall balance of the region’s ecological environment. This is also an important reason why the ecological environment quality of the study area of the Berlin airport remained relatively stable during the whole period.
5.2. Comparison with Previous Studies
Many studies have focused on the externalities of large-scale infrastructure construction on the surrounding ecological environment [21,69], while this research study has two different characteristics from previous studies.
Firstly, by taking the airport as case study, this paper found that the externalities of airport construction on the ecological environment change are mainly concentrated in the surrounding areas, which is different from the impacts of railway and highway that are mainly distributed on both sides of the road [70,71]. This difference is attributed to the type of large-scale infrastructure. The airport is a point infrastructure and its radiation impact can spread to the surrounding areas without specific direction [37], while the railway and highway are line infrastructure and their radiation impact mainly spreads along the road with clear direction [72]. Second, previous studies have explored the constraints affecting the externalities of infrastructure on ecological environment from the perspective of economic development [12], location conditions [73] and natural environment [74]. However, by taking two airports from two different institutional backgrounds in China and Germany as comparative cases, this study further reveals the institutional factors behind the different impacts of two airports on the change in the surrounding ecological environment, which has seldom been discussed before. In fact, the quality of ecological environment and land-use change around the airport are the result of the interactions among different actors, e.g., local government, land developers and land owners or farmers, while the institutions can coordinate the behaviors and interests among various actors, which means the institutions are one of the key factors that can affect the externalities of infrastructure on ecological environmental change. In addition, whether there are differences in the externalities of infrastructure on ecological environment change in different countries or regions with different institutional environment deserves further attention in follow-up research.
5.3. Policy Implications
The reason why there were no ecological environmental protection systems in China in the early stage is that the country needed to solve the problem of food and clothing through economic development, rather than giving priority to ecological protection. This is also one of the measures usually taken by other countries in the world. However, with the continuous improvement of economic development and the increasing emphasis on ecological environmental protection, China can learn from other countries that pursue the balance between economic development and ecological protection right now. In view of Germany’s long experience in carrying out an ecological requisition–compensation balance system and an ecological compensation for land development; in the implementation of land development; and in the utilization represented by infrastructure projects, China should establish a multi-objective value system in which ecological environmental protection and ecological balance maintenance are included.
However, it is worth noting that, if China completely duplicates Germany’s ecological requisition–compensation balance system and does not make appropriate localization adjustments, it may also restrict the implementation of several necessary and livelihood projects. Specifically, mechanisms of assessment, compensation, transaction and supervision should be established around the regional ecological cost losses caused by infrastructure construction or land development and the utilization and ecological value losses caused by various land development and utilization should be objectively faced. It is necessary to either urge the subject of infrastructure construction or land development and utilization to take necessary ecological environmental protection measures, or implement ecological compensation for land development from the perspective of law or planning so as to make up for the negative impact on the regional ecological environment. At the same time, similar ecological value trading platforms or mechanisms can be constructed by drawing on the ideas of land development rights’ transfer or cultivated land occupation and compensation index cross-regional transactions in order to guide different subjects who are implementing infrastructure construction or land development and utilization. It is important to restrain the short-sighted behavior of blindly pursuing social-economic benefits while ignoring ecological benefits from the aspects of oversight and decentralization. Moreover, the current cultivated land requisition–compensation balance system in China should be transformed at a quicker pace in order to establish a multi-objective dynamic balance between ecology and cultivated land quantity and quality.
6. Conclusions
This paper reveals the spatial and temporal changes in the ecological environment around two airports before and after the construction, compares the different impacts of the two airports on the surrounding ecological environment and discusses the differences in and institutional reasons behind these discrepancies through the adoption of the IAD framework.
The results show that there were significant differences in the effects that two airports had on the surrounding regional ecological environment, which mainly manifested in the scope, degree and effect of the impact. The overall ecological environment around HXIA in China decreased significantly from 2006 to 2016, while the overall ecological environment around BBIA in Germany did not vary obviously from 2005 to 2016. Within 25 km from the center of HXIA, the quality of the ecological environment remained a declining trend during the period. However, the quality of the ecological environment began to increase within a distance from 3 to 25 km from the center of BBIA.
Furthermore, the IAD framework was used to understand the significant differences in the influences of the two airports on the surrounding ecological environment. The differences in the impact of these airports on the ecological environment of the surrounding areas mainly stem from the fact that China and Germany have different ecological environmental protection systems. The ecological requisition–compensation balance system and land development compensation system established in Germany can effectively restrict the loss of ecological value caused by construction occupation of agricultural land and achieve a general balance, thus ensuring the relative stability of the ecological environment. However, the cultivated land requisition–compensation balance system adopted by China cannot strictly restrain the decline in the overall ecological environment caused by the construction occupation of cultivated land.
This study firstly investigated the different influences of airports in various countries on the surrounding ecological environment and uncovered the institutional factors behind these differences using the IAD framework. The results of the comparison can provide policy suggestions to coordinate the development and construction of airport infrastructure for areas that lack ecological protection, for example, China. Admittedly, there are several limitations in this study. First, our methods lack an effective control over other potentially influencing factors. Specifically, we did not strip the impact of the two airports’ attribute differences and external environment differences on airport externalities. Second, the analysis of the system differences between China and Germany is still at the qualitative level and lacks strong data support. For this reason, the ideas that we present about policy and institutional simulation can be used to achieve a quantitative simulation analysis of the institutional reasons behind airport externalities based on the assessment of the mechanism of institutional influence on airport externalities, in order to further illustrate the role that institutional differences play in determining the environmental impacts of transportation infrastructure.
Author Contributions
Conceptualization, C.X. and X.L.; methodology, C.X.; software, C.X.; validation, C.X. and Y.T.; formal analysis, X.L.; investigation, C.X.; resources, C.X. and Y.T.; data curation, C.X.; writing—original draft preparation, C.X., Y.T. and X.L.; writing—review and editing, R.T. and Q.L; visualization, Y.T.; supervision, R.T.; project administration, C.X.; funding acquisition, C.X., X.L., R.T. and Q.L. All authors have read and agreed to the published version of the manuscript. X.L. and R.T. contributed equally to this study.
Funding
This work was supported by the Ministry of Education in China Key Projects of Philosophy and Social Sciences Research (grant number 20JZD013), the National Natural Science Foundation of China (grant number 72004049), Fundamental Research Funds for the Central Universities (grant number 2021ECNU-HWCBFBLW002), the China Postdoctoral Science Foundation (grant number 2021M701210), the Ministry of Education in China Liberal Arts and Social Sciences Foundation (grant number 20XJCZH009), the High-Level Talents Program of Hainan Provincial Natural Science Foundation of China (grant numbers 2019RC122, 2019RC025), the Hainan Provincial Natural Science Foundation of China (grant number 720QN241) and the Planning Research Program of Hainan Provincial Philosophy and Social Science Foundation of China (grant number JD(ZC)19-40).
Institutional Review Board Statement
Not applicable.
Informed Consent Statement
Not applicable.
Data Availability Statement
The data are contained within the article and all data sources are mentioned.
Conflicts of Interest
The authors declare no conflict of interest.
References
- Chin, M.; Ong, S.; Wai, C.; Kon, Y. The role of infrastructure on economic growth in belt and road participating countries. J. Chin. Econ. Foreign Trade Stud. 2021, 14, 169–186. [Google Scholar] [CrossRef]
- Cigu, E.; Agheorghiesei, D.T.; Toader, E. Transport infrastructure development, public performance and long-run economic growth: A case study for the Eu-28 countries. Sustainability 2019, 11, 67. [Google Scholar] [CrossRef] [Green Version]
- Owusu-Manu, D.; Edwards, D.J.; Mohammed, A.; Thwala, W.D.; Birch, T. Short run causal relationship between foreign direct investment (FDI) and infrastructure development. J. Eng. Des. Technol. 2019, 17, 1202–1221. [Google Scholar] [CrossRef]
- Duranton, G.; Turner, M.A. Urban Growth and Transportation. Rev. Econ. Stud. 2012, 79, 1407–1440. [Google Scholar] [CrossRef]
- Wang, C.; Lim, M.K.; Zhang, X.; Zhao, L.; Lee, P.T. Railway and road infrastructure in the Belt and Road Initiative countries: Estimating the impact of transport infrastructure on economic growth. Transp. Res. Part A Policy Pract. 2020, 134, 288–307. [Google Scholar] [CrossRef]
- Sharif, F.; Tauqir, A. The effects of infrastructure development and carbon emissions on economic growth. Environ. Sci. Pollut. Res. 2021, 28, 36259–36273. [Google Scholar] [CrossRef] [PubMed]
- Wu, J.; Huang, J.; Han, X.; Xie, Z.; Gao, X. Ecology. Three-Gorges Dam—Experiment in habitat fragmentation? Science 2003, 300, 1239–1240. [Google Scholar] [CrossRef] [PubMed]
- Xiong, C.; Zhang, Y.; Liu, X.; Luan, Q.; Wei, S. Urban vacant land in rapidly urbanized areas: Status, micro-level drivers, and implications. J. Chin. Gov. 2021, 6, 554–577. [Google Scholar] [CrossRef]
- Luo, Z.; Wan, G.; Wang, C.; Zhang, X. Urban pollution and road infrastructure: A case study of China. China Econ. Rev. 2018, 49, 171–183. [Google Scholar] [CrossRef]
- Garcia-López, M. Urban spatial structure, suburbanization and transportation in Barcelona. J. Urban Econ. 2012, 72, 176–190. [Google Scholar] [CrossRef] [Green Version]
- Ke, X.; Chen, H.; Hong, Y.; Hsiao, C. Do China’s high-speed-rail projects promote local economy?—New evidence from a panel data approach. China Econ. Rev. 2017, 44, 203–226. [Google Scholar] [CrossRef]
- Kasraian, D.; Maat, K.; Stead, D.; van Wee, B. Long-term impacts of transport infrastructure networks on land-use change: An international review of empirical studies. Transp. Rev. 2016, 36, 772–792. [Google Scholar] [CrossRef]
- Asgarian, A.; Amiri, B.J.; Sakieh, Y. Assessing the effect of green cover spatial patterns on urban land surface temperature using landscape metrics approach. Urban Ecosyst. 2015, 18, 209–222. [Google Scholar] [CrossRef]
- Weng, Q. A remote sensing? GIS evaluation of urban expansion and its impact on surface temperature in the Zhujiang Delta, China. Int. J. Remote Sens. 2001, 22, 1999–2014. [Google Scholar] [CrossRef]
- Yue, W.; Liu, X. Assessment on heat island effect based on urban regulatory planning. Chin. J. Appl. Ecol. 2016, 27, 3631–3640. [Google Scholar] [CrossRef]
- Addie, J.D. Flying high (in the competitive sky): Conceptualizing the role of airports in global city-regions through “aero-regionalism”. Geoforum 2014, 55, 87–99. [Google Scholar] [CrossRef] [Green Version]
- Kasarda, J.D. Airport cities: The evolution. Airpt. World 2013, 18, 24–27. [Google Scholar]
- Graham, A. Airport benchmarking: A review of the current situation. Benchmarking Int. J. 2005, 12, 99–111. [Google Scholar] [CrossRef] [Green Version]
- Pestana Barros, C.; Dieke, P.U.C. Performance evaluation of Italian airports: A data envelopment analysis. J. Air Transp. Manag. 2007, 13, 184–191. [Google Scholar] [CrossRef]
- Hersperger, A.; Gennaio, M.; Verburg, P.; Bürgi, M. Linking land change with driving forces and actors: Four conceptual models. Ecol. Soc. 2010, 15, 1–17. [Google Scholar] [CrossRef] [Green Version]
- Xiong, C.; Beckmann, V.; Tan, R. Effects of Infrastructure on Land Use and Land Cover Change (LUCC): The Case of Hangzhou International Airport, China. Sustainability 2018, 10, 2013. [Google Scholar] [CrossRef] [Green Version]
- Cheng, M.; Qin, F. Innovation in construction of local eco-civilized cities in China: Cooperative construction mechanism with multi-element objects. J. Chin. Gov. 2021, 6, 375–395. [Google Scholar] [CrossRef]
- Song, W.; Shi, Y.; Zhu, Q.; Zhang, W.; Ding, J. Evaluation on Planning of High-Speed Rail Station Area Based on Node-Place Model in Yangtze River Delta Area. Econ. Geogr. 2016, 36, 18–25. [Google Scholar] [CrossRef]
- Mokhele, M. Spatial economic attributes of OR Tambo and Cape Town airport-centric developments in South Africa. J. Transp. Supply Chain Manag. 2018, 12, 1–12. [Google Scholar] [CrossRef] [Green Version]
- Williamson, O.E. The new institutional economics: Taking stock, looking ahead. J. Econ. Lit. 2000, 38, 595–613. [Google Scholar] [CrossRef] [Green Version]
- Ho, P. The discipline of form: Why the premise of institutional form does not apply to Chinese capital, technology, land and labor. J. Chin. Gov. 2021, 6, 175–197. [Google Scholar] [CrossRef]
- Tan, R.; Wang, R.; Sedlin, T. Land-Development Offset Policies in the Quest for Sustainability: What Can China Learn from Germany? Sustainability 2014, 6, 3400–3430. [Google Scholar] [CrossRef] [Green Version]
- Tan, R.; Hu, R.; Vatn, A. What does sustainability demand? An institutionalist analysis with applications to China. J. Chin. Gov. 2021, 6, 486–514. [Google Scholar] [CrossRef]
- Hu, X.; Xu, H. A new remote sensing index based on the pressure-state-response framework to assess regional ecological change. Environ. Sci. Pollut. Res. 2019, 26, 5381–5393. [Google Scholar] [CrossRef]
- McCusker, B.; Carr, E.R. The co-production of livelihoods and land use change: Case studies from South Africa and Ghana. Geoforum 2006, 37, 790–804. [Google Scholar] [CrossRef]
- Ostrom, E.; Gardner, R.; Walker, J. Rules, Games, and Common-Pool Resources; University of Michigan Press: Ann Arbor, MI, USA, 1993. [Google Scholar]
- Ostrom, E. Understanding Institutional Diversity; Princeton University Press: Princeton, NJ, USA, 2005. [Google Scholar]
- Ostrom, E. Governing the Commons: The Evolution of Institutions for Collective Action; Cambridge University Press: Cambridge, UK, 1990. [Google Scholar]
- Gibson, C.C.; Mckean, M.A.; Ostrom, E. People and Forests: Communities, Institutions, and Governance; MIT Press: Cambridge, UK, 2000. [Google Scholar]
- Clement, F.; Amezaga, J.M. Linking reforestation policies with land use change in northern Vietnam: Why local factors matter. Geoforum 2008, 39, 265–277. [Google Scholar] [CrossRef]
- McGinnis, M.D. An introduction to IAD and the language of the Ostrom workshop: A simple guide to a complex framework. Policy Stud. J. 2011, 39, 169–183. [Google Scholar] [CrossRef]
- Swangjang, K.; Iamaram, V. Change of Land Use Patterns in the Areas Close to the Airport Development Area and Some Implicating Factors. Sustainability 2011, 3, 1517–1530. [Google Scholar] [CrossRef] [Green Version]
- Cidell, J.L. Scales of Airport Expansion: Globalization, Regionalization, and Local Land Use; The University of Minnesota Digital Conservancy: Minneapolis, MN, USA, 2004; p. 313. [Google Scholar]
- Onasch, T.B.; Jayne, J.T.; Herndon, S.; Worsnop, D.R.; Miakelye, R.C. Chemical Properties of Aircraft Engine Particulate Exhaust Emissions. J. Propuls. Power 2009, 5, 1121–1137. [Google Scholar] [CrossRef]
- Standing Committee of the National People’s Congress in China. The Civil Aviation Law of People’ Republic of China; Standing Committee of the National People’s Congress in China: Beijing, China, 1995; pp. 596–616. (In Chinese) [Google Scholar]
- Brueckner, J.K. Airline Traffic and Urban Economic Development. Urban Stud. 2016, 40, 1455–1469. [Google Scholar] [CrossRef]
- Bai, Y.; Feng, S. Spatial structure of Zhengzhou Airport Economy Zone: Its evolution and drivers. Arab. J. Geosci. 2021, 14, 1–20. [Google Scholar] [CrossRef]
- Reiss, B. Maximising non-aviation revenue for airports: Developing airport cities to maximise real estate and capitalise on land development opportunities. J. Airpt. Manag. 2007, 1, 284–293. [Google Scholar]
- Works, P.T.A.A. Clearance Area of an Airfield. Available online: http://www.planete-tp.com/en/clearance-area-of-an-airfield-a44.html (accessed on 12 January 2022).
- Zhu, Y.; Fanning, E.; Yu, R.C.; Zhang, Q.; Froines, J.R. Aircraft emissions and local air quality impacts from takeoff activities at a large International Airport. Atmos. Environ. 2011, 45, 6526–6533. [Google Scholar] [CrossRef]
- Einig, K.; Schubert, J.A. Flughäfen als Agglomeration: Zur Aerotropolisbildung in Deutschland. Eur. Reg. 2010, 16, 102–112. Available online: https://nbn-resolving.org/urn:nbn:de:0168-ssoar-48070-8 (accessed on 12 January 2022).
- Franssen, E.A.M.; Lebret, E. Aircraft noise around a large international airport and its impact on general health and medication use. Occup. Environ. Med. 2004, 61, 405. [Google Scholar] [CrossRef] [Green Version]
- Kasarda, J.D. Shopping in the airport city and aerotropolis. Res. Rev. 2008, 15, 50–56. [Google Scholar]
- Xu, H.; Wang, Y.; Guan, H.; Shi, T.; Hu, X. Detecting ecological changes with a remote sensing based ecological index (RSEI) produced time series and change vector analysis. Remote Sens. 2019, 11, 2345. [Google Scholar] [CrossRef] [Green Version]
- Zhang, X.; Liu, X.; Zhao, Z.; Ma, Y.; Yang, Y. Dynamic monitoring of ecology and environment in the agro-pastral ecotone based on remote sensing: A case of Yanchi County in Ningxia Hui Autonomous Region. Arid Land Geogr. 2017, 15, 1070–1078. [Google Scholar] [CrossRef]
- Adam, E.; Mutanga, O.; Rugege, D. Multispectral and hyperspectral remote sensing for identification and mapping of wetland vegetation: A review. Wetl. Ecol. Manag. 2010, 18, 281–296. [Google Scholar] [CrossRef]
- Todd, S.W.; Hoffer, R.M. Responses of Spectral Indices to Variations in Vegetation Cover and Soil Background. Photogramm. Eng. Remote Sens. 1998, 64, 915–921. [Google Scholar]
- Tucker, C.J.; Pinzon, J.E.; Brown, M.E.; Slayback, D.A.; Pak, E.W.; Mahoney, R.; Vermote, E.F.; El Saleous, N. An extended AVHRR 8-km NDVI dataset compatible with MODIS and SPOT vegetation NDVI data. Int. J. Remote Sens. 2005, 26, 4485–4498. [Google Scholar] [CrossRef]
- Yu, X.; Guo, X.; Wu, Z. Land Surface Temperature Retrieval from Landsat 8 TIRS—Comparison between Radiative Transfer Equation-Based Method, Split Window Algorithm and Single Channel Method. Remote Sens. 2014, 6, 9829–9852. [Google Scholar] [CrossRef] [Green Version]
- Sobrino, J.A.; Jiménez-Muñoz, J.C.; Paolini, L. Land surface temperature retrieval from LANDSAT TM 5. Remote Sens. Environ. 2004, 90, 434–440. [Google Scholar] [CrossRef]
- Barsi, J.A.; Barker, J.L.; Schott, J.R. An Atmospheric Correction Parameter Calculator for a single thermal band earth-sensing instrument. In Proceedings of the IGARSS 2003. 2003 IEEE International Geoscience and Remote Sensing Symposium, Toulouse, France, 21–25 July 2003; Volume 5, pp. 3014–3016. [Google Scholar] [CrossRef]
- Barsi, J.A.; Schott, J.R.; Palluconi, F.D.; Hook, S.J. Validation of a web-based atmospheric correction tool for single thermal band instruments. In Earth Observing Systems X; International Society for Optics and Photonics: Bellingham, WA, USA, 2005; Volume 5882, p. 58820E. [Google Scholar] [CrossRef]
- Qin, Z.; Li, W.; Xu, B.; Chen, Z.; Liu, J. The estimation of land surface emissivity for Landsat TM6. Remote Sens. Land Resour. 2004, 16, 28–32. [Google Scholar] [CrossRef]
- Crist, E.P. A TM Tasseled Cap equivalent transformation for reflectance factor data. Remote Sens. Environ. 1985, 17, 301–306. [Google Scholar] [CrossRef]
- Baig, M.H.A.; Zhang, L.; Tong, S.; Tong, Q. Derivation of a tasselled cap transformation based on Landsat 8 at-satellite reflectance. Remote Sens. Lett. 2014, 5, 423–431. [Google Scholar] [CrossRef]
- Zhao, L.; Fan, X.; Lin, H.; Hong, T.; Hong, W. Impact of expressways on land use changes, landscape patterns, and ecosystem services value in Nanping City, China. Pol. J. Env. Stud. 2021, 30, 2935–2946. [Google Scholar] [CrossRef]
- Porter-Bolland, L.; Ellis, E.A.; Gholz, H.L. Land use dynamics and landscape history in La Montaña, Campeche, Mexico. Landsc. Urban Plan. 2007, 82, 198–207. [Google Scholar] [CrossRef]
- Tan, R. Understanding the Efficiency of Farmland Conversion: Resource Allocation, Governance Structure and Institutional Environment. Ph.D. Thesis, Nanjing Agricultural University, Nanjing, China, 2008. [Google Scholar]
- Liu, L.; Liu, Z.; Gong, J.; Wang, L.; Hu, Y. Quantifying the amount, heterogeneity, and pattern of farmland: Implications for China’s requisition-compensation balance of farmland policy. Land Use Policy 2019, 81, 256–266. [Google Scholar] [CrossRef]
- Kunzmann, K.R. State planning: A German success story? Int. Plan. Stud. 2001, 6, 153–166. [Google Scholar] [CrossRef]
- Needham, P.D.B. Planning Law and Economics—The Rules We Make for Using Land; Routledge: New York, NY, USA, 2006. [Google Scholar]
- Rose, S. Environmental Policy and Federal Structure: A Comparison of the United States and Germany. Vanderbilt Law Rev. 1994, 47, 1587–1622. [Google Scholar]
- Wolfgang, W.; Wera, W.; Ilke, M.; Stefan, H.; Torsten, L.; Markus, R.; Peter, S.; Catrin, S. Putting the Plan into Practice: Implementation of Proposals for Measures of Local Landscape Plans. Landsc. Res. 2012, 37, 483–500. [Google Scholar] [CrossRef]
- Chen, Z.; Xue, J.; Rose, A.Z.; Haynes, K.E. The impact of high-speed rail investment on economic and environmental change in China: A dynamic CGE analysis. Transp. Res. Part A Policy Pract. 2016, 92, 232–245. [Google Scholar] [CrossRef]
- Topalovic, P.; Carter, J.; Topalovic, M.; Krantzberg, G. Light rail transit in Hamilton: Health, environmental and economic impact analysis. Soc. Indic. Res. 2012, 108, 329–350. [Google Scholar] [CrossRef]
- Zhang, H.; Li, X.; Liu, X.; Chen, Y.; Ou, J.; Niu, N.; Jin, Y.; Shi, H. Will the development of a high-speed railway have impacts on land use patterns in China? Ann. Am. Assoc. Geogr. 2019, 109, 979–1005. [Google Scholar] [CrossRef]
- Mejia-Dorantes, L.; Paez, A.; Vassallo, J.M. Transportation infrastructure impacts on firm location: The effect of a new metro line in the suburbs of Madrid. J. Transp. Geogr. 2012, 22, 236–250. [Google Scholar] [CrossRef] [Green Version]
- Deng, T.; Gan, C.; Perl, A.; Wang, D. What caused differential impacts on high-speed railway station area development? Evidence from global nighttime light data. Cities 2020, 97, 102568. [Google Scholar] [CrossRef]
- Liu, S.; Dong, Y.; Deng, L.; Liu, Q.; Zhao, H.; Dong, S. Forest fragmentation and landscape connectivity change associated with road network extension and city expansion: A case study in the Lancang River Valley. Ecol. Indic. 2014, 36, 160–168. [Google Scholar] [CrossRef]
Figure 1.
IAD framework of the impacts of airports on surrounding ecological environments.

Figure 2.
Theoretical curve of the impact of an airport on the surrounding ecological environment.

Figure 3.
Location and study areas of the two airports: (a) HXIA; (b) BBIA.

Figure 4.
RSEI difference distribution in the case study areas of the two airports.

Figure 5.
Average annual RSEI variation curves in different buffer zones in (a) HXIA and (b) BBIA.


Table 1.
Changes in and comparison of the overall ecological environment quality before and after the construction of the two airports.
Table 1.
Changes in and comparison of the overall ecological environment quality before and after the construction of the two airports.
| Ecological Environment Index | HXIA | BBIA | ||
|---|---|---|---|---|
| 2006 | 2016 | 2005 | 2016 | |
| RSEI | 0.689 | 0.598 | 0.580 | 0.583 |
| Heat | 0.346 | 0.467 | 0.581 | 0.602 |
| Greenness | 0.692 | 0.480 | 0.533 | 0.557 |
| Wetness | 0.785 | 0.813 | 0.707 | 0.757 |
| Dryness | 0.376 | 0.435 | 0.338 | 0.382 |
Table 2.
Comparison of the impact of the two airports on the ecological environment of the surrounding areas.
Table 2.
Comparison of the impact of the two airports on the ecological environment of the surrounding areas.
| RSEI | 2 km of Influence Range | 9 km of Influence Range | 10 km of Influence Range |
|---|---|---|---|
| Average Change | Average Change | Average Change | |
| HXIA | −0.063 | −0.047 | −0.048 |
| BBIA | −0.004 | 0.014 | 0.015 |
Publisher’s Note: MDPI stays neutral with regard to jurisdictional claims in published maps and institutional affiliations. |
© 2022 by the authors. Licensee MDPI, Basel, Switzerland. This article is an open access article distributed under the terms and conditions of the Creative Commons Attribution (CC BY) license (https://creativecommons.org/licenses/by/4.0/).
Share and Cite
MDPI and ACS Style
Xiong, C.; Tian, Y.; Liu, X.; Tan, R.; Luan, Q. The Different Impacts of Airports on the Ecological Environment under Distinct Institutional Contexts. Land 2022, 11, 291. https://0-doi-org.brum.beds.ac.uk/10.3390/land11020291
AMA Style
Xiong C, Tian Y, Liu X, Tan R, Luan Q. The Different Impacts of Airports on the Ecological Environment under Distinct Institutional Contexts. Land. 2022; 11(2):291. https://0-doi-org.brum.beds.ac.uk/10.3390/land11020291
Chicago/Turabian StyleXiong, Changsheng, Yu Tian, Xue Liu, Rong Tan, and Qiaolin Luan. 2022. "The Different Impacts of Airports on the Ecological Environment under Distinct Institutional Contexts" Land 11, no. 2: 291. https://0-doi-org.brum.beds.ac.uk/10.3390/land11020291
Note that from the first issue of 2016, this journal uses article numbers instead of page numbers. See further details here.