Article

Assessing Susceptibility to Soil Liquefaction Using the Standard Penetration Test (SPT)—A Case Study from the City of Portoviejo, Coastal Ecuador

by
Eduardo Ortiz-Hernández
1,2,*,
Kervin Chunga
2,
José Luis Pastor
1 and
Theofilos Toulkeridis
3
1
Department of Civil Engineering, University of Alicante, 03690 Alicante, Spain
2
Departamento de Construcciones Civiles, Facultad de Ciencias Matemáticas, Físicas y Químicas, Universidad Técnica de Manabí (UTM), Av. José María Urbina, Portoviejo 130111, Ecuador
3
Departamento de Ciencias de la Tierra y de la Construcción, Universidad de las Fuerzas Armadas ESPE, Sangolquí 171-5-231B, Ecuador
*
Author to whom correspondence should be addressed.
Submission received: 18 January 2022 / Revised: 4 March 2022 / Accepted: 21 March 2022 / Published: 24 March 2022
(This article belongs to the Special Issue Protection, Management and Restoration of Coastal Ecosystems)

Abstract

:
The city of Portoviejo in coastal Ecuador was severely affected during the 16 April 2016, Pedernales earthquake (Mw 7.8). Various coseismic liquefaction phenomena occurred, inducing lateral spreading, sand boils, ground subsidence, and sinkholes in soils with poor geotechnical quality in the alluvial and alluvial–colluvial sedimentary environment. Therefore, the main aim of this study was to collect data from standard penetration tests (SPT) and shear velocity and exploratory trenches and to calculate the liquefaction potential index (LPI) by considering a corresponding seismic hazard scenario with an amax = 0.5 g. From these data, a liquefaction hazard map was constructed for the city of Portoviejo, wherein an Fs of 1.169 was obtained. It was determined that strata at a depth of between 8 and 12 m are potentially liquefiable. Our quantitative results demonstrate that the city of Portoviejo’s urban area has a high probability of liquefaction, whereas the area to the southeast of the city is less sensitive to liquefaction phenomena, due to the presence of older sediments. Our results are in accordance with the environmental effects reported in the aftermath of the 2016 earthquake.

1. Introduction

Within areas with high levels of seismicity, where earthquakes occur at intervals of 20 to 70 years and soils are susceptible to coseismic ground deformations, it is absolutely necessary to perform continuous studies in order to understand which urban areas may be susceptible to liquefaction. The poor quality of the soils due to their young age produces unfavorable conditions that correspond to the Holocene [1,2,3,4,5,6,7,8,9,10,11,12]. Historically, older buildings in alluvial valleys filled with Quaternary deposits are the most vulnerable, as was documented in past earthquakes in the province of Manabí, in the central coastal area of Ecuador (Figure 1) [11,13,14,15,16,17,18,19,20,21,22,23,24,25,26,27,28,29]. Some specialists have evaluated the surface coseismic effects related to liquefaction, exposing their criteria in a variety of studies [30,31,32,33,34,35,36,37,38,39,40,41,42,43,44,45,46,47,48].
Cavallaro et al. [49] conducted an investigation in the Emilia Romagna region after an earthquake in May 2012, with the purpose of determining the phenomenon of soil liquefaction in this region, using Piezocone tests (CPTU), seismic dilatometer Marchetti tests (SDMT), and comparisons between the in situ small shear strain, laboratory shear strain, and shear strain obtained by empirical correlations. Idriss and Boulanger (2006) re-examined the semi-empirical procedures for evaluating liquefaction potential by presenting modified relationships that can be used in re-evaluations of SPT and CPT case history databases.
During the recent thrust of the Pedernales earthquake, coseismic geological effects were documented in an area of around 18,000 km2, which included various soil liquefaction features in recent sedimentary deposits, such as alluvial and alluvial–colluvial sequences, where high frequencies are related to Quaternary climatic oscillations [11,14,21,22,25,50,51]. In the seismic event that occurred on 16 April 2016, the peak ground acceleration (PGA) of the soil was 1.40 g for the city of Pedernales, while in the city of Portoviejo it was approximately 0.38 g [52]. This earthquake was recorded 10 km from the city of Pedernales off the coast of Ecuador at a depth of 21 km, with greater intensity of damage along the 100–120 km long rupture zone, from Muisne to Bahía de Caraquez [52]. In the epicentral area, the earthquake environmental effects were represented in cartography by the isosists of maximum macroseismic intensities using the Environmental Seismic Intensity, the ESI 2007 scale [2]; the maximum intensity (IX ESI-07 intensity) was recorded in the Jama–Pedernales epicentral area. The urban area of Portoviejo, which is located 150 km away, was assigned a VII-VIII ESI-07 intensity [11,14], and registered the greatest damage to buildings. The poor geotechnical quality of the soils was exacerbated by the total breakdown of 2678 collapsed dwellings [51]. Other historical effects of soil liquefaction were documented in 1942 (Mw 7.9), in the same seismogenetic segment of the South American subduction zone, on the central coast of Ecuador [13,14,15,18,21,25,27].
Within this context, several government initiatives developed building regulations, such as the Ecuadorian Construction Standards (NEC) entitled NEC-2002, NEC-2011, and NEC-2015 [53,54]; however, the seismic parameters assigned were insufficient for seismic zones where little information is available on maximum magnitudes and expected recurrences [55]. The recent Pedernales earthquake of 2016 (Mw 7.8) provided enough instrumental data for the central coast of Ecuador. However, for the rest of the territory, the seismic coefficient values may be overestimated considering the new modifications of the NEC, in which the value of the seismic threat takes into account the different seismogenic subduction structures and the active geological fault systems in the coastal continental segment and in the Andes [14,55,56,57,58].
These acceleration values can be used in studies of seismic hazards in order to obtain attenuation models that are more approximate to the seismotectonic reality of the region. Moreover, the site effects are developed by the thickness of the soft layer of sediments, the level of saturation, and its high intensity from the acceleration reached on the ground. For the urban area of Portoviejo, a local geology map was drawn up outlining the main sedimentary units using data from geotechnical boreholes and exploratory trenches (Figure 2). For alluvial and alluvial–colluvial soils, a liquefaction probability analysis was performed to determine the maximum coseismic deformations up to depth of 20 m. The liquefaction evaluation was performed using geological, geophysical, and geotechnical data from the corresponding boreholes, and standard penetration tests were used to analyze the safety factor against liquefaction (Fs) and the liquefaction potential index (LPI). These geotechnical evaluations allow liquefaction probability profiles to be obtained. GIS technology was also used in order to propose a liquefaction hazard map of potential liquefaction. Finally, a linear equivalent analysis was used to assess the response of the site, in which seismic records within the spectrum were selected. All these study techniques are useful for the foundation designs of civil projects.

2. Materials and Methods

Geotechnical, geological, geomorphological, and geophysical data were used to assess the quality of susceptible soil profiles to coseismic deformations, such as phenomenal-induced liquefaction including lateral spreading, sinkholes, sand boils, and ground subsidence [2,8,59,60,61,62]. The thicknesses of the lithological units of the soil and the seismic shear wave profiles (assessed using the Nakamura method [63]) were analyzed using 23 available boreholes of up to 30 m deep; the number of SPT blows, granulometry, and water content were assessed in the soil, and variation in soil saturation degree, liquid limit (LL), and plasticity limit of soil strata samples were analyzed. The current study, which evaluated the probability of soil liquefaction in the city of Portoviejo (Figure 3), was based on four stages: (i) The creation of a database of historical and instrumental earthquakes and geological faults capable of generating earthquakes with magnitudes greater than 6 and PGA from 0.32 g to 0.38 g; (ii) the compilation and analysis of geotechnical, geological, and geophysical results from the urban area; moreover, field reconnaissance and the preparation of a map of geological units using GIS; (iii) the calculation of the liquefaction potential index (LPI) by means of deterministic techniques from SPT tests and wave speed measurements, considering a seismic hazard of amax = 0.5 g; (iv) the preparation of liquefaction hazard maps for the city of Portoviejo, with documented coseismic evidence from the 16 April 2016 earthquake.
The present investigation involved the city of Portoviejo, which is one of the most earthquake-susceptible urban areas on the Ecuadorian coast, as illustrated in Figure 1. It is located in a river valley with an extension of 57 km2. The population in the Portoviejo canton from 1950 to 2010 increased from 63,090 to 238,430 inhabitants according to the national census [64]. The urban area of Portoviejo has 171,847 inhabitants and is the eighth most populous city in Ecuador.
The urban area has soft soils for the most part, which are classified as silt, clay, and intercalated strata of sand. However, the geomorphological features in the hydrographic basin from north to south in the direction of the seismic subduction zone (NS) can be characterized as having unfavorable conditions as regards soil behavior (Figure 2).

3. Seismotectonic Setting and Quaternary Fault Seismic Hazard

The subduction tectonic zone of Ecuador registered one of the strongest earthquakes in the last 120 years: the Mw 8.8 Esmeraldas earthquake on the northwestern coast of Ecuador. Convergence movement occurs on the coasts of Ecuador due to the Nazca plate being subducted below the South American continent. This displacement occurs at a speed of approximately 47 mm per year [65,66,67,68]. The spatial distribution of instrumental earthquakes and deep geophysical surveys delineate potential fractures in the oceanic crust. The different dips in the subducting plate, together with the rupture distance are parameters that are considered in the determination of the intensities [69,70]. Table 1 illustrates the largest magnitude subduction seismic events on the Ecuadorian Pacific coast in the province of Manabí.
Furthermore, seismic hazard analyses applied to upper plate geological faults capable of generating moderate earthquakes of 6.0 ≤ Mw ≤ 6.7 have been poorly documented for the province of Manabí [56,57,67,71]. Indeed, the records of seismic history of the entire coast of Ecuador go back no further than 240 years, and for the province of Manabí, there is a historical documentation of less than 130 years. Therefore, the seismic risk from geological faults that may be close to their seismic cycle recurrence cannot be ruled out [71,72].
In order to provide the Mw and PGA rock values to be used in the current study, we performed a capable fault hazard analysis using a deterministic approach, with a magnitude between Mw 6.0 and Mw 7.1 and with PGA values ranging from 0.32 g to 0.38 g. Herein, we analyzed the capable faults near the city of Portoviejo in a 50 km radius. Capable faults were mapped from the morphometric analysis in the terrain using digital terrain models and aerial and orthofotos, while tectonic activity was associated with recent earthquakes with hypocentral distances of less than 15 km. The most appropriate approach with which to estimate the maximum magnitude of an earthquake is the relationship with the type and fault rupture length [73,74,75]. The maximum magnitudes for each of the identified crustal faults, and the maximum vertical displacement, were estimated with the empirical regression relationships given by the magnitude earthquake versus the displacement of geological fault (Table 2), based on the work of Wesnousky [74]. They were proposed for each type of capable fault:
Strike slip faults: Mw = 5.56 + 0.87Log(Lf)
Normal faults: Mw = 6.12 + 0.47Log(Lf)
Reverse faults: Mw = 4.11 + 1.88Log(Lf)
where Lf is the capable fault length.
These regression equations indicate that different kinds of faults with similar dimensions may generate earthquakes of different magnitudes [74,75]. This was applied on the capable faults outlined in the Manabí area and with potential coseismic ground environmental effects for the city of Portoviejo. Furthermore, we estimated the PGA values using the equation proposed by Fukushima and Tanaka [76].
P G A r o c k = ( 10 0.41 M e l o g 10 ( H f + 0.032 x 10 0.41 M e ) 0.0034 H f + 1.3 ) 980
where Hf is the depth of fault and Me is the estimated magnitude.
The seismicity related to a geological fault and a catalog of 14 faults capable of deforming the ground surface and able to generate modest-to-strong earthquakes were compiled and are listed in Table 2.

4. Results and Discussion

4.1. GIS-Type Geological, Geotechnical Database and Corresponding Conditions

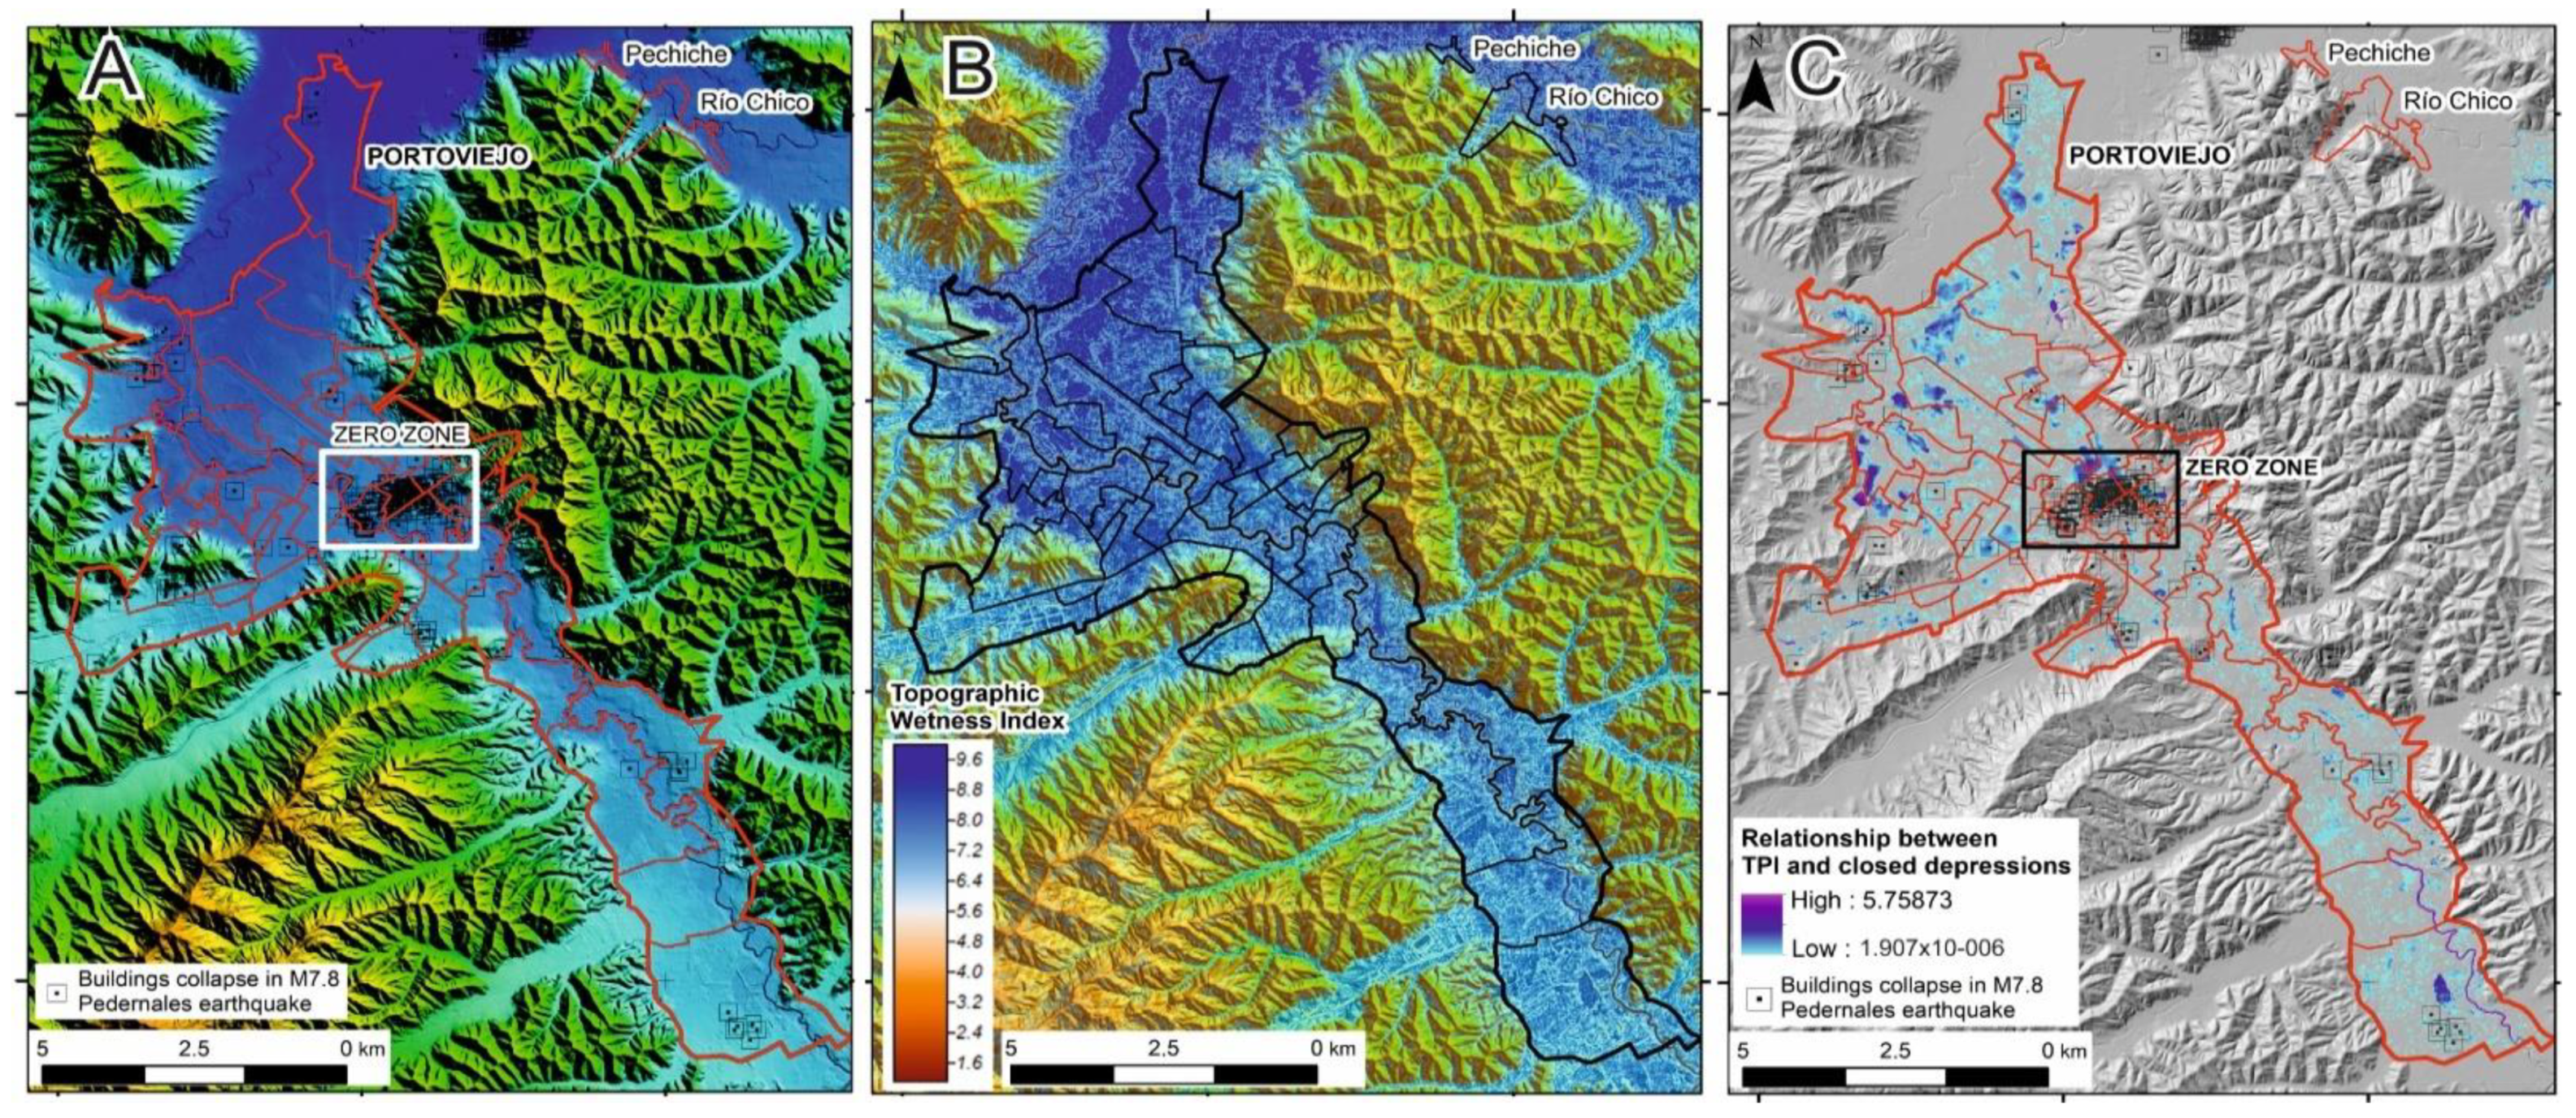
In this study, a mapping of the local geology was produced based on field recognition, aerial photos at a scale of 1:60,000, orthophotos at a scale of 1:6000, satellite images, and a flow direction analysis using the Topographic Position Index (TPI) technique. The available regional geological maps have a scale of 1:100,000 and do not well define the different lithological units of the Quaternary. The special projection of this information was inserted into an ArcGis platform and all the maps with the database were georeferenced using the WGS 84 UTM zone 17 South reference spatial System.
Borehole data were provided by the municipality of Portoviejo [
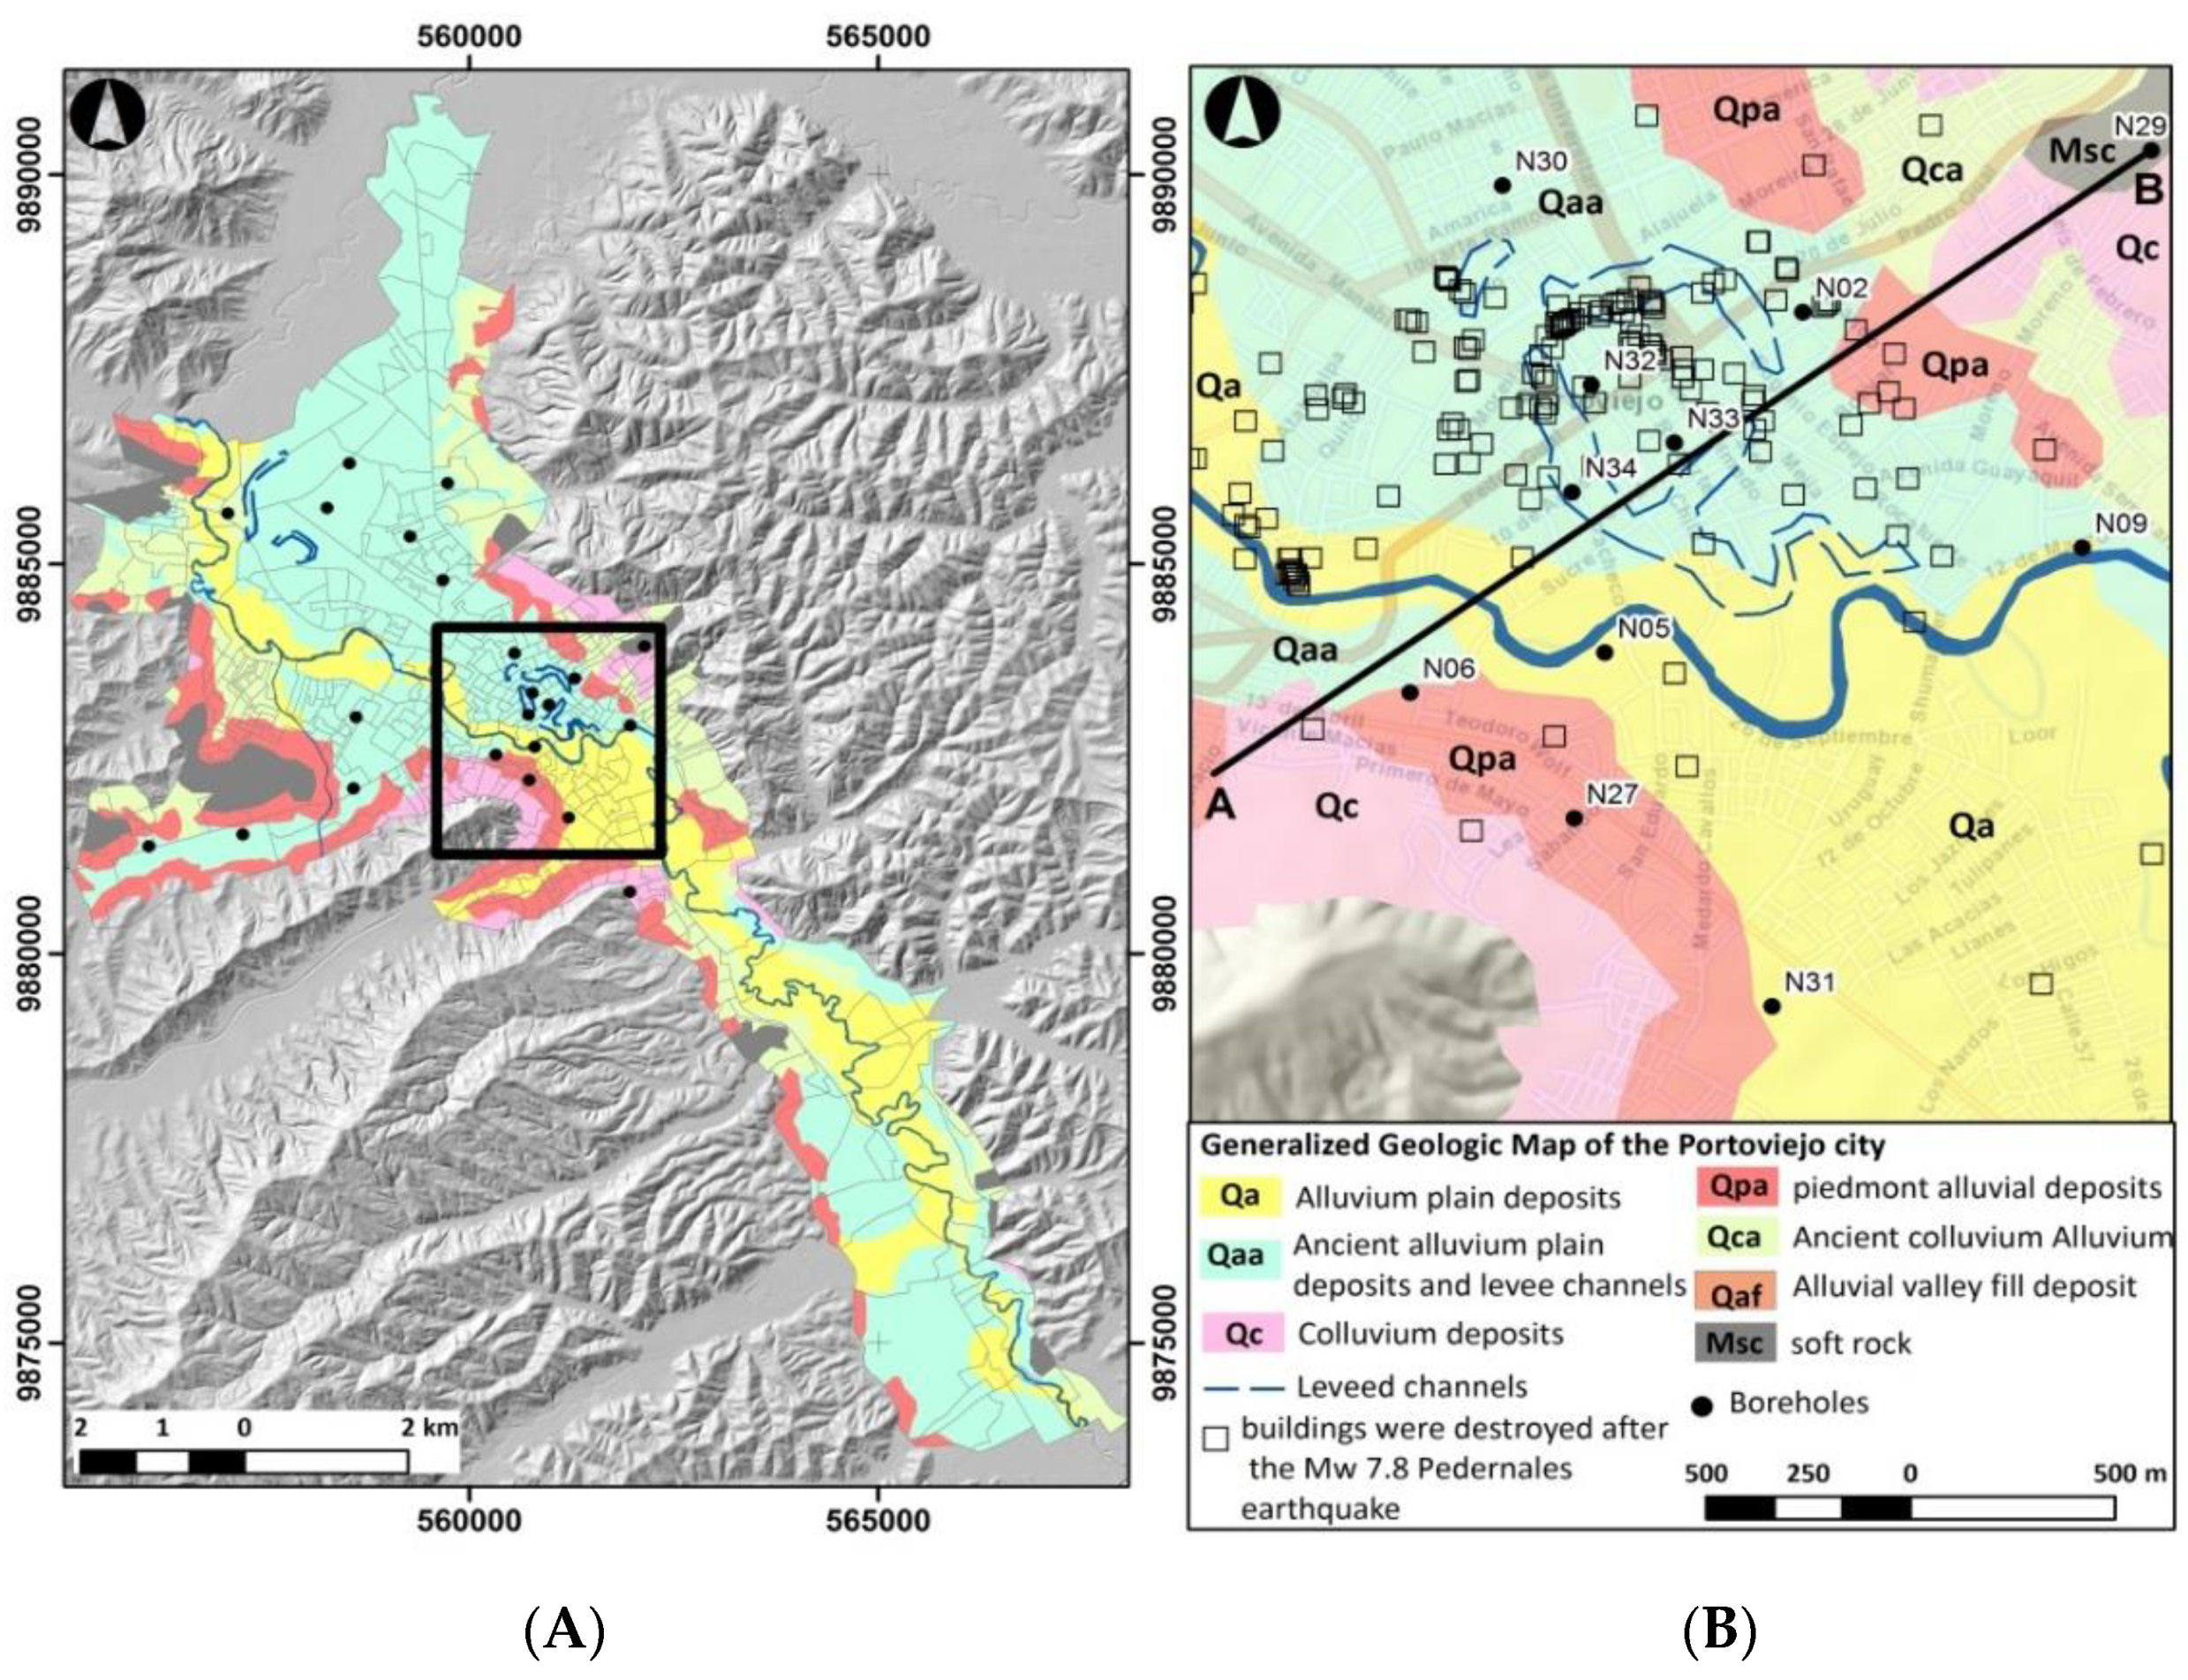
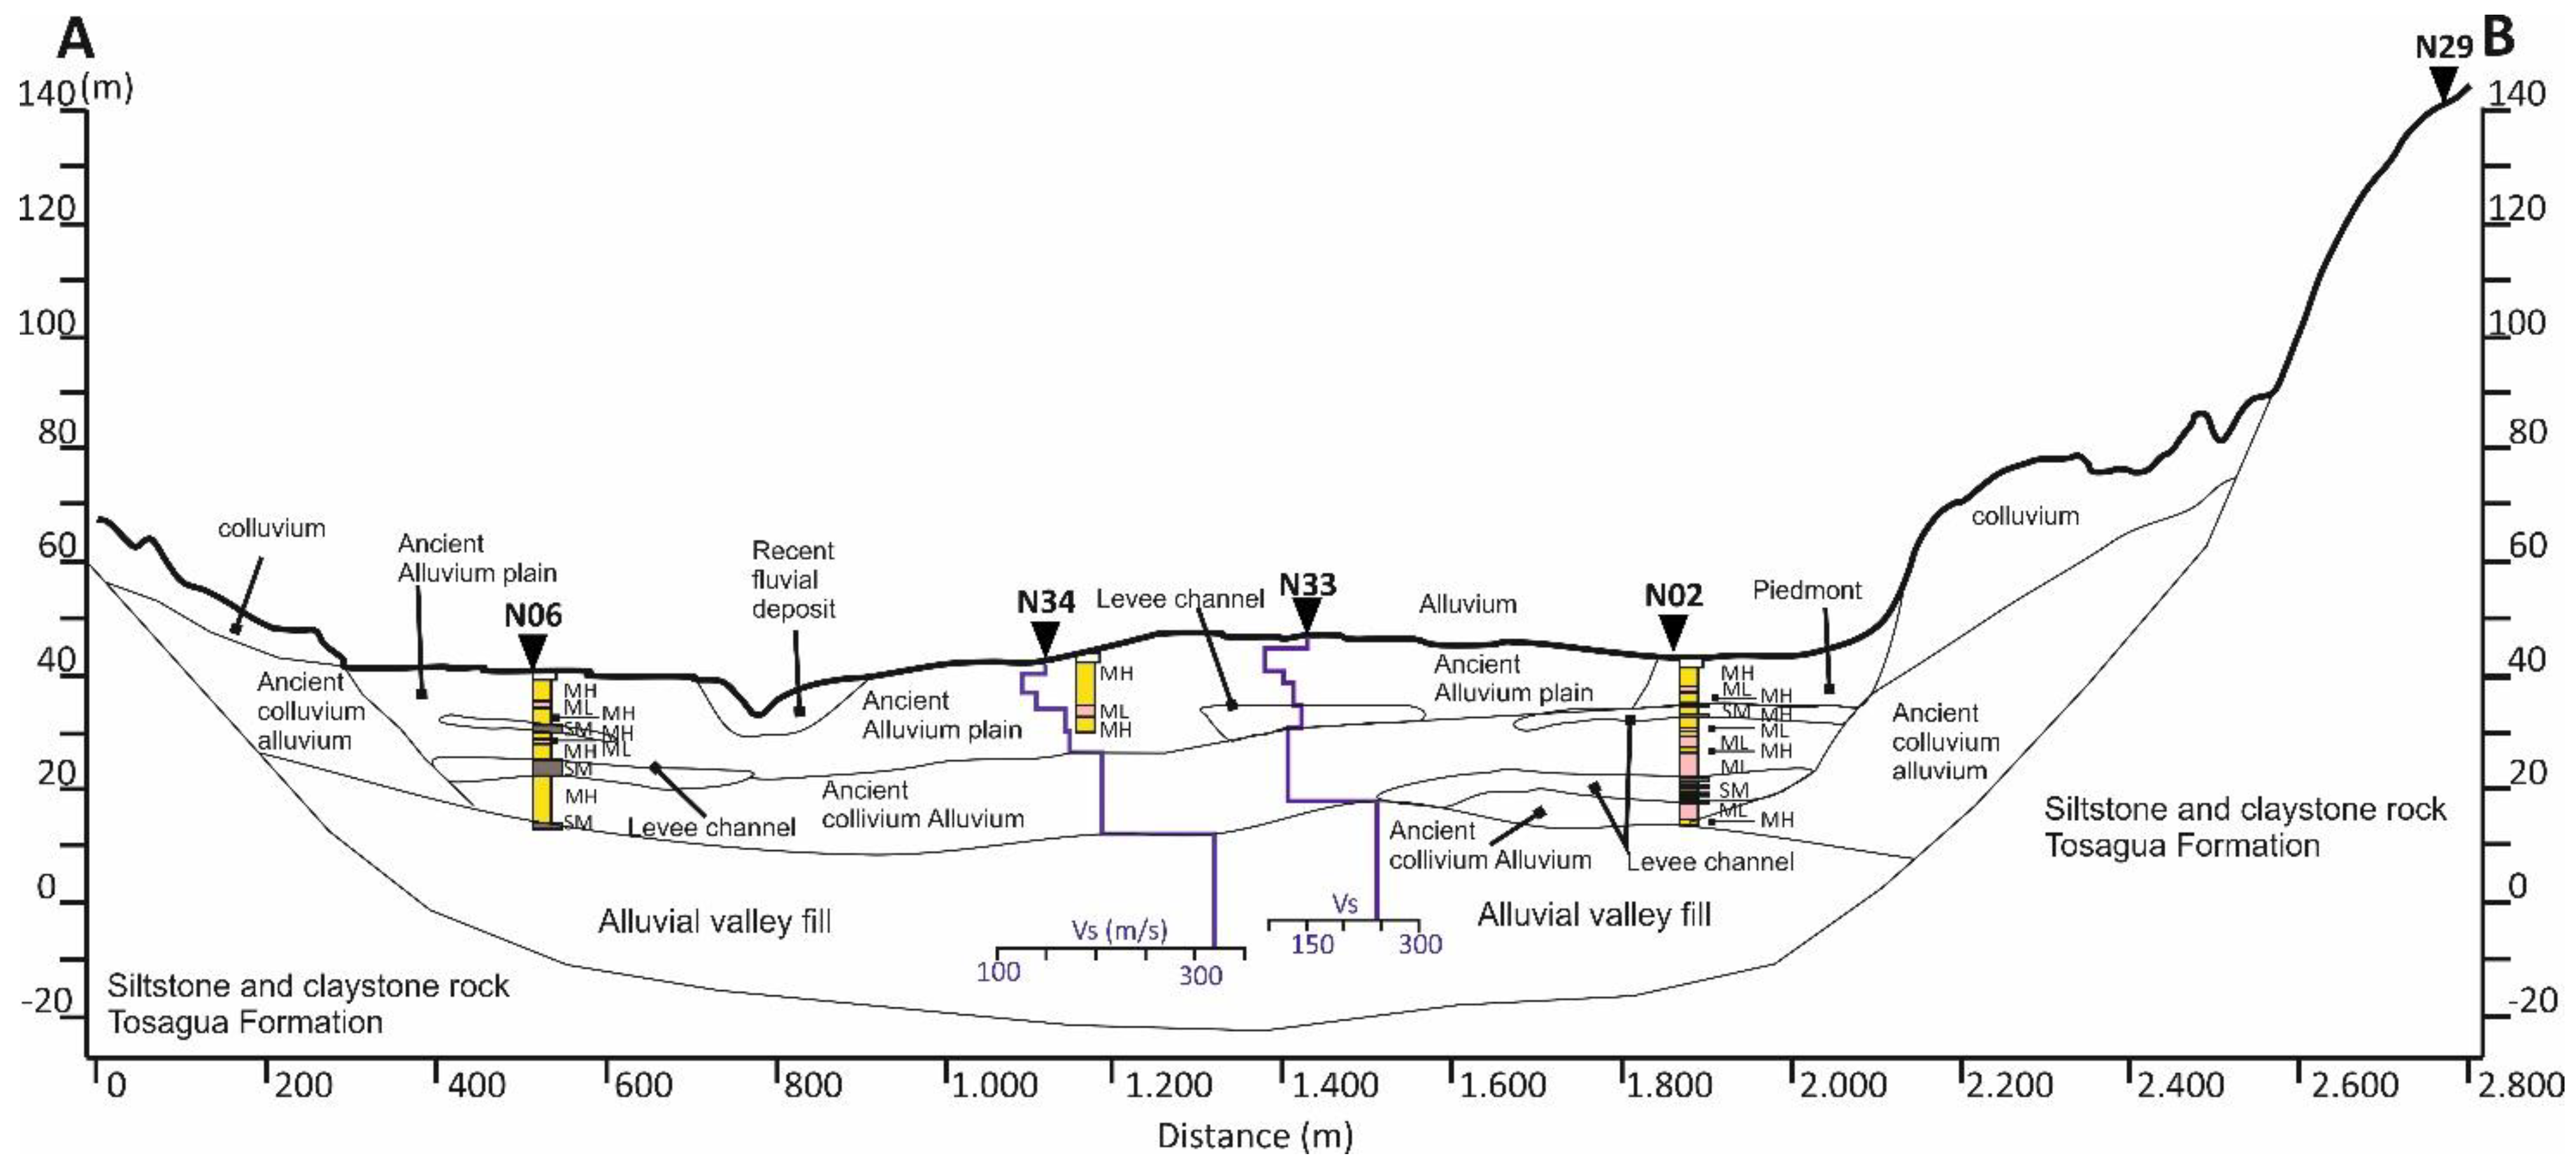
77] and private soil testing labs. The data from boreholes were used to prepare simplified geological sections illustrating the lithological structure and its relationships with the geomorphologic features of the studied area. A geological profile (AB) with a NE–SW direction of 2.8 km in length was compiled for the “ground zero” of the city of Portoviejo (Figure 3 and Figure 4), as it recorded the highest amount of damage to homes and buildings in the city during the seismic event in 2016 (Mw 7.8). This geological section is located on sedimentary deposits, composed of valleys in the presence of alluvial channels that provide important flows that are limited by slopes. These areas are characterized by the presence of artificial soils that are filled with products and waste materials with a thickness that varies between 0.5 and 4 m in relation to the natural terrain.
The soils of the city of Portoviejo are classified by the Unified Soil Classification System (SUCS) in Table 3; in addition, the shear rate, age, and geological units by strata with their respective thicknesses are given. Soils that correspond to the Holocene are present with strata ranging from 4 to 18 m and a shear rate that varies between 110 and 150 m/s. With respect to the oldest deposits of the alluvial plains, there are strata with a compactness varying with depth from soft to firm. The geomorphological position of the channels varies with discontinuous stratified heights in ages ranging from the Holocene to the Upper Pleistocene, with wave speeds from 150 to 230 m/s.
The rocky basement (Msc) of the Miocene age is composed of siltstones and claystones from the Tosagua geological formation, in which the shear rate must be greater than 650 m/s [78,79,80].

4.2. Liquefaction Susceptibility Analysis

In seismic areas with moderate to high magnitude levels, the soil liquefaction is among the main causes of structural damage in saturated loose silt and/or sand sediments of Holocene age during earthquakes [11,81,82]. In many cases, urban areas susceptible to soil liquefaction have seen rapid unplanned population growth; however, there are few regulations from the competent agencies related to territorial planning that involve types of soils prone to seismic environmental effects [2,83,84,85], i.e., they are not considered in municipal cadastral systems.
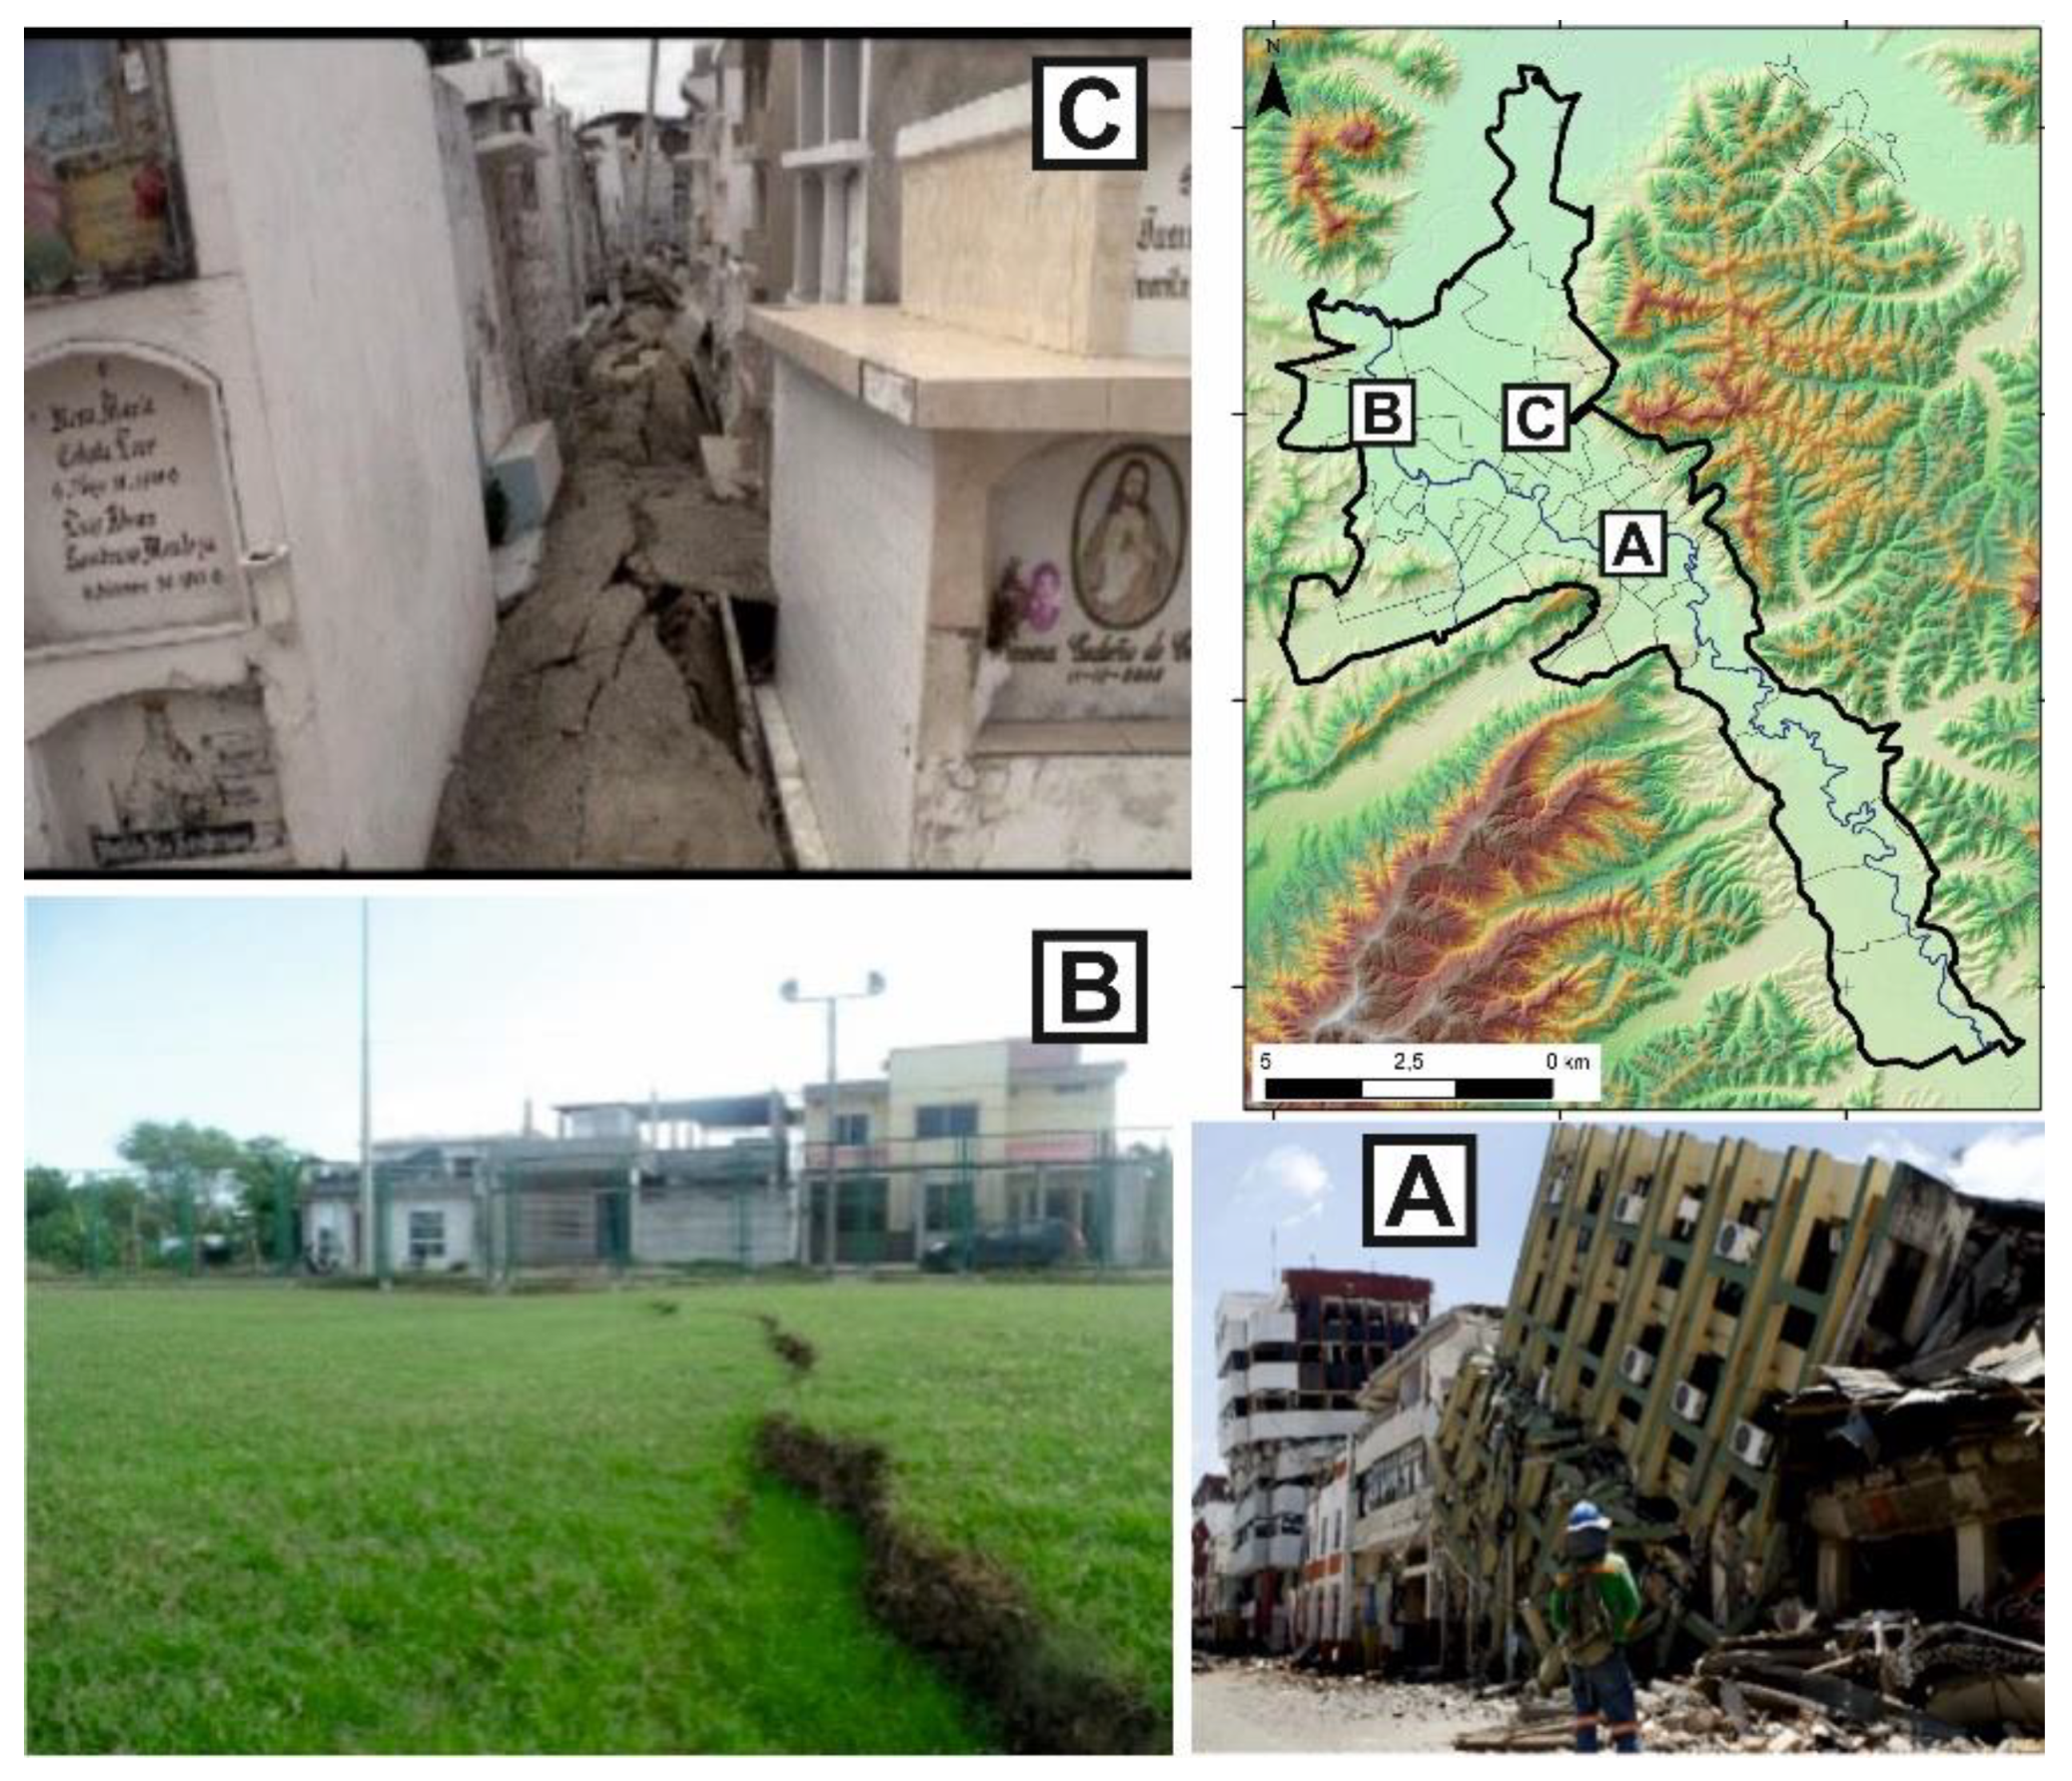
Many of the collapsed buildings were sitting on these potentially liquefiable soils [51]; the inadequate structural designs caused the collapse and destruction of about 2100 houses located on lateral spreading, sand boils, subsidence, and sinkholes. All of these features occurred in the urban center of Portoviejo city, where there was the highest concentration of damage to homes. In the current study, we also considered other seismogenic structures, e.g., local earthquakes attributed to crustal geological faults, which may have caused similar or greater coseismic liquefaction effects in these Holocene geological units. The liquefaction susceptibility was analyzed for both seismic sources.
In order to determine the probability of liquefaction in the city of Portoviejo, we utilized the methodology proposed by Chen and Juang [38] to calculate the safety factor per stratum, considering it to be the ratio between the cyclic resistance ratio (CRR) and the cyclic stress ratio (CSR). Portoviejo urban area is built on geological units including early Holocene to late Pleistocene floodplain deposits, channel deposits and floodplain deposits, and groundwater outcrops at least 6 m deep [54,86,87,
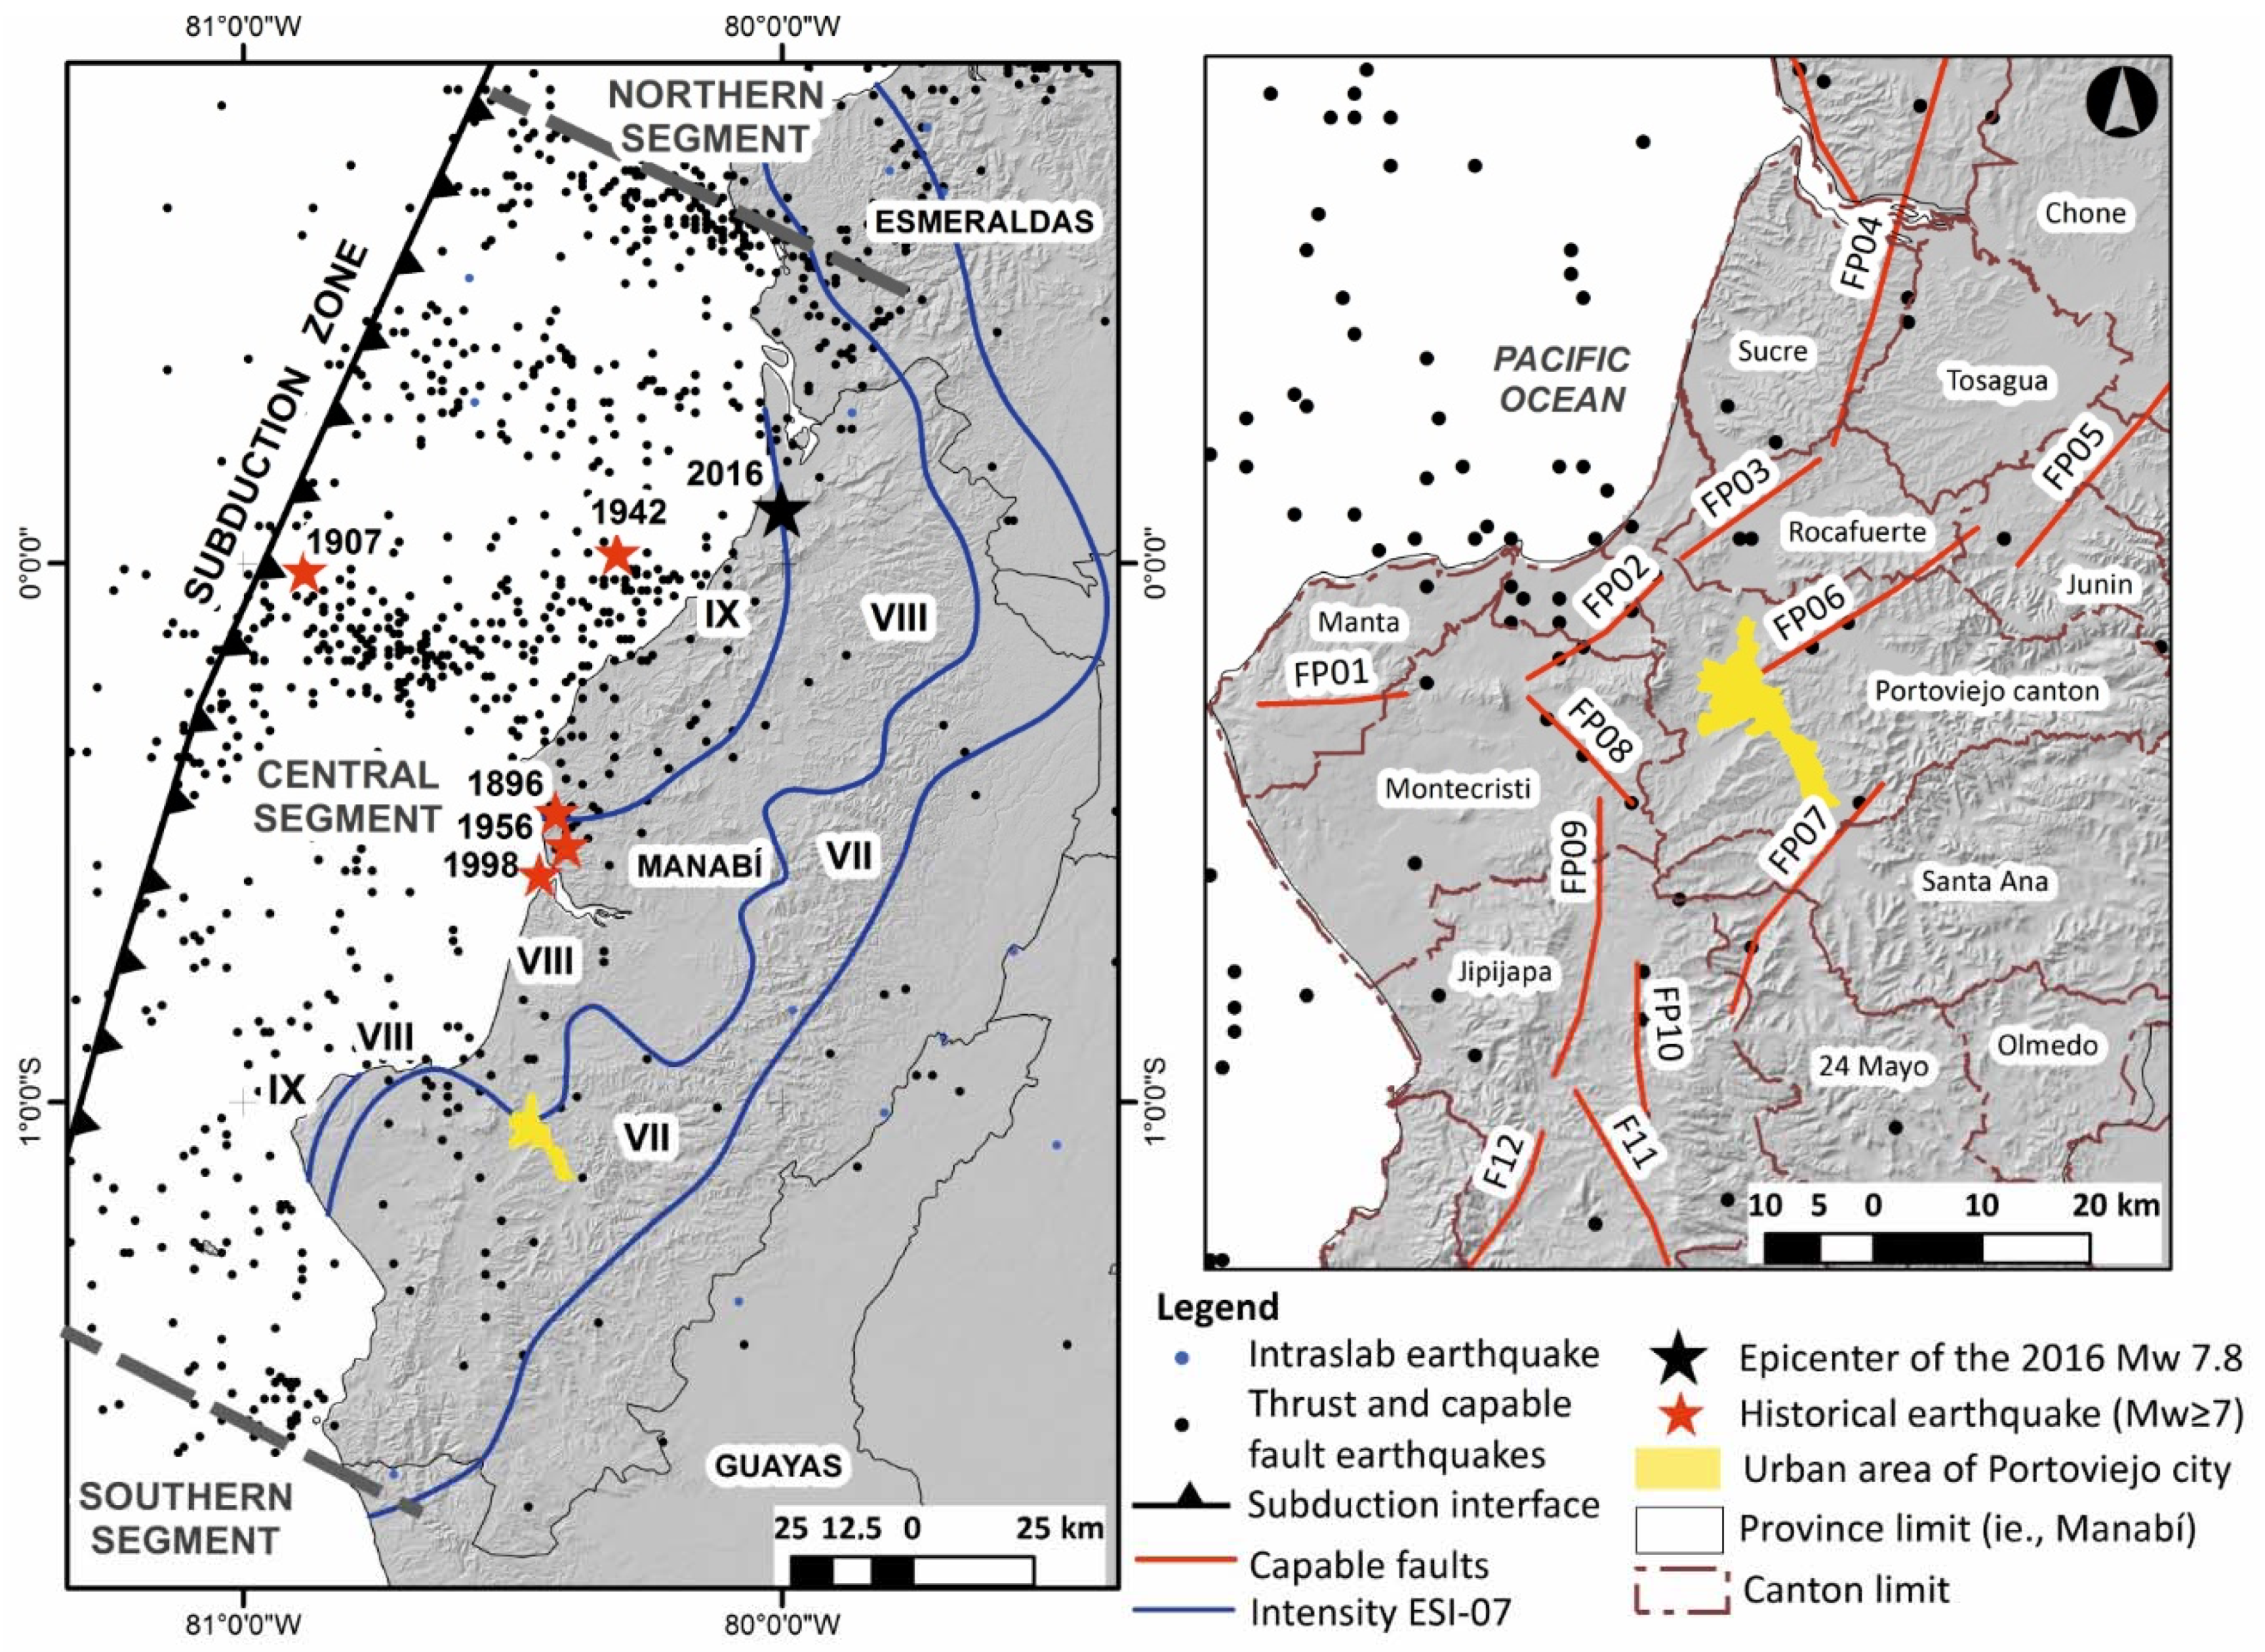
88]. In addition, there is evidence of historical liquefaction during the mega-earthquakes of 13 May 1942 (Mw 7.9) and 16 April 2016 (Mw 7.8) [14,17,22,89].
Many of the geological faults studied herein have recent records of active seismicity but of low magnitude [52]. Local earthquakes are not documented in the seismic catalogs due to incomplete historical records (covering less than 130 years) and the long recurrence of geological fault activation; however, the related seismic hazards should not be ruled out.
For the evaluation of the liquefaction potential index, soil characterization tests were conducted, including granulometry, liquid limits, plastic limit, and considered geotechnical parameters, as proposed by Wang [90], Seed and Idriss [31], and Chen and Juang [
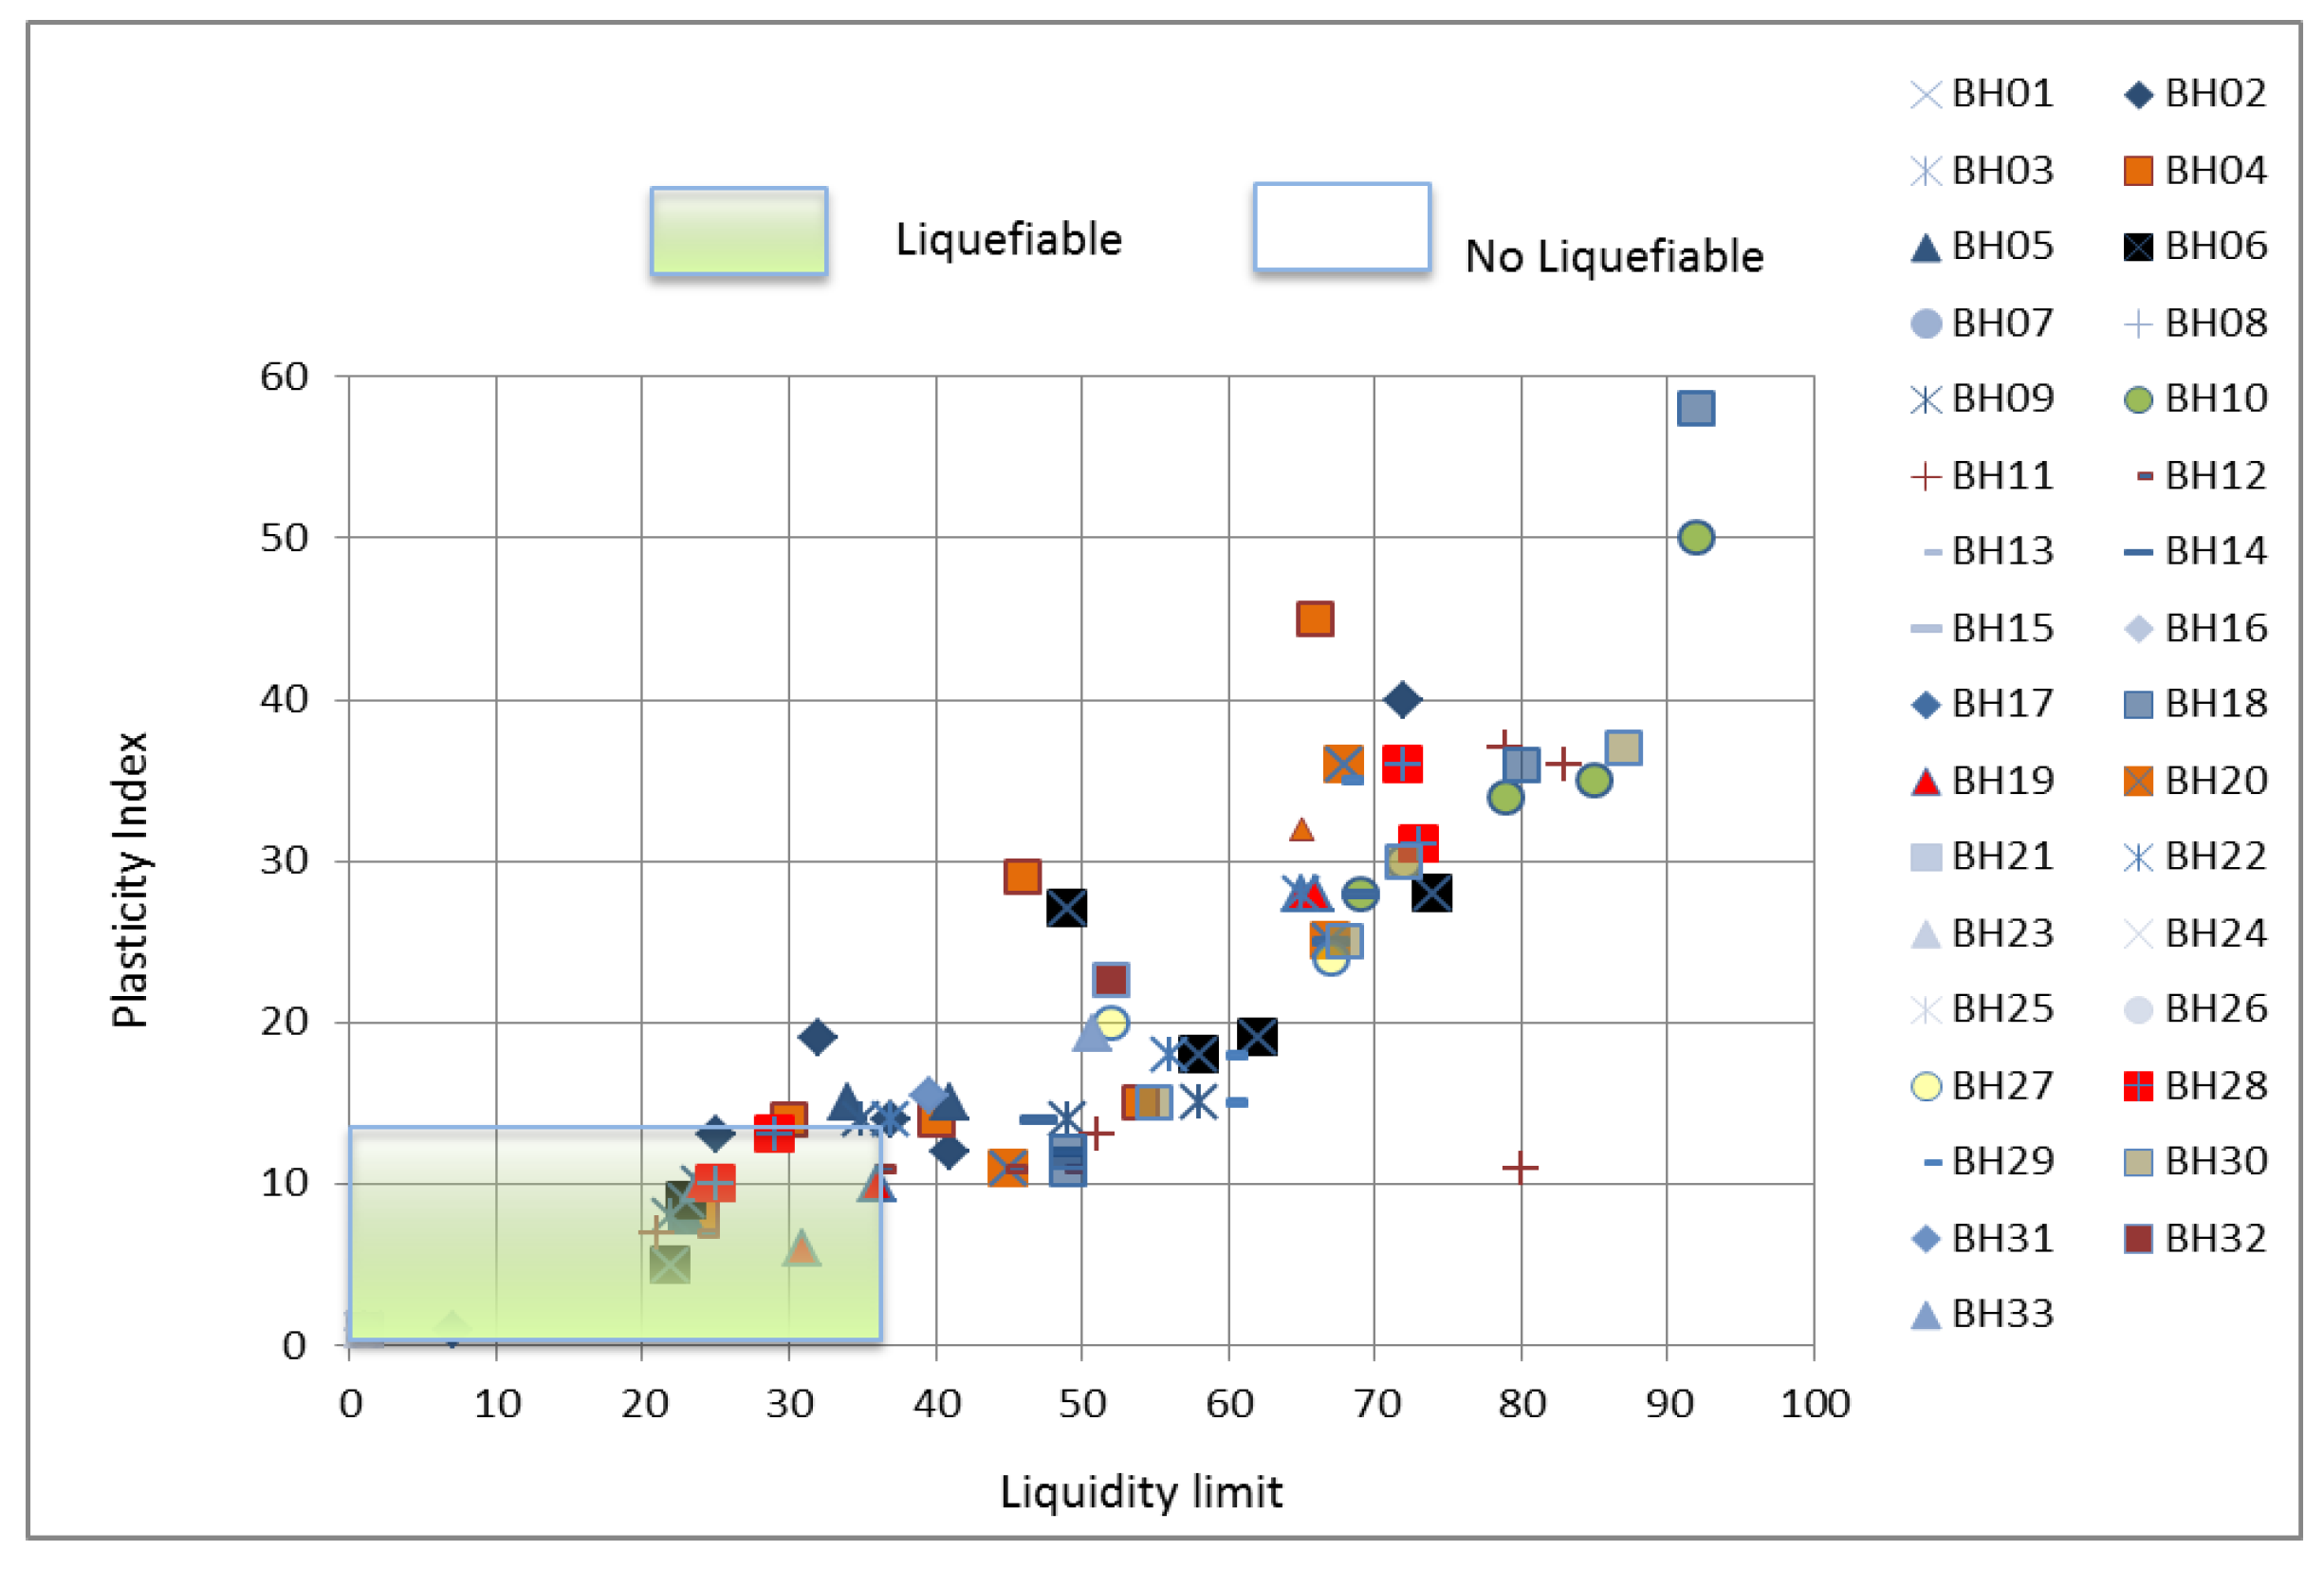
38]. An evaluation of these geotechnical parameters in a total of 21 geotechnical boreholes was conducted in this study; borehole data were provided by the municipality of Portoviejo and various other private soil laboratories. The initial approach involved classifying these geologic units as liquefiable soils if saturated according to Seed et al. [40], which indicates that the plasticity behavior of fine size particles of soils is more important than the percent clay size, while there are numerous cases of liquefaction with more than 10% clay-sized fines. Allowing for these criteria, soils with a fine content of more than 35% were characterized as potentially liquefiable when the liquid limit was less than 37, the plasticity index was less than 12 (LL ≤ 37 and PI ≤ 12), and the water content was high relative to their Liquid Limit (wc > 0.8 LL).
The soils analyzed from the city of Portoviejo indicate certain deep strata from the Holocene to Pleistocene ages, which are also potentially liquefiable when close to 100% saturation. They are considered “probably liquefiable” when the liquid limit is less than 37% related to a plasticity of less than 12% [40]. The geotechnical results for the “ground zero” of the city of Portoviejo are listed in Table 4. The granulometry results are as follows: (i) 95% saturation in alluvial plain deposits, and 84% saturation of the dike channel and old alluvial deposits; (ii) saturation between 5% and 99% of the fine particle fraction for flat alluvial deposits and between 75% and 97% for old alluvial deposits; (iii) the diameter of the D50 particle between 0.03–0.23 mm for the floodplain, dike channel, and old alluvium; (iv) the coefficient of uniformity (CU) ranges from 2 to 3.75 and the coefficient of curvature between 0.9 to 3.75 for fine to coarse silt and fine sand, according to the SUCS classification.
Figure 5 illustrates the susceptibility of the soil to liquefaction based on the previously proposed criteria [40]. The analysis indicates that liquefiable soils with low plasticity are found in the alluvium plain, the levee channel, and ancient alluvium deposits. The non-liquefiable yield (LL) values of the soils were between 60% and 80%, and the (PL) values were up to 52%. They correspond to the ancient alluvium plain (U3) and colluvium (U4) deposits, respectively (Figure 4). The analyzed samples were taken at a depth of 10 m.
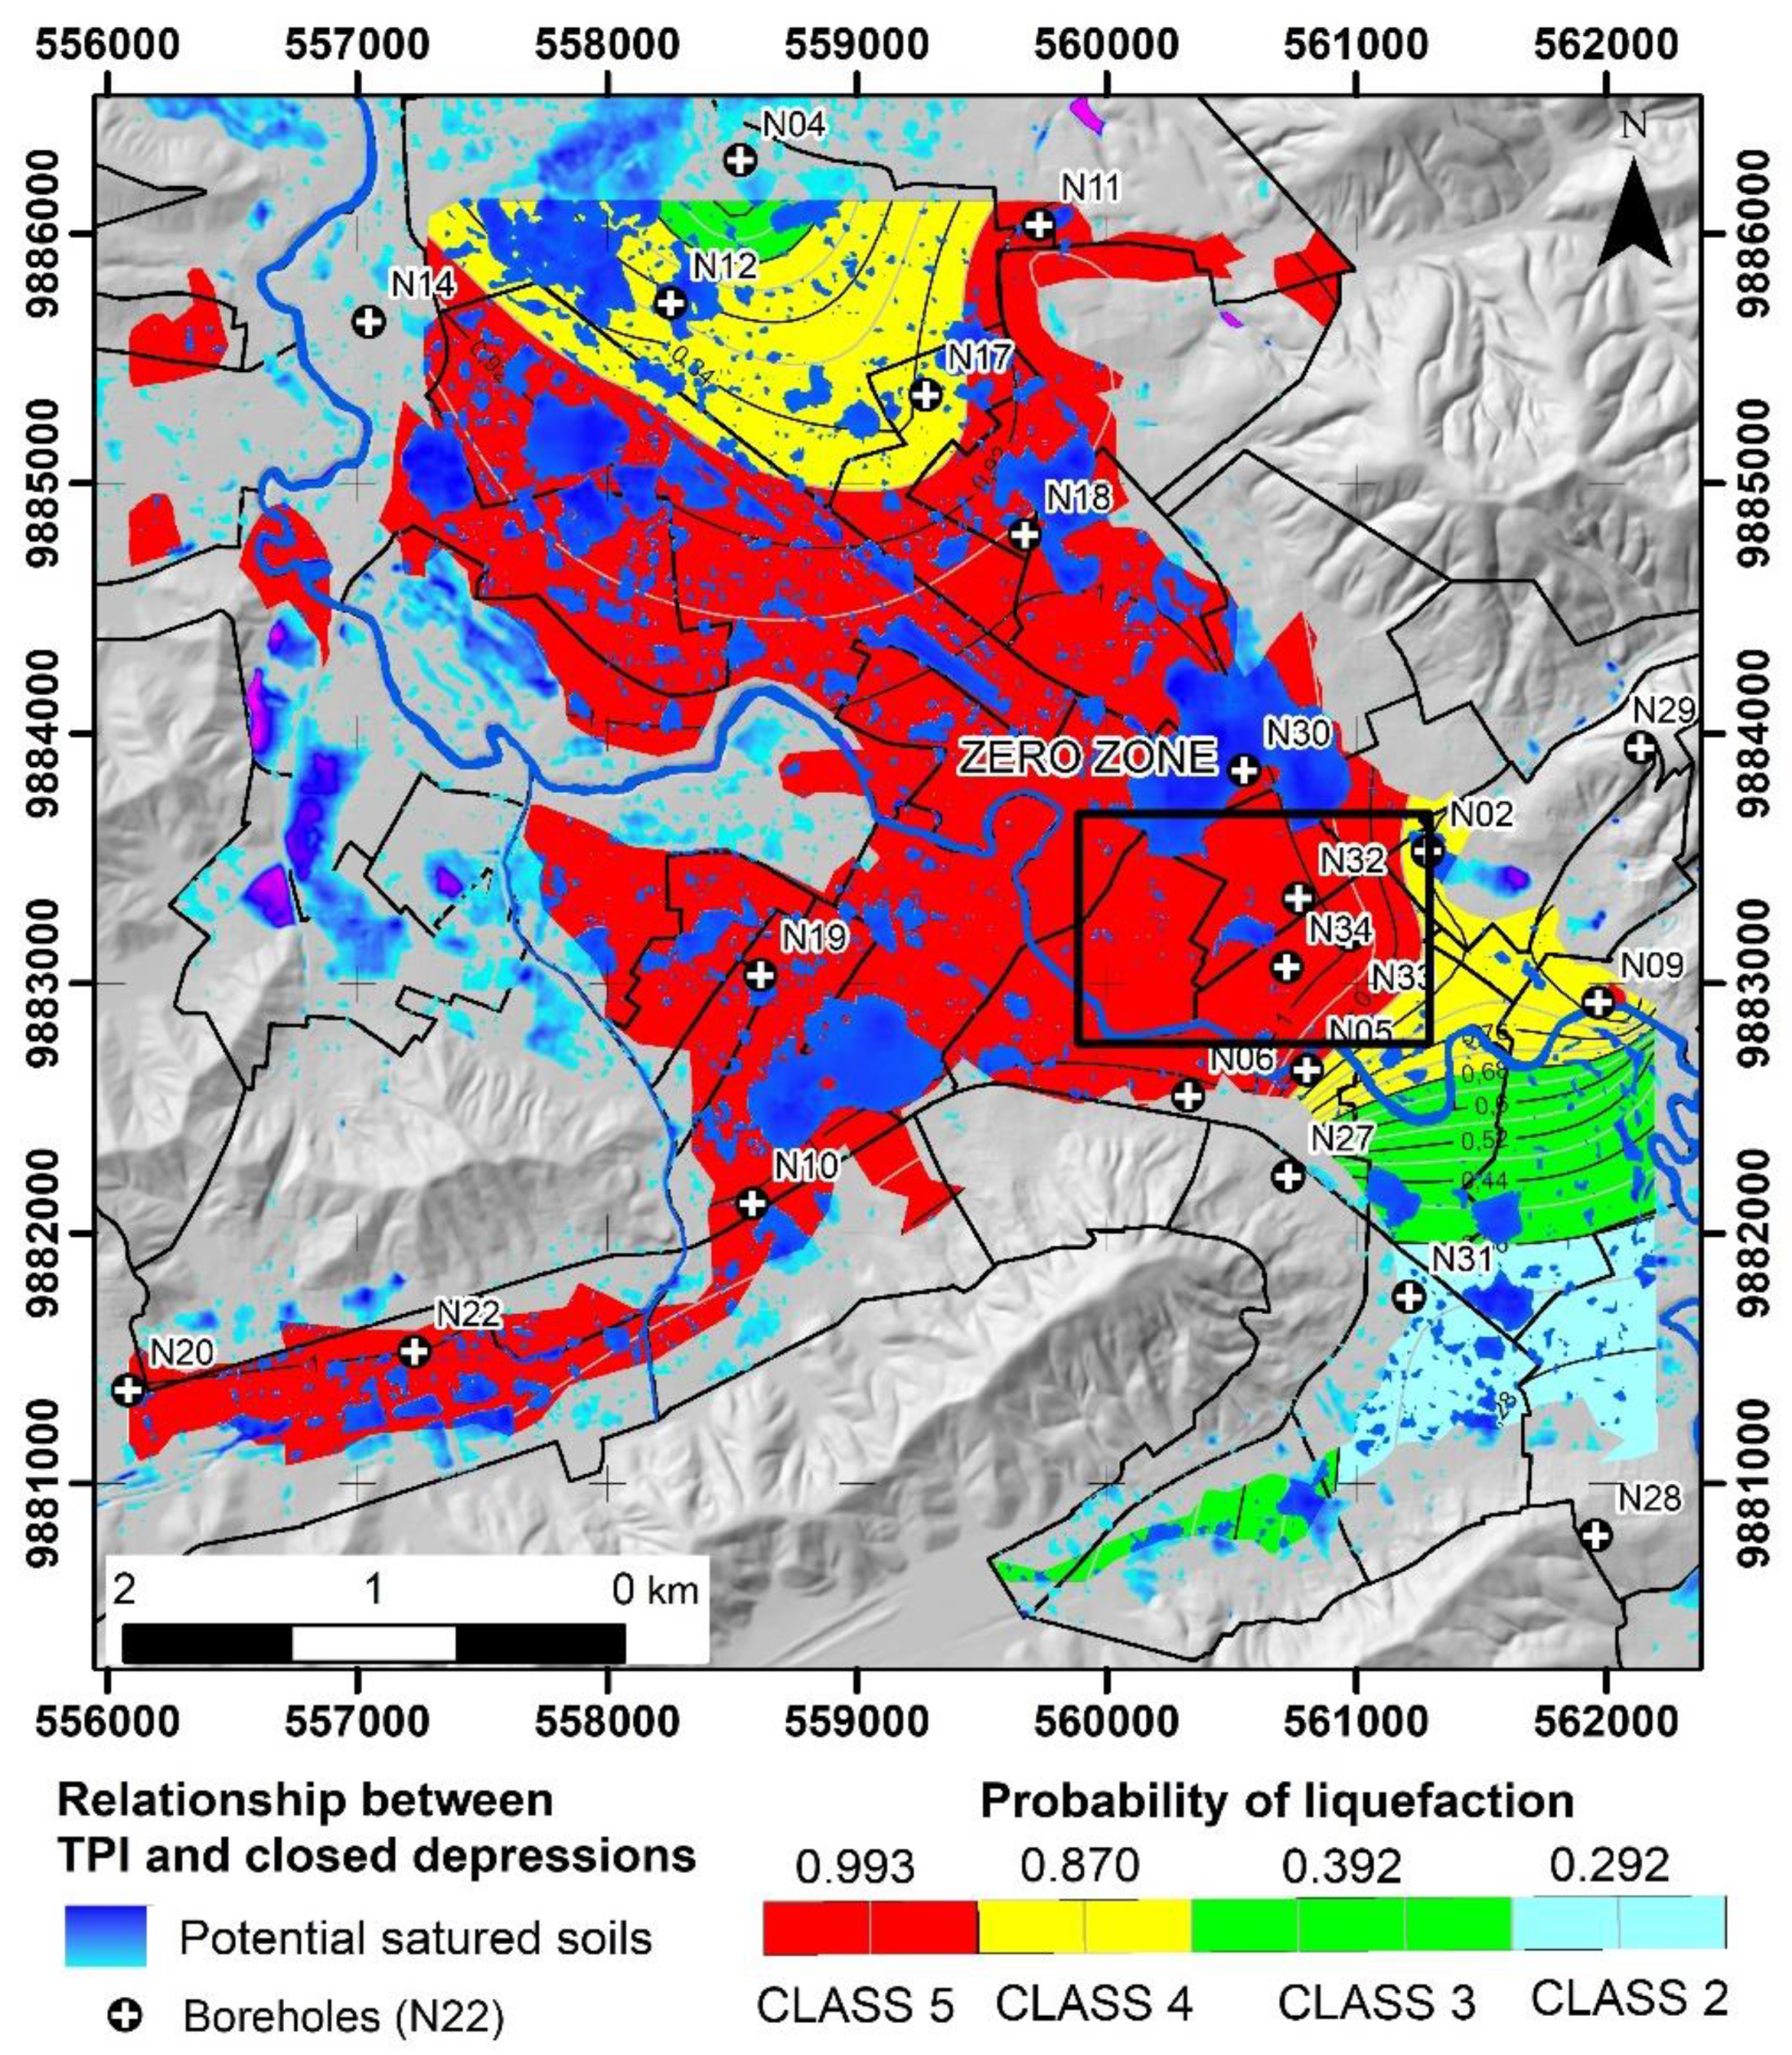
A previous but basic study of soil liquefaction in the city of Portoviejo is available. However, the present study applies a more detailed technique in order to determine the liquefaction probability (PL) up to 20 m in depth, with a mean value of 0.993 for class 5, i.e., high probability (Table 5 and Table 6), from equations proposed by Chen and Juang (2000). For the “ground zero”, the greatest deformation of the terrain is between 8 and 14 m deep. A map of soil liquefaction is presented in this study, which also indicates the levels of deformation with probability values for the soil. A particular focus was directed towards the southern part of the city of Portoviejo as a result of the liquefaction analysis performed in [77] and the present study.

4.3. Safety Factor Calculation

In order to evaluate the liquefaction potential of lithological units, such as Upper Pleistocene and Holocene units, in the city of Portoviejo, we applied the standard penetration test (SPT), and used simplified methods for the calculation of the factor of safety (Fs), the cyclical resistance ratio (CRR), and cyclical stress ratio (CSR). These methods were originally developed by Seed and Idriss [30], and later updated by Seed et al. [35,39,91], Youd and Idriss [91], and Youd et al. [39].
Fs = CRR/CSR
The CRR, according to Youd and Idriss [39], is approximated with the following equation:
CRR = 1 34 ( N 1 ) 60   + ( N 1 ) 60 135 + 50 ( 10 ( N 1 ) 60 + 45 ) 2 1 200
The resistance to penetration is given by the number of blows N, which is corrected by (N1)60 by means of the overload pressure factor Cn, the energy correction of the hammer (ER) Ce, in addition to the diameter of the borehole Cb, the correction factor of the rod length Cr, and the correction for samplers with or without liners Cs. (Cn) was calculated according to the equation proposed by Liao and Whitman (1986), i.e., Cn = (Pa/σv)0.5 in function with (Pa) (atmospheric pressure) and the σv (effective vertical stress). Thereafter, a “fine content” correction was applied to the calculated N1(60) value in order to obtain an equivalent clean sand value (N1)60cs given by the equations proposed by Youd et al. (2001).
The cyclic stress ratio is defined with the following expression:
CSR = 0.65   (   a m a x ( g )   ) ( σ v σ v ) ( rd ) / ( MSF )  
where σv is the total vertical stress at depth z, σv is the effective vertical stress at the same depth of the studied stratum, amax is the maximum horizontal acceleration of the soil, (g) is the acceleration due to gravity, and rd is a voltage reduction factor. In this study, the rd factor was considered using the equation of Liao and Whitman [92]:
Rd = 1.0 − 0.00765 Z for Z ≤ 9.15 m
Rd = 1.174 − 0.0267 Z for 9.15 m ≤ Z ≤ 23 m
Then, the CSR values were divided by the magnitude scaling factor (MSF), which is calculated by the following equation [39]:
MSF = (Mw/7.5)2.56
Furthermore, Juang et al. [93] developed a simplified equation for CRR based on their neural network analysis of field observations:
CRR7.5 = 0.241 {exp [(0.032 + 0.004FCI) (N1)60]} − 0.182
where FCI is an index of fines content (FC) defined as follows: FCI = 1 for FC < 5%, FCI = 2 for 5% < FC < 12%, FCI = 3 for 12% < FC < 35%, and FCI = 4 for FC > 35%. The use of an ordinal scale to characterize the effect of fines content is consistent with current geotechnical knowledge [
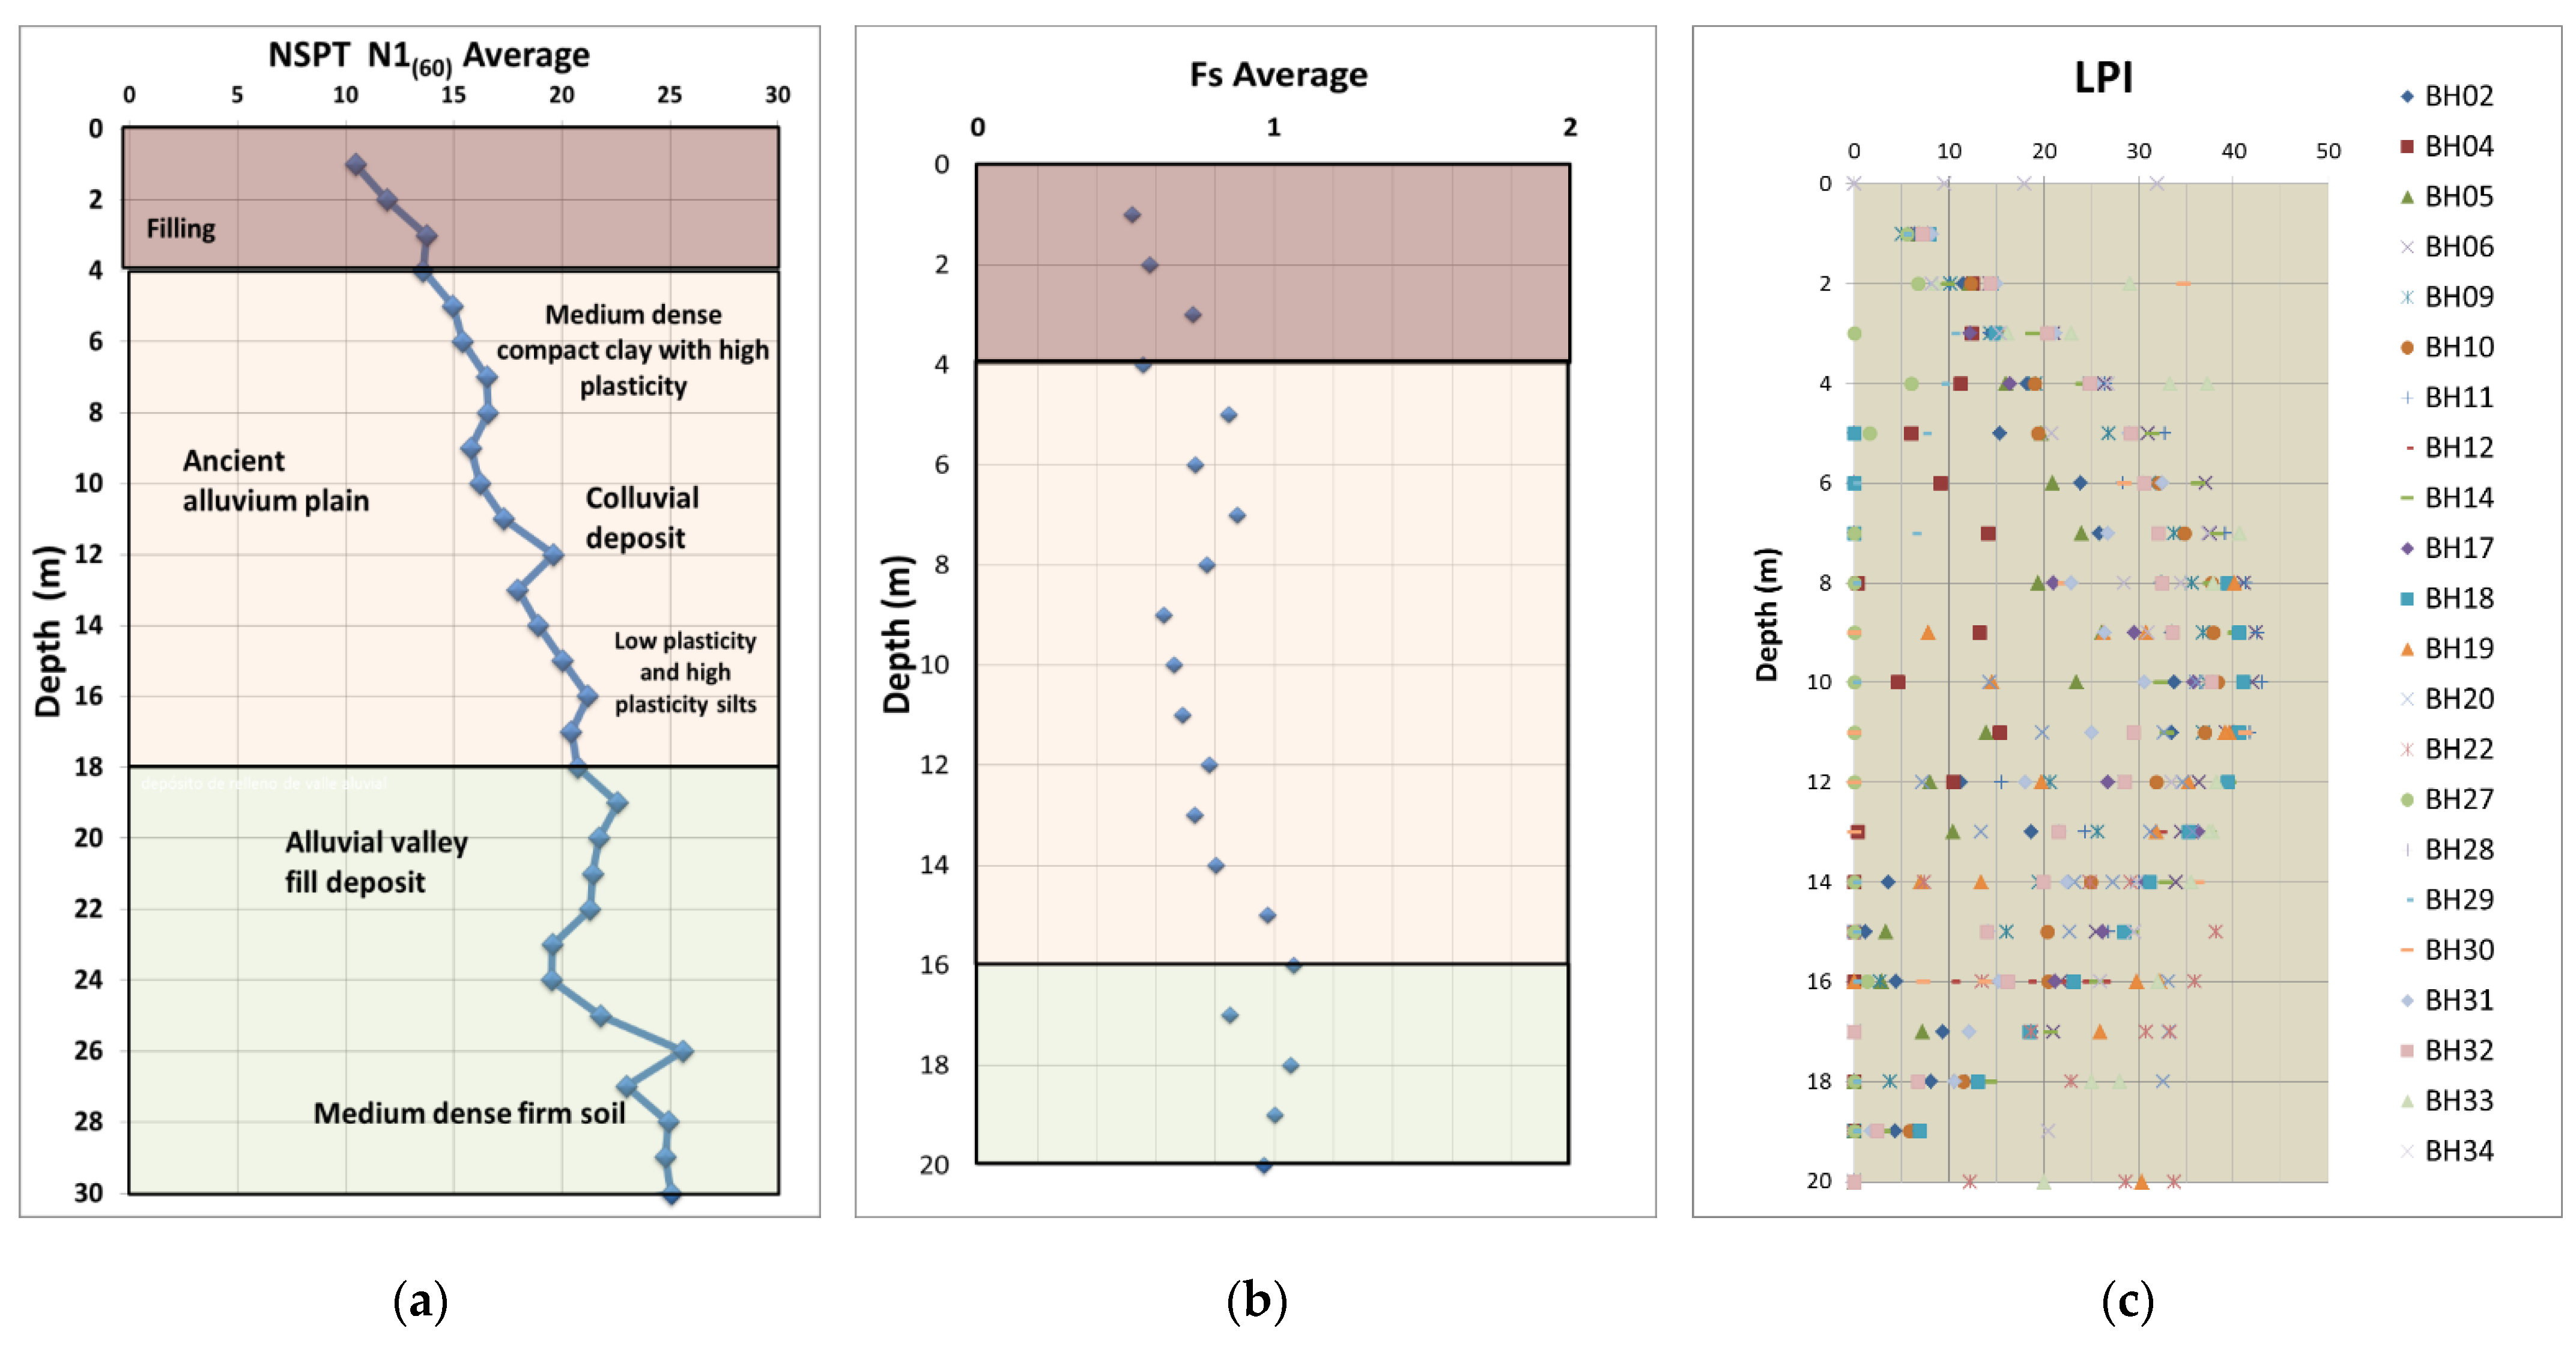
38]. The values obtained as the safety factor (Fs) for the different soil strata in the city of Portoviejo are illustrated in Figure 6b.

4.4. Liquefaction Potential Index

The equation defined by Iwasaki et al. [32] was used to calculate the liquefaction potential index (LPI) up to depths of 20 m in the urban area of Portoviejo:
LPI = 0 z F ( z ) W ( z ) dz
where z is the depth below the ground surface in meters and is calculated as w(z) = 10 − 0.5z; F(z) is a function of the factor of safety against liquefaction, Fs, where F(z) = 1 − Fs when Fs < 1 and if Fs > 1, then F(z) = 0.
Iwasaki et al. [32] calibrated the severity of liquefaction-induced damages with the (LPI) values as listed in Table 5.
Using this method, Sonmez [44] classified the sites according to their LPI value as low, moderate, high, and severe liquefaction susceptibility, as listed in Table 5. In addition, Figure 6c shows the LPI for each borehole per meter, as it is easier to determine which strata are subject to the greatest liquefaction influence.
When evaluating the LPI through the boreholes analyzed in the city of Portoviejo and under the criteria established by Chen and Juang [38] and Juang et al. [93], it was established that those strata that have a safety factor lower than 1.169, as obtained from the conditional mean, would behave as a liquefiable layer. Values higher than this would correspond to non-liquefiable soils. When applying the method proposed by Chen and Juang [38] in the commercial center of the city of Portoviejo, the probability of liquefaction occurring is “almost certain” in approximately 60%. There are also areas with a low likelihood and a high likelihood of soil liquefaction.
Once the analysis and interpretation of the data presented above had been conducted, the information was converted into a liquefaction susceptibility map for the urban area of the city of Portoviejo, establishing the areas by classes according to the safety factor and the calculated liquefaction probability, as proposed by Chen and Juang [38].
Probability   ( liquefaction ) = 1 1 + ( F s 0.96 ) 4.5
This evaluation of the liquefaction potential together with interferometry images specify the most critical areas in the urban area of the city of Portoviejo, which satisfactorily correlate with the evidence of coseismic liquefaction during the earthquake of April 16 (Mw 7.8), as demonstrated in Figure 7 and Figure 8.
By applying [38] with the liquefaction probability and safety factor intervals, values obtained for the soils of the city of Portoviejo presented a liquefaction probability mean value for class 5 of 0.993 and mean security factor of 0.310. Class 4 exhibited a PL mean value of 0.870 and an Fs of 0.629. Class 3 exhibited mean values of 0.392 for PL and 1.058 for Fs, and finally, class 2 mean value of 0.292 for PL and of 1.169 for Fs. It should be emphasized that, according to the analyses conducted in the urban area, there were no class 1 soils.

4.5. Site Response Analysis

On the basis of the geotechnical parameter vs. the data obtained from correlations based on the number of blows (N
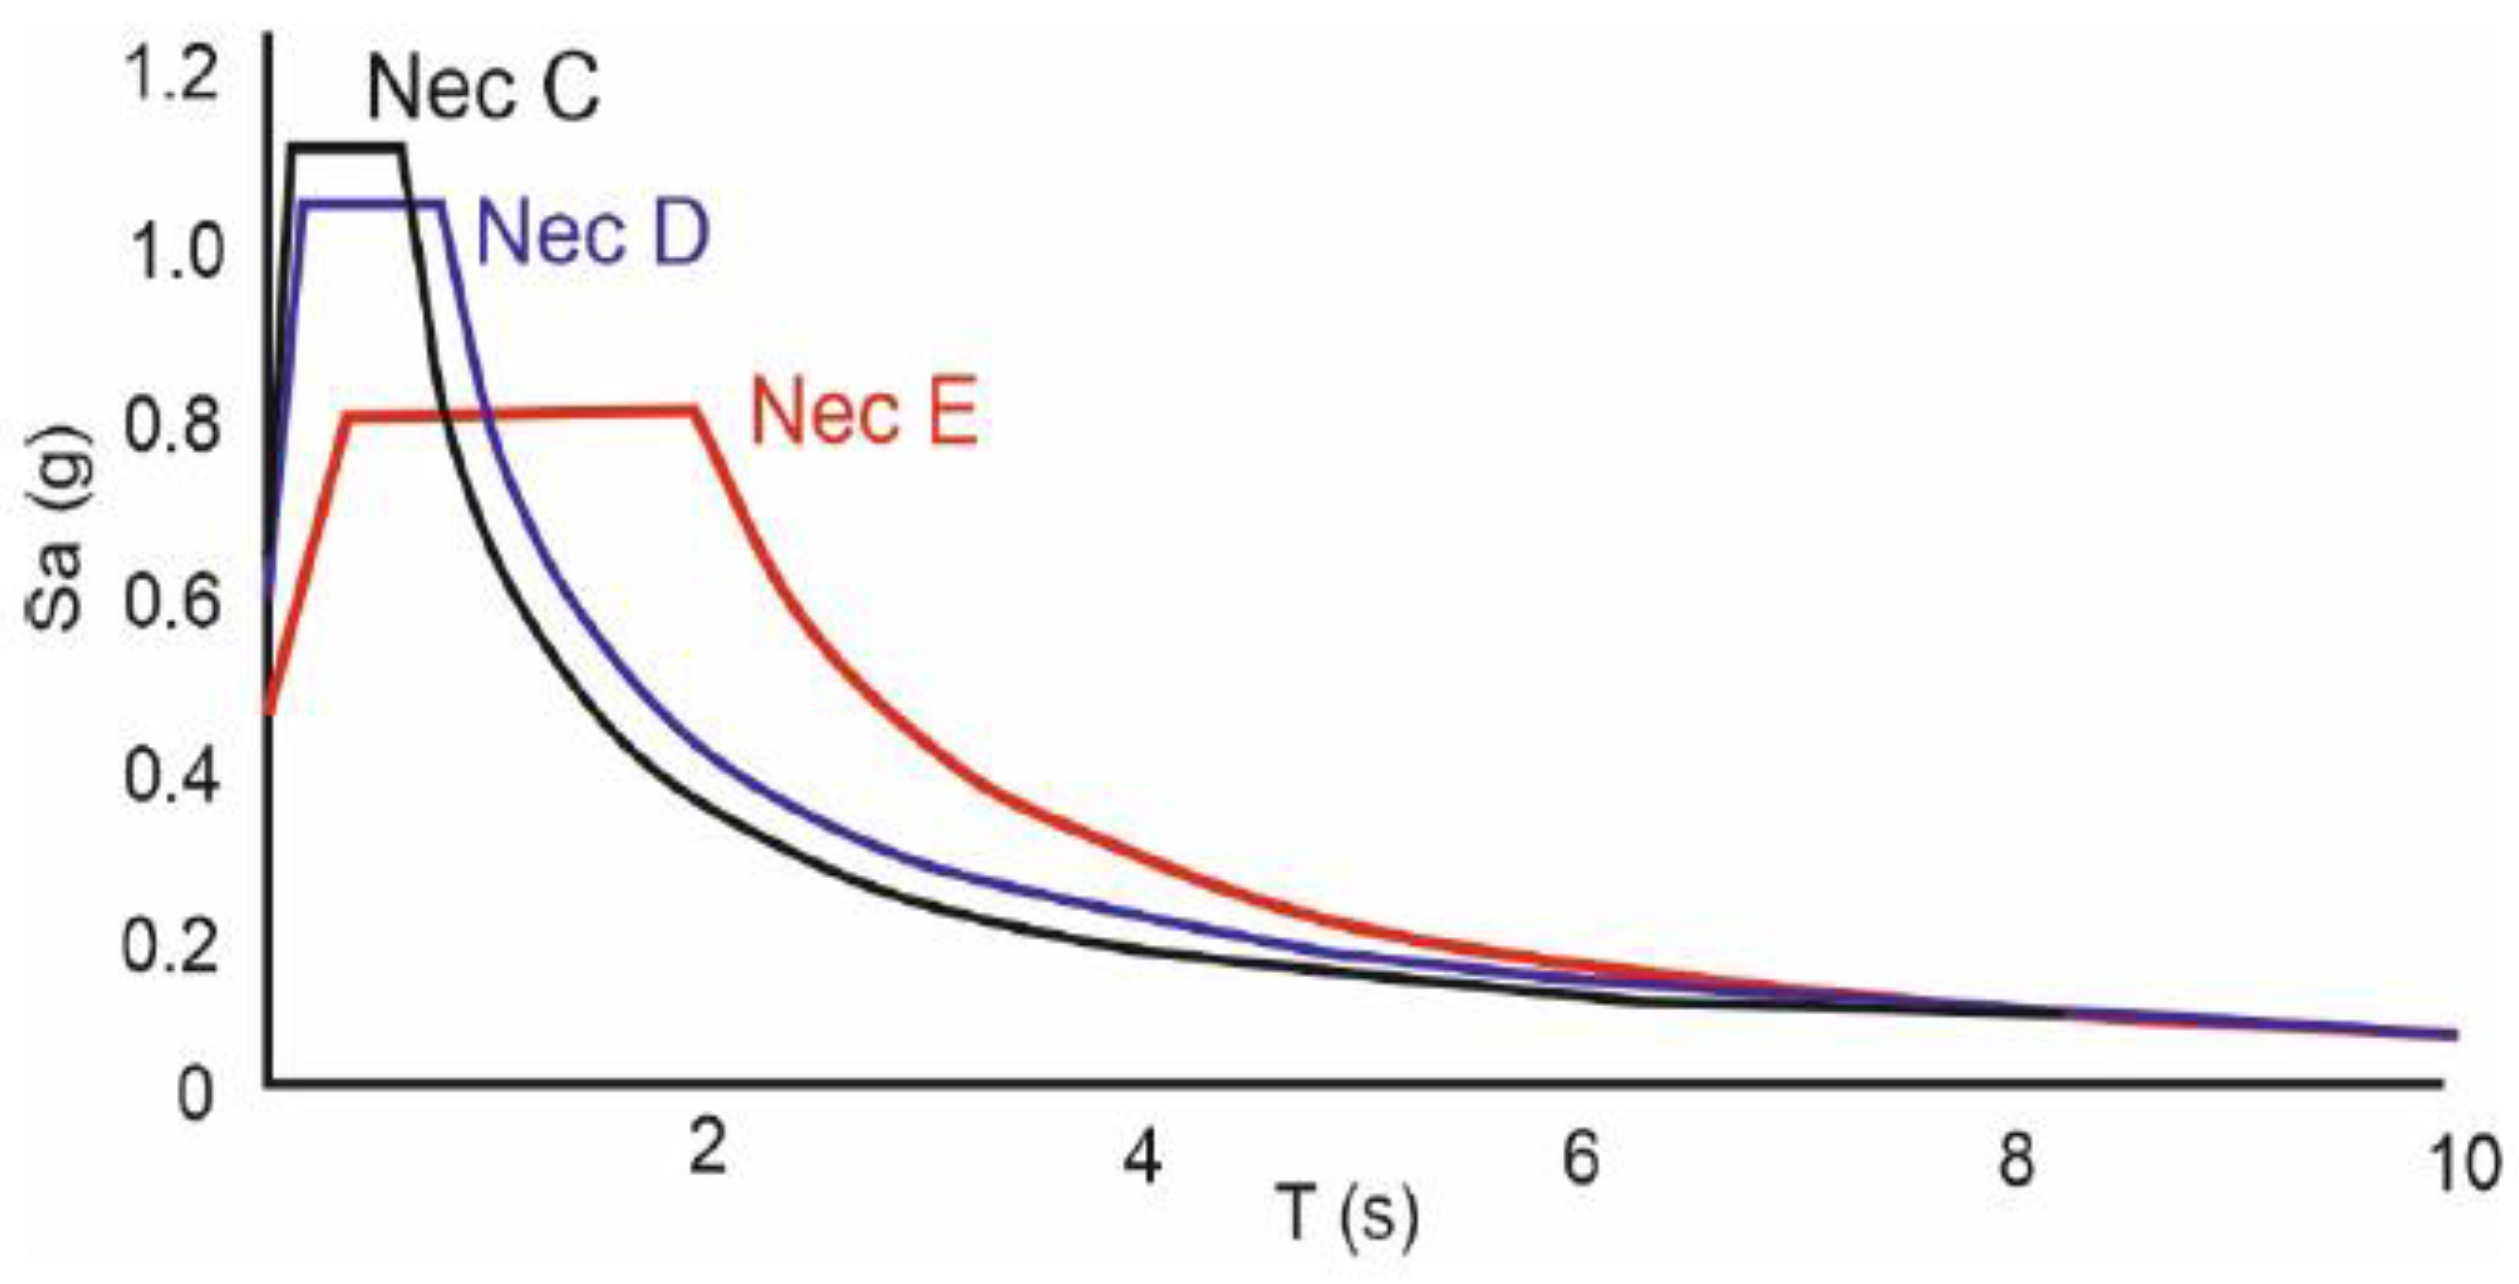
60), the soil of Portoviejo was classified as type D at a depth greater than 30 m for a seismic design process. The spectrum was found to be a function of the amplification factor of the soil in the short period zone (Fa), the amplification of the ordinate of the elastic displacement response spectrum for rock design (Fd), and the non-linear behavior of the soils (Fs) according to the NEC-11 [54]. This was compared with events of greater similarity than the one that occurred on 16 April 16 2016 (Table 7 and Table 8).
The basic seismological characteristics of an earthquake are intensity or amplitude, maximum ground acceleration, maximum ground velocity, frequency content, and duration. Ten earthquakes were selected (Table 8) with characteristics similar to the event that occurred in 2016 in Pedernales, which affected the Portoviejo canton, in the central region of the province of Manabí. The PEER ground motion database was used to this end and the period coordinates and spectral accelerations of the NEC-11 spectrum [54] were entered as spectra (Figure 9).
Seismogenic structures allow for an estimation of the magnitudes and maximum accelerations expected in rocks [94,95,96,97]. Therefore, the prediction of ground motion under the action of a seismic event is typically obtained by a one-dimensional site response analysis [11]. This analysis is usually performed using linear equivalent models since it requires the direct properties of the soils and a simple computational calculation [11]. One of the best-known linear equivalent models is the Deepsoil software [94], which calculates the response of a system of homogeneous viscoelastic layers with an infinite horizontal limit, subjected to a shear wave movement that travels vertically [11].
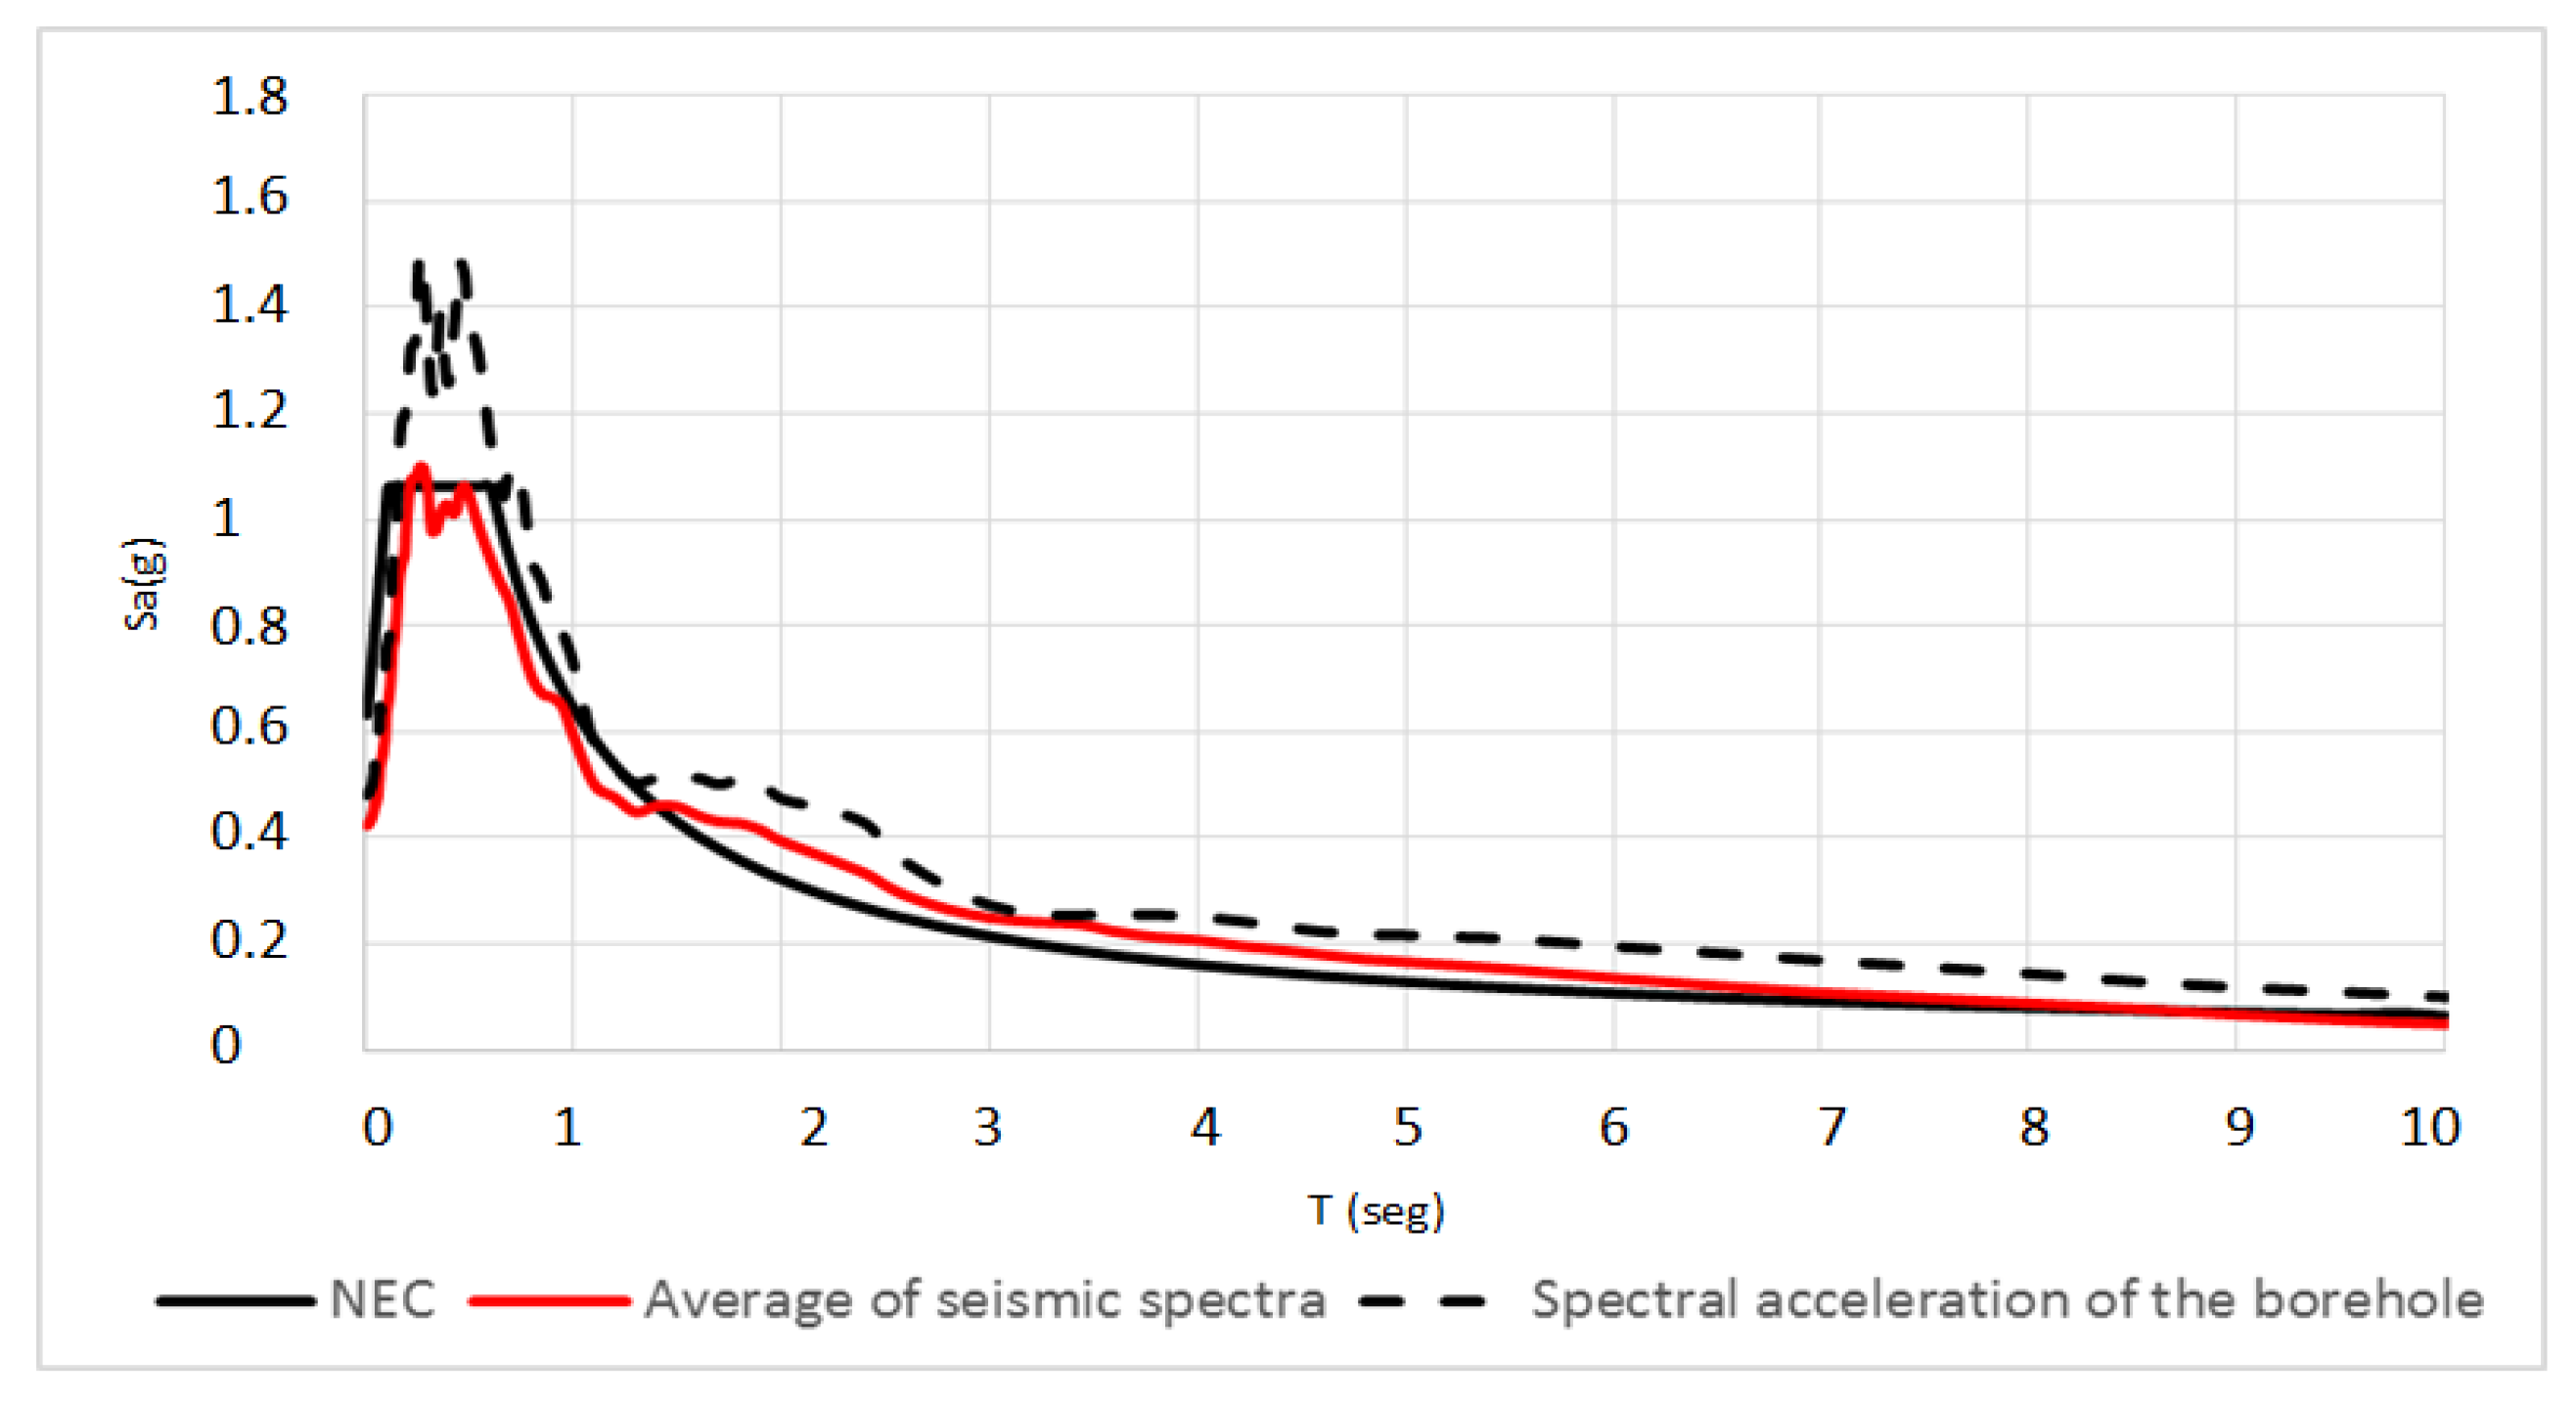
Figure 10 demonstrates the mean of a selection of 10 earthquakes with characteristics similar to the Portoviejo earthquake and NEC-11 [54]. Data from Peer Ground Motion were used and the coordinates corresponding to the spectral period and acceleration were entered as spectra. We took into account that when soft rock is evaluated according to the NEC-11 standard [54], it qualifies it as type C. Subsequently, a calibration of the scale factors was performed for the selected earthquakes, while maintaining a scale factor of 1 to 3 at all times, for a return period (Tr) of 475 years, which indicates the seismological characteristics of the scaled movements [11].

4.6. Terrain Response Modeling

The prediction of the movement in the ground under the action of a seismic event is usually made by means of a one-dimensional site response analysis (SRA). Equivalent linear models (EQL) are often used, since they require the immediate properties of the ground and simple computational. One of the best known and most calibrated linear equivalent models is the one implemented in the Deepsoil program [94], which is an effective stress analysis. Using the shear modulus, damping, and unit weight of each of the soil layers, the wave equation was developed with the complex stiffness response method. This was calculated in a transfer function based on the model to relate the internal movement of the rock mass to the movement at ground level.

4.7. Results of Site Response Analysis

The city of Portoviejo is located in zone VI, which indicates a high seismic level with a factor of Z 0.5 g in a return period of 475 years (NEC-11) [54]. The seismic data were obtained from geophysical tests, which gives more importance to soil profile data, as illustrated in Figure 4 and Table 3. Figure 10 illustrates the elastic response with an esca factor and a Tr of 475 years considering a structural damping equal to 5%.
From the probing results, spectral accelerations of 1.47 g were obtained for a period of between 0.7 s and 1 s (Figure 10). It can be concluded that, in the analysis shown, the spectra obtained on the surface are greater than the acceleration plateau of the Ecuadorian Construction Regulations (NEC-11) [54].

5. Conclusions

In the current study, we demonstrated a contemporary applied liquefaction probability technique in areas with active tectonics, including the central coast of Ecuador (Manabí province). The Analyses of the coseismic surface effects related to ground movement are scarce in many places, and the urban development of coastal cities does not take into account information on potentially liquefiable low-quality geotechnical zones. Liquefaction probabilities reach maximum values at depths from 8 to 12 m. In these strata, the value of N is between low and high. The most notable liquefaction characteristics in the Portoviejo ground zero soils are subsidence in soft soils with poor geotechnical quality, lateral expansion, and lateral spreading in fluvial margins where the groundwater level is low. Sand boils were not documented, probably due to the fine content. All of the anomalies that were mentioned were found in various similar locations with nearly identical behavior. There is an increasing level of risk in coastal cities, as they are constantly threatened by subduction earthquakes or moderate earthquakes due to other geological faults.
The city of Portoviejo is located on the Ecuadorian coast in a subduction zone, and during the earthquake in Pedernales on 16 April 2016 (Mw 7.8), the city reached a PGA of 0.38 g, with a maximum acceleration of 1.47 g in the ground.
Coseismic liquefaction phenomena were observed in the “ground zero” of the city and in places where the geological conditions were more favorable to the generation of seismic environmental effects. In the current study, we used geotechnical, standard penetration test (SPT) borehole data to calculate the liquefaction potential for soil strata (LPI) by considering a maximum acceleration of 0.5 g. According to the results obtained from the boreholes, the probability of the liquefaction of each sounding for each depth was calculated based on the safety factor. This was later classified according to the proposal by Chen and Juang [38]. From the quantitative results that were obtained, the safety factor for the city of Portoviejo was calculated. It was determined that strata with an Fs of less than 1.169 should be considered to be liquefiable soils.
According to the evidence obtained from the earthquake and the preparation of the liquefaction hazard map, the greatest coseismic deformations occur at depths between 8 and 12 m, and it is here that the highest severity of damage occurs. The urban area of the city is based on deposits of alluvial plains, dike channels, and old alluvial plains, which present a high probability of liquefaction. In addition, there is a low-to-moderate probability of liquefaction to the south east of the city due to the presence of old sediments. This liquefaction hazard map can be used as an essential tool for the management of and construction planning in the city of Portoviejo.

Author Contributions

Conceptualization, E.O.-H.; methodology, E.O.-H., J.L.P. and K.C.; software, E.O.-H. and J.L.P.; validation, T.T.; formal analysis, E.O.-H.; investigation, E.O.-H., K.C., J.L.P., T.T.; resources, E.O.-H.; data curation, E.O.-H., J.L.P. and K.C.; writing—original draft preparation, E.O.-H.; writing—review and editing, T.T.; visualization, E.O.-H. and K.C.; supervision, J.L.P.; project administration, J.L.P.; funding acquisition, E.O.-H. All authors have read and agreed to the published version of the manuscript.

Funding

This research was jointly supported by the Technical University of Manabí in Ecuador. With the particular support of the Soil and Concrete Mechanics laboratory “Suelcon & Asf”.

Institutional Review Board Statement

Not applicable.

Informed Consent Statement

Not applicable.

Data Availability Statement

Not applicable.

Acknowledgments

This study was realized with the support of the Soil Laboratory of the Technical University of Manabí (UTM), the University of Alicante in Spain and the soil mechanics laboratory “Suelcon & Asf”.

Conflicts of Interest

The authors declare no conflict of interest.

References

  1. Obermeier, S.F. Use of Liquefaction-Induced Features for Paleo Seismic Analysis—An Overview of How Seismic Liquefaction Features Can Be Distinguished from Other Features and How Their Origin Can Be Used to Infer the Location and Strength of Holocene Paleo-Earthquakes. Eng. Geol. 1996, 44, 1–76. [Google Scholar] [CrossRef]
  2. Michetti, A.M.; Esposito, E.; Guerrieri, L.; Porfido, S.; Serva, L.; Tatevossian, R.; Vittori, E.; Audemard, F.; Azuma, T.; Clague, J.; et al. Environmental Seismic Intensity Scale 2007—ESI, Memorie Descrittive della Carta Geologica d’Italia, Vol. 74, Servizio Geologico d’Italia—Dipartimento Difesa del Suolo; APAT: Rome, Italy, 2007; pp. 7–54. Available online: http://www.isprambiente.gov.it/en/publications/technical-periodicals/descriptive-memories-of-the-geological-map-of/intensity-scale-esi-2007?set_language=en (accessed on 28 February 2022).
  3. Kelson, K.; Witter, R.C.; Tassara, A.; Ryder, I.; Ledezma, C.; Montalva, G.; Frost, D.; Sitar, N.; Moss, R.; Johnson, L. Coseismic tectonic surface deformation during the 2010 Maule, Chile, M 8.8 earthquake. Earthq. Spectra 2012, 28, S39–S54. [Google Scholar] [CrossRef]
  4. Wartman, J.; Dunham, L.; Tiwari, B.; Pradel, D. Landslides in Eastern Honshu induced by the 2011 off the Pacific Coast of Tohoku earthquake. Bull. Seismol. Soc. Am. 2013, 103, 1503–1521. [Google Scholar] [CrossRef]
  5. Kritikos, T.; Robinson, T.R.; Davies, T.R. Regional coseismic landslide hazard assessment without historical landslide inventories: A new approach. J. Geophys. Res. Earth Surf. 2015, 120, 711–729. [Google Scholar] [CrossRef] [Green Version]
  6. Rahman, M.Z.; Siddiqua, S.; Kamal, A. Maksud. Liquefaction hazard mapping by liquefaction potential index for Dhaka City, Bangladesh. Eng. Geol. 2015, 188, 137–147. [Google Scholar] [CrossRef]
  7. Sana, H.; Nath, S.K. Liquefaction potential analysis of the Kashmir valley alluvium, NW Himalaya. Soil Dyn. Earthq. Eng. 2016, 85, 11–18. [Google Scholar] [CrossRef]
  8. Chunga, K.; Ochoa-Cornejo, F.; Mulas, M.; Toulkeridis, T.; Menéndez, E. Characterization of seismogenic crustal faults in the Gulf of Guayaquil, Ecuador. Andean Geol. 2019, 46, 66–81. [Google Scholar] [CrossRef]
  9. Fan, X.; Scaringi, G.; Korup, O.; West, A.J.; van Westen, C.J.; Tanyas, H.; Huang, R. Earthquake-induced chains of geologic hazards: Patterns, mechanisms, and impacts. Rev. Geophys. 2019, 57, 421–503. [Google Scholar] [CrossRef] [Green Version]
  10. Serey, A.; Piñero-Feliciangeli, L.; Sepúlveda, S.A.; Iveda, F.; Poblete, D.; Petley, I.; Murphy, W. Landslides induced by the 2010 Chile megathrust earthquake: A comprehensive inventory and correlations with geological and seismic factors. Landslides 2019, 16, 1153. [Google Scholar] [CrossRef]
  11. Avilés-Campoverde, D.; Chunga, K.; Ortiz-Hernández, E.; Vivas-Espinoza, E.; Toulkeridis, T.; Morales-Delgado, A.; Delgado-Toala, D. Seismically Induced Soil Liquefaction and Geological Conditions in the City of Jama due to the M7.8 Pedernales Earthquake in 2016, NW Ecuador. Geosciences 2020, 11, 20. [Google Scholar] [CrossRef]
  12. Khan, M.Y.; Turab, S.A.; Ali, L.; Shah, M.T.; Qadri, S.T.; Latif, K.; Akhter, M.G. The dynamic response of coseismic liquefaction-induced ruptures associated with the 2019 M w 5.8 Mirpur, Pakistan, earthquake using HVSR measurements. Lead. Edge 2021, 40, 590–600. [Google Scholar] [CrossRef]
  13. Aguiar, R.; Castro, C.; Garzón, C.; Yanchatuña, W.; Cumbal, L.; la Fave, J. Magnitud máxima en zonas fuentes para estudios de peligrosidad sísmica del Ecuador. Rev. Cienc. ESPE Univ. Fuerzas Armadas 2009, 12, 109–121. [Google Scholar]
  14. Chunga, K.; Livio, F.; Mulas, M.; Ochoa-Cornejo, F.; Besenzon, D.; Ferrario, M.F.; Michetti, A.M. Earthquake ground effects and intensity of the 16 April 2016, Mw 7.8 Pedernales Earthquake (Ecuador): Implications for the source characterization of large subduction earthquakes. Bull. Seismol. Soc. Am. 2018, 108, 3384–3397. [Google Scholar] [CrossRef]
  15. Egred, J. Catalogo de Terremotos del Ecuador 1541–2009; Internal Report; Escuela Politecnica Nacional, Instituto Geofisico: Quito, Ecuador, 2009. [Google Scholar]
  16. Mendoza, C.; Dewey, J.W. Seismicity associated with the great Colombia—Ecuador earthquakes of 1942, 1958, and 1979: Implications for barrier models of earthquake rupture. Bull. Seismol. Soc. Am. 1984, 74, 577–593. [Google Scholar]
  17. Ye, L.; Kanamori, H.; Avouac, J.-P.; Li, L.; Fai Cheung, K.; Lay, T. The 16 April 2016, Mw 7.8 (Ms 7.5) Ecuador earthquake: A quasi-repeat of the 1942 Ms 7.5 earthquake and partial re-rupture of the 1906 Ms 8.6 Colombia_Ecuador earthquake. Earth Planet. Sci. Lett. 2016, 454, 248–258. [Google Scholar] [CrossRef] [Green Version]
  18. Moncayo Theurer, M.; Velasco, G.; Mora, C.; Montenegro, M.; Cordova, J. Terremotos Mayores a 6.5 en Escala Richter Ocurridos en Ecuador Desde 1900 Hasta 1970. Ingeniería 2017, 21, 55–64. [Google Scholar]
  19. Ruffilli, A. Lecciones de Estructuras; Universidad de Guayaquil (Inédito): Guayaquil, Ecuador, 1948; 422p. [Google Scholar]
  20. Silgado, F.E. El movimiento sísmico del 12 de diciembre de 1953. Boletín Soc. Geológica Perú 1957, 32, 225–238. [Google Scholar]
  21. Nikolaou, S.; Vera-Grunauer, X.; Gilsanz, R. (Eds.) Geotechnical Extreme Events Reconnaissance Association–Applied Technology Council (Geer-Atc). In Earthquake Reconnaissance, Mw 7.8, 16 April 2016, Muisne, Ecuador; Version 1b; 2016; p. 604. Available online: https://geerassociation.org/administrator/components/com_geer_reports/geerfiles/ECUADOR_Report_GEER-049-v1b.pdf (accessed on 28 February 2022).
  22. Toulkeridis, T.; Chunga, K.; Rentería, W.; Rodriguez, F.; Mato, F.; Nikolaou, S.; Cruz D´Howitt, M.; Besenzon, D.; Ruiz, H.; Parra, H.; et al. The 7.8 Mw Earthquake and Tsunami of the 16th April 2016 in Ecuador—Seismic evaluation, geological field survey and economic implications. Sci. Tsunami Hazards 2017, 36, 197–242. [Google Scholar]
  23. Smith, M.E.; Wissmann, K. Ground improvement reinforcement mechanisms determined for the Mw 7.8 Muisne, Ecuador, earthquake. In Proceedings of the 5th Geotechnical Earthquake Engineering and Soil Dynamics Conference, Liquefaction Triggering, Consequences, and Mitigation—GEESDV, GSP, Austin, TX, USA, 10–13 June 2018; pp. 286–294. [Google Scholar]
  24. Mato, F.; Toulkeridis, T. An unsupervised K-means based clustering method for geophysical post-earthquake diagnosis. In Proceedings of the 2017 IEEE Symposium Series on Computational Intelligence (SSCI), Honolulu, HI, USA, 27 November–1 December 2017; pp. 1–8. [Google Scholar]
  25. Vera-Grunauer, X.F.; Lopez-Zhindon, S.; Ordonez-Rendon, J.; Chavez-Abril, M.A. Liquefaction case histories after the 2016 megathrust Pedernales earthquake in Ecuador. In Proceedings of the 7th International Conference on Earthquake Geotechnical Engineering—7 ICEGE, Rome, Italy, 17–20 June 2019; pp. 805–820. [Google Scholar]
  26. Toulkeridis, T.; Porras, L.; Tierra, A.; Toulkeridis-Estrella, K.; Cisneros, D.; Luna, M.; Carrión, J.L.; Herrera, M.; Murillo, A.; Perez-Salinas, J.C.; et al. Two independent real-time precursors of the 7.8 Mw earthquake in Ecuador based on radioactive and geodetic processes—Powerful tools for an early warning system. J. Geodyn. 2019, 126, 12–22. [Google Scholar] [CrossRef]
  27. Salocchi, A.C.; Minarelli, L.; Lugli, S.; Amoroso, S.; Rollins, K.M.; Fontana, D. Liquefaction source layer for sand blows induced by the 2016 megathrust earthquake (M 7.8) in Ecuador (Boca de Briceño). J. S. Am. Earth Sci. 2020, 103, 102737. [Google Scholar] [CrossRef]
  28. Suárez-Acosta, P.E.; Cañamar-Tipan, C.D.; Ñato-Criollo, D.A.; Vera-Zambrano, J.D.; Galarza-Vega, K.L.; Guevara-Álvarez, P.M.; Fajardo-Cartuche, C.N.; Herrera-Garcés, K.K.; Ochoa-Campoverde, C.V.; Torres-Orellana, J.S.; et al. Evaluation of seismic and tsunami resistance of potential shelters for vertical evacuation in case of a tsunami impact in Bahia de Caráquez, central coast of Ecuador. Sci. Tsunami Hazards 2021, 40, 1–37. [Google Scholar]
  29. Toulkeridis, T.; Barahona-Quelal, I.N.; Pilco-Paguay, E.O.; Cacuango-Casco, D.M.; Guilcaso-Tipán, B.S.; Sailema-Hurtado, W.P. Evaluation of seismic and tsunami resistance of potential shelters for vertical evacuation in case of a tsunami impact in Manta and Salinas, central coast of Ecuador. Sci. Tsunami Hazards 2021, 40, 286–314. [Google Scholar]
  30. Seed, H.B.; Idriss, I.M. Simplified Procedure for Evaluating Soil Liquefaction Potential. J. Soil Mech. Found. Div. 1971, 97, 1249–1273. [Google Scholar] [CrossRef]
  31. Seed, H.B.; Idriss, I.M. Ground Motions and Soil Liquefaction during Earthquakes; Earthquake Engineering Research Institute Monograph: Oakland, CA, USA, 1982. [Google Scholar]
  32. Iwasaki, T.; Tokida, K.I.; Tatsuoka, F.; Watanabe, S.; Yasuda, S.; Sato, H. Microzonation for soil liquefaction potential using simplified methods. In Proceedings of the 3rd International Conference on Microzonation, Seattle, WA, USA, 28 June–1 July 1982; Volume 3, pp. 1310–1330. [Google Scholar]
  33. Youd, T.L.; Perkins, D.H. Mapping liquefaction-induced ground failure potential. J. Geotech. Eng. Div. ASCE 1978, 104, 433–446. [Google Scholar] [CrossRef]
  34. Seed, H.B.; Tokimatsu, K.; Harder, L.F., Jr.; Chung, R. The Influence of SPT Procedures on Soil Liquefaction Resistance Evaluations; Report No. UCB/EERC-84/15; Earthquake Engineering Research Center, University of California: Berkeley, CA, USA, 1984. [Google Scholar]
  35. Seed, H.B.; Tokimatsu, K.; Harder, L.F.; Chung, R.M. Influence of SPT Procedures in Soil Liquefaction Resistance Evaluations. J. Geotech. Eng. 1985, 111, 1425–1445. [Google Scholar] [CrossRef]
  36. Wakamatsu, K. Evaluation of Liquefaction Susceptibility Based on Detailed Geomorphological Classification. In Proceedings of the Annual Meeting of Architectural Institute of Japan; pp. 1443–1444. Available online: https://0-scholar-google-com.brum.beds.ac.uk/scholar?q=Wakamatsu,%20K.,%201992.%20Evaluation%20of%20liquefaction%20susceptibility%20based%20on%20detailed%20geomorphological%20classification.%20In:%20Proceedings%20of%20the%20Annual%20Meeting%20of%20Architectural%20Institute%20of%20Japan,%20pp.%2014431444%20 (accessed on 28 February 2022). (In Japanese).
  37. CDMG. Guidelines for Analyzing and Mitigating Liquefaction Hazards; Special Publication 117; California Department Conservation, Division of Mines, 1999; p. 63. Available online: https://www.tugraz.at/fileadmin/user_upload/Institute/IAG/Files/33_Liquefaction_Mitigation-DMG_SP117.pdf (accessed on 28 February 2022).
  38. Chen, C.J.; Juang, C.H. Calibration of SPT-and CPT-based liquefaction evaluation methods. In Innovation Sand Application Sin Geotechnical Site Characterization; Mayne, P.W., Hryciw, R., Eds.; ASCE; Geotechnical Special Publication: Reston, VA, USA, 2000; Volume 97, pp. 49–64. [Google Scholar]
  39. Youd, T.L.; Idriss, I.M. Liquefaction resistance of soils: Summary report from the 1996 NCEER and 1998 NCEER/NSFworkshops on evaluation of liquefaction resistance of soils. J. Geotech. Geoenviron. Eng. 2001, 127, 297–313. [Google Scholar] [CrossRef] [Green Version]
  40. Seed, R.B.; Cetin, K.O.; Moss, R.E.S.; Kammerer, A.; Wu, J.; Pestana, J.; Riemer, M.; Sancio, R.B.; Bray, J.D.; Kayen, R.E.; et al. Recent advances in soil liquefaction engineering: A unified and consistent framework. Keynote presentation. In Proceedings of the 26th Annual ASCE Los Angeles Geotechnical Spring Seminar, Long Beach, CA, USA, 30 April 2003; Available online: https://digitalcommons.calpoly.edu/cenv_fac/8/ (accessed on 5 April 2021).
  41. Juang, C.H.; Yuan, H.; Lee, D.H.; Lin, P.S. A simplified CPT-based method for evaluating liquefaction potential of soils. J. Geotech. Geoenviron. Eng. 2003, 129, 66–80. [Google Scholar] [CrossRef]
  42. Juang, C.H.; Liu, C.-N.; Chen, C.-H.; Hwang, J.-H.; Lu, C.-C. Calibration of liquefaction potential index: A re-visit focusing on a new CPTU model. Eng. Geol. 2008, 102, 19–30. [Google Scholar] [CrossRef]
  43. Juang, C.H.; Lu, C.C.; Hwang, J.H. Assessing probability of surface manifestation of liquefaction at a given site in a given exposure time using CPTU. Eng. Geol. 2009, 104, 223–231. [Google Scholar] [CrossRef]
  44. Sonmez, H. Modification of the liquefaction potential index and liquefaction susceptibility mapping for a liquefaction-prone area (Inegol, Turkey). Environ. Geol. 2003, 44, 862–871. [Google Scholar] [CrossRef]
  45. Sonmez, H.; Gokceoglu, C. A liquefaction severity index suggested for engineering practice. Environ. Geol. 2005, 48, 81–91. [Google Scholar] [CrossRef]
  46. Sonmez, B.; Ulusay, R.; Sonmez, H. A study on the identification of liquefaction induced-failures on ground surface based on the data from the 1999 Kocaeli and Chi-Chi earthquakes. Eng. Geol. 2008, 97, 112–125. [Google Scholar] [CrossRef]
  47. Bahadori, H.; Hasheminezhad, A.; Karimi, A. Development of an integrated model for seismic vulnerability assessment of residential buildings: Application to Mahabad City, Iran. J. Build. Eng. 2017, 12, 118–131. [Google Scholar] [CrossRef]
  48. Bourenane, H.; Bouhadad, Y.; Tas, M. Liquefaction hazard mapping in the city of Boumerdès, Northern Algeria. Bull. Eng. Geol. Environ. 2018, 77, 1473–1489. [Google Scholar] [CrossRef] [Green Version]
  49. Cavallaro, A.; Capilleri, P.P.; Grasso, S. Site Characterization by Dynamic In Situ and Laboratory Tests for Liquefaction Potential Evaluation during Emilia Romagna Earthquake. Geosciences 2018, 8, 242. [Google Scholar] [CrossRef] [Green Version]
  50. Hernández, E.H.O.; Moncayo, E.H.O.; Sánchez, L.K.M.; De Calderero, R.P. Behavior of Clayey Soil Existing in the Portoviejo Canton and Its Neutralization Characteristics. Int. Res. J. Eng. IT Sci. Res. 2017, 2454, 2261. [Google Scholar] [CrossRef] [Green Version]
  51. Cando-Jácome, M.; Martínez-Graña, A.; Chunga, K.; Ortíz-Hernández, E. Satellite radar interferometry for assessing coseismic liquefaction in Portoviejo city, induced by the Mw 7.8 2016 Pedernales, Ecuador earthquake. Environ. Earth Sci. 2020, 79, 467. [Google Scholar] [CrossRef]
  52. IGEPN. Instituto Geofísico Escuela Politécnica Nacional. 2018. Available online: http://www.igepn.edu.ec/solicitud-de-datos (accessed on 22 February 2022).
  53. CEC. Código Ecuatoriano de la Construcción. Requisitos Generales de Diseño: Peligro Sísmico, Espectros de Diseño y Requisitos Mínimos de Cálculos Para Diseño Sismo Resistente. Registro Oficial No. 382 de 2 de Agosto de 2001. Available online: https://www.normalizacion.gob.ec/buzon/normas/cpe_inen_5_parte_1_cap_12.pdf (accessed on 28 February 2022).
  54. NEC-11. Norma Ecuatoriana de la Construcción. Registro Oficial No. 413 del 10 de Enero de 2015. Available online: https://www.habitatyvivienda.gob.ec/documentos-normativos-nec-norma-ecuatoriana-de-la-construccion/ (accessed on 11 August 2020).
  55. UNESCO-IOC. Expert Meeting on Tsunami Sources, Hazards, Risk and Uncertainties Associated with the Colombia-Ecuador Subduction Zone, Guayaquil, Ecuador, 27–29 January 2019; Workshop Reports, 295; UNESCO: Paris, France, 2021. [Google Scholar]
  56. Collot, J.-Y.; Agudelo, W.; Ribodetti, A.; Marcaillou, B. Origin of a crustal splay fault and its relation to the seismogenic zone and underplating at the erosional north Ecuador–south Colombia oceanic margin. J. Geophys. Res. Earth Surf. 2008, 113, 1–19. [Google Scholar] [CrossRef] [Green Version]
  57. Chunga, K.; Toulkeridis, T.; Vera-Grunauer, X.; Gutierrez, M.; Cahuana, N.; Alvarez, A. A review of earthquakes and tsunami records and characterization of capable faults on the northwestern coast of Ecuador. Sci. Tsunami Hazards 2017, 36, 100–127. [Google Scholar]
  58. Navas, L.; Caiza, P.; Toulkeridis, T. An evaluated comparison between the molecule and steel framing construction systems—Implications for the seismic vulnerable Ecuador. Malays. Construct. Res. J. 2018, 26, 87–109. [Google Scholar]
  59. Chini, M.; Albano, M.; Saroli, M.; Pulvirenti, L.; Moro, M.; Bignami, C.; Stramondo, S. Coseismic liquefaction phenomenon analysis by COSMO-SkyMed: 2012 Emilia (Italy) Earthquake. Int. J. Appl. Earth Obs. Geoinf. 2015, 39, 65–78. [Google Scholar] [CrossRef]
  60. Alessio, G.; Alfonsi, L.; Brunori, C.A.; Burrato, P.; Casula, G.; Cinti, F.R.; Civico, R.; Colini, L.; Cucci, L.; De Martini, P.M.; et al. Liquefaction phenomena associated with the Emilia earthquake sequence of May–June 2012 (Northern Italy). Nat. Hazards Earth Syst. Sci. 2013, 13, 935–947. [Google Scholar]
  61. Verdugo, R.; González, J. Liquefaction-induced ground damages during the 2010 Chile earthquake. Soil Dyn. Earthq. Eng. 2015, 79, 280–295. [Google Scholar] [CrossRef]
  62. Yao, Y.; Chen, J.; Li, T.; Fu, B.; Wang, H.; Li, Y.; Jia, H. Soil liquefaction in seasonally frozen ground during the 2016 Mw6.6 Akto earthquake. Soil Dyn. Earthq. Eng. 2018, 117, 138–148. [Google Scholar] [CrossRef]
  63. Nakamura, S. Applied Numerical Methods in C.; Prentice-Hall, Inc.: Hoboken, NJ, USA, 1993. [Google Scholar]
  64. INEC Base de Datos—Censo de Población y Vivienda del Ecuador. 2010. Available online: http://www.ecuadorencifras.gob.ec/base-de-datos-censo-de-poblacion-y-vivienda/ (accessed on 15 June 2021).
  65. Pennington, W.D. Subduction of the Eastern Panama Basin and seismotectonics of northwestern South America. J. Geophys. Res. Earth Surf. 1981, 86, 10753–10770. [Google Scholar] [CrossRef]
  66. Hey, R. Tectonic evolution of the Cocos-Nazca spreading center. Geol. Soc. Am. Bull. 1977, 88, i–vi. [Google Scholar] [CrossRef]
  67. Eguez, A.; Alvarado, A.; Yepes, H.; Machette, M.N.; Costa, C.; Dart, R.L.; Bradley, L.A. Database and map of Quaternary faults and folds of Ecuador and its offshore regions. U.S. Geol. Surv. Open-File Rept. 2003, 3, 289. Available online: https://pubs.usgs.gov/of/2003/ofr-03-289/ (accessed on 15 August 2018).
  68. Veloza, G.; Styron, R.; Taylor, M.; Mora, A. Open-Source Archive of Active Faults for Northwest South America. GSA Today 2012, 22, 4–10. [Google Scholar] [CrossRef]
  69. Kelleher, J. Rupture zones of large South Amercan earthquakes and some predictions. J. Geophys. Res. 1972, 77, 2087–2103. [Google Scholar] [CrossRef]
  70. Carena, S. Subducting-plate Topography and Nucleation of Great and Giant Earthquakes along the South American Trench. Seism. Res. Lett. 2011, 82, 629–637. [Google Scholar] [CrossRef]
  71. Chunga, K. Shallow Crustal Earthquakes and Seismic Zonation for Ecuador through the Integration of Geological, Seismological and Morphostructural Data. Ph.D. Thesis, University of Insubria, Varese, Italy, 2010; p. 165. (In Italian). [Google Scholar]
  72. Béjar-Pizarro, M.; Gómez, J.A.; Staller, A.; Luna, M.P.; Pérez-López, R.; Monserrat, O.; Chunga, K.; Lima, A.; Galve, J.P.; Díaz, J.J.M.; et al. InSAR-Based Mapping to Support Decision-Making after an Earthquake. Remote Sens. 2018, 10, 899. [Google Scholar] [CrossRef] [Green Version]
  73. Leonard, M. Earthquake fault scaling: Self consistent relating of rupture length width, average displacement, and moment release. Bull. Seismol. Soc. Am. 2010, 100, 1971–1988. [Google Scholar] [CrossRef]
  74. Wesnousky, S.G. Displacement and Geometrical Characteristics of Earthquake Surface Ruptures: Issues and Implications for Seismic-Hazard Analysis and the Process of Earthquake Rupture. Bull. Seismol. Soc. Am. 2008, 98, 1609–1632. [Google Scholar] [CrossRef]
  75. Stirling, M.; Goded, T.; Berryman, K.; Litchfield, N. Selection of Earthquake Scaling Relationships for Seismic-Hazard Analysis. Bull. Seismol. Soc. Am. 2013, 103, 2993–3011. [Google Scholar] [CrossRef]
  76. Fukushima, Y.; Tanaka, T. A New Attenuation Relation for Peak Horizontal Acceleration of Strong Earthquake Ground Motion in Japan. Bull. Seismol. Soc. Am. 1990, 80, 757–783. [Google Scholar]
  77. GAD-PTV. Estudio de Microzonificación Sísmica del Cantón Portoviejo. GAD Municipal del Cantón Portoviejo. 2018. Available online: http://microzonificacion.portoviejo.gob.ec/ (accessed on 12 July 2021).
  78. Stainforth, R.M. Applied micropaleontology in coastal Ecuador. J. Paleontol. 1948, 113–151. Available online: https://0-www-jstor-org.brum.beds.ac.uk/stable/1299388 (accessed on 13 May 2021).
  79. Bristow, C.R.; Hoffstetter, R.; Feininger, T.; Hall, M.T. Léxico Estratigráfico del Ecuador; Centre National de la Recherche Scientifique: Paris, Francia, 1977. (In Spanish)
  80. Whittaker, J.E. Benthic Cenozoic Foraminifera from Ecuador. In Taxonomy and Distribution of Smaller Benthic Foraminifera from Coastal Ecuador (Late Oligocene—Late Pliocene); British Museum (Nature History) Publishing: London, UK, 1988; 194p. [Google Scholar]
  81. Goharzay, M.; Noorzad, A.; Ahmadreza Mahboubi, A.; Mostafa, J. A worldwide SPT-based soil liquefaction triggering analysis utilizing gene expression programming and Bayesian probabilistic method. J. Rock Mech. Geotech. Eng. 2017, 9, 683–693. [Google Scholar] [CrossRef]
  82. Papathanassiou, G. LPI-based approach for calibrating the severity of liquefaction-induced failures and for assessing the probability of liquefaction surface evidence. Eng. Geol. 2008, 96, 94–104. [Google Scholar] [CrossRef]
  83. Serva, L.; Esposito, E.; Guerrieri, L.; Porfido, S.; Vittori, E.; Comerci, V. Environmental effects from five historical earthquakes in southern Apennines (Italy) and macroseismic intensity assessment: Contribution to INQUA EEE Scale Project. Quat. Int. 2007, 173–174, 30–44. [Google Scholar] [CrossRef]
  84. Serva, L.; Vittori, E.; Comerci, V.; Esposito, E.; Guerrieri, L.; Michetti, A.M.; Mohammadioun, B.; Mohammadioun, G.C.; Porfido, S.; Tatevossian, R.E. Earthquake Hazard and the Environmental Seismic Intensity (ESI) Scale. Pure Appl. Geophys. 2015, 173, 1479–1515. [Google Scholar] [CrossRef]
  85. Quigley, M.C.; Hughes, M.W.; Bradley, B.A.; van Ballegooy, S.; Reid, C.; Morgenroth, J.; Pettinga, J.R. The 2010–2011 Canterbury earthquake sequence: Environmental effects, seismic triggering thresholds and geologic legacy. Tectonophysics 2016, 672, 228–274. [Google Scholar] [CrossRef] [Green Version]
  86. Garcia, J.; Weatherhill, G.; Pagani, M.; Rodriguez, L.; Poggi, V.; The SARA Hazard Working Group. Building an open seismic hazard model for South America: The SARA-PSHA model. In Proceedings of the 16th World Conference on Earthquake Engineering, Santiago, Chile, 9–13 January 2017; p. 2145. [Google Scholar]
  87. Parra, H.; Benito, M.B.; Gaspar-Escribano, J.M. Seismic hazard assessment in continental Ecuador. Bull. Earthq. Eng. 2016, 14, 2129–2159. [Google Scholar] [CrossRef]
  88. Beauval, C.; Marinière, J.; Yepes, H.; Audin, L.; Nocquet, J.M.; Alvarado, A.; Baize, S.; Aguilar, J.; Singaucho, J.C.; Jomard, H. A New Seismic Hazard Model for Ecuador. Bull. Seismol. Soc. Am. 2018, 108, 1443–1464. [Google Scholar] [CrossRef]
  89. Swenson, J.L.; Beck, S.L. Historical 1942 Ecuador and 1942 Peru subduction earthquakes and earthquake cycles along Colombia–Ecuador and Peru subduction segments. Pure Appl. Geophys. 1996, 146, 67–101. [Google Scholar] [CrossRef]
  90. Wang, W. Some Findings in Soil Liquefaction; Report Water Conservancy and Hydro-Electric Power Scientific Research Institute: Beijing, China, 1979; pp. 1–17. [Google Scholar]
  91. Youd, T.L.; Idriss, I.M. Proceeding of the NCEER Workshop on Evaluation of Liquefaction Resistance of Soils. p. 276. Available online: https://pesquisa.bvsalud.org/portal/resource/pt/des-10504 (accessed on 8 June 2021).
  92. Liao, S.; Whitman, R. Overburden correction factor for SPT in sand. J. Geotech. Eng. 1986, 112, 373–377. [Google Scholar] [CrossRef]
  93. Juang, C.H.; Chen, C.J.; Jiang, T.; Andrus, R.D. Risk-based liquefaction potential evaluation using standard penetration tests. Can. Geotech. J. 2000, 37, 1195–1208. [Google Scholar] [CrossRef]
  94. Hashash, Y.M.A.; Musgrove, M.I.; Harmon, J.A.; Groholski, D.R.; Phillips, C.A.; Park, D. DEEPSOIL 6.1, User Manual; Board of Trustees of University of Illinois at Urbana-Champaign: Urbana, IL, USA, 2016. [Google Scholar]
  95. Romeo, R.; Pugliese, A. Seismicity, seismotectonics and seismic hazard of Italy. Eng. Geol. 2000, 55, 241–266. [Google Scholar] [CrossRef]
  96. Douglas, J. Earthquake ground motion estimation using strong-motion records: A review of equations for the estimation of peak ground acceleration and response spectral ordinates. Earth-Sci. Rev. 2003, 61, 43–104. [Google Scholar] [CrossRef] [Green Version]
  97. Ambraseys, N.N.; Douglas, J.; Sarma, S.K.; Smit, P.M. Equations for the estimation of strong ground motions from shallow crustal earthquakes using data from Europe and the Middle East: Horizontal peak ground acceleration and spectral acceleration. Bull. Earthq. Eng. 2005, 3, 1–53. [Google Scholar] [CrossRef] [Green Version]
Figure 1. Illustrated seismotectonic location on the Ecuadorian coasts (left panel); subduction events presented in the sea of the province of Manabí (right panel) and upper crustal geological faults and aftershocks (16 April 2016 to 27 January 2019) [14].
Land 11 00463 g001
Figure 2. Local geological map of the city of Portoviejo (A), and location of the boreholes (B), adapted and modified from Cando-Jácome et al. [51].
Land 11 00463 g002
Figure 3. Representative examples of the liquefaction observed in the city of Portoviejo on 16 April 2016: (A); building damage from settlement and structural failure due to poor construction quality; (B) the presence of differential settlement in the soil of June 5 avenue; (C) settlement in the vaults in the general cemetery.
Land 11 00463 g003
Figure 4. Geological and soil profile in the urban area of the city of Portoviejo.
Land 11 00463 g004
Figure 5. Analysis of the liquefaction susceptibility based on the criteria proposed by Seed et al. [40]. The green rectangle is distributed spatially to determinate the areas susceptible to soil liquefaction, while the white area indicates the non-liquefiable soils. The circles represent the boreholes.
Land 11 00463 g005
Figure 6. (a) Results of N SPT values (b) and safety factor (Fs), according to the depth of different geological units in the city of Portoviejo. (c) Liquefaction potential index (LPI), according to the depth of different geological units in the city of Portoviejo.
Land 11 00463 g006
Figure 7. Special projection of buildings that collapsed after the Pedernales earthquake (Mw 7.8) on 16 April 2016. (A) Portoviejo urban area is located in a narrow river valley area. (B) Analysis of the topographic wetness index and topographic position index. (C) Delineation of potential saturated soils from geomorphological analysis.
Land 11 00463 g007
Figure 8. Liquefaction probability hazard map of the urban center of Portoviejo city. A seismic hazard scenario corresponding to amax = 0.50 g was used in the predicted probability of liquefaction occurrence, as adapted and modified from Cando-Jácome et al. [51].
Land 11 00463 g008
Figure 9. Seismic elastic spectra of accelerations according to NEC-11 [54] for soils and rocks.
Land 11 00463 g009
Figure 10. Elastic seismic spectra with acceleration response spectrum for motion at different scales (grey lines).
Land 11 00463 g010
Table 1. Seismic subduction events in the Manabi Province [8].
Sector (Epicenter)DateMagnitude (Mw)
Bahía de Caráquez3 May 18967.1
Pedernales-Muisne1 June 19077.4
Pedernales14 May 19427.9
Bahía de Caraquez16 January 19567.4
Bahía de Caraquez4 August 19987.1
Pedernales16 April 20167.8
Table 2. List of faults that are able to generate seismic movement with a magnitude greater than Mw 6 in the canton of Portoviejo. Estimated Magnitude from type fault was taken from Wesnousky (2008), the estimated Magnitude was taken from [73], and the level of reliability was from [71].
Capable FaultTypeFault Length (km)Fault Depth (km)Distance Respect to Portoviejo (km)StrikeDip Slip FaultRakeFault Width (km)Max Offset (m)Estimated Magnitude Estimated Magnitude from Fault DepthEstimated Magnitude from Type Fault PGA in RockLevel of Reliability
FP01Normal13.68328545−9070.86.16.16.20.33Low
FP02Shear fault Sx15.5813204557.60.86.26.16.60.35High
FP03Shear fault Dx15813454518080.86.26.16.60.35High
FP04Reverse38.31239104590101.36.76.77.10.35High
FP05Normal25.912502545−9091.16.56.56.80.32Moderate
FP06Shear fault Dx2583508518091.16.56.56.80.34Low-Mod
FP07Shear fault Dx25813454518091.16.56.56.80.37Low-Mod
FP08Reverse18815130459080.96.26.26.50.35Low-Mod
FP09Reverse2612185459091.16.56.56.80.32Low
FP10Shear fault Sx1782835085580.96.36.26.60.36Low-Mod
FP11Reverse18840320459080.96.26.26.50.35Low
FP12Reverse1484615459070.86.16.16.30.33Low
FP11Normal138233045−9070.8666.20.32Low
FP12Reverse158932459080.86.16.16.30.34Low
FP13Shear fault Sx268172285591.16.56.56.80.38Low
FP14Shear fault Dx178153458518080.96.26.26.40.35Low
Table 3. Classification of the geological materials of the seven present Quaternary units and the one Miocene (Tosagua) unit of Portoviejo city.
Geologic UnitsThickness of SedimentsUSCS Soil TypeGeological AgeAverage Shear Rate in Meters
Fill1 ≤ m ≤ 4MH and waste materialsModern110 ≤ vs. ≤ 150
Alluvium plain deposits (Qa)4 ≤ m ≤ 18CL, CHHolocene130 ≤ vs. ≤ 175
Ancient alluvium plain deposits (Qaa)8 ≤ m ≤ 20CL, CH, MLHolocene to Late Pleistocene160 ≤ vs. ≤ 260
Levee channel deposit (Qaa)2 ≤ m ≤ 6SM, MHHolocene to Late Pleistocene150 ≤ vs. ≤ 230
Colluvium deposits (Qc)6 ≤ m ≤ 15MH, MLLate Pleistocene180 ≤ vs. ≤ 260
Piedmont alluvial deposit (Qpa)6 ≤ m ≤ 16ML, MHLate Pleistocene180 ≤ vs. ≤ 280
Ancient colluvium alluvium deposits (Qca)4 ≤ m ≤ 30MH, MLLate Pleistocene130 ≤ vs. ≤ 260
Alluvial valley fill deposit (Qaf)15 ≤ m ≤ 40ML, MH, SMMiddle Pleistocene300 ≤ vs. ≤ 500
Soft rock (Msc)>20 msiltstone, claystoneMiocenevs. > 650 m/s
Table 4. Statistical soil parameter analysis results of “ground zero” of the urban area of the city of Portoviejo.
Soil ParametersFcSrρdLPLLN1SPT60
(%)(%)(g/cm3)(%)(%)
LithologyMin–MaxMin–MaxMin–MaxMin–MaxMin–MaxMin–Max
Alluvium plain deposits5–9986.6–99.91.218–1.3498–15NP-414–36
Levee channel and Ancient alluvium deposits75–9775.56–93.561.099–1.1785–3839–684–19
Fc—Fraction of fine particles; Sr—Degree of saturation; ρd—Dry density; LL—Liquidity limit; LP—Plasticity limit; NSPT—Standard penetration.
Table 5. Liquefaction severity in the LPI scale.
Liquefaction Potential CategoryIwasaki et al. [32]Sonmez [44]
Very lowLPI = 0No liquefiable (based on Fs ≥ 1.2)
Low0 < LPI < 50 < LPI < 2
Moderate-2 < LPI < 5
High5< LPI < 155 < LPI < 15
Very highLPI > 15LPI > 15
Table 6. Soil liquefaction probability proposed by Chen and Juang [38] for the city of Portoviejo.
Probability of Liquefaction PLDescription (Likelihood of Liquefaction)Security Factor FsClass
0.993Almost certain that it will liquefy0.310 5
0.870Very likely0.629 4
0.392Liquefaction/non-liquefaction is equally likely1.058 3
0.292Unlikely1.1692
-Almost certain that it will not liquefy-1
Table 7. Liquefaction probability calculation according to the class proposed by Chen and Juang [38] in the city of Portoviejo.
Description (Likelihood of Liquefaction)ClassBoreholePL
Very likely4N020.789
Liquefaction/non-liquefaction is equally likely3N040.571
Liquefaction/non-liquefaction is equally likely3N050.494
Almost certain that it will liquefy5N060.997
Almost certain that it will liquefy5N090.898
Almost certain that it will liquefy5N100.986
Almost certain that it will liquefy5N110.970
Very likely4N120.845
Almost certain that it will liquefy5N140.998
Very likely4N170.841
Almost certain that it will liquefy5N180.994
Almost certain that it will liquefy5N190.997
Almost certain that it will liquefy5N200.992
Almost certain that it will liquefy5N220.994
Liquefaction/non-liquefaction is equally likely3N270.391
Unlikely2N280.221
Liquefaction/non-liquefaction is equally likely3N290.460
Almost certain that it will liquefy5N300.998
Almost certain that it will liquefy5N310.991
Almost certain that it will liquefy5N320.991
Almost certain that it will liquefy5N330.999
Almost certain that it will liquefy5N340.994
Table 8. Seismological characteristics of the scaled seismic movements for a profile D soil. The 7.2 Mw seismic event in Chichi, Taiwan in 1999 was a reverse oblique mechanism.
MovScale FactorRrup (Km)Vs30 (m/s)File Name
11.14829.62427.73CHICHI_CHY024
21.164616.04233.14CHICHI_CHY036
32.139624.1442.15CHICHI_CHY046
41.887824.13169.52CHICHI_CHY047
52.029737.48318.52CHICHI_CHY088
61.538840.88423.4CHICHI_CHY033
71.506335.68393.77CHICHI_TCU034
81.38117.64350.06CHICHI_TCU051
91.20636.34359.13CHICHI_TCU055
101.25812.11389.41CHICHI_TCU101
Mov—Movement; Rrup—Distance to fault; Vs30—Propagation speed of shear waves in the surface thirty meters.
Publisher’s Note: MDPI stays neutral with regard to jurisdictional claims in published maps and institutional affiliations.

