
Ecosystem Stability Assessment of Yancheng Coastal Wetlands, a World Natural Heritage Site
by
 , ,
, ,
Peng Tian
1,† ,
,
Luodan Cao
1,†, 
Jialin Li
1,2,*,
Ruiliang Pu
3 ,
,
Yongchao Liu
1,
Haitao Zhang
1 and
Caiyi Wang
1 1
Department of Geography & Spatial Information Techniques, Ningbo University, Ningbo 315211, China
2
Ningbo Universities Collaborative Innovation Center for Land and Marine Spatial Utilization and Governance Research, Ningbo University, Ningbo 315211, China
3
School of Geosciences, University of South Florida, Tampa, FL 33620-5250, USA
*
Author to whom correspondence should be addressed.
†
These authors contributed equally to this work.
Land 2022, 11(4), 564; https://0-doi-org.brum.beds.ac.uk/10.3390/land11040564
Submission received: 8 March 2022
/
Revised: 4 April 2022
/
Accepted: 10 April 2022
/
Published: 11 April 2022
(This article belongs to the Special Issue Protection, Management and Restoration of Coastal Ecosystems)
Abstract
:By evaluating the stability of coastal wetland ecosystems, health conditions of regional ecosystems can be revealed and the sustainable development of coastal wetlands can be promoted. Coastal wetlands have been scarcely involved in present ecosystem stability evaluation studies, these being performed with relatively simple evaluation data sources. Therefore, in this research, a comprehensive and representative ecosystem stability evaluation index system was constructed by using the pressure-state-response model and multi-source datasets from perspectives of internal and external environmental changes of the Yancheng coastal wetlands, Jiangsu, China. The analysis results indicated that: (1) The ecosystem stability of the Yancheng coastal wetlands was at an early warning stage, and all segments except the Binhai segment (relatively stable) were in an early warning state. (2) In the criterion layer, the Dafeng District and the whole Yancheng District were faced with the highest pressure, followed by the Dongtai, Xiangshui and Binhai segments, successively. The Sheyang segment reached the highest state level, followed by the Binhai, Xiangshui and Dafeng segments in succession. (3) In the factor layer, the whole Yancheng District was faced with high resource and socioeconomic double pressures, with a poor water quality state and relatively low environmental pressure; favorable soil, biological and landscape states; and positive response to wetland protection. Various factors varied from county to county. (4) In the index layer, the ecosystem stability of the Yancheng coastal wetlands was significantly influenced by the invasion of alien species, change rate of natural wetland area (D32), change rate of artificial wetland area, increment of aquafarm area, intensity of fertilizer application and coverage of dominant vegetations. The novel significance of this research lies in enriching global coastal wetlands ecosystem stability evaluation investigations by providing a typical case study.
1. Introduction
Stability, as a unique feature of wetland ecosystems, is a key factor deciding the prosperity or depression of wetland ecosystems [1]. It characterizes the ecological safety and health of wetlands and plays an crucial role in promoting the sustainable eco-environmental and socioeconomic development of wetlands [2]. Wetland ecosystem stability refers to the ability of a regional wetland ecosystem that has faced an external disturbance lower than a threshold to weaken and clear up the disturbing force by virtue of a self-regulation ability, so as to promote its self-recovery to the original state [3]. A wetland ecosystem features a high internal complexity, containing linear and nonlinear association characteristics of the system’s constituent parts, the internal spatial-temporal heterogeneity characteristics, the fluctuation characteristics of each component state in the system, etc., which aggravates the difficulty and complexity of wetland ecosystem stability evaluation [4,5]. With a rapid increase in the population and economic activities in coastal areas in recent years, coastal wetlands have been confronted with a series of problems, such as natural wetland degradation, environmental pollution and ecosystem stability reduction [6,7,8]. It will be significant to scientifically evaluate the ecosystem stability of coastal wetlands based on their strategic positions and ecological benefits.
The present ecosystem stability evaluations usually carried out by scholars have mainly concentrated on eco-environmentally vulnerable areas such as karst mountainous areas, drainage basins, arid deserts and fan deltas [9,10], covering important ecosystem types such as forest lands, grasslands, water areas, wetlands and tidal flats, but focusing on coastal wetland ecosystem research [11,12,13]. The main research methods adopted may be summarized as follows: First, detailed information of regional surface water quality, soil and organisms is acquired through field sampling [14,15]. This method places a particular emphasis on changes in concrete internal functions of regional ecosystems, where field investigations and experiments are involved, so their input cost is high. Second, with an extensive application of “3S” technology, remote-sensing images have been applied to regional landscape ecosystem evaluation at different scales, generating related satellite-derived data, such as the ratio vegetation index (RVI), normalized difference vegetation index (NDVI), difference vegetation index (DVI) and enhanced vegetation index (EVI) [16,17,18]. Further, regional ecosystem stability is characterized by changes in vegetation indexes. This method can save substantial time and money required by field investigations and experiments, but the evaluation results fail to accurately reflect the changes in regional natural elements. Third, the regional ecosystem’s stability is comprehensively investigated based on field-measured data, remote sensing image data and socioeconomic data, which can give comprehensive feedback on regional ecosystem features [11,19]. Given the dynamics, complexity and comprehensiveness of regional ecosystems, the evaluation work, if carried out by combining multi-source data, will be greatly improved. As to the concrete model selection, the disturbance-response model (D-R), multiple stepwise regression [20], comprehensive index method, pressure-state-response model (PSR), analytic hierarchy process (AHP) [21] and driving force-pressure-state-impact-response (DPSIR) model have been widely applied in current studies on ecosystem stability evaluation [22]. The PSR model characterizes the interaction characteristics between regional human activities and ecosystems based on the pressure, state and response relations faced by regional ecosystems [21]. This model can not only embody pressures faced by ecosystems under the driving force of human activities but also effectively analyze changes of ecosystem state and internal and external driving mechanisms in order to provide managers with pertinent and constructive decision-making suggestions. Thus, this model is of significant applicability and operability [23].
No unified evaluation system has been formed over the selection of concrete indexes in the current ecosystem stability evaluation [24]. The concrete indexes in different evaluation models are different according to their ecological connotations and representational meanings [25]. For instance, based on the PSR model, Li et al. [26] selected 24 indicators to establish an evaluation system for the ecosystem stability of tidal flat wetland. When selecting evaluation indexes, predecessors have mostly placed extra emphasis on single data sources, while there are fewer evaluation index systems composed of multi-source data [23,27]. AHP and the entropy method have been mainly used as weight determination methods, which have both subjective and objective evaluation characteristics, respectively [21]. AHP shows higher flexibility and applicability in the evaluation index systems with some subjective indexes [28,29]. To sum up, in considering differences in scholars’ professional backgrounds and research objectives, the present index system construction and diagnosis methods for ecosystem stability evaluation are still at an initial stage of extensive discussion and uncertainty, so scholars of different professions need to further enrich the related theoretical foundation and technical methods.
In 2019, the World Heritage Committee of the United Nations Educational Scientific and Cultural Organization (UNESCO) deliberated and passed the resolution of listing the China Yellow Sea (Bohai Sea) Migratory Bird Habitat (Phase I) into the World Heritage List [30]. As such, Yancheng’s natural wetlands became the 14th natural world heritage site throughout China, and the first in Jiangsu, filling the voids of this list left by coastal wetland types in China. The present studies on the Yancheng coastal wetlands have mostly focused on coastal scouring and silting dynamics, landscape patterns and environmental evolution [31], invasion of alien species, wildlife protection and vegetation recognition [32], while a few have been involved in relevant ecosystem stability studies. Hence, based on the important position of the Yancheng coastal wetlands and the current research status regarding ecosystem stability, to supplement and enrich existing ecosystem stability evaluation methods, this wetland system stability evaluation investigation is necessary. To be specific, in this study, (1) the evaluation data sources were enriched based on multi-source data (field measured data, remote sensing image data and socioeconomic data), and (2) an ecosystem stability evaluation index system was constructed for the Yancheng coastal wetlands using 33 indexes (external environmental change factors and internal natural environmental factors), and thus a practical case study on the coastal wetland ecosystem stability was supplemented. The novel significance of this research is expected to promote the restoration and protection of the coastal wetland ecosystem in Yancheng and provide people with a typical case for the research on the stability of global coastal wetland ecosystems.
2. Materials and Methods
2.1. Study Area
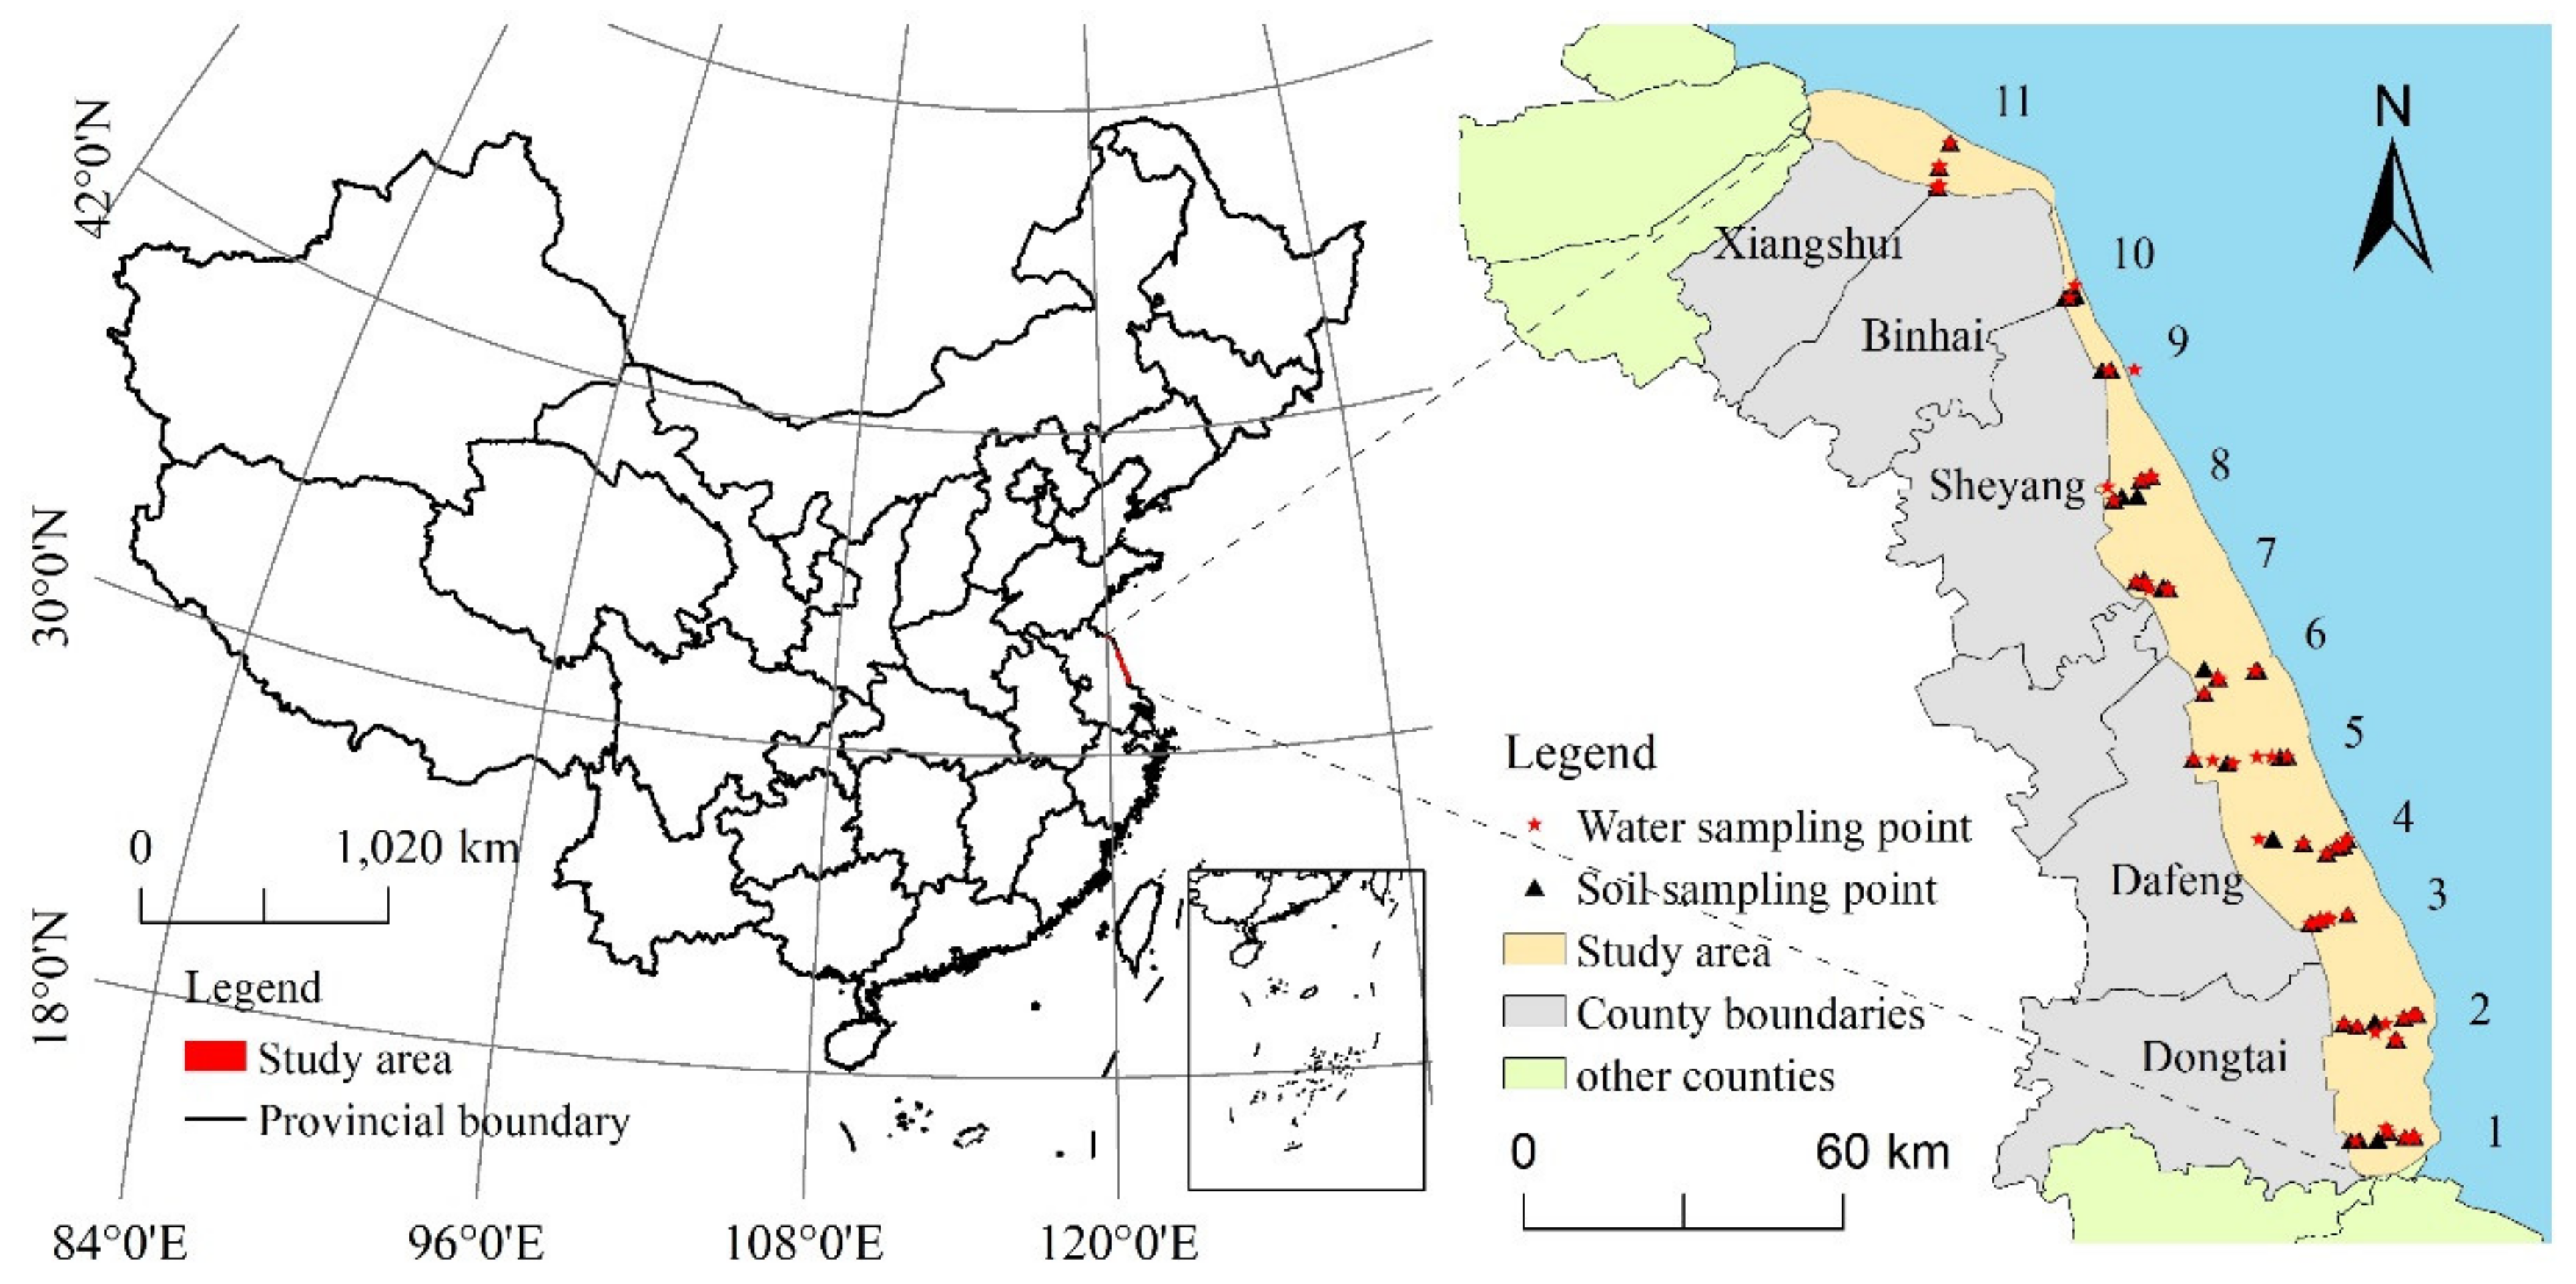
The Yancheng coastal wetlands are located in the central coastal area of the Jiangsu Province, with the geographical location of 32°34′–34°28′ N and 119°48′–120°56′ E (Figure 1). The subtropical monsoon climate prevails in the study area, featuring abundant rain and heat, and the river here flows from the west to the east and converges into the Yellow Sea. The shoreline of the Yancheng coastal wetlands accounts for 60% of the total shoreline length in the Jiangsu Province, with abundant shoreline resources [31]. In addition, the conservation area is of extremely abundant biodiversity, where there are over 2600 species of animals and plants, and the vegetation types mainly include Phragmites australis, suaeda salsa, couch grasses and spartina alterniflora. In this research, for a demarcation of the scope of the Yancheng coastal wetlands, the main road and river boundaries in Yancheng City were taken as the landside of the study area; the land boundary with the maximum landscape coverage in coastal wetland images, which slightly extended towards the sea, was taken as the seaside; the northern boundary was the Guanhe River; the southern boundary was the administrative boundary in the south of Yancheng City; and the total study area covered an area of about 3402.49 km2 [32,33].
2.2. Experimental Design and Method
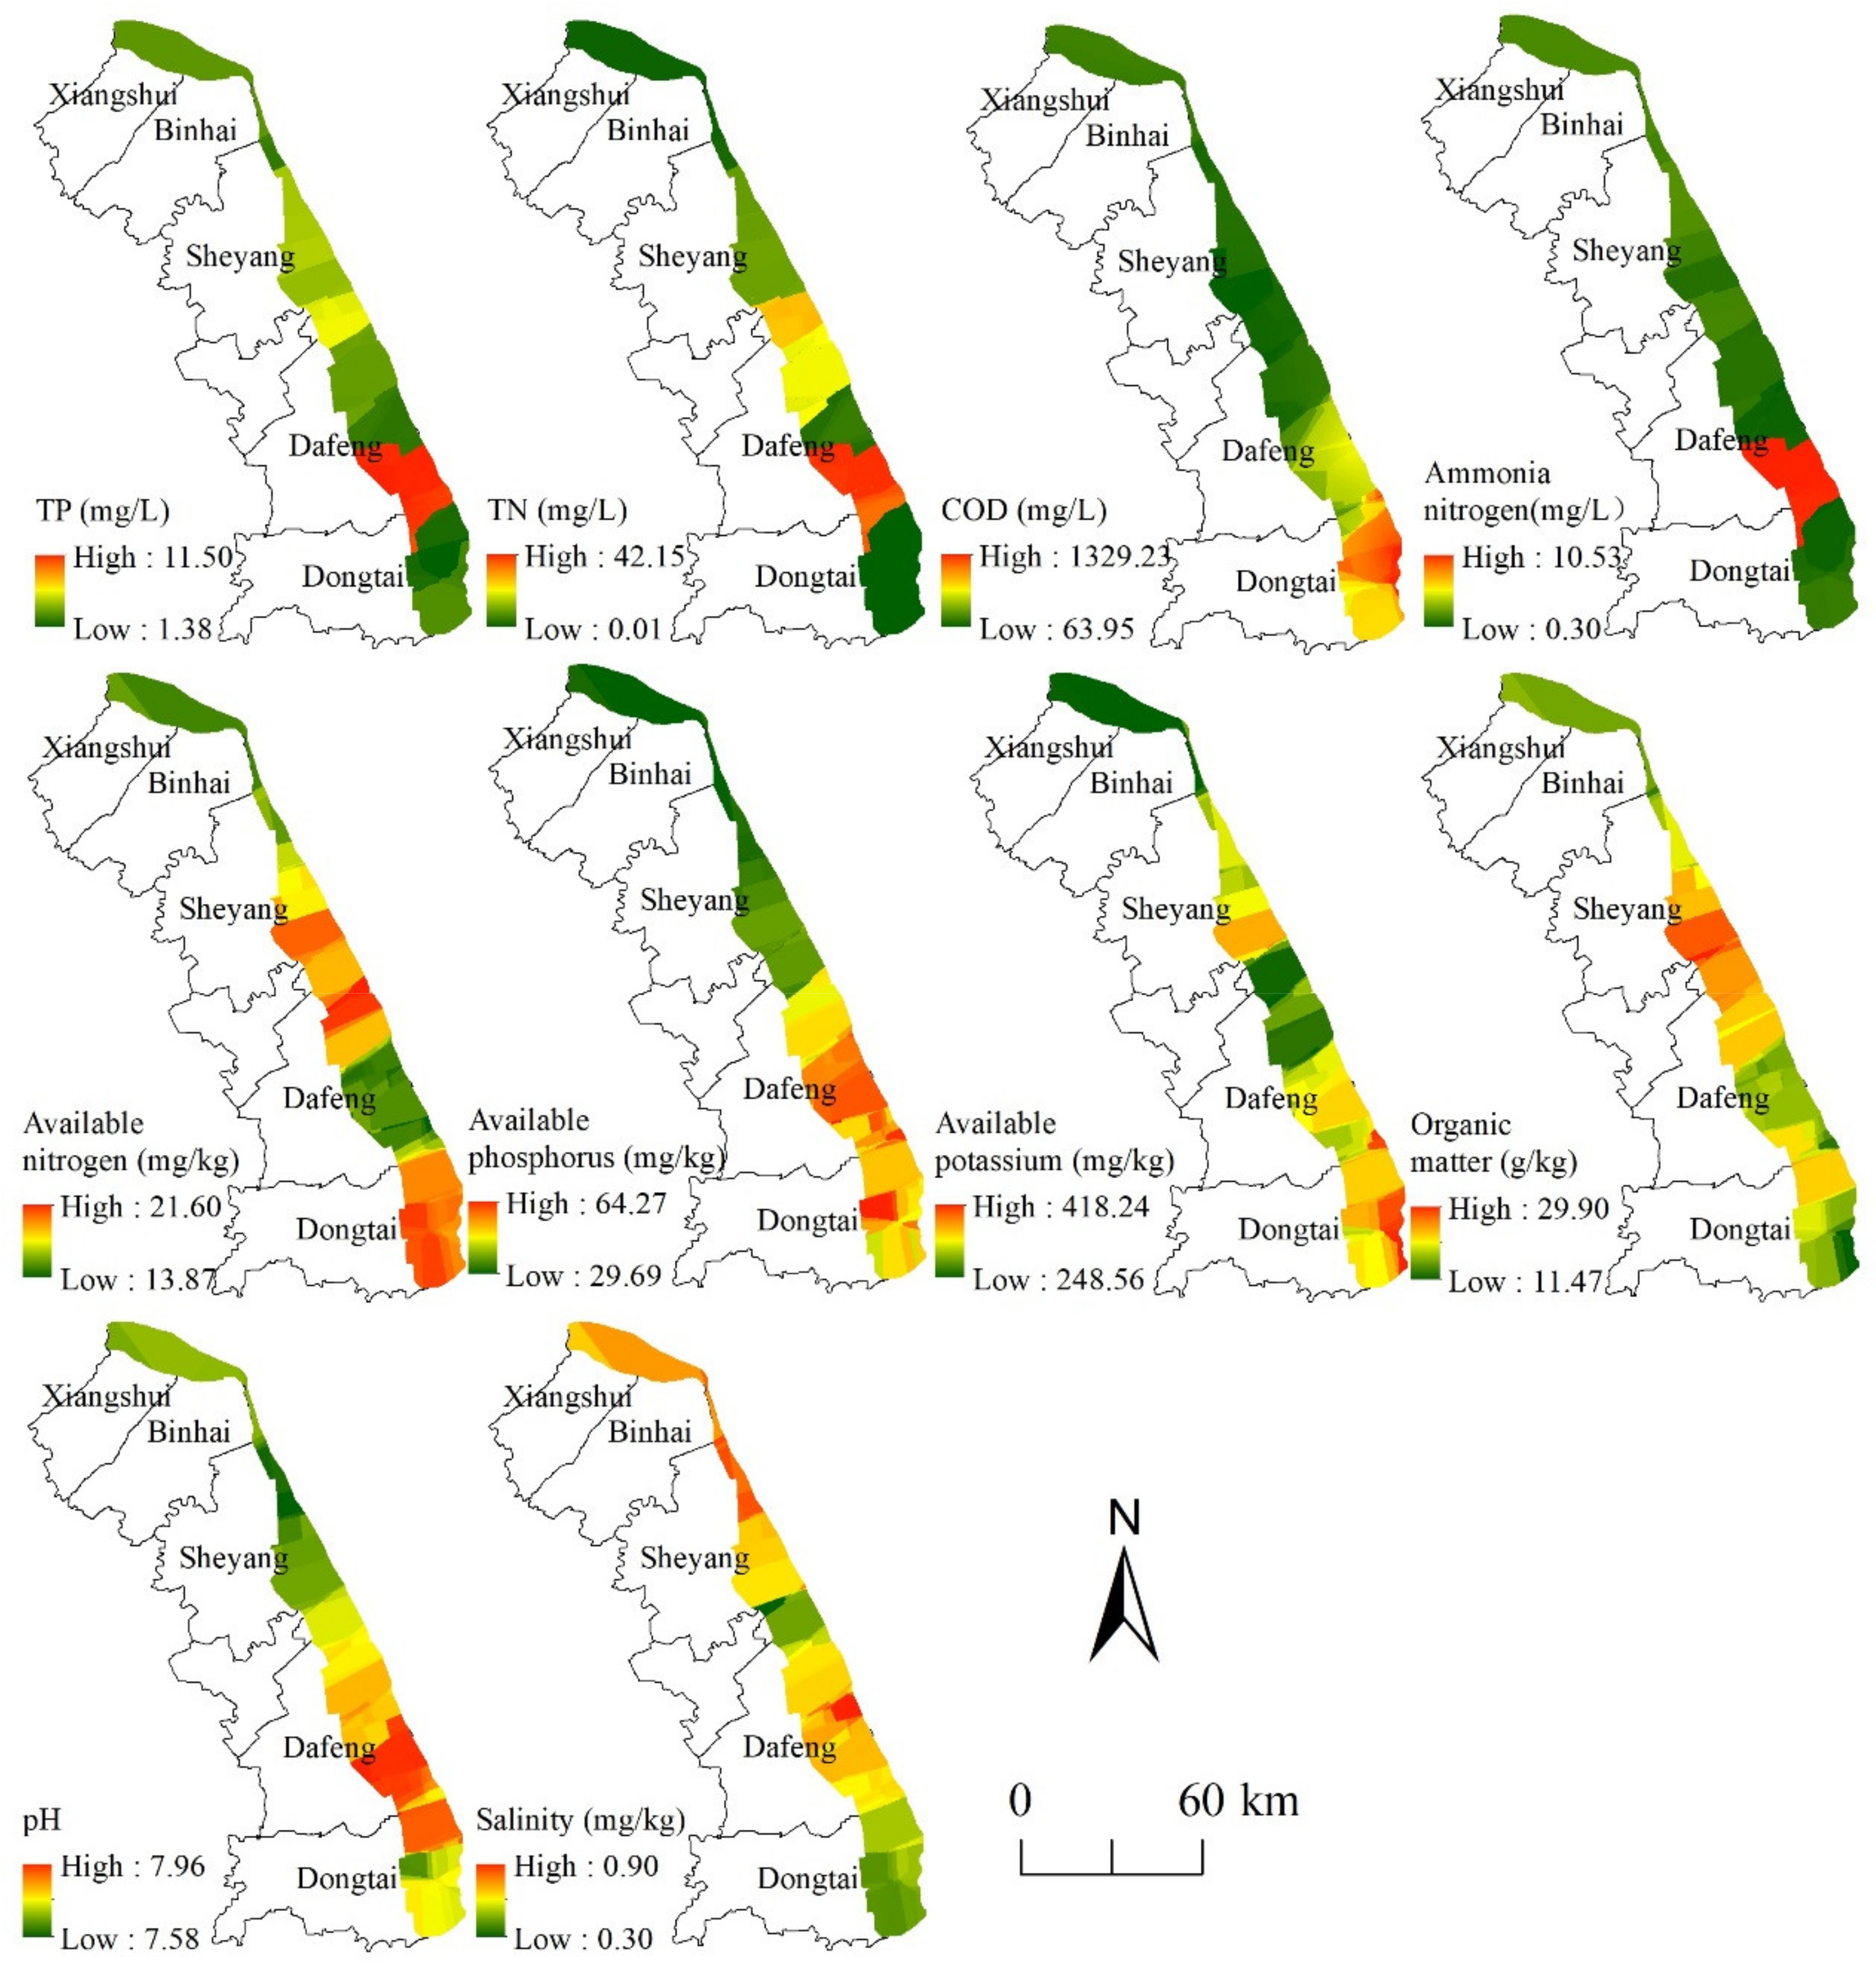
A one-week field sampling investigation was carried out in the Yancheng coastal wetlands in the middle ten days of November 2018 (autumn), and the last ten days of February (winter), middle ten days of May (spring) and beginning of August (summer) 2019, respectively [34]. The wetlands were evenly distributed into 11 sampling routes during the field trips (Figure 1), and there were 59 soil samples and 64 water quality samples at each phase. Within the sampling routes, the inland-to-coastal mudflats were perpendicularly distributed, while the perpendicularity deviated slightly in some routes in consideration of traffic accessibility. In the initial sampling, the geographical coordinates of sampling sites were determined and recorded, followed by repeated sampling surveys, three times in different seasons, in an effort to ensure that the sampled data synthesized the regional seasonal changes. The sampling survey proceeded in strict accordance with industrial standards [35]. During the soil sampling process, the soils covered by all kinds of vegetation were comprehensively considered, and soil samples were each collected by mixing repeated 3–4 samples. The water sampling was mainly conducted in rivers, and the vegetation distribution at sampling points was recorded [13]. The spatial distribution characteristics of soil and water quality are shown in Figure 2.
2.2.1. Soil Sampling and Analysis
The field sampling survey was implemented on the soil in the Yancheng coastal wetlands according to nationally stipulated industrial standards. The soil samples were bagged and marked according to the sampling points and carried back to the laboratory for further treatment. Then, the sealed soil samples were air dried and orderly put in a well-ventilated place. Massive soil samples were crushed, while large stones, vegetation roots and animal carcasses were picked out. Next, the dried soil samples were ground with two different procedures: rough grinding and fine grinding. In the former procedure, impurities were picked out from the soil samples after the grinding treatment. Afterwards, the samples were taken by the quartering method and passed through nylon sieves with a mesh aperture of 0.25 micron, making preparations for sample preservation and follow-up experiment. The samples experiencing rough grinding were taken through the quartering method and ground once again, then passed through sieves. The measured indicators of soil samples passing through nylon sieves with different mesh apertures were different, e.g., the soil samples passing through 0.25-micron nylon sieves supported indexes, such as organic matter and total nitrogen (TN), and those passing through 0.15-micron nylon sieves supported the total analysis of soil elements, etc. After this, the ground samples were placed in sealed bags, and the samples’ information, such as serial number, soil type and sampling point, were recorded. The surplus samples were air dried, sealed and put in dry and well-ventilated places without direct sunlight or pollution for the subsequent experiment. Six indicators are mainly obtained from soil, which are available nitrogen, available phosphorus, available potassium, organic matter, pH value and salinity.
2.2.2. Water Sampling and Analysis
The water samples were collected using a water sampler from the surface layers (depth: about 0.3~0.5 m) of rivers and lakes near different landscape types in the Yancheng coastal wetlands. Next, they were placed into sterile and pollution-free chemical bottles, with serial numbers recorded on the body of bottles. In this research, the water quality was tested via an American Hash DR1900 portable spectrophotometer, which could rapidly measure the water quality status. In addition, the water samples were pretreated (digestion) with the help of a DRB200 digestion system developed by Hash Company, including indexes such as total phosphorous (TP), TN, ammonia nitrogen (NH4+-N) and chemical oxygen demand (COD). This digestion system could freely choose the digestion time and temperature according to test standards, with the time and temperature ranges of 0~480 min and 37~165 °C, respectively. The digestion process mainly aimed to oxidize to-be-measured elements of different valence states in the water into single high-valence states or into inorganic compounds that were easy to separate. In the end, the water quality of the digested water samples was measured and the content values of water quality indicators at sampling points were obtained.
2.3. Data Processing and Analysis
2.3.1. Construction of Ecosystem Stability Evaluation Index System
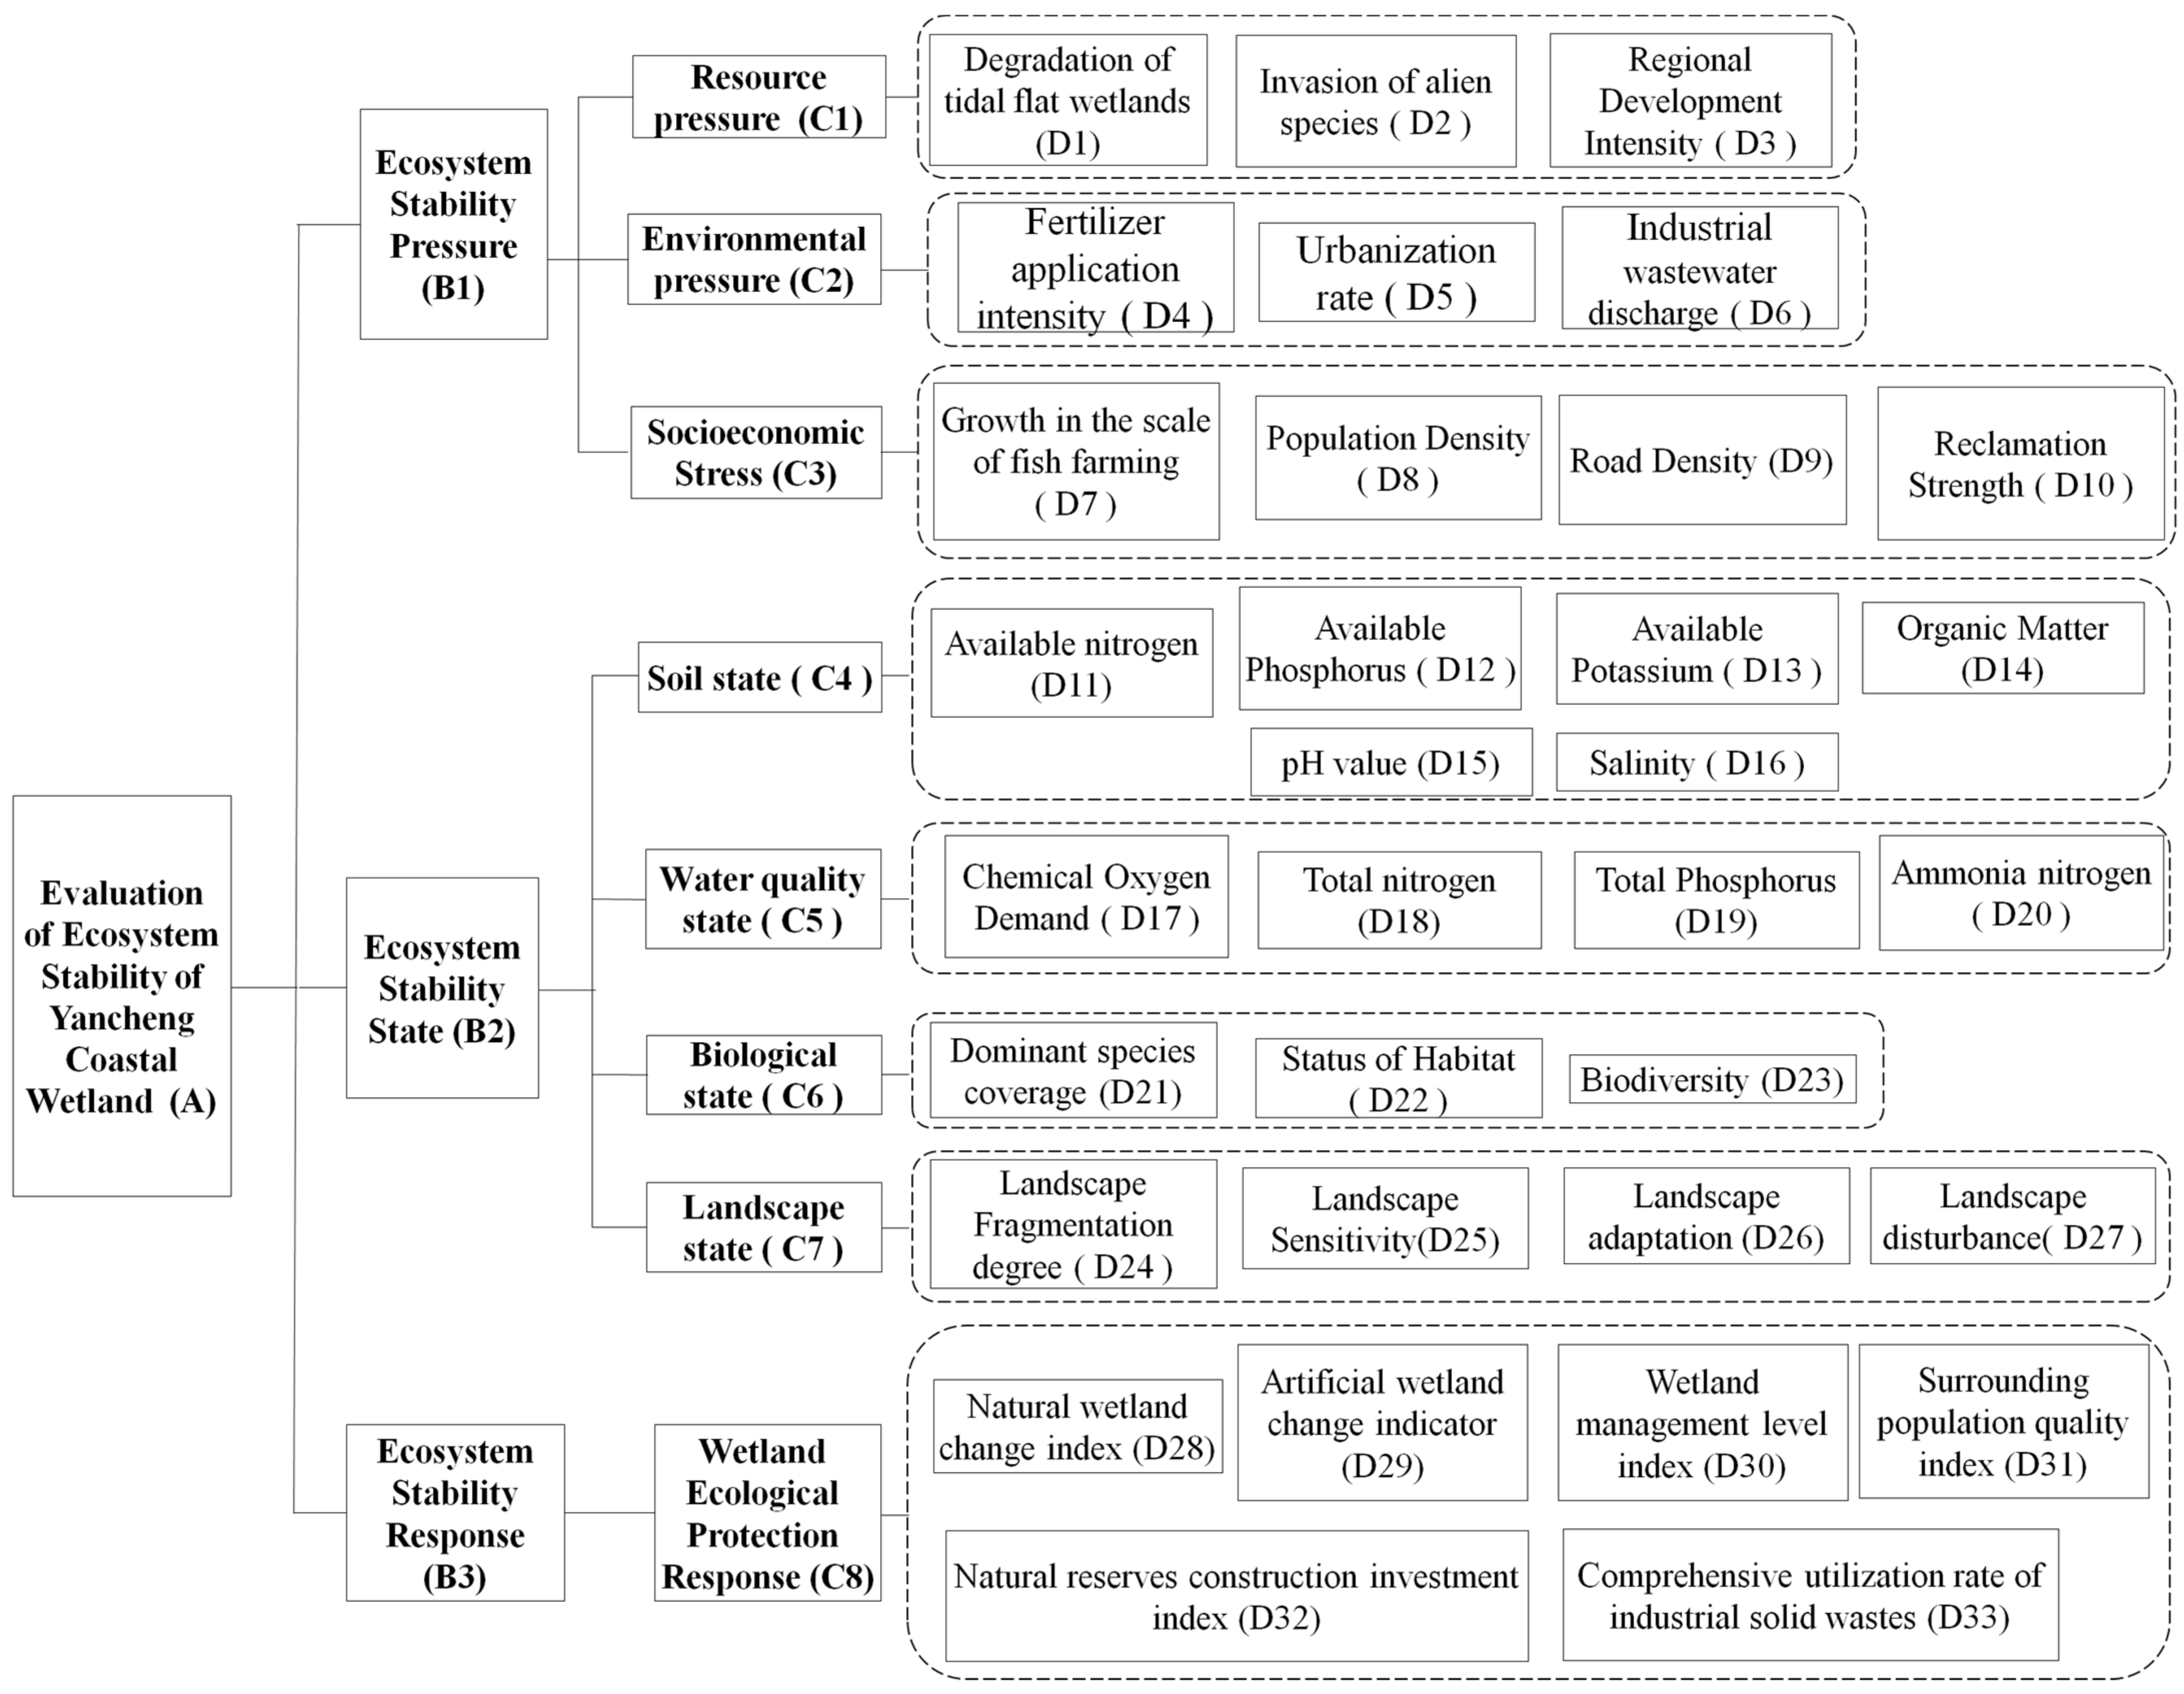
Based on the connotation and concept of PSR model and by referring to predecessors’ research progress on the Yancheng coastal wetland ecosystem [33,35], the data sorting and field survey on the Yancheng coastal wetland ecosystem were carried out, and the opinions were extensively solicited from experts in the fields of ecology and environment [36,37], thus constructing a basic ecosystem stability evaluation index system of the Yancheng coastal wetlands by following the basic principles of index construction. On this basis, the ecosystem stability of the Yancheng coastal wetlands in 2019 was characterized and assessed. This evaluation index system was implemented layer by layer based on the basic structure of AHP. The ecosystem stability evaluation included target layer (A), criterion layer (B), factor layer (C), and index layer (D) (Figure 3). Among them, the target layer (A) expresses the general status of the Yancheng coastal wetlands’ stability. The criterion layer (B) includes three criterion layers: ecosystem stability pressure (B1), ecosystem stability state (B2) and ecosystem stability response (B3). The “pressure” comes from human society and the natural environment. It is manifested in resource and environmental pressure, pollution load and natural disasters. The "state" directly reflects the ecological health of wetlands, and comes from the analysis and description of existing wetland water resources, vegetation, soil, and species. The "response" reflects the capital investment, pollution control efforts, and government supervision capabilities of the local government and society in order to maintain wetlands and improve the status of wetland ecosystems. The factor layer (C) mainly includes three aspects, the first is the resource, environmental and socio-economic pressures faced by coastal wetlands. The second is the soil, water quality, biodiversity and landscape pattern characteristics of coastal wetlands under the disturbance of human activities. Finally, it includes the impact of wetland pressure and state changes on the overall wetland ecological function in the region, and the direct or indirect effects of surrounding human activities on wetland protection. The detailed introduction of the indicator layer (D) is shown in Table A1, including its calculation method and the impact of each indicator on the coastal wetland ecosystem function.
Each single index had two characteristics: change and current situation, where the former included tidal flat wetland degradation index (D1), invasion of alien species index (D2), reclamation intensity index (D10) and change rates of natural and artificial wetland areas (D28 and D29). The years 1991 and 2019 were taken as the research phase, and the field sampling year 2019 was the end year of the research. By reference to predecessors’ studies on the changes in the landscape pattern/land utilization/vegetations in Yancheng coastal wetland, it was discovered that before 1990, human activities generated relatively small impacts on the study area [31,38]. However, after 1990, its land utilization/vegetation changed rapidly; the habitat quality declined; and the degree of landscape fragmentation and disturbance rose. Under a great influence of cloud cover in the study area in 1990, which resulted in no suitable remote sensing images, the year 1991 was taken as the starting year of this research. The changes in the land utilization in the Yancheng coastal wetlands in the past 28 years were used to reflect the transition characteristics of regional ecosystems. The current situation indexes mainly reflected the current natural environment and socioeconomic status of the Yancheng coastal wetlands in 2019. With predecessors’ research results as references [34,39], an evaluation grading standard (five-level standard) was established to eliminate the uncertainties brought in by time, as seen in Table A2.
2.3.2. Methods and Data Sources
The degree of landscape fragmentation ( is used to characterize the degree of fragmentation of regional landscapes at a time point; a higher degree of fragmentation indicates the poorer internal stability of landscapes, i.e., the lower the corresponding landscape ecosystem stability, as expressed by the following formula [40]:
where stands for the number of patches of one landscape type, and represents the total area of one landscape type.
Landscape sensitivity refers to the response degree [41]. Impacted greatly by the influence degree and their own resistance, the landscape sensitivity is constructed mainly using landscape disturbance index (Ui) and landscape vulnerability index (Vi).
where n is the number of landscape types; i denotes the landscape type; is the area of landscape type i in the ecologically vulnerable plot k; and represents the area of the vulnerable plot k.
Landscape adaptation index (LAI) is defined as the resistance, adaptability and restorability of landscapes against the impacts of human activities, so it is associated with the functions, composition and structure, diversity and homogeneity of regional landscapes, and it is established using patch richness density (PRD) index, Shannon diversity index (SHDI) and Shannon evenness index (SHEI) [32].
Landscape disturbance () refers to the response of regional internal landscapes to external human activities. Under the impacts of human activities, regional landscapes or patches start the aggravated transformation from simplicity, regular shape, close landscape association and significant diversity into fragmentation, irregular shape, discontinuity and heterogeneity. Hence, the landscape indexes showing obvious landscape changes under the impacts of human activities, such as degree of landscape fragmentation (Ci), degree of aggregation (Si) and degree of dominance (Ki), are selected to constitute the landscape disturbance index [41]. The values of Ci, Si and Ki are calculated by reference to predecessors’ research, with the weights of 0.5, 0.3 and 0.2, respectively.
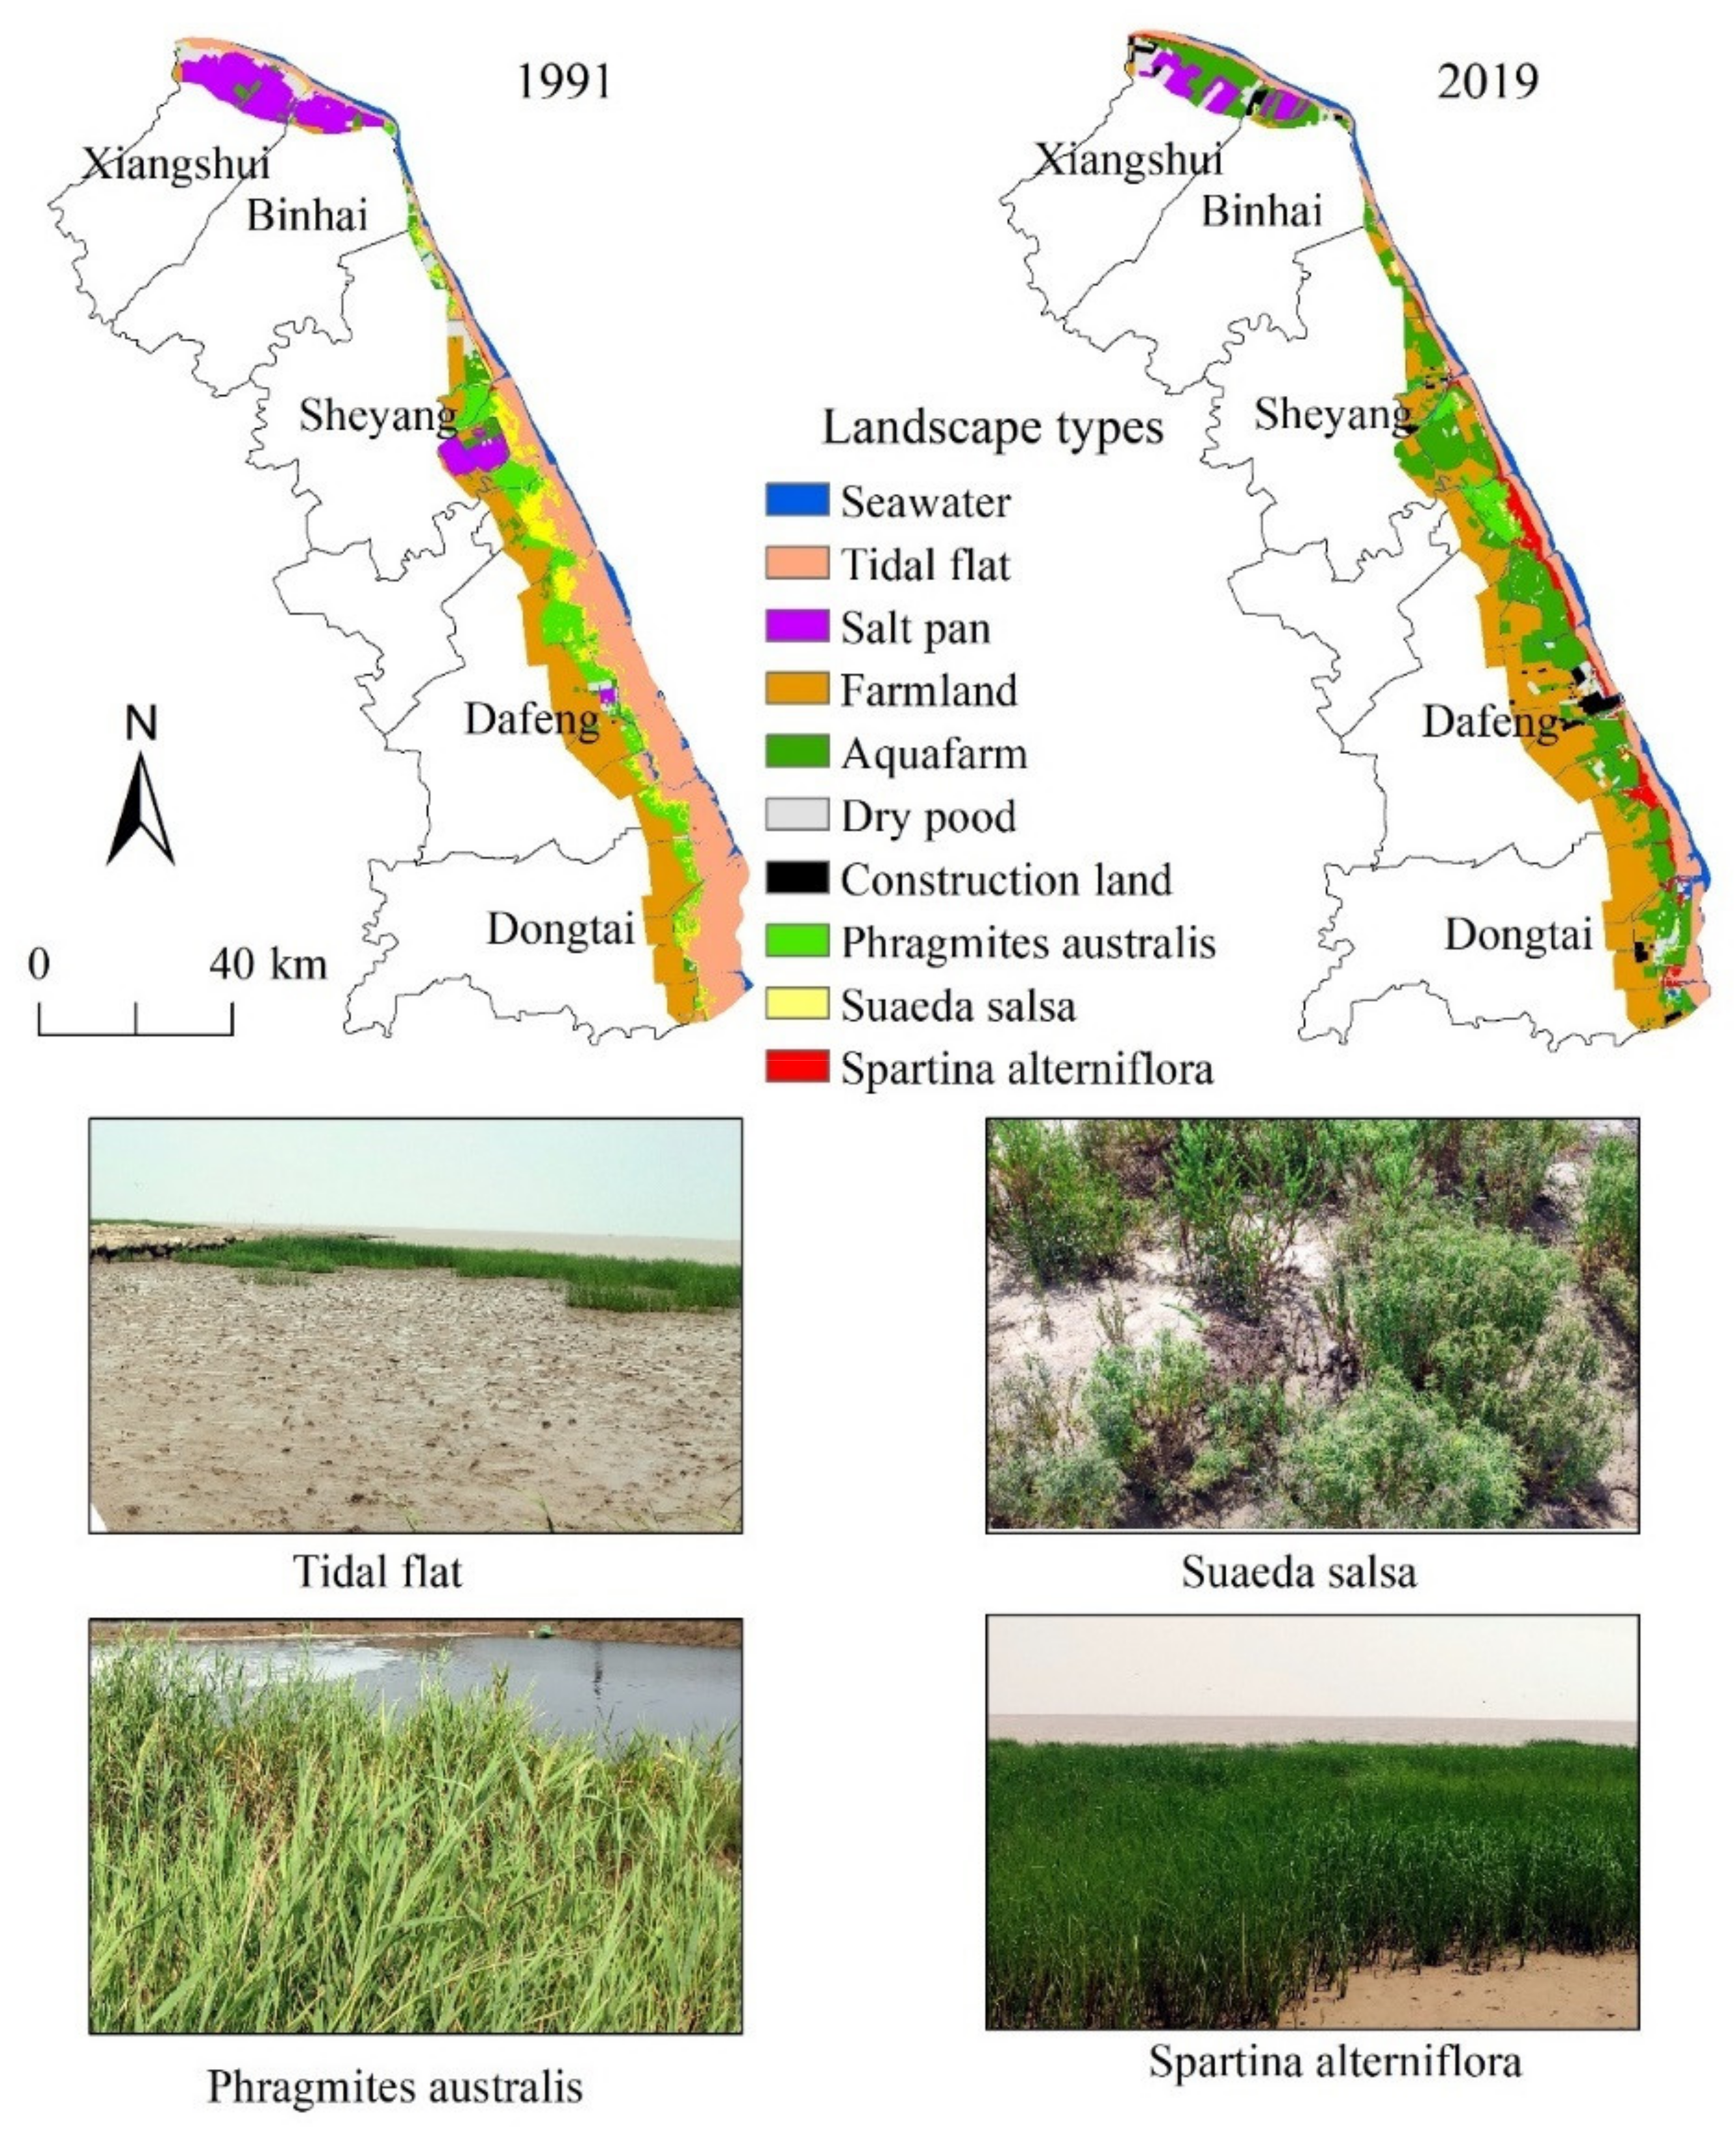
The land utilization data for the two periods were obtained by remote sensing image interpretation of Landsat 5 TM (1991) and Landsat 8 OLI (2019), where the images came from United States Geological Survey (USGS) website (http://glovis.usgs.gov/, accessed on 7 March 2022) with row and column numbers of 119/37 and 120/36, respectively. Next, supervised classification of the remote sensing data was performed via ENVI5.3 software by combining the field survey after several preprocessing steps such as clipping, geometric correction and registration, waveband synthesis, image mosaicking and image enhancement, and then the interpretation results were corrected through manual visual interpretation. According to predecessors’ research experience and regional practice, landscapes were divided into natural and artificial wetland landscapes, where the former included seawater, tidal flats, Phragmites australis, suaeda salsa and spartina alterniflora, and the latter included salt pans, farmlands, aquafarms and dry ponds [34]. Due to disturbances from human activities, traces (e.g., work sheds, ports and villages) of human residence or activities appeared in the Yancheng coastal wetlands; these were named construction lands by referring to predecessors’ research [31]. According to the field survey, the interpretation accuracy was higher than 85%, meeting the research needs, with the spatial distribution as shown in Figure 4. The socioeconomic data involved in this research included those derived from the 2019 Yancheng Statistical Yearbook [42] and related county-level statistical departments.
2.3.3. Evaluation Criteria and Grades for Coastal Wetland Ecosystem Stability
- (1)
- Selection of evaluation units
The evaluation units for coastal wetland ecosystem stability can be generally divided into point-like units and planar units, where the former, which is generally specific to grid cell size or sampling points, can embody the stability characteristics of ecosystems in space more meticulously and accurately. However, it is not conducive to the direct comparison between different regions, and the sampling-centered point-like data can hardly be used in the whole region [34].
In general, planar units include administrative division, drainage basins, landscapes, etc. Despite the lower accuracy than point-like units, planar units are characterized by more convenient data acquisition, and the results are of better interpreting significance. Given that most of the socioeconomic data and eco-environmental data of Yancheng City might be divided, organized, surveyed and calculated by administrative regions, vector plane-line administrative regions, i.e., Xiangshui County, Binhai County, Sheyang County, the Dafeng District and the Dongtai District included in the Yancheng coastal wetlands, were taken as the ecosystem stability evaluation units, which could be more clearly compared according to their ecological evaluation results, thus comprehensively assessing the ecological status in the whole region and understanding the interregional ecological differences [23]. Meanwhile, eco-environmental protection policies could be more effectively formulated based on the current differences, which then provided a decision-making basis for regional ecological governance.
- (2)
- Evaluation grading standard
The indexes were classified into five grades (extremely dangerous, dangerous, early warning, relatively stable and stable) according to the calculation results of 33 indexes and the relevant industrial standards, where the indexes with positive and negative effects were graded oppositely. This grading work unified the expression of indexes with different effects and unified the dimensions of indexes with different properties for the sake of follow-up calculation (Table A2). The indexes under the biology, landscapes and ecosystem stability of ecosystem stability pressure and ecosystem stability state were classified into five grades using the natural breakpoint method [41]. The indexes under ecosystem state were graded in accordance with the latest regulations promulgated by relevant government management departments. For example, the soil data were graded according to the soil fertility standards specified in the second China ‘s national general soil survey and relevant standards. The water quality data were graded in accordance with Environmental Quality Standards for Surface Water released by the State Environmental Protection Administration of China (http://www.hnziyang.gov.cn/, accessed on 7 March 2022). The fertilizer application intensity and urbanization rate were graded on basis of Construction Indicators for Ecological County, City and Province (Trial) issued by the State Environmental Protection Administration of China (http://www.mee.gov.cn, accessed on 7 March 2022). The current situation of habitats and wetland protection management level were quantitatively and qualitatively graded by sampling experts according to the actual situation of Yancheng conservation area. The final evaluation results of each index are shown in Table A3.
- (3)
- Grading evaluation of ecosystem stability
Given qualitatively described indexes in the evaluation index system, AHP was used to determine weights of ecosystem stability evaluation indexes, and the ecosystem stability of the Yancheng coastal wetlands was evaluated through the comprehensive index method (graded and general).
Grading evaluation refers to the hierarchical progressive evaluation of index layer, factor layer, subsystem layer and target layer, which can comprehensively figure out the importance of indexes at each grade of each layer in the ecosystem stability evaluation system. General evaluation aims to obtain the ecosystem stability evaluation values in each grade of each layer and the general ecosystem stability evaluation value [29].
where is the ecosystem stability evaluation value of the Yancheng coastal wetlands; represents the grading value of each ecosystem stability evaluation index; and denotes the weight value of each ecosystem stability evaluation index.
3. Results
3.1. General Ecosystem Stability Evaluation and Grading
The ecosystem stability value of the Yancheng coastal wetlands was 2.27 in 2019, and as such was at an early warning stage (Table 2), indicating that the regional ecosystem stability was externally threatened and disturbed to some degree and certain early warning information was reflected. To be more specific, the coastal wetland ecosystem in the Binhai segment was in a relatively stable state, with a stability value of 3.15, while those in the Xiangshui segment, Sheyang segment, Dafeng segment and Dongtai segment were all in an early warning state, with stability values of 2.67, 2.93, 2.24 and 2.61, respectively. The wetland ecosystem in the Dafeng segment showed the weakest stability, with the stability value being smaller than the general ecosystem stability value of the Yancheng coastal wetlands. The Binhai segment and Sheyang segment had the highest wetland ecosystem stability values. For the whole of the Yancheng coastal wetlands, the northern ecosystem stability value was higher than the southern one, e.g., the northern Xiangshui segment and Binhai segment had greater wetland ecosystem stability values than those in the southern Dafeng segment and Dongtai segment.
3.2. Ecosystem Stability Evaluation in a Criterion Layer
The indexes of ecosystem stability pressure, state and response values were classified into 1–5 grades (extremely dangerous, dangerous, early warning, relatively stable and stable), so the greater the pressure, state and response grading values, the stronger the ecosystem stability. From an angle of subsystem layers (Table 2), the Yancheng coastal wetlands’ ecosystem stability pressure (2.02) was dangerous in all segments except the Binhai segment, among which the Dafeng segment in the whole region of Yancheng was faced with the highest pressure (1.98). The ecosystem stability pressure in the Dafeng segment had already reached an extremely dangerous stage, with intense socioeconomic construction activities and facing the highest pressure from external disturbance. For instance, the pressure faced by ecosystem stability in the Dafeng segment was aggravated due to a series of human activities such as intense reclamation activities, the increasing area of industrial parks and cities, and infrastructure construction at ports. The northern Xiangshui segment and Binhai segment were faced with relatively low ecosystem stability pressure, being at a relatively stable stage, and their pressure was mainly associated with the expansion of aquafarm land. The ecosystem stability pressure was high in the southern Dongtai segment.
The coastal wetlands’ ecosystem stability state was at the early warning stage; among them, the Sheyang segment reached the best state (evaluation value: 2.84) because it held ecological reserves such as red-crowned crane, elk and migratory bird habitats, as well as a core zone bearing minimum disturbance from human activities. In addition, the Sheyang segment was of high ecosystem integrity, so its ecosystem stability level was higher than that in all other segments. The Binhai segment had the second-best stability state (2.81), and it was long and narrow with a small area, so its ecosystem was relatively stable. The general ecosystem stability level in the whole of Yancheng City was the lowest (2.29), and among the all segments, and the stability states of the Dafeng segment and Xiangshui segment were the lowest and the 2nd lowest (2.35 and 2.37, respectively). As for ecosystem stability responses, the Sheyang segment gave the greatest response, with a response level (3.92) much higher than that in all other segments. Depending on the protection of the core zone and the construction of natural reserves, the Sheyang segment took positive solutions to its own ecosystem protection. As a whole, the response level in the southern Dafeng segment and Dongtai segment was higher than that in the Xiangshui segment and Binhai segment, but all of the four segments showed lower ecosystem stability response values than that in the whole of Yancheng City.
3.3. Ecosystem Stability Evaluation in a Factor Layer
At the factor layer (Table 2), the whole of Yancheng City was faced with high resource pressure and socioeconomic pressure and poor water quality status, with the evaluation grading values of 1.92, 1.45 and 1.00, respectively, and its water quality status had reached an extremely dangerous stage, indicating that it was urgent to strengthen the water quality protection and governance in the Yancheng coastal wetlands. The environmental pressure was relatively low, its soil, biological and landscape states were satisfactory and its response to wetland protection was active, such as its environmental pressure factor (3.48), biological state factor (3.00), landscape state (3.10) and wetland ecosystem protection response (3.07) all being relatively stable. For the overall Yancheng coastal wetlands, therefore, the enormous pressure caused by regional resource and socioeconomic factors upon the wetland should be relieved, and the regional water quality should be effectively protected, so as to promote the coordinated development of human beings and the wetland ecological environment.
The Xiangshui segment showed poor water quality and biological state, both of which were a dangerous state, suggesting that regional wetland protection was inefficient, with the stability state at an early warning stage (2.12), making it necessary to formulate wetland management mechanisms in the Xiangshui segment and elevate its management level. In the Xiangshui segment, the landscape state was favorable with low environmental pressure and resource pressure, and its state was in a relatively stable stage. The Binhai segment featured low wetland resource pressure, environmental pressure and socioeconomic pressure, and its resource pressure factor reached a stable state (4.28), indicating that the Binhai segment contained rich resources. In addition, the environmental pressure, socioeconomic pressure and water quality state in the Binhai segment were in a relatively stable state, but the soil state, biological state and landscape state were poor in this segment, especially the biological state factor in this segment which was already in a dangerous grade. As such, the regional biodiversity should be strengthened, and the wetland ecological protection and response state (early warning grade) should be elevated.
As a core zone in the ecological protection of coastal wetland, the Sheyang segment was faced with low and stable environmental pressure; its biological state and landscape state were comparatively good; and its biological state factor was in a stable state (4.58), which was closely related with the policy implemented in this core zone, which is that all human activities were forbidden. In this segment, the input into wetland ecological protection was large, which actively responded to the wetlands’ ecological protection, but meanwhile, the resource pressure and socioeconomic pressure (early warning grade) should be relieved. In the end, the regional water quality state (dangerous grade) should be improved, and the water pollution should be prevented and controlled. The Dafeng segment’s wetlands were faced with enormous resource pressure and socioeconomic pressure, both of which were in a dangerous grade. Under the influence of rapid urbanization and industrialization, the water quality state (early warning grade) was poor in this segment, accompanied by relatively serious water pollution. However, the regional biological state and landscape state were relatively favorable, with great inputs into the wetland protection. The Dongtai segment was faced with low environmental pressure but high resource pressure and socioeconomic pressure; its resource pressure factor was already at a dangerous grade; and its socioeconomic pressure factor was at the early warning stage. In addition, the Dongtai segment was of poor water quality state and biological state (early warning grade), and the wetland ecological protection response remained to be further enhanced.
3.4. Ecosystem Stability Evaluation of Index Layer
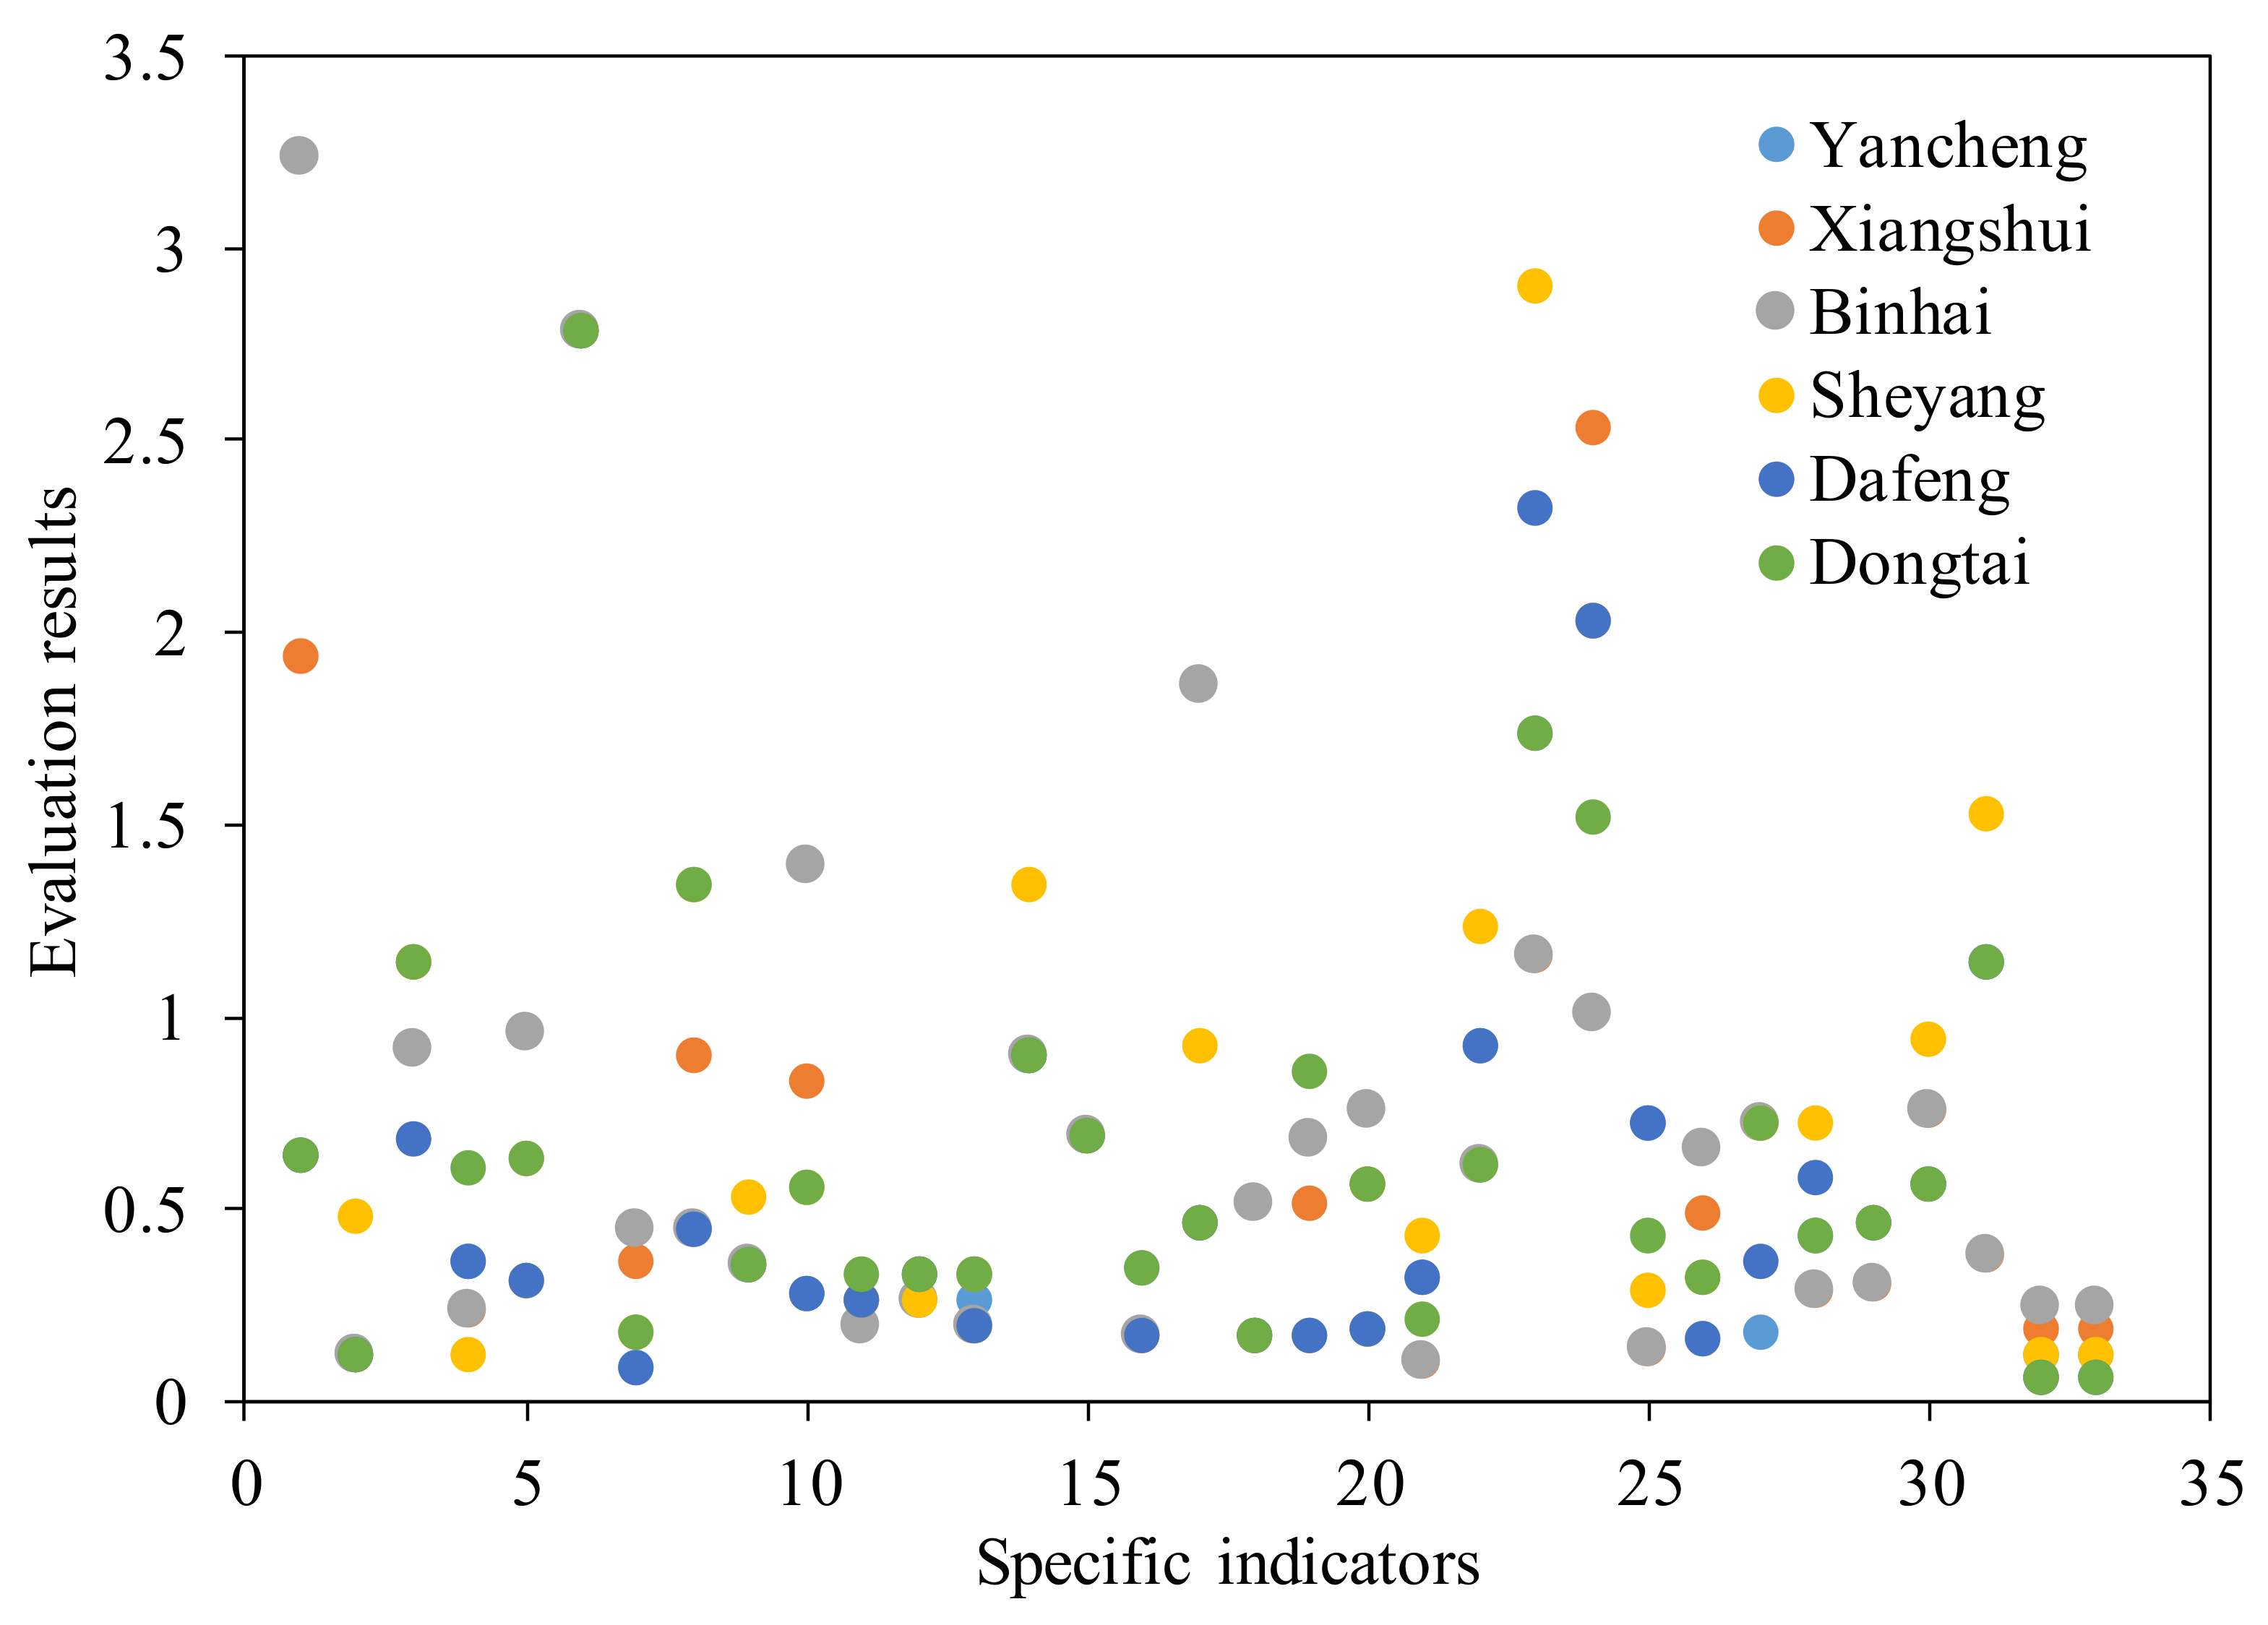
The index layer contained the evaluation grading values of 33 evaluation indexes in each segment (Figure 5). Except for the tidal flat wetland degradation rate (D1) in the Binhai segment being in a relatively stable state, the other 32 indexes were in an early warning, dangerous or extremely dangerous state.
There were 10 peak values (i.e., evaluation value > 1.00) in total in the index layer of the Yancheng coastal wetland ecosystem; namely, the tidal flat wetland degradation rate (D1), regional development index (D3), urbanization rate (D6), population density (D8), reclamation area (D10), organic matters (D14), COD (D17), current situation of habitats (D22), biodiversity index (D23), degree of landscape fragmentation (D24) and natural reserves construction investment (D31). The 10 index peak values were higher than the extremely dangerous grade, but the dangerous grade dominated, and a few were at relatively stable (D1 in Binhai segment) and early warning grades (D6 and D24 in the whole of Yancheng City and the Xiangshui segment; D6 in the Binhai segment; D23, D6 and D24 in the Sheyang segment; D6, D23 and D24 in the Dafeng segment; and D6 in theDongtai segment). The low-peak indexes (average value < 0.15) in each segment mainly included the change rate of natural wetland area (D32), change rate of artificial wetland area (D33), invasion of alien species (D2) and increment of aquafarm area (D7) in the whole of Yancheng City; the invasion of alien species (D2) and coverage of dominant vegetations (D21) in both the Xiangshui segment and Binhai segment; the change rate of natural wetland area (D32), change rate of artificial wetland area (D33) and fertilizer application intensity (D4) in the Sheyang segment; the invasion of alien species (D2), increment of aquafarm area (D7), change rate of natural wetland area (D32) and change rate of artificial wetland area (D33) in the Dafeng segment; and the invasion of alien species (D2), change rate of natural wetland area (D32) and change rate of artificial wetland area (D33) in the Dongtai segment. Spartina alterniflora (included into the list of the first batch of alien invasive species in 2003) was a typical alien invasive species, encroaching on a large regional area of natural tidal flat wetland, where its area grew from 614.34 hm2 in 1991 to 15677.10 hm2 in 2019. Moreover, the expansion of aquafarm land driven by reclamation also aggravated the embezzlement on regional natural landscapes; the area of its artificial wetlands grew rapidly while that of natural wetlands dropped rapidly; the ecological functions of natural wetlands tended to be weakened; and the stability of growth environments for animals and plants was disrupted, which led to the decline in habitat conditions and quality, going against the development of reginal biodiversity and ecosystem stability. In the end, for the fertilizer application intensity (D4), the total amount of pesticide and fertilizer application in Yancheng City presented a declining trend during 2010–2018, indicating that the regional eco-environmental awareness tended to be strengthened. However, the total amount of pesticide and fertilizer application was still large, especially as the amount of pesticide and fertilizer application in Sheyang County and the Dafeng District much larger than that in the all other counties of the Binhai wetlands.
4. Discussion
4.1. The Importance of Assessing the Stability of Coastal Wetland Ecosystems
Ecosystem research focuses on globally important and fragile ecosystems with different themes, such as forest ecosystems, grassland ecosystems, marine ecosystems, desert ecosystems, urban ecosystems, wetland ecosystems, etc. [43,44]. Among them, coastal wetlands, as an important part of wetland ecosystems, are rich in productivity and natural resources. However, current research on coastal wetlands focuses on the change characteristics of specific elements within a coastal wetland ecosystem, such as landscape pattern, vegetation, water quality, soil, etc., and fewer studies comprehensively explore the stability of the coastal wetland ecosystem [8,41]. The main reason is that the coastal wetland ecosystem has the dual attributes of artificial and natural, so the internal stability of the system involves various factors of natural ecological environment and human activities. Therefore, it is difficult to effectively assess the stability of coastal wetland ecosystems through a single type of factors. In view of this, our study took the Yancheng coastal wetlands (world natural heritage site) as the research object and constructed a relatively complete ecosystem stability assessment system from the internal and external environmental change factors of coastal wetland. In order to enrich the theoretical and practical research on coastal wetlands, we provided a typical case for the world’s typical coastal wetland ecosystem research.
4.2. Differences in Evaluation Results of Coastal Wetland Ecosystem Stability
In evaluating coastal wetland ecosystem stability, the selection of evaluation indicators, the method of data acquisition of evaluation indicators, the selection of evaluation models and evaluation units, and the method of determining weights will all have an impact on the evaluation results of ecosystem stability, which will intensify the evaluation process and help to understand the uncertainties of the results.
First of all, the selection of the evaluation index system should not necessarily choose a more complicated system to make the evaluation results more accurate, but the construction of the evaluation index system must comprehensively consider the internal and external environmental change factors to ensure the comprehensiveness and scientific rigor of the evaluation index system [23]. Our study mainly drew on the ecosystem stability evaluation index systems of predecessors, and comprehensively considered the actual situation of the study area [28]. Based on the external pressure faced by coastal wetlands, their current state and their response to external changes, a comprehensive evaluation index system was constructed. However, the evaluation index system can still be enriched and supplemented from the internal and external indicators of an ecosystem.
Second, most of our predecessors’ studies have been restricted to single datasets [45]. Given that a high cost should be allocated to field sampling and measurement, most ecosystem stability studies have concentrated on socioeconomic data or remote sensing image data [10], which can easily aggravate uncertainties of evaluation indexes. Therefore, the coastal wetland ecosystem stability evaluation with multi-source data in this study will be of good explanatory significance. In the field sampling work and experimental process, errors existed in sampling time, sampling methods, monitoring instruments and experimental steps, so uncertainties in the data acquisition were reduced by repeatedly comparing samples and strictly operating experimental steps.
Third, since qualitative description was done in the evaluation system established in this research, the AHP method was very pragmatic in the weight determination, but it was subjective to some extent. Therefore, the entropy method and AHP method should be combined in the future study to determine the weight values, thus effectively reflecting the index weights by combining subjective and objective factors.
Finally, the verification of evaluation results is especially important in consideration of uncertainties in the ecosystem stability evaluation results. However, the approach to ecosystem stability evaluation varies from scholar to scholar (due to differences in evaluation object, index selection, evaluation system, evaluation unit and scale, model selection and weight determination), so it is also difficult to verify the evaluation results. If the evaluation results are compared with the field measurement results, this will be only applicable to the studies with single data sources or ecological connotations [19]. In addition, it will be persuasive if the results in this research are compared with predecessors’ study results based on the same study area or similar study areas, or if they are compared according to the same connotations of evaluation index systems. For example, the connotation of ecosystem stability is similar to that of ecosystem health. In this research, the Yancheng coastal wetlands ecosystem stability was mainly in an early warning state. However, the evaluation results of the Yancheng coastal wetlands ecosystem health obtained by Qiu [46] indicated a vulnerable state, so the two results can be comparatively verified. Moreover, the evaluation index system constructed by Qiu was enhanced [46] by our study, thus extending and enriching the connotation of ecosystem stability.
4.3. Suggestions on the Stability of Coastal Wetland Ecosystems
The following suggestions were mainly proposed specifically to the problems at all layers in the ecosystem stability evaluation index system of the Yancheng coastal wetlands: (1) control the reclamation speed, relieve the intensity of human activities in coastal wetland, establish a wetland ecological compensation mechanism and charge or compensate for the behavioral subjects destroying or protecting regional wetland environments, respectively, so as to realize the goal of protecting wetland ecological environments; (2) accelerate the protection and governance of coastal wetlands while promoting marine economic development in Yancheng, and solve the regional difficulties (e.g., water quality reduction, fertilizer pollution and invasion of alien species), since ecological civilization construction and economic development are interdependent and promote each other; (3) optimize the regional land utilization structure, control the growth of artificial wetlands and facilitate the reasonable spatial layout of national coastal wetlands; and (4) strengthen the scientific research work on the natural ecosystem and human activities inside coastal wetlands, establish a network monitoring system for the Yancheng coastal wetlands ecosystem, and boost its stable development.
4.4. Prospects for the Stability of Coastal Wetland Ecosystems
At present, a unified evaluation system for ecosystem stability has not yet been formed. Therefore, this study took coastal wetlands as the research object and established a multi-level ecosystem stability evaluation index system based on the pressure-state-response model (PSR) in order to enrich global coastal wetland ecosystems’ stability. Limited by data and methods, this study can still be enriched via the following aspects. First, increase the time and spatial span (multi-year, multi-month, multi-point) of sampling data, and establish long-term series of soil and water sample data in the study area, so as to carry out research on characterizing a spatiotemporal differentiation of ecosystem stability. Second, the 33 evaluation indicators are closely related to coastal wetlands, but the degree of impact of each indicator on coastal wetland ecosystem functions needs to be further expanded; scientific and reasonable grading standards should be established to increase the scientific rigor and applicability of quantitative and qualitative indicators. Finally, after considering the verification of the evaluation results, the evaluation index system can be applied to different ecosystems, and the similarity and difference of the evaluation results can be analyzed to verify the suitability of the evaluation index system.
5. Conclusions
In this research, a multi-source data-supported ecosystem stability evaluation index system of the Yancheng coastal wetlands was established by combining its internal and external environmental factors based on the PSR model, followed by index grading and general evaluation. This evaluation index system was complete with relatively rigorous index logic and comprehensive index coverage, and so was of favorable applicability and explanatory significance for the ecosystem stability evaluation of the Yancheng coastal wetlands. The research findings derived from the analysis results are descried as follows: (1) The ecosystem stability value of the Yancheng coastal wetlands was 2.27, and so was at an early warning stage. The ecosystem stability in the Binhai segment was in a relatively stable state, while those in the Xiangshui, Dafeng and Dongtai segments were in an early warning state. In the subsystem layer, the ecosystem stability pressure in the south side of the Yancheng coastal wetlands was higher than that in the north side, where the whole of Yancheng City and the Dafeng District were faced with the highest pressure, and the pressure faced by the northern Xiangshui segment and Binhai segment was the lowest. The ecosystem stability state was the highest in the Sheyang segment, followed by the Binhai segment and the whole of Yancheng City, successively. As to the ecosystem stability response, the Sheyang segment showed the maximum response to the ecosystem stability and, as a whole, the ecosystem stability response level in the southern Dafeng segment and Dongtai segment was higher than that in the northern Xiangshui segment and Binhai segment; (2) In the factor layer, the whole of Yancheng City was faced with high resource pressure and socioeconomic pressure, with poor water quality state and relatively low environmental pressure. Moreover, its soil, biological and landscape states were favorable, and further, it showed an active response to the wetland protection. The pressure, state and response varied from segment to segment in the whole region. In the index layer, the low-peak indexes included the invasion of alien species (D2), change rate of natural wetland area (D32), change rate of artificial wetland area (D33), increment of aquafarm area (D7), fertilizer application intensity (D4) and coverage of dominant vegetations (D21). Hopefully, these findings can promote the restoration and protection of the coastal wetland ecosystem in Yancheng and provide a typical case for research on the stability of global coastal wetland ecosystems.
Author Contributions
Conceptualization, P.T. and J.L.; methodology, P.T. and H.Z.; software, P.T. and J.L.; writing—original draft preparation, P.T., J.L. and L.C.; writing—review and editing, P.T., L.C. and R.P.; supervision, H.Z., Y.L. and C.W.; All authors have read and agreed to the published version of the manuscript.
Funding
This research was funded by National Natural Science Funded project (41976209) and Natural Science Foundation of Zhejiang Province (No. LQ20D010006).
Institutional Review Board Statement
Not applicable.
Informed Consent Statement
Not applicable.
Data Availability Statement
Not applicable.
Acknowledgments
The authors express their gratitude to the editors and the anonymous reviewers for providing valuable comments and suggestions to improve the paper.
Conflicts of Interest
The authors declare no conflict of interest.
Appendix A

Table A1.
Detailed introduction of ecosystem stability evaluation indicators.
| Indicator Layer | Calculation Method | Impact on Ecosystem Functioning |
|---|---|---|
| D1 | The change rate in the tidal flat area | Stabilize the shoreline, protect against storms, et al. |
| D2 | The expansion rate of alien species (Spartina alterniflora) | Threats to native species diversity |
| D3 | The proportion of regional construction land area in the total area. | Reduce ecological land and threaten ecosystem balance |
| D4 | The fertilizer application within unit regional area | Contaminated soil and water quality |
| D5 | The proportion of regional urban population in the total regional population | Urban sprawl destabilizes ecosystems |
| D6 | The regional industrial wastewater discharge | Pollution of water and soil, threatening biological life |
| D7 | The regional aquafarm area | Encroaching on ecological land |
| D8 | The population distribution within unit area | Human activities disturb the natural environment |
| D9 | The highway network route distribution within unit area | Road network construction interferes with the stability of the landscape |
| D10 | The change rate in the regional area of aquafarms and dry ponds | Reclamation reduces natural wetland area |
| D11 | Laboratory measurement | The content of nitrogen in the soil |
| D12 | Laboratory measurement | The content of phosphorus in the soil |
| D13 | Laboratory measurement | The content of potassium in the soil |
| D14 | Laboratory measurement | The content of organic matter in the soil |
| D15 | Laboratory measurement | Soil acid-base properties |
| D16 | Laboratory measurement | Soil salinity properties |
| D17 | Laboratory measurement | The content of organic pollutants in water |
| D18 | Laboratory measurement | The degree of water pollution by nutrients |
| D19 | Laboratory measurement | The degree of water pollution by nutrients |
| D20 | Laboratory measurement | The degree of water pollution by nutrients |
| D21 | Taking Phragmites australis, suaeda salsa and spartina alterniflora with larger coverages in Yancheng coastal wetland as the dominant species | The change of dominant species directly affects ecosystem stability |
| D22 | The protection of regional habitats | Habitat assessment characterizes habitat quality |
| D23 | The number of animal and plant species in records | Reflect the situation of biodiversity |
| D24 | See Equation (1) | Reflect the integrity of the landscape pattern |
| D25 | See Equation (2) | Reflect the sensitivity of the landscape to external disturbances |
| D26 | See Equation (3) | Reflect the adaptability of the landscape to external disturbances |
| D27 | See Equation (4) | Reflect the degree of external disturbance to the landscape |
| D28 | The change rate in the regional natural wetland area | The ability to exert the ecological functions of natural wetlands |
| D29 | The change rate in the regional artificial wetland area | Artificial wetlands encroach on natural wetlands |
| D30 | Evaluated by experts scoring the regional wetland management status and the management team in the conservation area | The management level of coastal wetlands directly affects the normal performance of ecological functions |
| D31 | The proportion of regional population accepting above middle school education in the total regional population | The quality of the surrounding population directly affects the protection of coastal wetlands |
| D32 | The regional capital input into natural reserves | Capital investment is linked to the construction and protection of coastal wetlands |
| D33 | The comprehensive utilization rate of regional industrial solid wastes | Industrial waste harms soil and water quality |
Table A2.
Grading standard of evaluation indicators.
| Main Indicators | Extremely Dangerous (1) | Dangerous (2) | Early Warning (3) | Relatively Stable (4) | Stable (5) |
|---|---|---|---|---|---|
| D1 (%) | <−40 | −20~−40 | −20~−10 | −10~0 | >0 |
| D2 (%) | >30 | 20~30 | 10~20 | 5~10 | <5 |
| D3 (%) | >20 | 15~20 | 10~15 | 5~10 | <5 |
| D4 (%) | >350 | 300~350 | 250~300 | 200~250 | <200 |
| D5 (10,000 tons) | >1000 | 800~1000 | 600~800 | 500~600 | <500 |
| D6 (%) | <10 | 10~20 | 30~40 | 40~50 | >50 |
| D7 (km2) | >400 | 350~400 | 200~350 | 0~200 | <0 |
| D8 (10,000 people/square kilometer) | >1.5 | 1~1.5 | 0.5~1 | 0~0.5 | <0 |
| D9 (km/km2) | >200 | 150~200 | 100~150 | 50~100 | <50 |
| D10 (%) | >200 | 150~200 | 100~150 | 50~100 | <50 |
| D11 (mg/kg) | <5 | 5~10 | 10~15 | 15~20 | >20 |
| D12 (mg/kg) | <5 | 5~10 | 10~20 | 20~40 | >40 |
| D13 (mg/kg) | <100 | 100~200 | 200~300 | 300~350 | >350 |
| D14 (g/kg) | <10 | 10~20 | 20~30 | 30~40 | >40 |
| D15 | >9.5 | 9~9.5 | 8.5~9 | 8~8.5 | <8 |
| D16 (mg/kg) | >250 | 200~250 | 180~200 | 150~180 | <150 |
| D17 (mg/L) | >2.5 | 2~2.5 | 1.5~2 | 1~1.5 | <1 |
| D18 (mg/L) | >1.5 | 1~1.5 | 0.5~1 | 0.2~0.5 | <0.2 |
| D19 (mg/L) | >2 | 1.5~2 | 1~1.5 | 0.5~1 | <0.5 |
| D20 (mg/L) | >200 | 100~200 | 50~100 | 15~50 | <15 |
| D21 (%) | <0.06 | 0.06~0.08 | 0.08~0.1 | 0.1~0.2 | >0.2 |
| D22 | There are serious human activities such as reclamation, mowing, fishing and hunting in the area | Excessive human activities such as reclamation, mowing, fishing and hunting exist in the area | Excessive human activities such as reclamation, mowing, fishing and hunting exist in some parts of the area | There are moderate human activities such as reclamation, mowing, fishing and hunting in the area | There are no human activities such as reclamation, mowing, fishing and hunting in the area |
| D23 (%) | <10 | 10~20 | 20~30 | 30~40 | >40 |
| D24 | >0.02 | 0.015~0.02 | 0.012~0.015 | 0.01~0.012 | <0.01 |
| D25 | >0.02 | 0.015~0.02 | 0.012~0.015 | 0.01~0.012 | <0.01 |
| D26 | >50 | 30~50 | 10~30 | 0~10 | <0 |
| D27 | >10 | 7~10 | 5~7 | 3~5 | <3 |
| D28 | No management mechanism, no management team | Poor management and low quality of team personnel | Existence of management bodies and lack of theoretical and practical training | Reasonable management mechanism and high level of management team | Advanced management concept, sufficient and high-level team members, reasonable configuration |
| D29 (%) | <2 | 2~3 | 3~5 | 5~10 | >10 |
| D30 (%) | <80 | 80~85 | 85~90 | 90~95 | >95 |
| D31 (10,000 yuan) | <20 | 20~30 | 30~40 | 40~50 | >50 |
| D32 (%) | <−0.5 | −0.5~−0.1 | −0.1~−0.01 | −0.01~0.01 | >0.01 |
| D33 (%) | >1 | 0.5~1 | 0.1~0.5 | 0.01~0.1 | <0.01 |
Table A3.
The grading results of each indicator.
| Grade | Yancheng | Xiangshui | Binhai | Sheyang | Dafeng | Dongtai |
|---|---|---|---|---|---|---|
| 1 | D1, D2, D5, D7, D8, D10, D17, D18, D19, D20, D26, D27 | D2, D16, D17, D18, D21, D25, D31 | D2, D8, D16, D21, D25, D31 | D1, D4, D5, D16, D18, D19, D20 | D1, D2, D5, D7, D8, D10, D16, D17, D18, D19, D20, D26, D32, D33 | D1, D2, D17, D18, D32, D33 |
| 2 | D9, D14, D16, D32, D33 | D4, D5, D8, D9, D14, D22, D23, D28, D29 | D4, D9, D14, D22, D23, D24, D28, D29 | D7, D10, D17, D25, D26, D32, D33 | D9, D14, D27 | D5, D7, D9, D10, D14, D16, D21, D22, D26 |
| 3 | D4, D21, D22, D23, D28, D29, D31 | D1, D10, D19, D20, D26, D32, D33 | D5, D11, D13, D18 | D8, D9, D13, D14, D29 | D3, D4, D13, D21, D22, D29, D30, D31 | D8, D20, D23, D24, D25, D28, D29, D30, D31 |
| 4 | D11, D13, D15, D24, D30 | D7, D11, D12, D15, D27, D30 | D3, D12, D15, D17, D19, D20, D26, D27, D30, D32, D33 | D2, D11, D12, D15, D21, D22, D24, D27, D31 | D11, D15, D23, D24, D28 | D15, D27 |
| 5 | D3, D6, D12, D25 | D3, D6, D13, D24 | D1, D6, D7, D10 | D3, D6, D23, D28, D30 | D6, D12, D25 | D3, D4, D6, D11, D12, D13, D19 |
References
- Hautier, Y.; Tilman, D.; Isbell, F.; Seabloom, E.W.; Borer, E.T.; Reich, P.B. Anthropogenic environmental changes affect ecosystem stability via biodiversity. Science 2015, 348, 336–340. [Google Scholar] [CrossRef] [PubMed] [Green Version]
- Bláha, M.; Grabicova, K.; Shaliutina, O.; Kubec, J.; Randák, T.; Zlabek, V.; Buřič, M.; Veselý, L. Foraging behaviour of top predators mediated by pollution of psychoactive pharmaceuticals and effects on ecosystem stability. Sci. Total Environ. 2019, 662, 655–661. [Google Scholar] [CrossRef] [PubMed]
- Gómez-Baggethun, E.; Tudor, M.; Doroftei, M.; Covaliov, S.; Năstase, A.; Onără, D.-F.; Mierlă, M.; Marinov, M.; Doroșencu, A.-C.; Lupu, G. Changes in ecosystem services from wetland loss and restoration: An ecosystem assessment of the Danube Delta (1960–2010). Ecosyst. Serv. 2019, 39, 100965. [Google Scholar] [CrossRef]
- Sun, T.; Lin, W.; Chen, G.; Guo, P.; Zeng, Y. Wetland ecosystem health assessment through integrating remote sensing and inventory data with an assessment model for the Hangzhou Bay, China. Sci. Total Environ. 2016, 566, 627–640. [Google Scholar] [CrossRef]
- Liu, Y.; Liu, Y.; Li, J.; Sun, C.; Xu, W.; Zhao, B. Trajectory of coastal wetland vegetation in Xiangshan Bay, China, from image time series. Mar. Pollut. Bull. 2020, 160, 111697. [Google Scholar] [CrossRef]
- Sato, C.F.; Lindenmayer, D.B. Meeting the global ecosystem collapse challenge. Conserv. Lett. 2018, 11, e12348. [Google Scholar] [CrossRef] [Green Version]
- Zelnik, Y.R.; Arnoldi, J.-F.; Loreau, M. The impact of spatial and temporal dimensions of disturbances on ecosystem stability. Front. Ecol. Evol. 2018, 6, 224. [Google Scholar] [CrossRef] [Green Version]
- Tian, P.; Li, J.; Cao, L.; Pu, R.; Gong, H.; Liu, Y.; Zhang, H.; Chen, H. Impacts of reclamation derived land use changes on ecosystem services in a typical gulf of eastern China: A case study of Hangzhou bay. Ecol. Indic. 2021, 132, 108259. [Google Scholar] [CrossRef]
- Kim, D.; Ko, J.; Jo, J.; Ryu, J.; Choi, K. Decoupling natural and man-made impacts on the morphologic and sedimentologic changes in the tidal flats, Saemangeum area, west coast of Korea: Implications for benthic ecosystem stability. Sci. Total Environ. 2022, 807, 151779. [Google Scholar] [CrossRef]
- Huang, Z.; Liu, X.; Yang, Q.; Meng, Y.; Zhu, L.; Zou, X. Quantifying the spatiotemporal characteristics of multi-dimensional karst ecosystem stability with Landsat time series in southwest China. Int. J. Appl. Earth Obs. Geoinf. 2021, 104, 102575. [Google Scholar] [CrossRef]
- Ivits, E.; Horion, S.; Erhard, M.; Fensholt, R. Assessing European ecosystem stability to drought in the vegetation growing season. Glob. Ecol. Biogeogr. 2016, 25, 1131–1143. [Google Scholar] [CrossRef]
- Feghhi, J.; Teimouri, S.; Makhdoum, M.; Erfanifard, Y.; Tehrani, N.A. The assessment of degradation to sustainability in an urban forest ecosystem by GIS. Urban For. Urban Green. 2017, 27, 383–389. [Google Scholar] [CrossRef]
- Ekumah, B.; Armah, F.A.; Afrifa, E.K.; Aheto, D.W.; Odoi, J.O.; Afitiri, A.-R. Geospatial assessment of ecosystem health of coastal urban wetlands in Ghana. Ocean. Coast. Manag. 2020, 193, 105226. [Google Scholar] [CrossRef]
- Valbonesi, P.; Profita, M.; Vasumini, I.; Fabbri, E. Contaminants of emerging concern in drinking water: Quality assessment by combining chemical and biological analysis. Sci. Total Environ. 2021, 758, 143624. [Google Scholar] [CrossRef] [PubMed]
- Gwinnett, C.; Miller, R.Z. Are we contaminating our samples? A preliminary study to investigate procedural contamination during field sampling and processing for microplastic and anthropogenic microparticles. Mar. Pollut. Bull. 2021, 173, 113095. [Google Scholar] [CrossRef]
- Mugo, R.; Waswa, R.; Nyaga, J.W.; Ndubi, A.; Adams, E.C.; Flores-Anderson, A.I. Quantifying land use land cover changes in the Lake Victoria basin using satellite remote sensing: The trends and drivers between 1985 and 2014. Remote Sens. 2020, 12, 2829. [Google Scholar] [CrossRef]
- Mahdianpari, M.; Jafarzadeh, H.; Granger, J.E.; Mohammadimanesh, F.; Brisco, B.; Salehi, B.; Homayouni, S.; Weng, Q. A large-scale change monitoring of wetlands using time series Landsat imagery on Google Earth Engine: A case study in Newfoundland. GISci. Remote Sens. 2020, 57, 1102–1124. [Google Scholar] [CrossRef]
- Obermeier, W.A.; Lehnert, L.W.; Pohl, M.; Gianonni, S.M.; Silva, B.; Seibert, R.; Laser, H.; Moser, G.; Müller, C.; Luterbacher, J. Grassland ecosystem services in a changing environment: The potential of hyperspectral monitoring. Remote Sens. Environ. 2019, 232, 111273. [Google Scholar] [CrossRef]
- Qin, J.; Hao, X.; Hua, D.; Hao, H. Assessment of ecosystem resilience in Central Asia. J. Arid Environ. 2021, 195, 104625. [Google Scholar] [CrossRef]
- Liu, B.; Zhao, Q.; Jin, Y.; Shen, J.; Li, C. Application of combined model of stepwise regression analysis and artificial neural network in data calibration of miniature air quality detector. Sci. Rep. 2021, 11, 1–12. [Google Scholar] [CrossRef]
- Sun, B.; Tang, J.; Yu, D.; Song, Z.; Wang, P. Ecosystem health assessment: A PSR analysis combining AHP and FCE methods for Jiaozhou Bay, China. Ocean. Coast. Manag. 2019, 168, 41–50. [Google Scholar] [CrossRef]
- Mosaffaie, J.; Jam, A.S.; Tabatabaei, M.R.; Kousari, M.R. Trend assessment of the watershed health based on DPSIR framework. Land Use Policy 2021, 100, 104911. [Google Scholar] [CrossRef]
- Hu, X.; Ma, C.; Huang, P.; Guo, X. Ecological vulnerability assessment based on AHP-PSR method and analysis of its single parameter sensitivity and spatial autocorrelation for ecological protection–A case of Weifang City, China. Ecol. Indic. 2021, 125, 107464. [Google Scholar] [CrossRef]
- Ward, D.F.; Melbourne-Thomas, J.; Johnson, C.R.; Wotherspoon, S.J. Trophic mediation and ecosystem stability: An assessment using qualitative network models. Limnol. Oceanogr. 2021, 67, S146–S162. [Google Scholar] [CrossRef]
- Jijing, C.; Lei, Z.; Yong-gang, C. Review on Research of Spatial Pattern and Influencing Mechanisms of Terrestrial Ecosystem Stability. Chin. J. Agrometeorol. 2021, 42, 552. [Google Scholar]
- Li, H.; Li, L.; Su, F.; Wang, T.; Gao, P. Ecological stability evaluation of tidal flat in coastal estuary: A case study of Liaohe estuary wetland, China. Ecol. Indic. 2021, 130, 108032. [Google Scholar] [CrossRef]
- Mirzaei, A.; Azarm, H.; Layani, G. Prioritize the factors affecting the sustainability of Shadegan Wetland Ecosystem Stability Index. J. Wetl. Ecobiol. 2019, 10, 69–80. [Google Scholar]
- Irfan, M.; Elavarasan, R.M.; Ahmad, M.; Mohsin, M.; Dagar, V.; Hao, Y. Prioritizing and overcoming biomass energy barriers: Application of AHP and G-TOPSIS approaches. Technol. Forecast. Soc. Change 2022, 177, 121524. [Google Scholar] [CrossRef]
- Shafaghat, A.; Ying, O.J.; Keyvanfar, A.; Jamshidnezhad, A.; Ferwati, M.S.; Ahmad, H.; Khorami, M. A treatment wetland park assessment model for evaluating urban ecosystem stability using analytical hierarchy process (AHP). J. Environ. Treat. Tech. 2019, 7, 81–91. [Google Scholar]
- Accatino, F.; Tonda, A.; Dross, C.; Léger, F.; Tichit, M.J.A.S. Trade-offs and synergies between livestock production and other ecosystem services. Agric. Syst. 2019, 168, 58–72. [Google Scholar] [CrossRef]
- Tian, P.; Cao, L.; Li, J.; Pu, R.; Shi, X.; Wang, L.; Liu, R.; Xu, H.; Tong, C.; Zhou, Z. Landscape grain effect in Yancheng coastal wetland and its response to landscape changes. Int. J. Environ. Res. Public Health 2019, 16, 2225. [Google Scholar] [CrossRef] [PubMed] [Green Version]
- Xia, M.; Wang, L.; Wen, B.; Zou, W.; Ou, W.; Qu, Z. Land Consolidation Zoning in Coastal Tidal Areas Based on Landscape Security Pattern: A Case Study of Dafeng District, Yancheng, Jiangsu Province, China. Land 2021, 10, 145. [Google Scholar] [CrossRef]
- Zang, Z.; Zou, X.; Song, Q.; Yao, Y. Analysis of the spatiotemporal correlation between vegetation pattern and human activity intensity in Yancheng coastal wetland, China. Anthr. Coasts 2019, 2, 87–100. [Google Scholar] [CrossRef] [Green Version]
- Tian, P.; Li, J.; Cao, L.; Pu, R.; Gong, H. Correlation Analysis of Landscape Patterns with Surface Water Quality in Yancheng Coastal Wetland, Jiangsu, China. Pol. J. Environ. Stud. 2021, 30, 4731–4746. [Google Scholar] [CrossRef]
- Yao, X. Evaluation of the Stability of the Yellow River Delta Wetland Ecosystem; Shandong Agricultural University: Shandong, China, 2013. [Google Scholar]
- Geng, S.; Shi, P.; Song, M.; Zong, N.; Zu, J.; Zhu, W. Diversity of vegetation composition enhances ecosystem stability along elevational gradients in the Taihang Mountains, China. Ecol. Indic. 2019, 104, 594–603. [Google Scholar] [CrossRef]
- Ganjurjav, H.; Zhang, Y.; Gornish, E.S.; Hu, G.; Li, Y.; Wan, Y.; Gao, Q. Differential resistance and resilience of functional groups to livestock grazing maintain ecosystem stability in an alpine steppe on the Qinghai-Tibetan Plateau. J. Environ. Manag. 2019, 251, 109579. [Google Scholar] [CrossRef]
- Wang, L.; Zhang, Y.; Huang, L.; Lin, F.; Li, Y. Canopy spectral characteristics of typical invasive and native plants in the coastal wetland of Yancheng City, China. Acta Ecol. Sin. 2021, 41, 631–637. [Google Scholar] [CrossRef]
- Wang, C.; Wang, G.; Dai, L.; Liu, H.; Li, Y.; Qiu, C.; Zhou, Y.; Chen, H.; Dong, B.; Zhao, Y. Study on the effect of habitat function change on waterbird diversity and guilds in Yancheng coastal wetlands based on structure–function coupling. Ecol. Indic. 2021, 122, 107223. [Google Scholar] [CrossRef]
- Bogovac, L.; Butula, S.; Andlar, G.; Tomić Reljić, D. Approaches to landscape evaluation: Questioning examining landscape vulnerability and sensitivity of the Island of Rab. Geoadria 2021, 26, 35–58. [Google Scholar] [CrossRef]
- Liu, Y.; Liu, Y.; Li, J.; Lu, W.; Wei, X.; Sun, C. Evolution of landscape ecological risk at the optimal scale: A case study of the open coastal wetlands in Jiangsu, China. Int. J. Environ. Res. Public Health 2018, 15, 1691. [Google Scholar] [CrossRef] [Green Version]
- Yancheng Bureau of Statistics, Jiangsu Province. Yancheng Statistical Yearbook (2019); China Statistics Press: Yancheng, China, 2019. [Google Scholar]
- Guardia-Puebla, Y.; Llanes-Cedeño, E.; Rodríguez-Pérez, S.; Arias-Cedeño, Q.; Sánchez-Girón, V.; Morscheck, G.; Eichler-Löbermann, B. Sustainable management of wastewater: Theoretical design of combined upflow anaerobic reactors and artificial wetlands systems. J. Water Land Dev. 2020, 47, 66–76. [Google Scholar]
- Tiemann, A.; Ring, I. Towards ecosystem service assessment: Developing biophysical indicators for forest ecosystem services. Ecol. Indic. 2022, 137, 108704. [Google Scholar] [CrossRef]
- Kang, W.; Liu, S.; Chen, X.; Feng, K.; Guo, Z.; Wang, T. Evaluation of ecosystem stability against climate changes via satellite data in the eastern sandy area of northern China. J. Environ. Manag. 2022, 308, 114596. [Google Scholar] [CrossRef] [PubMed]
- Qiu, H. Research on the Health Assessment and Protection Countermeasures of the Coastal Wetland Ecosystem in Yancheng, Jiangsu; Zhejiang Normal University: Zhejiang, China, 2012. [Google Scholar]
Figure 1.
Geographical location of the study area. The sampling routes were named after the port and river names nearby the shorelines, which, from the south to the north, were the Xinchuan Port route (1), Liangduo River route (2), Chuandong Port route (3), Wanggang Port route (4), Wanzhuang Port route (5), Doulong Port route (6), Xinyang Port route (7), Sheyang River route (8), Shuangyang Port route (9), Biandan Port route (10) and New Huai River estuary route (11).

Figure 2.
Spatial interpolation results of water quality (TP, TN, COD and Ammonia nitrogen) and soil (Available nitrogen, Available phosphorus, Available Potassium, Organic matter, pH and Salinity) indicators.
Figure 2.
Spatial interpolation results of water quality (TP, TN, COD and Ammonia nitrogen) and soil (Available nitrogen, Available phosphorus, Available Potassium, Organic matter, pH and Salinity) indicators.

Figure 3.
The ecosystem stability evaluation index system of Yancheng coastal wetland.

Figure 4.
Landscape pattern characteristics of Yancheng coastal wetlands.

Figure 5.
Ecosystem stability index layer (D) evaluation results.

Table 1.
Ecosystem stability evaluation grades.
| Ecosystem Stability Criteria | Stable | Relatively Stable | Early Warning | Dangerous | Extremely Dangerous |
|---|---|---|---|---|---|
| Grading value | (4.0~5.0] | (3.0~4.0] | (2.0~3.0] | (1.0~2.0] | (0.0~1.0] |
Table 2.
Evaluation results of each index layer (A, B, C).
| Indicator Layers | Yancheng | Xiangshui | Binhai | Sheyang | Dafeng | Dongtai |
|---|---|---|---|---|---|---|
| Resource Pressure (C1) | 1.92 | 3.22 | 4.28 | 2.28 | 1.46 | 1.92 |
| Environmental Pressure (C2) | 3.48 | 3.68 | 3.99 | 3.23 | 3.48 | 4.04 |
| Socioeconomic Pressure (C3) | 1.45 | 2.64 | 3.29 | 2.54 | 1.45 | 2.09 |
| Soil State (C4) | 2.82 | 2.64 | 2.44 | 2.96 | 2.58 | 2.95 |
| Water Quality State (C5) | 1.00 | 1.72 | 3.83 | 1.47 | 1.00 | 2.07 |
| Biological State (C6) | 3.00 | 1.89 | 1.89 | 4.58 | 3.58 | 2.58 |
| Landscape State (C7) | 3.10 | 3.91 | 2.55 | 3.38 | 3.29 | 3.02 |
| Wetland Ecological Protection Response (C8) | 3.06 | 2.12 | 2.25 | 3.93 | 2.90 | 2.75 |
| Ecosystem Stability Pressure (B1) | 2.02 | 2.97 | 3.57 | 2.69 | 1.97 | 2.58 |
| Ecosystem Stability State (B2) | 2.29 | 2.37 | 2.81 | 2.84 | 2.35 | 2.60 |
| Ecosystem Stability Response (B3) | 3.06 | 2.47 | 2.72 | 3.93 | 2.71 | 2.56 |
| Ecosystem Stability (A) | 2.27 | 2.67 | 3.15 | 2.93 | 2.24 | 2.61 |
Publisher’s Note: MDPI stays neutral with regard to jurisdictional claims in published maps and institutional affiliations. |
© 2022 by the authors. Licensee MDPI, Basel, Switzerland. This article is an open access article distributed under the terms and conditions of the Creative Commons Attribution (CC BY) license (https://creativecommons.org/licenses/by/4.0/).
Share and Cite
MDPI and ACS Style
Tian, P.; Cao, L.; Li, J.; Pu, R.; Liu, Y.; Zhang, H.; Wang, C. Ecosystem Stability Assessment of Yancheng Coastal Wetlands, a World Natural Heritage Site. Land 2022, 11, 564. https://0-doi-org.brum.beds.ac.uk/10.3390/land11040564
AMA Style
Tian P, Cao L, Li J, Pu R, Liu Y, Zhang H, Wang C. Ecosystem Stability Assessment of Yancheng Coastal Wetlands, a World Natural Heritage Site. Land. 2022; 11(4):564. https://0-doi-org.brum.beds.ac.uk/10.3390/land11040564
Chicago/Turabian StyleTian, Peng, Luodan Cao, Jialin Li, Ruiliang Pu, Yongchao Liu, Haitao Zhang, and Caiyi Wang. 2022. "Ecosystem Stability Assessment of Yancheng Coastal Wetlands, a World Natural Heritage Site" Land 11, no. 4: 564. https://0-doi-org.brum.beds.ac.uk/10.3390/land11040564
Note that from the first issue of 2016, this journal uses article numbers instead of page numbers. See further details here.