
Coastal Dynamics Initiate, Relocate and Terminate Short-Lived Wetlands of Dune Slacks, Manawatū, New Zealand


Ecology Group, School of Natural Sciences, Massey University, Palmerston North 4412, New Zealand
*
Author to whom correspondence should be addressed.
†
Current address: Ecociencia, Quito 170517, Ecuador.
Land 2022, 11(7), 980; https://0-doi-org.brum.beds.ac.uk/10.3390/land11070980
Submission received: 11 May 2022
/
Revised: 14 June 2022
/
Accepted: 15 June 2022
/
Published: 28 June 2022
(This article belongs to the Special Issue Protection, Management and Restoration of Coastal Ecosystems)
Abstract
:Dunelands are one of the most dynamic environments on Earth, which greatly hinders their conservation and management. In the dune slacks along the Manawatū coast, New Zealand, lies a zone of small, temporary, freshwater wetlands that host early seral communities of rare turf plants. Analysis of historical aerial photos allowed determination of coastline movement, distance of the wetlands from the coast, and wetland movements through time. Study sites were around the coastal settlements of Tangimoana and Foxton Beach, both having major rivers debouching nearby, and Himatangi, amongst stabilising exotic pine plantations. The coastline is prograding (with seaward movement) generally by 0.7–1 m yr−1, but is more variable closer to river mouths, with episodes of movement of up to 15 m yr−1. Wetlands occur 200–400 m behind the strandline, are closer to the coast at Foxton Beach, and furthest away at Himatangi. Wetlands wobble in their position at 5.2 m yr−1 but migrate inland at an average of 2.7 m yr−1. Wetland size appears unrelated to rainfall, but may be related positively to coastal progradation rate, to which wetland movement is negatively related. Near the major rivers, dunes are less stable, and wetlands can be impacted both positively and negatively. Wetland existence and movement is balanced between stability and dynamism on the coast, and management will need to be proactive to maintain environments for early successional turfs.
1. Introduction
Anthropic activities are heavily impacting most natural environments on Earth, promoting or prompting a range of conservation and managerial activities to protect them [1,2,3,4,5,6,7,8,9,10,11,12,13,14,15,16,17,18,19,20,21,22,23,24,25,26,27,28,29,30,31,32,33,34,35,36,37,38,39,40,41,42,43,44,45,46,47,48,49,50,51,52,53,54,55,56,57,58,59,60,61,62,63,64,65], particularly in the face of changing climates [51]. Despite being important reservoirs of biodiversity, e.g., [19,50], wetlands are especially impacted by drainage, agricultural uses and urbanization, e.g., [11,52,62]. Coasts are also heavily impacted by such pressures, e.g., [15,54]. Sandy coasts form one of the most dynamic terrestrial environments, due to the mobility of the substrate and the high levels of exposure to extreme weather conditions (viz. the preponderance of wind roses in dune papers, e.g., [15,38,47]). Consequently, coastal wetlands are an especially threatened habitat [39,42], but there is a paucity of information related to their dynamics and the degree of their interaction with the dynamics of the broader coastal environment.
“Movement” of the coastline is the most broad-scale of coastal dynamics. World-wide coastlines are retreating or retrograding under sea-level rise [3,29], but in some places progradation still occurs, e.g., [4,28]. Both processes operate on sand spits or barrier dunes, resulting in localised movement, for example at Yalgorup, Western Australia [53]. Such coastal dynamics change the exposure of wetlands to coastal influences [20,43,54].
Smaller-scale coastal dynamism may actually be a prerequisite for the formation of wetlands. Hesp [21] suggested that foredune blowouts were important in the formation of parabolic dunes, where topographical steering may generate “jet flows”, winds with heightened powers of sand transport [22,23]. Wind energy rolls sand particles across the dunes, eroding stoss faces and building lee or slip faces, moving dunes, in the case of Manawatū, at rates averaging 5.2 m yr−1 [38], potentially impacting on wetlands.
Another element of coastal dynamism is aeolian sand, wind-borne sand, which can travel 200 m or more inland, depending on wind speed [2]. Dune slack wetlands are frequently exposed to moving sand, which can over-fly a wetland but can also be deposited in it, causing infilling [12,46]. Murphy et al. [39] reported rates of aeolian infilling of dune slack wetlands ranging from 0–5–3.2 cm yr−1, so that surfaces eventually rose above the water table, accelerating succession and leading to loss of desirable vegetation types. Changes in the water table are also important in coastal dynamics, changing wetlands’ hydrology (both seasonality and depth of inundation), and erodability by deflation by wind [9,54], called ventiplanation by Fleming [14].
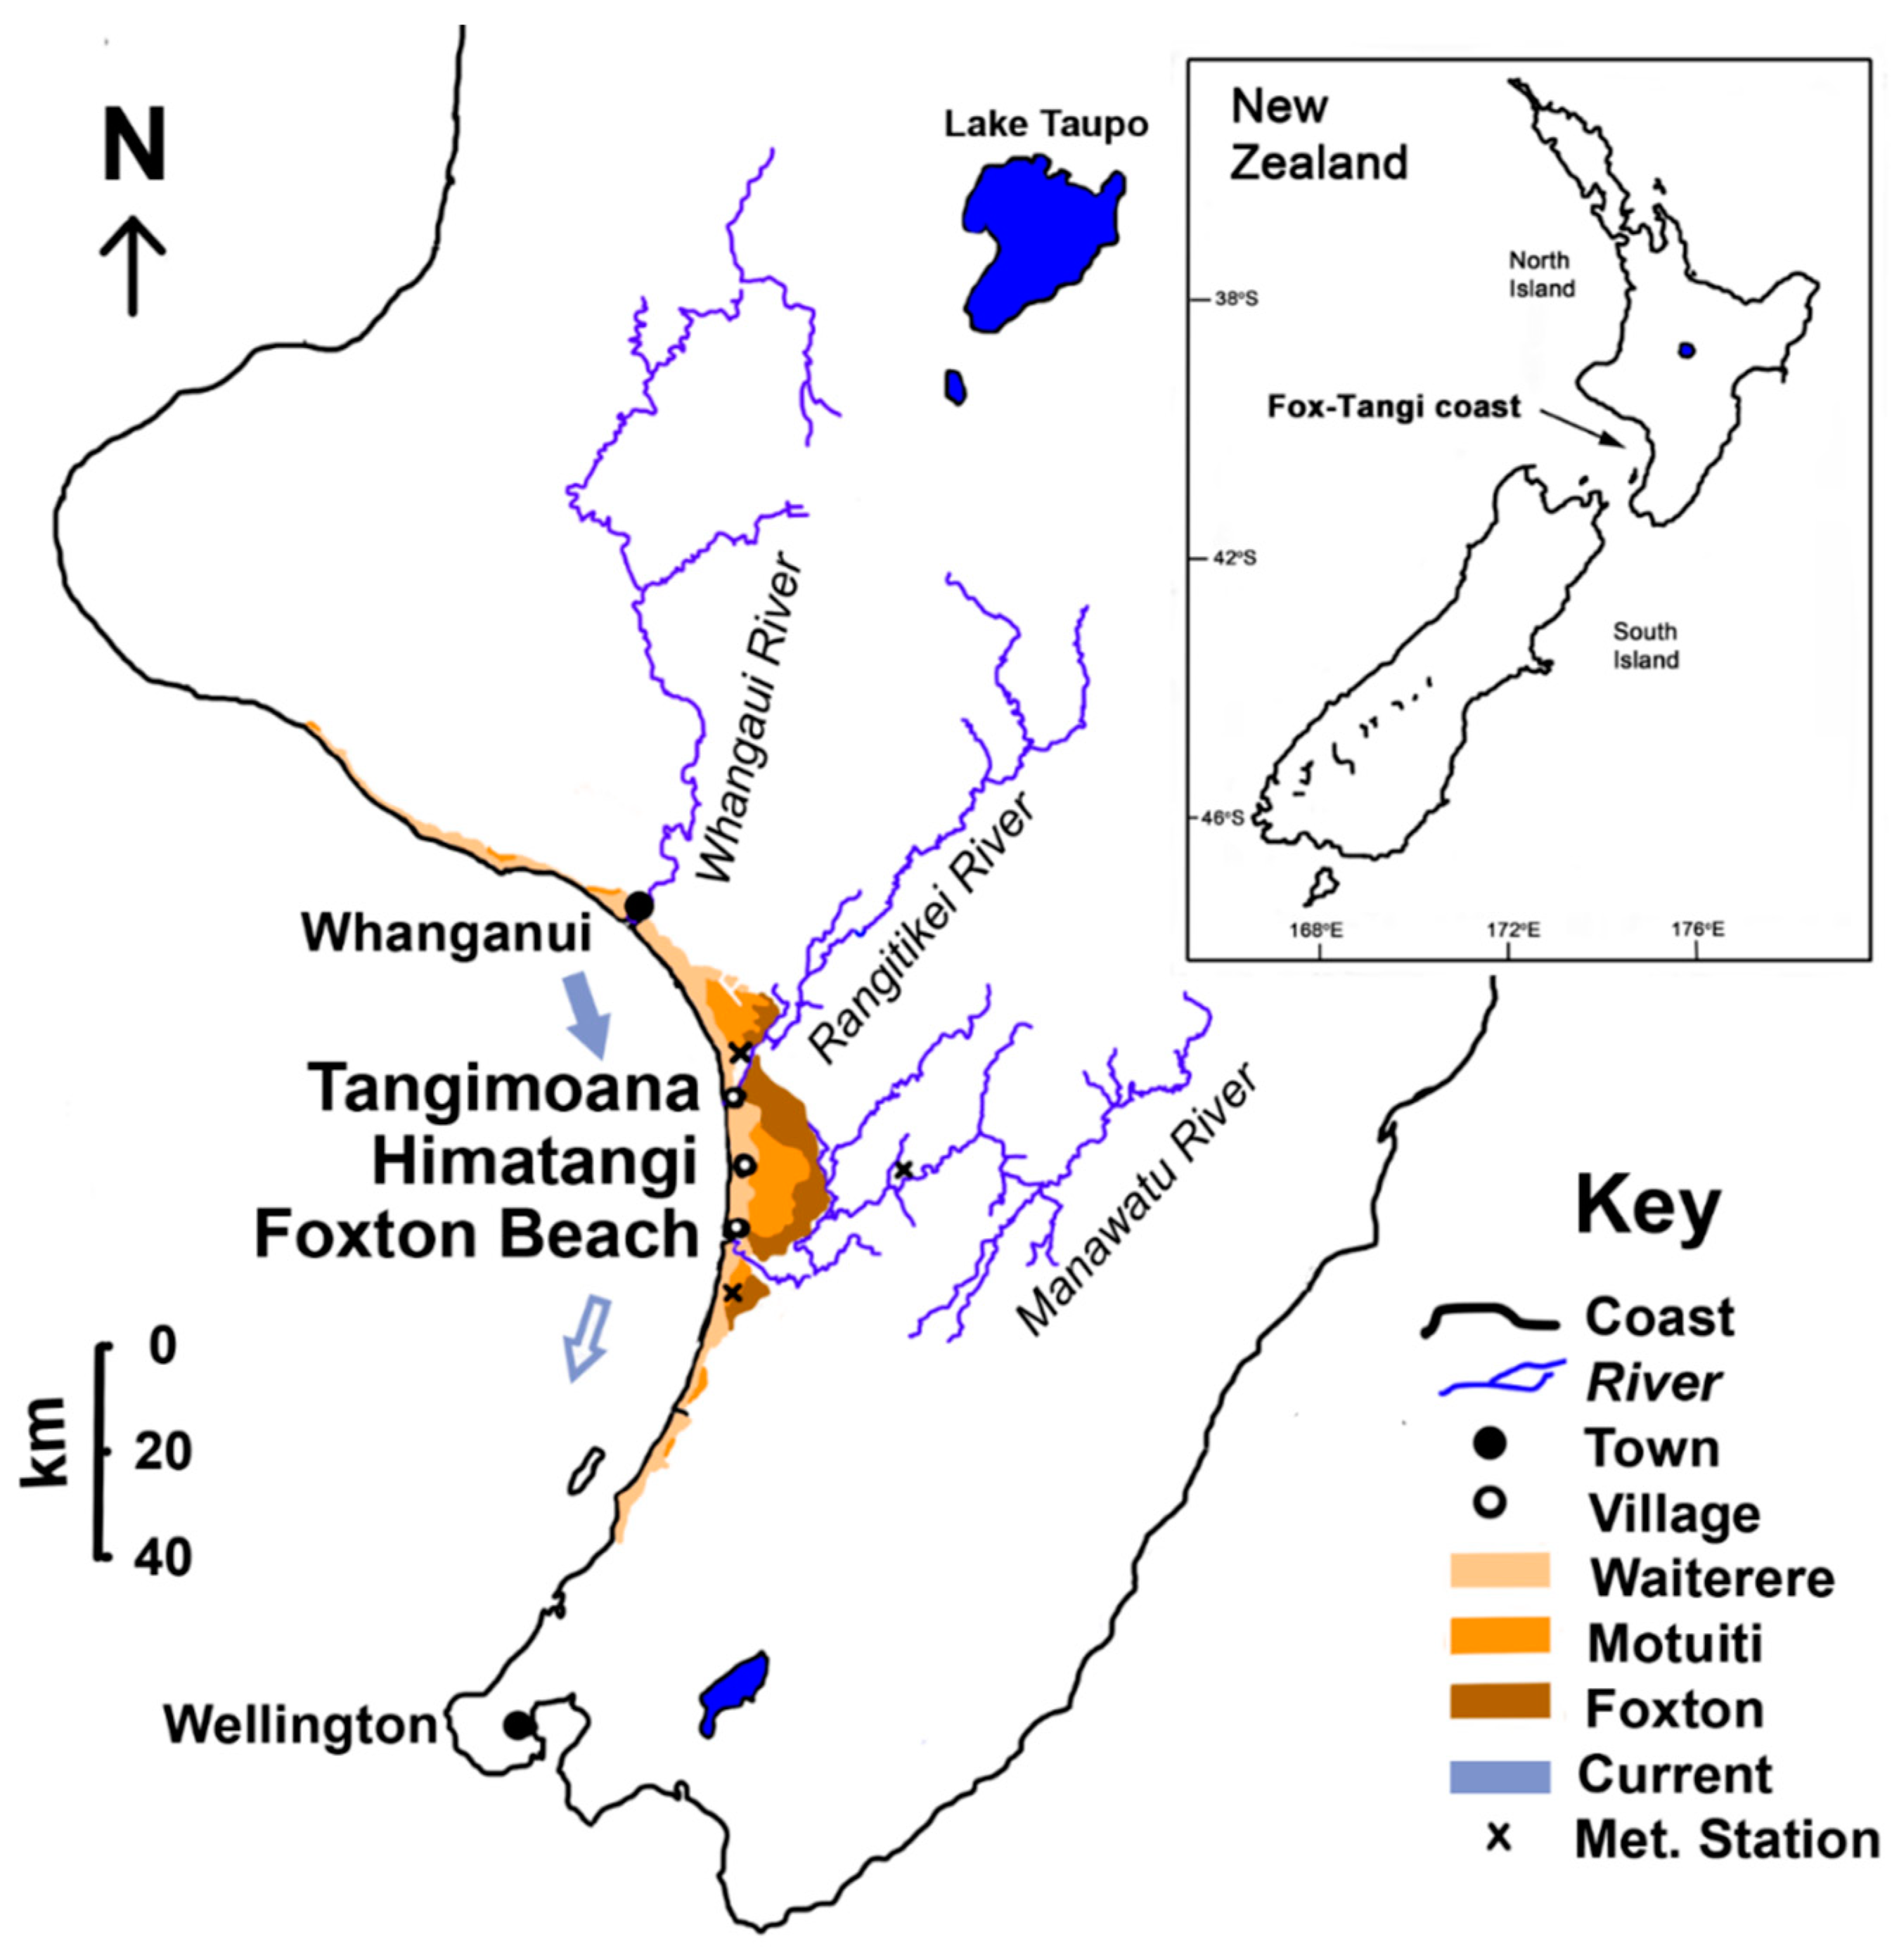
One of the most dynamic in the world [21,27], the Manawatū coast (Figure 1) stretches 200 km along the lower western North Island, New Zealand, and is an exposed, high-energy coast abutting the Tasman Sea in an extremely windy environment [13]. The coast is punctuated by three large river systems, draining much of the central and lower North Island (Figure 1), and supplying sediment to the coast as fine-grained, rounded, quartz sand. The southerly flowing long-shore current deposits sediment along the coast, though it weakens progressively further south [55]. Wave action moves the sediment onto the plage, and subsequent aeolian movement builds foredunes through sand accretion. This has generated an expansive dunefield that has been forming episodically for over 5000 years [8,21,38]. The most recent dune-building phase, the Waiterere, has emplaced unweathered sand to build up on average 2.9 km of prograded coastline over the last 600–1000 years, probably accelerated by anthropogenic destabilisation of the hinterland [7,8,21,35,38].The coastline is peppered by a belt of wetlands lying in dune slacks (Figure 2).
These wetlands have been studied over many years. Esler [12] detailed the flora of a “wet sand” plain only 200 m from the coast, while Carnahan [6] noted that wet sand plain vegetation was successional to shrubland when further from the coas. Murphy et al. [39] compared the vegetation of natural dune slack wetlands, that flora being congruous with the wet sand plains of Esler [12], to three artificial wetlands created to provide habitat for the short species (<5 cm) of early successional short turf. Rapson [48] went on to comment on some of the rare flora, including the local endemic Goodenia heenanii (=Selliera rotundifolia Heenan 1997; nomenclature follows Nga Tipu [41]). There are also two threatened cyperads, Eleocharis neozelandica and Isolpeis basilaris, and a range of other uncommon species of turf, whose autecology was examined by Singers [57] and Yukhnevich [65]. Villacís Lozada and Rapson [63] reported the morphometrics of three groups of wetlands, and how these changed over the duration of a wetland’s existence.
Our specific aim is to examine the impact of coastal dynamism on the creation, movement and infilling of the dune slack wetlands, and how these processes might interact, to infer appropriate management of these rare ecosystems [25,64] and the rare turf species that inhabit them [39]. The artificial wetlands created at Tangimoana [39] were excluded from this analysis.
2. Methods
We focus on the same three sites along 20 km of the Fox-Tangi coast used by Villacís Lozada and Rapson [63]. The sites are Tangimoana (T; Figure 1), which has the major Rangitikei River system debouching immediately north of the site, and upstream on the longshore ocean current, and Foxton Beach (F), which is further down-current and just north of the large Manawatu River estuary. In between is Himatangi (H), just south of the eponymous village, with large pine (Monterrey pine, Pinus radiata) plantations adjacent to the coast, stabilising sand movement.
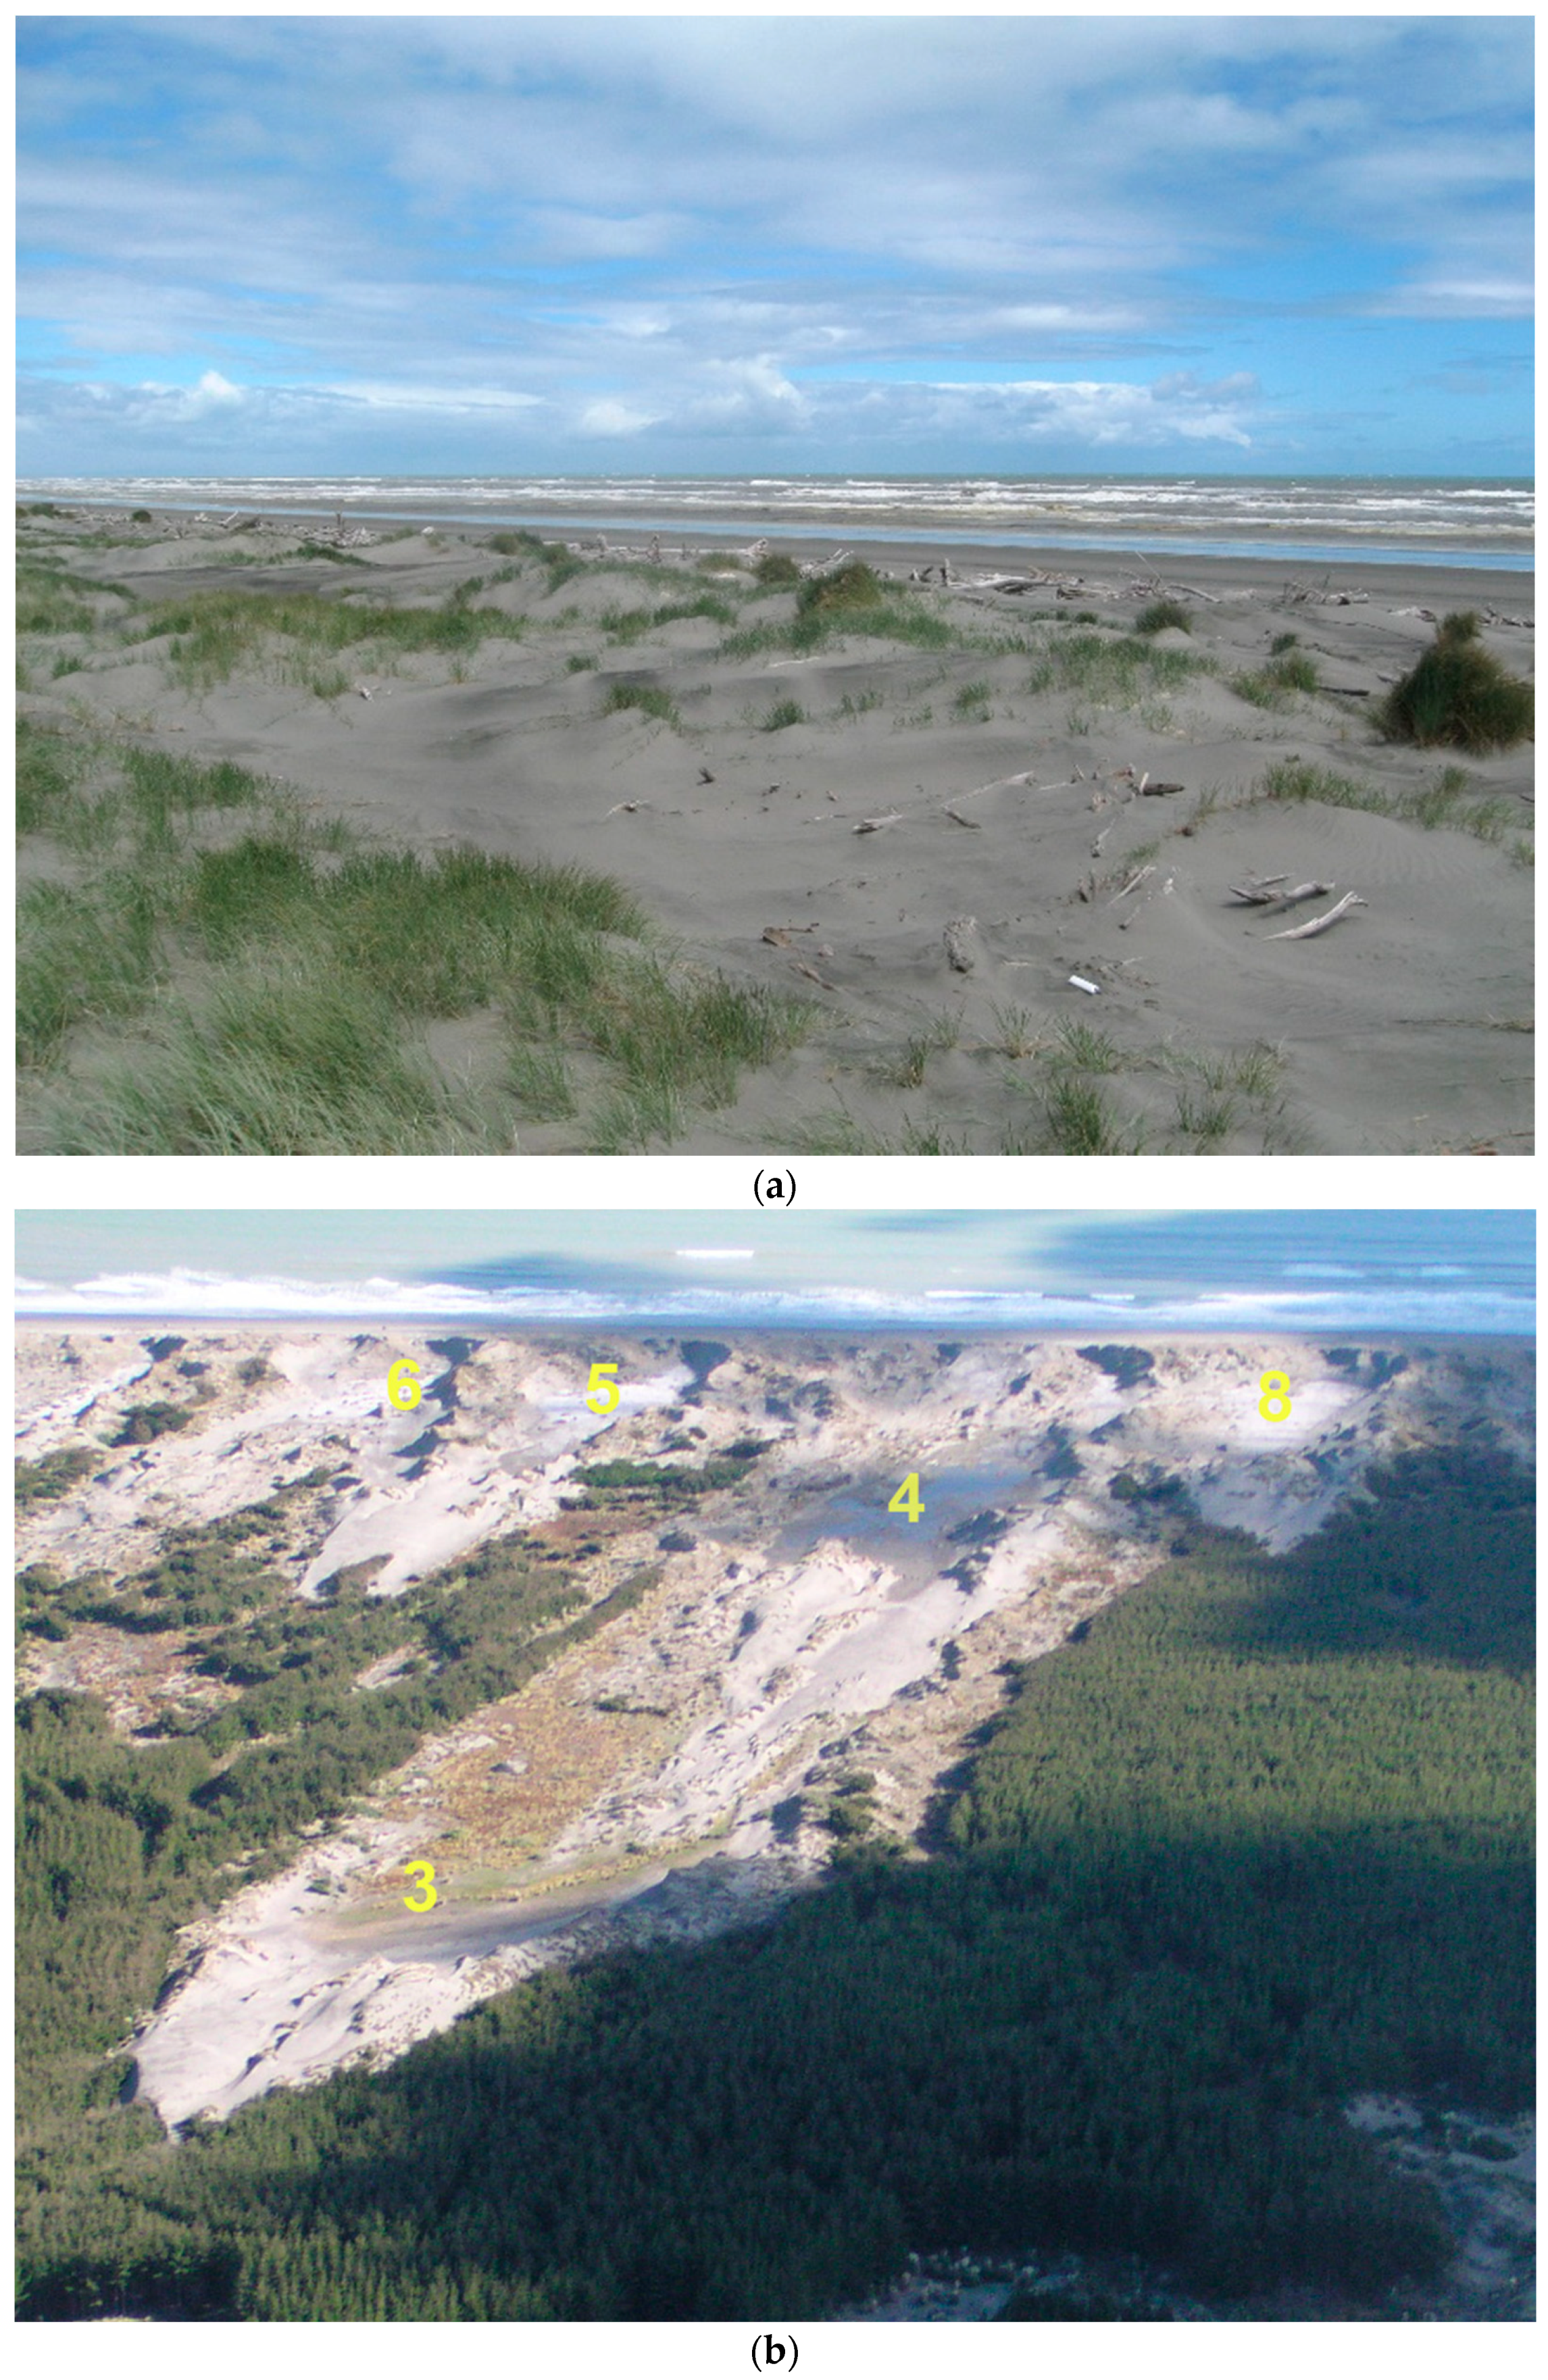
Aerial photos are a frequent source for coastline mapping, but the very mobility of sand dunes makes it hard to determine location correctly. All historic images of adequate quality were digitized using ArcMap 10.3 [1], georeferenced and aligned (see [63] for details). There is no standard technique to identify coastline changes through time [37], but the most common approach taken at a regional scale is considering the line between the wet and dry sand, called the high water line, due to its easy visibility in aerial photos [9,37,60]. Here, we identified the coastline as the strandline or the seaward edge of the vegetated foredunes as laid down by the widespread native foredune sand binder, Spinifex sericeus (Poaceae; Figure 3a), with occasional Ficinia spiralis (Cyperaceae).
2.1. Coastal Movement
Point measurement is a common method to measure coastline changes through time in aerial photos [37]. On the oldest aerial photos in each set, points were placed on the strandline every 100 m along the coast of each study site, and the distance from that point to the current coast in each subsequent image was measured and expressed as coastal movement per annum. Just north of the Tangimoana study site, an additional five points were added to monitor changes associated with the southern side of the highly dynamic Rangitikei River mouth.
2.2. Distance of Wetlands to the Coastline
For each of the wetlands in our study sites, see [39,63], the number of water bodies per wetland (i.e., within the same sand plain) was counted. For each wetland in each year, a “tightest-fit” concave polygon was generated using ArcGis, and its centre of gravity taken as the wetland’s centroid. Where a wetland is formed by more than one water body within the same year, the average of the centroids of each water body was calculated. The centroid’s distance to the then-current coastline was measured as the shortest line.
2.3. Wetland Movement
Wetland movement in any direction was analysed through consecutive imagery by determining the rate of change per year of each wetland’s centroid with respect to a reference point. If a wetland did not appear in an image but reappeared later, its movements were omitted for that time period. Inland movement was expressed as change in position either coastwards or inland within the “horns” of the surrounding parabolic dune, along the trajectory of the prevailing wind direction at each site, wind directions from [63].
2.4. Impacts of Rainfall on Wetlands
For the impact of rainfall on the size of the wetlands, from [63], the total monthly rainfall was extracted from the national climate database, Cliflo (cliflo.niwa.co.nz; accessed on 1 March, 2022). Two short-term, highly correlated (r2 = 0.69) stations located near the study sites were Flock House (Station No. 3205), 10 km inland from Tangimoana, and Waiterere Forest (Station No. 3267), 12 km south of Foxton Beach along the coast, providing data from 1948–1979. A correlation against the longer-term, more inland (30 km) station of Palmerston North (Station No. 21963; r2 = 0.50) showed that the coast was 11% drier than inland. Data were taken from the appropriate local station for each of Tangimoana and Foxton Beach up to and including 1979. Thereafter the inland station’s data were corrected for the coastal effect and applied. Himitangi, with only recent imagery, used only inland data.
Seasonal rainfall was calculated for spring (September to November), summer (December to February), autumn (March to May), and winter (June to August). When the season of capture was not known for an image, seasonal rainfall was averaged. These rainfall values were graphed against wetland area. Relationships with annual rainfall were also examined. Wetland size at any one time was also expressed as a percent of the maximum for each wetland and examined against seasonal rainfall corrected for the raininess of that particular year, as expressed by the Palmerston North station’s range of annual rainfall values against the maximum over the period 1948–2013.
2.5. Dynamic Inter-Relationships
The coastal progradation rate over each period between images was examined against wetland area at the end of each period, and also against the rate of inland movement of wetlands over each period.
3. Results
Using nine aerial photos as equi-spaced as possible between 1958 and 2012, a 1.3 km section of coastline at Tangimoana was found to contain nine natural wetlands (Table 1), as well as three created ones (not studied further here, see [39]). Two separate wetlands, T8a and T8b, occurred in the same slack 21 years apart [63]. At Himatangi, 22 wetlands were found along a similar length of coastline over three years (1995, 2005 and 2012). At Foxton Beach, 16 wetlands were found over seven different periods between 1942 and 2012, two of them (F6a and F6b) appearing at the same location 53 years apart and treated as separate wetlands. Thus, we studied 47 wetlands, represented by 89 separate occurrences, with each wetland occurring in 1–7 images. In only 4% of the images did a wetland possess multiple water bodies, giving a mean of 1.2 water bodies per wetland, with no sign of inter-annual variation.
Wetlands were most common at Tangimoana from 1974–1990. Foxton Beach has had five wetlands present since 2000, but not always the same five, and also had five in 1965, with smaller numbers at other times. Three wetlands were present in our first Himatangi image, from 1990, and numbers had increased to 18 by 2012.
3.1. Coastal Movement
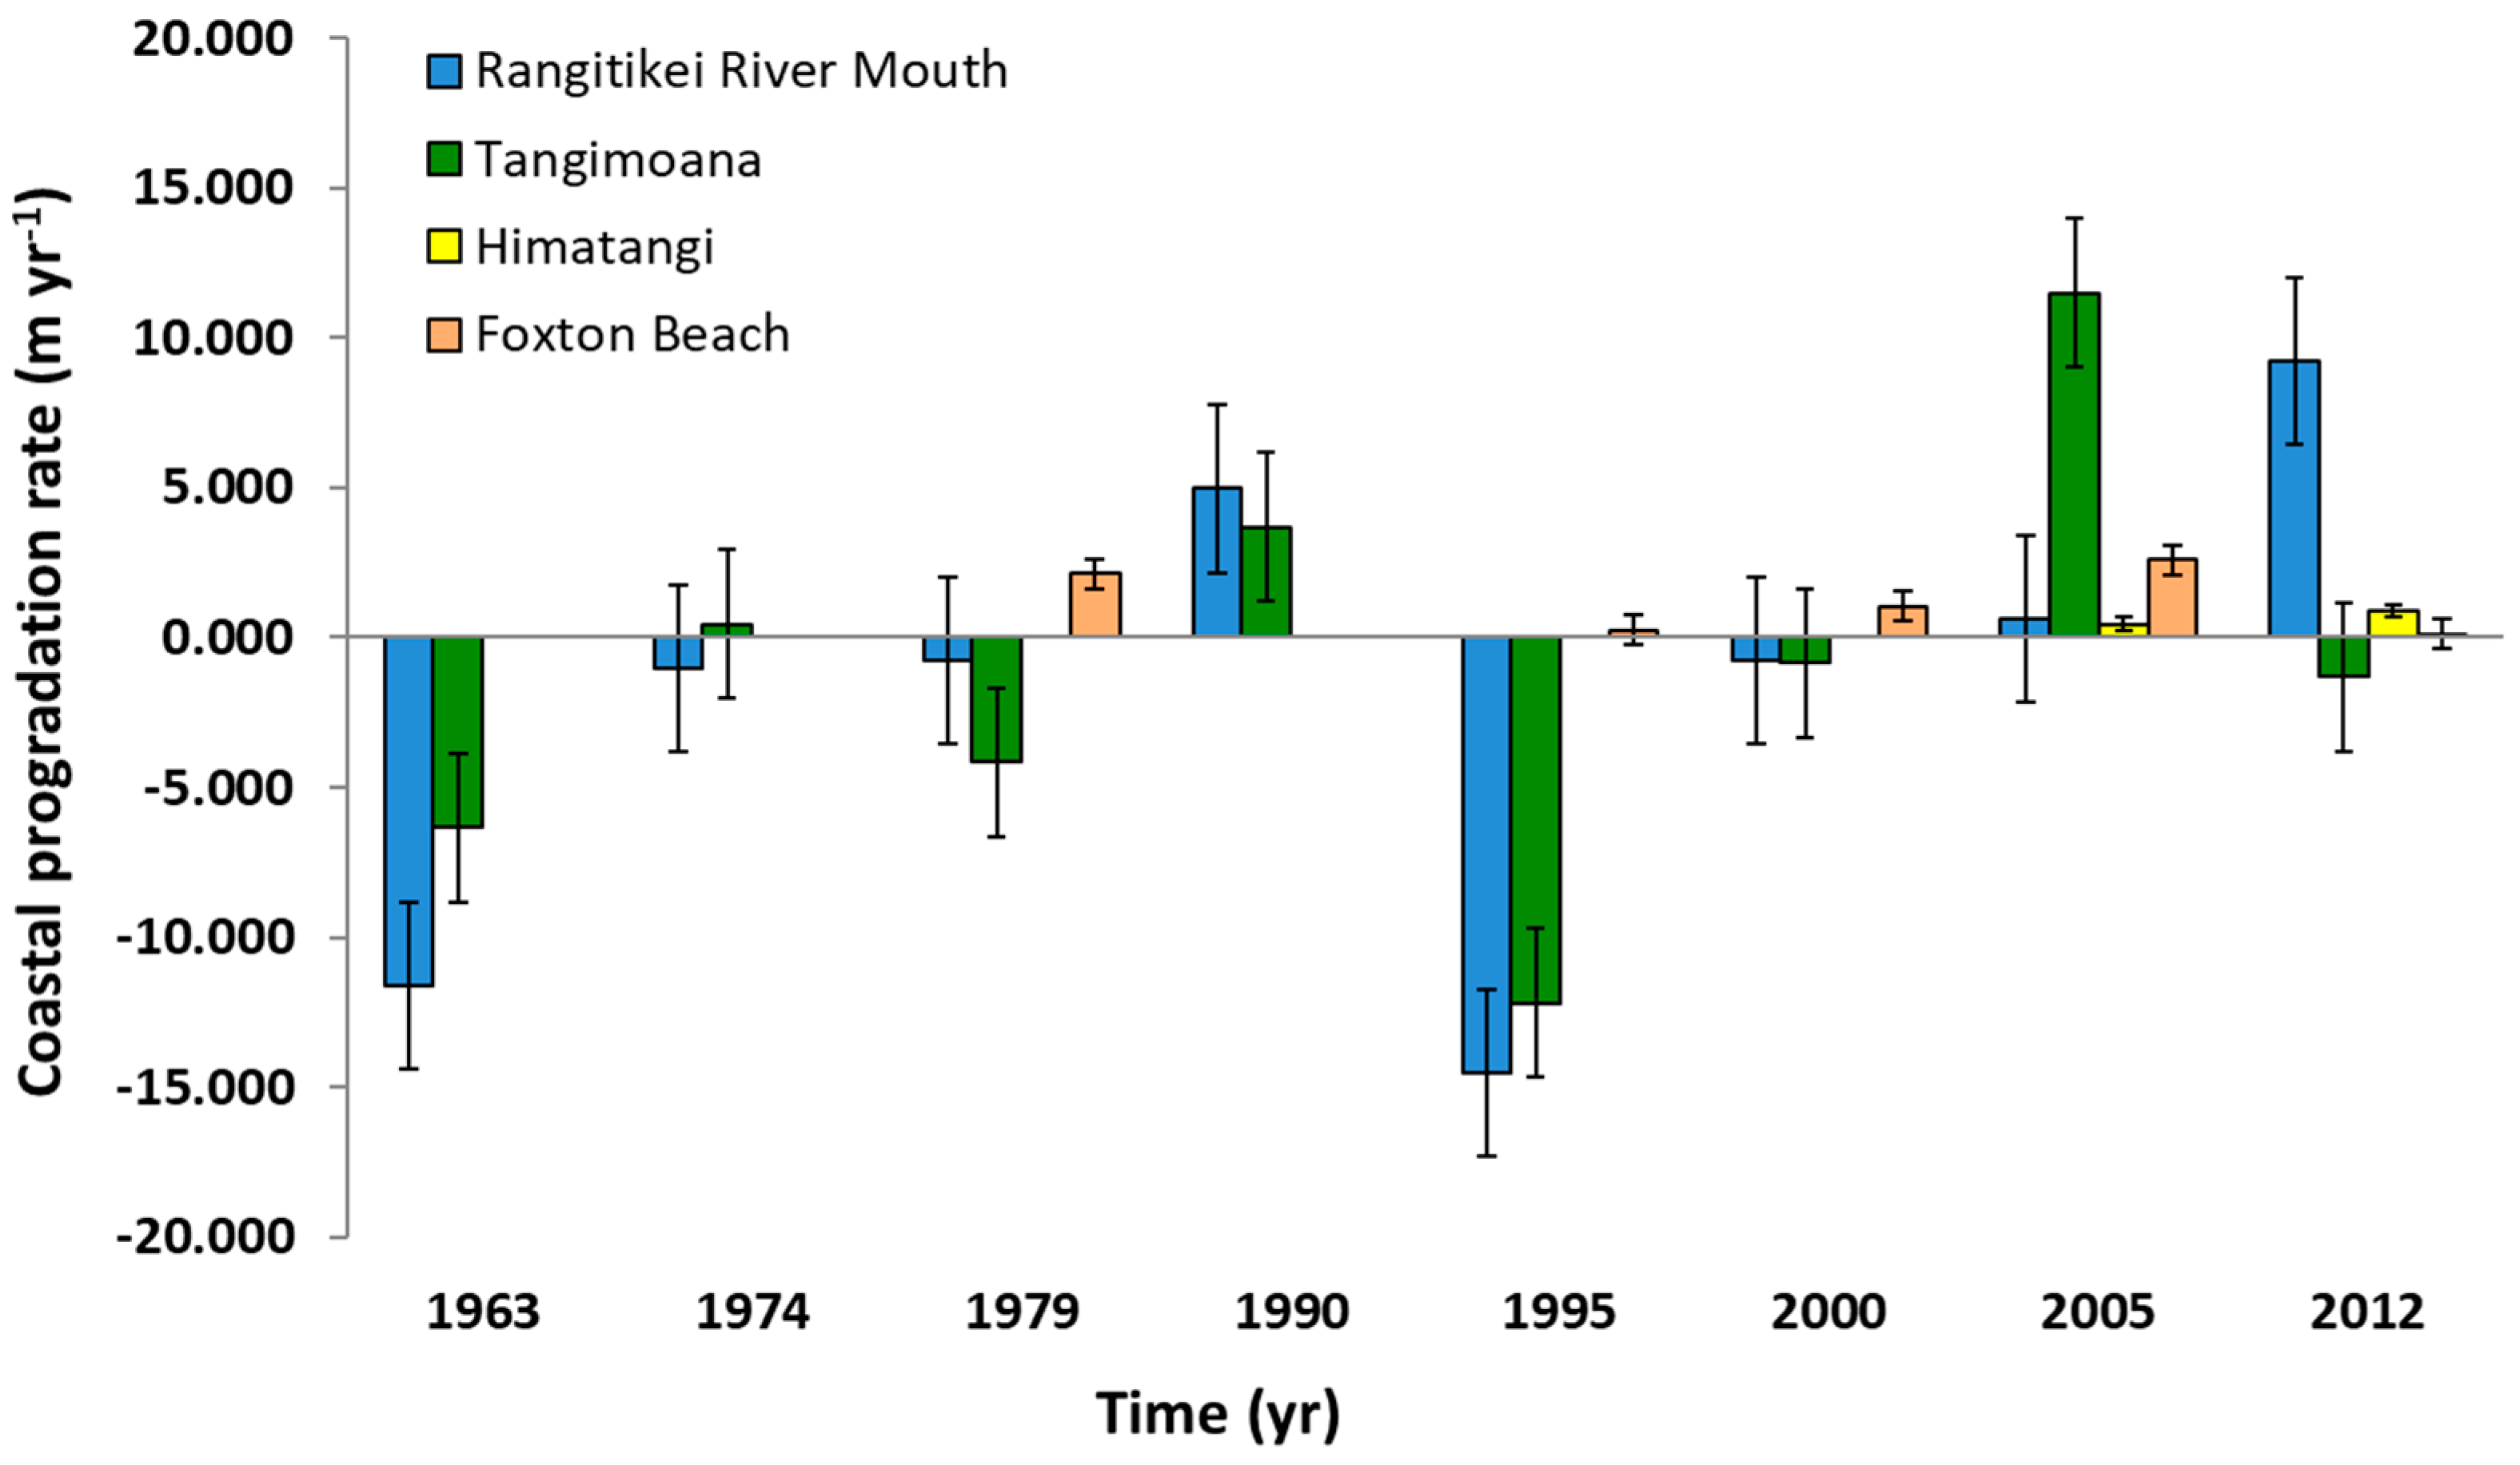
The coastline moved out to sea by 1.0 m yr−1 over the period studied (Table 1). However interannual variation was high, ranging from retrogradation of 14.7 m yr−1 over 1990–1995, and progradation of 15.4 m yr−1 from 2000–2005, both at Tangimoana (Figure 4), with those periods reflective of changes all along the coast. Tangimoana and Foxton Beach were generally prograding at similar rates, though rates were 30% slower at Himatangi (Table 1).
Coastal movements over five points placed north of the study sites, and immediately south of the Rangitkei River mouth show a general trend towards progradation of 4.1 ± 1.3 m yr−1 over the periods studied, ranging from retrogradation of 4.9 m yr−1 for 1979–1990 to progradation of 14.2 m yr−1 for 1990–1995 (Figure 4).
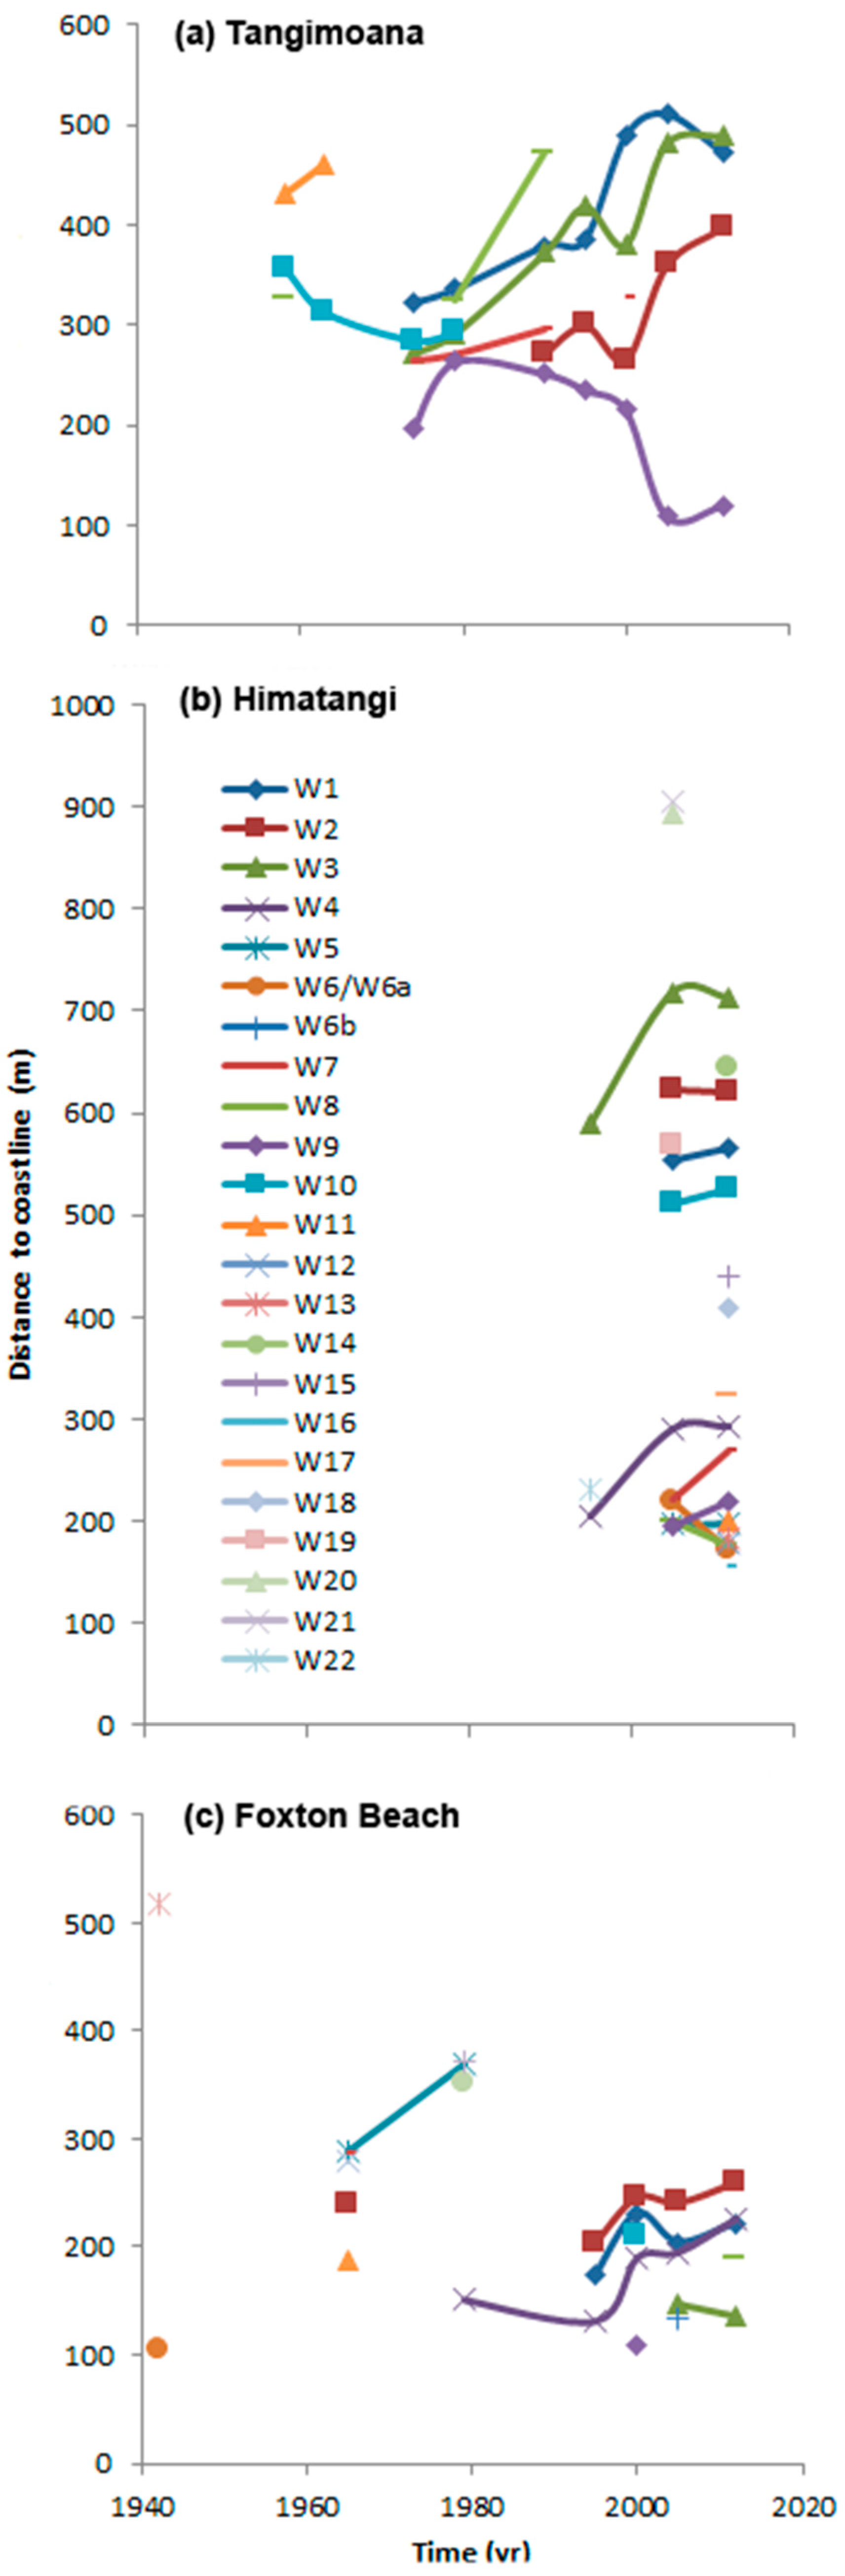
3.2. Distance from Wetlands to the Coastline
The average distance of wetlands’ centroids from the coast in each year is 319 m (Table 1), and the range is from 906 m (for H21 in 2005) to 105 m (for F6a in 1942). Wetlands are closest to the coast at Foxton Beach (mean of 227 m), and are 74% further inland at Himatangi, with Tangimoana in between (Table 1).
Over time, the distance to the coast of wetlands changed (Figure 5). At Tangimoana, the distance was greatest for 1956 and 1963 (at a mean of 379 m), decreased by 70% by 1974, and progressively increased thereafter by 2.5 m yr−1. Wetland T8b, at the southern end of the study site [63], had the greatest rate of separation from the coast (13.2 m yr−1), while T9, at the northern end, was becoming closer to the coast by 5.9 m yr−1.
Over its three images, Himatangi shows the largest range of variation (range 156–906 m), distances being greatest in 2005 (average of 469 m). Ten wetlands occurred in >1 image and had an average rate of separation from the coast of 2.3 m yr−1. The range was 12.7 m yr−1 (H3) to −6.7 m yr−1 (H6), though these wetlands are nearby (Figure 3b).
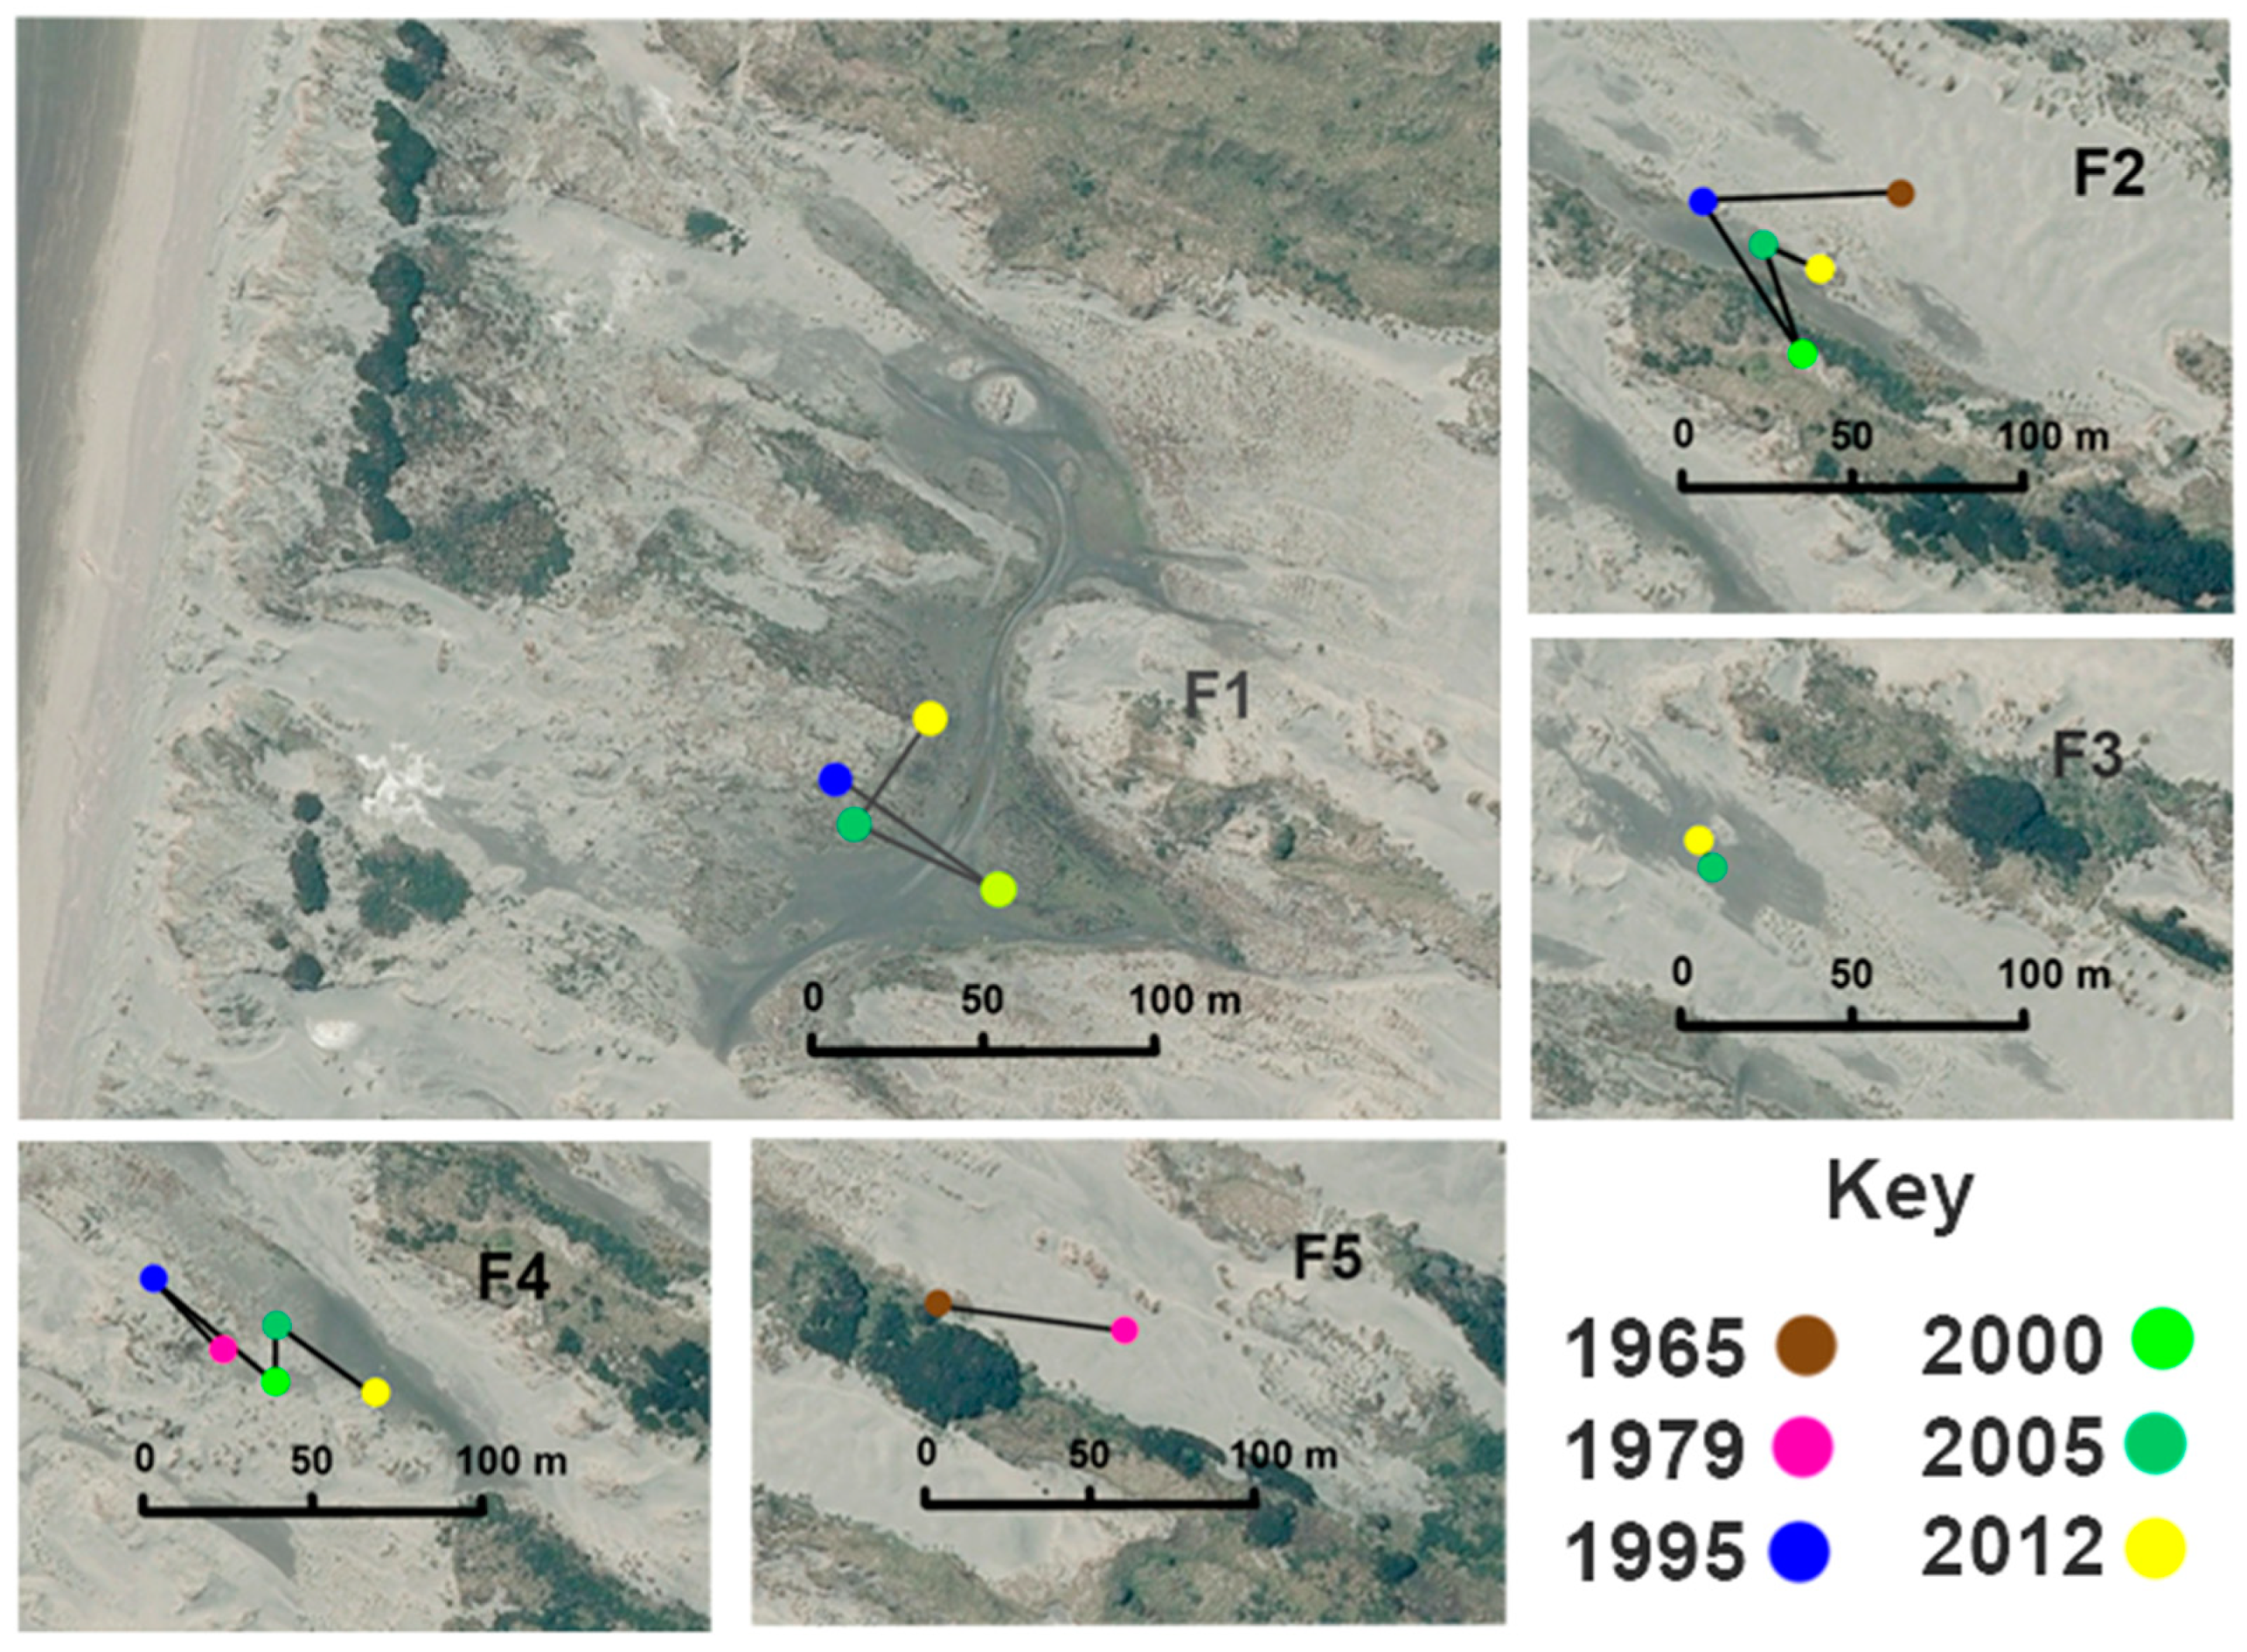
At Foxton Beach, wetlands were nearly 100 m further from the coast prior to the 1980s than they are today (data not presented). Of the five wetlands in >1 image, the mean rate of separation from the coast was 5.5 m yr−1, and the greatest 11.4 m yr−1 for F1.
3.3. Movement of the Wetlands
Disregarding coastal movements, wetland centroids show an average movement of 5.2 m yr−1, with an average inland migration, for wetlands at Tangimoana and Foxton Beach, along the line of the “horns” of the parabolic dunes of 2.9 m yr−1, i.e., only 42% of overall movement (Table 1).
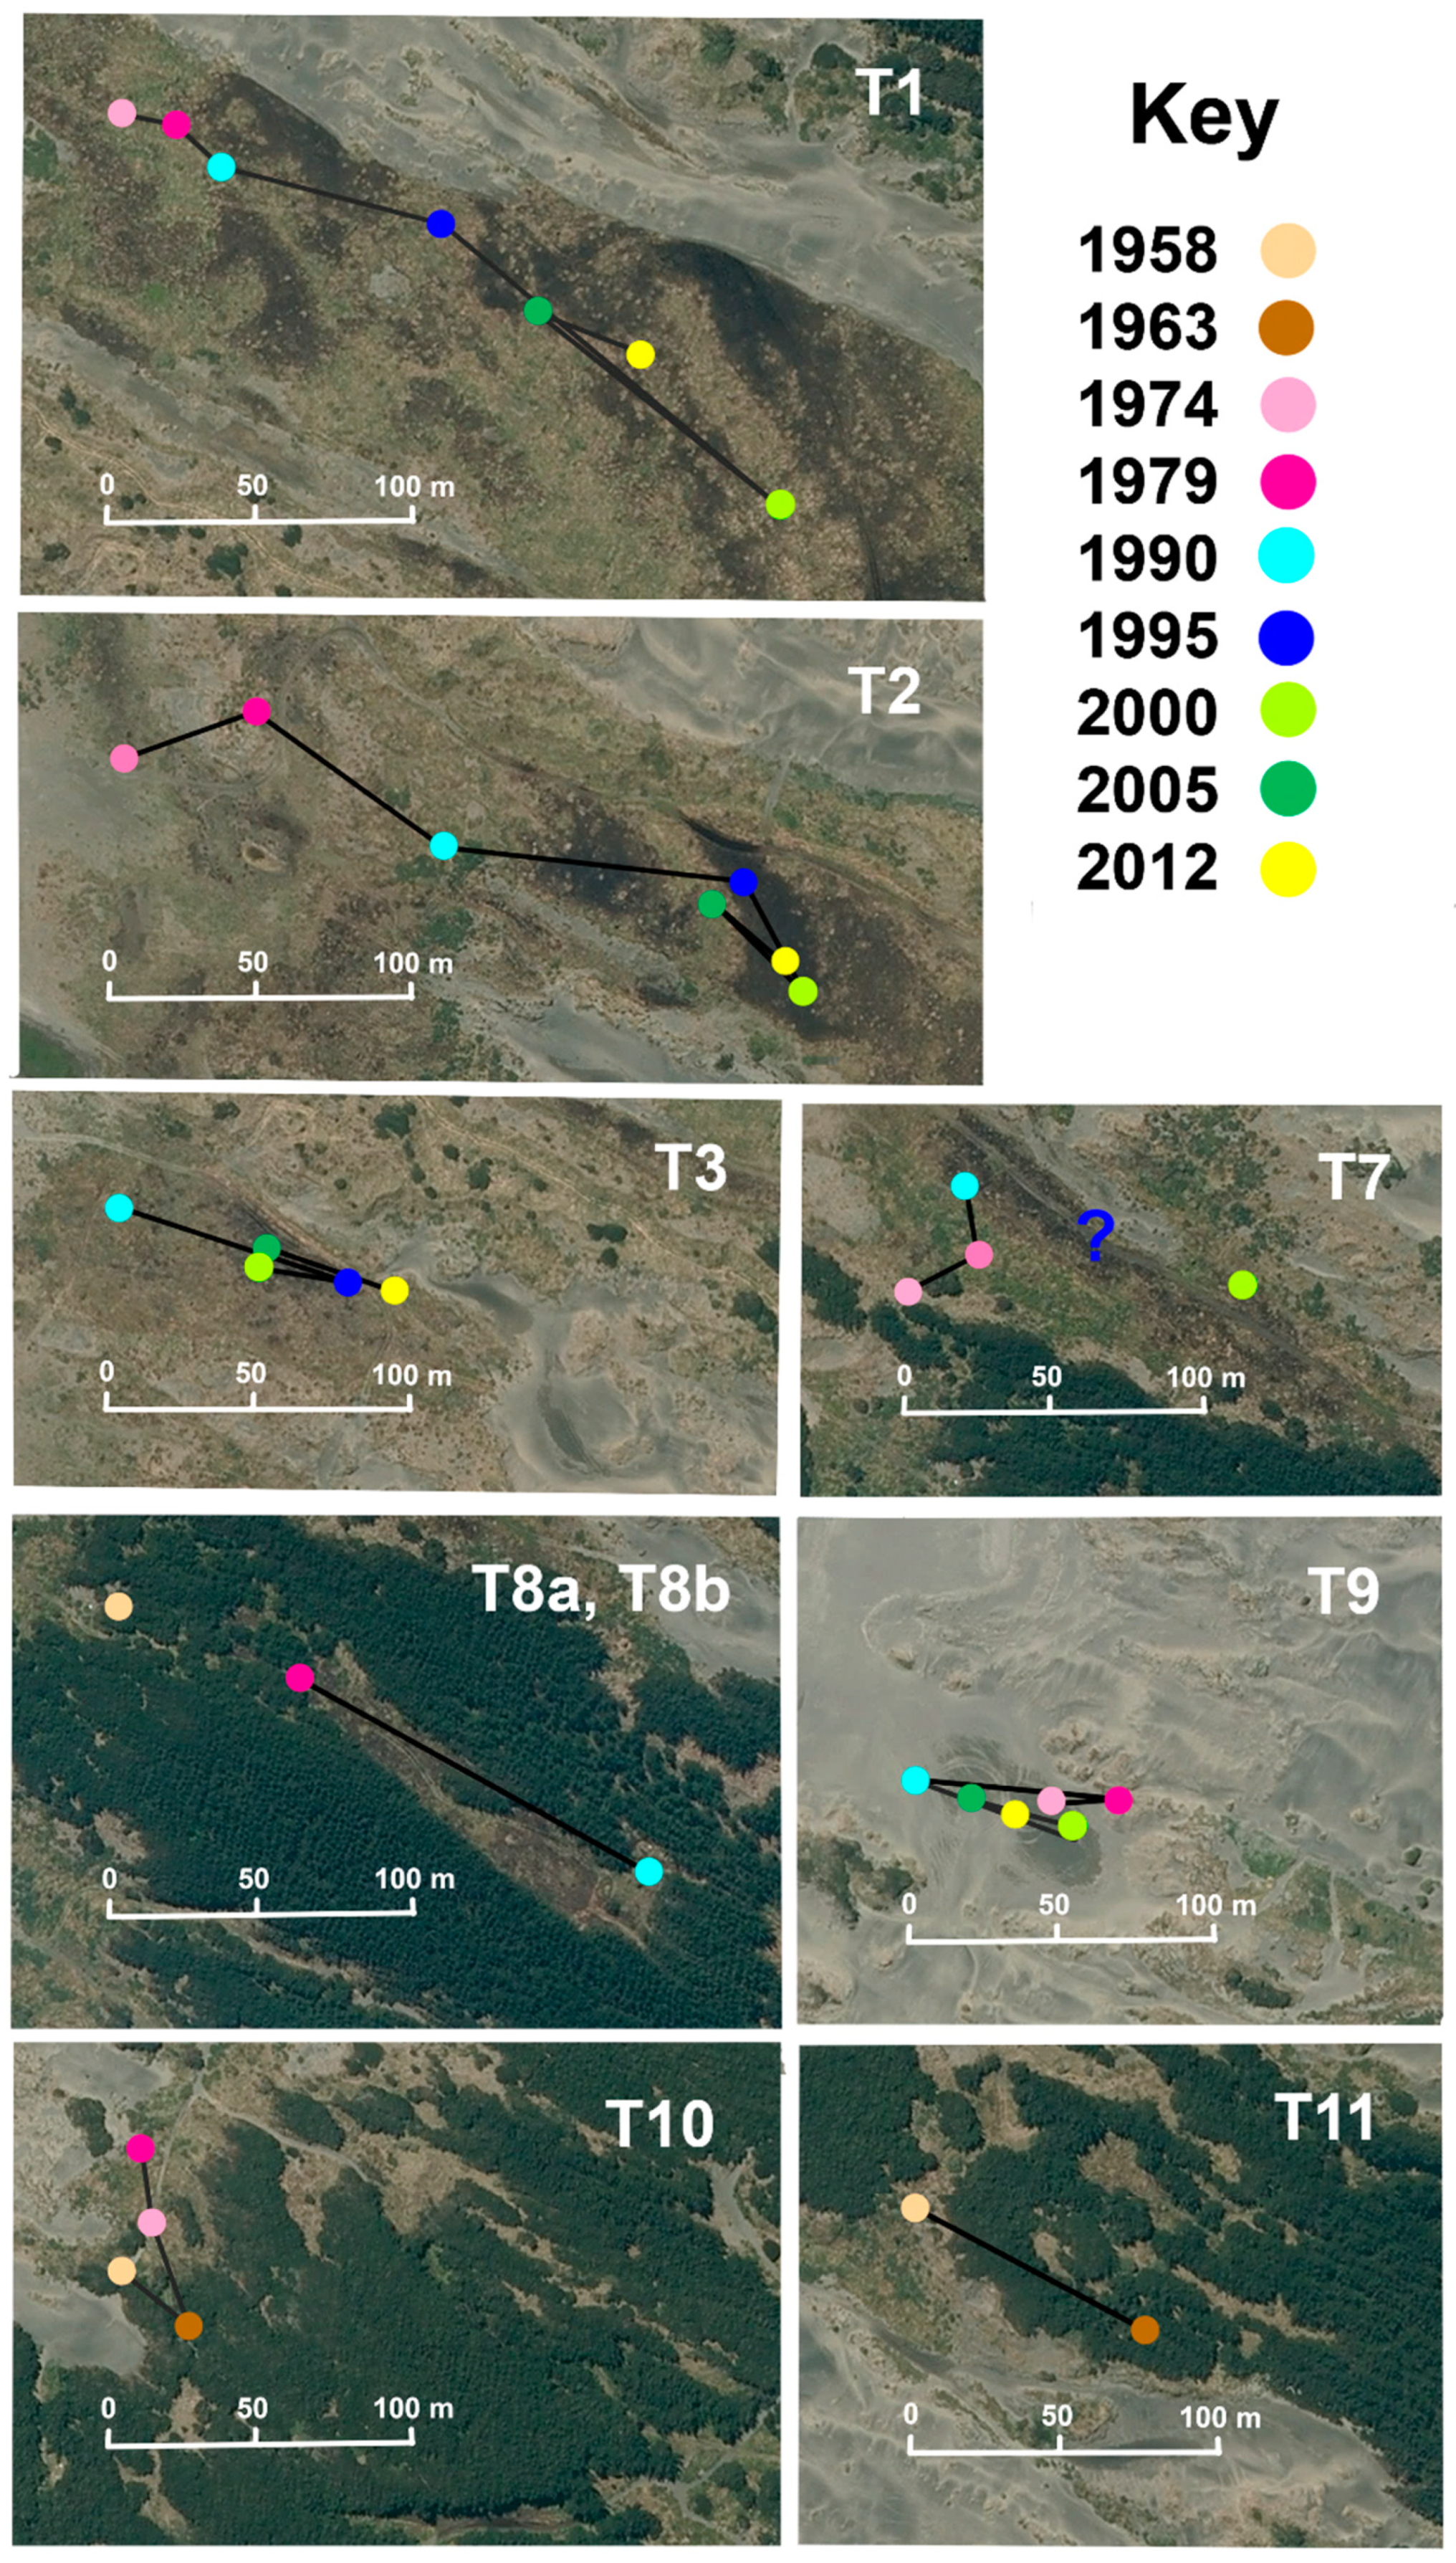
At Tangimoana, the mean movement of the centroids is 7.7 m yr−1 (Table 1). Wetlands T1 and T8a move inland at 13.1 and 12.2 m yr−1, and T11 had a brief but mobile existence, moving 18.0 m yr−1 between 1958 and 1963. Wetland T1 had the largest episodic movement recorded at 26.4 m yr−1 over the period 1995–2000. The rest of the wetlands have a movement rate of between 5–8 m yr−1, one third of those movements being seawards. Considering only inland movement of the wetlands’ centroids, rates average 3.7 m yr−1 (Figure 6) and are 5.7 m yr−1 for T1.
Himatangi wetlands H3 and H4, in the same parabolic basin, but separated by a small transgressive dune, move inland at 10.7 m yr−1, though the overall average wetland movement is only a fifth of that (2.1 m yr−1; Table 1). Inland movements were not calculated due to data limitations.
3.4. Impact of Rainfall on Wetlands
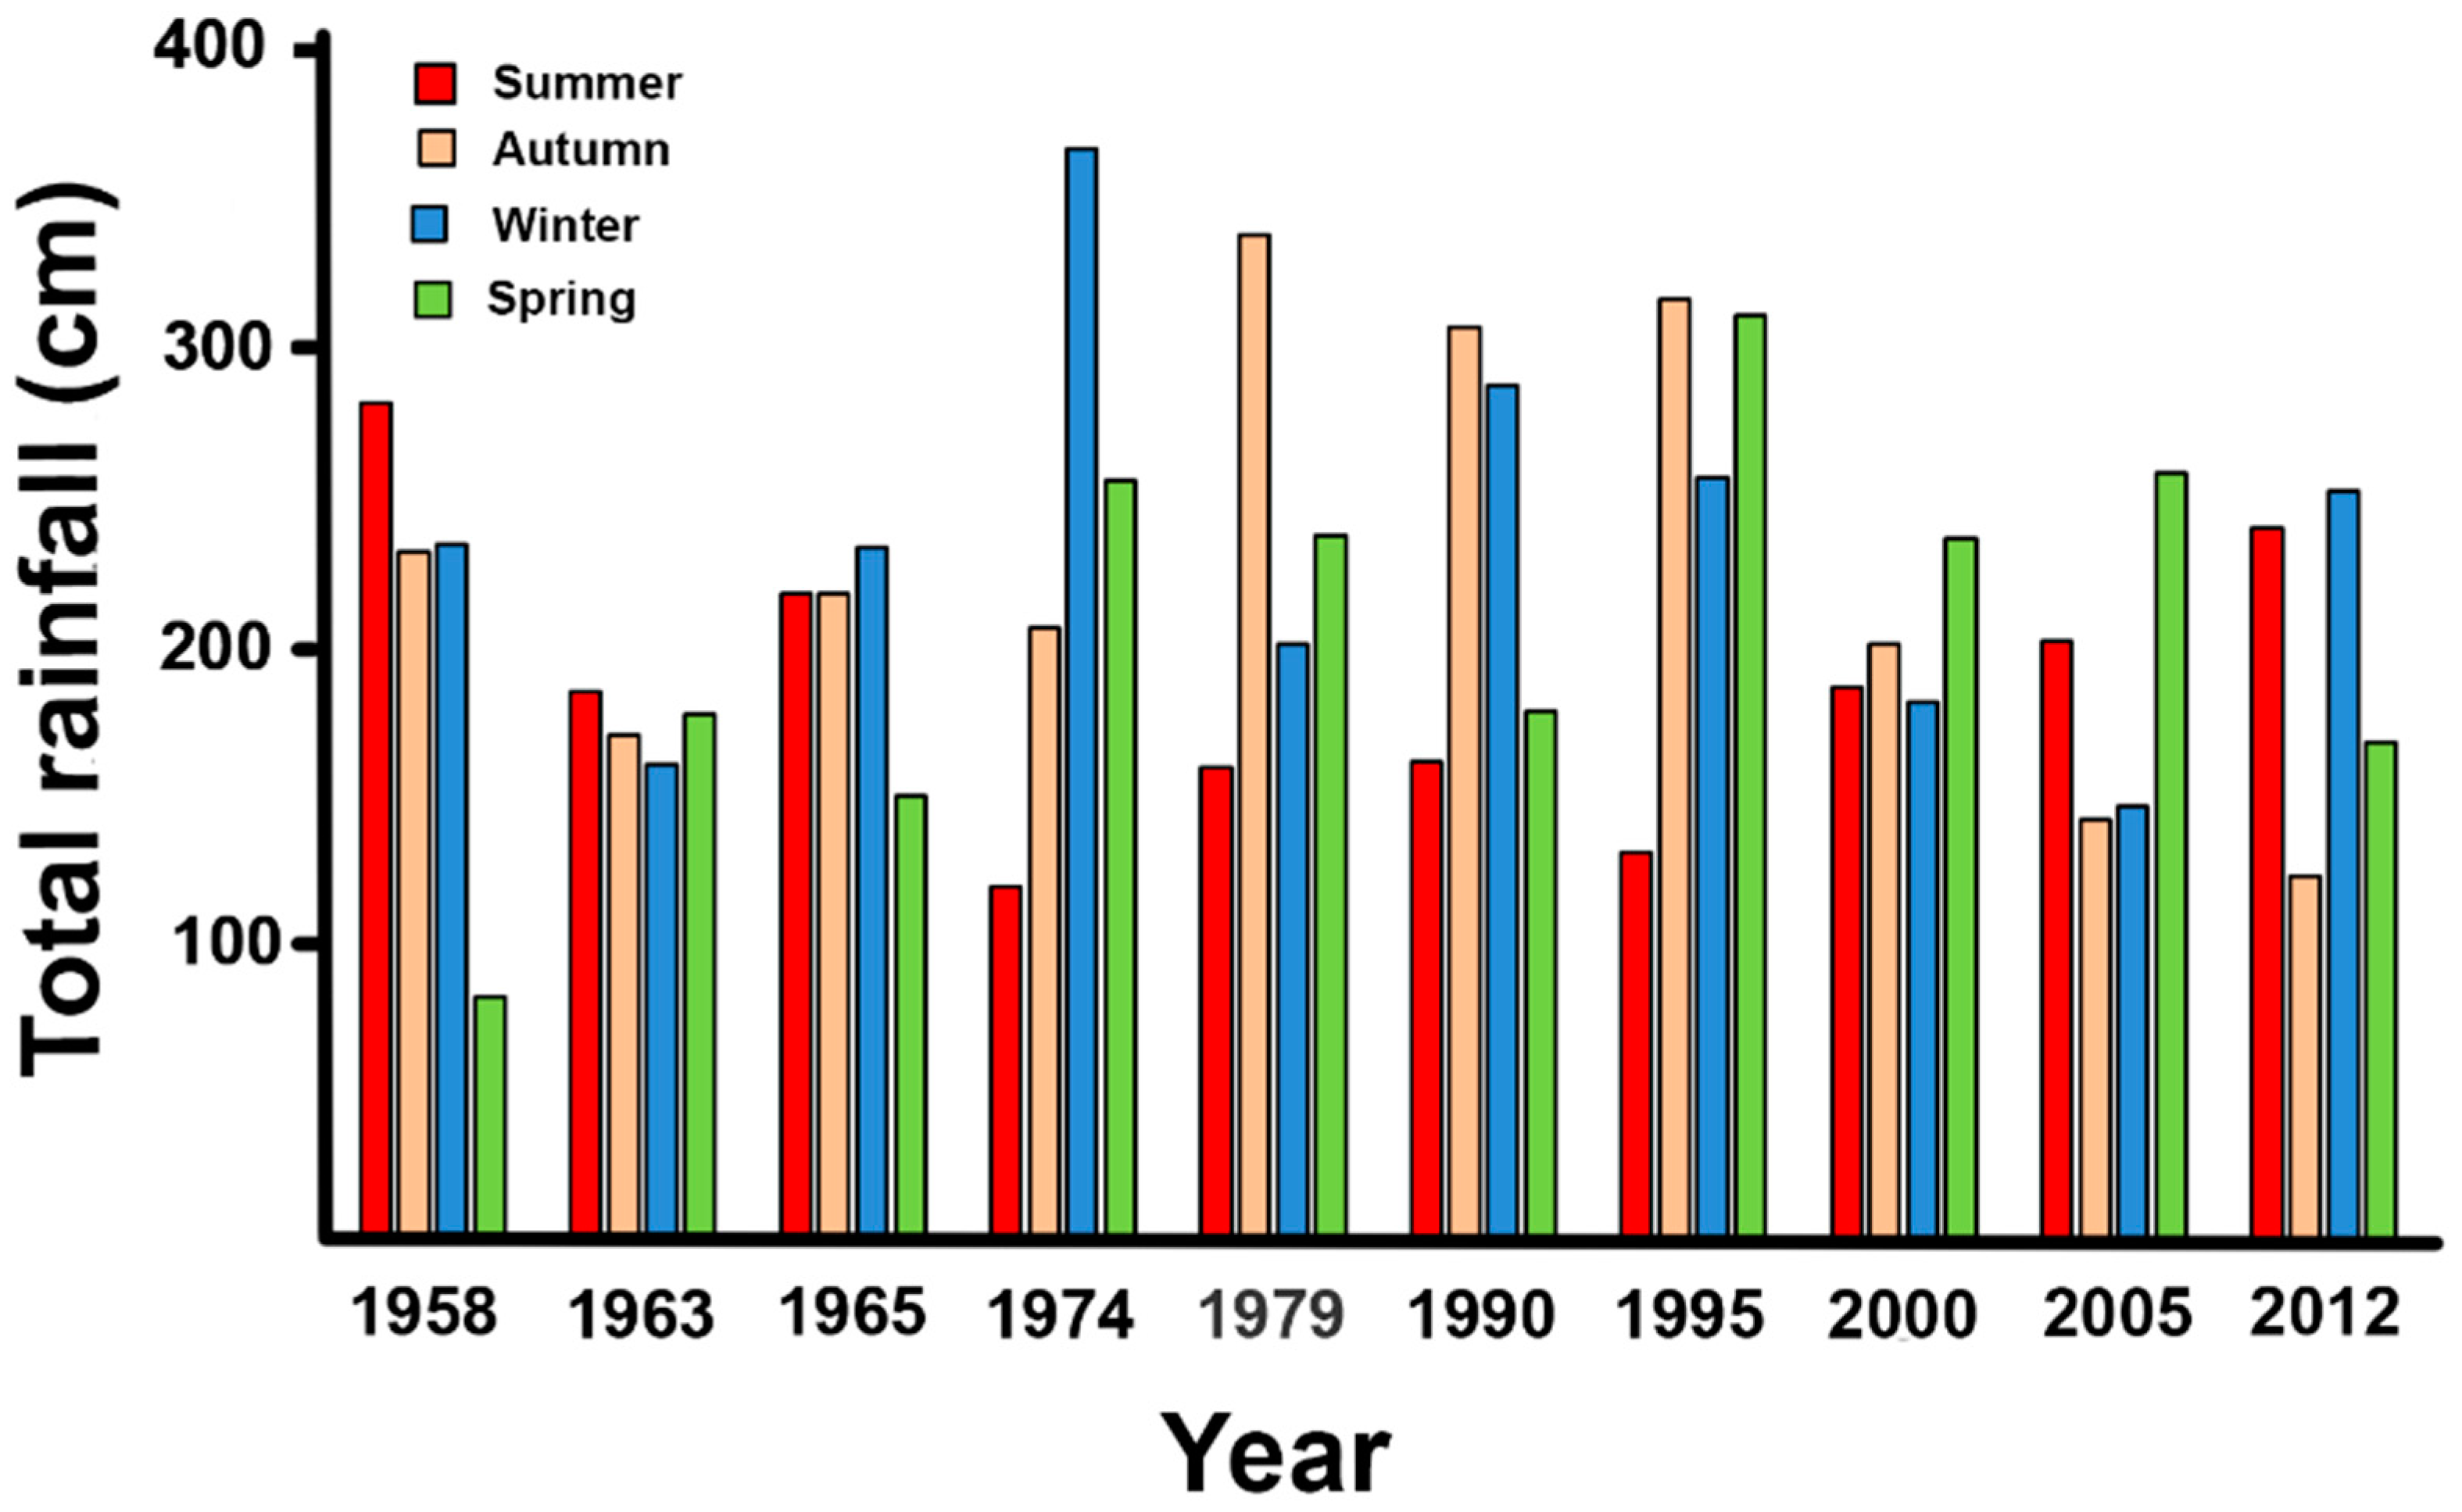
Over the years of the imagery, total rainfall averaged 852 ± S.E. 34 cm yr−1, with low inter-annual variation (Figure 8). Rainfall was evenly spread over the seasons with <10% variation.
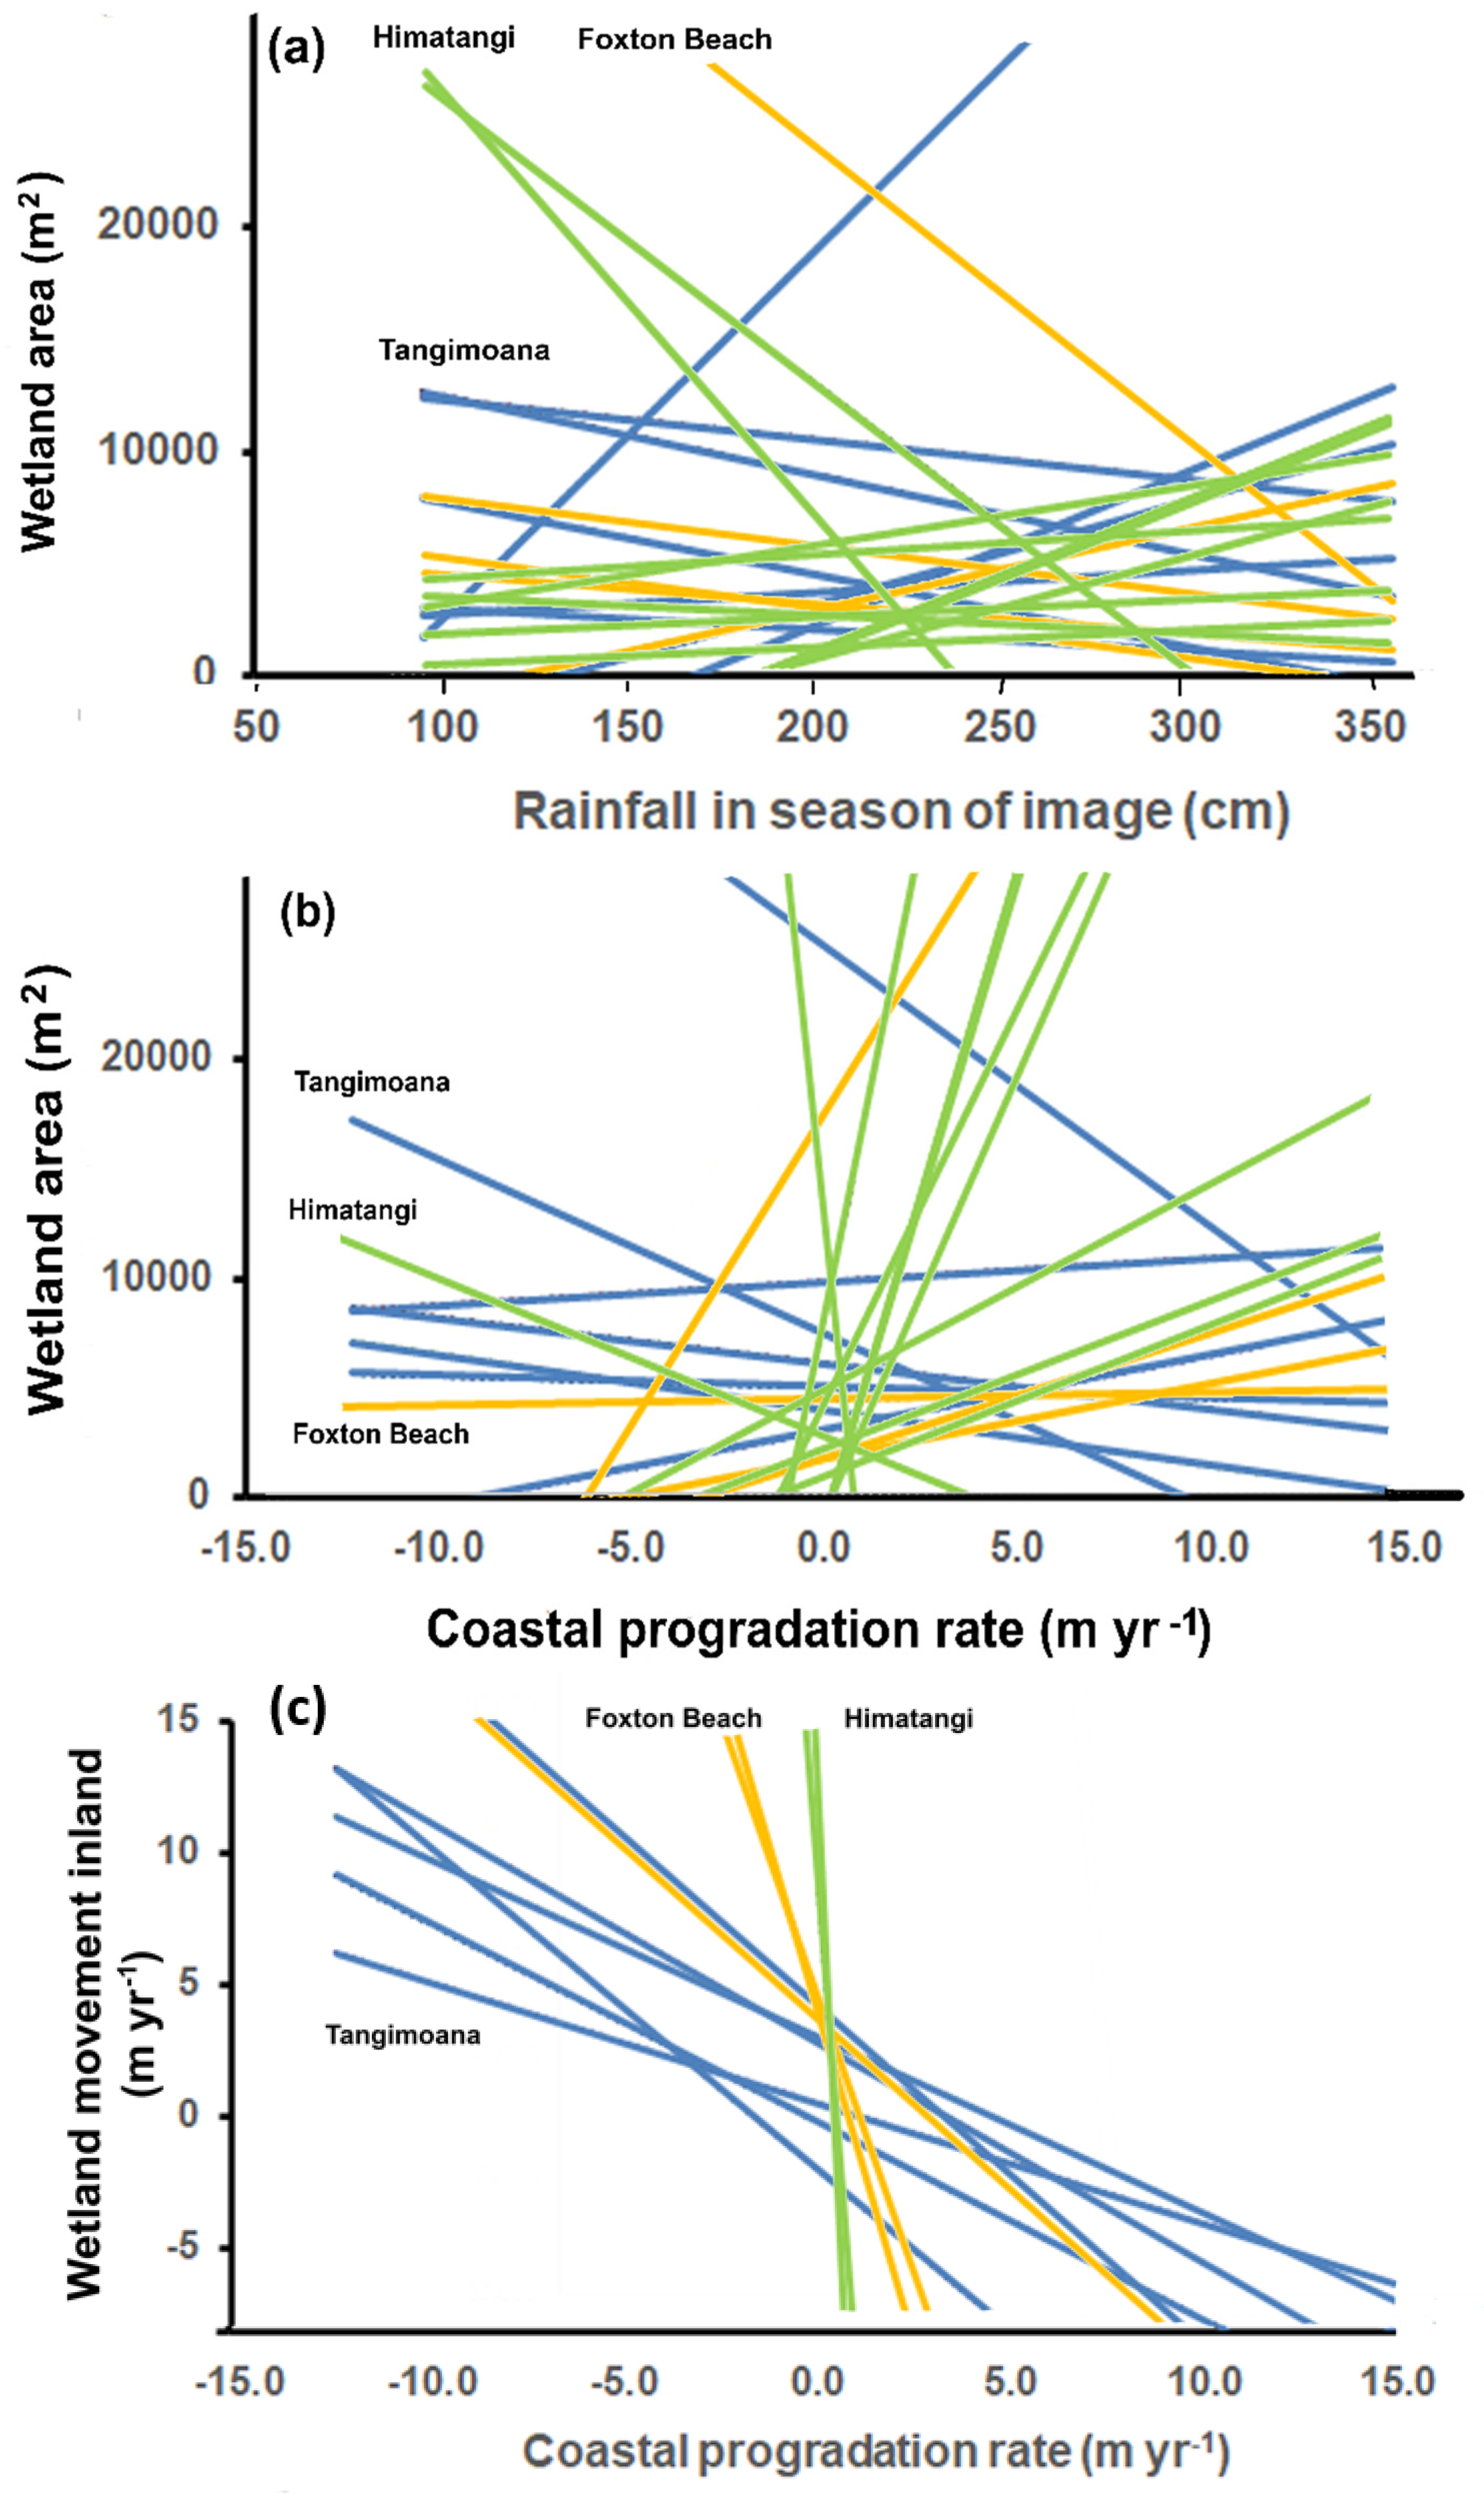
Considering wetlands occurring in >2 images, correlations with seasonal rainfall were firm (mean r2 = 0.70; Table 1). Higher rainfall during a season increased wetland size at Tangimoana, largely due to T1, and decreased it evenly across all wetlands by about the same amount at Foxton Beach, and decreased by about half at Himatangi (Table 1), where effects were very variable (Figure 9a). Correlations were weaker (r2 = 0.62) between wetland area and annual rainfall (Table 1), with wetter years having larger wetlands at both Tangimoana and Foxton Beach. Adjusting for the size of a wetland, as a proportion of its maximum, and the raininess of any season, reverses patterns (r2 = 0.70).
3.5. Dynamic Inter-Relationships
Though there were more than twice the number of positive vs. negative relationships between coastal progradation rates and wetland area, the trends are unconvincing (r2 = 0.55; Table 1; Figure 9b). However, for rate of inland movement of wetlands, there is a consistent negative trend against progradation rates, excluding the poorly imaged Himatangi site (r2 = 0.68; Table 1; Figure 9c).
4. Discussion
The implications of the dynamics of sand and rainfall on the movements of the coastline and of the dune slack wetlands are analysed for the Fox-Tangi coast, Manawatū, New Zealand, and management options raised.
4.1. Coastal Dynamics and Wetland Formation
In Manawatū, the coast and all its parts are extremely dynamic. A common expectation of the effects of anthropogenic climatic warming is of rising sea levels, both world-wide [3,26] and in New Zealand [17]. This is evidenced by the erosion or retrogradation of sandy coastlines in most parts of the world, e.g., in the north-eastern United States of America [9,37,58], the Gironde Estuary, France [40], the Catalan coast, Spain [28], and at Doughboy Bay, New Zealand [24]. Such erosion inevitably results in the loss of dune slack wetlands. However, in some places, coasts are prograding, e.g., Magheramore, Ireland [4], Wadden Sea, Denmark [16], Humboldt Bay, California, U.S.A. [46], and Whatipu Beach, New Zealand [43], which is commonly a response to regionally increased sediment supply. Progradation also affects dune slack wetlands by changing their proximity to the coast [20,54], isolating them in space as relict features [43], or hastening their succession to more complex vegetation stages [12,15,45], or even to their demise [4,39,46]. Such dynamics raise the question of whether coasts need to be prograding for dune slack wetlands to actually form [5].
At our Himatangi site, where the coast is away from large rivers and stabilised by forestry plantations, progradation rates are 0.7 m yr−1, the lowest rate measured on the Fox-Tangi coast. We determined progradation rates which were 1.5 times higher than Himatangi’s for pine-free sites along the coast, being >1.1 m yr−1. These rates both approximate the range reported for this area by Johnston [31](rate 0.6–1.0 m yr−1), though they are 41% less on average than those reported by Gibb [18] around the 1880s for sites between the wrecks of the coastal steamers Fuselier and Hydrabad. It remains to be seen if this decrease in rates is a reflection of global climate warming or a more local response to changes in the dynamics of the Fox-Tangi dunefield.
On a prograding coastline a new line of foredunes forms seaward of an area of former plage (Figure 3a; [5,43]), making a potential site for future wetlands, all of similar age and proximity to the foredunes. However, no such wetlands are found between current and incipient foredunes in our sites, c.f. [43] and instead 80% of our wetlands are >200 m inland. Given our progradation rates, this would suggest wetlands are occurring on sites terrestrialised at least 170 years ago.
Wetlands may form episodically when strong winds erode blowouts in existing foredunes, exposing the sand behind to deflation [13,39,57]. In that case wetlands should all occur close to the coast, and haphazardly along it, in response to unpredictable interactions of storm events and random areas of foredune weakness, with older belts further inland. There is some evidence for this in our Himatangi data, where the 11 wetlands formed between 1995 and 2005, perhaps in response to the major storm event of 2004, are 170 m further from the coast than the eight wetlands formed between 2005 and 2012. However, the decadal scale between images and a coastal progradation rate of 0.7 m yr−1 explains only 4% of that distance. Further, wetlands appear regularly spaced along the available (pine-free) coast [63], probably in relation to the size at formation of a parabolic dune. They also occur at relatively regular distances from the plage, those distances somewhat specific to each study zone, probably a consequence of local patterns of wind, tide and currents. Even assuming the inland wetlands to be older, and given that Murphy et al. [39] estimates longevity of dune slack wetlands as <50 years, then only 20% of the distance of wetlands from the coast would be explained by this model of formation.
Wetland formation may simply occur amidst parabolic dunes wherever they arise, even if well inland, where wind energy is sufficiently high to deflate largely unvegetated floors during dry but stormy periods of weather [13,39,57]. This seems the most probable situation for wetland formation given their apparent distribution. For example, Himatangi Wetlands H20 and H21 are located approximately 900 m inland amongst pine plantations, which probably channel wind flows into zones of least resistance, widening and lengthening those, and given the mobility of sand, creating wetland sites (e.g., Figure 3b). In addition to such a mechanism of formation, wetlands well inland of the foredunes may be secondary or even “replacement” wetlands such as T8a, occurring in what is apparently the same slack as T8, but 21 years later. Detection of such dynamics requires closer monitoring.
Unstabilised sand, either from the foredunes, or the dry floor of the parabolic dune itself, can build into small, mobile dunes that then roll rapidly inland and across more stable vegetation (e.g., Figure 3b). Dunes move inland 1–4 m yr−1 at Cape Cod, Massachussetts, USA. [15], 0.8–1.6 m yr−1 at Humboldt Bay, California, USA. [46] and 10 m yr−1 at Łeba Bar dunes, Poland [45]. Though Muckersie and Shepherd [38] used a rate of 5 m yr−1, dune movement on the Manawatū coast can be much more dynamic, with 50–80 m yr−1 reported by Hesp [21], while Holland [27] reported 1200 m yr−1 for low dunes migrating across pasture, physiognomically similar to our wetland turf vegetation. This type of movement is depicted by our wetland T1, mentioned above. Similarly, H3 and H4 within a single parabolic dune are separated by a small sand ridge (Figure 3b). While no historically united wetland is known from this parabola, it may pre-date our imagery, as such large wetlands do occur along the coast (pers. obs.). In contradistinction to this situation, the large, W-shaped wetland at Foxton Beach (F1; Figure 7) has probably formed from the coalescence of two adjacent parabolas, when the sand forming their dividing horns was eroded away. However, this is an unusual situation along this coast, with no other such wetlands being known. Broad-scale assessment of the coast’s dune slack wetlands would be efficacious here.
4.2. Watery Dynamics of Wetlands
Water serves as a stabilising phenomenon in dunelands, as wet sand is very heavy and slow to move [16], while the water level of wetlands affects their floristics [10,12,32,39]. Wetland size is influenced by the dynamics of both groundwater, including springs [4], and of precipitation regimes [32]. Our sites are all on prograded sand from the Waiterere dune building phase [38] (Figure 1), i.e., <1000 years old. Thus, they are subject only to regional water tables, which are maintained by rainfall, though possibly agricultural irrigation on the nearby sand country may now be influential (pers. obs.). Within each year, wetland size varies according to the seasons, with higher water in winter and lower in summer [10,12,39]. Nevertheless, our relationships between trends in wetland size and rainfall are at best weakly positive, and trending negative at Foxton Beach, regardless of use of annual or seasonal or scaled data. The probable cause is that changes are too dynamic for the time interval between our images (average of 5 years).
Wet periods expose the wetland floor to planation by wind fetch and the equalising effect of small, random water movements (I.M. Henderson, Massey University, pers. comm.), so that a perfectly bowl-shaped wetland will show no centroid movement even as the water level varies. Instead, the average rates of multi-directional movement of centroids at Tangimoana and Foxton Beach are 8 and 6 m yr−1, respectively. This wetland wobble may be an expression of random events, such as lack of intermediate imagery, or occurrence of localised foredune blowouts or of transgressing dunes infilling part of a wetland. Dry periods expose the wetland floor to deflation, especially when it lacks organic materials and is only partly stabilised by an open covering of small wetland turf species, such as occurs here, and uneven deflation can alter a centroid’s location. Further, since less aoelian sand is transported the longer distances, the wetland edge closest to the coast infills faster than the inland edge. Consequently, only about 40% of the wobble translates into directly inland movement of 2.9 m yr−1.
Just north of our Tangimoana site, progradation rates are currently about four times higher than at our study sites. These are affected by movements of the Rangitikei River mouth, which progressively migrates southwards, driven by the long-shore current (Figure 1), until such time as the growing, northern sand bar is breached, resetting the river mouth [55]. Thus, progradation rates are reduced during southwards movement, and increased once the river mouth is “reset” to the more northern end of its range. This temporal cycle appears to be of the order of 40 years, but is highly susceptible to flood or storm events (pers. obs.; [55]), which can also affect the parabolic dunes behind the foredune. A major regional flood in February 2004 [49] reset the Rangitikei River mouth, with progradation rates subsequently increasing (Figure 4). By 2009, the southerly drift of the river mouth had destabilised foredunes and accelerated sand movement through the northern end of our Tangimoana study site, causing the transgression of a sand dune across Wetland T1, apparent in imagery of Murphy et al. [39], Villacís Lozada and Rapson [63], and in our Figure 6, in the upper portion of T1. Such movement can infill and eliminate wetlands. A similar pattern of southerly drift is exhibited by the Manawatū River mouth, but our study site there is up-current of the mouth, and so is unaffected.
Fox-Tangi wetlands move inland more rapidly when progradation rates are less. So coastal progradation and wetland movement appear to be alternative uses of sand (Figure 9c), even though the latter rate is only 42% of the movement of the former. This is probably because it takes much less sand to move or fill a wetland than it does to build a plage. Johnston [31] gives the average volume of sand accreting on these foredunes as 22 m3 m−1 yr−1 of shoreline, orders of magnitude greater than that needed to move a wetland. This suggests that coastal progradation may actually increase longevity of wetlands by reducing sand supply inland to infill wetlands.
4.3. Coastal Management
Coastal ecosystems all over the world have been impacted by anthropogenic activities, changes in land-use, sea level rise, the development of farming, increased cattle and grazing and fertiliser applications, and the introduction of exotic plant and animal species [15,29,33,34]. The Manawatū dune field in New Zealand has also experienced these impacts, affecting endangered species, such as the early successional species of damp turf [30,39,57].
Due to the dynamics of both the coastline and the dune slack wetlands, interventionist management has previously been taken regarding these wetlands. In 1996 and 2008, artificial wetlands were excavated in Tawhirihoe Dune Reserve, which were reasonably successful in increasing the temporary availability of suitable habitat for the rare, early-successional turf species [39]. Such created wetlands also provide habitat for the rare, now vanishingly so, sub-shrub of dune slack margins, Pimelea actea [48]. However, creation of such transitory systems needs to be ongoing, though for dune slacks in the late herbaceous stages of succession, de-turfing might be an appropriate management tool, via destabilisation of and lowering of the surface [47,56].
The exact nature of the vegetation along the Manawatū coast prior to human settlement and development is unclear, but fires and clearance by indigenous Māori may have been widespread [21]. Coastal devegetation during European settlement in the nineteenth century resulted in the formation of transgressive sand sheets, which may not have offered any habitat for turf species [8] but did form one of the largest and most mobile dunefields in the world [21]. Subsequent foredune stabilisation by plantings of exotics, mostly Ammophila arenaria (marram) and Pinus radiata (pine; [36]), may have allowed formation of wetland habitat. By the mid-twentieth century, Esler’s [12] investigations showed wet flats 600 m from a foredune-less coast, with vegetation being more stable and later-successional further inland. Recent management (over the last four decades) has consisted of planting of the native sand-binders, including Spinifex (pers. obs.), which stabilise the foredunes further.
However, instability of the sand is critical to wetland formation. Shanmugam and Barnsley [56] noted that wetland formation ceased when dunes were over-stabilised at Kenfig, Wales. While no recently-formed wetlands were noted in our study, several small (<100 m2) patches of the more common of the wetland turf species have formed along the coast (pers. obs.; e.g., beside H8, Figure 3b, in April 2022). These may be a prelude to wetland formation or at least serve as species’ reservoirs until wetlands do form. However, it remains unclear where our dune slack wetlands form and why, or even whether wetlands occured prior to anthropogenic disturbance.
To date, there is little evidence progradation rates are declining in the face of anthropogenic sea level rise, and instead uplift for the Manawatū coast is predicted to be 2–3 vertical mm yr−1, though it is unclear whether coastal progradation was factored into this [59]. Nor is it clear how dunes might respond [61], perhaps affecting the dynamics of wetlands in novel ways.
Given the dynamics of these dune systems, relevant management options need to be at all scales, not just locally as per past management [39]. Thus management needs to address global climate change [51] and catchment stability, while reation of wetland sites as per Singers [57] and Murphy et al. [39] needs to be ongoing. Regionally, for riverine sediment translocation and deposition, understanding of the role of historical impacts of humans on the river catchments, and of potential impacts of future management initiatives requires development. Also, perhaps the scenic and ecosystem values of destabilised versus stabilised sand should be explored to contectualise current perceptions of the dunelands [44].
5. Conclusions
It seems plausible that dune slack wetlands in Manawatū only arise during periods of relative dune instability and only persist during periods of relative foredune stability. Some stability is needed, with the subsequent formation of parabolic dunes leading to deflation of their floors, which initiates suitable wetland sites. It is this situation that provides the sort of habitat, which explains the occurrence of the sand species of short turf, including the localised endemics Goodenia heenanii and Pimelea actea.
By contrast, a highly unstable dunefield offers no opportunities to develop even such short-lived wetlands as these. It would appear that there were periods when few or even no wetlands were present along the Fox-Tangi coast, such as in the decades immediately after European settlement (i.e., since 1840). However, if wetlands are not continuously present along this coast, then how do we explain the biogeographic origin and persistence of the rare species and diverse communities of turf species that occupy them?
At the present time, stabilisation has resulted from programmed planting of the foredunes with native foredune binders over the past four decades, so that wetland initiation appears to have slowed. As the effects of this stabilisation become prolonged, formation of wetlands may cease altogether, or instead become reliant on destabilising events such as major floods in the contributory catchments (e.g., 2004). These wetland systems remain as problematic as the species they house, and their management is becoming more critical in the face of warming climates.
Author Contributions
S.P.V.L. completed the thesis, which G.L.R. supervised; G.L.R. wrote the paper, and both authors reviewed it. All authors have read and agreed to the published version of the manuscript.
Funding
This research received no external funding.
Data Availability Statement
Data are available from either author.
Conflicts of Interest
The authors declare no conflict of interest.
References
- ArcGIS. GIS Software, Version 10.3; Environmental Systems Research Institute: Redlands, CA, USA, 2015.
- Arens, S.M. Patterns of sand transport on vegetated foredunes. Geomorphology 1996, 17, 339–350. [Google Scholar] [CrossRef] [Green Version]
- Bâki İz, H. Sea level acceleration under the magnifier. J. Geod. Sci. 2021, 11, 7–13. [Google Scholar]
- Barrett-Mold, C.; Burningham, H. Contrasting ecology of prograding coastal dunes on the northwest coast of Ireland. J. Coast. Conserv. 2010, 14, 81–90. [Google Scholar] [CrossRef]
- Boorman, L.A.; Londo, G.; van der Maarel, E. Communities of dune slacks and wet plains. In Dry Coastal Ecosystems: General Aspects; van der Maarel, E., Ed.; Elsevier: Amsterdam, The Netherlands, 1997; Volume 2C, pp. 275–296. [Google Scholar]
- Carnahan, J.A. Botany of the Manawatu sand country. Proc. N. Z. Ecol. Soc. 1997, 5, 7–18. [Google Scholar]
- Cowie, J.D. The soils of the Manawatu sand country. Proc. N. Z. Ecol. Soc. 1957, 5, 15–16. [Google Scholar]
- Cowie, J.D. Dune-building phases in the Manawatu district, New Zealand. N. Z. J. Geol. Geophys. 1963, 6, 268–280. [Google Scholar] [CrossRef] [Green Version]
- Crowell, M.; Leatherman, S.P.; Buckley, M.K. Historical shoreline change: Error analysis and mapping accuracy. J. Coast. Res. 1991, 7, 839–852. [Google Scholar]
- Curreli, A.; Wallace, H.; Freeman, C.; Hollingham, M.; Stratford, C.; Johnson, H.; Jones, L. Eco-hydrological requirements of dune slack vegetation and the implications of climate change. Sci. Total Environ. 2013, 443, 910–919. [Google Scholar] [CrossRef] [Green Version]
- Davidson, N.C. How much wetland has the world lost? Long-term and recent trends in global wetland area. Mar. Freshw. Res. 2014, 65, 934–941. [Google Scholar] [CrossRef]
- Esler, A.E. Manawatu sand plain vegetation. Proc. N. Z. Ecol. Soc. 1969, 16, 32–35. [Google Scholar]
- Esler, A.E. Manawatu sand dune vegetation. Proc. N. Z. Ecol. Soc. 1970, 17, 41–46. [Google Scholar]
- Fleming, C.A. The geology of Wanganui subdivision, Waverley and Wanganui sheet districts (N137 and N138). N. Z. Geol. Surv. Bull. 1953, 52, 1–362. [Google Scholar]
- Forman, S.L.; Sagintayev, Z.; Sultan, M.; Smith, S.; Becker, R.; Kendall, M.; Marìn, L. The twentieth-century migration of parabolic dunes and wetland formation at Cape Cod National Sea Shore, Massachusetts, USA: Landscape response to a legacy of environmental disturbance. Holocene 2008, 18, 765–774. [Google Scholar] [CrossRef]
- Fruergaard, M.; Kirkegaard, L.; Østergaard, A.T.; Murray, A.S.; Andersen, T.J. Dune ridge progradation resulting from updrift coastal reconfiguration and increased littoral drift. Geomorphology 2019, 330, 69–80. [Google Scholar] [CrossRef]
- Gehrels, W.R.; Hayward, B.W.; Newnham, R.M.; Southall, K.E. A 20th century acceleration of sea-level rise in New Zealand. Geophys. Res. Lett. 2008, 35, L20717. [Google Scholar] [CrossRef]
- Gibb, J.G. Rates of coastal erosion and accretion in New Zealand. N. Z. J. Mar. Freshw. Res. 1978, 12, 429–456. [Google Scholar] [CrossRef]
- Grootjans, A.P.; Adema, E.B.; Bekker, R.M.; Lammerts, E.J. Why coastal dune slacks sustain a high biodiversity. In Coastal Dunes; Springer: Berlin/Heidelberg, Germany, 2004; pp. 85–101. [Google Scholar]
- Hernández-Cordero, A.I.; Hernández-Calvento, L.; Espino, E.P. Relationship between vegetation dynamics and dune mobility in an arid transgressive coastal system, Maspalomas, Canary Islands. Geomorphology 2015, 238, 160–176. [Google Scholar] [CrossRef]
- Hesp, P.A. The Manawatu dunefield: Environmental change and human impacts. N. Z. Geogr. 2001, 57, 33–40. [Google Scholar] [CrossRef]
- Hesp, P.A.; Hyde, R. Flow dynamics and geomorphology of a trough blowout. Sedimentology 1996, 43, 505–525. [Google Scholar] [CrossRef]
- Hesp, P.A.; Pringle, A. Wind flow and topographic steering within a trough blowout. J. Coast. Res. Spec. Issue 2001, 34, 597–601. [Google Scholar]
- Hilton, M.; Woodley, D.; Sweeney, C.; Konlechner, T. The development of a prograded foredune barrier following Ammophila arenaria eradication, Doughboy Bay, Stewart Island. J. Coast. Res. 2009, SI56, 317–321. [Google Scholar]
- Holdaway, R.J.; Wiser, S.K.; Williams, P.A. Status assessment of New Zealand’s naturally uncommon ecosystems. Conserv. Biol. 2012, 26, 619–629. [Google Scholar] [CrossRef] [PubMed]
- Holgate, S.J. On the decadal rates of sea level change during the twentieth century. Geophys. Res. Lett. 2007, 34, L01602. [Google Scholar] [CrossRef] [Green Version]
- Holland, L. The shifting sands of the Manawatu. Soil Water 1983, 19, 3–5. [Google Scholar]
- Jiménez, J.A.; Valdemoro, H.I. Shoreline evolution and its management implications in beaches along the Catalan coast. In The Spanish Coastal Systems; Morales, J.A., Ed.; Springer Nature: Cham, Switzerland, 2019; pp. 745–764. [Google Scholar]
- Johnson, P.N. Naturalised plants in south-west South Island, New Zealand. N. Z. J. Bot. 1982, 20, 131–142. [Google Scholar] [CrossRef]
- Johnson, P.; Rogers, G. Ephemeral wetlands and their turfs in New Zealand. Sci. Conserv. 2003, 230, 1–109. [Google Scholar]
- Johnston, R.M.S. Monitored changes to foredunes on the Rangitikei-Wanganui coast. In Geography and Society in a Global Context, Proceedings of the Fourteenth New Zealand Geography Conference, and Fifty-Sixth ANZAAS Congress (Geographical Sciences), Palmerston North, New Zealand, January 1987; Le Heron, R., Roche, M., Shepherd, M., Eds.; New Zealand Geographical Society: Palmerston North, New Zealand, 1987; pp. 112–114. [Google Scholar]
- Jones, P.S.; Farr, G.; Low, R.; Etherington, J.R. Ecohydrological studies of dune slack vegetation at Kenfig dunes, South Wales, UK. J. Coast. Conserv. 2017, 21, 623–630. [Google Scholar] [CrossRef]
- Kiehl, K.; Isermann, M. Restoration of coastal ecosystems. Coastline Rep. 2007, 7, 1–4. [Google Scholar]
- Kuleli, T.; Guneroglu, A.; Karsli, F.; Dihkan, M. Automatic detection of shoreline change on coastal Ramsar wetlands of Turkey. Ocean. Eng. 2011, 38, 1141–1149. [Google Scholar] [CrossRef]
- McGlone, M.S. Polynesian deforestation of New Zealand: A preliminary synthesis. Archaeol. Ocean. 1987, 18, 11–25. [Google Scholar] [CrossRef]
- McKelvey, P. Sand Forests: A Historical Perspective of the Stabilisation and Afforestation of Coastal Sands in New Zealand; Canterbury University Press: Christchurch, New Zealand, 1999. [Google Scholar]
- Moore, L.J. Shoreline mapping techniques. J. Coast. Res. 2000, 16, 111–124. [Google Scholar]
- Muckersie, C.; Shepherd, M.J. Dune phases as time-transgressive phenomena, Manawatu, New Zealand. Quat. Int. 1995, 26, 61–67. [Google Scholar] [CrossRef]
- Murphy, A.L.; Singers, N.J.; Rapson, G.L. Created dune slack wetlands effectively host rare early successional turf communities in a dynamic dunefield, New Zealand. J. Coast. Conserv. 2019, 23, 203–225. [Google Scholar] [CrossRef]
- Musseau, R.; Boutault, L.; Beslic, S. Rapid losses of intertidal salt marshes due to global change in the Gironde estuary (France) and conservation implications for marshland passerines. J. Coast. Conserv. 2018, 22, 443–451. [Google Scholar] [CrossRef]
- Nga Tipu. Available online: https://nzflora.landcareresearch.co.nz/default.aspx (accessed on 10 January 2022).
- Li, X.; Bellerby, R.; Craft, C.; Widney, S.E. Coastal wetland loss, consequences, and challenges for restoration. Anthr. Coasts 2018, 1, 1–15. [Google Scholar] [CrossRef] [Green Version]
- Pegman, A.P.; Rapson, G.L. Plant succession and dune dynamics on actively prograding dunes, Whatipu Beach, northern New Zealand. N. Z. J. Bot. 2005, 43, 223–244. [Google Scholar] [CrossRef]
- Pérez-Hernández, E.; Peña-Alonso, C.; Fernández-Cabrera, E.; Hernández-Calvento, L. Assessing the scenic quality of transgressive dune systems on volcanic islands. The case of Corralejo (Fuerteventura island, Spain). Sci. Total Environ. 2021, 784, 147050. [Google Scholar] [CrossRef]
- Peyrat, J.; Braun, M.; Dolnik, C.; Isermann, M.; Roweck, H. Vegetation dynamics on the Łeba Bar/Poland: A comparison of the vegetation in 1932 and 2006 with special regard to endangered habitats. J. Coast. Conserv. 2009, 13, 235–246. [Google Scholar] [CrossRef]
- Pickart, A.J.; Hesp, P.A. Spatio-temporal geomorphological and ecological evolution of a transgressive dunefield system, Northern California, USA. Glob. Planet. Chang. 2019, 172, 88–103. [Google Scholar] [CrossRef]
- Pye, K.; Blott, S.J. Evolution of a sediment-starved, over-stabilised dunefield: Kenfig Burrows, South Wales, UK. J. Coast. Conserv. 2017, 21, 685–717. [Google Scholar] [CrossRef]
- Rapson, G.L. Endemic plants of the Manawatū dunes. In Plains’ Science: Inventions, Innovations, and Discoveries from the Manawatū—3; Neall, V.E., Ed.; Royal Society of New Zealand Manawatū Branch and Science Centre: Palmerston North, New Zealand, 2018; pp. 112–123. [Google Scholar]
- Redpath, D.T.; Rapson, G.L. An extreme flood event initiates a decade of stand collapse in Beilschmiedia tawa forest, Turakina Valley, Rangitikei, New Zealand. N. Z. J. Bot. 2015, 53, 38–59. [Google Scholar] [CrossRef]
- Richardson, S.J.; Clayton, R.; Rance, B.D.; Broadbent, H.; McGlone, M.S.; Wilmshurst, J.M. Small wetlands are critical for safeguarding rare and threatened plant species. Appl. Veg. Sci. 2015, 18, 230–241. [Google Scholar] [CrossRef]
- Ripple, W.J.; Wolf, C.; Newsome, T.M.; Galetti, M.; Alamgir, M.; Crist, E.; Mahmoud, M.I.; Laurance, W.F.; 15,364 Scientist Signatories from 184 Countries. World scientists’ warning to humanity: A second notice. BioScience 2017, 67, 1026–1028. [Google Scholar] [CrossRef]
- Robertson, H.A.; Ausseil, A.G.; Rance, B.; Betts, H.; Pomeroy, E. Loss of wetlands since 1990 in Southland, New Zealand. N. Z. J. Ecol. 2019, 43, 1–9. [Google Scholar] [CrossRef] [Green Version]
- Semeniuk, V. New Pleistocene and Holocene stratigraphic units in the Yalgorup Plain area, southern Swan Coastal Plain. J. R. Soc. West. Aust. 2011, 78, 67–79. [Google Scholar]
- Semeniuk, C.A.; Semeniuk, V. Dune slacks in Western Australia. J. R. Soc. West. Aust. 2011, 94, 503. [Google Scholar]
- Shand, R.D.; Shepherd, M.J. Geomorphological Assessment Relating to Natural Character of the Manawatu District Coast; Report to Manawatu District Council; Coastal Systems Limited: Whanganui, New Zealand, 2016; p. 52. [Google Scholar]
- Shanmugam, S.; Barnsley, M. Quantifying landscape-ecological succession in a coastal dune system using sequential aerial photography and GIS. J. Coast. Conserv. 2002, 8, 61–68. [Google Scholar] [CrossRef]
- Singers, N. The Dynamics of Temporary Wetlands in Dune Slacks at Tangimoana, Manawatu, New Zealand with Special Reference to the Endangered Sand Spiked Sedge, Eleocharis neozelandica Kirk (Cyperaceae): A Thesis Submitted in Partial Fulfillment of the Requirements for the Degree of Masters of Science in Ecology at Massey University. Ph.D. Thesis, Massey University, Palmerston North, New Zealand, 1997. [Google Scholar]
- Smith, G.L.; Zarillo, G.A. Calculating long-term shoreline recession rates using aerial photographic and beach profiling techniques. J. Coast. Res. 1990, 6, 111–120. [Google Scholar]
- Takiwa. Available online: https://searise.takiwa.co/map/6233f47872b8190018373db9/embed (accessed on 1 May 2022).
- Thieler, E.R.; Danforth, W.W. Historical shoreline mapping: (I) improving techniques and reducing positioning errors. J. Coast. Res. 1994, 10, 549–563. [Google Scholar]
- Van Ijzendoorn, C.O.; de Vries, S.; Hallin, C.; Hesp, P.A. Sea level rise outpaced by vertical dune toe translation on prograding coasts. Sci. Rep. 2021, 11, 12792. [Google Scholar] [CrossRef]
- Van Roon, M.R. Wetlands in The Netherlands and New Zealand: Optimising biodiversity and carbon sequestration during urbanisation. J. Environ. Manag. 2012, 101, 143–150. [Google Scholar] [CrossRef] [PubMed]
- Villacís Lozada, S.P.; Rapson, G.L. Morphodynamics of short-lived wetlands of coastal dune slacks, Manawatū, New Zealand. Wetl. Ecol. Manag. 2021, 29, 351–367. [Google Scholar] [CrossRef]
- Williams, P.A.; Wiser, S.; Clarkson, B.; Stanley, M.C. New Zealand’s historically rare terrestrial ecosystems set in a physical and physiognomic framework. N. Z. J. Ecol. 2007, 31, 119–128. [Google Scholar]
- Yukhnevich, M. Ephemeral Wetlands of Dune Slacks; How Do Their Environmental Relations Structure Their Patterning? Master’s Thesis, Massey University, Palmerston North, New Zealand, 2015. [Google Scholar]
Figure 1.
Location map of study sites along the Fox-Tangi portion of the Manawatū bight, North Island, New Zealand. Study sites are immediately south of Tangimoana and Himitangi, and north of Foxton Beach. The brown shades are the Holocene dune phases, sensu Muckersie and Shepherd [38], surrounding the study sites.

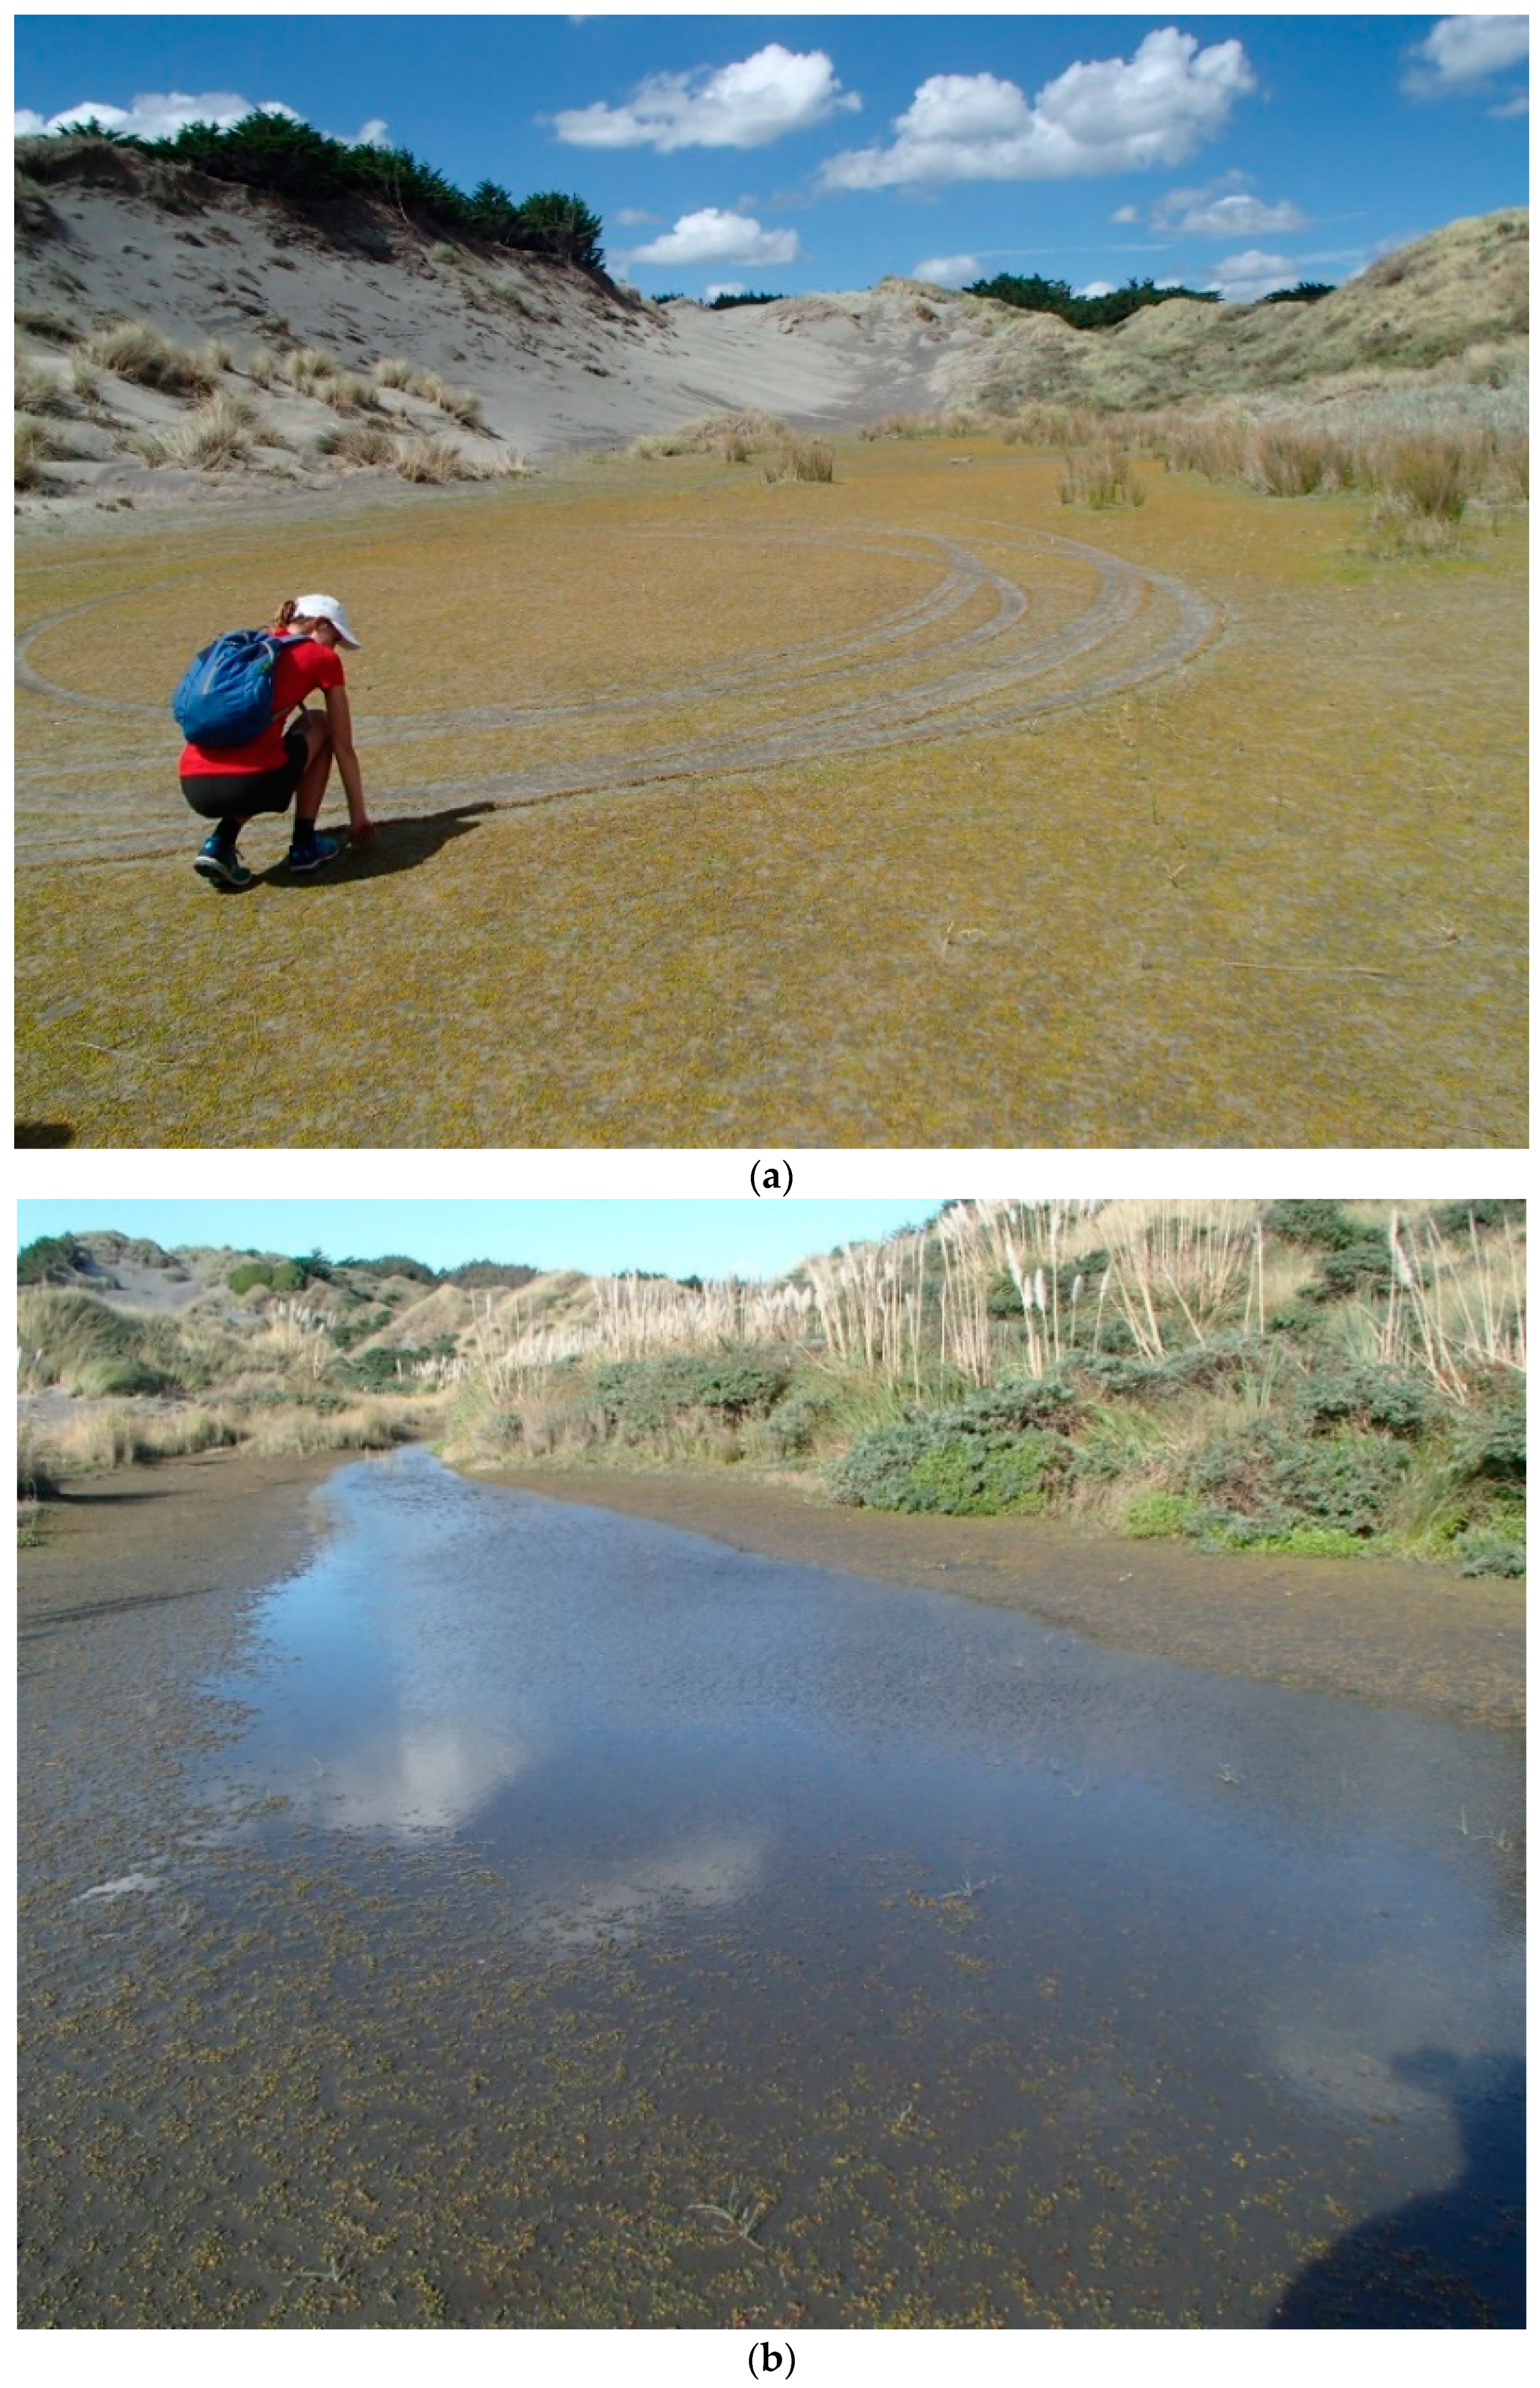
Figure 2.
(a) Well-turfed wetland surrounded by mobile sand dunes and bearing tracks of (illegal) recreational off-road vehicles; Foxton Beach (Wetland F3; 3 March 2018); (b) Young wetland with a floor of Goodenia heenanii turf with scattered Carex pumila tufts, surrounded by invasive alien species on the parabola’s horns; Foxton Beach (upper part of Wetland F2; 25 May 2015). Images: G. Rapson.

Figure 3.
(a) New foredune forming in front of the existing foredune, southern Tangimoana, 5 March 2012. The bluish-green is the native foredune-binder Spinifex sericeus, and the dull-green tufts are alien Ammophila arenaria, all plants being self-introduced. Image: G. Rapson. (b) Oblique aerial from August 2004 of wetlands at Himatangi (H) embedded amongst pine plantation to 10 m tall (dark green). The wetland numbers are as per Villacís Lozada and Rapson [63]. Note the presence of wetlands H3 and H4 in the same parabola, separated by a transgressive dune. Image: Roger Shand.

Figure 4.
Coastal movement rates at the Rangitikei River Mouth, Tangimoana, Himatangi and Foxton Beach against date of imagery. Note that missing bars do not imply values of zero.
Figure 4.
Coastal movement rates at the Rangitikei River Mouth, Tangimoana, Himatangi and Foxton Beach against date of imagery. Note that missing bars do not imply values of zero.

Figure 5.
Distance from the wetlands to the coastline at the time of each image, by year at each of (a) Tangimoana, (b) Himatangi and (c) Foxton Beach. Symbols and colours as per key for each wetland (W) number, regardless of site. Lines are drawn to interpret, not to interpolate. At Tangimoana, wetlands 8 (1958) and 8a (1979–1990) are separate and distinct.

Figure 6.
Location and movement of the centroid of each wetland through time for each of the available images at Tangimoana. The aerial photo of 2012 is used as the basal image. For T7, the wetland did not appear in the image of 1995, and its missing situation is indicated by a query sign.
Figure 6.
Location and movement of the centroid of each wetland through time for each of the available images at Tangimoana. The aerial photo of 2012 is used as the basal image. For T7, the wetland did not appear in the image of 1995, and its missing situation is indicated by a query sign.

Figure 7.
Location and movement of the centroid of each wetland through time in Foxton Beach. The aerial photo of 2012 is used as the basal image. F1 is the W-shaped wetland, formed by coalescence of two adjacent parabolic systems, and kept open by vehicle tracks.
Figure 7.
Location and movement of the centroid of each wetland through time in Foxton Beach. The aerial photo of 2012 is used as the basal image. F1 is the W-shaped wetland, formed by coalescence of two adjacent parabolic systems, and kept open by vehicle tracks.

Figure 8.
Total rainfall by season and by (non-sequential) year of the images of the study sites.

Figure 9.
Fitted lines, colour-coded by study site, for the relationship between (a) the area of each wetland and rainfall in the season of the image, (b) area and coastal progradation rate over the period before the image, and (c) coastal progradation rate against rate of wetland movement inland.
Figure 9.
Fitted lines, colour-coded by study site, for the relationship between (a) the area of each wetland and rainfall in the season of the image, (b) area and coastal progradation rate over the period before the image, and (c) coastal progradation rate against rate of wetland movement inland.


Table 1.
Characteristics of the Fox-Tangi coast and its wetlands. The coefficient is the slope of the rate of change of wetland area or of inland movement with rainfall or with coastal progradation rates. Coefficients are bold if correlations (r2) are >0.5 (including many values of 1, i.e., a line fitted to only 2 points, for Himatangi and 1–2 for the other sites), and in italics if <0.4, with normal font for values in between. NA = not appropriate, due to few images covering Himatangi.
| Tangimoana | Himatangi | Foxton Beach | |
|---|---|---|---|
| Length of the coastline studied (m) | 1300 | 1500 | 1200 |
| Wetland number (natural) | 9 | 22 | 16 |
| Number of points re coastline measurements | 16 | 17 | 9 |
| Mean annual coastline movement (m yr−1) | 1.1 ± 0.7 | 0.7 ± 0.1 | 1.2 ± 0.2 |
| Mean distance from wetland to coast (m) | 334 ± 16 | 395 ± 39 | 227 ± 17 |
| Mean annual movement of wetlands (m yr−1) | 7.7 ± 1.1 | 2.1 ± 1.5 | 6.0 ± 1.0 |
| Mean annual inland movement of wetlands (m yr−1) | 3.7 ± 1.6 | NA | 2.1 ± 4.5 |
| Coefficient of rainfall by season of image (cm season−1) against wetland area (m2) | 24.1 | −9.1 | −29.4 |
| Coefficient of rainfall by year (cm yr−1) against wetland area (m2) | 26.4 | −94.6 | 11.4 |
| Coefficient of normalised rainfall (cm yr−1) against wetland area as a proportion of maximum | −0.001 | 0.006 | −0.003 |
| Coefficient of coastal progradation rate (m yr−1) against wetland area (m2) | −324.7 | 1289.5 | 919.1 |
| Coefficient of coastal progradation rate (m yr−1) against rate of wetland movement inland (m yr−1) | −0.69 | −23.76 | −3.41 |
Publisher’s Note: MDPI stays neutral with regard to jurisdictional claims in published maps and institutional affiliations. |
© 2022 by the authors. Licensee MDPI, Basel, Switzerland. This article is an open access article distributed under the terms and conditions of the Creative Commons Attribution (CC BY) license (https://creativecommons.org/licenses/by/4.0/).
Share and Cite
MDPI and ACS Style
Villacís Lozada, S.P.; Rapson, G.L. Coastal Dynamics Initiate, Relocate and Terminate Short-Lived Wetlands of Dune Slacks, Manawatū, New Zealand. Land 2022, 11, 980. https://0-doi-org.brum.beds.ac.uk/10.3390/land11070980
AMA Style
Villacís Lozada SP, Rapson GL. Coastal Dynamics Initiate, Relocate and Terminate Short-Lived Wetlands of Dune Slacks, Manawatū, New Zealand. Land. 2022; 11(7):980. https://0-doi-org.brum.beds.ac.uk/10.3390/land11070980
Chicago/Turabian StyleVillacís Lozada, Sylvia P., and Gillian L. Rapson. 2022. "Coastal Dynamics Initiate, Relocate and Terminate Short-Lived Wetlands of Dune Slacks, Manawatū, New Zealand" Land 11, no. 7: 980. https://0-doi-org.brum.beds.ac.uk/10.3390/land11070980
Note that from the first issue of 2016, this journal uses article numbers instead of page numbers. See further details here.