
Spatial Distribution and Driving Forces of the Vegetable Industry in China

1
College of Economics and Management, Nanjing Agricultural University, Nanjing 210095, China
2
Institute of Agricultural Economics and Development, Jiangsu Academy of Agricultural Sciences, Nanjing 210014, China
*
Author to whom correspondence should be addressed.
Land 2022, 11(7), 981; https://0-doi-org.brum.beds.ac.uk/10.3390/land11070981
Submission received: 23 May 2022
/
Revised: 24 June 2022
/
Accepted: 24 June 2022
/
Published: 28 June 2022
(This article belongs to the Special Issue Sustainable Rural Development: Strategies, Good Practices, and Opportunities Ⅱ)
Abstract
:Based on the ArcGIS geostatistical analysis method, this study offers a visualization of the spatial distribution pattern and spatial trend of vegetable production in China. The research also examines the degree of spatial agglomeration patterns of vegetable production by using the standard deviation ellipse technique and exploratory spatial data analysis method. In addition, we employ the spatial regression model partial differential method to explore the driving factors leading to the changing layout of vegetable production. The findings unveil that vegetable production in China exhibit strong spatial non-equilibrium characteristics, with “high-high” and “low-low” types as the main agglomeration patterns. Furthermore, the location distribution shows a northeast–southwest orientation with the center of gravity of distribution gradually directed toward the southwest. Regarding driving factors, the results show that the effective irrigated area of natural factors had a facilitating effect on the layout of vegetable production, while the affected area had an inhibiting effect on it. Climate indicators such as temperature, precipitation and light show different degrees of influence on the layout of vegetable production. The level of urbanization and transportation conditions have a negative impact on the layout of production in the region. Market demand has a positive spillover effect on the layout of local vegetable production, while it has a negative spillover effect on other regions. Technological progress shows positive spillover effects on the layout of vegetable production in the region and other regions. Financial support policy also shows positive effects from an overall perspective.
1. Introduction
The vegetable sector is a pillar sector of any national economy, playing a vital role in increasing farmers’ incomes and promoting employment, as well as transforming agriculture. In the context of China, it also plays an irreplaceable role in optimizing planting structure and boosting rural economic development. The vegetable-sown area in China in 2019 reached 20,862,700 hectares, and production spiked up to 721 million tons, with a per capita possession of about 515.86 kg. China is both acknowledged as a large producer and consumer of vegetables. According to the Food and Agricultural Organization of the United Nations (FAO, 2019), China’s vegetable-sown area and production accounted for 52.25% and 58.31% of the world’s total planted area and production, and it ranked first in the world.
At present, the development of China’s vegetable industry has achieved remarkable results. However, there are still problems such as unbalanced spatial development and low degree of organization, especially the unbalanced spatial development of the vegetable industry, which has seriously hindered the development and growth of a high-quality agricultural economy. The spatial distribution of vegetable production has dramatically changed in China due to increasing marketization in agriculture, population growth, and rapid urbanization [1,2,3,4]. Moreover, the vegetable sector faces many other challenges, such as rapidly rising production costs, price volatility, and consumers’ increasing concern for product quality and safety. These issues arise from structural, seasonal and regional imbalances between vegetable supply and demand, and they are closely related to spatial distribution, as well as to the organization and management of vegetable production, such as the increasing issues of excess capacity in the vegetable sector [5,6,7].
Along with the strong promotion of agrarian supply-side structural reform, the agricultural production structure urgently needs adjustment. The report of the Central Government (2021) pointed out the need to build a modern rural industrial system, modern agricultural industrial parks, strong agricultural industry towns, and advantageous special industrial clusters. The Fourteenth Five-Year Plan for National Economic and Social Development of the People’s Republic of China and the Outline of the Vision 2035 (the Fourteenth Five-Year Plan) also emphasizes the modification of agricultural structure, optimizing the layout of agricultural production, building advantageous agricultural product industry belts, and promoting strategic areas with special agricultural products to boost rural revitalization. Against this backdrop, it is of great particular significance to examine the spatial agglomeration characteristics of China’s vegetable industry and its evolutionary trends and explore the driving factors of its layout changes to promote the rural revitalization broadly and to accelerate the development of agricultural and rural modernization.
Agricultural Location Theory was first introduced by German agricultural economist von Thunen in 1826 [8]. It was proposed that the pattern of agricultural production is a concentric circle structure with a circle distribution centered on cities. Farmers’ production decisions are influenced to a large extent by geographical location. Vegetables are located in the first circle, i.e., the free farming circle. Along with the gradual advancement of the market economy and the booming infrastructure and transportation industry, this theory has encountered significant practical challenges [9]. In the 1990s, Krugman, a representative of the new economic geography theory, refined this theory by adding spatial analysis. Given the assumption of increasing returns and imperfect competition, Krugman analyzed the mechanism of spatial agglomeration from the perspectives of economies of scale, transportation costs and market demand [10]. The relationship between industrial agglomeration and regional economic growth was explored. The study proposed that industrial agglomeration formation is a trade-off between increasing returns to scale and transportation costs, inferring that industrial agglomeration provides economic benefits to the residents. In contrast, those residents who belong to non-agglomeration areas are not likely to avail such benefits due to increased distance issues. The new economic sociology represented by Granovetter considers institutions, culture, knowledge, and geographical location as crucial factors of spatial agglomeration [11].
In the context of agricultural production, various scholars and researchers have directed their attention to the spatial distribution phenomenon to reveal the agricultural production layout in the context of food crops, cash crops, and animal husbandry. A large amount of literature has emerged on studying spatial layout variation of food crops [12,13,14,15]. In the context of cash crops, the main emphasis is given to analyzing the production layout changes in the apple [16,17] and cotton commodities [18]. In the context of the spatial layout of the vegetable industry, Bao et al. [19] revealed that comparative advantage, non-farm employment opportunities, transportation conditions, and urbanization level are the main reasons affecting the layout of the vegetable industry. Technological progress has less influence on the layout of the vegetable industry. In addition, in the spatial layout of the livestock industry [20], many studies explored the spatial layout of the dairy industry [21,22] and the layout of pig production [23,24].
In the existing literature, a handful of studies analyzed the spatial pattern and dynamic changes in vegetable production in China; however, these studies have several limitations. First, most of the studies in the prevailing literature used location entropy or production concentration index to measure the degree of agglomeration in the vegetable industry. These studies failed to provide a clear picture of agglomeration characteristics from a spatial perspective. Second, the study of vegetable production layout involved different regions’ natural resource endowment characteristics and failed to consider spatial factors. Still, the studies that used spatial econometric models to explore the driving factors of the change in vegetable production layout are relatively rare. Based on these backdrops, the marginal academic contribution of this paper is to discuss in depth the distribution pattern and evolution trend of vegetable production in China. The study further attempts to explore the degree of spatial agglomeration and the spatial agglomeration pattern of vegetable production in China using the standard deviation ellipse technique and exploratory spatial data analysis methods. The study constructed an analytical framework for assessing the influence mechanism and employed the partial differential method of spatial regression model to examine the influencing factors of the changing layout of vegetable production in China based on the spatial perspective. The outcome of this study provides empirical evidence to boost the decision-making concerning optimizing the layout of vegetable production in China.
Thus, the rest of this study is structured as follows: Section 2 theoretically discusses the influencing factors of vegetable production layout. Section 3 introduces the data and primary methods used in the analysis. Section 4 provides a descriptive analysis of the spatial distribution and spatial agglomeration of the vegetable industry in China. In addition, we also use a spatial econometric model to empirically analyze the factors affecting the vegetable production layout. Section 5 concludes with a summary of the major findings and policy implications.
2. Theoretical Framework
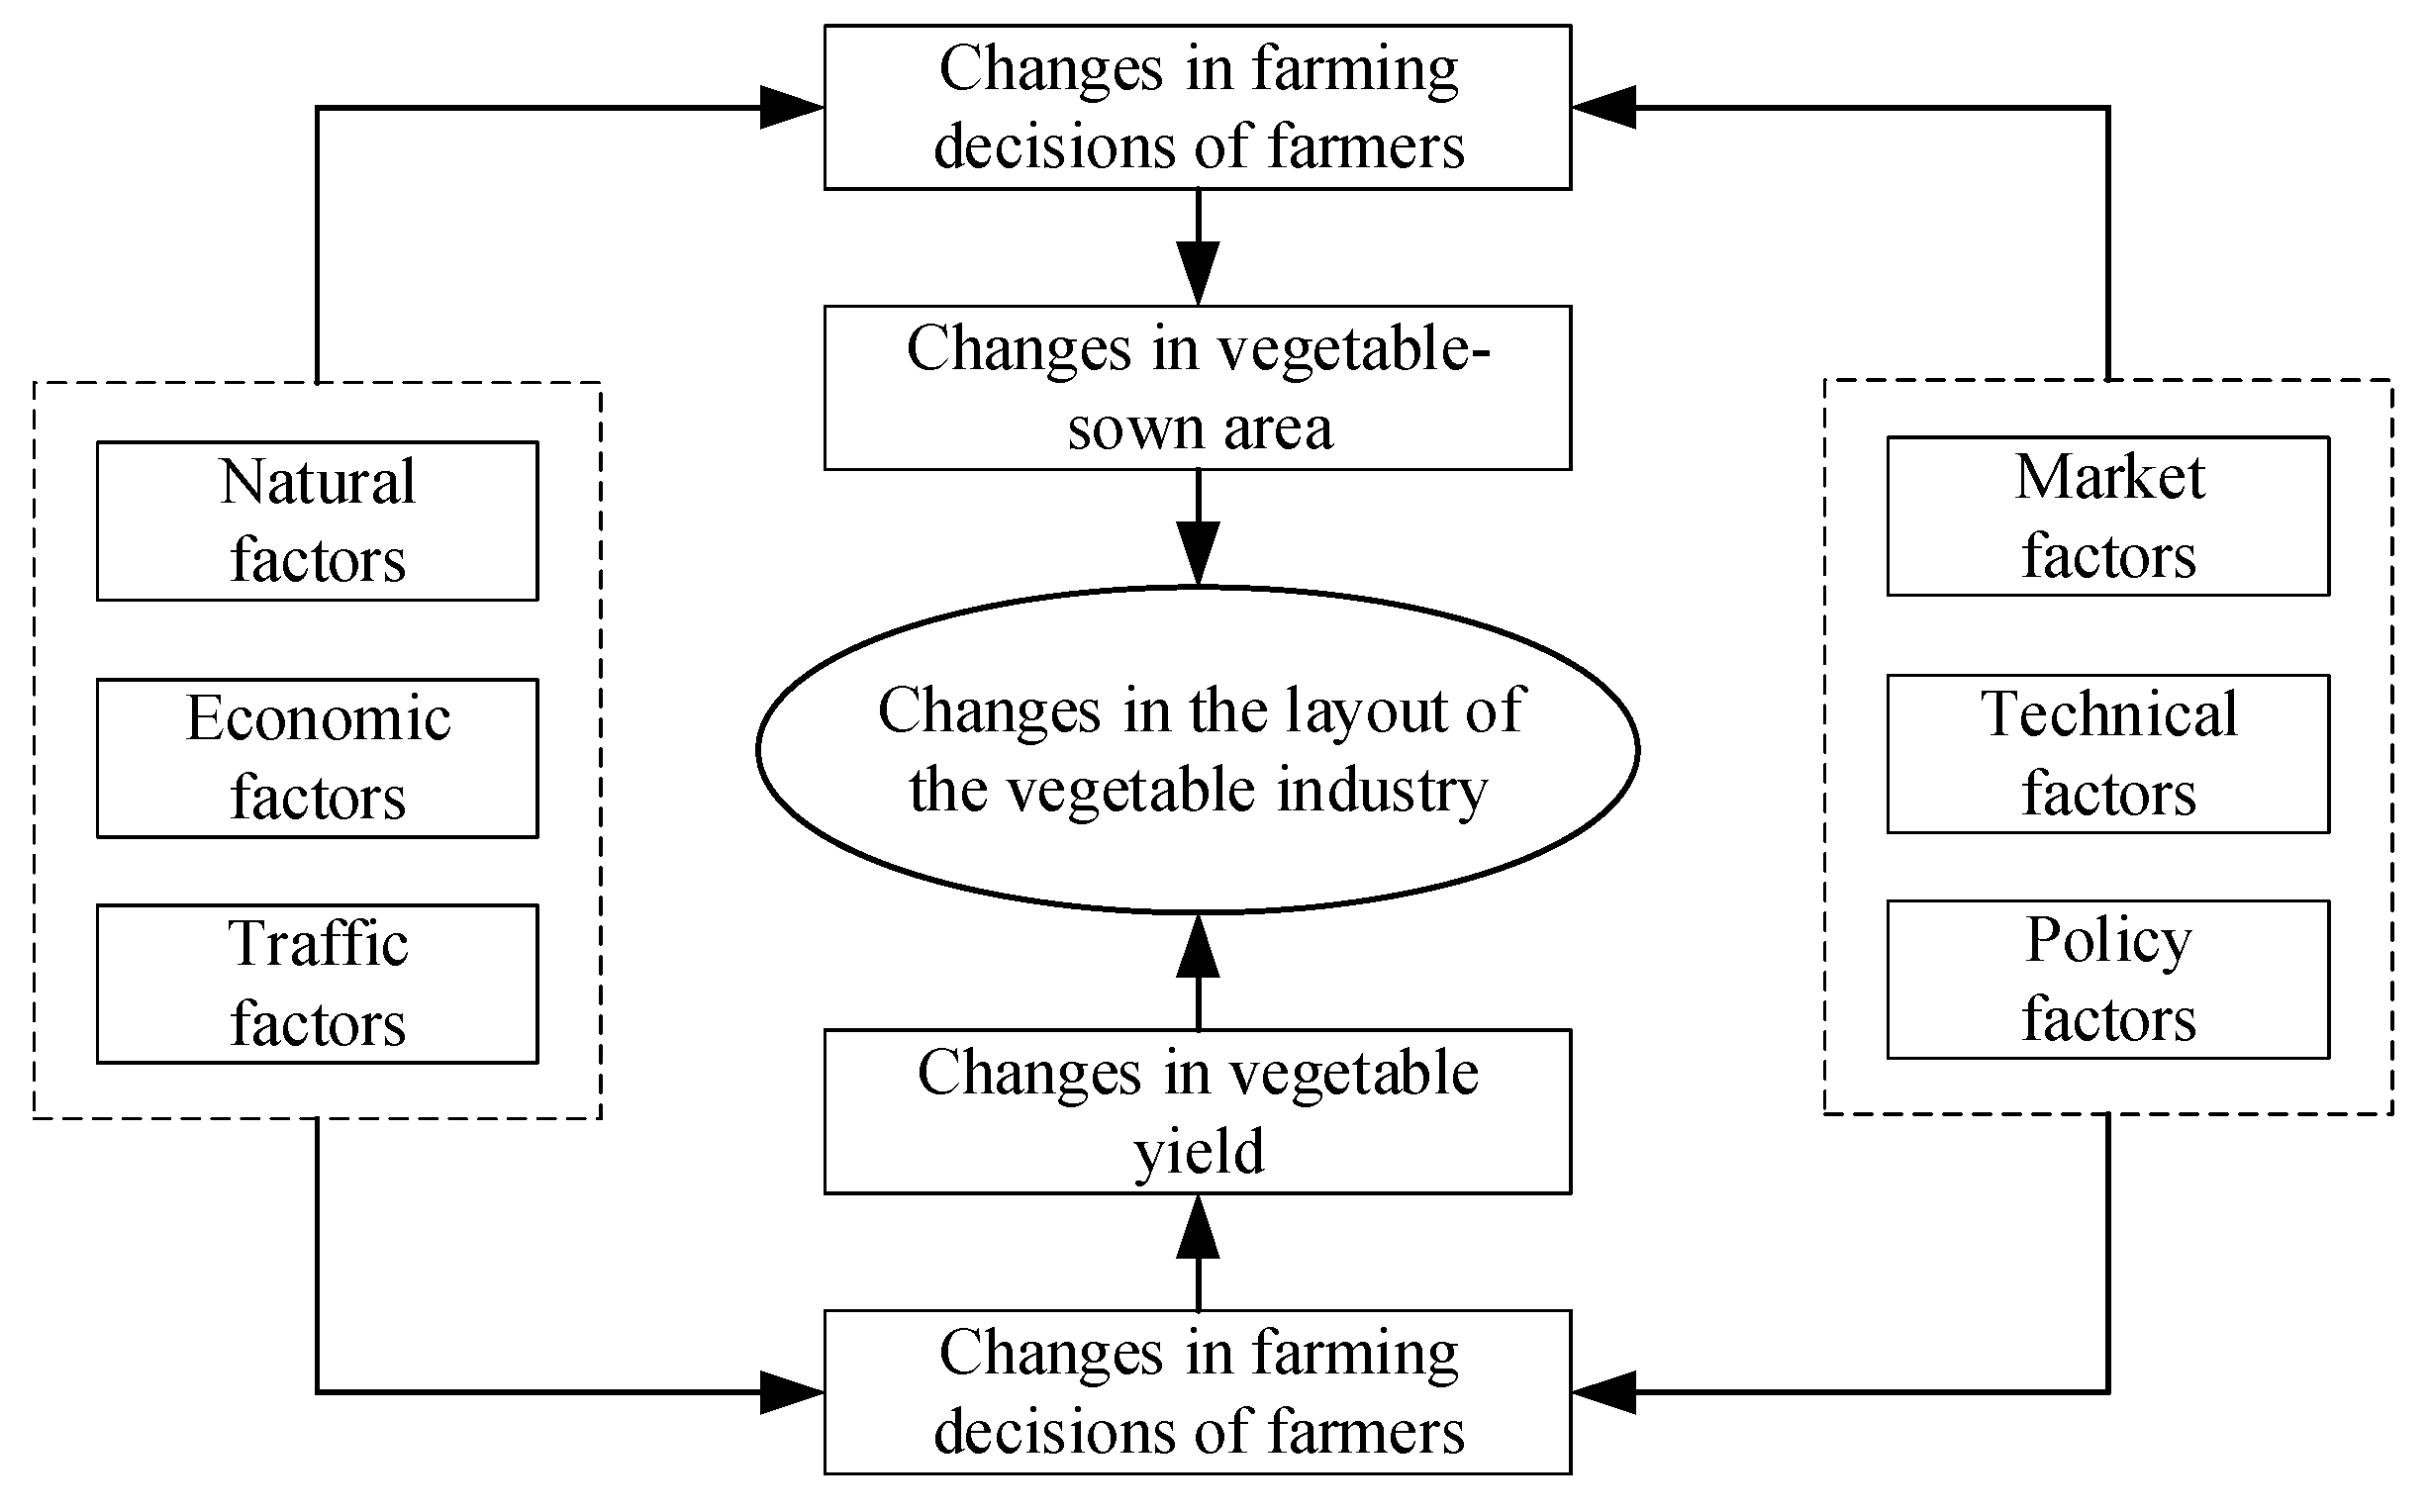
A mature and complete theoretical analysis framework has not been developed for the spatial aggregation of vegetable production. The change in vegetable production layout in China is the result of the combined effect of natural, economic, transportation, market, technology, and policy factors. Among them, natural factors are the most direct factors that cause the change in vegetable production layout, while economic, transportation, market, and technology factors have indirect effects on the shift in production layout by affecting the cost and income of vegetable cultivation. The above factors influence the vegetable planting decision of farmers, which in turn affects the change of vegetable planting area and yield, leading to a shift in vegetable production layout. This study analyzes the influence mechanism of changing vegetable production layout in China based on agricultural location theory, industrial layout theory, and new economic geography theory. It constructs a theoretical analysis framework regarding natural resource endowment, urbanization level, and transportation conditions (see Figure 1).
(1) Vegetable cultivation is subject to the dual constraints of natural resources and natural disasters. China is a vast country with large differences in resource endowments among regions, and vegetable cultivation requires suitable natural conditions such as temperature, precipitation, sunshine hours and irrigation; conversely, agriculture is weak and vulnerable to natural disasters, and the occurrence of natural disasters such as floods, droughts and vegetable pests and diseases can reduce vegetable yields and affect farmers’ planting decisions in the following year, thus leading to changes in vegetable planting areas and products. Therefore, this paper takes natural conditions as the primary factor influencing the shift in vegetable production layout, and natural resources are expected to positively impact the layout structure of the vegetable industry. In contrast, natural disasters are to negatively impact the layout of vegetable production.
(2) With the development of the economy, the urbanization process is accelerating, non-farm employment opportunities are increasing, part-time employment is becoming more prominent, a large number of rural laborers are moving to the cities, the opportunity cost of farmers increases, and the accelerated urbanization process is likely to make farmers lack comparative advantage in vegetable farming. Therefore, farmers will adjust their vegetable planting decisions after weighing the income from vegetable planting and non-farm income, thus causing changes in vegetable planting scale and production.
(3) Location theory believes that transportation cost plays a key role in the location choice of economic activities, and convenient transportation conditions can reduce transportation costs and promote the rational layout of the agricultural industry. Vegetables have high water content, short shelf life, and are highly perishable; conversely, residents have extremely high requirements for the freshness of vegetables. This determines that only convenient transportation conditions and developed transportation facilities can realize long-distance transportation and sales of vegetables. In addition, the continuous improvement of transportation conditions is an important driving factor for the restructuring of agricultural production [25]. Therefore, the development of transportation infrastructure has become an important factor in the current changes in the layout of the agricultural output.
(4) Market demand has a vital role in promoting the change in vegetable production layout. Along with the deepening of market-oriented reform, people’s living standards have improved, food consumption demand has gradually changed from subsistence to quality, and vegetable production is increasingly influenced by market demand.
(5) The vegetable industry is not only labor intensive but also technology intensive. As agricultural technology improves the yield of different crops to different degrees, it may affect the comparative returns of vegetable cultivation, which in turn affects the motivation of vegetable farmers to cultivate vegetables, thus making changes in the scale and yield of vegetable production. In addition, there are regional differences in technological advances in vegetable cultivation, which have different effects on the layout of vegetable production.
(6) From Porter’s diamond model, it is known that the development of an industry cannot be separated from the support of government policies. The government provides farmers with subsidies, credit, and information related to vegetable production will greatly increase farmers’ motivation to grow vegetables, thus affecting the changes in vegetable cultivation scale and output.
3. Data Sources and Research Methodology
3.1. Data Sources
In the analysis of the characteristics of the changing layout of vegetable production in China, this paper uses the data on vegetable-sown area and production by province in China from 2010 to 2019 for spatial visualization, and the data are obtained from the China Rural Statistical Yearbook. In the analysis of the drivers of changes in the layout of vegetable production in China, the data sources of the variables used in this paper are as follows.
3.2. Study Variables
3.2.1. Explained Variables
To explore the changes layout of vegetable production in this paper, the current study used the proportion of vegetable-sown area in each province to the total vegetable planted area in the country and the proportion of vegetable output in each region to the total vegetable output in the country as a proxy variable.
3.2.2. Explanatory Variables
The explanatory variables employed in the study include natural factors, economic factors, transportation factors, market factor, technology factor and policy factor.
(1) Natural factors: In this paper, the indicators of effective irrigated area, affected area, temperature, precipitation and sunshine hours are selected as proxy variables for the natural factors of changes in vegetable production layout. The data on the effective irrigated area, and the affected area of vegetables are obtained by estimation. The specific calculation methods are as follows: effective irrigated area of vegetables = effective irrigated area of crops × (vegetable-sown area ÷ total sown area of crops); affected area of vegetables = affected area of crops × (vegetable-sown area ÷ total sown area of crops), and to ensure data stability, these variables are treated as logarithms in this paper. The data of effective irrigated area and total sown area of crops are obtained from the official website of National Bureau of Statistics (https://data.stats.gov.cn), and the area of crops affected and vegetable-sown area are obtained from China Rural Statistical Yearbook. Climate data on temperature, precipitation and sunshine from the National Meteorological Information Center—China Meteorological Data Network (http://data.cma.cn).
(2) Economic factors: The level of urbanization is an important indicator of regional economic development and the proportion of urban population to total population is used to indicate the level of urbanization in the region. These data are obtained through the official website of the National Bureau of Statistics (https://data.stats.gov.cn).
(3) Traffic factors: We used the road density as a proxy variable for the traffic factor, which is expressed as the ratio of road mileage in each province to the administrative area of that province. The road mileage data are obtained from the official website of the National Bureau of Statistics (https://data.stats.gov.cn).
(4) Market factors: In order to reflect the market demand of different provinces, this paper adopts retail sales of social consumer goods as the proxy variable of vegetable market demand, and in order to eliminate the influence of non-smoothness of data on the empirical results, this paper legalizes it, and the data are obtained from the China Rural Statistical Yearbook.
(5) Technical factors: With the continuous innovation and promotion of agricultural technology, the level of vegetable yields continues to improve. In this paper, the total power of agricultural machinery is used as a proxy variable for technological progress in agriculture. The data are obtained through the official website of the National Bureau of Statistics (https://data.stats.gov.cn).
(6) Policy factors: The government’s financial support policy for agriculture will make farmers more motivated to grow vegetables. In this paper, the share of local fiscal expenditure on agriculture, forestry, and water affairs in local fiscal general budget expenditure is used to indicate the financial support policy for agriculture. The data on local fiscal spending on agriculture, forestry, and water affairs and local fiscal general budget expenditure were obtained from the official website of the National Bureau of Statistics (https://data.stats.gov.cn). Table 1 reports the definitions and descriptive statistics results of each variable.
3.3. Research Methodology
3.3.1. Standard Deviational Ellipse (SDE)
Unlike the previous studies, who used the production concentration index, Herfindahl–Hirschman index, dispersion in probability statistics, and locational entropy, standard deviational ellipse to characterize the spatial aggregation of vegetable production in China, the current paper used the Standard Deviational Ellipse to reveal the spatial agglomeration characteristics of vegetable production, proposed by Lefever [26], which can accurately show the spatial distribution and spatial and temporal evolution of geographical factors. The main advantage of ellipse distribution range is that it can broadly indicate the main area of vegetable production distribution in China, the mean center can describe the center of gravity of vegetable production layout and indicate the relative position of vegetable production distribution in China, the azimuth reflects the main trend direction of vegetable production distribution in China, the long half-axis characterizes the main distribution direction of vegetable production, and the short half-axis the dispersion degree of vegetable production [27,28], which can be calculated by Equations (1)–(4).
Where (, ) is the spatial coordinate of the study area; (, ) is the relative coordinate of (, ) from the center of the distribution; wi denotes the weight; θ is the azimuth of the standard deviation ellipse, i.e., the angle of clockwise rotation in the due north direction to the long axis of the standard deviational ellipse; and denote the standard deviation on the x and y axes, respectively. At present, this method has been widely used in economics. Meanwhile, this paper draws on the spatial agglomeration degree calculation method of Zhao L. and Zhao Z. to calculate the spatial agglomeration degree of China’s vegetable industry [28], which is spatially agglomerated if the vegetable distribution ellipse area is significantly larger (or smaller) than the benchmark distribution ellipse. The formula for calculating the spatial agglomeration degree is A =|1− [Area(vegetable industry distribution ellipse)/Area(benchmark distribution ellipse)]|.
3.3.2. Exploratory Spatial Data Analysis Method (ESDA)
To further investigate the spatial agglomeration characteristics and spillover effects, the spatial correlation of vegetable production agglomeration in China was examined by using the global and local spatial correlation indices in Exploratory Spatial Data Analysis (ESDA). The global spatial correlation is measured by Moran’s I index, which is calculated by Moran [29] and Anselin [30]. Local spatial correlations and spatial clustering characteristics are described by plotting Moran’s scatter plot. The weight matrix used in this paper is the economic, spatial weight matrix (W), where i and j represent cell i and j, respectively, E is a matrix describing the inter-regional variability, and yit is the actual regional value added of the primary industry in the ith province in year t, calculated as , .
3.3.3. Spatial Durbin Model (SDM)
Following the notion of LeSage and Pace [31], the Spatial Durbin Model (SDM) is constructed, which considers the spatial spillover effects of both the explained and explanatory variables and solves the problems of variable omission and endogeneity to a certain extent, and the general form of the model is set as follows.
In Equation (5), the explanatory variable Y denotes the change in the layout of vegetable production; the is a constant term, Zn is the N × 1 unit matrix, N is the number of provinces, W is the economic spatial weight matrix, X represents the explanatory variables, WY and WX consider the spatial dependence of the explained and explanatory variables, respectively, and is the model error term.
To ensure the robustness of the estimation results, following the idea of Elhorst [32], the current study applies the Wald test to discern whether the spatial Durbin model can be transformed into a Spatial Lag Model (SLM) and a Spatial Error Model (SEM). If the test results significantly reject the original hypothesis, then the spatial Durbin model is better than the SLM and the SEM.
4. Results
4.1. Spatial Distribution and Spatial Trends of Chinese Vegetable Industry
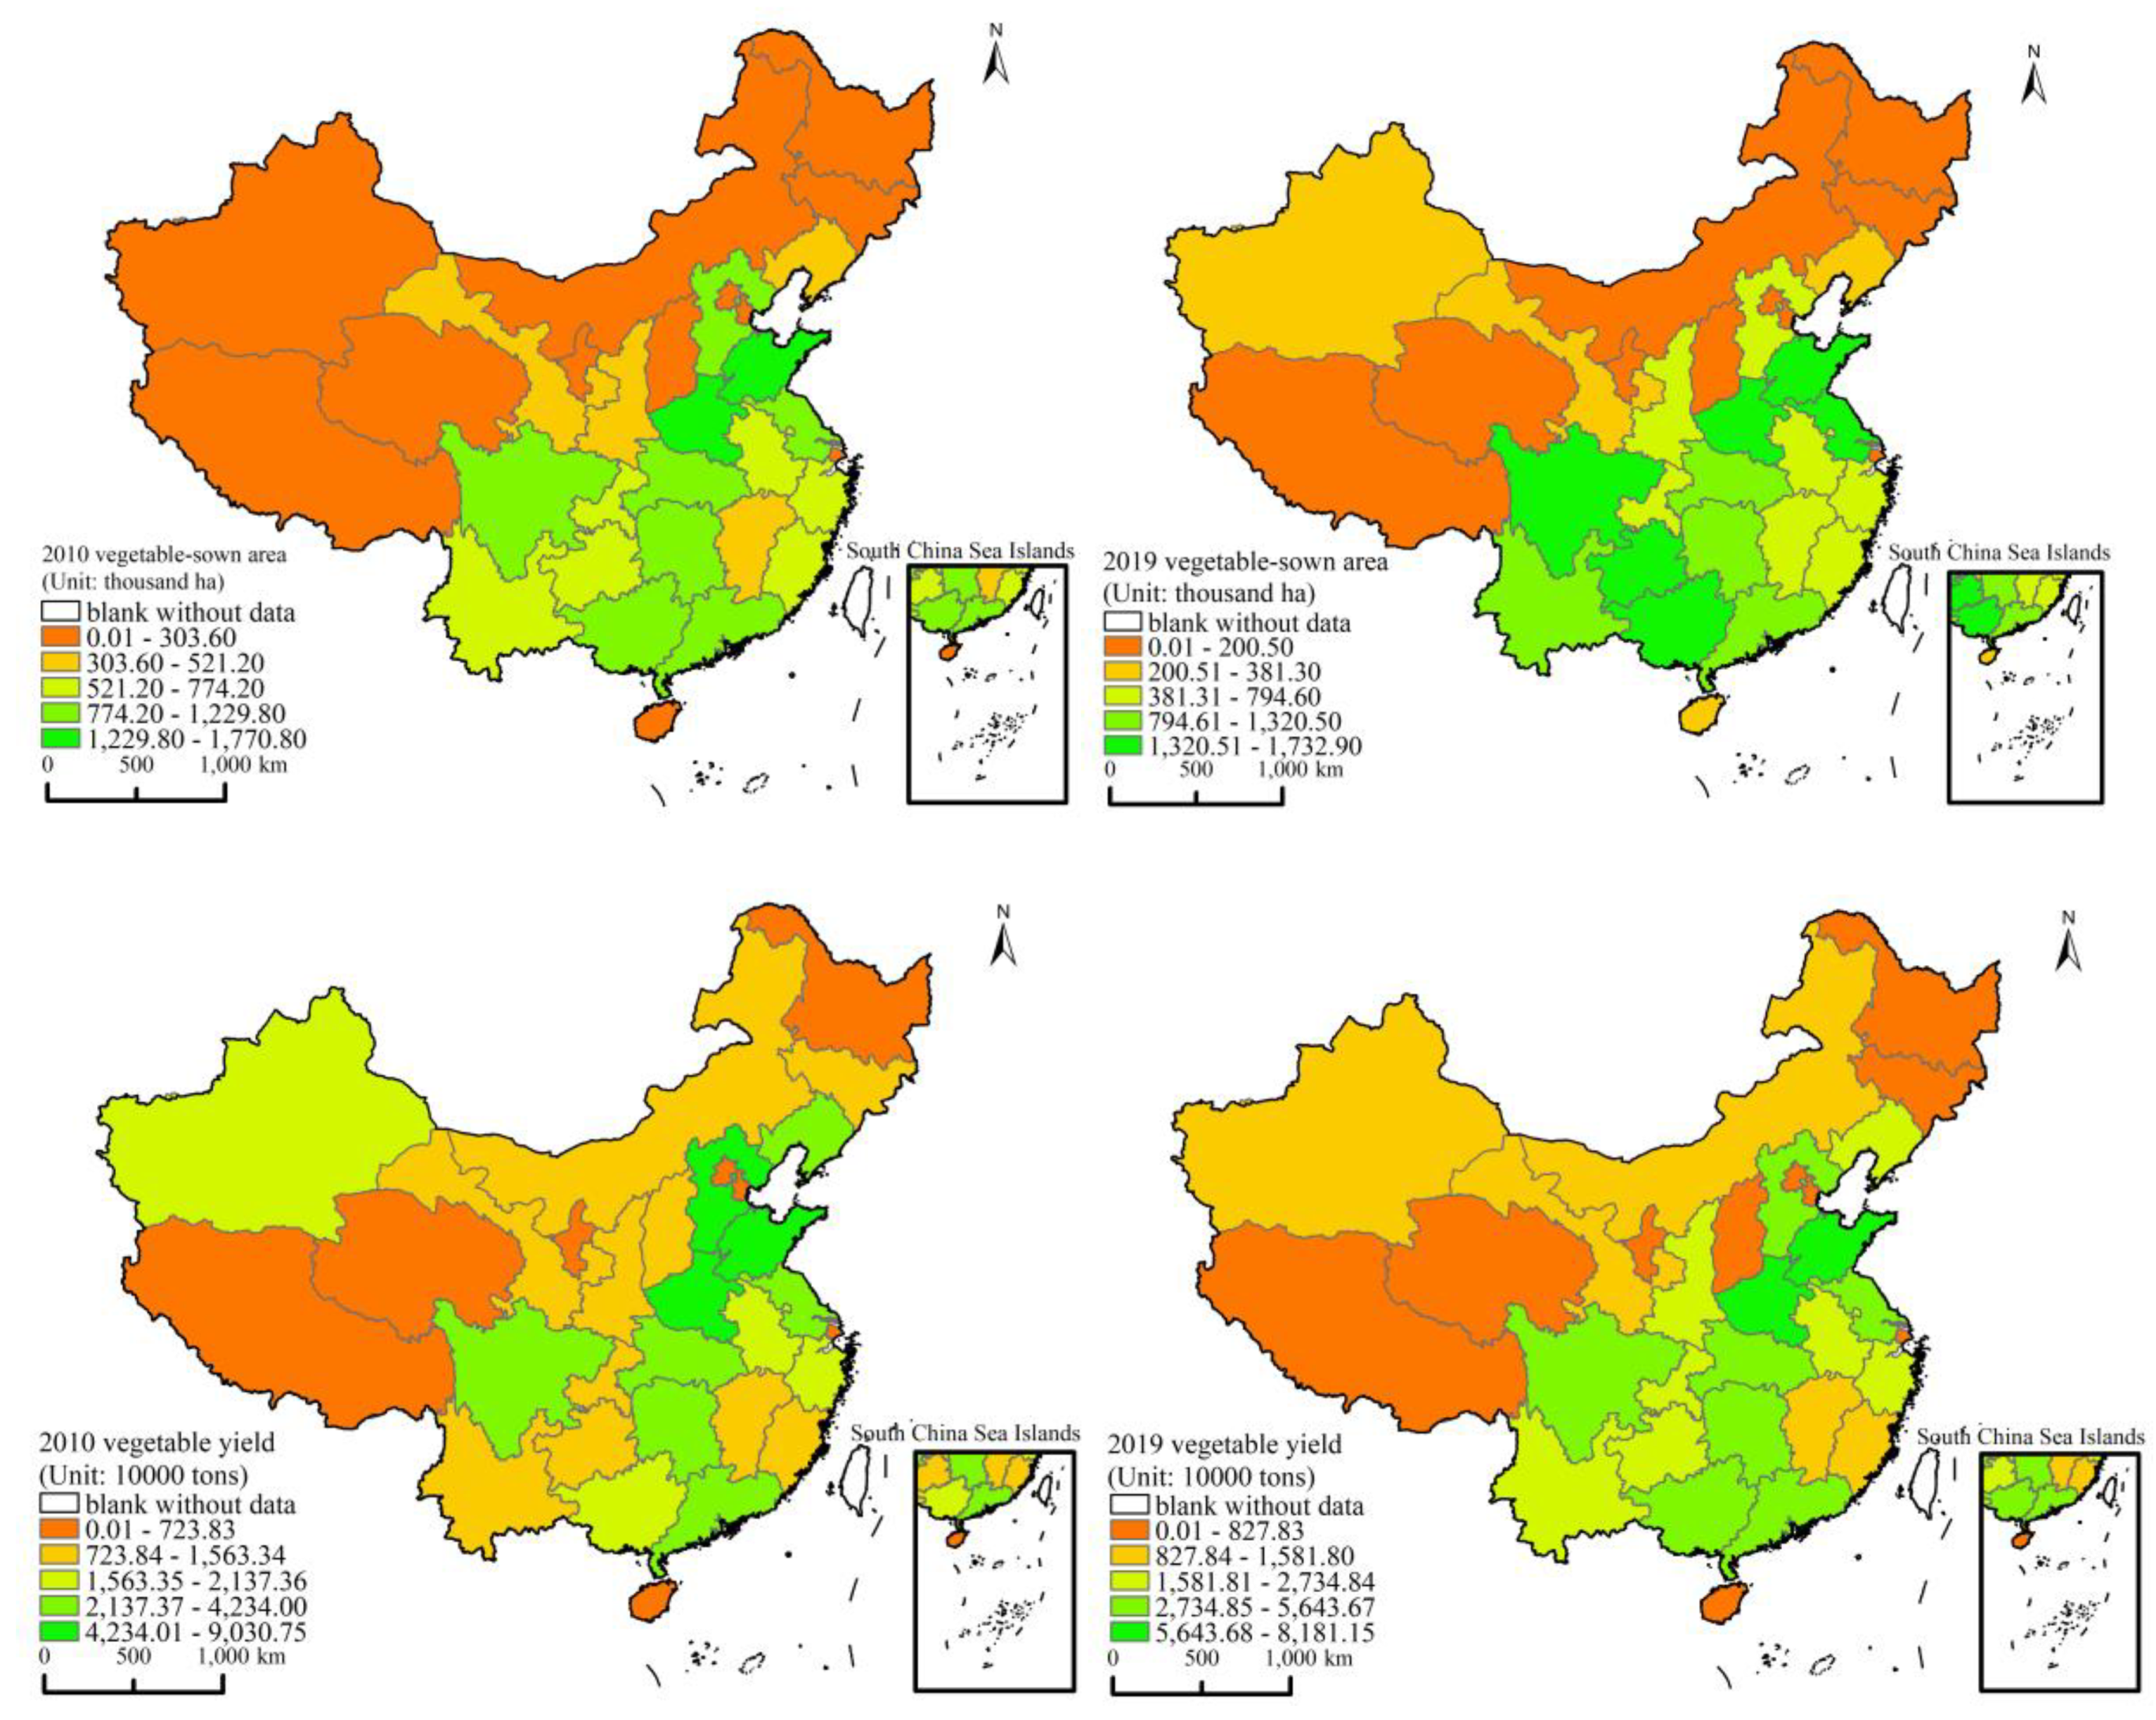
To visually demonstrate the characteristics of the changing layout of Chinese vegetable production, this paper draws the spatial distribution pattern of the vegetable-sown area and production in 2010 and 2019 based on ArcGIS geostatistical software as shown in Figure 2.
It can be seen from the figure that the development of China’s vegetable industry shows obvious spatial non-equilibrium characteristics. China’s vegetable planting was mainly located in Shandong and Henan provinces in 2010; while in 2019, the main vegetable planting provinces added Jiangsu and Sichuan provinces, and the planting area was also expanded. Comparatively 2010, the overall growth of vegetable production in 2019 increased specifically in the areas of Shandong, Henan, and other large agricultural areas. Overall, the regional differences in the development of China’s vegetable industry are more obvious; the development of the vegetable industry in the eastern and south region is better than the western and northern region, respectively, which reveals the importance of exploring spatial synergy.
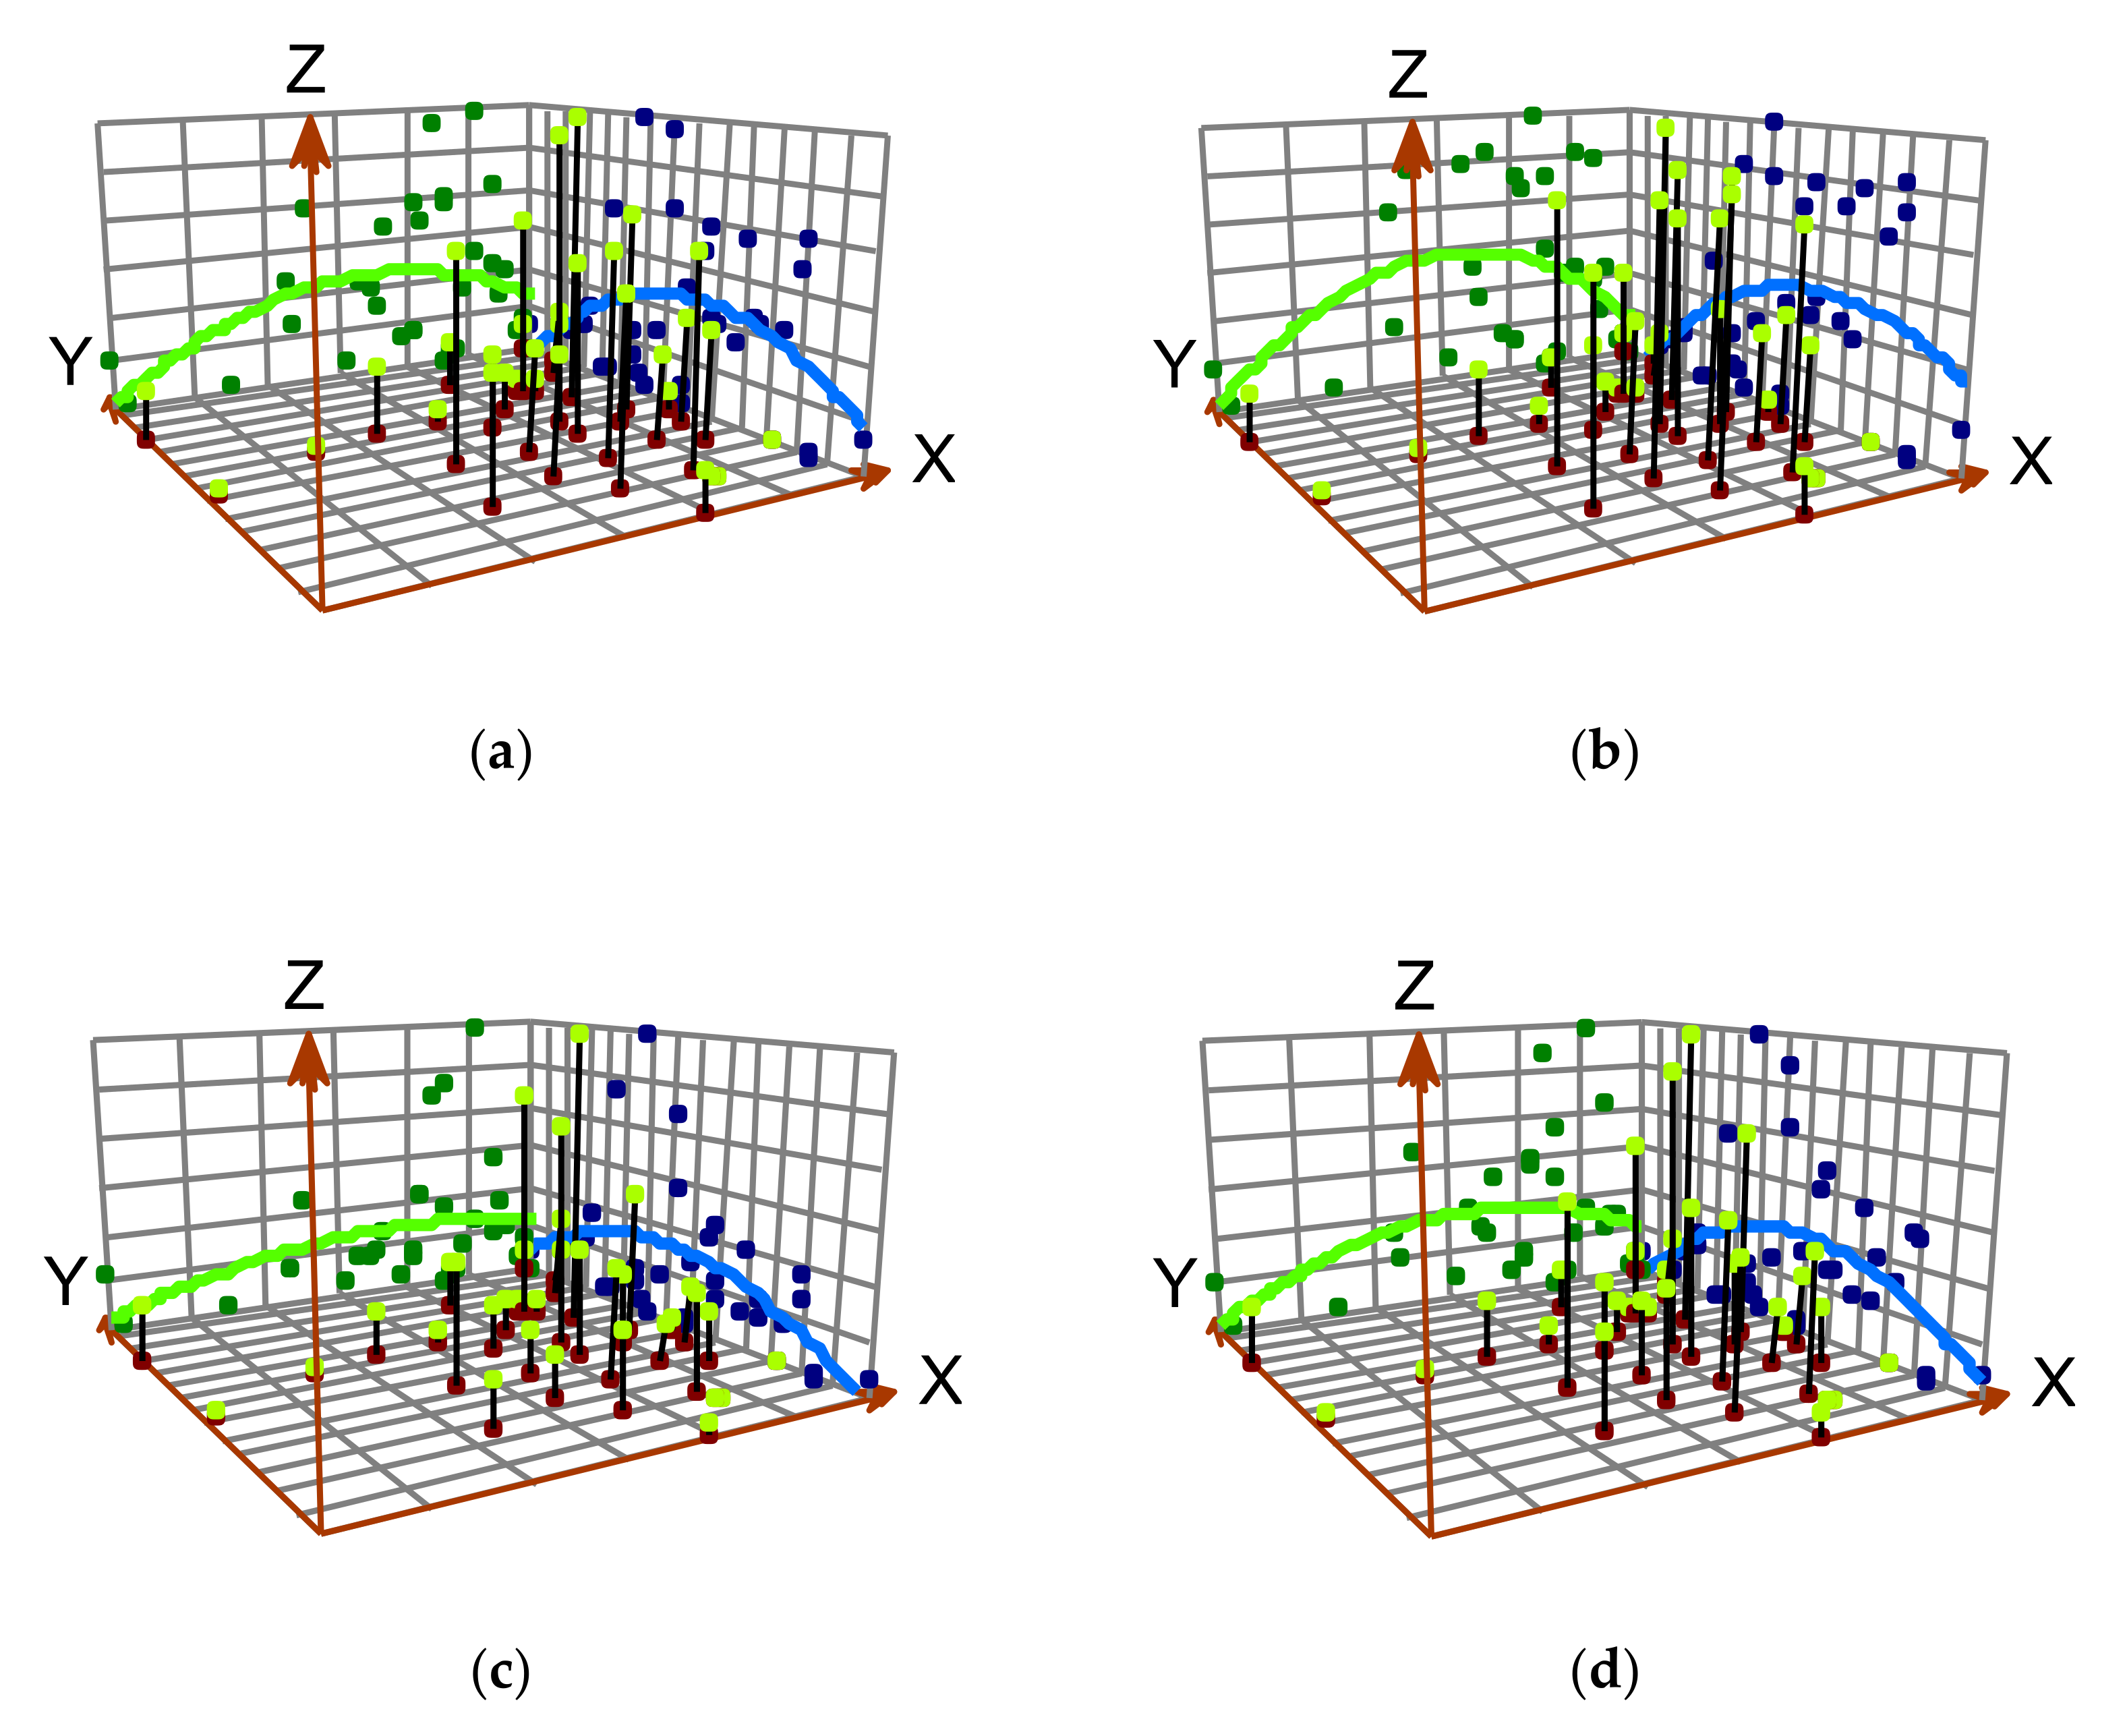
The study further presented the trend graphs of vegetable sowing area and yield in 2010 and 2019 by using the global trend analysis method of ArcGIS geostatistical analysis. The outcome reveals that the vegetable-sown area and yield in 2010 and 2019 were produced with due east and due north directions as the X and Y axes and vegetable-sown area and production as the height attribute values (Z-axis), respectively (see Figure 2). Figure 3a,b shows that the vegetable-sown area in China offers an obvious inverted U-shaped trend in the east–west and north–south directions. The east is higher than the west, and the south is higher than the north. Likewise, the inverted U-shaped characteristic of the projected trend line of vegetable production is more moderate, and the east is higher than the west, which is still obvious as shown in Figure 3c,d. From the above results, it is apparent that both vegetable-sown area and vegetable production in China in 2019 showed an increase compared to 2010, and the inverted U-shaped characteristics of vegetable planted area in the spatial trend are also found to be more apparent compared to vegetable production.
4.2. Spatial Aggregation and Evolution of Chinese Vegetable Industry
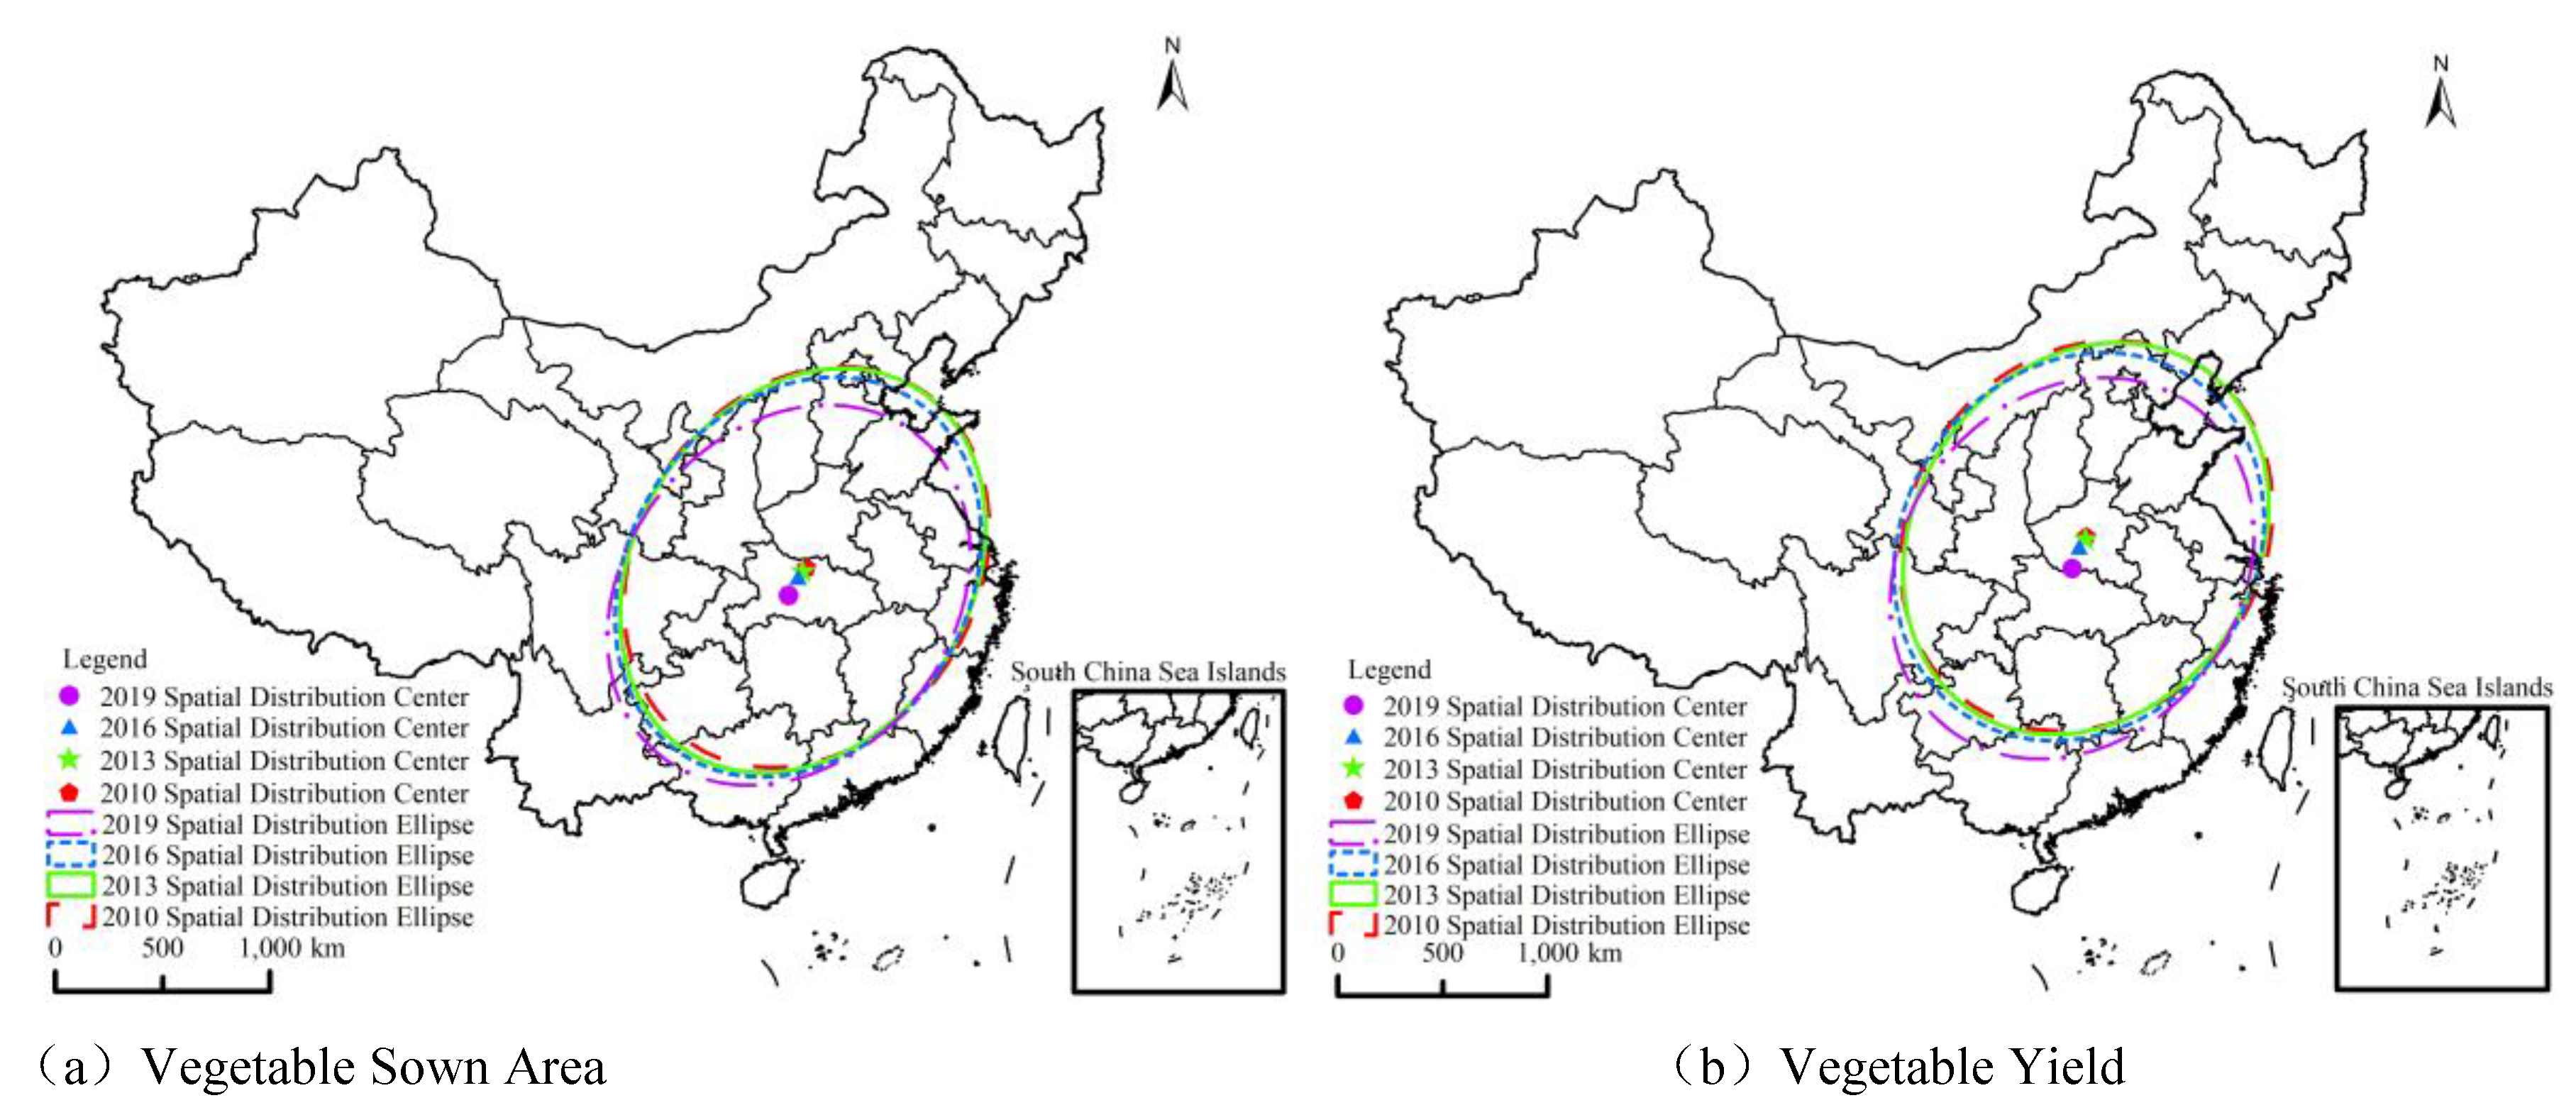
Based on the spatial visualization description of the distribution of vegetable area and yield in China, to further reveal the spatial agglomeration characteristics of the Chinese vegetable industry, this paper also explored the spatial agglomeration characteristics of the Chinese vegetable industry using two methods: standard deviation ellipse and exploratory spatial data analysis. The standard deviation ellipse of vegetable-sown area and production in China are shown in Figure 4. According to Figure 4a, the center of gravity of the ellipse distribution of vegetable-sown area in China is located in Hubei. It keeps moving to the southwest over time. Moreover, the long and short half-axes of the standard deviation ellipse are significantly shorter in 2019, and the shape is more flattened as compared to previous years. Furthermore, Figure 4b shows that the standard deviation ellipse of vegetable production in China is more toward the northeast than that of the sown area ellipse, and the center of gravity of the distribution also shows a trend of moving toward southwest. Unlike the vegetable planted area, the vegetable yield ellipse distribution centers are all located in Henan. Especially obvious is that the azimuth of the vegetable yield ellipse in 2019 is 37.46°, showing a greater angle of clockwise rotation as compared to other years.
Furthermore, the outcome in Table 2 shows that the spatial aggregation of vegetable-sown area in China fluctuates, with a slight decrease in 2013 compared to 2010, but an increase in 2016, with the highest spatial accumulation of 0.47 in 2019, while the spatial aggregation of vegetable production is on the rise, gradually increasing from 0.41 in 2010 to 0.44 in 2019; the sown area shows stronger spatial clustering characteristics. In terms of the evolution of spatial clustering, the long half-axis of the ellipse of vegetable-sown area distribution shortened from 983.67 km in 2010 to 958.32 km in 2019, and the short half-axis shortened from 795.54 km in 2010 to 763.66 km in 2019, which reflects the obvious spatial clustering characteristics of vegetable-sown area in the northeast-southwest direction. In summary, the test results based on the standard deviation ellipse method show obvious spatial clustering characteristics in Chinese vegetable production. The centers of gravity of the vegetable sowing area and production in China are located in Hubei and Henan, respectively. From 2010 to 2019, the centers of gravity of the vegetable sowing area and production gradually move to the southwest, indicating that the center of output has slowly steadily moved from the north to the south as the future development trend of the Chinese vegetable industry.
Further, the results of the region-wide spatial correlation test showed that under the economic, spatial weight matrix, the Moran’s I indices of the vegetable area and production in China were greater than 0 (see Table 3), indicating that the distribution of vegetable production in China exhibited positive spatial correlation characteristics of high-high agglomeration (High-High type, H-H type) and low-low agglomeration (Low-Low type, L-L type). In other words, there is a mutual influence on the development of the vegetable industry in each province, i.e., there is a significant positive spatial dependence. This outcome is consistent with the previous study of Ji et al. [3].
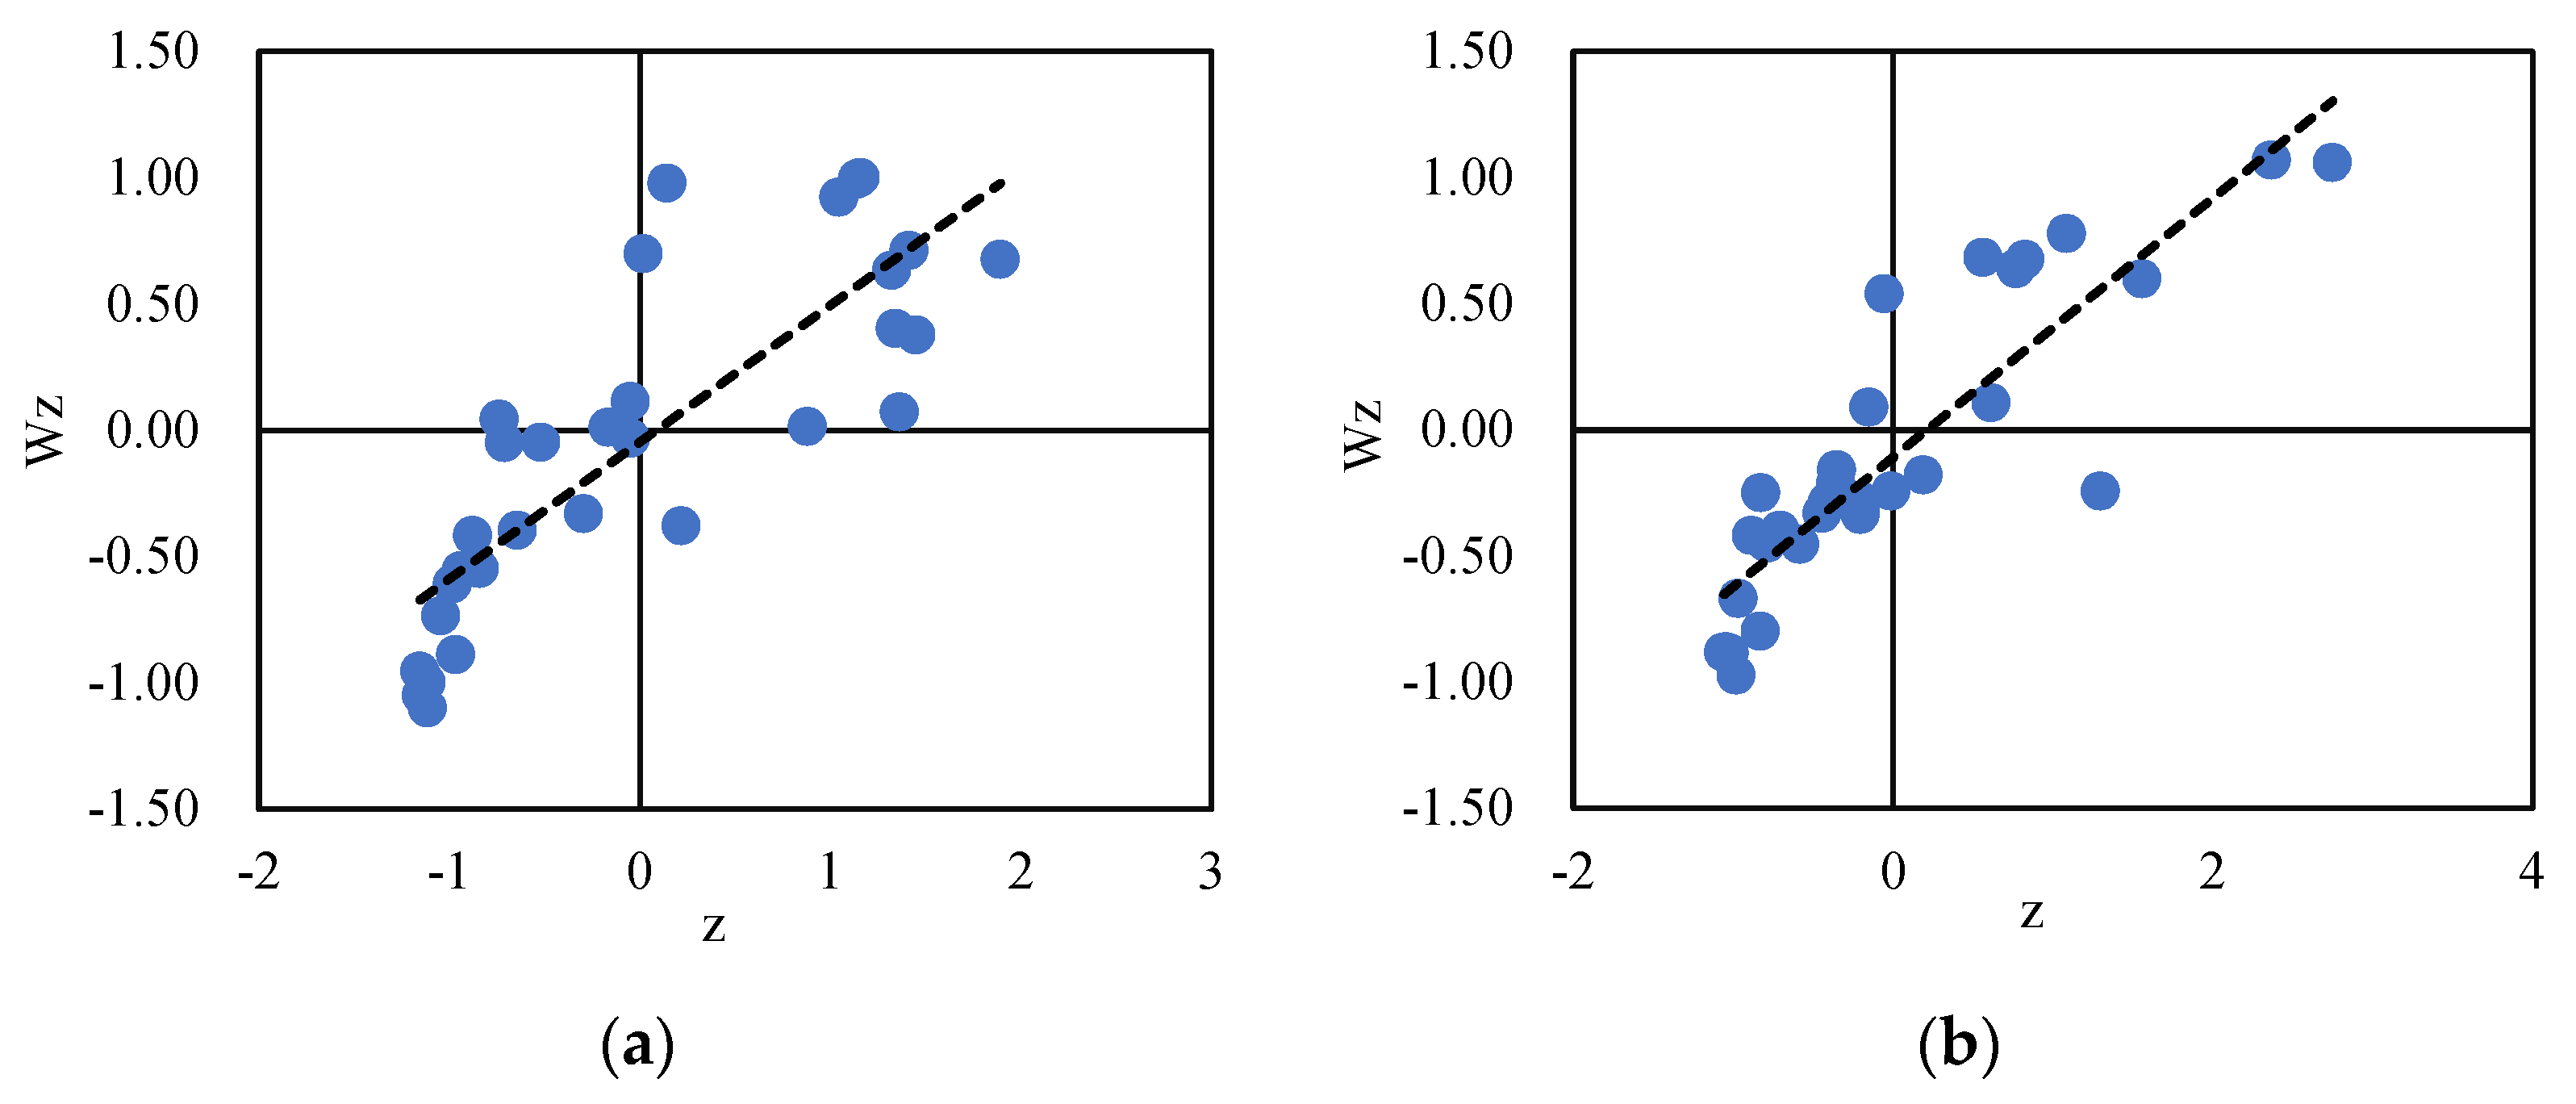
Figure 5 reports the Moran scatter plot of vegetable-sown area and production in China in 2019, it can be seen from the figure that Chinese vegetable production shows a positive spatial correlation, with the 2019 vegetable area scatter plot revealing that 12 provinces are located in the first quadrant (high-high agglomeration) and the third quadrant (low-low agglomeration), respectively. Likewise, the 2019 vegetable production scatter plot shows that a total of eight provinces and a total of 18 regions located in the third quadrant, i.e., most of the provinces are located in the first and third quadrants, indicating that there are obvious spatial agglomeration characteristics of vegetable production in China, i.e., the spatial distribution of vegetable production in China is non-homogeneous. There is a significant positive spatial spillover effect.
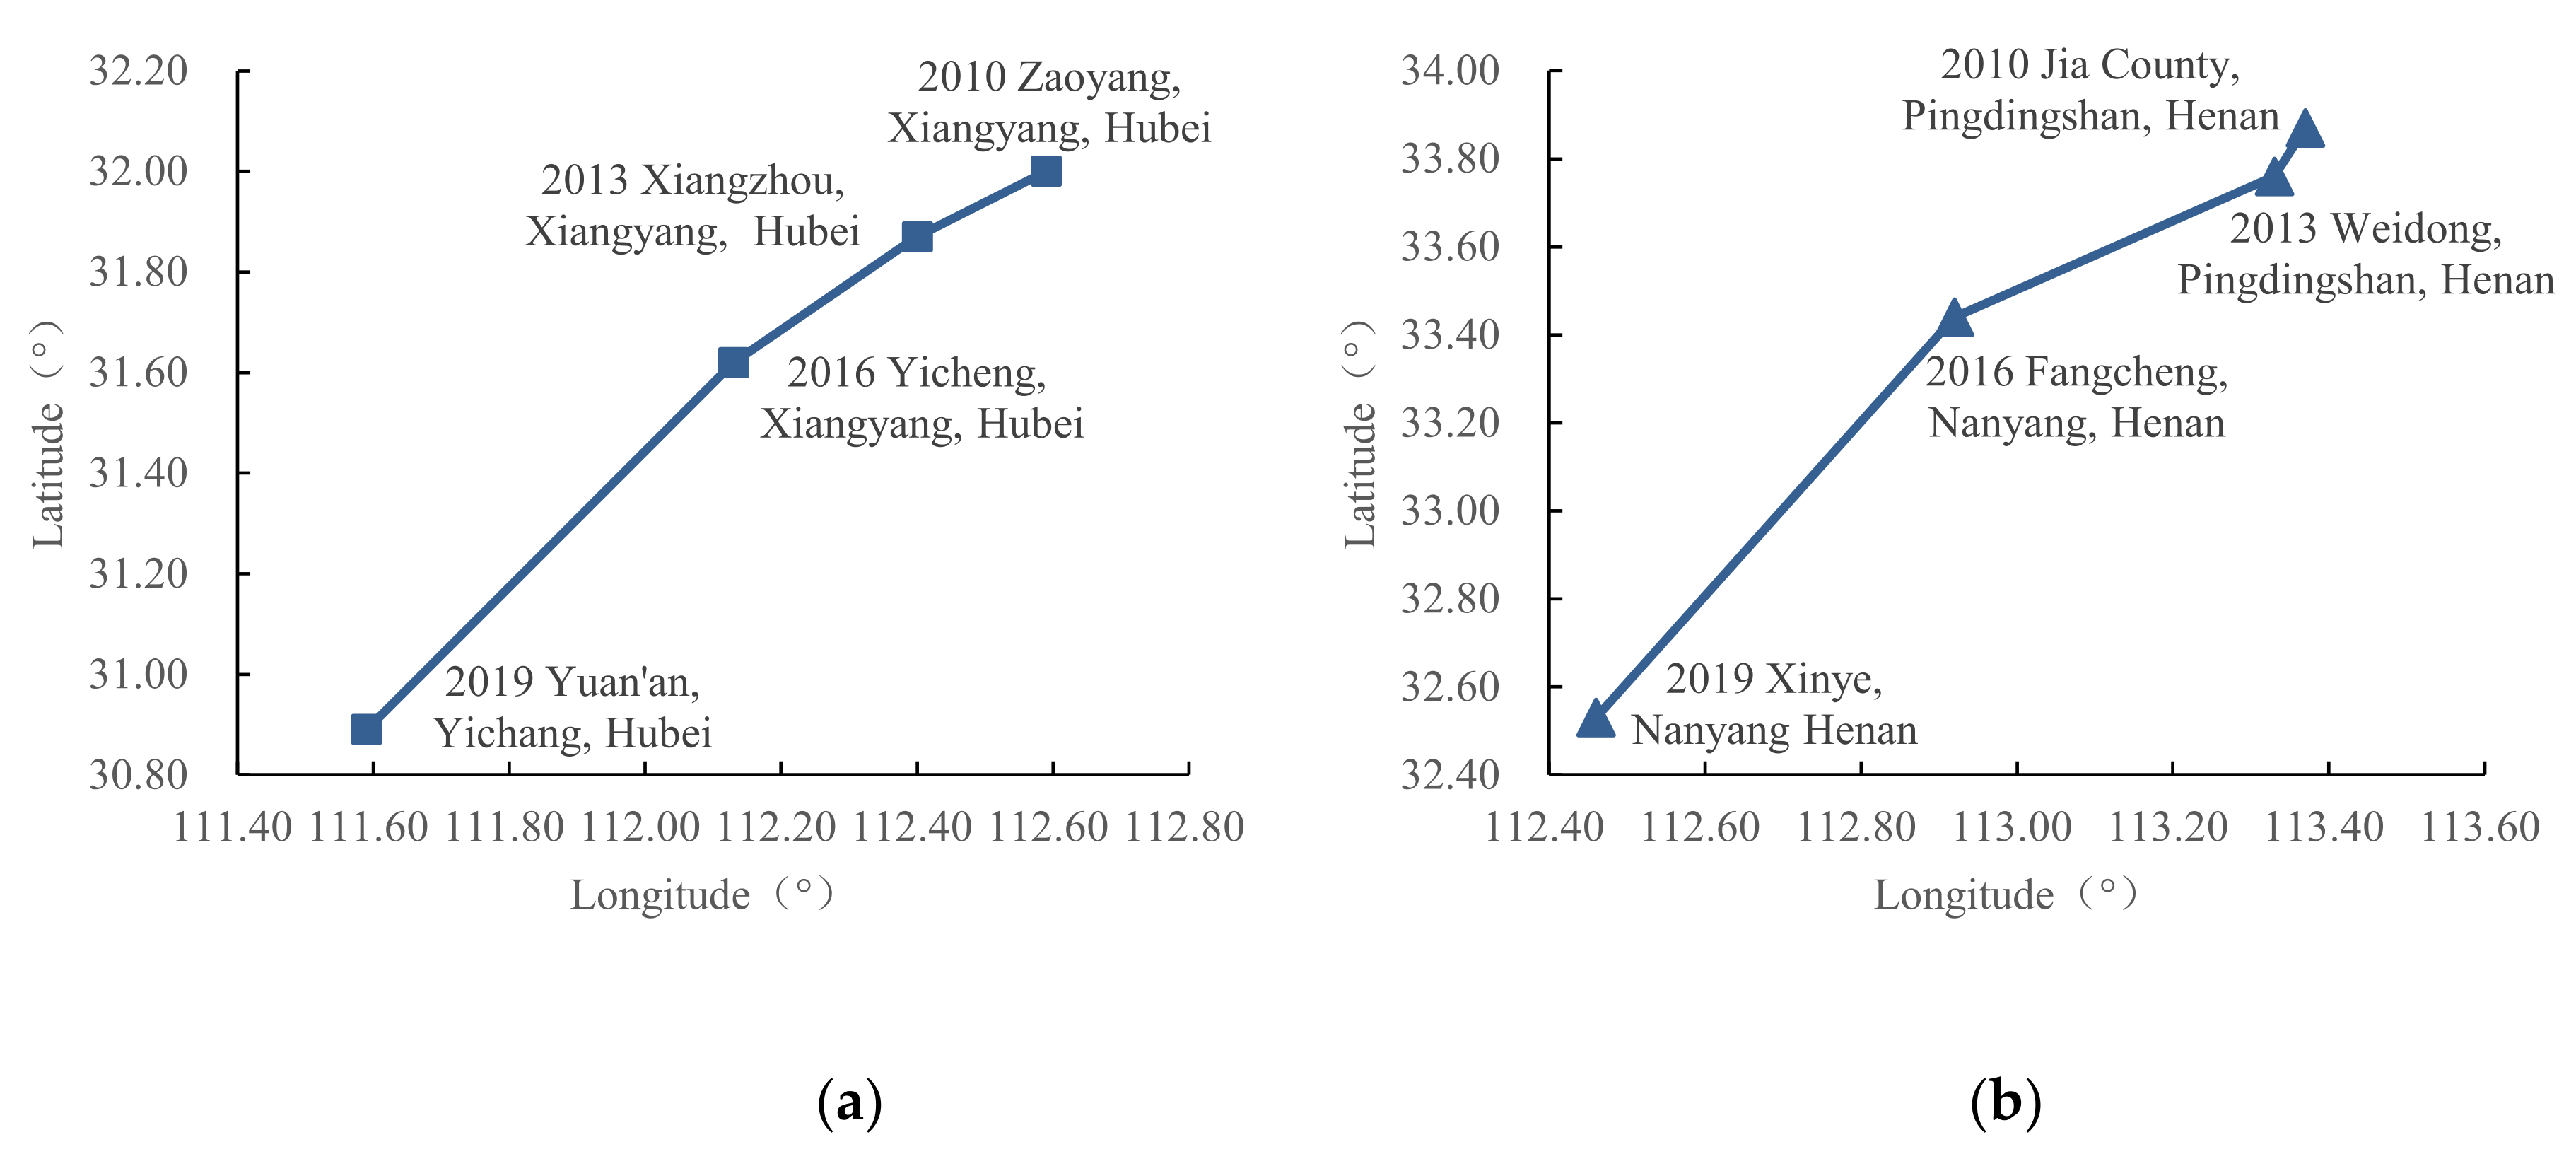
In addition, the movement of the center of gravity of vegetable production in China is also plotted (see Figure 6) based on the coordinates of the ellipse center of the standard deviation of the Chinese vegetable industry calculated in the previous section. It is apparent from the figure that compared to 2010, the vegetable-sown area in 2019 showed a trend of moving to the southwest with an azimuthal change of 7°. The ellipse center shifted from Zaoyang City, Xiangyang City, Hubei Province (112.59° E, 32.00° N) to Yuan’an County, Yichang City, Hubei Province (111.59° E, 30.89° N), with a total of 155.67 km in the southwest distance. From the standard deviation ellipse parameters of vegetable production, the long and short semi-axes of the ellipse showed an overall shortening trend (the short semi-axis of the ellipse increased slightly in 2016 compared with 2013), the spatial agglomeration rose from 0.41 in 2010 to 0.44 in 2019, the azimuthal angle changed by 1.7°, and the center of gravity of distribution shifted 12.78 km to the southwest from 2010 to 2013 (from Jia County, Pingdingshan City, Henan Province to Weidong County, Pingdingshan City, Henan Province), 52.04 km to the southwest from 2013 to 2016 (from Weidong County, Pingdingshan City, Henan Province to Fangcheng County, Nanyang City, Henan Province), and 109.91 km to the southwest from 2016 to 2019 (from Fangcheng County, Nanyang City, Henan Province to Xinye County, Nanyang City, Henan Province). This shows that the trend of agglomeration in the distribution of vegetable production in China is becoming more and more obvious, and the center of gravity has accelerated in the southwestern direction.
To reveal the evolutionary trend of spatial aggregation of vegetable production in China in more detail, this paper reported the changes in H-H provinces in 2010, 2013, 2016, and 2019 in the context of vegetable area and vegetable production (see Table 4). In the context of vegetable area, Guizhou replaced Fujian to join the H-H provinces in 2013, and Chongqing was added in 2016. In 2019, Yunnan became a new member of the H-H areas. In the context of vegetable production, it was found that Liaoning dropped out of the H-H provinces in 2013 and continued to do so in 2016, while in 2019, Anhui also dropped out of the H-H regions “club”. The above findings show that both at the level of vegetable area and vegetable production, “H-H” provinces are mostly distributed in eastern and central provinces, such as Shandong, Henan, Jiangsu, Anhui, Hubei, etc., and show a trend of moving to the southwest, which coincides with the direction of moving the center of the standard deviation ellipse distribution in the previous paper, indicating that Chinese vegetable production shows an overall trend of moving to the southwest.
4.3. Analysis of Driving Factors of Changing Layout
To explore the driving factors accountable for changing vegetables layout patterns in China, the current study employed the spatial Durbin model (see Table 5). According to the findings, it is seen that both Wald-spatial-lag and Wald-spatial-error tests reject the original hypothesis at the 1% significance level, i.e., the spatial Durbin model could not be converted into a lagged model and a spatial error model. The findings further reveal that the share of vegetable-sown area in each province with respect to the country’s total vegetable-sown area, the Log-likelihood value of the fixed-effect model is found at 1389.54, which is higher than that of the random-effect model (1305.07).
Further, with the share of vegetable production of each province with respect to the total national vegetable production, the Log-likelihood value of the fixed effects model is 1340.83, higher than the random-effects model (1242.18), and the AIC values of both fixed-effects models are lower than the random-effects model, indicating that the fixed effect of the spatial Durbin model is more appropriate. The results further show that the coefficient of the spatial lag term of the share of vegetable-sown area in each province to the total vegetable planted area in the country is 0.2022, which is highly significant at the 1% level. The coefficient of the spatial lag term of the share of vegetable production in each province to the total vegetable production in the country is 0.0876, indicating the interdependence of vegetable production between regions.
According to Lesage and Pace [31], if the coefficient of the spatial lag term of the explanatory variable ≠ 0, it cannot directly explain the economic significance of each variable. Accordingly, this paper further decomposes the spatial spillover effect into direct effect (intra-regional spillover), indirect effect (inter-regional spillover), and total effect (average effect of changes in the explanatory variables on all regions) through the partial differencing method of the spatial regression model, and the estimation results are detailed in Table 6.
The results reveal that the direct effect of effective irrigation area (LnEffe) on the layout of vegetable production was positive at 1% significance level, indicating that effective irrigation of vegetables in the region significantly contributes to an increase in the share of vegetable-sown area and production in the region. The results in the context of indirect effects are found to be small, and none of them passed the significance level test, indicating that the increase in effective irrigated area in this region had little effect on the increase in the share of vegetable area and production in other regions. In the context of total effects, the results are found significant. The results for the full impact are all significantly positive, implying that the intra-regional spillover effect of effective irrigated vegetable area on vegetable production layout is considerably larger than the inter-regional spillover effect. The direct effect of vegetable affected area (LnAffe) on vegetable production layout was small, 0.0002 and 0.0004, respectively, and insignificant, while the indirect effect is found to be negative and significant. Since the negative spillover effect of the vegetable affected area between regions cancels out the weak positive direct effect within regions, the final total impact is still negative, indicating that the vegetable affected area harms the layout of the vegetable industry in general. The coefficients of direct effect, indirect effect and total effect of temperature (LnTem) on vegetable area and yield share are all found negative, and the coefficient of total effect is found to be significant, indicating that temperature negatively influences the vegetable industry layout. The intra-regional spillover effect of precipitation (LnPre) on the share of vegetable-sown area and the share of vegetable production is found to be positive, indicating that abundant precipitation positively contributes to the vegetable production in the region. In contrast, the results in the context of both indirect and total effects are found to be negative. The intra-regional and inter-regional spillover effects of sunshine (LnSun) on the share of vegetable-sown area and the share of vegetable production are both found to be positive and insignificant, indicating that the sunshine factor has a positive effect on the layout of vegetable industry. The coefficients of direct effects of urbanization level (Urban) on the vegetable area and production share were −0.0434 and −0.0794, respectively, and both passed the 1% significance level test, implying that the development of local urbanization inhibits the development of local vegetable industry, which contradicts the findings of earlier study [33]. The possible reason is that the acceleration of regional urbanization makes non-farm employment opportunities increase and a large amount of rural labor flows into urban areas, causing a structural shortage of vegetable farmers. The non-farm income obtained by farmers is higher than the income from vegetable cultivation, making farmers change their cultivation decisions after weighing the benefits, thus leading to a decrease in the proportion of vegetable cultivation area and production in the region. The indirect effect of urbanization development level on the share of vegetable production is significantly positive, which infers that urbanization in the region has a positive spillover effect in increasing the vegetable yield share in other regions. It reflects the point that the increase in demand is due to the decrease in local vegetable cultivation during urbanization development. The direct effects of road density (Traf) on the vegetable area and production share are significantly negative, which is contrary to theoretical expectations, probably because transportation accessibility in the region increases vegetable distribution efficiency while also decreasing non-farm employment costs and increasing the opportunity cost of engaging in agricultural production, which has a certain negative effect on the layout of vegetable production. In contrast, the indirect effects of road density on the vegetable area and production share are found significantly positive, offsetting the negative direct effects, making the total product’s effect significantly positive, and indicating that traffic accessibility has a significant positive effect on vegetable industry layout in general, this is generally consistent with the findings of the previous study [19]. The results in the case of the direct effect of market demand (LnMark) are also found to be positive, but the total indirect effects are both negative. The findings unveil that a 1% increase in local market demand will increase the share of local vegetable acreage in the national acreage by 0.0007%, and the percentage of local vegetable production in the national acreage will increase by 0.0054%. A 1% increase in local market demand will cause the proportion of vegetable planted area in other regions to the national share to decrease by 0.0036% and will also cause the proportion of vegetable production in different regions to the national share to reduce by 0.0097%, which means that the local market demand has a positive spillover effect on the local vegetable production layout and a negative spillover effect on the vegetable production layout in other regions. This is due to the fact that the vegetable growers in this region are more likely to capture local vegetable market demand information than other regions and can respond more quickly than the local vegetable market demand, thus making it more difficult for vegetable growers in different regions to squeeze out the local market. The coefficients of the intra-regional, inter-regional and total effects of technological progress (LnTech) on the share of vegetable-sown area and the share of vegetable production are all found to be positive, indicating that technological progress has a significant positive spillover effect on the layout of local vegetable production, and positive spillover to other regions. Overall, technological progress has a significant positive effect on the layout of vegetable industry. The coefficients of the direct effect, indirect effect and total effect of the effect of fiscal support policy (Fina) on the share of vegetable area are also found to be positive, but none of them pass the significance level test, indicating that the local fiscal support policy has a positive spillover effect on the layout of vegetable industry in the region and other regions, but it is not significant. The direct effect of fiscal support policy for agriculture on the share of vegetable yieldis negative (−0.0015), but the indirect and total effects are positive. Overall, the government’s financial support stimulates vegetable growers’ enthusiasm and influences the development of vegetable industry positively; thus, the findings propose that financial support for the vegetable industry should be enhanced in the study area.
5. Conclusions and Policy Implications
The vegetable sector is a pillar sector of any national economy, playing a vital role in increasing farmers’ incomes and promoting employment, as well as transforming agriculture. Thus, to enhance vegetable production, it is of great importance to reveal the distribution and spatial agglomeration characteristics of vegetables. The study used the Chinese vegetable-sown area and production data from 2010 to 2019 to visualize the spatial distribution pattern and spatial trends of the Chinese vegetable industry. The study used ArcGIS to examine the spatial agglomeration degree and pattern of the Chinese vegetable industry using standard deviation ellipsoid technique and exploratory spatial data analysis method. The study additionally applied the spatial regression partial differential method to empirically examine the driving factors of the change in the layout of vegetable production in China. The findings reveal that the design of the Chinese vegetable industry showed strong spatial non-equilibrium characteristics during the sample period. The location distribution showed a northeast–southwest spatial pattern, showing “H-H” and “L-L” positive spatial correlation characteristics, mainly concentrated in Shandong, Henan, Hubei, and other large agricultural provinces. The center of gravity of distribution gradually moved to the southwest. The empirical regression results showed that the effective irrigated area of natural factors facilitated vegetables production layout. In contrast, the affected area had an inhibiting effect. Climate indicators such as temperature, precipitation and light show different degrees of influence on the layout of vegetable production. The direct effects of urbanization and transportation conditions on the region’s layout of vegetable production are negative. Market demand has a positive spillover effect on the layout of local vegetable production, while it has a negative spillover effect on other regions. Technological progress shows positive spillover effects on the layout of vegetable production in this region and other regions, and financial support policies for agriculture as a whole also showed positive effects.
Based on the findings, the current study puts forward the following policy implications. First, it is necessary to optimize the production layout of the vegetable industry and create development policies according to local conditions. China’s vegetable industry in the spatial distribution showed unbalanced characteristics; regional differences are found more pronounced. Therefore, the study reveal that we should grasp the law of changes in the layout of the vegetable industry, follow the trend of vegetable production centers moving to the southwest, pay attention to the spatial correlation of vegetable production between provinces and regions, develop differentiated policies to support the vegetable industry, and form a pattern of promoting the development of vegetable industry gradually. Second, it is imperative to accurately grasp the comparative advantages, and the development of vegetable industry agglomeration. The level of agglomeration of China’s vegetable industry has gradually increased, and the characteristics of spatial agglomeration are obvious. Therefore, we should pay attention to the trend of vegetable industry distribution centers moving to the southwest, optimize industrial agglomeration policies and services, maintain the existing “H-H” type province’s priority development, accelerate the low-level to high-level development, and promote the vegetable industry to areas with advantages. Third, it is necessary to strengthen vegetable technology innovation and services and promote the transformation of technical achievements. The agricultural science and technology innovation system should be improved. According to changes in market demand, the innovation of agricultural agrarian technology extension services should enhance the relevant technical inputs in the vegetable industry.
This study is not without limitation, as the current study emphasized the entire vegetable industry without considering the vegetable cultivation methods and vegetable types. Therefore, the current study proposes that future research should focus on considering the impact of different planting methods (open-air vegetables and greenhouse vegetables) on the production layout of vegetables. In addition, the changes and influencing factors of the production layout of different vegetable species should also be considered, which is conducive to developing a more targeted national policy on vegetable production.
Author Contributions
Conceptualization, writing, methods, and visualization H.W.; supervision and funding acquisition, J.H.; review and editing, N.A.; review and analysis, Y.W. All authors have read and agreed to the published version of the manuscript.
Funding
This research was funded by the National Natural Science Foundation of China (Grant no. 72141010).
Institutional Review Board Statement
Not applicable.
Informed Consent Statement
Not applicable.
Data Availability Statement
The data presented in this study are available on request from the authors.
Acknowledgments
The authors are grateful for the patient review and helpful suggestions from the editor of this journal, as well as to the anonymous reviewers.
Conflicts of Interest
The authors declare no conflict of interest.
References
- You, L.; Spoor, M.; Ulimwengu, J.; Zhang, S. Land use change and environmental stress of wheat, rice and corn production in China. China Econ. Rev. 2011, 22, 461–473. [Google Scholar] [CrossRef]
- Ji, L.; Wu, W. Spatial-temporal characteristics and affecting factors of vegetable produce geographic agglomeration in China. Econ Geogr. 2015, 35, 141–148. [Google Scholar] [CrossRef]
- Ji, L.; Li, C.; Zhang, S. The spatial distribution of vegetable production in China and its impact on vegetable price volatility. Econ. Geogr. 2016, 36, 148–155. [Google Scholar] [CrossRef]
- Ji, L.; You, L.; See, L.; Fritz, S.; Li, C.; Zhang, S.; Li, G. Spatial and temporal changes of vegetable production in China. J. Land Use 2018, 13, 494–507. [Google Scholar] [CrossRef]
- Zhou, Y.; Lv, C.; Zhou, D. Analysis of the influencing factors of the formation of main vegetable production areas in China: A case study of Shouguang in Shandong Province. Geogr. Res. 2012, 31, 687–700. [Google Scholar] [CrossRef]
- Liu, T.; Zheng, L. Analysis of Chinese vegetable supply and demand problem and its prospect. Agric. Outlook 2013, 2, 52–55. [Google Scholar]
- Wu, J.; Shen, C.; Wang, S.; Zhang, J.; Kong, F. Spatial evolution, mechanism, effect and policies of vegetable production agglomeration in China. Sci. Agric. Sin. 2015, 48, 1641–1649. [Google Scholar] [CrossRef]
- O’Kelly, M.; Bryan, D. Agricultural location theory: Von Thunen’s contribution to economic geography. Prog. Hum. Geog. 1996, 20, 457–475. [Google Scholar] [CrossRef]
- Dong, X.; Huang, J.; Scott, R.; Wang, H. Study on geographical location, transportation infrastructure and planting structure adjustment. Manag. World 2006, 9, 59–63+79. [Google Scholar] [CrossRef]
- Krugman, P. Increasing Returns and Economic Geography. J. Political Econ. 1991, 99, 483–499. [Google Scholar] [CrossRef]
- Granovetter, M. Economic action and social structure: The problem of embeddedness. Am. J. Sociol. 1985, 91, 481–510. [Google Scholar] [CrossRef]
- Deng, Z.; Feng, Y.; Zhang, J.; Wang, J. Analysis on the Characteristics and Tendency of Grain Production’s Spatial Distribution in China. Econ. Geogr. 2013, 5, 117–123. [Google Scholar] [CrossRef]
- Bai, L.; Wu, L.; Song, X. Spatial difference of grain yield changes during 1995-2010 and balanced potential output to increase in Shandong Province. Prog. Geogr. 2013, 32, 1257–1265. [Google Scholar] [CrossRef]
- Liu, Y.; Wang, S.; Chen, B. Optimization of national food production layout based on comparative advantage index. Energy Procedia 2019, 158, 3846–3852. [Google Scholar] [CrossRef]
- Hou, M.; Deng, Y.; Yao, S. Spatial agglomeration pattern and driving factors of grain production in China since the reform and opening up. Land 2020, 10, 10. [Google Scholar] [CrossRef]
- Zhang, Q.; Weng, F.; Shi, F.; Shao, L.; Huo, X. The Evolutionary Characteristics of Apple Production Layout in China from 1978 to 2016. Cienc. Rural. 2021, 51, e20200688. [Google Scholar] [CrossRef]
- Zhang, Q.; Shi, F.; Abdullahi, N.; Shao, L.; Huo, X. An empirical study on spatial–temporal dynamics and influencing factors of apple production in China. PLoS ONE 2020, 15, e0240140. [Google Scholar] [CrossRef]
- Niu, Y.; Xie, G.; Xiao, Y.; Qin, K.; Liu, J.; Wang, Y.; Gan, S.; Huang, M.; Liu, J.; Zhang, C.; et al. Spatial Layout of Cotton Seed Production Based on Hierarchical Classification: A Case Study in Xinjiang, China. Agriculture 2021, 11, 759. [Google Scholar] [CrossRef]
- Bao, Y.; Yu, Y.; Zhou, Y.; Niu, M. Layout and evolutionary of China’s vegetable industry: From 1990 to 2014. J. Arid. Land Resour. Environ. 2018, 11, 53–58. [Google Scholar] [CrossRef]
- Han, C.; Wang, G.; Zhang, Y.; Zhu, L. Analysis of the temporal and spatial evolution characteristics and influencing factors of China’s herbivorous animal husbandry industry. PLoS ONE 2020, 15, e0237827. [Google Scholar] [CrossRef]
- Sellschopp, J.; Kalter, R. Spatial Distribution of the US Dairy Industry: Long Term Impacts of Policy Change. In Proceedings of the 1990 Annual Meeting, Vancouver, QC, Canada, 5–8 August 1990. [Google Scholar] [CrossRef]
- Yan, B.; Li, Y.; Qin, Y.; Yan, J.; Shi, W. Spatial–temporal analysis of the comparative advantages of dairy farming: Taking 18 provinces or municipalities in China as an example. Comput. Electron. Agric. 2021, 180, 105846. [Google Scholar] [CrossRef]
- Roe, B.; Irwin, E.; Sharp, J. Pigs in Space: Modeling the Spatial Structure of Hog Production in Traditional and Nontraditional Production Regions. Am. J. Agric. Econ. 2002, 84, 259–278. [Google Scholar] [CrossRef]
- Yan, B.; Li, Y.; Qin, Y.; Yan, J. Spatial layout planning of the pig northward movement based on GIS. Environ. Sci. Pollut. Res. 2021, 28, 41051–41060. [Google Scholar] [CrossRef]
- Jacoby, H. Access to markets and the benefits of rural roads. Econ. J. 2000, 110, 713–737. [Google Scholar] [CrossRef] [Green Version]
- Lefever, D. Measuring Geographic Concentration by Means of the Standard Deviational Ellipse. Am. J. Sociol. 1926, 32, 88–94. [Google Scholar] [CrossRef]
- Zhao, L.; Zhao, Z. Projecting the spatial variation of economic based on the specific ellipses in China. Sci. Geogr. Sin. 2014, 34, 979–986. [Google Scholar] [CrossRef]
- Zhao, L.; Zhao, Z. Large scale spatial agglomeration and change of China’s manufacturing industry——An Empirical Study Based on the data of two economic censuses. Res. Quant. Econ. Tech. Econ. 2014, 31, 110–121+138. [Google Scholar] [CrossRef]
- Moran, P. Notes on Continuous Stochastic Phenomena. Biometrika 1950, 37, 17–23. [Google Scholar] [CrossRef]
- Anselin, L. Spatial Econometrics: Methods and Models; Kluwer Academic Publishers: Berlin/Heiderlberg, Germany, 1988. [Google Scholar]
- Lesage, J.; Pace, R. Introduction to Spatial Econometrics; CRC Press: Boca Raton, FL, USA, 2009. [Google Scholar] [CrossRef] [Green Version]
- Elhorst, J. Dynamic Spatial Panels: Models, Methods, and Inferences. J. Geogr. Syst. 2012, 14, 5–28. [Google Scholar] [CrossRef]
- Wu, S.; Mu, Y. Analysis on the determinants and regional trade of vegetables in China based on the spatio-temporal characteristics. J. Bus. Econ. 2016, 2, 18–25. [Google Scholar] [CrossRef]
Figure 1.
Research framework.

Figure 2.
Spatial distribution pattern of vegetable-sown area and yield in China.

Figure 3.
Spatial trend map of vegetable-sown area and yield in China. (a) 2010 vegetable-sown area; (b) 2019 vegetable-sown area; (c) 2010 vegetable yield; (d) 2019 vegetable yield.
Figure 3.
Spatial trend map of vegetable-sown area and yield in China. (a) 2010 vegetable-sown area; (b) 2019 vegetable-sown area; (c) 2010 vegetable yield; (d) 2019 vegetable yield.

Figure 4.
Standard deviation ellipse of vegetable-sown area and yield in China: (a) vegetable-sown area; (b) vegetable yield.
Figure 4.
Standard deviation ellipse of vegetable-sown area and yield in China: (a) vegetable-sown area; (b) vegetable yield.

Figure 5.
Moran scatter plot of vegetable planting area and yield: (a) 2019 vegetable-sown area; (b) 2019 vegetable yield.
Figure 5.
Moran scatter plot of vegetable planting area and yield: (a) 2019 vegetable-sown area; (b) 2019 vegetable yield.

Figure 6.
Shift chart of vegetable production center in China: (a) vegetable-sown area; (b) vegetable yield.
Figure 6.
Shift chart of vegetable production center in China: (a) vegetable-sown area; (b) vegetable yield.


Table 1.
Description and summary statistics of the studied variables.
| Variables | Symbols | Definition | Mean | Standard Deviation |
|---|---|---|---|---|
| Area weight | Area | Sown area by province ÷ total national sown area | 0.0323 | 0.0253 |
| Yield weight | Yield | Production by province ÷ Total national production | 0.0323 | 0.0307 |
| Effective irrigated area for vegetables | LnAeff | Effective irrigated area of crops × (vegetable-sown area ÷ total sown area of crops) | 5.1506 | 1.0288 |
| Vegetables affected area | LnAaff | Crop affected area × (vegetable-sown area ÷ total crop sown area) | 3.9073 | 1.4427 |
| Temperature | LnTem | Average temperature by province | 2.5442 | 0.3951 |
| Precipitation | LnPre | Average precipitation by province | 9.0611 | 0.5007 |
| Sunshine hours | LnSun | Average daylight hours by province | 7.6037 | 0.2579 |
| Urbanization level | Urban | Number of urban populations ÷ total population | 0.5551 | 0.1355 |
| Road density | Traf | Road mileage ÷ administrative area | 0.8962 | 0.5098 |
| Market demand | LnMark | Retail sales of social consumer goods | 8.6722 | 1.0936 |
| Technological advances | LnTech | Total power of agricultural machinery | 7.6264 | 1.1162 |
| Financial support for agriculture expenditure | Fina | Local finance expenditure on agriculture, forestry and water affairs ÷ Local finance general budget expenditure | 0.1152 | 0.0325 |
Table 2.
Standard deviation ellipse-related parameters of the Chinese vegetable industry.
| Categories | Year | Short Half Shaft (km) | Long Half Shaft (km) | Azimuth (°) |
| Area | 2010 | 795.54 | 983.67 | 31.85 |
| 2013 | 783.22 | 1001.51 | 32.73 | |
| 2016 | 789.79 | 987.90 | 33.28 | |
| 2019 | 763.66 | 958.32 | 38.85 | |
| Yield | 2010 | 838.09 | 973.82 | 35.76 |
| 2013 | 812.27 | 983.91 | 34.20 | |
| 2016 | 834.54 | 967.10 | 35.49 | |
| 2019 | 801.15 | 965.55 | 37.46 | |
| Categories | Year | Center Coordinates | Spatial Aggregation | Distribution of the Direction of Movement of the Center of Gravity |
| Area | 2010 | 112.59° E, 32.00° N | 0.44 | - |
| 2013 | 112.40° E, 31.87° N | 0.43 | Southwest | |
| 2016 | 112.13° E, 31.62° N | 0.44 | Southwest | |
| 2019 | 111.59° E, 30.89° N | 0.47 | Southwest | |
| Yield | 2010 | 113.37° E, 33.87° N | 0.41 | - |
| 2013 | 113.33° E, 33.76° N | 0.42 | Southwest | |
| 2016 | 112.92° E, 33.44° N | 0.42 | Southwest | |
| 2019 | 112.46° E, 32.53° N | 0.44 | Southwest |
Table 3.
Moran’s I index of the Chinese vegetable industry.
| Year | Vegetable-Sown Area | Vegetable Yield | ||
|---|---|---|---|---|
| I | z | I | z | |
| 2010 | 0.579 *** | 5.272 | 0.429 *** | 4.236 |
| 2011 | 0.585 *** | 5.313 | 0.434 *** | 4.260 |
| 2012 | 0.590 *** | 5.331 | 0.440 *** | 4.293 |
| 2013 | 0.589 *** | 5.313 | 0.441 *** | 4.290 |
| 2014 | 0.591 *** | 5.317 | 0.443 *** | 4.314 |
| 2015 | 0.592 *** | 5.325 | 0.450 *** | 4.369 |
| 2016 | 0.596 *** | 5.345 | 0.459 *** | 4.440 |
| 2017 | 0.546 *** | 4.909 | 0.501 *** | 4.732 |
| 2018 | 0.536 *** | 4.818 | 0.506 *** | 4.750 |
| 2019 | 0.541 *** | 4.858 | 0.514 *** | 4.799 |
Note: *** indicate 1% significance levels.
Table 4.
Change in “high-high” type of provinces.
| Categories | 2010 | 2013 | 2016 | 2019 |
|---|---|---|---|---|
| Area | Shandong, Henan, Jiangsu, Anhui, Hubei, Hunan, Fujian, Guangxi, Guangdong, Sichuan | Shandong, Henan, Jiangsu, Anhui, Hubei, Hunan, Guizhou, Guangxi, Guangdong, Sichuan | Shandong, Henan, Jiangsu, Anhui, Hubei, Hunan, Guizhou, Guangxi, Guangdong, Chongqing, Sichuan | Shandong, Henan, Jiangsu, Anhui, Hubei, Hunan, Yunnan, Guizhou, Guangxi, Guangdong, Chongqing, Sichuan |
| Yield | Shandong, Henan, Jiangsu, Anhui, Hubei, Hunan, Guangxi, Guangdong, Liaoning, Sichuan | Shandong, Henan, Jiangsu, Anhui, Hubei, Hunan, Guangxi, Guangdong, Sichuan | Shandong, Henan, Jiangsu, Anhui, Hubei, Hunan, Guangxi, Guangdong, Sichuan | Shandong, Henan, Jiangsu, Hubei, Hunan, Guangxi, Guangdong, Sichuan |
Table 5.
Estimation results of spatial Durbin model.
| Variables | Area | Yield | ||
|---|---|---|---|---|
| FE | RE | FE | RE | |
| LnEffe | 0.0164 *** (12.19) | 0.0148 *** (11.02) | 0.0162 *** (10.28) | 0.0163 *** (10.25) |
| LnAffe | 0.0002 (0.81) | 0.0002 (0.69) | 0.0004 (1.28) | 0.0005 (1.54) |
| LnTem | −0.0008 (−0.09) | 0.0043 (0.80) | −0.0017 (−0.17) | 0.0069 (0.91) |
| LnPre | 0.0023 (1.04) | 0.0039 * (1.83) | 0.0049 * (1.90) | 0.0053 ** (2.03) |
| LnSun | 0.0017 (0.42) | −0.0021 (−0.55) | 0.0037 (0.78) | 0.0031 (0.65) |
| Urban | −0.0431 *** (−2.93) | −0.0383 *** (−3.26) | −0.0819 *** (−4.74) | −0.0745 *** (−4.78) |
| Traf | −0.0099 *** (−2.73) | −0.0038 (−1.26) | −0.0124 *** (−2.98) | −0.0048 (−1.18) |
| LnMark | 0.0009 (0.45) | 0.0023 (1.25) | 0.0057 ** (2.28) | 0.0073 *** (3.08) |
| LnTech | 0.0035 *** (2.70) | 0.0027 ** (2.28) | 0.0030 ** (2.00) | −0.0040 *** (2.64) |
| Fina | 0.0020 (0.11) | −0.0027 (−0.16) | −0.0025 (−0.13) | −0.0021 (−0.10) |
| W(LnEffe) | −0.0043 * (−1.84) | −0.0022 * (−0.94) | −0.0004 (−0.14) | −0.0014 (−0.51) |
| W(LnAffe) | −0.0012 ** (−2.58) | −0.0012 ** (−2.39) | −0.0011 ** (−1.95) | −0.0011 * (−1.88) |
| W(LnTem) | −0.0151 (−1.19) | −0.0183 ** (−2.00) | −0.0147 (−0.99) | −0.0294 ** (−2.24) |
| W(LnPre) | −0.0039 (−1.38) | −0.0052 ** (−1.82) | −0.0070 ** (−2.10) | −0.0079 ** (−2.30) |
| W(LnSun) | 0.0037 (0.67) | 0.0088 (1.59) | 0.0016 (0.24) | 0.0057 (0.85) |
| W(Urban) | −0.0134 (−0.54) | −0.0366 ** (−1.97) | 0.0916 *** (3.12) | 0.0539 ** (2.18) |
| W(Traf) | 0.0460 *** (7.27) | 0.0504 *** (8.95) | 0.0273 *** (3.67) | 0.0330 *** (4.57) |
| W(LnMark) | −0.0032 (−1.01) | −0.0044 * (−1.76) | −0.0094 ** (−2.58) | −0.0100 *** (−2.99) |
| W(LnTech) | 0.0006 (0.30) | 0.0022 (1.26) | 0.0017 (0.73) | 0.0023 (1.05) |
| W(Fina) | 0.0518 (1.52) | 0.0393 (1.14) | 0.0270 (0.67) | 0.0277 (0.67) |
| ρ | 0.2022 *** | 0.1903 *** | 0.0876 | 0.1569 * |
| AIC | −2735.09 | −2562.13 | −2637.66 | −2436.35 |
| Log likelihood | 1389.54 | 1305.07 | 1340.83 | 1242.18 |
| Wald-spatial-lag | 82.90 *** | 113.95 *** | 50.72 *** | 62.33 *** |
| Wald-spatial-error | 65.63 *** | 99.44 *** | 42.45 *** | 51.00 *** |
Note: ***, **, and * indicate 1%, 5%, and 10% significance levels, respectively.
Table 6.
Decomposition results of spatial effects.
| Variables | Area | Yield | ||||
|---|---|---|---|---|---|---|
| Direct Effect | Indirect Effects | Total Effect | Direct Effect | Indirect Effects | Total Effect | |
| LnEffe | 0.0164 *** (11.97) | −0.0013 (−0.53) | 0.0151 *** (5.65) | 0.0163 *** (10.10) | 0.0010 (0.40) | 0.0173 *** (6.18) |
| LnAffe | 0.0002 (0.61) | −0.0013 ** (−2.24) | −0.0012 * (−1.72) | 0.0004 (1.23) | −0.0011 * (−1.67) | −0.0006 (−0.93) |
| LnTem | −0.0007 (−0.09) | −0.0202 (−1.45) | −0.0209 ** (−1.98) | −0.0010 (−0.11) | −0.0180 (−1.17) | −0.0190 * (−1.75) |
| LnPre | 0.0021 (1.01) | −0.0041 (−1.35) | −0.0020 (−0.74) | 0.0047 * (1.91) | −0.0070 ** (−2.10) | −0.0022 (−0.82) |
| LnSun | 0.0018 (0.48) | 0.0049 (0.80) | 0.0067 (1.17) | 0.0036 (0.82) | 0.0021 (0.31) | 0.0057 (0.96) |
| Urban | −0.0434 *** (−3.04) | −0.0270 (−0.91) | −0.0705 ** (−2.27) | −0.0794 *** (−4.61) | 0.0911 *** (2.91) | 0.0117 (0.36) |
| Traf | −0.0079 ** (−2.13) | 0.0538 *** (6.38) | 0.0460 *** (4.58) | −0.0119 *** (−2.80) | 0.0287 *** (3.45) | 0.0168 * (1.65) |
| LnMark | 0.0007 (0.37) | −0.0036 (−1.06) | −0.0029 (−0.90) | 0.0054 ** (2.32) | −0.0097 *** (−2.61) | −0.0043 (−1.27) |
| LnTech | 0.0036 *** (2.94) | 0.0014 (0.61) | 0.0050 ** (2.06) | 0.0032 ** (2.19) | 0.0019 (0.78) | 0.0051 ** (2.02) |
| Fina | 0.0049 (0.29) | 0.0640 (1.61) | 0.0689 (1.62) | −0.0015 (−0.07) | 0.0301 (0.71) | 0.0287 (0.65) |
Note: ***, **, and * indicate 1%, 5%, and 10% significance levels, respectively.
Publisher’s Note: MDPI stays neutral with regard to jurisdictional claims in published maps and institutional affiliations. |
© 2022 by the authors. Licensee MDPI, Basel, Switzerland. This article is an open access article distributed under the terms and conditions of the Creative Commons Attribution (CC BY) license (https://creativecommons.org/licenses/by/4.0/).
Share and Cite
MDPI and ACS Style
Wang, H.; He, J.; Aziz, N.; Wang, Y. Spatial Distribution and Driving Forces of the Vegetable Industry in China. Land 2022, 11, 981. https://0-doi-org.brum.beds.ac.uk/10.3390/land11070981
AMA Style
Wang H, He J, Aziz N, Wang Y. Spatial Distribution and Driving Forces of the Vegetable Industry in China. Land. 2022; 11(7):981. https://0-doi-org.brum.beds.ac.uk/10.3390/land11070981
Chicago/Turabian StyleWang, Hongru, Jun He, Noshaba Aziz, and Yue Wang. 2022. "Spatial Distribution and Driving Forces of the Vegetable Industry in China" Land 11, no. 7: 981. https://0-doi-org.brum.beds.ac.uk/10.3390/land11070981
Note that from the first issue of 2016, this journal uses article numbers instead of page numbers. See further details here.