Article

Land-Use Classifying and Identification of the Production-Living-Ecological Space of Island Villages—A Case Study of Islands in the Western Sea Area of Guangdong Province

1
School of Architecture, South China University of Technology, Guangzhou 510641, China
2
Municipal Key Laboratory of Landscape Architecture, Guangzhou 510641, China
3
The Key Laboratory for Subtropical Architecture Science of the Ministry of Education Research Center, Guangzhou 510641, China
*
Author to whom correspondence should be addressed.
These authors contribute equally to this work.
Submission received: 6 April 2022 / Revised: 29 April 2022 / Accepted: 6 May 2022 / Published: 8 May 2022

Abstract

:
Accurately identifying the rural production-living-ecological space (PLES) of different islands can help reveal their distinct natural resources and land-use situations, which is significant for the sorted management, subarea utilization, and protection of islands. At present, studies on the PLES of island villages are deficient. For instance, the existing land-use classification system is incomplete; the PLES is poorly identified; and the dominant function of multiple land-use types based on different island geomorphology types is insufficiently investigated. Therefore, a case study was conducted on the island villages of the western sea area of Guangdong Province, based on remote sensing, spatial analysis, and land classification, with field research and the relevant data. In this study, before establishing the PLES system, the islands were classified, including six bedrock islands, 10 sedimentary islands, and one volcanic island. When the PLES system of the island villages was classified, the ecological and utilized areas of the intertidal zone and neritic region should be combined with the island–continent part, and the distinct industrial types should be emphasized, before forming 22 secondary types of PLES. Furthermore, it is found that each island generally has its own dominant space and land-use type. Ecological space (ES) dominates the bedrock islands, and production space (PS) is prominent for sedimentary islands and volcanic islands. Forestland, aquaculture pond, and dryland are the prominent land-use types for bedrock islands, sedimentary islands, and volcanic islands, respectively. The rural residential lands are the main component of living space (LS) in all islands, and the most urban residential lands are distributed on the bedrock islands. The main driving factors for the formation and distribution of island rural PLES are the altitudinal gradient and geomorphic characteristics. The research shows that the main problems of PLES are that the intertidal zones are threatened by aquaculture ponds at various levels, and the development of LS in these islands is generally backward.

1. Introduction

The dense population and rapid economic development in coastal zones in China cause frequent changes in land-use structures of offshore islands and intensify the conflicts among the production space, living space, and ecological space [1,2]. In order to achieve sustainable development of geographical space, in 2012, the Chinese government proposed the principle of the national territorial space development: optimizing the allocation of natural and socioeconomic resources for high-efficiency and intensive production, comfortable living, and eco-friendly territorial space [3,4,5,6]. With the discussion and popularization of the concept of production-living-ecological space (PLES) [7,8], the identification of PLES [9,10], the evolution of PLES [11,12], and PLES functionality [13,14] have become research hotspots in the fields of landscape planning and urban planning.
Current studies on the identification of PLES mainly focus on the national land space [15], provincial spaces [16,17], and urban spaces [18,19]. However, PLES identification was rarely conducted in rural spaces, especially in island villages. With the increasing anthropogenic activities, the ecology of the islands has been experiencing critical deterioration. Moreover, the island ecosystem, characterized by a small area, low ecological diversity, and low self-regulating and restoring capacity, is fragile and challenging to repair [20,21,22,23]. Therefore, island land planning and management should be carried out from an integrative research perspective. PLES covers the ecological, production, and living spaces, and the classification of PLES is a comprehensive land spatial zoning [24]. PLES identification on island villages could help to find out the conflict and contradiction among the production space (PS), living space (LS), and ecological space (ES), with achieving co-ordinated developments.
Generally, the identification and division of rural PLES can be achieved by two mainstream methods: (1) the evaluation index system (EIS); (2) land-use classification (LUC) [25,26,27]. The method of EIS is usually used to divide the PLES by evaluating the function and suitability of each administrative unit [28,29]. However, it cannot be used to identify the PLES within the village because of the difficulty in obtaining the socioeconomic statistics at the village level. The method of LUC can identify rural PLES by classifying land-use types with the same dominant function and can be used to identify the multispatial characteristics of rural PLES within the village [30]. For example, Duan et al. [24] identified the multispatial rural PLES in Ertai Town of Zhangjiakou from the perspective of the villagers’ behavior.
The existing LUC-related studies on PLES mainly used Chinese “Land-use status classification” (GB/T21010-2017) for spatial identification [31]. Nevertheless, the surface features of island areas cannot be highlighted by using this taxonomy. In this case, scholars who participated in the Special Project for Comprehensive Investigation and Evaluation of China’s Offshore Ocean (908 Special Project) formulated an LUC system of islands [2], which can emphasize the surface features of the island–continent part. However, each island contains the island–continent part, island intertidal zone, and neritic region [32]. Thus, it is essential to combine the ecology and the utilized spaces of the intertidal zone and neritic region while classifying the land-use of islands. Furthermore, rural spaces in different islands have distinct resource combinations and utilization characteristics. Consequently, in order to find out the advantages and limitations of resources and utilization in various islands, island classification is necessary.
With the increasing exploitation, the island villages in the western sea area of Guangdong Province are commonly confronted with the following issues: (1) development and utilization behaviors such as reclamation and arbitrary quarrying which changed the topography and geomorphology of some islands; (2) severe destruction of the ecological environment; and (3) extensive utilization of natural resources. With a narrow economic base, restricting the protection and management of the islands. Previous studies in this area mainly focused on qualitative planning strategies, the islands’ intertidal zones and neritic regions were rarely considered in the LUC-related studies, and research from a geomorphological perspective is scarce. Hence, the present study aims to fill these knowledge gaps using a remote sensing-based approach. The specific objectives of this study are to: (1) establish a PLES system for the island villages; (2) map the spatial distribution of secondary types of PLES; (3) explain the formation mechanism from the geographical perspective; and (4) figure out the conflict among the PLES and propose space-optimization strategies.

2. Materials and Methods
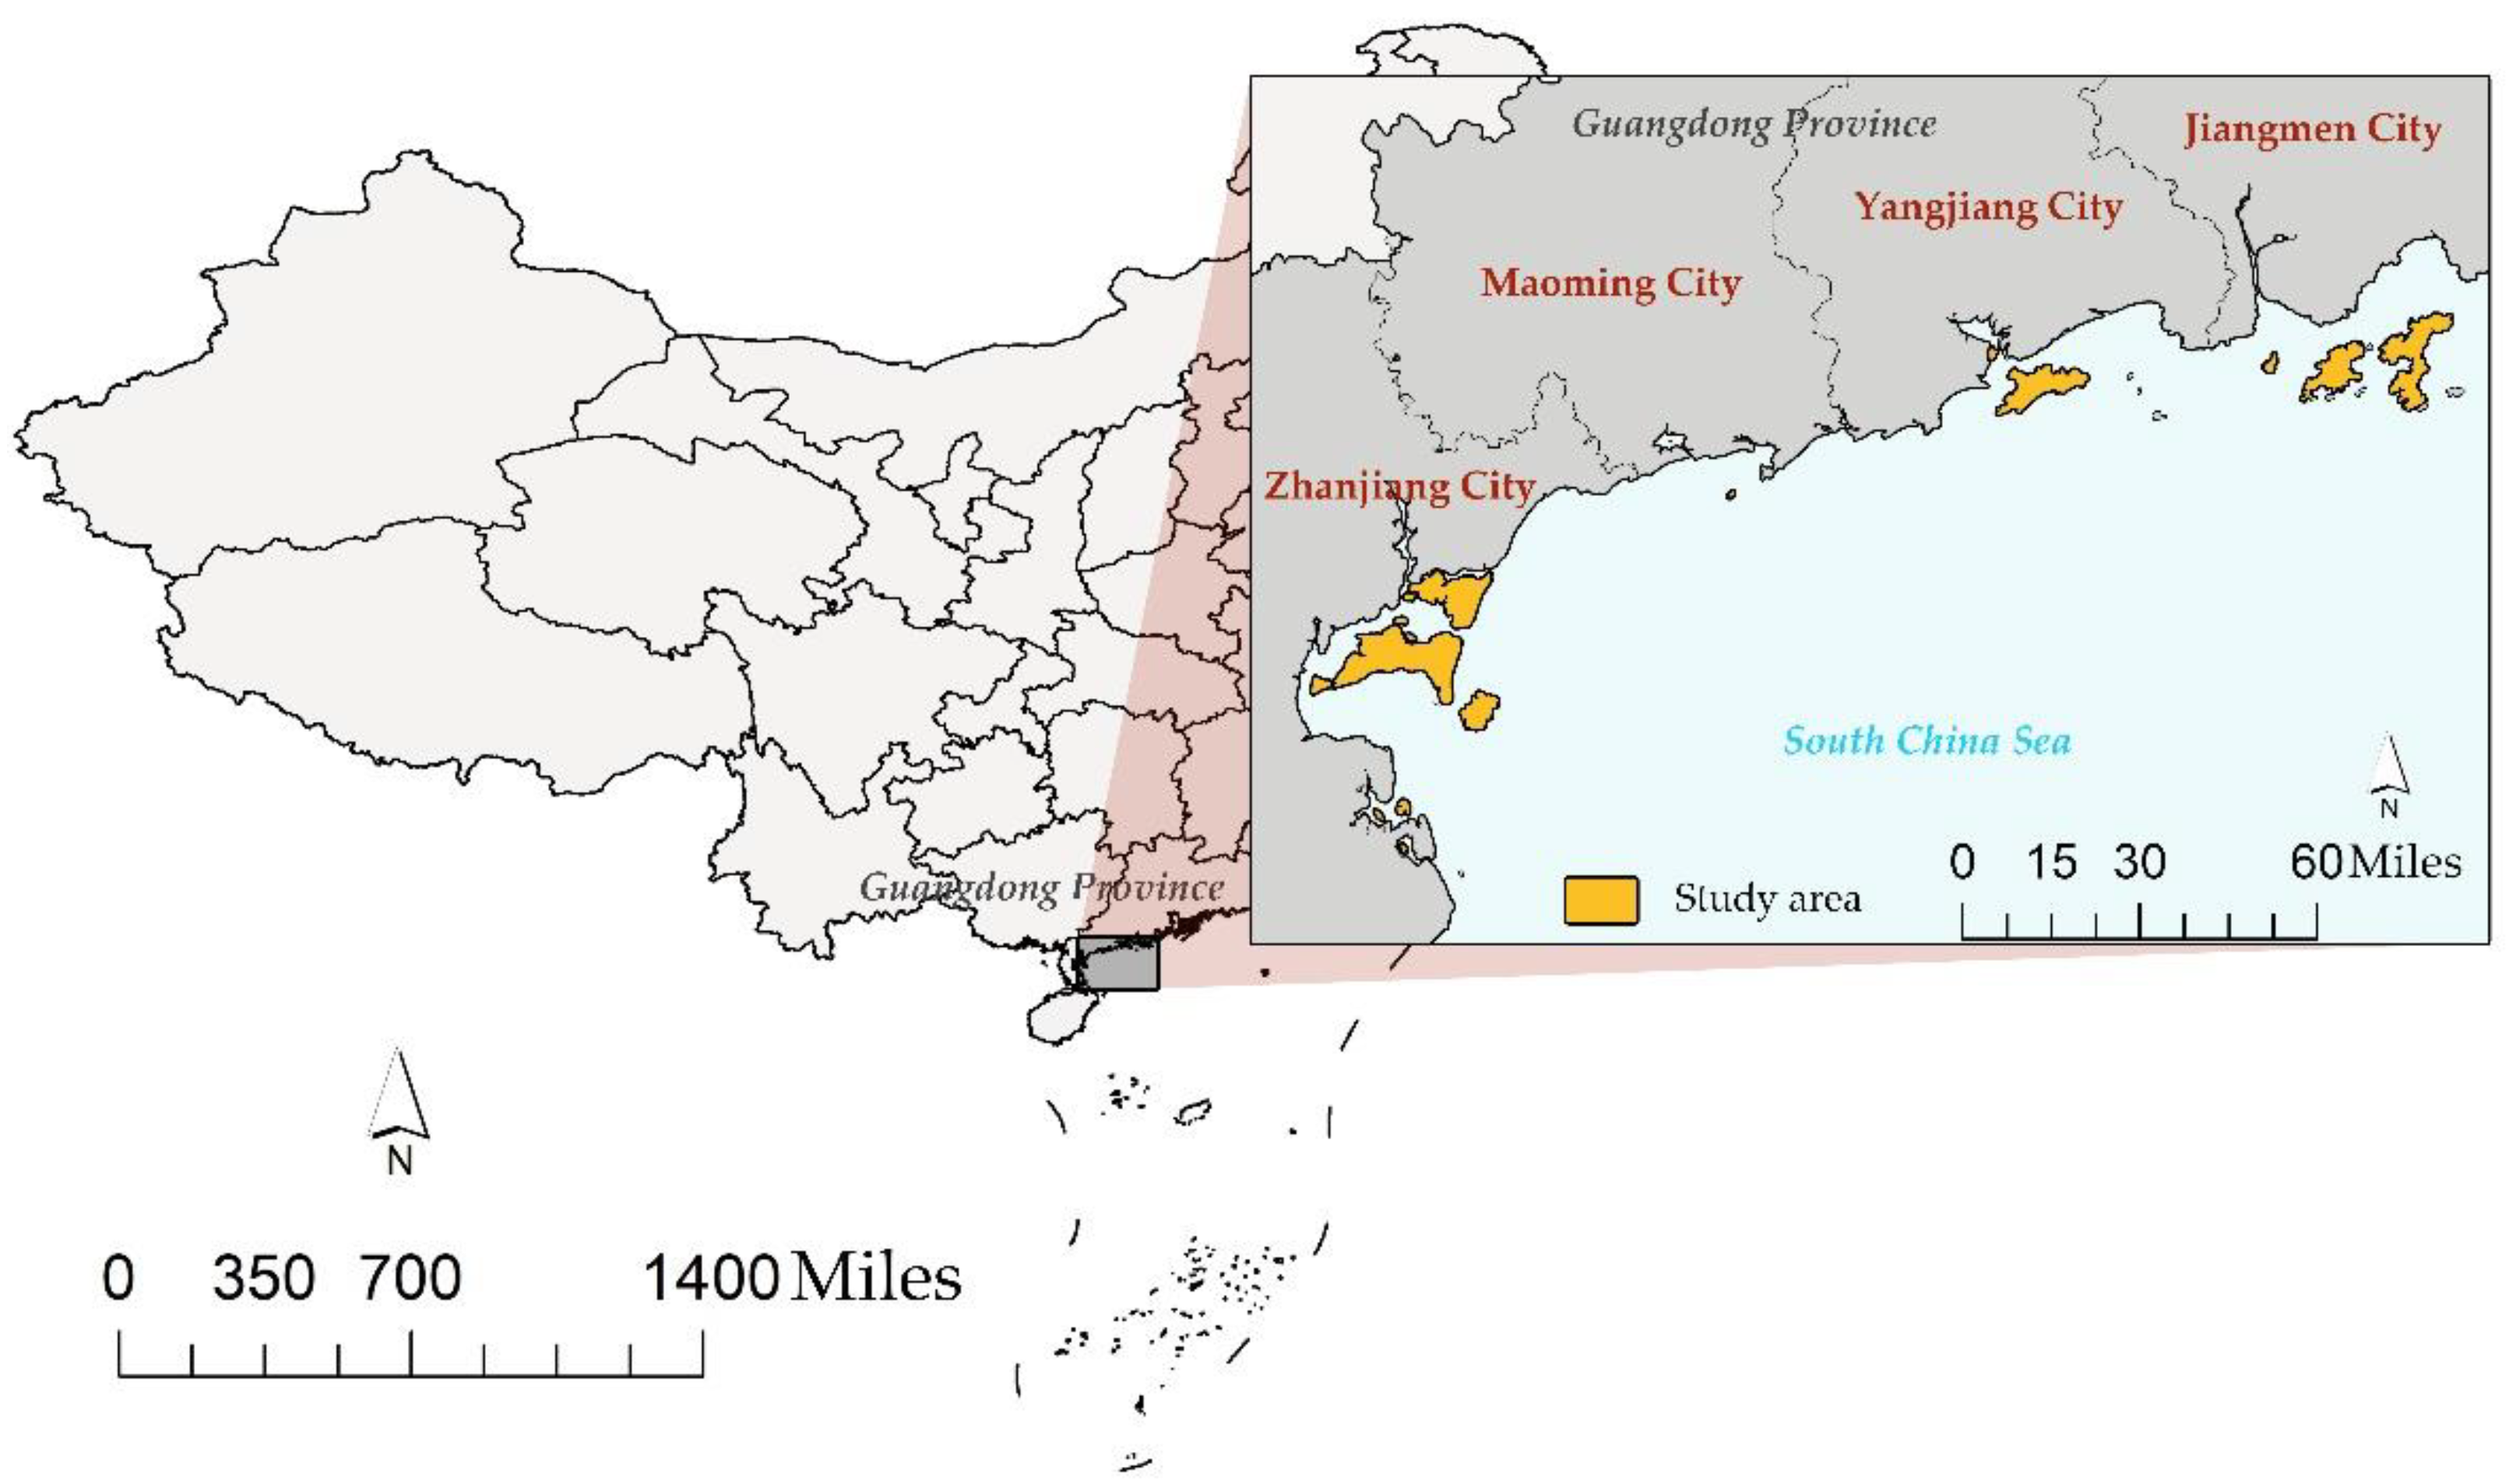
2.1. Study Area

The study area covers 17 populated offshore islands (within approximately 30 nautical miles) in the western sea area of Guangdong Province (Figure 1). The largest island in the study area is Donghai Island, with an area of 286 km2, and the smallest island is Gonggang Island, with a mere area of 1.26 km2, and all the islands are located at a distance of about 0.4 km~18 km from the coastline. The study area belongs to the subtropical climate. Compared with the coastwise mainland, the islands have an oceanic climate, with an annual temperature of 1~1.5 °C lower than that of the adjacent mainland; the number of days with at least Level-8 gale on annual average is 3~8 times that of the adjacent mainland; the annual amount of evaporation is 20~200 mm higher than that of the adjacent mainland [33].

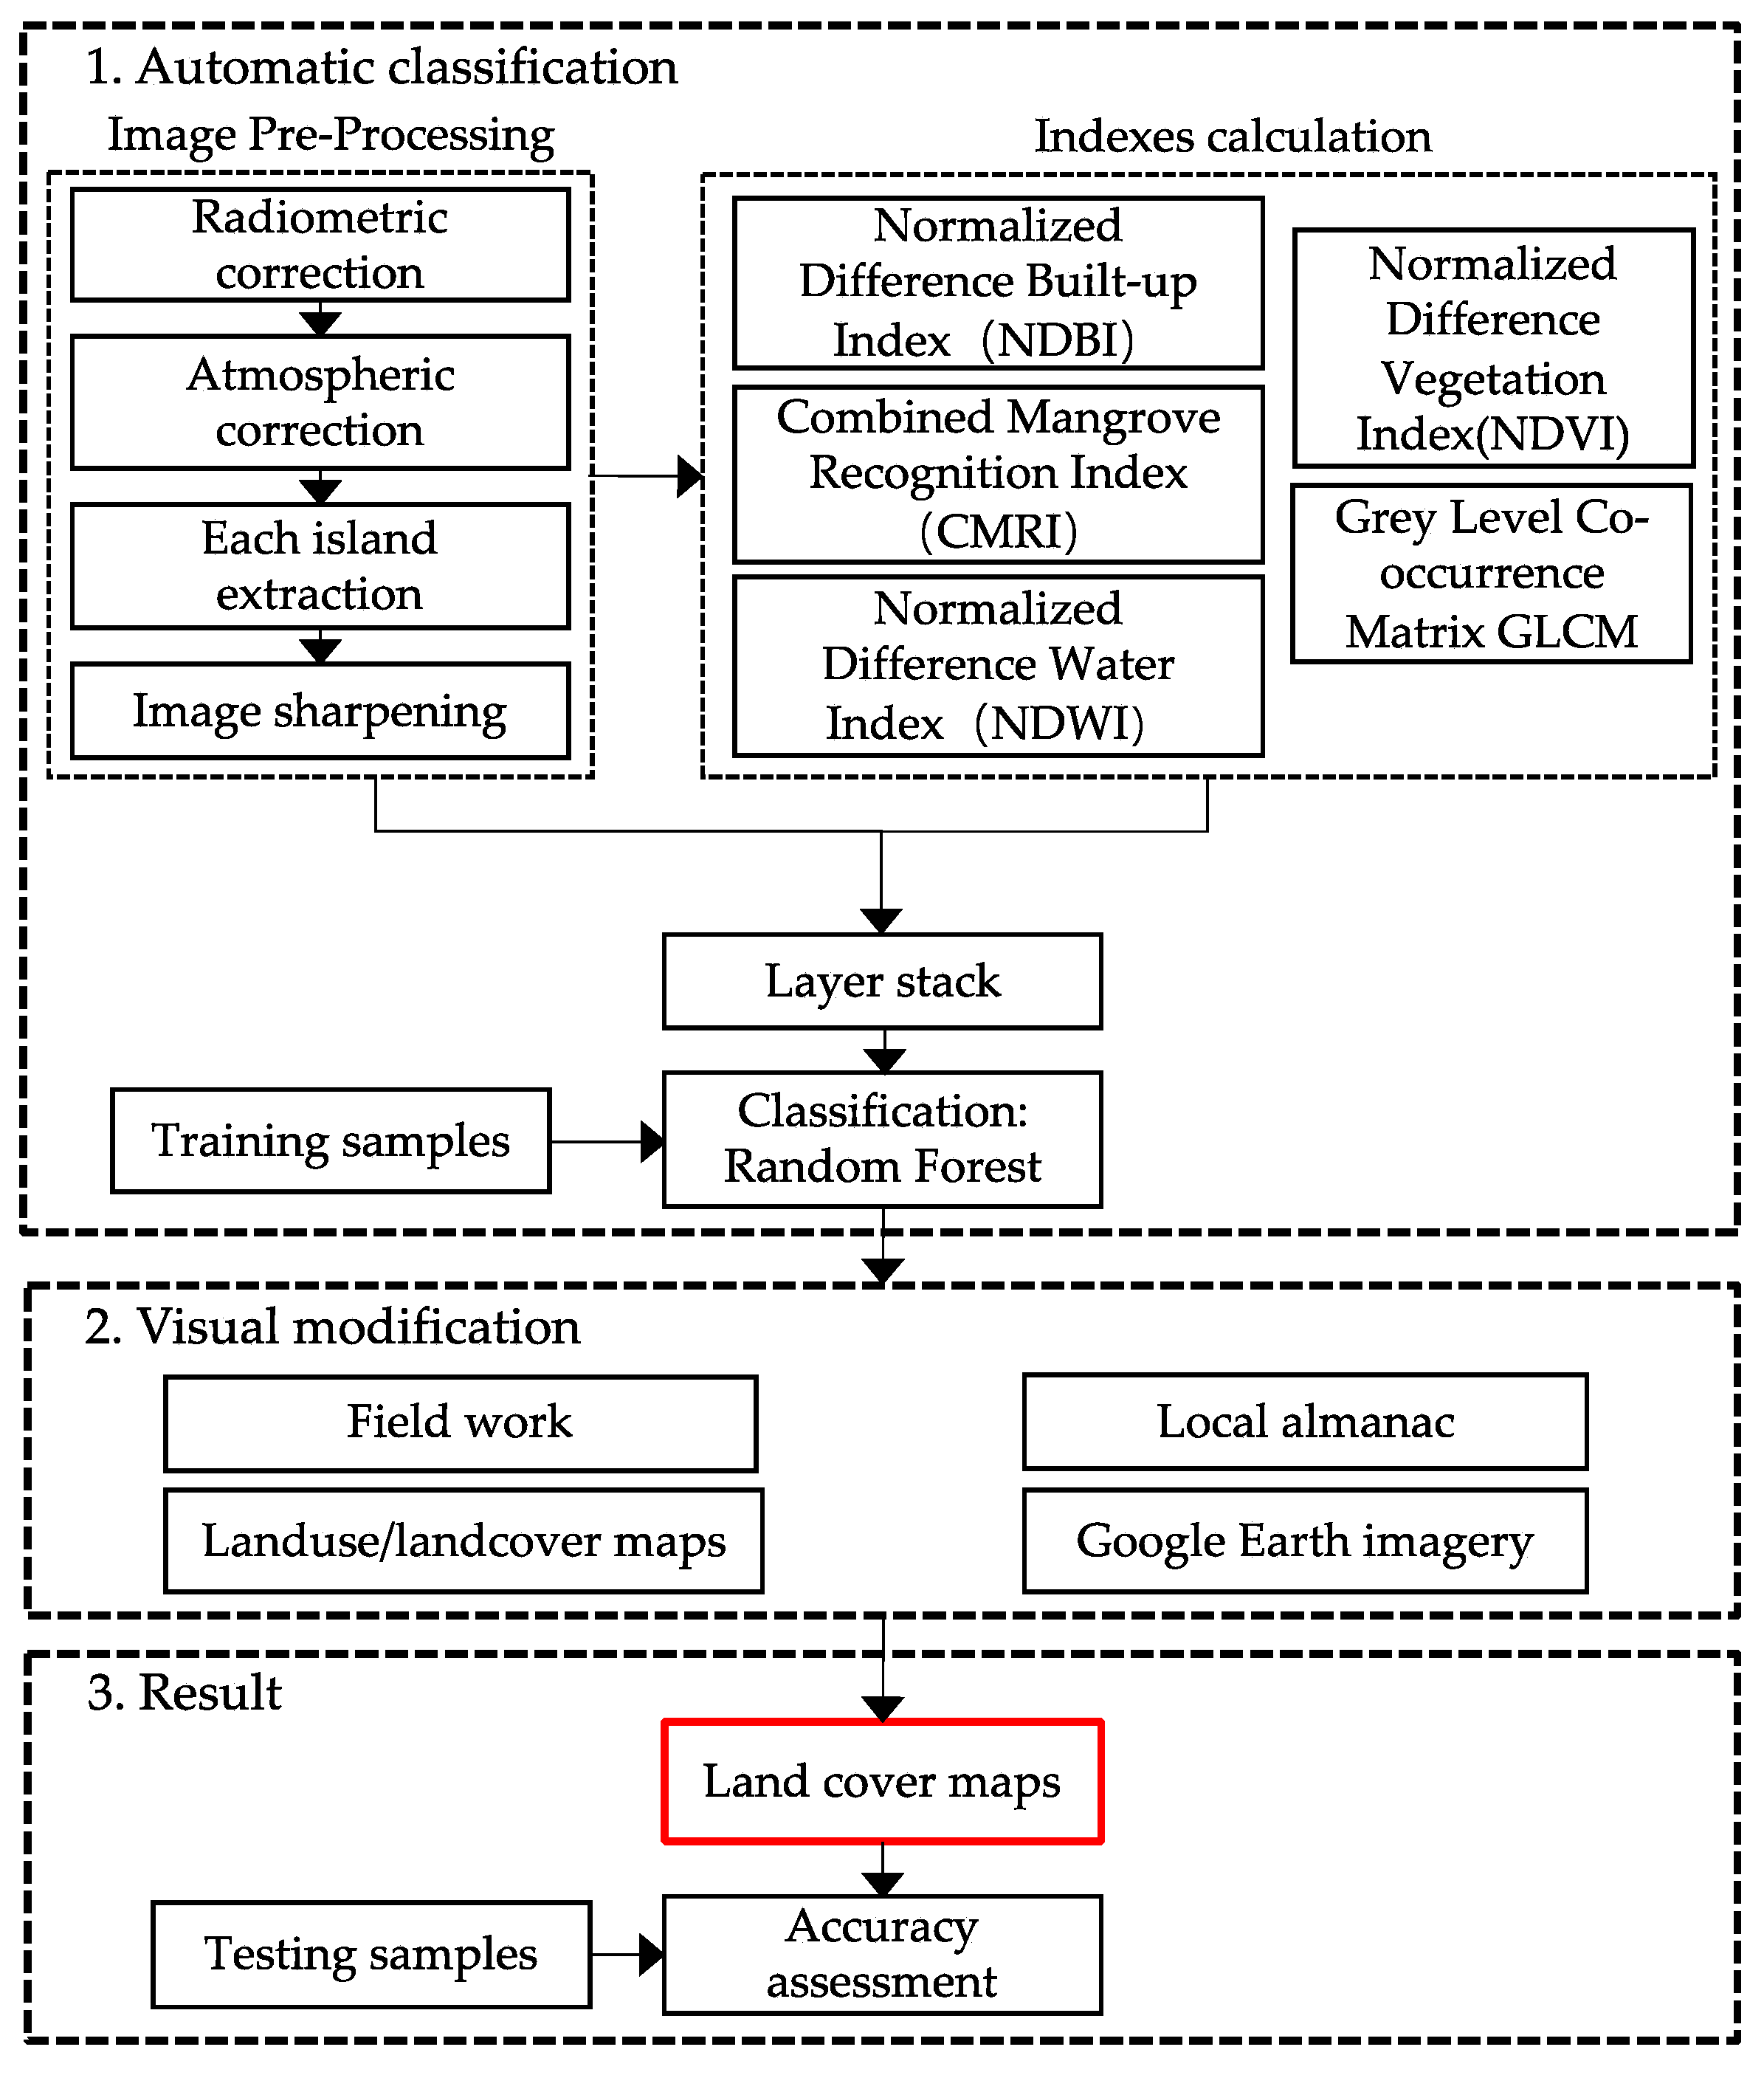
2.2. Data Processing and Classification Method

This study uses satellite images and auxiliary data, and employs a hybrid classification approach for image classification. The auxiliary data includes those from field investigation, yearbooks, local chronicles, Google images, and the land use/land cover maps of the Resource and Environment Science and Data Center (https://www.resdc.cn (accessed on 13 December 2021)). The auxiliary data were mainly used to identify training samples for image classification, testing samples for accuracy evaluation, and visually modified classified images. A hybrid classification method, which was developed for image classification, was found to be an effective approach to enhancing the accuracy of image classification [34]. This method includes automatic classification (random forest) and visual modification. The classification process is shown in Figure 2. See the following steps for details.

2.2.1. Data Processing and Classification Method

This study adopts the physical boundary of islands as the division, including the ecological and utilized areas of the islands’ intertidal zones and neritic regions. The Geospatial Data Cloud (http://www.gscloud.cn/ (accessed on 15 December 2021)) server was used to download Landsat 8 Operational Land Imager (OLI), and Thermal Infrared Sensor (TIRS) database was used for the images of the 2014s and 2015s. All images used in this study are from the dry season period (November–January), during which zero cloud cover allowed for high image quality. The raw images have a spatial resolution of 30 m.
Preprocessing is an essential step to correct atmospheric effects and minimize geometric and radiometric errors before image classification. This study used the ENVI software to undertake the radiometric calibration and atmospheric correction of all the images. A fusion or pan-sharpened multispectral (MS) image provides an improved image of high spatial resolution and can also improve the classification results [35,36]. Therefore, the panchromatic (PAN) band with a resolution of 15 m and MS images were adopted to be fused by the Gram–Schmidt (GS) method in this study. Subsequently, four pan-sharpened MS images with a spatial resolution of 15 m of the studied area were generated.

2.2.2. Island Classification

Referring to the 908 Special Project and “Law of the People’s Republic of China on the Protection of Islands”, according to their results of the classification of islands by geological composition, the islands were classified into three types: bedrock islands, volcanic islands, and sedimentary islands (Table 1). Furthermore, while classified, two or more islands connected via aquaculture pond(s) were deemed as one island.

2.2.3. Island PLES System Construction

The identification of a rural place or village varies in different countries. The term in this paper is identified as a region that is outside the urban built-up area and is a system of the territorial complex with natural, social, and economic functions [37,38].
Based on the island land-use classification formulated by the 908 Special Project (Table 2), the primary industries were emphasized and the ecological and utilized area of the intertidal zones and neritic regions were supplemented. Meanwhile, to allow for the resolution of remote sensing (RS) images, some microscale land-use types that were difficult to acquire from the images were merged and adjusted. The islands’ PLES-classification-system fit for the studied area was formulated afterward (Table 3).
The production space (PS) refers to the space dominated by the production functions. The PS includes paddy field, dryland, orchard land, and aquaculture pond, which supports agriculture and marine production. The reservoirs and ponds of the islands in the studied area mainly serve agricultural production and hence are classified as PS.
The living space (LS) refers to the space guaranteeing the survival of humankind and carrying human culture. Many time-honored villages on the islands in the studied area have historical, cultural, scientific, artistic, social, and economic value [39]. Thus, in this classification, the rural residential land was separated from the urban residential land by considering the further assessment and preservation of the traditional villages, and was classified into LS alongside land for the harbor and wharf.
The ecological space (ES) refers to the natural space which can maintain regional ecological security [40]. The mangrove forest is a critical ecological space in the study area, listed in the list of Ramsar Convention wetlands of international importance. Besides, wetlands, sandy beaches, and mudflats in the intertidal zones were highlighted in the PLES classification system. Due to the weak capacity of the islands to withstand natural disasters, this classification also stresses the shelterbelts, which defend against natural disasters, protect production, and maintain ecological balance, so as to highlight the particular ecosystem of the subtropical islands.

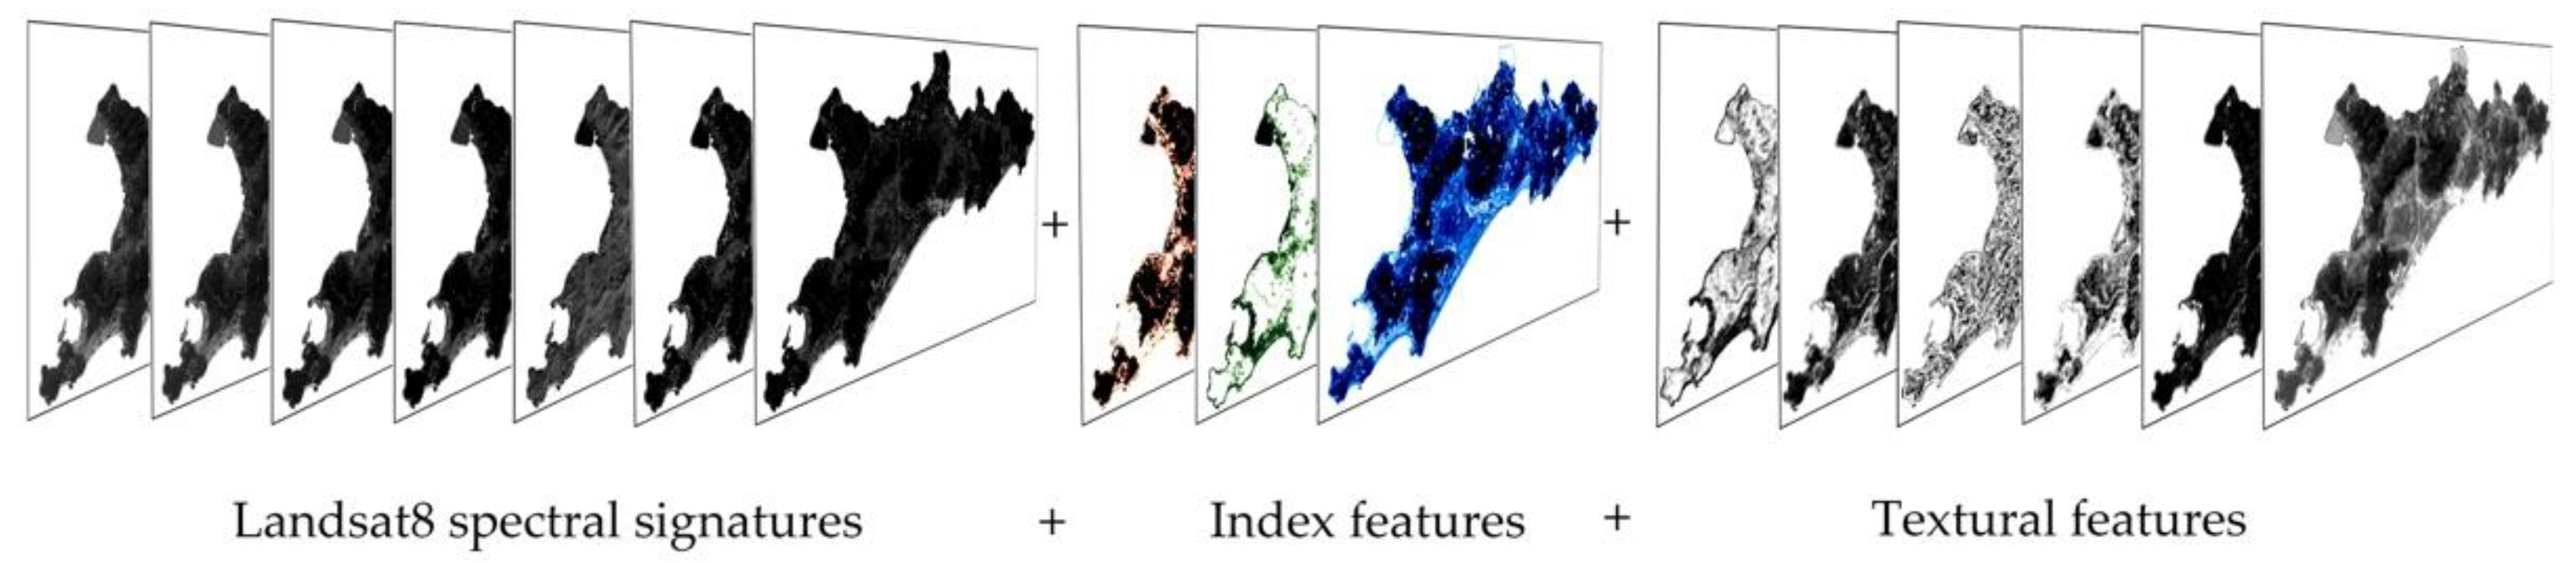
2.2.4. Imagery Feature Extraction

The construction of the categorical dataset requires the spectral signature, index feature calculation, gray-level co-occurrence matrix extraction, and feature fusion [41]. The spectral signature is the foremost feature in remote-sensing image classification [42], while the index feature can effectively enhance image classification accuracy. Index features include Normalized Difference Vegetation Index (NDVI) [43], Normalized Difference Water Index (NDWI) [44], and Normalized Difference Built-up Index (NDBI) [45,46]. Besides, this study adopts the Combined Mangrove Recognition Index (CMRI), which can enhance the discrimination between mangrove forests and nonmangrove vegetations [47] (Table 4).
The existing studies suggest that the gray-level co-occurrence matrix (GLCM) can effectively enhance the classification accuracy of various land-use types and diminish the classification errors due to similar spectral signatures [48]. Combined with the test, the study sets the window size of statistical pixels as 9 × 9 while extracting textures and selects the value of grayscale quantization level as 32 to calculate six textural features of images using the GLCM (Table 4).
After the calculations above, this step adopted the integrating the multifeatures method [49], including spectral features, texture features (GLCM), and index features. Each feature obtained in this study corresponds to a layer, and the method of layer-overlay is used for feature fusion (Figure 3). The integrating multifeatures method can significantly enrich the information content of remote sensing data, and one of the most commonly used methods to quantify the importance of features is decision trees.

2.2.5. Random Forest Classification

Random forest (RF) is an integrated learning technology that can generate a large number of decision trees for the training, calculation, and classification of samples. The bagging method is adopted in RF to generate independent, identically distributed training sample sets for each decision tree, and the final classification result of the RF depends on the voting of all decision trees.
The RF algorithm is amplified as follows: (1) obtain N (N is a random positive number) training sample sets from a large number of original samples, by drawing with replacement N times; (2) select m (m is a random positive number) classification features randomly from the total features in each sample set; (3) divide the nodes of the decision trees by complete segmentation methodology, and then build a great number of decision trees. After completing the classification for each decision tree, the classes of new samples are determined by a majority vote according to the classification results of the decision trees [50].
The main idea of using the random forest to measure the importance of features is to evaluate the contribution of each feature in each decision tree, and to calculate the average values. Subsequently, the contribution value of features can be compared.

2.2.6. Visual Modification

This study involves various classification types, with the existence of the phenomenon of “different objects with the same spectrum”. This leads to unavoidable ineffectiveness when distinguishing surface features. Therefore, in combination with the auxiliary data, the classification maps generated by RF were visually modified to enhance the classification accuracies.

3. Results

3.1. Classification Accuracy Evaluation

The accuracy assessment gave overall accuracies of 87.06~97.38% for the images of all the islands. Meanwhile, the kappa coefficient was 0.84~0.96. Images of larger islands coincide with higher accuracy, whereas images of smaller islands coincide with lower accuracy. The user and producer accuracies of the various thematic classes were over 81.3%, except for ponds (70.3%), reservoirs (72.7%), and bare lands (71.2%).

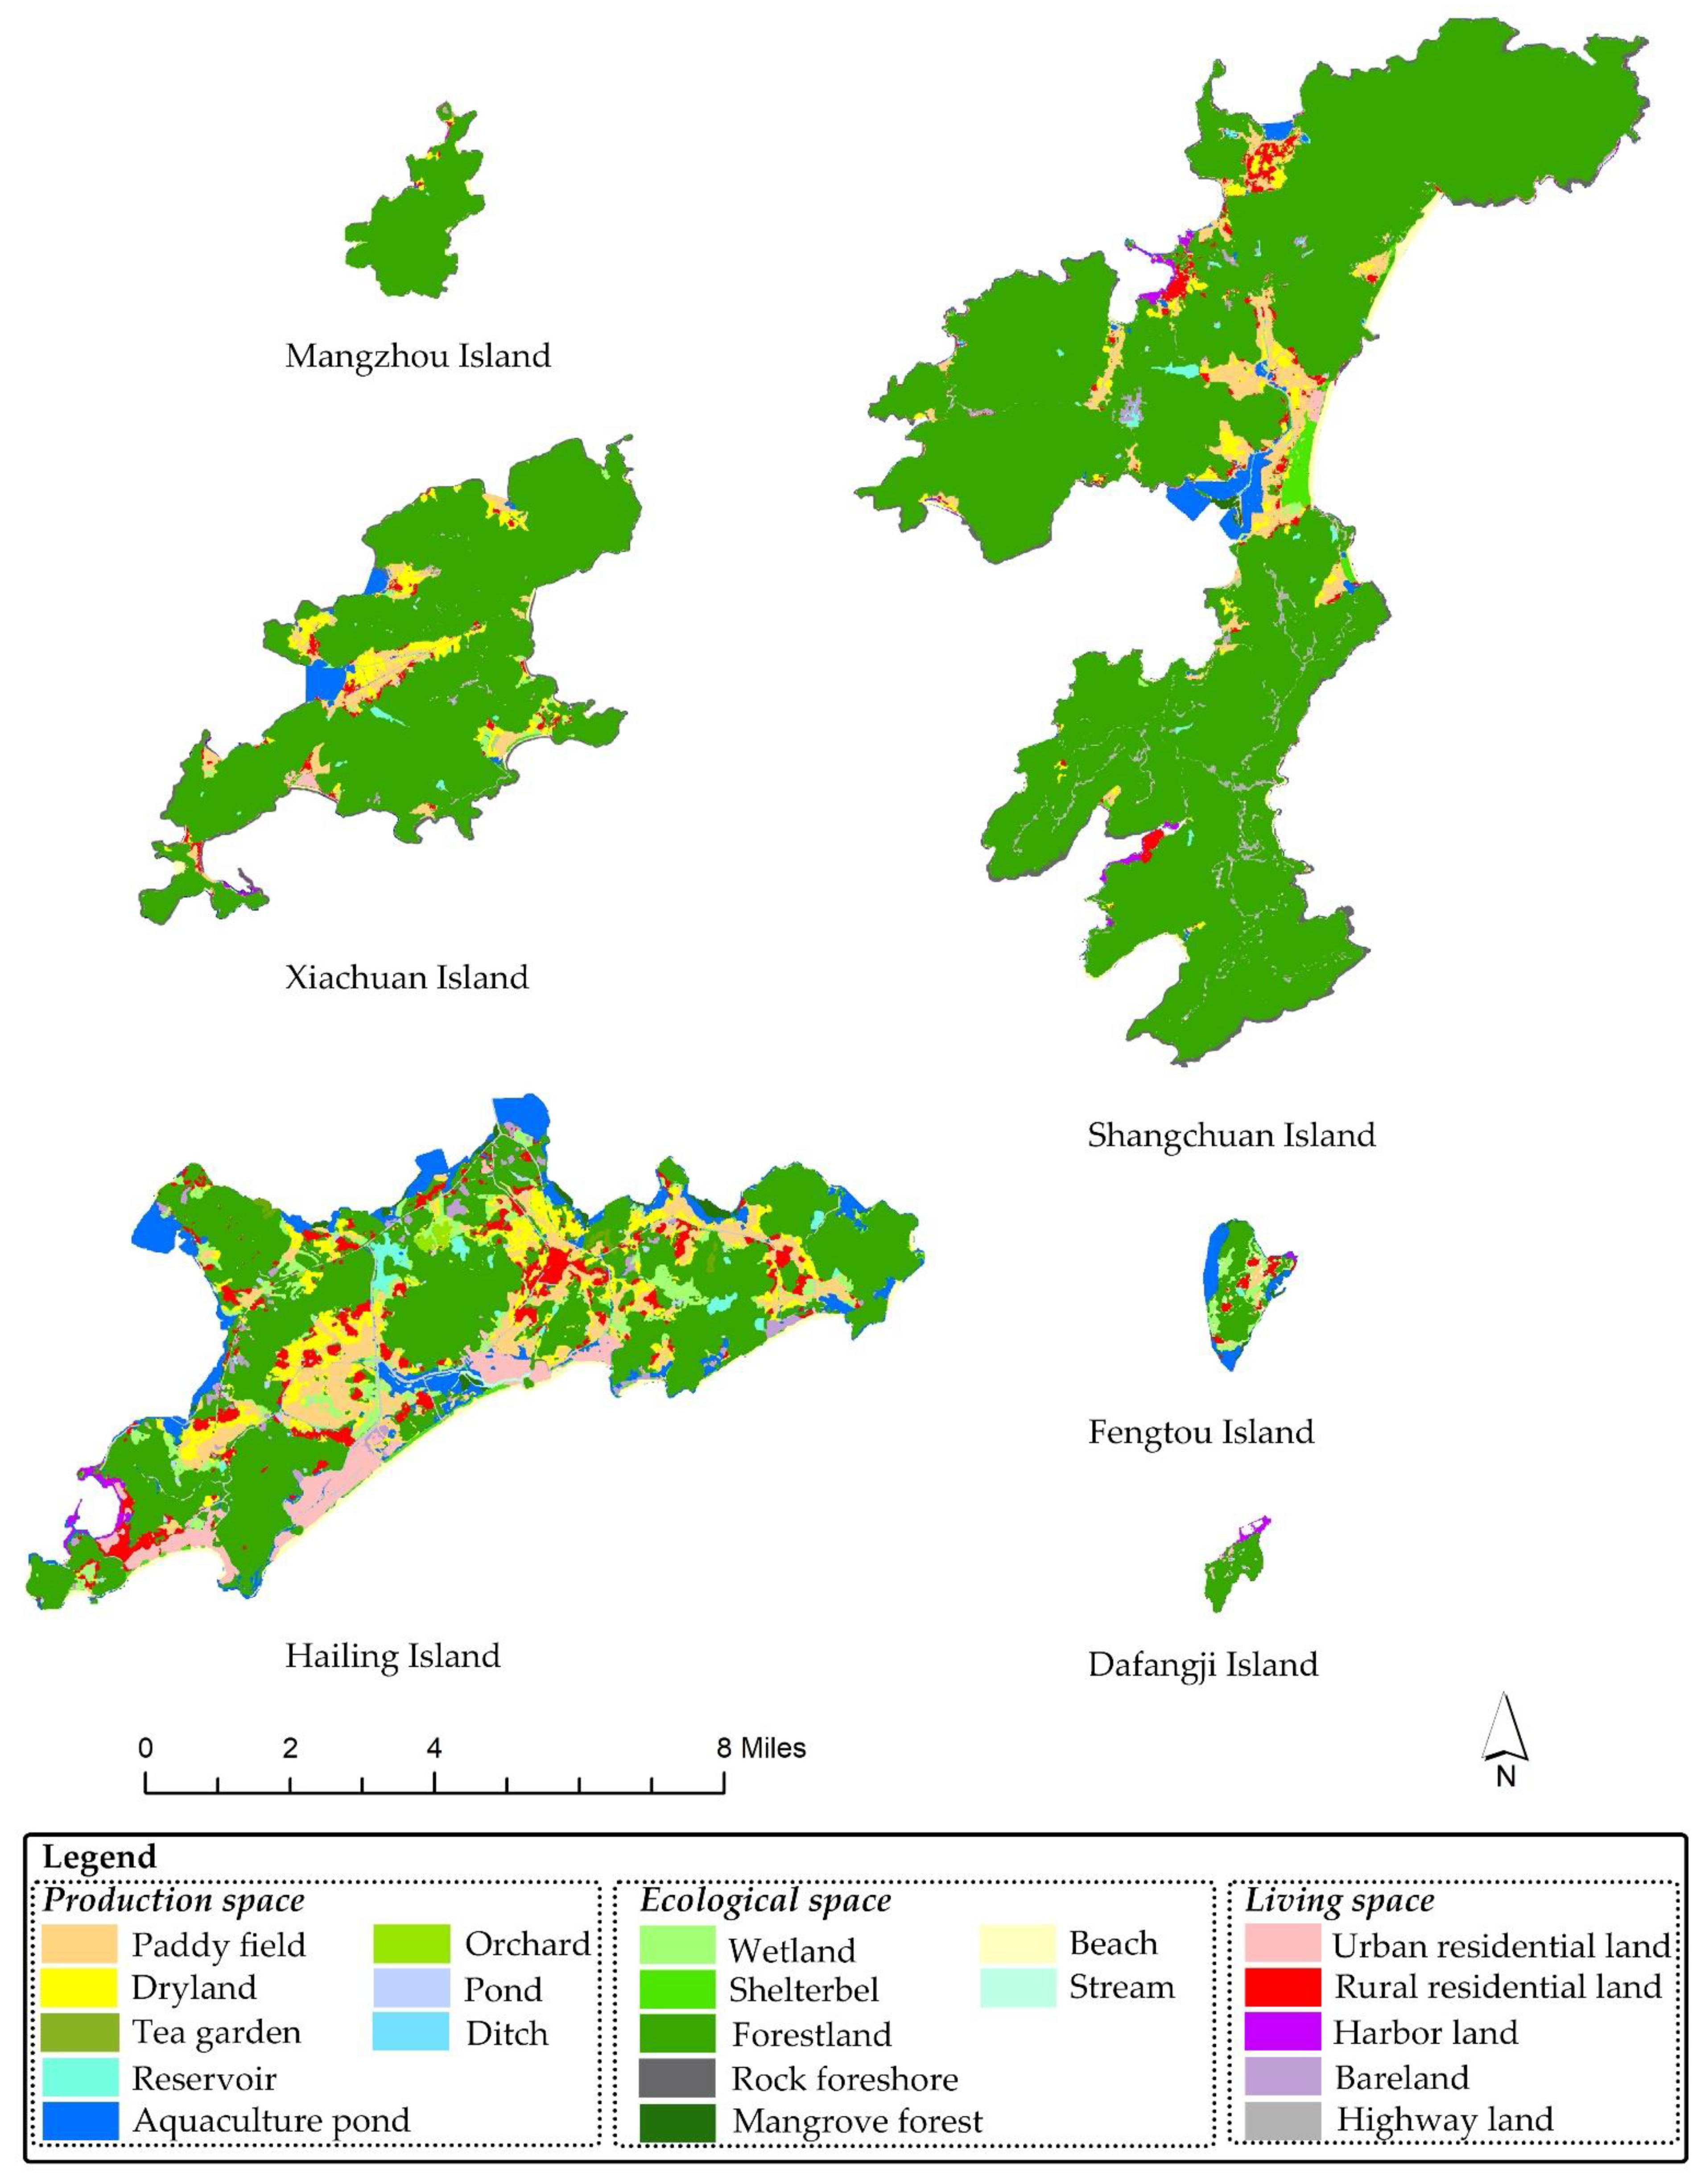
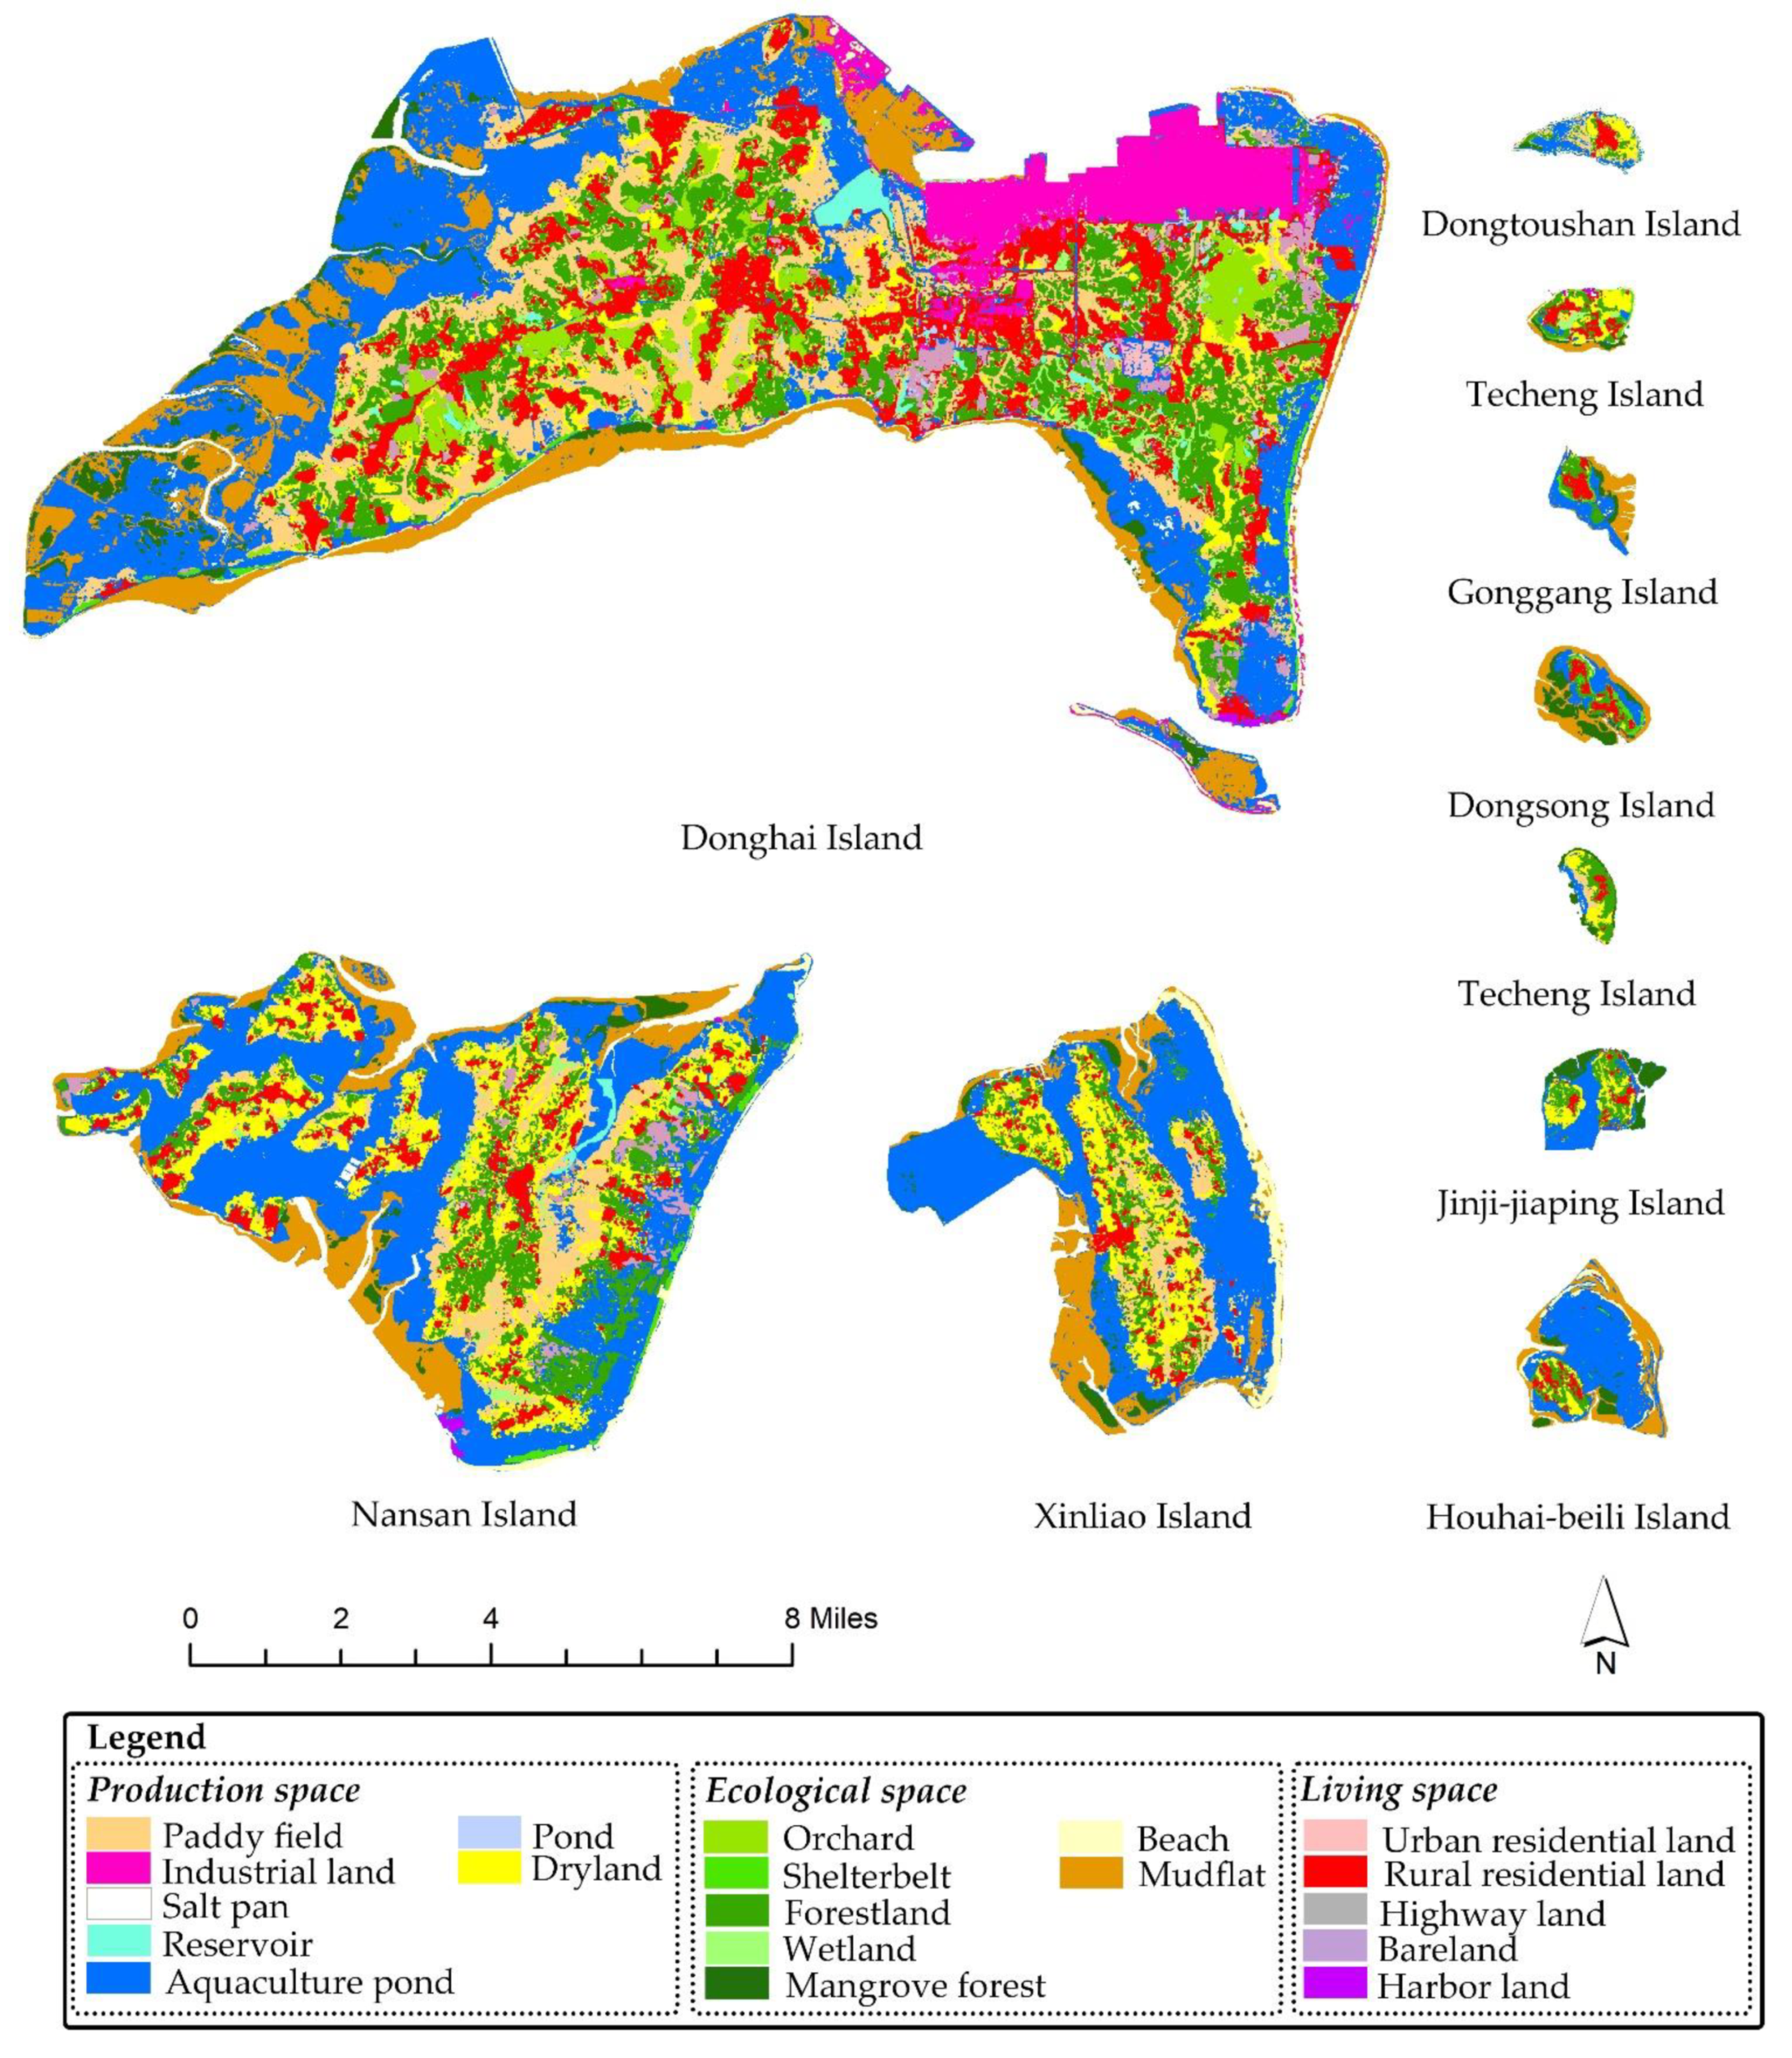
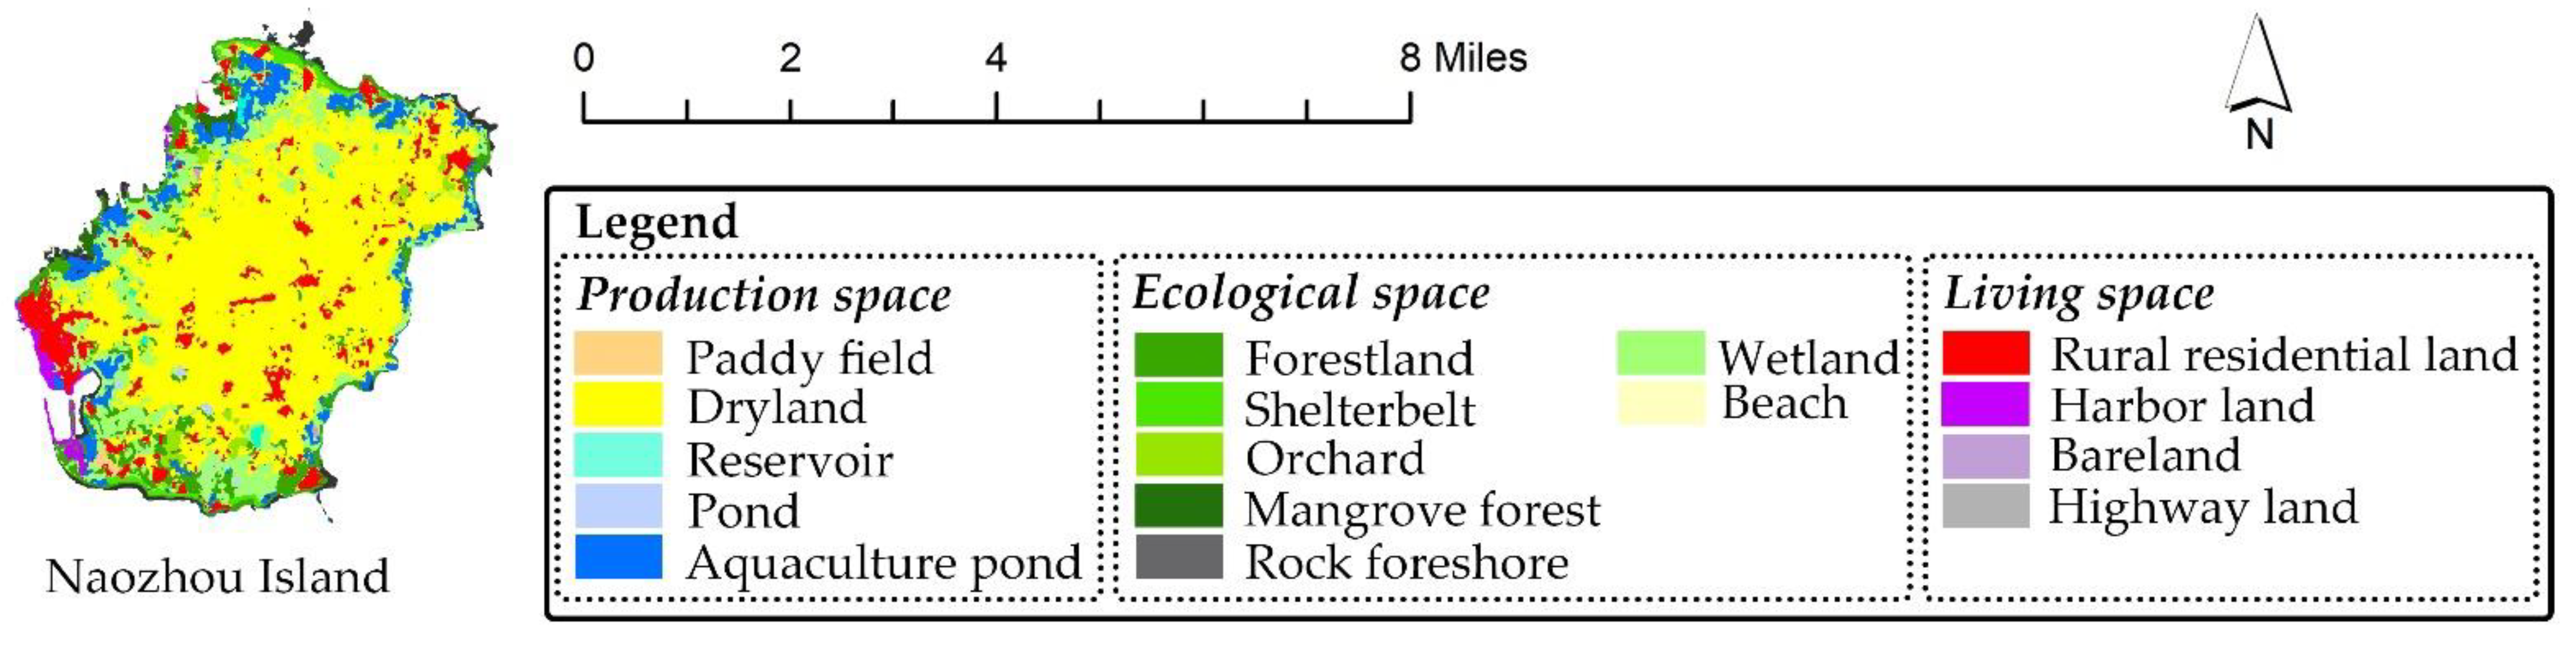
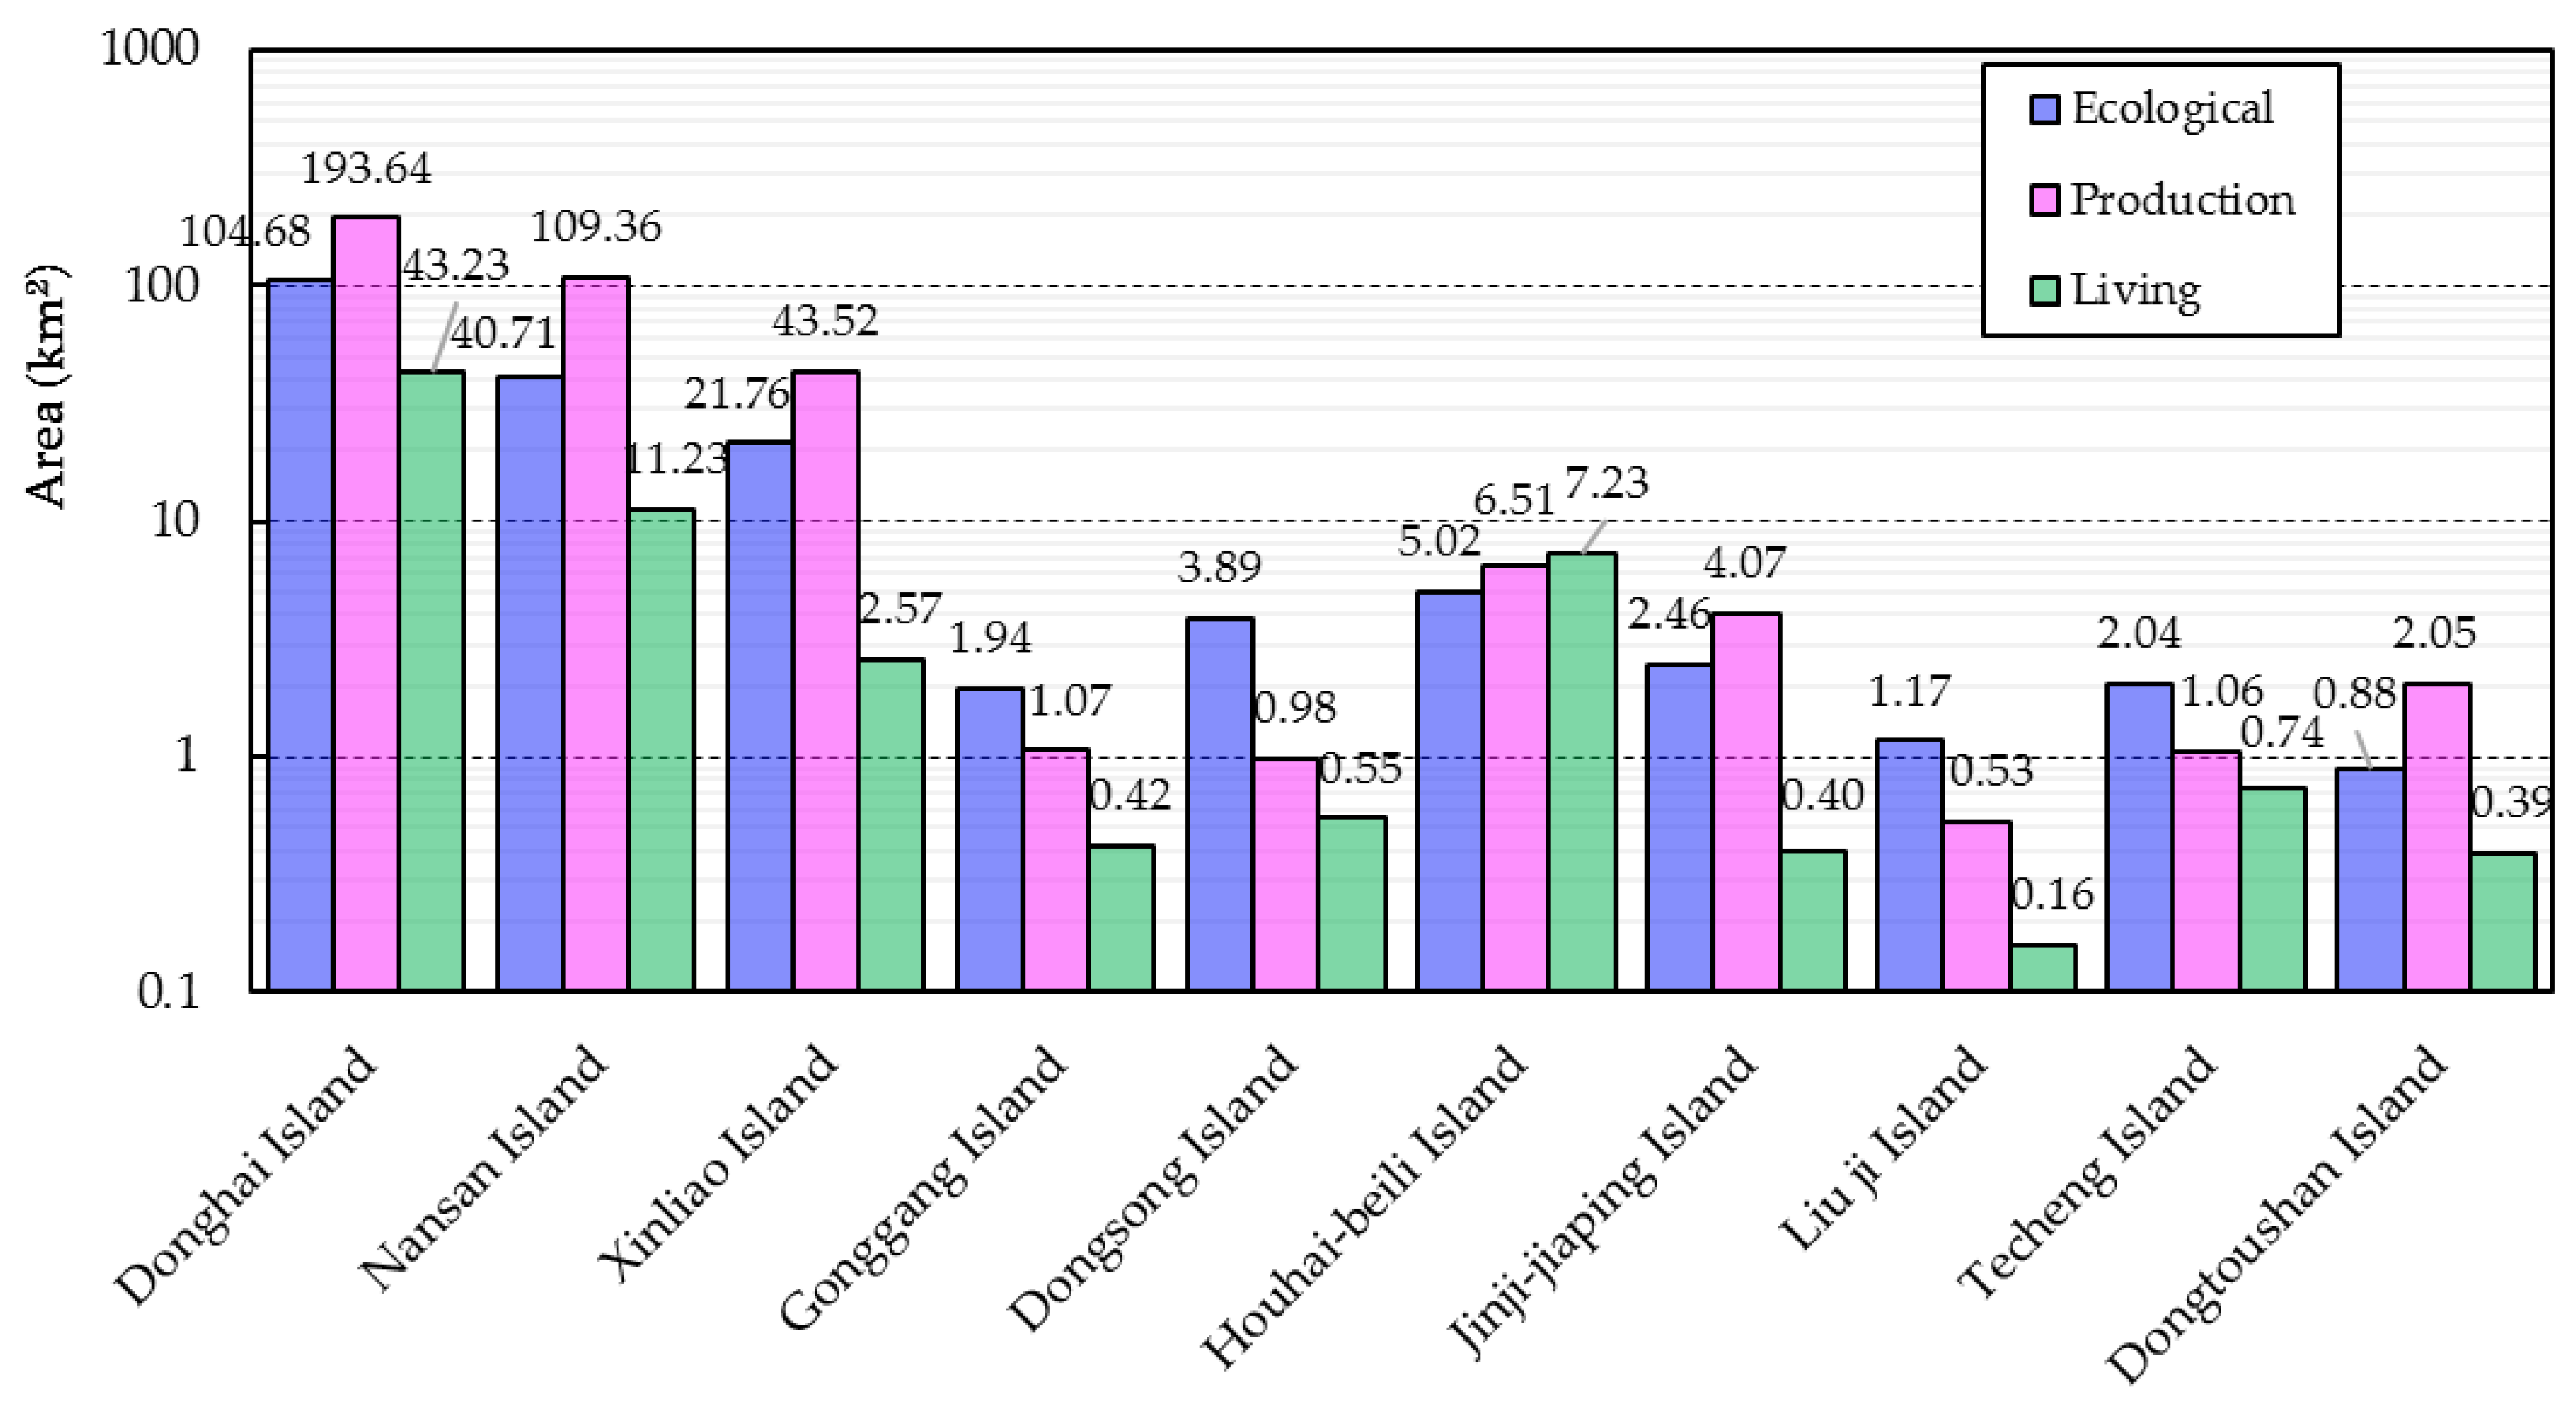
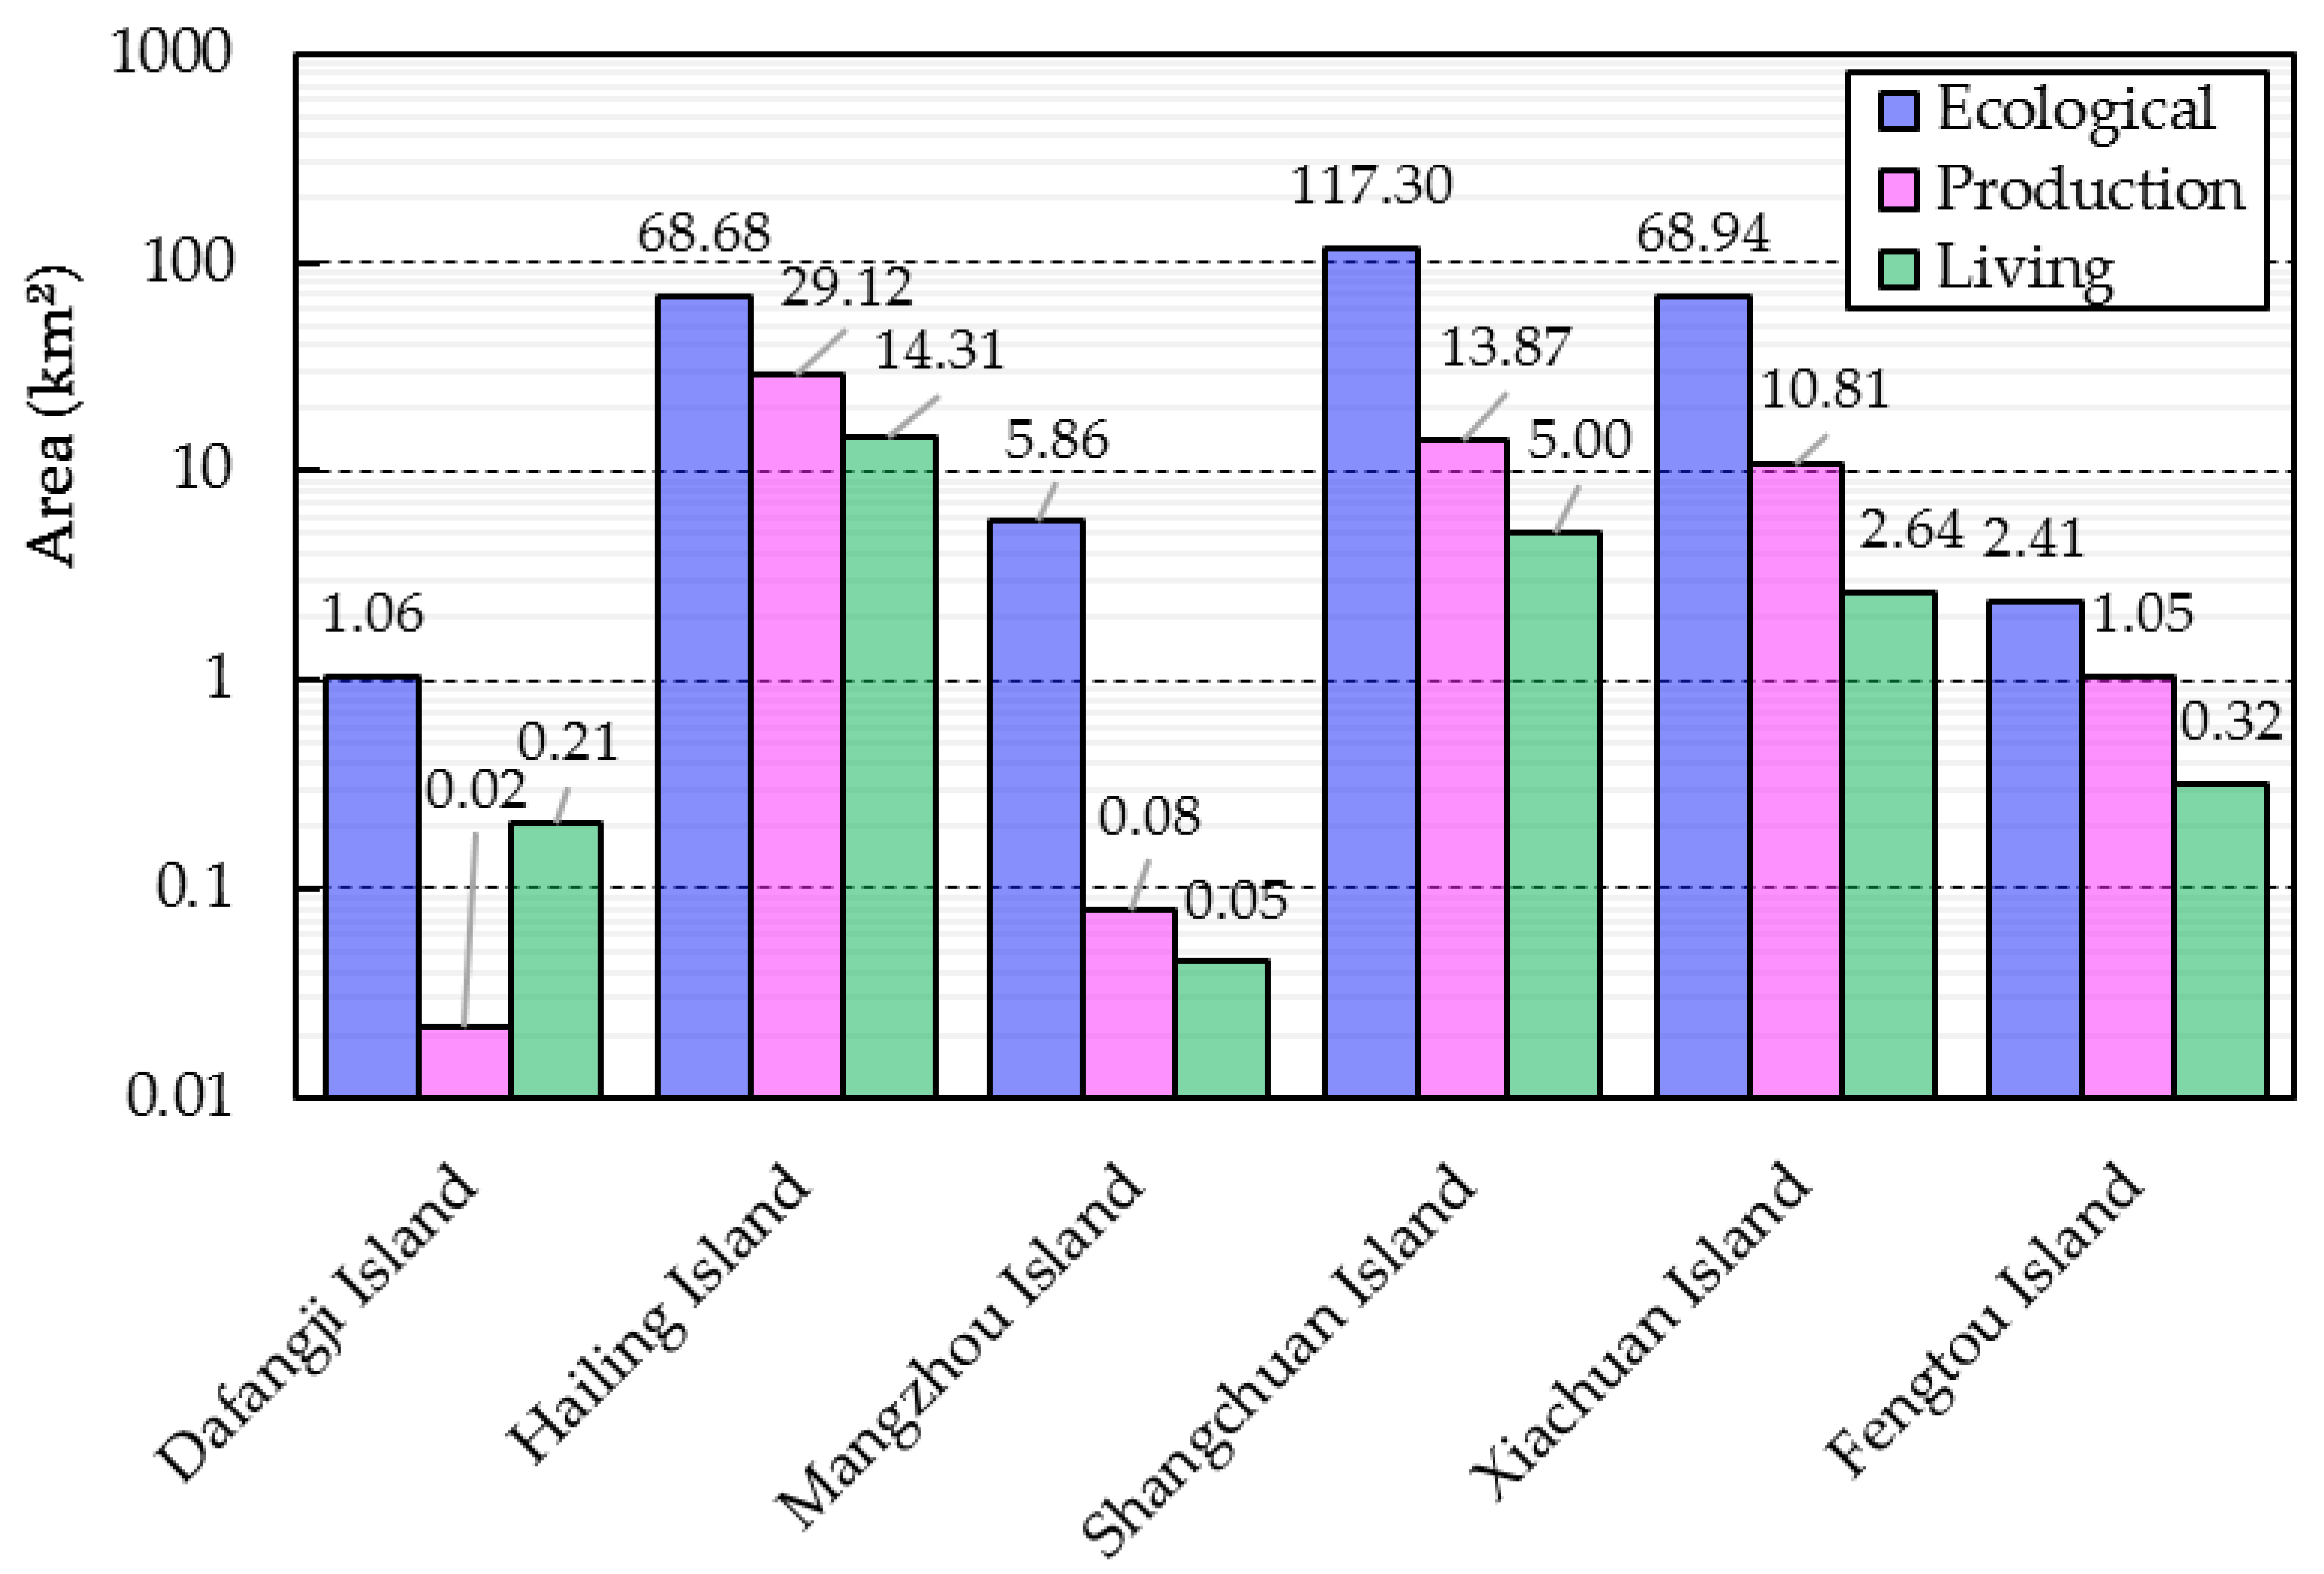
3.2. Types and Quantity of PLES Classification of the Islands in the Western Sea Area of Guangdong Province

Through the result of PLES classification, the number of PLES types on a single island range between 6 and 19. The PS types divided from the Landsat images include paddy field, dryland, salt pan, aquaculture pond, industrial land, tea garden, reservoir, pond, and ditch. The ES types include forestland, shelterbelt, mangrove forest land, wetland, beach, rock foreshore, mudflat, and stream. The LS types include rural residential land, urban residential land, harbor land, bare land, and highway land. Some secondary types of PLES are distributed only on certain islands. For example, in the PS, the industrial land and salt pan only appear on the sedimentary islands, a vast majority of irrigation ditches are distributed on the bedrock islands, and tea gardens are distributed only in a small area on the bedrock islands. Most mangrove forests and mudflats in the ES are distributed on the sedimentary islands. Only a few streams are distributed on the bedrock islands, while rock foreshores are mainly distributed in the relatively large area on the volcanic islands (Figure 4, Figure 5 and Figure 6).

3.3. PLES Distribution Characteristics of the Three Types of Islands in the Western Sea Area of Guangdong Province

Overall, the areas of LS are less than both PS and ES in all types of islands. Rural residential lands are the main component of LS and are distributed dispersedly, while the urban residential land is mainly distributed on the bedrock islands. The aquaculture pond is the dominant land-use type in PS of the intertidal zone in the study area, with various proportion levels.
The bedrock islands are dominated by ES, with an area of 264.24 km2, or 70.35% of the area of bedrock islands. The ES is mainly composed of forestland, which takes 48.0%~89.4% over the island area, and is concentrated distributed on the island–continent part. The ES of the intertidal zone is made up of rock foreshore, with a small area. The PS occupies a total area of 54.95 km2, representing 14.63% of the bedrock island. The arable land of the island–continent part in bedrock islands takes up a large proportion, from 1.2% to 16.1%, except for Fengtou Island. The LS area of bedrock islands is 22.52 km2, accounting for only 6.0% of the bedrock island’s total area, and the quantity of the harbor land is more than other islands, as shown in Figure 7 and Table 5.
The sedimentary islands are dominated by PS, with an area of 362.79 km2, or 77.26% of the sedimentary islands. In PS, the aquaculture pond is the dominant land-use type and is mainly distributed in the intertidal zone, and the area of aquaculture ponds on some islands even takes up 50%, while the paddy field occupies a large proportion of the island–continent part. The proportion of the intertidal zone of ES occupies an area of 184.55 km2, or 39.3% of the island’s total area, and is formed by mudflats and mangrove forests. In comparison, the ES of the island–continent part is composed of forest and shelterbelt. LS occupies an area of 66.92 km2 (or 14.25%) of the sedimentary islands, as illustrated in Figure 8 and Table 5.
The number of the volcanic island samples is less than that of other island types. The overall distribution of their PLES is similar to the sedimentary islands. PS takes an area of 32.87 km2 or 58.69% of the island. The dominant land-use type in PS is day land (53.20%), and the intertidal zone is mainly occupied by aquaculture ponds. The ES on the island–continent part occupies 25.35% of the volcanic island and comprises wetland (13.80%), while rock foreshore takes a large proportion of the intertidal zone. The LS of volcanic islands occupies an area of 9.41% (see Figure 9 and Table 5).

4. Discussion

4.1. Satellite-Image-Classification-Based Method and Classification Accuracy

In this study, the accuracy of most images can reach a threshold of above 90%. Although some of the user and producer accuracies are lower than 80%, most have an accuracy between 81.3% and 99.5%, and such an accuracy threshold is deemed satisfactory for the studied area with complex and diverse land features categories [51].

4.2. The Formation and Distribution Mechanism of PLES from the Geomorphic Perspective

The PLES diversity in the studied area is closely related to island sizes. Usually, islands with a larger area have relatively complete geomorphic combinations with more developable geomorphic types [52]. This kind of island has more diversified PLES. In contrast, the landform of small islands is unitary. Some small bedrock islands only have hills and sandy beaches. Thus, the exploitation extent is limited, with less PLES (Table 5). Furthermore, the geomorphology of islands also influences the development level, dominant space, and distribution characteristics. According to the concept and method of Geomorphons [53], the geomorphic elements were extracted from DEM data by ArcGIS, and the PLES of different islands was analyzed in this study.

4.2.1. Bedrock Islands

The diversity of PLES in the bedrock islands dominated by hills is lower than that of the islands occupied by platforms. For example, the area of Hailing Island is similar to Xiachuan Island, but the PLES diversity of the former is higher because the platform occupies nearly 50% of the total area.
The hill and platform difference led to the ES and PS/LS dualistic pattern of the bedrock islands. Hills generally account for over 60% of the bedrock islands, and forest land in ES is mainly distributed in hilly areas, with an altitude of 16–517 m and steep slopes. Since hills are not developed on a large scale, a few primary and some secondary forests are preserved, with a large area of the artificial forest planted and the nature reserve established [54], leading to the idea that ES maintenance is better than that of other island types.
Generally, PS and LS are distributed on the platform at an altitude of 0–20 m. The platform area of the bedrock island is usually small; thus, the exploitation of PS and LS is limited. In PS, arable land irrigation mainly relies on reservoirs, resulting in more reservoirs reconstructed from bedrock islands than other islands under a water-scarce situation. In PS of the intertidal zone, since the shoal area is small, the aquaculture ponds cannot be built on a large scale. In LS, the natural environment of the bedrock islands is more suitable for harbor exploitation since they have a jagged coastline, deep near-shore water, and fewer barrier shoals. Thus, the number of harbor land in bedrock islands is more than that of other island types.

4.2.2. Sedimentary Islands

The altitude of the sedimentary island is 0–93 m, with over 95% of areas lower than 16 m, and the flat terrain caused a high level of exploitation indirectly, including small islands with an area of 1 km2 to 3 km2. Thus, the proportion of PS and LS in sedimentary islands is large.
The marine depositional plain and mudflat are the main geomorphic types of the sedimentary island, leading to the different dominant land-use types of PS and ES on the island–continent and intertidal zones. Sedimentary islands are formed by the deposition of sediment flow [55], during which more sandy lands are formed, with the low-lying wetlands evolving from tidal creeks on the island–continent. These landscapes are primarily turned into drylands and paddy fields. These islands, with a low vegetation coverage, are susceptible to desertification and storm surge invasion, so many casuarinas are cultivated for wind-breaking and sand-fixation in this area. Furthermore, the intertidal zone of the sedimentary island developed a large area of mudflat, offering the enabling environment for the mangrove forest growth and the aquaculture pond reclamation. Thus, the area and the density of aquaculture ponds far outweigh the other islands under disorderly exploitation.

4.2.3. Volcanic Island

Naozhou Island features a volcanic landform, which has the altitude ranging from 0 to 81 m and decreasing outward from the crater center with a gentle slope gradient. Thus, it is intensively exploited. Since loping fields on volcanic islands with a topographic relief gradient between 10–40 m lack surface water, many drought-tolerant crops are planted in this area, such as sweet potatoes, peanuts, and mung beans. Combined with the field research, local literature, and historical satellite maps, it is found that some lagoon and ancient lagoon landforms were developed on the coast and intertidal zone. The formation of harbor lands mainly relies on the lagoon landforms. While the wetlands mostly evolved from ancient lagoons and most reservoirs, paddy fields were exploited on this geomorphic type.

4.3. Problem Analysis of PLES and Exploitation Suggestions

4.3.1. Problem Analysis of PLES

The specialties of the small islands (e.g., low environmental carrying capacity and limited natural resources) restrict the production and living activities of the island. With the different degrees of anthropogenic activities and exploitation in various types of islands, the ecological environment has been affected at different levels: (1) The overall threat to ES in bedrock islands is less than that of other island types. Among them, ES of the island–continent part is less contaminated by agricultural and domestic sewage. The primary pollution risk is concentrated in the intertidal zone, mainly from the harbor lands and aquaculture ponds, especially in Hailing Islands. (2) The contradictions between PS, LS, and ES in the sedimentary island are more prominent. The problems are as follows: most sedimentary islands have no garbage disposal facilities except for the islands with large areas (e.g., Nansan Island and Donghai Island); much domestic and agricultural sewage threatens the ES of the island–continent part after intense exploitation, especially on the natural wetlands; and the mangrove forests and the mudflats in the intertidal zone are threatened by the high-density aquaculture ponds in disordered distribution. (3) According to the field investigation, the water shortage and overuse by tourism and agriculture are the main ecological issues for the volcanic island.
The production activities of the islanders were restricted by the frequent wind disasters and water scarcity of these islands. In order to increase their income, the islanders on the sedimentary and volcanic islands adopted large-scale and high-density aquaculture systems and drought-tolerant economic crop patterns. However, the income of islanders who participated in traditional agriculture is still unstable. This leads to the obvious population loss, farmland abandonment, and homestead hollowing of the agricultural areas. Although the islanders can increase their income by engaging in tourism on the bedrock islands, the islanders who participated in traditional agriculture face the same problems as the sedimentary islands and volcanic islands.
Overall, low exploitation can help to keep the PLES balance of small islands because it can sustain the available natural resources for production and living activities and have fewer threats to the ES. The PLES of bedrock islands maintains the balance through the low exploitation rate and comparatively abundant natural resources. However, the drastic human–land conflict causes a PLES imbalance on the sedimentary and volcanic islands.

4.3.2. Exploitation Suggestions

It is suggested that ecological carrying capacity and self-purification should be emphasized. Additionally, the core and buffer protection zones of the ecology and cultural relics should be established when further developing and planning these islands. To balance the PLES of these islands and meet the needs of the islanders, intensive agriculture, and fisheries, eco-friendly and novel industries with higher technologies can be introduced on these islands. Specifically, the development modes such as ecological tourism are more applicable to the bedrock islands. Ecological restoration should be considered before further exploiting the sedimentary islands. During the volcanic island exploitation, the agricultural planting structure and tourism mode should be fully considered for the sustainable use of water resources. Moreover, attention should be paid to the public infrastructure, such as the schools, transportation facilities, and garbage disposal facilities, to improve the livability of LS in these islands.

5. Conclusions

In the present study, Landsat images were used to identify and analyze the rural PLES of different island types in the western sea area of Guangdong Province, and the PLES distribution characteristics and formation mechanism were explored. The following conclusions can be drawn.
(1)
It is found that the ecological and utilized area of the intertidal zone and neritic region should be combined with the island–continent part, and the distinct industrial type should be considered during the establishment of the rural island PLES classification system.
(2)
The bedrock islands are dominated by ES, which is composed of forestlands. While the PS is the dominant space of sedimentary islands, and the aquaculture pond is the main land-use type. The dominant type of volcanic island is dryland. The rural residential lands are the main component of LS in all kinds of islands.
(3)
Altitudinal gradient and geomorphic characteristics are the main driving factors for the formation and distribution of island rural PLES. In addition, the exploitation level, preference of dominant industries, and PLES contradiction of different island types are clarified from a geomorphology perspective.
(4)
A comprehensive and targeted method of land-use classification and PLES establishment of the island is proposed in this study. Thus, this method is more applicable to the island areas, such as the Small Island Developing States, the small islands of other developing countries, or regions with similar natural resources. Moreover, it can be applied on the mesolevel and microlevel of space, as it is difficult to distinguish the boundaries between the cities and villages on the macrolevel. Additionally, this method could divide nonoverlapping boundaries and generate continuous geographical spatial maps with different functions. Therefore, the method is easier to accomplish in regional management and implement in the specific departments when facing practical applications.
This work only qualitatively analyzed the balance of the rural PLES of islands and how the rural PLES meet the needs of the islanders because the village-level social and economic data lacked statistics from the local statistical bureau. Such data is challenging to obtain from fieldwork. Nevertheless, a quantitative analysis of the social and economic data will be conducted in the future.

Author Contributions

Conceptualization, R.B. and Y.P.; methodology, R.B.; software, R.B.; validation, R.B.; formal analysis, R.B. and Y.P.; investigation, R.B. and Y.P.; resources, Y.S.; data curation, R.B., Y.S. and Y.P.; writing—original draft preparation, R.B.; writing—review and editing, R.B., Y.S. and Y.P.; visualization, R.B.; supervision, Y.S. and Y.P.; project administration, Y.S. and Y.P.; funding acquisition, Y.S. and Y.P. All authors have read and agreed to the published version of the manuscript.

Funding

This research was funded by National Natural Science Foundation of China, grant number 51978275.

Institutional Review Board Statement

Not applicable.

Informed Consent Statement

Not applicable.

Data Availability Statement

Not applicable.

Acknowledgments

The supports from Bureaus of Natural Resources in Yangjiang City, Zhanjiang City, and Taishan City, Agricultural Departments and local government offices of the islands in the study area, Local Chronicles Museum are acknowledged. The technological advises from Cheng Jiang from Western Sydney University are well acknowledged.

Conflicts of Interest

The authors declare no conflict of interest.

References

  1. Liu, J.; Wen, J.; Huang, Y.; Shi, M.; Meng, Q.; Ding, J.; Xu, H. Human settlement and regional development in the context of climate change: A spatial analysis of low elevation coastal zones in China. Mitig. Adapt. Strateg. Glob. Chang. 2015, 20, 527–546. [Google Scholar] [CrossRef] [Green Version]
  2. Jiang, X.W. Remote Sensing Image Processing and Interpretation of Island and Coastal Zone in Offshore Ocean of China, 1st ed.; Maritime Press: Beijing, China, 2016; pp. 6–7, 31–38. [Google Scholar]
  3. The State Council’s Opinions on Establishing and Supervising Implementation of the Spatial Planning System. Available online: http://www.gov.cn/zhengce/2019-05/23/content_5394187.htm (accessed on 19 March 2022).
  4. Zou, L.; Liu, Y.; Yang, J.; Yang, S.; Wang, Y.; Hu, X. Quantitative identification and spatial analysis of land use Ecological-Production-Living functions in rural areas on China’s southeast coast. Habitat Int. 2020, 100, 102182. [Google Scholar] [CrossRef]
  5. Deng, Y.; Yang, R. Influence mechanism of Production-Living-Ecological space changes in the urbanization process of Guangdong Province, China. Land 2021, 10, 1357. [Google Scholar] [CrossRef]
  6. Yang, Y.; Bao, W.; Li, Y.; Wang, Y.; Chen, Z. Land use transition and its eco-environmental effects in the Beijing-Tianjin-Hebei urban agglomeration: A Production-Living-Ecological perspective. Land 2020, 9, 285. [Google Scholar] [CrossRef]
  7. Lin, G.; Jiang, D.; Fu, J.; Zhao, Y. A review on the overall optimization of Production-Living-Ecological space: Theoretical basis and conceptual framework. Land 2022, 11, 345. [Google Scholar] [CrossRef]
  8. Fang, C.; Yang, J.; Fang, J.; Huang, X.; Zhou, Y. Optimization transmission theory and technical pathways that describe multiscale urban agglomeration spaces. Chin. Geogr. Sci. 2018, 28, 543–554. [Google Scholar] [CrossRef] [Green Version]
  9. Zhang, H.; Xu, E.; Zhu, H. An Ecological-Living-Industrial land classification system and its spatial distribution in China. Resour. Sci. 2015, 37, 1332–1338. [Google Scholar]
  10. Shi, Z.; Deng, W.; Zhang, S. Spatio-temporal pattern changes of land space in Hengduan mountains during 1990–2015. J. Geogr. Sci. 2018, 28, 529–542. [Google Scholar] [CrossRef] [Green Version]
  11. Li, G.; Fang, C. Quantitative function identification and analysis of urban Ecological-Production-Living spaces. Acta Geogr. Sin. 2016, 71, 49–65. [Google Scholar]
  12. Xi, J.; Wang, S.; Zhang, R. Restructuring and optimizing Production-Living-Ecology space in rural settlements: A case study of Gougezhuang village at Yesanpo tourism attraction in Hebei Province. J. Nat. Resour. 2016, 31, 425–435. [Google Scholar]
  13. Wan, J.; Su, Y.; Zan, H.; Zhao, Y.; Zhang, L.; Zhang, S.; Deng, W. Land Functions, Rural Space Governance, and Farmers’ Environmental Perceptions: A Case Study from the Huanjiang Karst Mountain Area, China. Land 2020, 9, 134. [Google Scholar] [CrossRef]
  14. Yang, Y.; Bao, W.; Liu, Y. Coupling coordination analysis of rural Production-Living-Ecological space in the Beijing-Tianjin-Hebei region. Ecol. Indic. 2020, 117, 106512. [Google Scholar] [CrossRef]
  15. Liu, J.L.; Liu, Y.S.; Li, Y.R. Classification evaluation and spatial-temporal analysis of “Production-Living-Ecological” spaces in China. Acta Geogr. Sin. 2017, 72, 1290–1304. [Google Scholar]
  16. Cai, E.; Jing, Y.; Liu, Y.; Yin, C.; Gao, Y.; Wei, J. Spatial-temporal patterns and driving forces of Ecological-Living-Production land in Hubei province, central China. Sustainability 2018, 10, 66. [Google Scholar] [CrossRef] [Green Version]
  17. Chen, L.; Zhou, S.L.; Zhou, B.B.; Lv, L.G.; Chang, T. Characteristics and driving forces of regional land use transition based on the leading function classification: A case study of Jiangsu Province. Econ. Geogr. 2015, 35, 155–162. [Google Scholar]
  18. Liu, C.; Xu, Y.; Wang, Y.; Cheng, L.; Lu, X.; Yang, Q. Analyzing the value and evolution of land use functions from “Demand–Function–Value” perspective: A framework and case study from Zhangjiakou City, China. Land 2021, 11, 53. [Google Scholar] [CrossRef]
  19. Feng, C.; Zhang, H.; Xiao, L.; Guo, Y. Land use change and its driving factors in the rural–urban fringe of Beijing: A Production–Living–Ecological perspective. Land 2022, 11, 314. [Google Scholar] [CrossRef]
  20. Li, X.M.; Zhang, J.; Cao, J.F.; Ma, Y. Ecological risk assessment of exploitation and utilization in Chuanshan archipelago, Guangdong Province, China. Acta Ecol Sin. 2015, 35, 2265–2276. [Google Scholar]
  21. Pan, Y.; Bai, R.; Shi, Y. Research on the landscape characteristics of traditional settlement under the influence of topographic factor—A case of Weizhou Island in Beibu Gulf. Chin. Landsc. Archit. 2021, 37, 33–38. [Google Scholar]
  22. Island Protection Plan of Guangdong Province (2011–2020). Available online: http://nr.gd.gov.cn/zwgknew/tzgg/tz/content/post_3006827.html (accessed on 15 March 2022).
  23. Ma, Y.; Zhang, J.; Li, X.M.; Hao, Y.L.; He, Z.H. Feasibility study of remote sensing technology applied to island protection and utilization planning. Ocean. Dev. Manag. 2009, 26, 92–95. [Google Scholar]
  24. Duan, Y.; Wang, H.; Huang, A.; Xu, Y.; Lu, L.; Ji, Z. Identification and spatial-temporal evolution of rural “production-living-ecological” space from the perspective of villagers’ behavior–A case study of Ertai Town, Zhangjiakou City. Land Use Policy 2021, 106, 105457. [Google Scholar] [CrossRef]
  25. Fang, Y.G.; Shi, K.J.; Niu, C.C. A comparison of the means and ends of rural construction land consolidation: Case studies of villagers’ attitudes and behaviours in Changchun City, Jilin Province, China. J. Rural Stud. 2016, 47, 459–473. [Google Scholar] [CrossRef]
  26. Ma, W.; He, X.; Jiang, G.; Li, Y.; Zhang, R. Land use internal structure classification of rural settlements based on land use function. Trans. Chin. Soc. Agric. Eng. 2018, 34, 269–277. [Google Scholar]
  27. Ma, X.; Li, X.; Hu, R.; Khuong, M.H. Delineation of “production-living-ecological” space for urban fringe based on rural multifunction evaluation. Prog. Geogr. 2019, 38, 1382–1392. [Google Scholar] [CrossRef]
  28. Zhen, L.; Chao, S.Y.; Wei, Y.J.; Xie, G.D.; Li, F.; Yang, L. Land use functions: Conceptual framework and application for China. Resour. Sci. 2009, 31, 544–551. [Google Scholar]
  29. Du, G.M.; Sun, X.B.; Wang, J.Y. Spatiotemporal patterns of multi-functions of land use in northeast China. Prog. Geogr. 2016, 35, 232–244. [Google Scholar]
  30. Xia, M.; Feng, X.H.; Xia, J.L.; Zhou, W. Delineation of Production-Living-Ecological space in Lishui District of Nanjing based on land multi-functions and suitability. Trans. Chin. Soc. Agric. Eng. 2021, 375, 242–250. [Google Scholar]
  31. Wu, J.; Zhang, D.; Wang, H.; Li, X. What is the future for Production-Living-Ecological spaces in the Greater Bay Area? A multi-scenario perspective based on DEE. Ecol. Indic. 2021, 131, 108171. [Google Scholar] [CrossRef]
  32. Liu, C.; Cui, W.L.; Zhu, Z.T.; Ye, F.; Yu, X.J. Study on the technical methods of the delineation of island ecological red lines. Acta Ecol. Sin. 2018, 38, 8564–8573. [Google Scholar]
  33. Compilation Committee of Chorography of Guangdong Province. Guangdong Province Chorography: Ocean and Islands Chorography, 1st ed.; Guangdong People’s Press: Guangzhou, China, 2000; p. 98.
  34. Dang, A.T.; Kumar, L.; Reid, M.; Nguyen, H. Remote sensing approach for monitoring coastal wetland in the Mekong Delta, Vietnam: Change trends and their driving forces. Remote Sens. 2021, 13, 3359. [Google Scholar] [CrossRef]
  35. Kumar, L.; Sinha, P.; Taylor, S. Improving image classification in a complex wetland ecosystem through image fusion techniques. J. Appl. Remote Sens. 2014, 8, 083616. [Google Scholar] [CrossRef] [Green Version]
  36. Ehlers, M.; Klonus, S.; Johan Ȧstrand, P.; Rosso, P. Multi-sensor image fusion for pansharpening in remote sensing. Int. J. Image Data Fusion 2010, 1, 25–45. [Google Scholar] [CrossRef]
  37. Law of the People’s Republic of China on the Promotion of Rural Revitalization. Available online: http://www.gov.cn/xinwen/2021-04/30/content_5604050.htm (accessed on 28 April 2022).
  38. Shi, H.; Zhao, M.; Simth, D.A.; Chi, B. Behind the Land Use Mix: Measuring the Functional Compatibility in Urban and Sub-Urban Areas of China. Land 2022, 11, 2. [Google Scholar] [CrossRef]
  39. Ministry of Housing and Urban-Rural Development, Finance, Culture, Protection of Cultural Relics: Guidelines on Strengthening the Protection of Traditional Settlements of China. Available online: http://www.gov.cn/zhengce/2016-05/22/content_5075656.htm (accessed on 16 March 2022).
  40. Bohua, L.; Can, Z.; Yindi, D.; Peilin, L.; Chi, C. Change of human settlement environment and driving mechanism in traditional villages based on living-production-ecological space: A case study of Lanxi Village, Jiangyong County, Hunan Province. Prog. Geogr. 2018, 37, 677–687. [Google Scholar]
  41. Li, J.M.; Wang, M.C.; Wang, F.Y.; Chen, X.Y.; Ding, W. Urban land use classification of multi-features random forest. Sci. Surv. Mapp. 2021. in press (In Chinese) [Google Scholar]
  42. Mu, Y.N.; Ding, L.X.; Li, N.; Lu, L.Y.; Wu, M. Classification of coastal wetland vegetation in Hangzhou Bay with an object-oriented, random forest model. J. Zhejiang A F Univ. 2018, 35, 1088–1097. [Google Scholar]
  43. Tucker, C.J. Red and photographic infrared linear combinations for monitoring vegetation. Remote Sens. Environ. 1979, 8, 127–150. [Google Scholar] [CrossRef] [Green Version]
  44. Gautam, V.K.; Gaurav, P.K.; Murugan, P.; Annadurai, M.J.A.P. Assessment of surface water dynamicsin bangalore using WRI, NDWI, MNDWI, supervised classification and KT transformation. Aquat. Procedia 2015, 4, 739–746. [Google Scholar] [CrossRef]
  45. Zha, Y.; Gao, J.; Ni, S. Use of normalized difference built-up index in automatically mapping urban areas from TM imagery. Int. J. Remote Sens. 2003, 24, 583–594. [Google Scholar] [CrossRef]
  46. Measuring Vegetation (NDVI and EVI). Available online: https://earthobservatory.nasa.gov/features/MeasuringVegetation (accessed on 19 March 2022).
  47. Gupta, K.; Mukhopadhyay, A.; Giri, S.; Chanda, A.; Majumdar, S.D.; Samanta, S.; Hazra, S. An index for discrimination of mangroves from non-mangroves using LANDSAT 8 OLI imagery. MethodsX 2018, 5, 1129–1139. [Google Scholar] [CrossRef]
  48. Xie, J.; Wang, Z.M.; Mao, D.H.; Ren, C.Y.; Han, J.X. Remote sensing classification of wetlands using object-oriented method and multi-season HJ-1 images—A case study in the Sanjiang plain north of the Wandashan mountain. Wetl. Sci. 2012, 10, 429–438. [Google Scholar]
  49. Guo, X.; Zhang, C.; Luo, W. Urban impervious surface extraction based on multi-features and random forest. IEEE Access 2020, 8, 226609–226623. [Google Scholar] [CrossRef]
  50. Breiman, L. Random forests. Mach. Learn. 2001, 45, 5–32. [Google Scholar] [CrossRef] [Green Version]
  51. Tran, H.; Tran, T.; Kervyn, M. Dynamics of land cover/land use changes in the Mekong Delta, 1973-2011: A remote sensing analysis of the Tran Van Thoi District, Ca Mau Province, Vietnam. Remote Sens. 2015, 7, 2899–2925. [Google Scholar] [CrossRef] [Green Version]
  52. Compilation Committee of Island Annals of China. Chinese Island Chronicle (Guangdong Volumes), 1st ed.; Maritime Press: Beijing, China, 2013; pp. 9–10.
  53. Jasiewicz, J.; Stepinski, T.F. Geomorphons-a pattern recognition approach to classification and mapping of landforms. Geomorphology 2013, 182, 147–156. [Google Scholar] [CrossRef]
  54. Li, Y.; Zhou, H.C. Characteristics and exploitation policy for island resources in Guangdong. Coast. Eng. 2010, 29, 75–82. [Google Scholar]
  55. Ratter, B.M. Geography of Small Islands, 2nd ed.; Springer: Cham, Switzerland, 2018; p. 42. [Google Scholar]
Figure 1. Distribution map of island in the western sea area of Guangdong Province.
Land 11 00705 g001
Figure 2. Flow chart of island land-use classification in the study area.
Land 11 00705 g002
Figure 3. Multifeature fusion diagram (take Hailing Island as an example).
Land 11 00705 g003
Figure 4. PLES classification of bedrock islands.
Land 11 00705 g004
Figure 5. PLES classification of sedimentary island.
Land 11 00705 g005
Figure 6. PLES classification of volcanic island.
Land 11 00705 g006
Figure 7. PLES distribution characteristics of sedimentary islands.
Land 11 00705 g007
Figure 8. PLES distribution characteristics of bedrock islands.
Land 11 00705 g008
Figure 9. PLES distribution characteristics of volcanic islands.
Land 11 00705 g009
Table 1. Island classification and image characteristics (Data resources: Google Earth).
Primary ClassificationSecondary ClassificationImage CharacteristicsDescriptions
IslandBedrock island Land 11 00705 i001The island consists of bedrocks.
Volcanic island (High Island) Land 11 00705 i002The island consists of volcanic ejecta (lava and volcanic ash).
Sedimentary island Land 11 00705 i003The island consists of incompact substances (mud and sand).
Table 2. Island land-use classification of study area.
First-Level Land-Use TypeSecond-Level Land-Use Type
Arable landPaddy field
Dryland
GardenOrchard
Tea garden
ForestlandForestland
Mangrove forest
Industrial and mining storage landIndustrial land
Salt pan
Residential land-
Transportation landHighway land
Rural road
Water area and water conservancy facilities landHarbor land
Reservoir
Pond
Ditch
Other landsAquaculture pond
Mudflat aquaculture
Sandy land
Bare land
Table 3. PLES classification and image features (Data resources: Google Earth).
PLESSecondary Types of PLESInterpretation SignalDescription
Production spacePaddy field Land 11 00705 i004Cultivated land for aquatic crops such as rice. Including the areas that rotated by aquatic and xerophytic crop.
Dryland Land 11 00705 i005Cultivated land for xerophilous crops with no irrigation facilities, and the cultivation mainly relies on natural precipitation.
Tea garden Land 11 00705 i006Site for tea production.
Salt pan Land 11 00705 i007Salt production sites mainly use the evaporation method, including mixed land-use by fish-farming and salt production.
Aquaculture pond Land 11 00705 i008The site for aquaculture includes its ancillary facilities, which are located above the shoreline or in the intertidal zones.
Industrial land Land 11 00705 i009Site for industrial production.
Reservoir Land 11 00705 i010Site for water storage by artificial intercept (area > 1 × 10⁴ m2), including its ancillary facilities.
Pond Land 11 00705 i011Site ponding area or bottomland (area < 1 × 10⁴ m2), the aquaculture pond is not included.
Ditch Land 11 00705 i012Site for the channels (width ≥ 1 m) used for drainage and irrigation, including ditches, embankments, and surrounding shelterbelt.
Ecological spaceForestland Land 11 00705 i013Site for the forest with canopy density ≥ 0.2.
Stream Land 11 00705 i014A stream is formed naturally or excavated artificially.
Shelterbelt Land 11 00705 i015Site for shelterbelt that is distributed on the coastal zone.
Mangrove forest land Land 11 00705 i016Site for the semimangrove or mangrove forest.
Wetland Land 11 00705 i017Site for the herb growth in the inland swamp.
Beach Land 11 00705 i018The dry shoal consists of gravel or sand.
Rock foreshore Land 11 00705 i019The dry shoal consists of rock.
Mudflat Land 11 00705 i020The dry shoal consists of sand or mudflat.
Living spaceRural residential land Land 11 00705 i021Villages’ house.
Urban residential land Land 11 00705 i022Urban residential community.
Harbor land Land 11 00705 i023Site for berthing ships and storage of goods, including the ancillary buildings.
Highway land Land 11 00705 i024Site for national roads, provincial roads, county roads, and township roads.
Bare land Land 11 00705 i025Areas with no dominant vegetation cover on at least 90% of the area or areas covered by lichens/moss.
Table 4. The characteristic attributes involved in classification.
Index FeaturesNormalized Difference Vegetation Index (NDVI) N D V I = N I R R e d N I R + R e d
Normalized Difference Water Index (NDWI) N D W I = G r e e n N I R G r e e n + N I R
Normalized Difference Built-up Index (NDBI) N D B I = M I R N I R M I R + N I R
Combined Mangrove Recognition Index (CMRI) C M R I = N D V I N D W I
Gray-Level Co-Occurrence Matrix (GLCM)GLCM Homogeneity i = 1 k j = 1 k P ( i , j ) 1 + ( i + j ) 2
GLCM Contrast n = 0 k 1 n 2 | i j | = 1 P ( i , j )
GLCM Dissimilarity i = 1 k j = 1 k | i j | P ( i , j )
GLCM Entropy i = 1 k j = 1 k P ( i , j ) log [ P ( i , j ) ]
GLCM Mean i = 1 k j = 1 k i = 1 k j = 1 k P ( i , j ) n 2
GLCM Std. Dev. i = 1 k j = 1 k [ P ( i , j ) μ n * n ] 2
Table 5. The PLES pattern and connection between the island sizes and the PLES diversity.
Type of the IslandsName of the IslandsThe Area of the Island (km2)The Number of PLESThe Dominant Space of PLESDominant Plaque Type of PLESPercentage of Dominant Patch Types in PLES (of Each Island)Area of Dominant Patch Types in PLES (km2)
Volcanic islandNaozhou Island56.4016Production spaceDry farming53.20%27.89
Bedrock islandHailing Island108.9019Ecological spaceForestland47.00%51.64
Shangchuan Island157.0018Ecological spaceForestland75.30%103.36
Xiachuan Island98.3213Ecological spaceForestland76.25%63.39
Mangzhou Island6.829Ecological spaceForestland89.40%5.38
Fengtou Island3.679Ecological spaceForestland41.37%1.57
Dafangji Island1.235Ecological spaceForestland82.25%1.06
Sedimentary islandDonghai Island286.6018Production spaceAquafarm20.27%70.68
Techeng Island3.1312Production spaceDry farming19.97%0.77
Nansan Island123.4015Production spaceAquafarm28.13%41.26
Dongtoushan Island2.918Production spaceAquafarm27.36%0.91
Gonggang Island1.267Production spaceAquafarm30.00%1.02
Dongsong Island2.808Ecological spaceMudflat33.50%1.81
Houhai-beili Island2.767Production spaceAquafarm50.69%6.10
Jinji-jiaping Island4.546Production spaceAquafarm33.89%2.09
Liuji Island1.946Ecological spaceForestland34.57%0.82
Xinliao Island40.7012Production spaceAquafarm33.17%22.91
Publisher’s Note: MDPI stays neutral with regard to jurisdictional claims in published maps and institutional affiliations.

