Article

Applying Analytic Hierarchy Process for Identifying Best Management Practices in Erosion Risk Areas of Northwestern Himalayas

1
ICAR-Central Research Institute for Jute and Allied Fibers, Kolkata 700121, India
2
ICAR-Central Inland Fisheries Research Institute, Kolkata 700120, India
3
ICAR-Indian Institute of Soil and Water Conservation, Dehradun 248195, India
4
Department of Soil Science, Dr. Rajendra Prasad Central Agricultural University, Samastipur 848125, India
*
Author to whom correspondence should be addressed.
Submission received: 24 December 2021 / Revised: 18 January 2022 / Accepted: 28 March 2022 / Published: 2 June 2022
(This article belongs to the Special Issue The Science and Practice of Soil Health for Versatile Sustainability)

Abstract

:
Despite the growing importance of soil and water conservation and watershed development projects as an approach to rural development and natural resource management, there has been relatively little research on devising site-specific best management practice (BMP) to check the soil erosion losses within permissible limits, especially in hilly regions. For a sustainable watershed management programme and implementation, site specific BMPs assume importance and hold the promise of making conservation planning and watershed management simpler and more effective. The study was attempted to develop a methodology to obtain BMPs, aiming to reduce the erosion losses in erosion risk areas of the northwestern Himalayas by employing Analytic Hierarchy Process (AHP). The AHP technique was employed to prioritise the potential technologies and select the BMP suitable for a particular land area. The prioritization of technologies was performed with four criteria viz. soil erosion resistance, cost, benefit, maintenance and environment friendliness of conservation measures. The soil erosion scenario of the study area located in the northwestern Himalayas was generated with each selected measure in a SWAT model using DEM, land use maps, a soil map and climate data of the study area. Then, the resultant erosion scenario of the conservation measures was compared and used for the AHP analysis. However, other criteria were assessed based on the judgement of a group of experts as well as farmers. In this study, four conservation measures, viz. Bench Terraces (BT), Vegetative Barrier (VB), Contour Farming (CF) and Zero Tillage + Live Mulch (ZL), were considered for BMP selection. Three scenarios, viz. experts’ judgement, farmers’ opinions and combined expert and farmer opinion, were analyzed to uncover the BMP for the different zones. The result revealed that experts and farmers unanimously preferred ZL as a BMP because of its low-cost implementation value and lower maintenance requirement while significantly controlling the erosion level as well as being environment friendly. The BT was the second most preferred technology for the study area. However, BMP was recommended for different zones having high to very severe erosion (soil loss > 10 t/ha/yr). Therefore, ZL was recommended for the areas with low altitude, whereas BT was recommended for the areas having high slopes because of its high capability for erosion control in the high slopping area. The methodology will act as a useful strategy for decision makers to prioritize the technology and recommend the best management for any region after considering suitable criteria. Future work may consider more criteria for inclusion to thus recommend the technology for a region in a more realistic way.

1. Introduction

Soil and water are the two critical resources for agricultural production, and thus there is an ongoing need for research for devising ways to manage soil and water resources in a more sustainable manner [1,2,3]. The continuing debate on sustainability has raised wide concerns towards integration of environmental and economic aspects into the development decision making process [4,5].
In India, water erosion is the major concern affecting topsoil loss with terrain deformation [6,7,8]. It is reported that the annual soil loss due to water erosion varies from less than 5.0 t ha−1 yr−1 for dense forests to more than 80 t ha−1 yr−1 in the Shiwalik hills [9]. Land degradation due to soil erosion impacts soil productivity as well as soil quality, which is a matter of serious concern for environmentalists and conservationists. However, years of field experience as well as scientific research indicate that some soil loss can be tolerated without affecting the crop production significantly. This accepted rate of erosion is known as Soil Loss Tolerance (SLT) or permissible soil loss [10,11,12]. If the erosion rate is more than the permissible value, it is considered as unacceptable and must be brought down to within a permissible rate to ensure sustainable agriculture.
In general, the top layer of soil erodes in the area with the occurrence of medium to high intensity rainfall events [13] along with the land use land cover condition of the area [14]. Therefore, knowledge of the water flow scenario of an area is a prerequisite for the planning of various environmental management policies such as watershed management operations, flood forecasting, water allocation, hydroelectric power generation, etc. One of the most commonly used soil erosion models is the Universal Soil Loss Equation (USLE) and its family of models: the Revised Universal Soil Loss Equation (RUSLE), the Revised Universal Soil Loss Equation version 2 (RUSLE2) and the Modified Universal Soil Loss Equation (MUSLE). Benavidez et al. [15] investigated the existing (R)USLE formulations, such as uncertainty of the model and its sub-components; uncertainty around data availability; and its inability to account for soil loss from gully erosion, mass wasting events or predicting potential sediment yields to streams. In this direction, Borrelli et al. [16] developed a database, ‘Global Applications of Soil Erosion Modelling Tracker (GASEMT)’, which provides comprehensive insights into the state-of-the-art of soil erosion models and model applications worldwide, including 3030 individual modeling records from 126 countries, encompassing all continents (except Antarctica). Moreover, various studies have been carried out to simulate the soil erosion scenario of different regions and recommend different management practices for sustainable erosion management for the area [17,18,19,20,21].
On the other hand, water flow dynamics is performed through various hydrological models. Moreover, rainfall–runoff modeling is also an important research area for estimating the runoff status with given rainfall events and other environmental parameters. One of the well-known models among several watershed models is the Soil and Water Assessment Tool (SWAT), which is basically used for predicting the impacts of slope, soil, landuse management practices on water, sediment and different agricultural chemical migration pattern in a large complex watershed scenario over long periods of time [22,23,24,25]. The model developed by USDA ARS [26,27,28] uses prevailing soil, slope, landuse, weather data to simulate water flow, sediment, nutrient and pesticide movement along the sub-basins to the outlet. In addition, the model is open source, with an array of applications in hydrological modeling applicable in various research areas, ranging from basin scale to continental scales.
In order to control the runoff and soil loss either from a field or watershed, implementation of site specific BMP is fundamental which, in due course, impacts the goal of sustainable management of the system [29,30]. However, for selection of BMP in erosion risk areas, several criteria need to be considered and prioritized for sustainable implementation and management of the conservation practices, which not only satisfies the objectives of controlling soil erosion but also suits the farmers’ adaptability and suitability for long run. These criteria may include a soil erosion control check, cost, benefit, maintenance and long-term maintenance costs, etc. In recent times, the use of a mathematical model for BMP selection is a new and growing area of research, with various approaches to achieve the target. In this context, several studies have attempted multi-criteria decision analysis (MCDA) to solve the complex decision-making problems in agriculture systems. The analytical hierarchy process (AHP) is one of the most widely known and used multi-criteria analysis approaches, introduced by Saaty [31]. It uses an optimization algorithm well suited for quantitative comparison among the alternative options. It enables users to determine the weights of the parameters in the solution of a multi-criteria problem. Hipp et al. [32] applied linear programming with simple runoff-pollutant loading models to find the least cost placement strategies for locating storm sewer insert filters at critical points in the City of Costa Mesa, CA’s storm sewer system. The AHP decision support algorithm was applied to evaluate and rank BMP options for the Town of Blacksburg, Virginia, and the EPA’s Storm Water Management Model (SWMM) was used to effectively model the BMPs recommended by the AHP software [33].
Moreover, a software-based decision support framework with cost comparisons of possible BMP alternatives seems a highly simplified approach based on the sizing and location of facilities [34]. Researchers have also attempted to develop BMP decision support tools for the optimization of BMP placement and design. The consideration of ecological as well as economical factors is imperative for the comprehensive planning of sustainable land use in developing decision support system (DSS). However, there should be an easy and effective framework for environmental economic decision making that includes the environmental and economic sustainability criteria along with local people’s preference. In general, the land users desire maximum benefits with minimum efforts, subject to a set of constrains. Therefore, the monetary assessment of different conservation measures along with their value benefit analysis for evaluation and ranking of the compared scenarios (various conservation measures) through statistical analysis (optimization technique) is essential for proposing best management practices.
However, the efficiency of BMPs in controlling soil erosion differs from site to site [35] because of changing scenarios of soil type, land uses, topography, geological formations, climate and management practices [36]. At the same time, the planning and implementation of BMPs in all the fields seems unrealistic as well as expensive, as in the implementation of BMPs in Critical Source Areas (CSAs), regions that contribute the most to water quality impairment [37,38].
Several attempts have been undertaken in developing location specific management planning in the field of soil and water conservation for sustaining farming systems. Pertiwi et al. [39] developed a soil conservation DSS for upland farm management, with special consideration given to estimating potential annual soil loss and comparing it to a tolerable soil-loss criterion. It suggested improved soil conservation farming practices, including the most suitable soil tillage machinery, when soil loss exceeded a tolerable soil-loss criterion. Bishr and Radwan [40] developed a DSS for watershed management integrating a geographic information system (GIS) tool, object-oriented data modeling and a knowledge-based system to assist decision-makers in selecting the BMPs for controlling soil erosion and water quality. In another study, Giri et al. [35] employed AHP techniques for ranking BMPs in the Saginaw River Watershed based on environmental, economic and social factors, whereas Himanshu et al. [41] used a SWAT model to evaluate and recommend the BMPs in an agriculture-based Marol watershed of India.
The state of Uttarakhand, India is located in the northwestern Himalayan region, which is bestowed with highly diversified topography, perennial to seasonal glaciers, deep valleys, streams, etc. The state also has severe problems of water erosion because of high rainfall erosivity, increased slope gradients, weak geological formations and uncontrolled deforestation. A study carried out by Gorge et al. [17] reported that more than 90% of the total soil loss of Uttarakhand is contributed by hilly physiographic regions (nearly 80% of the study), which comprise the youngest mountain ranges in the world. In another study, Mahapatra et al. [18] also reported that about 7.39%, 6.71%, 8.84% and 32.72% area were under moderate, moderately severe, severe and very severe erosion class respectively, which exceeded the tolerance limit of soil loss of 11.2 tonnes/ha/year, and therefore there is an urgent need to adopt appropriate soil conservation measures in Uttarakhand. However, recommending appropriate measures to different areas requires a systematic scientific approach and execution for sustainable management of the ecosystem. Though several studies have proved the effectiveness of BMPs using AHP techniques in different locations, so far, no such research has been attempted in the northwestern Himalayas region. Therefore, this study aimed to apply the AHP technique as a decision-making tool for selecting BMPs for erosion risk areas based on certain criteria. Furthermore, the study considered the judgements of scientific experts as well as farmers’ opinions to construct the AHP model so that the recommended BMP can satisfy the environmental aspects as well as farmers’ interests.

2. Materials and Methods
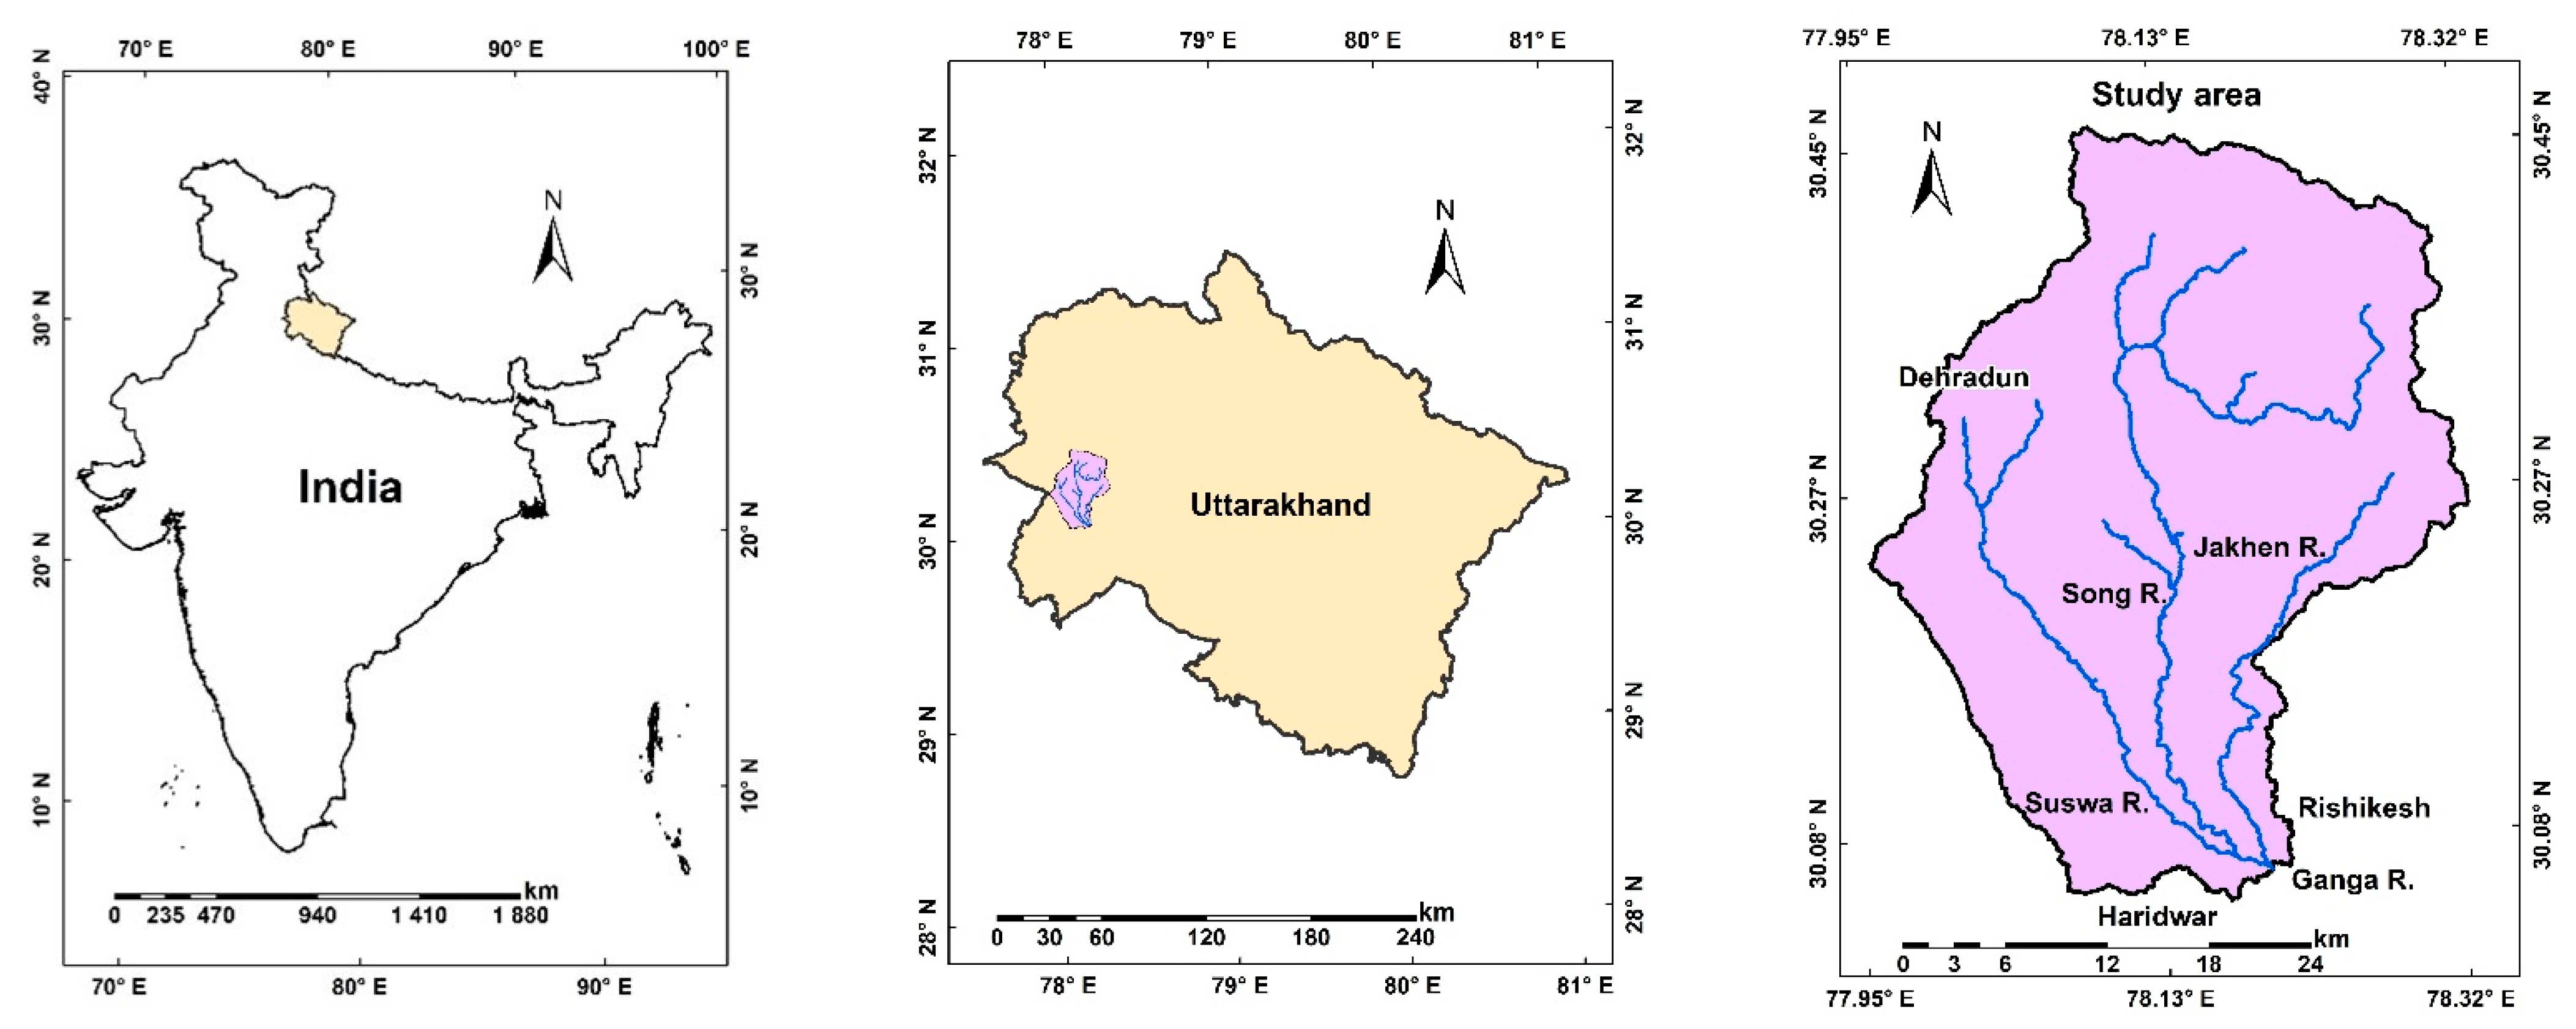
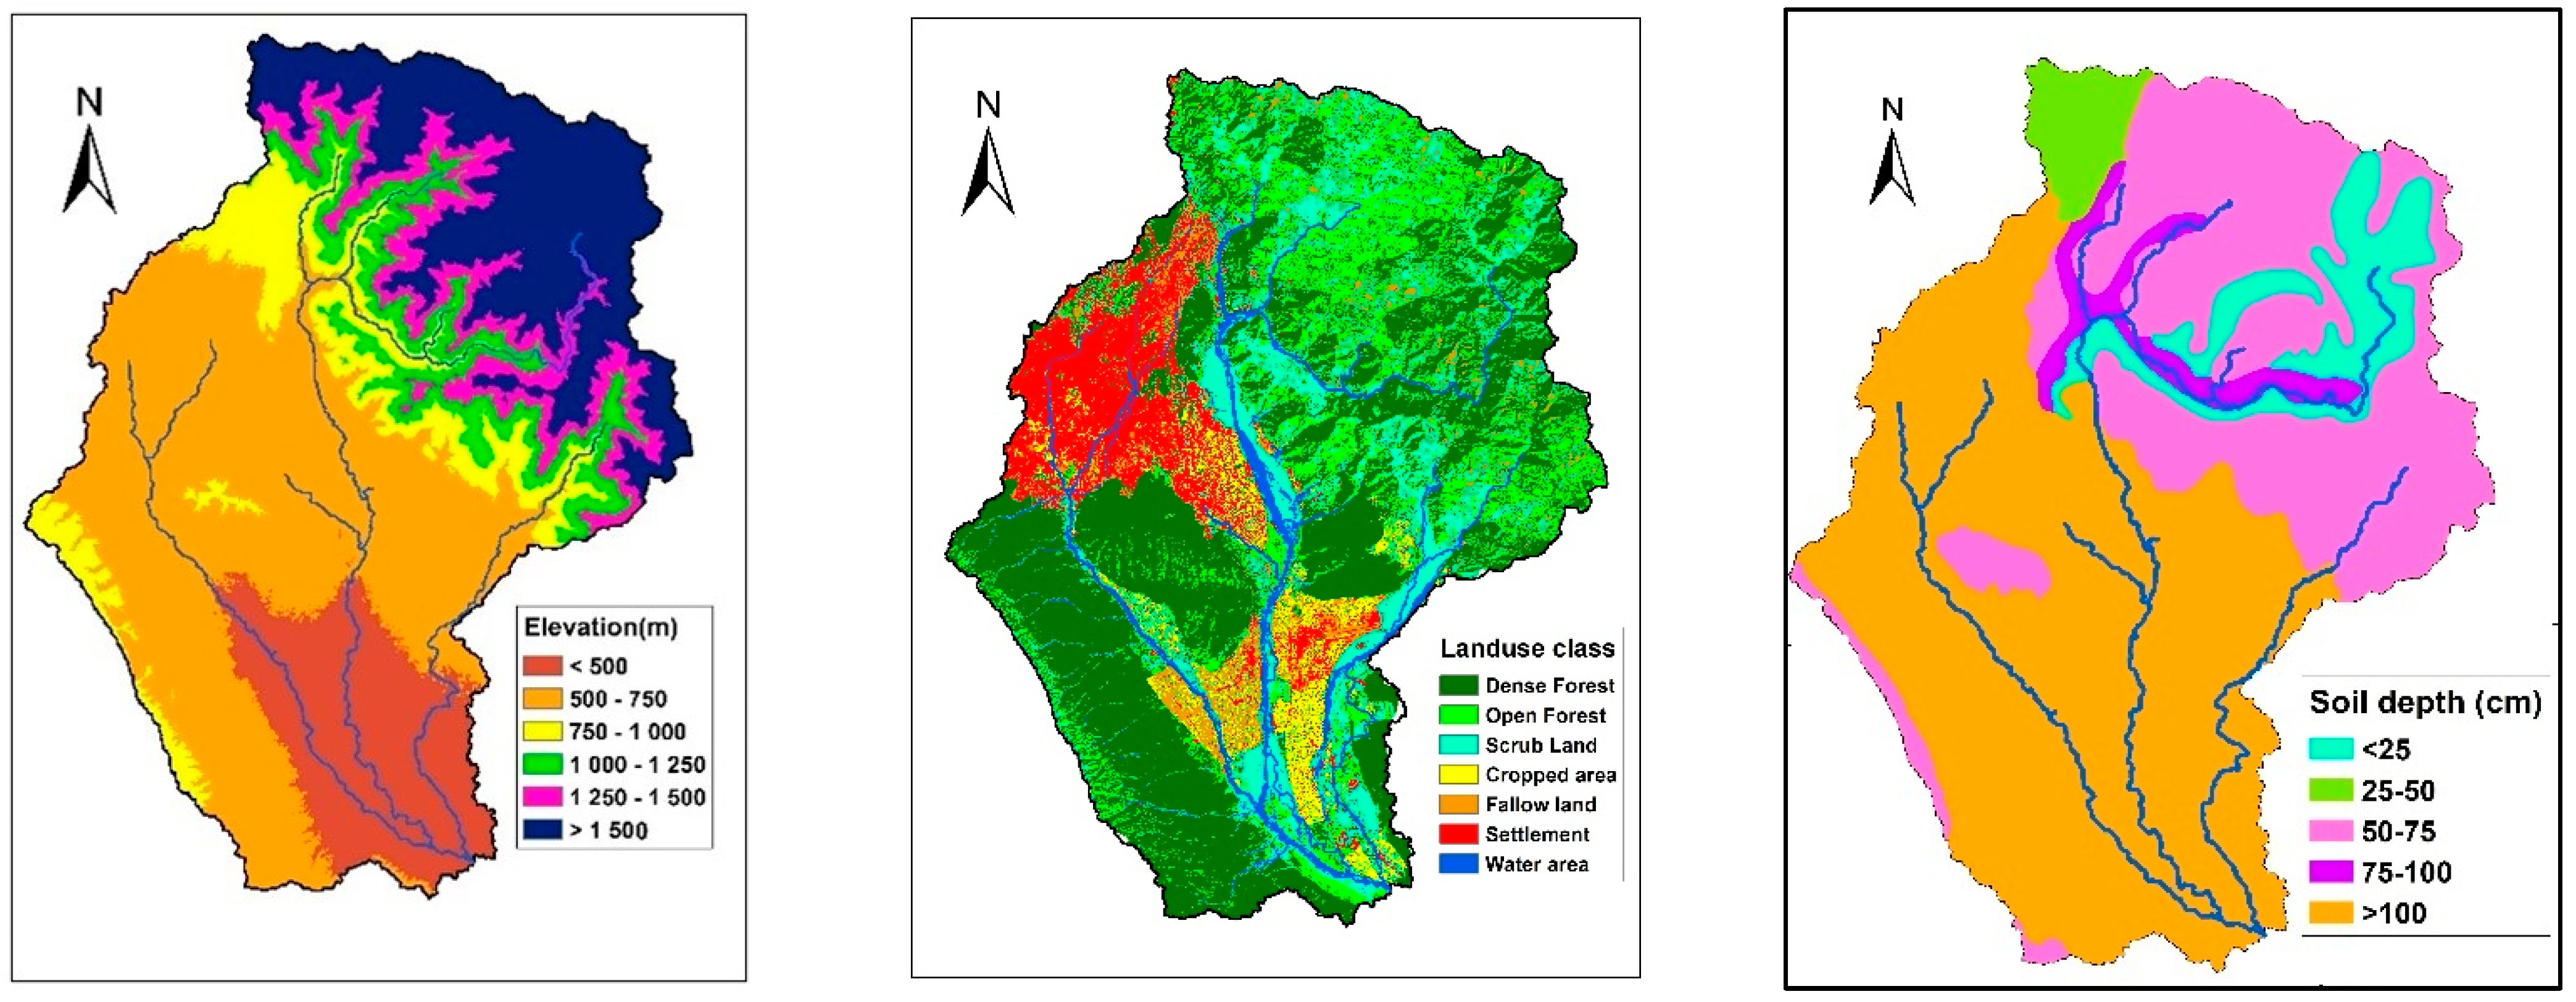
2.1. Study Area

The study area was selected in part of Doon Valley, which is in between 30°15′26″ N to 30°13′56″ N latitudes and 78°10′26″ E to 78°05′07″ E longitudes within the Shiwalik Hills in the Lower Himalayas, in the state of Uttarakhand, India (Figure 1).
This part of the Himalayas is inherently (geologically) vulnerable to various hazards such as rainfall, landslides, debris flows and torrent sand flash floods due to failures of natural dams. Dehradun, the capital city of the state Uttarakhand, India, is the most rapidly populating area located in the Doon valley, on the foothills of the Himalayas nestled between two of India’s mightiest rivers—the Ganges on the east and the Yamuna on the west. The valley is full of natural resources and a major part is covered with forests. Although, the rising population pressure in Dehradun and its nearby regions has affected the ecosystem by gradually shrinking the green areas such as forest area, agriculture and other land uses [42]. As a consequence, the pervious surface is reducing day by day, resulting in more runoff and soil erosion. The study area consists of 12 sub-basins with bare (less than 1%) and steep slopes (more than 33%) that generally drain east from the high Dhanulti to the near Rishikesh region. Furthermore, heavy rainfall events have high potential for increased runoff and soil erosion with frequent occurrence of flooding in riverside areas. The mean annual rainfall for the last 56 years (1957–2019) is 1625 mm, with 80% occurring during the rainy season (June–September) [43].

2.2. Selection of Conservation Measures

The various attributes of soil and water conservation structures, agronomic measures and vegetative measures adopted on different slope ranges, land-capability classes and soil types were listed and analysed for further consideration for the suitable conservation measures applicable for the study area. Conservation measures which were preliminary found to be good measures for reducing soil erosion after implementing in the erosion risk areas are considered for selection of BMP.

2.3. Identification of Erosion Risk Area

Report suggests that any amount of soil erosion is generally not considered beneficial and some level of soil loss (permissible soil loss) can be tolerated without affecting the crop production significantly [44]. Therefore, first and foremost, the crucial factor is to identify the erosion risk area, and further attention should be paid for reducing erosion level through applying suitable management practices. In India, the soil erosion rate is classified into six categories [45]. The classes are estimated based on water erosion of the area, as illustrated in Table 1. The study area was also classified based on the erosion classes.

2.4. Criteria for Selecting Suitable Management Practices

In the process of selecting best management practices, various factors need to be considered which actually influence the decision process, ensuring realistic recommendations. There are many factors which determine the suitable conservation measures for a particular piece of land. In this process, the determination of appropriate criteria seems to be very crucial and varies according to the stakeholder’s objective. The main purpose of this study is to identify the best management practice (BMP) which will reduce the soil loss as well as be most suitable for the farmers. To address the situation, five important criteria viz. soil erosion check capability, benefit, cost, maintenance and suitability/environmental friendliness of the conservation measures were identified, which would be the main deciding factors for selecting a technology suitable for a piece of land in hilli areas.

2.4.1. Soil Erosion Check Capability

Soil erosion is the loss of topsoil due to natural forces, such as wind and water, when acting on the soil. Principally, the more exposed soil is, the more likely it is to erode during rain or windstorms. When topsoil is eroded from an area, it loses the most nutrient-rich layer, and therefore soil quality is reduced.
A technology or conservation measure which can reduce the present soil loss by a significant level could be considered as a suitable measure for that erosion prone area, since soil loss directly impacts the top layer of soil and, consequently, crop productivity. However, soil erosion is a complex phenomenon governed by a large number of factors, such as rainfall erosivity, soil type, slope, land use and conservation measures. To capture the whole scenario of soil erosion, the Soil and Water Assessment Tool (SWAT) model was used in this study. The estimated erosion rate of the area was classified into different classes for BMP recommendation.

2.4.2. Benefit

The benefit of a technology in agriculture includes expediting crop production rate and crop quantity, which in turn reduces costs of production for farmers and even makes crops more nutritious and livestock bigger. A technology is sustainable and adaptable only when it is profitable to the farmers. A technology which earns profit in terms of high productivity or yields can be recommended to the farmers and is expected to be sustainable. Therefore, benefit is one of the important factors to be considered for recommending best management practices for a particular area.

2.4.3. Cost

Cost of a technology includes the cost of implementation like cost for construction, inputs, tillage operation, fertilizers, irrigations, harvesting, etc. If a technology requires more inputs in terms of money, then the farmers, who are marginal farmers, are not able to adopt the technology in spite of its suitability and benefits. Therefore, technology should be cost effective for its wider acceptability.

2.4.4. Maintenance

One of the main factors for sustaining a technology is its level of maintenance. Any technology or crops need various timely management operations to complete the life cycle in order to achieve their potential yield. However, in today’s scenario of labour scarcity, farmers are facing difficulties in finding the desired labour needed to perform the various management operations in the field. As a result, either technology failed or farmers did not obtain their potential yield. Therefore, maintenance is one of the criteria to be considered for selecting the best management practices. The practices which require less maintenance are more acceptable by the farmers and vice versa.

2.4.5. Suitability/Environment Friendly

A technology is environment friendly or suitable to the area if it is sustainable along with not damaging or depleting the environment or natural resources. Hence, the area, which is vulnerable to erosion, must be treated with environmentally friendly technology which checks the erosion without aggravating the situation further. As an example, a vegetative barrier is more environmentally friendly than contour bunding because, in the former case, the land is less disturbed during implementation than in the latter.

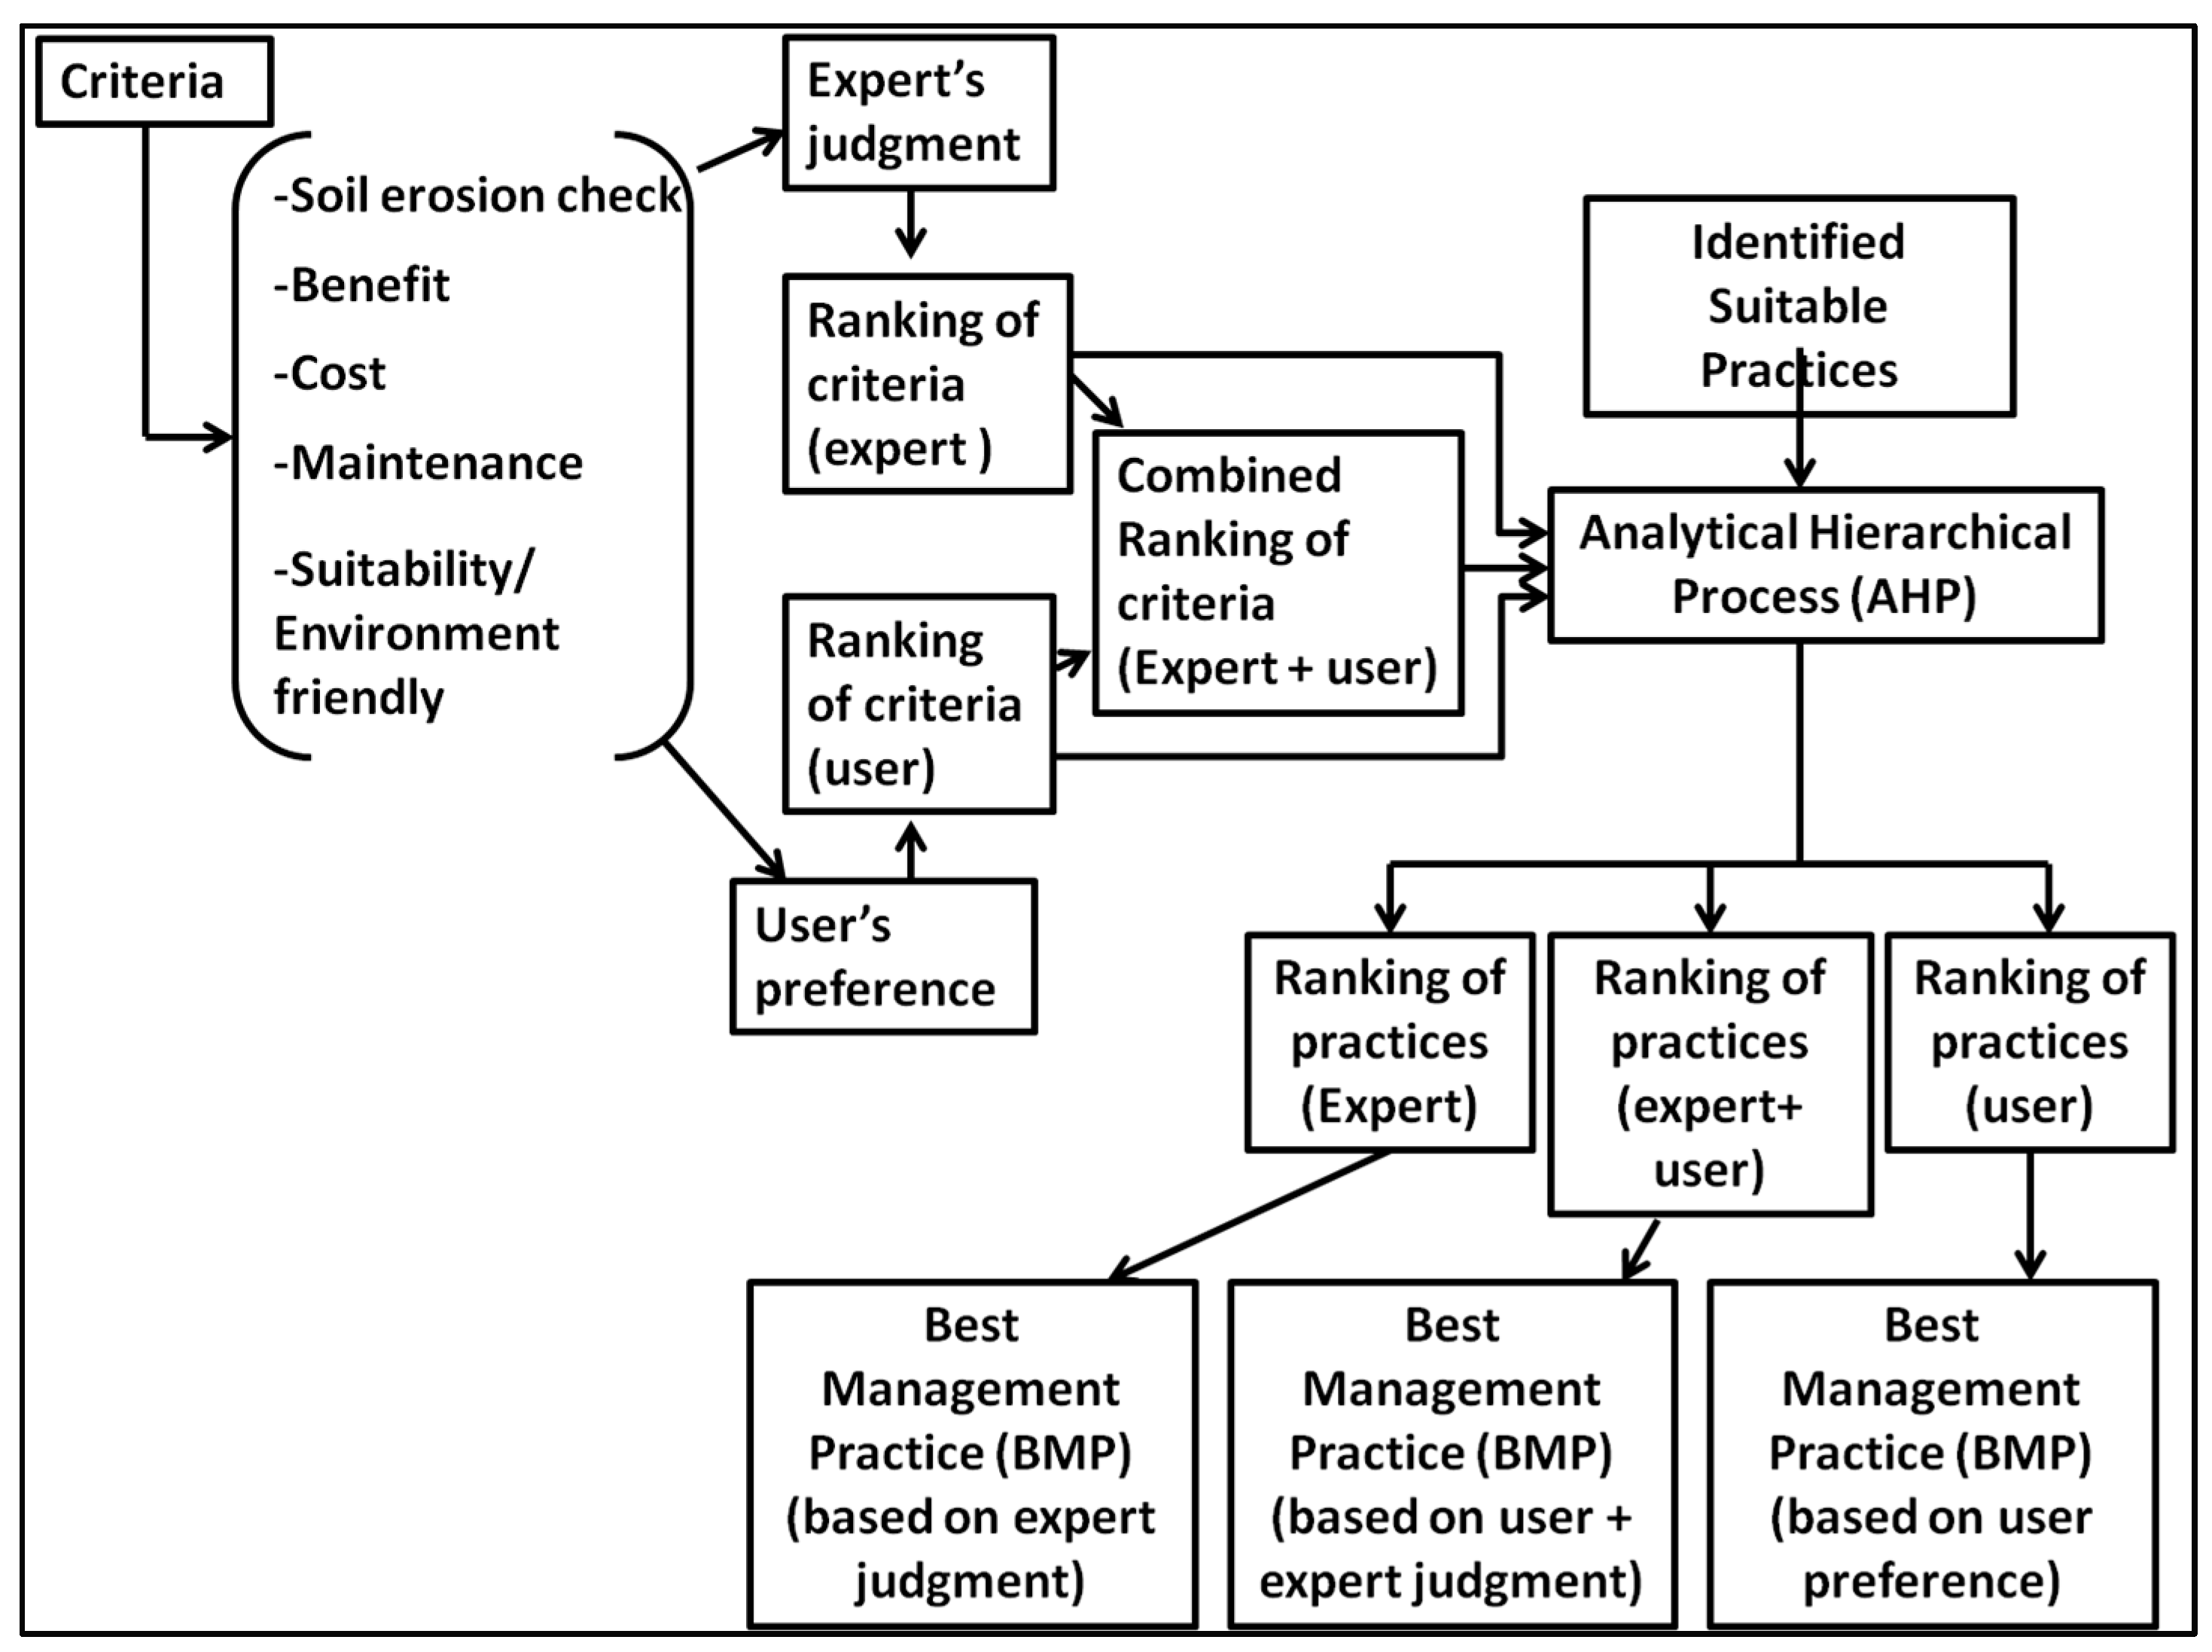
2.5. Implementation of AHP for BMP Selection

AHP is a multi-criteria decision-making technique well suited for quantitative comparison among the alternative options [31]. It is one of the most widely known and used multi-criteria analysis approaches; the AHP method enables users to determine the weights of the parameters in the solution of a multi-criteria problem. In comparison to traditional evaluation techniques, it can account for not only quantitative but also for qualitative impacts. It was developed for analyzing a variety of decisions concerning complex technological, economical and socio-political problems. It has been successfully applied in problem solving activities, for example, product/process/project selection [46,47,48,49,50], resource allocation [51,52,53] and performance measurement [54,55].
In the AHP model, based on the problems and objective, criteria are identified and the weights of the criteria are calculated [56]. The first step of the algorithm is to construct pairwise comparison matrices between criteria and then rank them. The next step involves construction of pairwise comparison matrices of various BMP alternatives with respect to each criterion, which are then ranked accordingly. In order to derive valid results, all factors must fall within the same order of magnitude [57]. It provides a measure of the ratio of inconsistency (CR) that indicates the degree to which each pairwise comparison is consistent with the remainder of the comparisons.

2.5.1. Development of Comparison Matrix (Step One)

Criteria Comparison

To evaluate the criteria and calculate their comparative weightage, scoring is made with the utilization of the preference scale (Table 2) [31] and a pairwise comparison matrix is created [58]. The pairwise comparison matrix consists of n (n–1)/2 comparisons for n number of elements [48].
The priority scale of criteria was decided in consultation with experts as well as farmers who have vast experience in the respective field. In this study, three scenarios were considered for the ranking the criteria. The priority scaling of the criteria was judged based on the opinion from experts, farmers and the combined opinion of expert and farmer (Figure 2). Opinions were collected from various farmers’ groups who are actively involved in farming in the region. Similarly, judgements were gathered from the experts, especially scientists who are involved in the research area, for construction of the comparison matrix among the criteria. After that, the combined judgement was determined by averaging the ranking of the other two judgments.
However, weights of any criteria are determined by normalizing the pairwise comparison matrix. Normalization of a matrix is obtained by dividing the column elements of the matrix by the sum of each column. The row elements in the obtained matrix are summed, and the total value is divided by the number of elements in the row. In this manner, a priority vector or weight vector is obtained [59]. Weights range from 0 to 1, and their sum should be equal to 1 [56,60].

Conservation Measures Comparison

Suitable conservation measures were screened from the available technologies which are applicable and suitable for the study area. After that, a pairwise comparison matrix was developed for the selected technologies (alternatives) with respect to each criterion. In this study, we considered four conservation measures, Bench Terraces (BT), Vegetative Barrier (VB), Contour farming (CF) and Zero Tillage + Live Mulch (ZL), for selection of BMP. The individual conservation measure was applied separately in the arable land or agriculture land in high priority sub-basins derived from SWAT model analysis to assess the soil loss criteria changes pattern. Accordingly, all the conservation measures were ranked based on the SWAT results [38]. The other four criteria viz. cost, benefit, maintenance and environmentally friendly characteristics of each conservation practice are very relative in nature, and their actual estimates in terms of any value may vary over the locations. Therefore, their priorities were judged by the group of experts with their years of field experience as well as scientific research for these four criteria. The task was accomplished by giving the scale of relative importance to each selected technology. This step evaluates the performance of each technology against the other with respect to the selected criteria. The final comparison matrix is termed the criteria judgment matrix and is used to reflect the user-defined importance of the individual criteria themselves.

2.5.2. Extraction of Priority Vectors (Step Two)

After developing comparison matrices and the criteria judgment matrix, the next step was to extract the relative importance implied by each matrix. A matrix algebra was developed to compute the right principal eigenvector of each judgment matrix. The resulted eigenvector represents the priority vector of the respective criteria or technologies.

2.5.3. Consistency Evaluation (Step Three)

A logic-based consistency check should be performed to validate the analyst’s entries into the various comparison matrices [31]. The consistency threshold value was defined, which ensures that each matrix is within an acceptable consistency tolerance and, therefore, does not inadvertently violate the comparison values intended by the analyst. A consistency ratio was calculated for the pairwise comparison matrix where it was below 0.10; it was considered that the judgments showed a sufficient degree of consistency, and the assessment can be continued. If it was above 0.10, then the judgments were considered inconsistent indicating that the quality of the judgments needs to be improved. The consistency rate can be reduced by reviewing the judgments [61].

2.6. SWAT Model for BMP Selection

2.6.1. Model Description

To evaluate the effectiveness of a BMP’s implementation in the selected region and its impacts on reducing soil loss, the well-known Soil and Water Assessment Tool (SWAT) model is used. It is a physically based, spatially distributed watershed scale model with legacy of continuous model advancement over multiple decades [26,28,62,63,64]. Moreover, it comprises several modules representing climatic inputs, crop growth and yield, representation of management practices, hydrological cycling, erosion processes and resulting sediment transport, pollutant (nutrient, pesticide and pathogen) cycling and transport, etc. In the SWAT model, the entire basin based on the Digital Elevation Model (DEM) was first delineated into sub-basins, which were then further sub-divided into hydrologic response units (HRUs). Each HRU represents landscapes consisting of homogeneous soil, topographic, land use and management characteristics.

2.6.2. Model Data Sources

The SWAT model requires the topographic, climate, soil and land use information to execute the rainfall–runoff modeling. For topographic inputs, Shuttle Radar Topography Mission (SRTM) elevation data with 30m resolution were acquired from the Earth Explorer website. For land use information, Landsat8 data for 2019 were acquired from the Earth Explorer portal (https://earthexplorer.usgs.gov/) (accessed on 9 March 2019) and classified using supervised classification techniques. For image classification, supervised land use classification techniques were employed for study years. The recode technique was applied on some pixels of the known area by comparing with original FCC images to correct any misclassification. In order to validate the classified images, accuracy assessment technique was carried out. FCC images and Google Earth information were referred for verification of the classified data. The classification was tested and validated with 96% accuracy. Soil information was collected from NBSSLUP publications on ‘Soils of India’ series [65]. The soil erodibility factor (k) was computed based upon texture and organic matter content [66]. The final soil data are framed in the SWAT model input format. Climate data from 2000 to 2019 were obtained from the Selaqui meteorological station (30°20′57.71″ N, 77°52′7.81″ E), which is located near the study area, representing well the climate of the study area. The climatic variables of the SWAT model consist of rainfall, maximum and minimum air temperature, solar radiation, wind speed and relative humidity.

2.6.3. Execution of SWAT Model

In order to understand the sediment loss in different sub-basins, the SWAT model was executed with requisite inputs. The entire studied watershed was divided into 13 sub-basins with dominant land use, soil type, and management. Then, each sub-watershed was further sub-divided into hydrologic response units (HRUs) which are represented by homogeneous land use, management, topographical and soil characteristics. To understand the sediment loss in different years with and without conservation practices, the SWAT model was run for all sub-basins. The output of the soil erosion scenario was assessed and provided input to the AHP selection process. In the study, information on runoff data was not available to validate the model output. Therefore, model outputs for the area were compared with the research results from other study so as to realize the acceptability of the output for further analysis.

3. Results and Discussion

The approximate area of the study region is about 965.73 km2 with elevation varies between 350 m and 2500 m. The elevation, land use and soil depth map is presented in Figure 3. Most of the area (57%) were covered by forest, whereas the agricultural area only contributes around 10% of the total area (Table 3). However, there are also villages and agricultural areas existing in the high altitude of more than 2000 m. Table 3 also depicted that about 53% of the study area falls in the high sloping zone (more than 15% slope). Similarly, 88% of the area has a good soil depth of more than 50 cm. Soil depth denotes the depth up to unconsolidated rocks, i.e., C layer. There are two prominent soil series, namely Dhulkot and Bainkhala. The Dhulkot soil series (Alfisols and Inceptisols) is derived from heavy-textured, deep alluvium, yellowish-brown to dark yellowish-brown in colour, with few gravel and coarse rock fragments. For this soil, the depth comprises of A + B horizons. The Bainkhala (Entisols) soil series originated from the recent alluvium of stream-bed, with only A horizon formation and just below cobble and stones on top soil [67,68]. The soils are classified as Udic Haplustalf and Typic Ustifluvent, respectively [69,70].
Long term observation of rainfall and temperature data acquired from Selaqui weather station located near study area shows that mean annual rainfall is 1581 mm and average maximum and minimum temperature are 31.5 °C and 14.3 °C, respectively.
The permissible soil loss for the study area varied between 2.5 t/ha/yr to 12.5 t/ha/yr depending on the soil depth and soil resistive capacity [12,68]. Soil depth in the study area ranged between <25 cm and >100 cm, therefore, for shallow soil depth area (<25 cm), the permissible limit is 2.5 t/ha/yr, while for the deeper soil area (>100 cm soil depth), it is 12.5 t/ha/yr. For the region falling in the soil depth range of 50 to 75 cm, the recommended permissible limit is between 5 t/ha/yr and 7.5 t/ha/yr [44,68].

3.1. Criteria Ranking

In this study, three scenarios viz. expert, farmer and the collective opinion of expert and farmer were considered. Hence, three criteria matrices were framed to rank the criteria. The eigenvalue of each criterion with consistency index (C.R) is represented in Table 4 and indicated that the judgements are acceptably consistent. According to the experts’ opinions, soil loss is highly important followed by suitability, cost, maintenance and benefit, since, to protect the land fertility and its sustainability, soil loss must be controlled under permissible limit which farmers sometimes ignored or overruled for the higher profit from their farming. Suitability of a practice is also a major factor for sustainable agriculture, because a specific practice is sustainable if it is environmental friendly or suitable with the environment. On the other hand, farmers felt that cost for the implementation of conservation practice is most important criteria followed by benefit, maintenance, soil loss and suitability. Since marginal and small farmers are constrained by their economic status for their livelihood, therefore, for them, cost of any practice is the main factor for accepting in the farming. Similarly, the combined judgement of experts and farmers ranks the cost as the most important criterion, followed by soil loss, benefit, suitability and maintenance.

3.2. Comparison Matrix for Conservation Measures

Conservation measures are considered to control the water and soil erosion of land while maintaining soil moisture as well as fertility. Although, in practice, various conservation measures have their own merits and demerits and are suitable for different situations, which finally decides their adaptability. However, the conservation measures should be effective as well as adaptable before any recommendation is made. Rutebuka et al. [71] proved that bench terraces have huge potential to sustainably reduce soil erosion rates (85%) when established within an integrated approach, paying attention to correct installation and fertility-supporting agronomic practices. Whereas, in red soils of Bundelkhand region in Central India, contour bund at 0.7 m VI was a superior rainwater conservation measure to a vegetative barrier for sloping agricultural lands [72]. A study carried out by Komissarov et al. [73] reported that zero tillage or minimum tillage systems are the best recommendation for the erosion-prone slopes of alpine foothills. Similarly, Yadav et al. [74] recommended that growing summer maize under a no tillage-raised bed planting system develops higher soil moisture conservation, improved plant growth and, subsequently, good fodder and green cob yield in the hills of the northeast Himalayan Region. In another study, the SWAT model was used to simulate the impacts of contour farming and filter strips on water and sediment yields and found that implementation of contour farming and filters strips reduced sediments by 63% from the base value in the Thika-Chania catchment of Kenya [75]. Furthermore, different vegetation covers [76] and their heights [77] and soil management approaches [78] also play a great role in reducing soil loss from the land. However, several studies proved the effectiveness of conservation measures for controlling soil erosion. As indicated before, in this study, four conservation measures were considered which are suitable for the region. Comparison matrices for conservation measures were prepared with respect to each criterion.

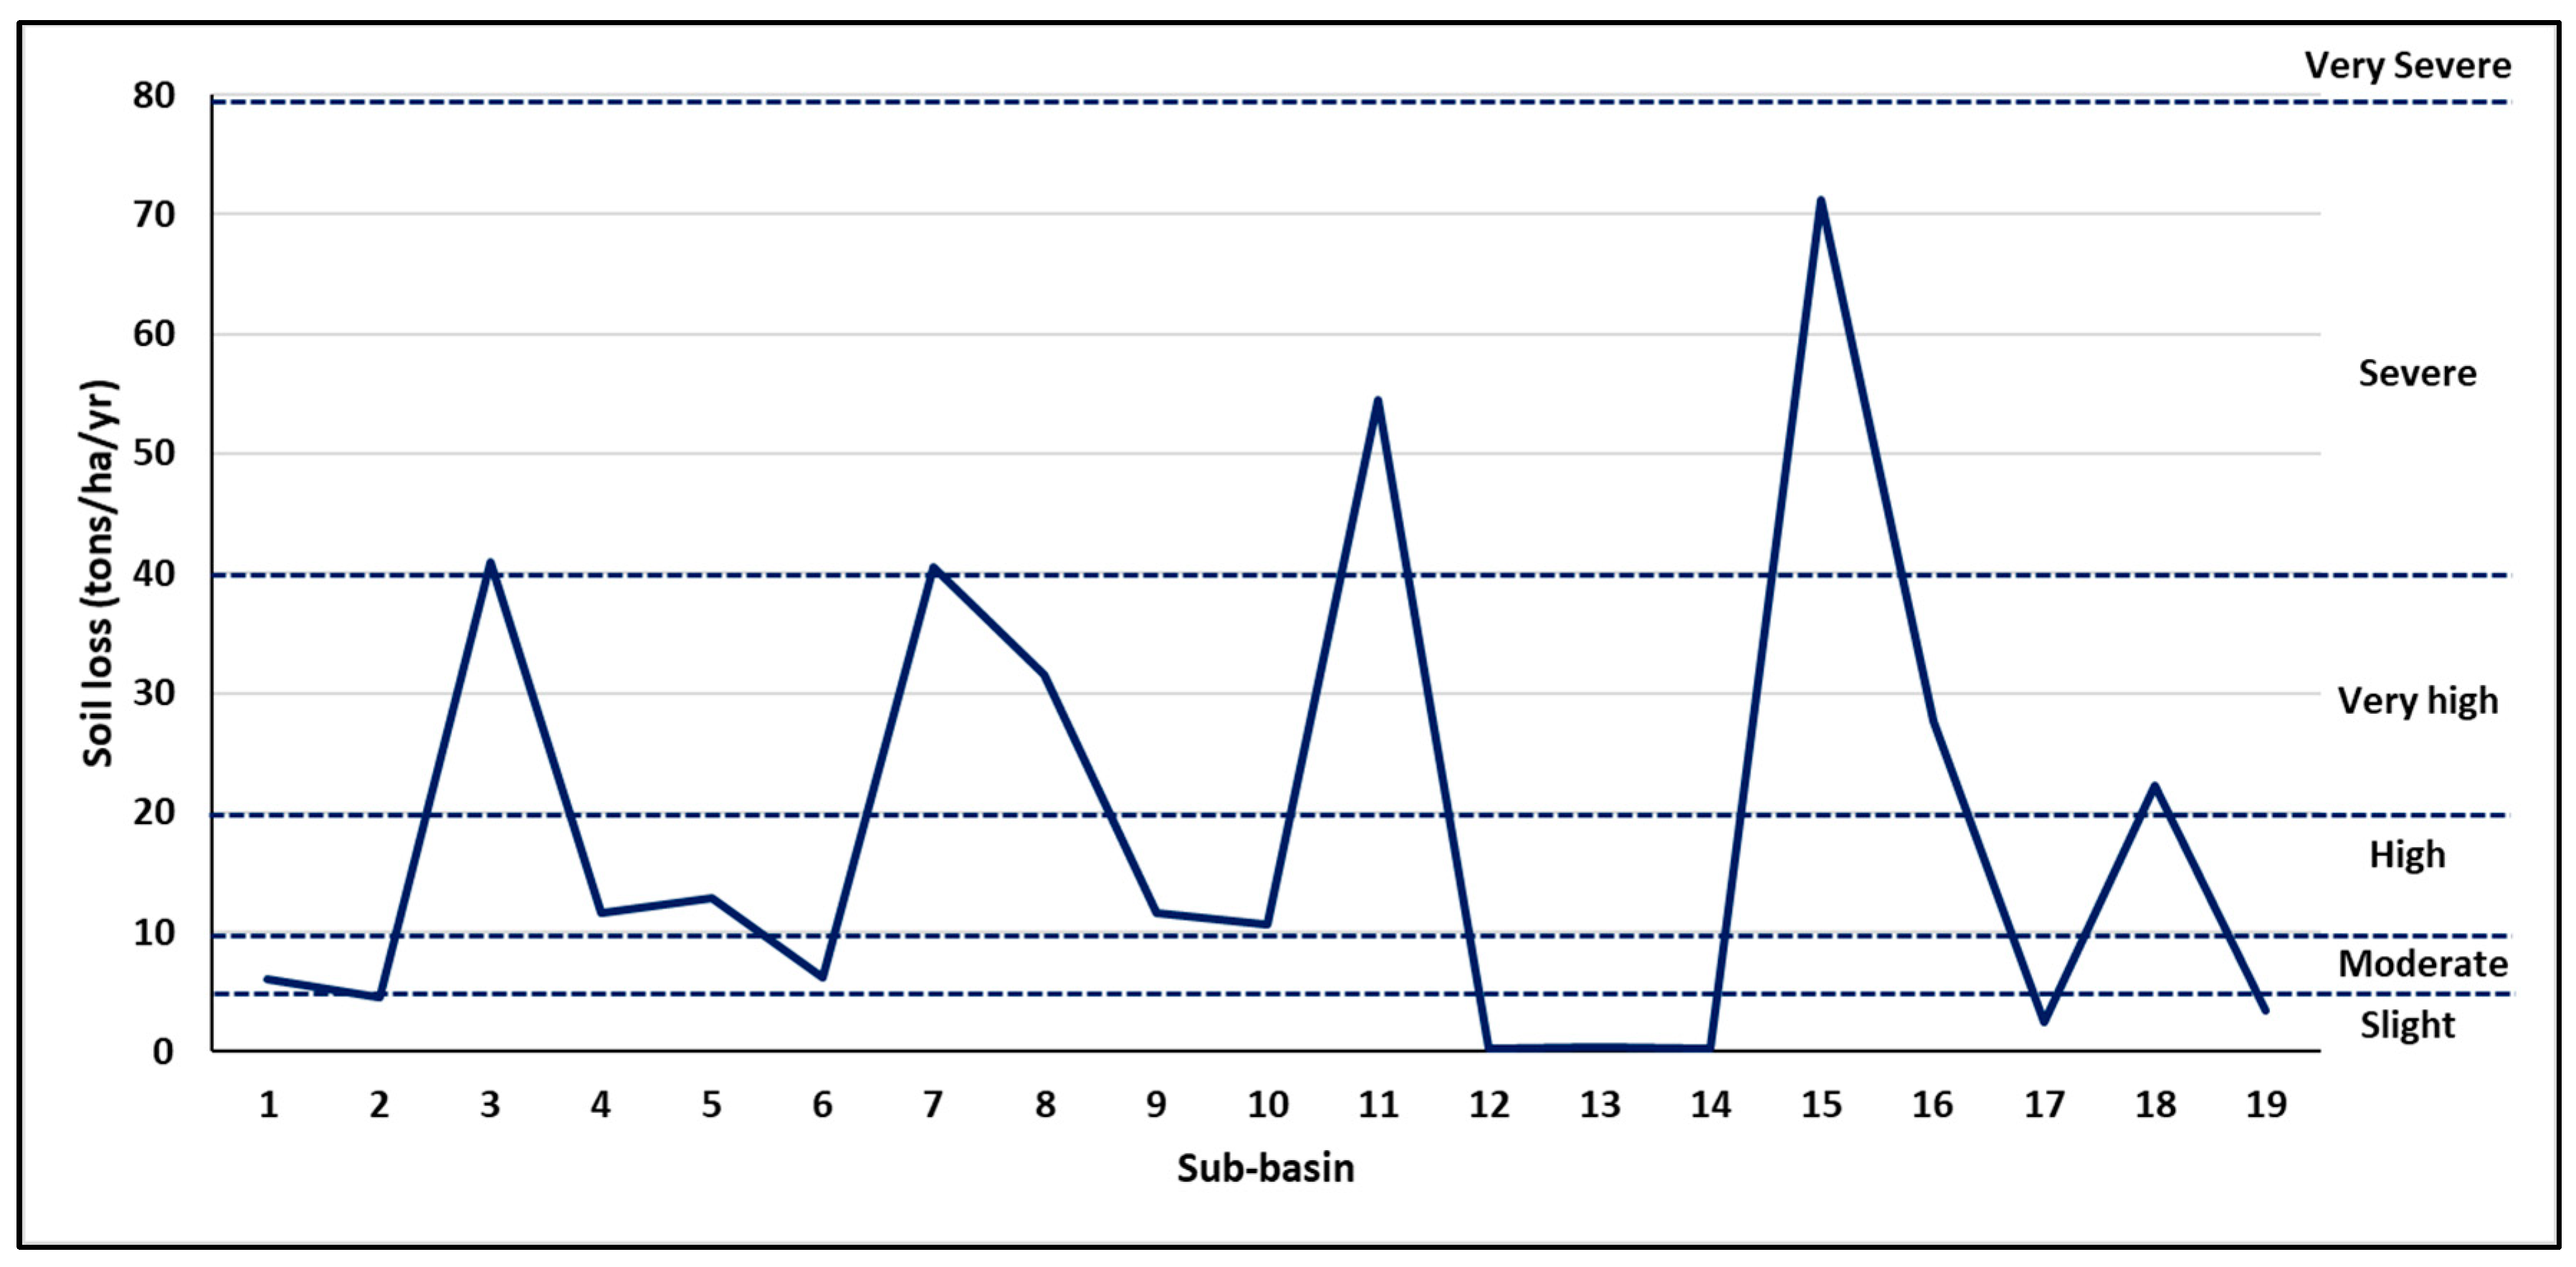
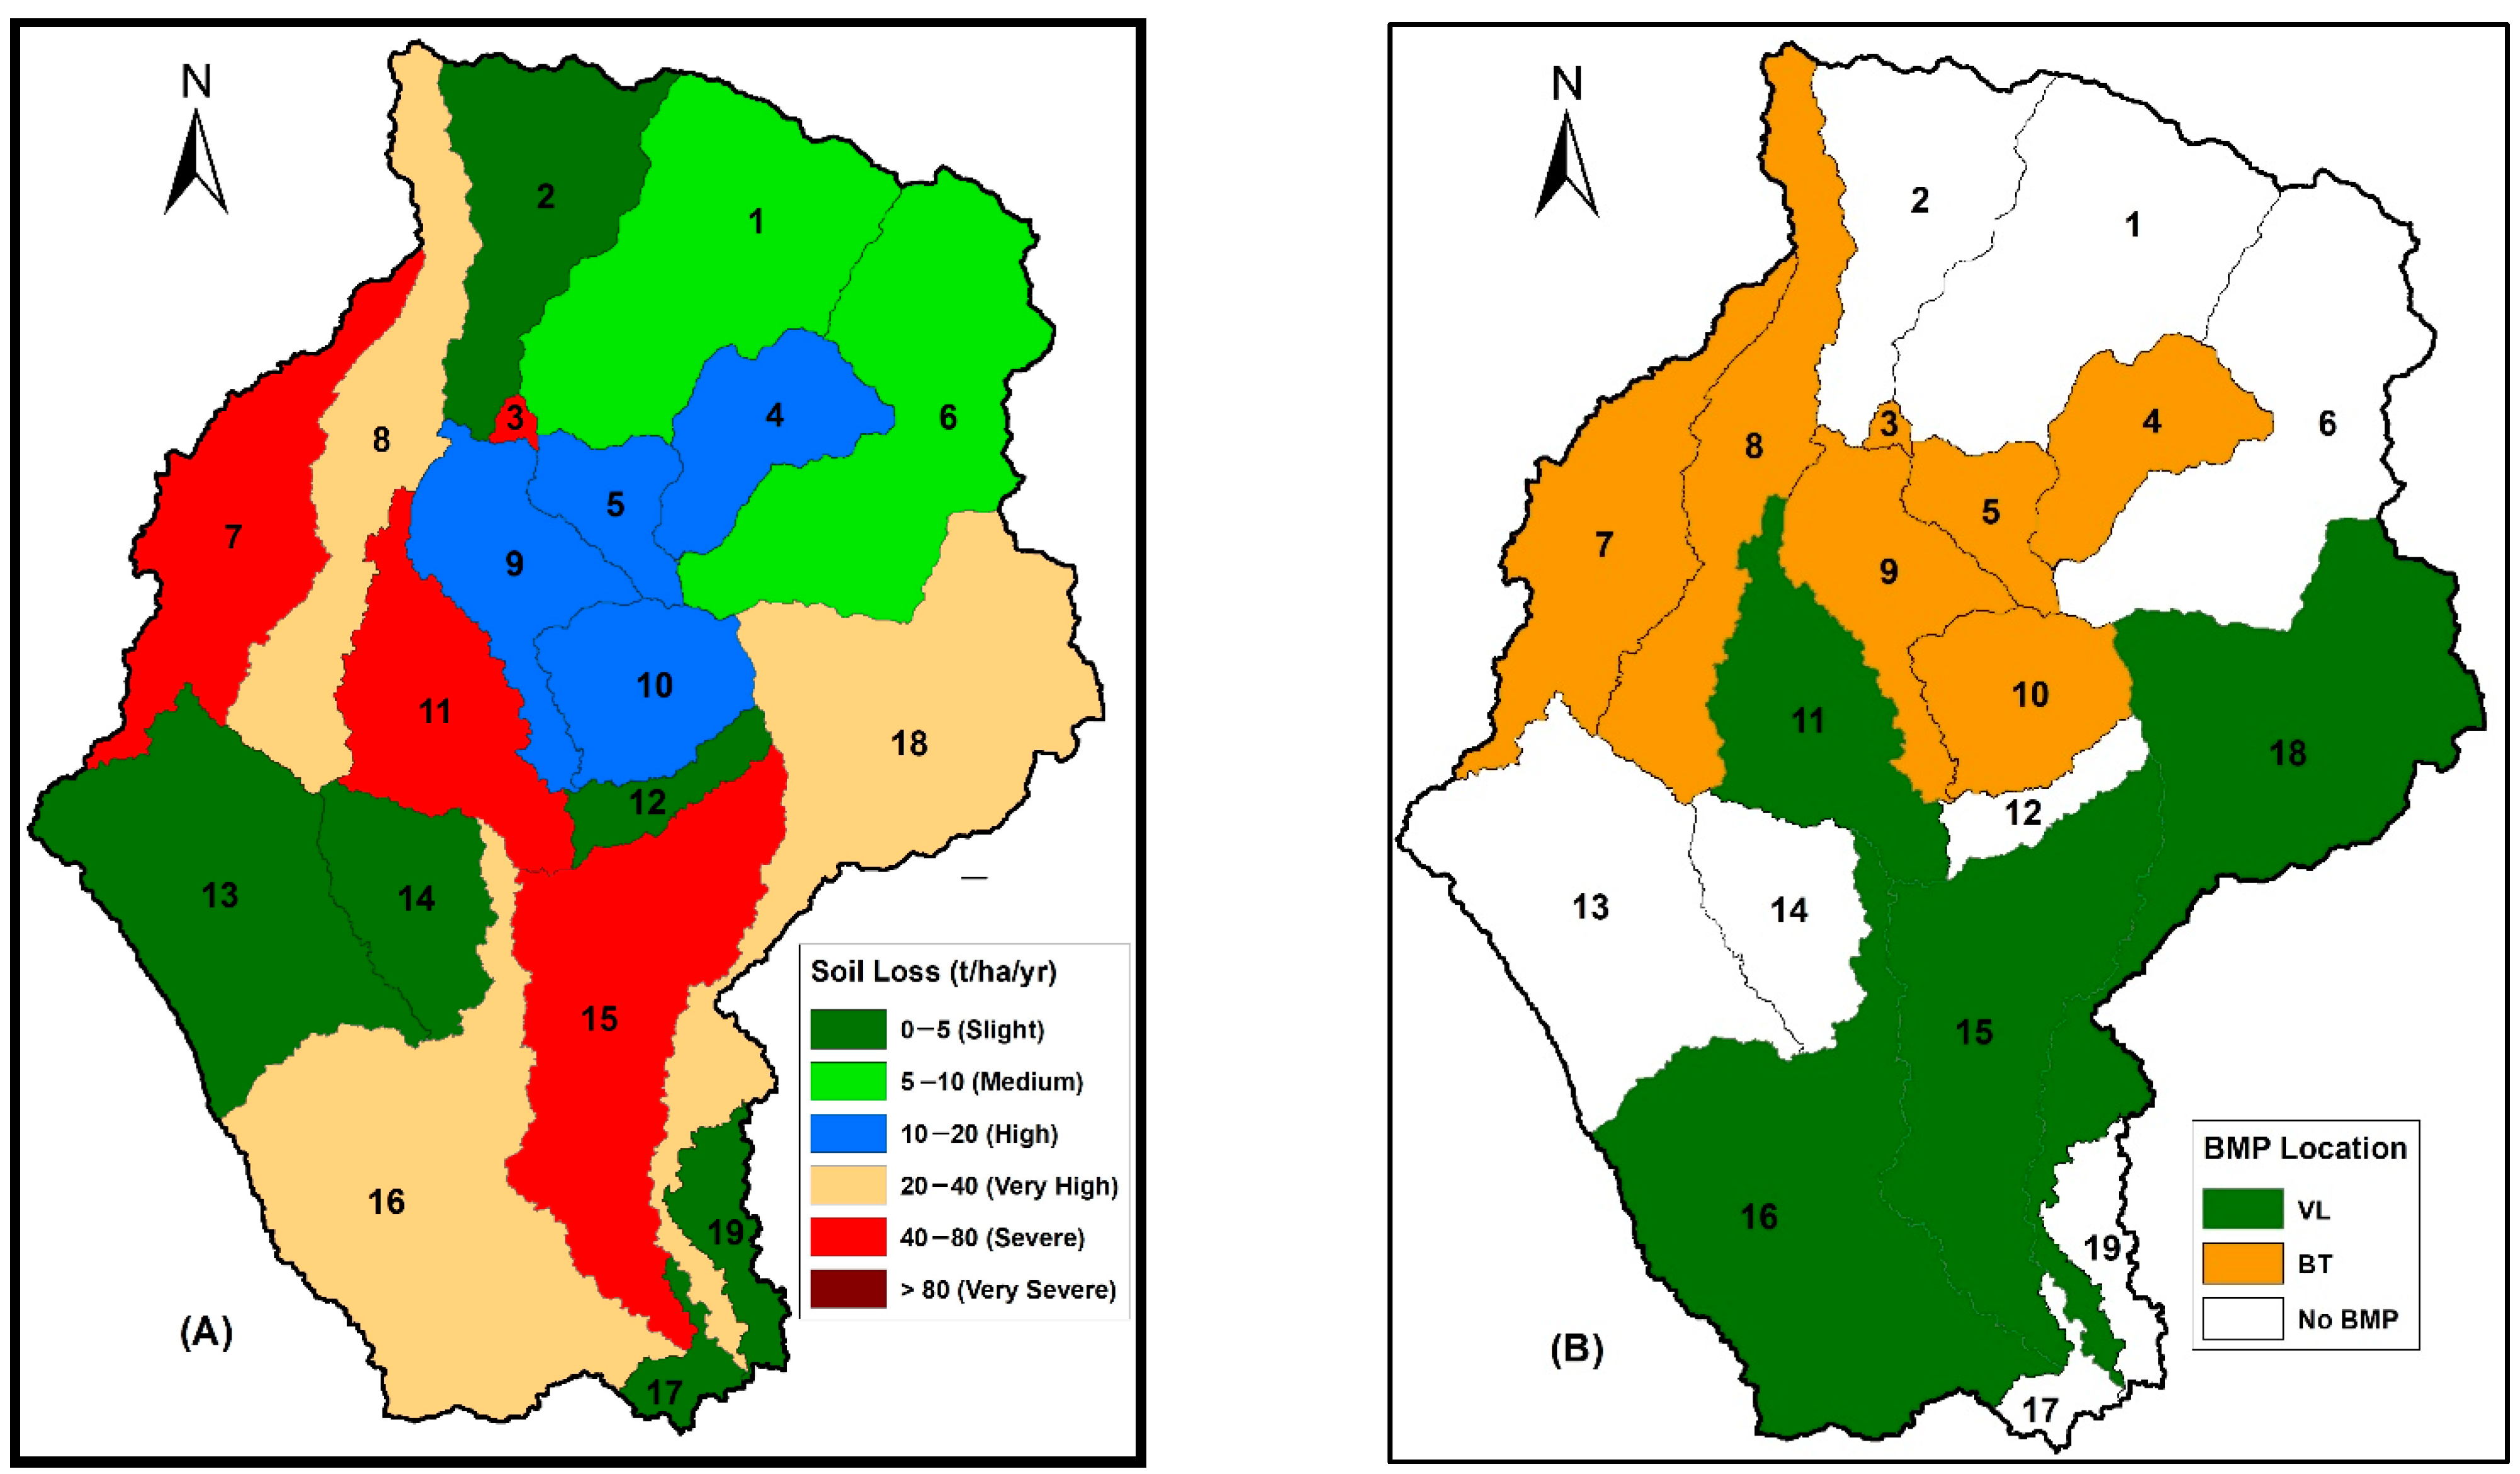
Soil Loss Scenario Using the SWAT Model

The soil loss criteria for each conservation measure were ranked based on SWAT model outputs. The soil loss was estimated before and after implementation of the conservation measure in the sub-basin where arable land is present. The sub-basin wise sediment loss scenario without BMP application is presented in Figure 4. The sub-basin soil loss ranges from 0.3 tons/ha/yr to 71 tons/ha/yr. Mahapatra et al. [18] also found that Dehradun district has severe erosion problems which are above the tolerance limit of 11.2 tons/ha/year of soil loss. The sediment loss scenario indicated that four sub-basins, #3, 7, 11 and 15, were classified as severely eroded zones, followed by sub basins 8, 16 and 18 as very high eroded zones. Sub-basins 3 and 7, however, have no significant agriculture land, therefore, further BMP analysis considered only two sub-basins, #11 and #15, as having agricultural land. Each conservation practice is usually first implemented on agricultural fields and executed by the SWAT model. After that, the sediment loss reduction (before and after scenario) was calculated and the conservation measures were ranked accordingly.
For other criteria like cost, benefit, maintenance and suitability, ranking of the conservation measure was achieved based on the expert’s judgement. The overall rankings for all conservation measures is presented in Table 5. The consistency ratio for each matrix depicted that the judgements are acceptably consistent, since the consistency ratio is less than 0.1 for all cases. It states that a bench terrace is the best for reducing soil loss, but, being high in cost, it requires high maintenance and is less environmentally friendly compared to other conservation measures, since significant earthwork needs to be carried out to prepare the bench terrace system. On the other hand, a vegetative barrier is highly suitable to the environment while maintenance trouble and cost are less, since it requires minimum work to implement the measures in already established field bunds. In the case of zero tillage with live mulch, cost and maintenance are the lowest compared to the other measures because of its minimal requirement of efforts to implement it.

3.3. Identification of BMP for the Selection Site

All conservation measures are applicable in a region based on certain criteria and situation of the area. However, farmers or policy planners need to work out the situation and adopt suitable technologies which are best suited for the area. In this study, the BMP was identified for a specific zone based on the ranking matrix of criteria and conservation measures. Three scenarios, i.e., expert’s judgement, farmers’ opinion and combined expert and farmer opinion (Table 6) were executed to find out the BMP for the different zones. This revealed that experts and farmers unanimously preferred zero tillage with live mulch for best management practices because of its low-cost implementation expenses and lower maintenance requirement while significantly controlling the erosion level, as well as being environment friendly, though the farmers preferred getting high profit or benefit before adopting any measures. However, it is likewise a fact that lost-cost practices are more favored by marginal farmers because of their financial constraints which prevail in the Indian farming system. Similarly, the bench terrace was preferred second for its capability of high erosion control as well as providing more economic benefits to the farmers. Contour farming was the least preferred technology because of its relatively low erosion resistance capability compared to other measures. The overall pattern for the three scenarios was quite similar, though their views for selection criteria were different. Experts gave importance to soil loss resistance capability of the technology whereas farmers were interested in low-cost and high profitable technology.

3.4. Implementation of BMP in the Watershed Area

AHP analysis facilitates identification of the ideal technology based on a user’s preference matrix. In this study, four technologies were judged and ranked based on five criteria. The most suitable technology was preferred for any area after satisfying all chosen criteria. However, each conservation measure has its own merits and demerits. As an example, bench terrace is mostly recommended for high sloping land. Whereas, in a less slopping area, vegetative barrier, zero tillage, live mulch, etc., are more suitable than bench terrace. Sometimes, a combination of measures is also encouraged if farmers can afford them. Therefore, the implementation strategy is also important to obtain the most satisfying results. The study only indicated the technology preferences to a particular area or region based on certain criteria. Users can add value with other information to make it more realistic before applying in any region. Therefore, final BMPs were recommended in different regions, taking into account slope information, assuming only one technology for each area (Figure 5). In this study, the sub-basins having soil erosion of less than 10 t/ha/yr were not considered for any BMP implementation because these areas do not require any management practices, as suggested by [12]. Therefore, BMP was recommended for the sub-basins which came under high to very severe erosion classes (soil erosion > 10 t/ha/yr). AHP analysis revealed that VL (Vegetative barrier + Live mulch) was the best management practice followed by BT (Bench Terrace) based on identified criteria. Therefore, VL was recommended for the areas with low altitude, whereas BT is recommended in the areas having high slopes because of its high capability of erosion control in high sloping areas. The recommended BMP will suffice for the condition of reducing the erosion level as well as maintaining the farmers’ suitability for adopting the technology.

4. Conclusions

This study was attempted to devise the process for identifying and implementing the best management practices based on some identified criteria in erosion risk areas. In this process, AHP was employed, which is a system of ranking different options against each other based on importance. Here, five criteria viz. soil loss reduction capability, cost, benefit, maintenance and environmental friendliness were prioritized based on experts’ as well as farmers’ opinions. Then, suitable conservation measures were ranked based on SWAT model output and experts’ judgements. Three scenarios were considered for BMP selection i.e. experts’ judgements, farmers’ opinions and the combined opinion of expert and farmer. The study shows that experts emphasized environmental aspects such as soil loss control capacity and environmental friendliness whereas farmers were interested in benefit, cost and maintenance for adopting any technology. However, the main objective was to recommend a BMP which is capable of controlling the soil erosion significantly while satisfying the interest of the farmers in a highly eroded area. The SWAT model revealed that the study area consists of 19 sub-basins, out of which 11 sub-basins had soil loss of more than 10 t/ha/yr, which requires treatment with suitable conservation measures. It is well known that many conservation measures may be adopted to treat the soil loss, but every conservation measure has its own advantages and disadvantages. Thus, it is indeed a very complex situation to identify the best measures and simultaneously satisfy the users’ interest. Therefore, a holistic and systematic approach is required to choose the best conservation measure which satisfy the maximum interest of the users as well as are suitable for the area. However, the final AHP result showed that zero tillage + live mulch was preferred most, followed by bench terrace, vegetative barrier and contour farming, unanimously by experts, farmers and the combined judgement of expert and farmers. Although, sometimes, additional judgements may be applied to determine the BMP for realistic implementation in the region. Furthermore, the SWAT model facilitates optimization and validation of the BMP recommendation in the region. In North-western Himalayas, several studies proved that appropriate conservation measures are needed to sustain the highly fragile ecosystem. However, the present study has highlighted on the methodology for screening the underlying criteria and applying statistical techniques (AHP) considering experts’ as well as farmers’ judgements for identifying BMPs for the region. This approach may be successfully applied in any region considering the suitable criteria and recommend BMPs for sustainable ecosystem management. Further study may consider more appropriate criteria which represent well the objective and validate the result with field data. Moreover, planners and policy makers may take advantage of this technique to solve the complex scenario for developing realistic and sustainable management plans for farming.

Author Contributions

Conceptualization, N.M.A., C.J. and D.M.; methodology, N.M.A. and C.J.; software and validation, C.J., N.M.A., S.S.S. and U.M.; resources, C.J. and D.M.; original draft preparation, N.M.A., C.J. and D.M.; review and editing, G.K., S.M. and S.K.M.; project administration, N.M.A. All authors have read and agreed to the published version of the manuscript.

Funding

The study was carried out under institute funded project. No external funds were involved.

Institutional Review Board Statement

Not applicable.

Informed Consent Statement

Not applicable.

Data Availability Statement

All data generated or analyzed during this study are included in this article, and the datasets used or analyzed during the current study are available from the corresponding authors on reasonable request.

Conflicts of Interest

The authors declare no conflict of interest.

References

  1. Giorgi, F.; Bi, X.; Pal, J. Mean, interannual variability and trends in a regional climate change experiment over Europe II: Climate change scenarios (2071–2100). Clim. Dyn. 2004, 23, 839–858. [Google Scholar] [CrossRef]
  2. Raisanen, J.; Hansson, U.; Ullerstig, A.; Doscher, R.; Graham, L.P.; Jones, C.; Meier, H.E.M.; Samuelsson, P.; Willen, U. European climate in the late twenty-first century: Regional simulations with two driving global models and two forcing. Clim. Dyn. 2004, 22, 13–31. [Google Scholar] [CrossRef]
  3. Trenberth, K.E.; Dai, A.; Rasmussen, R.M.; Parsons, D.B. The changing character of precipitation. Bull. Am. Meteorol. Soc. 2003, 84, 1205–1217. [Google Scholar] [CrossRef]
  4. Food and Agriculture Organization of the United Nations. Status of the World’s Soil Resources (SWSR)—Main Report; FAO: Rome, Italy, 2015; Volume 650. [Google Scholar]
  5. Borrelli, P.; Robinson, D.A.; Fleischer, L.R.; Lugato, E.; Ballabio, C.; Alewell, C.; Meusburger, K.; Modugno, S.; Schütt, B.; Ferro, V. An assessment of the global impact of 21st century land use change on soil erosion. Nat. Commun. 2017, 8, 1–13. [Google Scholar] [CrossRef] [PubMed] [Green Version]
  6. Wakatsuki, T.; Rasyidin, A. Rates of weathering and soil formation. Geoderma 1992, 52, 251–263. [Google Scholar] [CrossRef]
  7. Ng, S.L.; Cai, Q.G.; Ding, S.W.; Chau, K.C.; Qin, J. Effects of contour hedgerows on water and soil conservation, crop productivity and nutrient budget for slope farmland in the Three Gorges Region (TGR) of China. Agrofor. Syst. 2008, 74, 279–291. [Google Scholar] [CrossRef]
  8. Pelt, R.S.V.; Hushmurodov, S.X.; Baumhardt, R.L.; Chappell, A.; Nearing, M.A.; Polyakov, V.O. The reduction of partitioned wind and water erosion by conservation agriculture. Catena 2017, 148, 160–167. [Google Scholar] [CrossRef]
  9. Bhattacharyya, P.; Bhatt, V.K.; Mandal, D. Soil loss tolerance limits for planning of soil conservation measures in Shivalik–Himalayan region of India. Catena 2008, 73, 117–124. [Google Scholar] [CrossRef]
  10. Bhattacharyya, P.; Mandal, D.; Bhatt, V.K.; Yadav, R.P. A Quantitative Methodology for Estimating Soil Loss Tolerance Limits for Three States of Northern India. J. Sustain. Agric. 2011, 35, 276–292. [Google Scholar] [CrossRef]
  11. Lakaria, B.L.; Biswas, H.; Mandal, D. Soil loss tolerance values for different physiographic regions of Central India. Soil Use Manag. 2008, 24, 192–198. [Google Scholar] [CrossRef]
  12. Mandal, D.; Sharda, V.N. Assessment of permissible soil loss in India employing a quantitative bio-physical model. Curr. Sci. 2011, 100, 383–390. [Google Scholar]
  13. Mohamadi, M.A.; Kavian, A. Effects of rainfall patterns on runoff and soil erosion in field plots. Int. Soil Water Conserv. Res. 2015, 3, 273–281. [Google Scholar] [CrossRef] [Green Version]
  14. Xu, Q.X.; Wu, P.; Dai, J.F.; Wang, T.W.; Li, X.Z.; Cai, C.F.; Shi, Z.H. The effects of rainfall regimes and terracing on runoff and erosion in the Three Gorges area, China. Environ. Environ. Sci. Pollut. Res. 2018, 25, 9474–9484. [Google Scholar] [CrossRef] [PubMed]
  15. Benavidez, R.; Jackson, B.; Maxwell, D.; Norton, K. A review of the (Revised) Universal Soil Loss Equation ((R)USLE): With a view to increasing its global applicability and improving soil loss estimates. Hydrol. Earth Syst. Sci. 2018, 22, 6059–6086. [Google Scholar] [CrossRef] [Green Version]
  16. Borrelli, P.; Alewell, C.; Alvarez, P.; Anache, J.A.A.; Baartman, J.; Ballabio, C.; Bezak, N.; Biddoccu, M.; Cerdà, A.; Chalise, D.; et al. Soil erosion modeling: A global review and statistical analysis. Sci. Total Environ. 2021, 780, 146494. [Google Scholar] [CrossRef]
  17. George, K.J.; Kumar, S.; Hole, R.M. Geospatial modeling of soil erosion and risk assessment in Indian Himalayan region—A study of Uttarakhand state. Environ. Adv. 2021, 4, 100039. [Google Scholar] [CrossRef]
  18. Mahapatra, S.K.; Reddy, G.P.O.; Nagdev, R.; Yadav, R.P.; Singh, S.K.; Sharda, V.N. Assessment of soil erosion in the fragile Himalayan ecosystem of Uttarakhand, India using USLE and GIS for sustainable productivity. Curr. Sci. 2018, 115, 108–121. [Google Scholar] [CrossRef]
  19. Jazouli, A.E.; Barakat, A.; Ghafiri, A.; Moutaki, S.E.; Ettaqy, A.; Khellouk, R. Soil erosion modeled with USLE, GIS, and remote sensing: A case study of Ikkour watershed in Middle Atlas (Morocco). Geosci. Lett. 2017, 4, 25. [Google Scholar] [CrossRef] [Green Version]
  20. Alexakis, D.D.; Hadjimitsis, D.G.; Agapiou, A. Integrated use of remote sensing, GIS and precipitation data for the assessment of soil erosion rate in the catchment area of “Yialias” in Cyprus. Atmos. Res. 2013, 131, 108–124. [Google Scholar] [CrossRef]
  21. Renard, K.G.; Foster, G.R.; Weesies, G.; McCool, D.; Yoder, D. Predicting Soil Erosion by Water: A Guide to Conservation Planning with the Revised Universal Soil Loss Equation (RUSLE); US Government Printing Office: Washington, DC, USA, 1997; Volume 703. [Google Scholar]
  22. Parajuli, P.B.; Nelson, N.O.; Frees, L.D.; Mankin, K.R. Comparison of AnnAGNPS and SWAT model simulation results in USDA-CEAP agricultural watersheds in south-central Kansas. Hydrol. Processes 2009, 23, 748–763. [Google Scholar] [CrossRef]
  23. Gassman, P.W.; Arnold, J.G.; Srinivasan, R.; Reyes, M. The worldwide use of the SWAT model: Technological drivers, networking impacts and simulation trends. In Proceedings of the 21st Century Watershed Technology: Improving Water Quality and Environment. Universidad Earth, San Jose, Costa Rica, 21–24 February 2010; American Society of Agricultural Engineering: St. Joseph, MI, USA, 2010. [Google Scholar]
  24. Boscha, N.S.; Allanb, J.D.; Dolanc, D.M.; Hand, H.; Richardse, R.P. Application of the Soil and Water Assessment Tool for six watersheds of Lake Erie: Model parameterization and calibration. J. Great Lakes Res. 2011, 37, 263–271. [Google Scholar] [CrossRef]
  25. Zhang, X.; Srinivasan, R.; Arnold, J.; Izaurralde, R.C.; Boasch, D. Simultaneous calibration of surface flow and baseflow simulations: A revisit of the SWAT model calibration framework. Hydrol. Processes 2011, 25, 2313–2320. [Google Scholar] [CrossRef]
  26. Arnold, J.G.; Srinivasan, R.; Muttiah, R.S.; Williams, J.R. Large area hydrologic model development and assessment part 1: Model development. J. Am. Water Resour. Assoc. 1998, 34, 73–89. [Google Scholar] [CrossRef]
  27. Neitsch, S.L.; Arnold, J.G.; Kiniry, J.R.; Williams, J.R. Soil and Water Assessment Tool: Theoretical Documentation; USDA-ARS Grassland, Soil and Water Research Laboratory: Temple, TX, USA, 2005. [Google Scholar]
  28. Gassman, P.W.; Reyes, M.R.; Green, C.H.; Arnold, J.G. The Soil and Water Assessment Tool: Historical development, applications and future research directions. Trans. ASABE 2007, 50, 1211–1250. [Google Scholar] [CrossRef] [Green Version]
  29. Arabi, M.; Frankenberger, J.R.; Engel, B.A.; Arnold, J.G. Representation of agricultural conservation practices with SWAT. Hydrol. Processes 2007, 22, 3042–3055. [Google Scholar] [CrossRef]
  30. Giri, S.; Nejadhashemi, A.P. Application of analytical hierarchy process for effective selection of agricultural best management practices. J. Environ. Manag. 2014, 132, 165–177. [Google Scholar] [CrossRef]
  31. Saaty, T.L. The Analytic Hierarchy Process; Mcgraw-Hill: New York, NY, USA, 1980. [Google Scholar]
  32. Hipp, J.A.; Ogunseitan, O.; Lejano, R.; Smith, C.S. Optimization of stormwater filtration at the urban/watershed interface. Environ. Sci. Technol. 2006, 40, 4794–4801. [Google Scholar] [CrossRef]
  33. Young, K.D.; Younos, T.; Dymond, R.L.; Kibler, D.F.; Lee, D.H. Application of the Analytic Hierarchy Process for Selecting and Modeling Stormwater Best Management Practices. J. Contemp. Water Res. Educ. 2010, 146, 50–63. [Google Scholar] [CrossRef]
  34. Lai, V.S.; Wong, B.K.; Cheung, W. Group decision making in a multiple criteria environment: A case using the AHP in software selection. Eur. J. Oper. Res. 2002, 137, 134–144. [Google Scholar] [CrossRef]
  35. Giri, S.; Nejadhashemi, A.P.; Woznicki, S.A. Evaluation of targeting methods for implementation of best management practices in the Saginaw River Watershed. J. Environ. Manag. 2012, 103, 24–40. [Google Scholar] [CrossRef]
  36. Cunningham, J.H.; Benham, B.L.; Brannan, K.M.; Mostaghimi, S.; Dillaha, T.A.; Pease, J.W. An assessment of the quality of the agricultural best management practices implemented in the James River basin of Virginia. In Proceedings of the 2003 ASAE Annual Meeting, Las Vegas, NV, USA, 27–30 July 2003; American Society of Agricultural and Biological Engineers: St. Joseph, MI, USA, 2003; pp. 190–281. [Google Scholar]
  37. White, M.J.; Storm, D.E.; Busteed, P.R.; Stoodley, S.H.; Phillips, S.J. Evaluating nonpoint source critical source area contributions at the watershed scale. J. Environ. Qual. 2009, 38, 1654–1663. [Google Scholar] [CrossRef] [PubMed]
  38. Giri, S.; Nejadhashemi, A.P.; Woznicki, S.A.; Zhang, Z. Analysis of best management practice effectiveness and spatiotemporal variability based on different targeting strategies. Hydrol. Processes 2014, 28, 434–455. [Google Scholar] [CrossRef]
  39. Pertiwi, S.; Konaka, T.; Koike, M. Decision support system for management of upland farming with special consideration on soil conservation. In Proceedings of the First Conference on Agricultural Information Technology in Asia and Oceania, Wakayama, Japan, 24–26 January 1998; The Asian Federation for information Technology in Agriculture: Wakayama, Japan, 1998; pp. 73–78. [Google Scholar]
  40. Bishr, Y.A.; Radwan, M.M. Preliminary design of a decision support system for watershed management. ITC J. 1995, 1, 23–28. [Google Scholar]
  41. Himanshu, S.K.; Pandey, A.; Yadav, B.; Gupta, A. Evaluation of best management practices for sediment and nutrient loss control using SWAT model. Soil Tillage Res. 2019, 192, 42–58. [Google Scholar] [CrossRef]
  42. Jana, C.; Mandal, D.; Shrimali, S.S.; Alam, N.M.; Kumar, R.; Sena, D.R.; Kaushal, R. Assessment of urban growth effects on green space and surface temperature in Doon Valley, Uttarakhand, India. Environ. Monit. Assess. 2020, 192, 257. [Google Scholar] [CrossRef]
  43. Alam, N.M.; Sharma, G.C.; Moreira, E.; Jana, C.; Mishra, P.K.; Sharma, N.K.; Mandal, D. Evaluation of drought using SPEI drought class transitions and log-linear models for different agro-ecological regions of India. Phys. Chem. Earth 2017, 100, 31–43. [Google Scholar] [CrossRef]
  44. Mandal, D.; Dadhwal, K.S.; Khola, O.P.S.; Dhayni, B.L. Adjusted T values for conservation planning in Northwest Himalayas of India. J. Soil Water Conserv. 2006, 61, 391–397. [Google Scholar]
  45. Singh, G.; Babu, R.; Narain, P.; Bhushan, L.S.; Abrol, I.P. Soil erosion rates in India. J. Soil Water Conserv. 1992, 47, 97–99. [Google Scholar]
  46. Tang, J.C.S.; Nam, I.S. Sector priority and technology choice in the Korean machinery industry. Int. J. Technol. Manag. 1993, 8, 333–334. [Google Scholar] [CrossRef]
  47. Karbhari, V.M. The analytic hierarchy process: A viable decision tool for composite materials? Int. J. Technol. Manag. 1994, 9, 77–93. [Google Scholar]
  48. Barbarosoglu, G.; Pinhas, D. Capital rationing in the public sector using the analytic hierarchy process. Eng. Econ. 1995, 40, 315–341. [Google Scholar] [CrossRef]
  49. Partovi, F.Y. Determining what to benchmark: An analytic hierarchy process approach. Int. J. Oper. Prod. Manag. 1994, 14, 25–39. [Google Scholar] [CrossRef]
  50. Davis, L.; Williams, G. Evaluating and selecting simulation software using the analytic hierarchy process. Integr. Manuf. Syst. 1994, 5, 23–32. [Google Scholar] [CrossRef]
  51. Liberatore, M.J.; Nydick, R.L.; Sanchez, P.M. The evaluation of research papers (or how to get an academic committee to agree on something. Interfaces 1992, 22, 92–100. [Google Scholar] [CrossRef] [Green Version]
  52. Ossadnik, W. AHP-based synergy allocation to the partners in a merger. Eur. J. Oper. Res. 1996, 88, 42–49. [Google Scholar] [CrossRef]
  53. Partovi, F.Y.; Hopton, W.E. The analytic hierarchy process as applied to two types of inventory problems. Prod. Inventory Manag. J. 1994, 26, 13–19. [Google Scholar]
  54. Lee, H.; Kwak, W.; Han, I. Developing a business performance evaluation system: An analytical hierarchical model. Eng. Econ. 1995, 40, 343–357. [Google Scholar] [CrossRef]
  55. Madu, C.N. On the total productivity management of a maintenance float system through AHP applications. Int. J. Prod. Econ. 1994, 34, 201–207. [Google Scholar] [CrossRef]
  56. Ozturk, D.; Batuk, F. Implementation of gis-based multicriteria decision analysis with VB in ArcGIS. Int. J. Inf. Technol. Decis. Mak. 2011, 10, 1023–1042. [Google Scholar] [CrossRef]
  57. Saaty, T.L. How to Make a Decision: The Analytic Hierarchy Process. Interfaces 1994, 24, 19–43. [Google Scholar] [CrossRef] [Green Version]
  58. Saaty, T.L. Decision making—The Analytic Hierarchy and Network Processes (AHP/ANP). J. Syst. Sci. Syst. Eng. 2004, 13, 1–35. [Google Scholar] [CrossRef]
  59. Tombus, F.E. Uzaktan algılama ve coğrafi bilgi sistemleri kullanılarak erozyon risk belirlemesine yeni bir yaklaşım, Çorum ili örneği. Ph.D. Thesis, Anadolu Üniversitesi, Fen Bilimleri Enstitüsü. Uzaktan Algılama ve Cografi Bilgi Sistemleri Anabilim Dalı, Eskisehir, Turkey, August 2005. [Google Scholar]
  60. Malczewski, J. GIS and Multicriteria Decision Analysis; Wiley: New York, NY, USA, 1999. [Google Scholar]
  61. Özturk, D.; Batuk, F. Criterion Weighting in Multicriterıa Decision Making. J. Eng. Nat. Sci. 2007, 25, 86–98. [Google Scholar]
  62. Arnold, J.G.; Moriasi, D.N.; Gassman, P.W.; Abbaspour, K.C.; White, M.J.; Srinivasan, R.; Santhi, C.; Harmel, R.D.; van Griensven, A.; Liew, M.W.V.; et al. SWAT: Model use, calibration, and validation. Trans. ASABE 2012, 55, 1491–1508. [Google Scholar] [CrossRef]
  63. Williams, J.R.; Arnold, J.G.; Kiniry, J.R.; Gassman, P.W.; Green, C.H. History of model development at Temple, Texas. Hydrol. Sci. 2008, 53, 948–960. [Google Scholar] [CrossRef] [Green Version]
  64. Bieger, K.; Arnold, J.G.; Rathjens, H.; White, M.J.; Bosch, D.D.; Allen, P.M.; Volk, M.; Srinivasan, R. Introduction to SWAT, a completely restructured version of the soil and water assessment tool. J. Am. Water Resour. Assoc. 2017, 53, 115–130. [Google Scholar] [CrossRef]
  65. NBSSLUP, Soils of India. National Bureau of Soil Survey and Land Use Planning; Publ. No. 94; NBSSLUP, Soils of India: Nagpur, India, 2002. [Google Scholar]
  66. Kirkby, M.J.; Morgan, R.P. Soil Erosion; John Wiley & Sons: New York, NY, USA, 1980; pp. 150–179. [Google Scholar]
  67. Bhardwaj, S.P.; Singh, P.N. Soil, Land Capability Land Use Characteristics of Soil Conservation Research Farm, Dehradun; Technical Bulletin No. T-14/D-11, No 4–8; Central Soil and Water Conservation Research and Training Institute: Dehradun, India, 1981. [Google Scholar]
  68. Mandal, D.; Sharda, V.N.; Tripathi, K.P. Relative efficacy of two biophysical approaches to assess soil loss tolerance for Doon Valley soils of India. J. Soil Water Conserv. 2010, 65, 42–49. [Google Scholar] [CrossRef]
  69. Soil Survey Staff. Keys to Soil Taxonomy, 8th ed.; US Department of Agriculture Natural Resource Conservation Service: Washington, DC, USA, 1998; 326p. [Google Scholar]
  70. Mandal, D.; Dadhwal, K.S. Land Evaluation and Soil Easement for Conservation Planning and Enhanced Productivity; Technical Bulletin No. T-59/D-38; Central Soil and Water Conservation Research and Training Institute: Dehradun, India, 2012. [Google Scholar]
  71. Rutebuka, J.; Uwimanzi, A.M.; Nkundwakazi, O.; Kagabo, D.M.; Mbonigaba, J.J.M.; Vermeir, P.; Verdoodt, A. Effectiveness of terracing techniques for controlling soil erosion by water in Rwanda. J. Environ. Manag. 2021, 277, 111369. [Google Scholar] [CrossRef]
  72. Narayan, D.; Biswas, H.; Kumar, P. Efficacy of contour bunds and vegetative barriers in resource conservation on sloping agricultural land in Bundelkhand region. Indian J. Soil Conserv. 2019, 47, 280–285. [Google Scholar]
  73. Komissarov, M.A.; Klik, A. The Impact of No-Till, Conservation, and Conventional Tillage Systems on Erosion and Soil Properties in Lower Austria. Eurasian Soil Sci. 2020, 53, 503–511. [Google Scholar] [CrossRef]
  74. Yadav, G.S.; Saha, P.; Babu, S.; Das, A.; Layek, A.; Debnath, C. Effect of No-Till and Raised-Bed Planting on Soil Moisture Conservation and Productivity of Summer Maize (Zea mays) in Eastern Himalayas. Agric. Res. 2018, 7, 300–310. [Google Scholar] [CrossRef]
  75. Gathagu, J.N.; Mourad, K.A.; Sang, J. Effectiveness of Contour Farming and Filter Strips on Ecosystem Services. Water 2018, 10, 1312. [Google Scholar] [CrossRef] [Green Version]
  76. Chau, N.L.; Chu, L.M. Fern cover and the importance of plant traits in reducing erosion on steep soil slopes. CATENA 2017, 151, 98–106. [Google Scholar] [CrossRef]
  77. Apollonio, C.; Petroselli, A.; Tauro, F.; Cecconi, M.; Biscarini, C.; Zarotti, C.; Grimaldi, S. Hillslope Erosion Mitigation: An Experimental Proof of a Nature-Based Solution. Sustainability 2021, 13, 6058. [Google Scholar] [CrossRef]
  78. Stanchi, S.; Zecca, O.; Hudek, C.; Pintaldi, E.; Viglietti, D.; D’Amico, M.E.; Colombo, N.; Goslino, D.; Letey, M.; Freppaz, M. Effect of Soil Management on Erosion in Mountain Vineyards (N-W Italy). Sustainability 2021, 13, 1991. [Google Scholar] [CrossRef]
Figure 1. Location map of study area.
Land 11 00832 g001
Figure 2. Conceptual framework of AHP analysis.
Land 11 00832 g002
Figure 3. Study area elevation, land use map and soil map.
Land 11 00832 g003
Figure 4. Sub-basin wise average soil loss (SWAT model) during 1992–2019 (with erosion class).
Land 11 00832 g004
Figure 5. Sediment loss scenario before BMP implementation (A); BMP recommendation (B).
Land 11 00832 g005
Table 1. Different classes of soil erosion by water in India.
Soil Erosion Rate (Mg/ha/yr)Soil Erosion Class
0–5Slight
5–10Moderate
10–20High
20–40Very high
40–80Severe
More than 80Very severe
Table 2. The priority scale for pairwise comparison for different criteria.
Weightage/
Priority
DefinitionExplanation
1Equal importanceTwo activities contribute equally to the objective
3Weak importance of one over anotherExperience and judgment slightly favor one activity over another
5Essential or strong importanceExperience and judgment strongly favor one activity over another
7Demonstrated importanceAn activity is strongly favored and its dominance demonstrated in practice
9Absolute importanceThe evidence favoring one activity over another is of the highest possible order of affirmation
2, 4, 6, 8Intermediate values between the two adjacent judgmentsWhen compromise is needed
ReciprocalsIf activity i has one of the above numbers assigned to it when compared with activity j, then j has the reciprocal value when compared with i (i, j are different activities)
Table 3. Land use/soil/slope description of the study area.
Landuse/Soil/Slope DescriptionArea (km2)% Area
Land useAgriculture93.939.73
Dense Forest391.9440.58
Open Forest163.1716.89
Scrub Land169.0217.50
Settlement110.3311.42
Water area37.333.86
Slope (%)0–227.632.86
2–8237.1824.56
8–15185.9919.26
15–33173.8117.99
>33341.1135.32
Soil depth (cm)<2571.787.40
25–5031.053.20
50–75302.7531.23
75–10035.453.65
>100528.2254.49
Table 4. Comparison matrix for criteria ranking.
JudgementSoil Loss (Rank)Cost (Rank)Benefit (Rank)Suitability (Rank)Maintenance
(Rank)
C.I. (C.R.)
Expert 0.404 (I)0.169 (III)0.042 (V)0.270 (II)0.114 (IV)0.087 (0.078)
Farmer0.053 (IV)0.439 (I)0.329 (II)0.047 (V)0.131 (III)0.093 (0.084)
Expert + Farmer0.229 (II)0.304 (I)0.186 (III)0.156 (IV)0.123 (V)-
Table 5. Comparison matrix with five criteria viz. Soil Loss, Cost, Benefit, Maintenance and Suitability.
CriteriaBTCFVBZLC.I. (CR)
Soil Loss reduction (output from SWAT model)0.565 (I)0.055 (IV)0.117 (III)0.262 (II)-
Cost 0.048 (IV)0.350 (II)0.149 (III)0.458 (I)0.089 (0.09)
Benefit0.526 (I)0.050 (IV)0.145 (III)0.279 (II)0.069 (0.08)
Maintenance0.048 (IV)0.148 (III)0.311 (II)0.493 (I)0.050 (0.06)
Suitability/Environment Friendly0.040 (IV)0.130 (III)0.503 (I)0.326 (II)0.081 (0.09)
Table 6. BMP ranking for three scenarios through AHP technique.
Conservation MeasuresExpertFarmerExpert + Farmer
Bench Terrace (BT)0.280.230.25
Contour Farming (CF)0.140.190.17
Vegetative Barrier (VB)0.220.190.21
Zero Tillage + Live Mulch (ZL)0.370.370.37
Publisher’s Note: MDPI stays neutral with regard to jurisdictional claims in published maps and institutional affiliations.

