Article

Landslide Susceptibility Model Using Artificial Neural Network (ANN) Approach in Langat River Basin, Selangor, Malaysia

by
Siti Norsakinah Selamat
1,
Nuriah Abd Majid
1,*,
Mohd Raihan Taha
2 and
Ashraf Osman
3
1
Institute for Environment and Development (LESTARI), Universiti Kebangsaan Malaysia, Bangi 43600, Selangor, Malaysia
2
Department of Civil Engineering, Faculty of Engineering and Build Environment, Universiti Kebangsaan Malaysia, Bangi 43600, Selangor, Malaysia
3
Department of Engineering, The Palatine Centre, Durham University, Stockton Road, Durham DH1 3LE, UK
*
Author to whom correspondence should be addressed.
Submission received: 29 April 2022 / Revised: 29 May 2022 / Accepted: 30 May 2022 / Published: 2 June 2022
(This article belongs to the Special Issue Landslide and Natural Hazard Monitoring)

Abstract

:
Landslides are a natural hazard that can endanger human life and cause severe environmental damage. A landslide susceptibility map is essential for planning, managing, and preventing landslides occurrences to minimize losses. A variety of techniques are employed to map landslide susceptibility; however, their capability differs depending on the studies. The aim of the research is to produce a landslide susceptibility map for the Langat River Basin in Selangor, Malaysia, using an Artificial Neural Network (ANN). A landslide inventory map contained a total of 140 landslide locations which were randomly separated into training and testing with ratio 70:30. Nine landslide conditioning factors were selected as model input, including: elevation, slope, aspect, curvature, Topographic Wetness Index (TWI), distance to road, distance to river, lithology, and rainfall. The area under the curve (AUC) and several statistical measures of analyses (sensitivity, specificity, accuracy, positive predictive value, and negative predictive value) were used to validate the landslide predictive model. The ANN predictive model was considered and achieved very good results on validation assessment, with an AUC value of 0.940 for both training and testing datasets. This study found rainfall to be the most crucial factor affecting landslide occurrence in the Langat River Basin, with a 0.248 weight index, followed by distance to road (0.200) and elevation (0.136). The results showed that the most susceptible area is located in the north-east of the Langat River Basin. This map might be useful for development planning and management to prevent landslide occurrences in Langat River Basin.

1. Introduction

A landslide is a type of natural hazard that endangers human life and causes property damage and even fatalities [1,2]. Landslides are defined as geological phenomena involving the down-slope transport of soil and rock elements that occur on steep terrain [3,4]. In addition, landslide events could be in faster and slower movements depending on their types of slides. Landslides are movements of Earth’s materials caused by a variety of natural processes as well as human-caused land surface disturbances [5,6,7,8]. Thus, landslide phenomena have drawn a large number of researchers in recent decades to study landslide susceptibilities because of their enormous cataclysmic potential to reoccur, especially in historical landslide places.
Landslides are a natural phenomenon that occur daily and seem to be increasing in number across the globe. The landslide phenomenon as a moving mass of rock, debris, or soil down a slope under the force of gravity is known as among the most devastating environmental disasters in the world [9]. In general, there are several types of landslide movement such as fall, topple, rotational sliding, translational sliding, lateral spreading, flow, and complex [9,10]. Hence, a landslide is considered a natural hazard and dangerous event that leads to property damage and injury. The development of technologies has found some comprehensive and well-established methods to prevent and address landslide phenomena, including forecasting and intelligent construction.
A landslide is a complex natural disaster that involves various conditioning factors such as soil condition, bedrock, topographical, hydrological, and human activities, and developing a credible geographic prediction is still an extremely difficult task [11,12,13]. The best landslide model is significantly influenced by the modeling approaches and the quality of the data used [14,15,16]. The method of determining the possibility of a landslide happening in a specific location using relevant environmental factors is known as landslide susceptibility assessment. Landslide susceptibility assessment can be carried out using a variety of approaches, the most common of which are qualitative and quantitative [17,18,19]. Distribution analysis or inventory, geomorphic analysis, and expert (heuristic) evaluation procedures are examples of qualitative approaches that are based on the evaluator’s expertise and experience [18,20,21,22]. Quantitative analysis, often known as objective evaluation, is a type of numerical estimation used to evaluate the probability of landslide occurrences [23,24,25]. Another important assessment in disaster risk management is landslide susceptibility mapping (LSM). LSM is an effective way to predict landslide occurrences [26,27,28] as it incorporates planning and decision making [11,29]. LSM was created using historical analyses of geo-environmental variables responsible for similar events, which are conducted using bivariate or multivariate statistics [30]. Furthermore, it provides useful information on the probability of landslides occurring in a specific location.
The data-driven models are considered a quantitative method and have been proven to be an incredibly useful tool for landslide mapping [31]. Landslide prediction using data-driven models is able to estimate the possibility of a landslide by analyzing and interpreting the relationship between historical landslide events and various conditioning factors without using physical processes [32]. Several noteworthy data-driven models for assessing landslide study, including Artificial Neural Network (ANN) [33], Support Vector Machine (SVM) [34], Random Forest (RF) [35], Naïve Bayes (NB) [36], and Decision Tree (DT) [37], have been widely used. Recently, several landslide susceptibilities studies have been conducted in Malaysia, including landslide susceptibility modeling of Canada Hill in Miri, Sarawak [38] and Cameron Highland [39] using statistical and machine learning combined with expert knowledge. Evaluation of LSM using a GIS approach has been conducted in Gua Musang, Kelantan [40], the tropical mountainous forest of Cameron Highlands [41], and Genting Sempah, Pahang [42]. In addition, several landslide susceptibility studies focusing on model performance comparison have been conducted in Malaysia as case studies, including Cameron Highland [35], Penang Island [43,44], and Hulu Kelang [45].
Due to the degradation of forests, uncontrolled development, and increasing urbanization as a result of population increase, landslides are becoming a more prevalent calamity globally [46,47]. Landslides are commonly caused by deforestation in the highlands for development objectives such as roads and housing. In Malaysia, landslides are linked to the construction of new developments such as roads, highways, dams, and housing complexes in steep places [48,49,50,51,52]. Heavy rain, particularly during the monsoon season, induced by the southwest monsoon from May to September and the northeast monsoon from November to March, can cause landslides in Malaysia [53]. In one of the many incidents of landslide occurrences in the country, heavy rainfall caused a landslide in the Hulu Langat region in 2011, killing 16 members of the Children’s Hidayah Madrasah Al-Taqwa Orphanage. In another incident, the Langat River Basin suffered a disaster in September 2021 due to prolonged, heavy rain that triggered flash floods and landslides in nearly every location. This natural disaster was the worst disaster ever to occur in the area, resulting in severe loss of life, loss of homes, and property damage [54,55,56,57,58]. Thereby, the process of returning the area back to normal takes a considerable amount of time. Since then, researchers and government institutions have become alert to the significance of the landslide problem as a result of this tragedy. Unfortunately, landslide studies for the Langat River Basin are still receiving little attention. Only a few studies on landslide susceptibility have been conducted in the Langat sub-river Basin [59,60]. Thus, this study was conducted by covering the entire area of the Langat River Basin.
Therefore, the preparation of data, creation of a predictive model, and analysis of findings are all considered to be important stages in the implementation of effective and efficient disaster management. This research is focused on developing a landslide susceptibility model using an Artificial Neural Network (ANN) in order to reduce the future harm caused by landslide events.

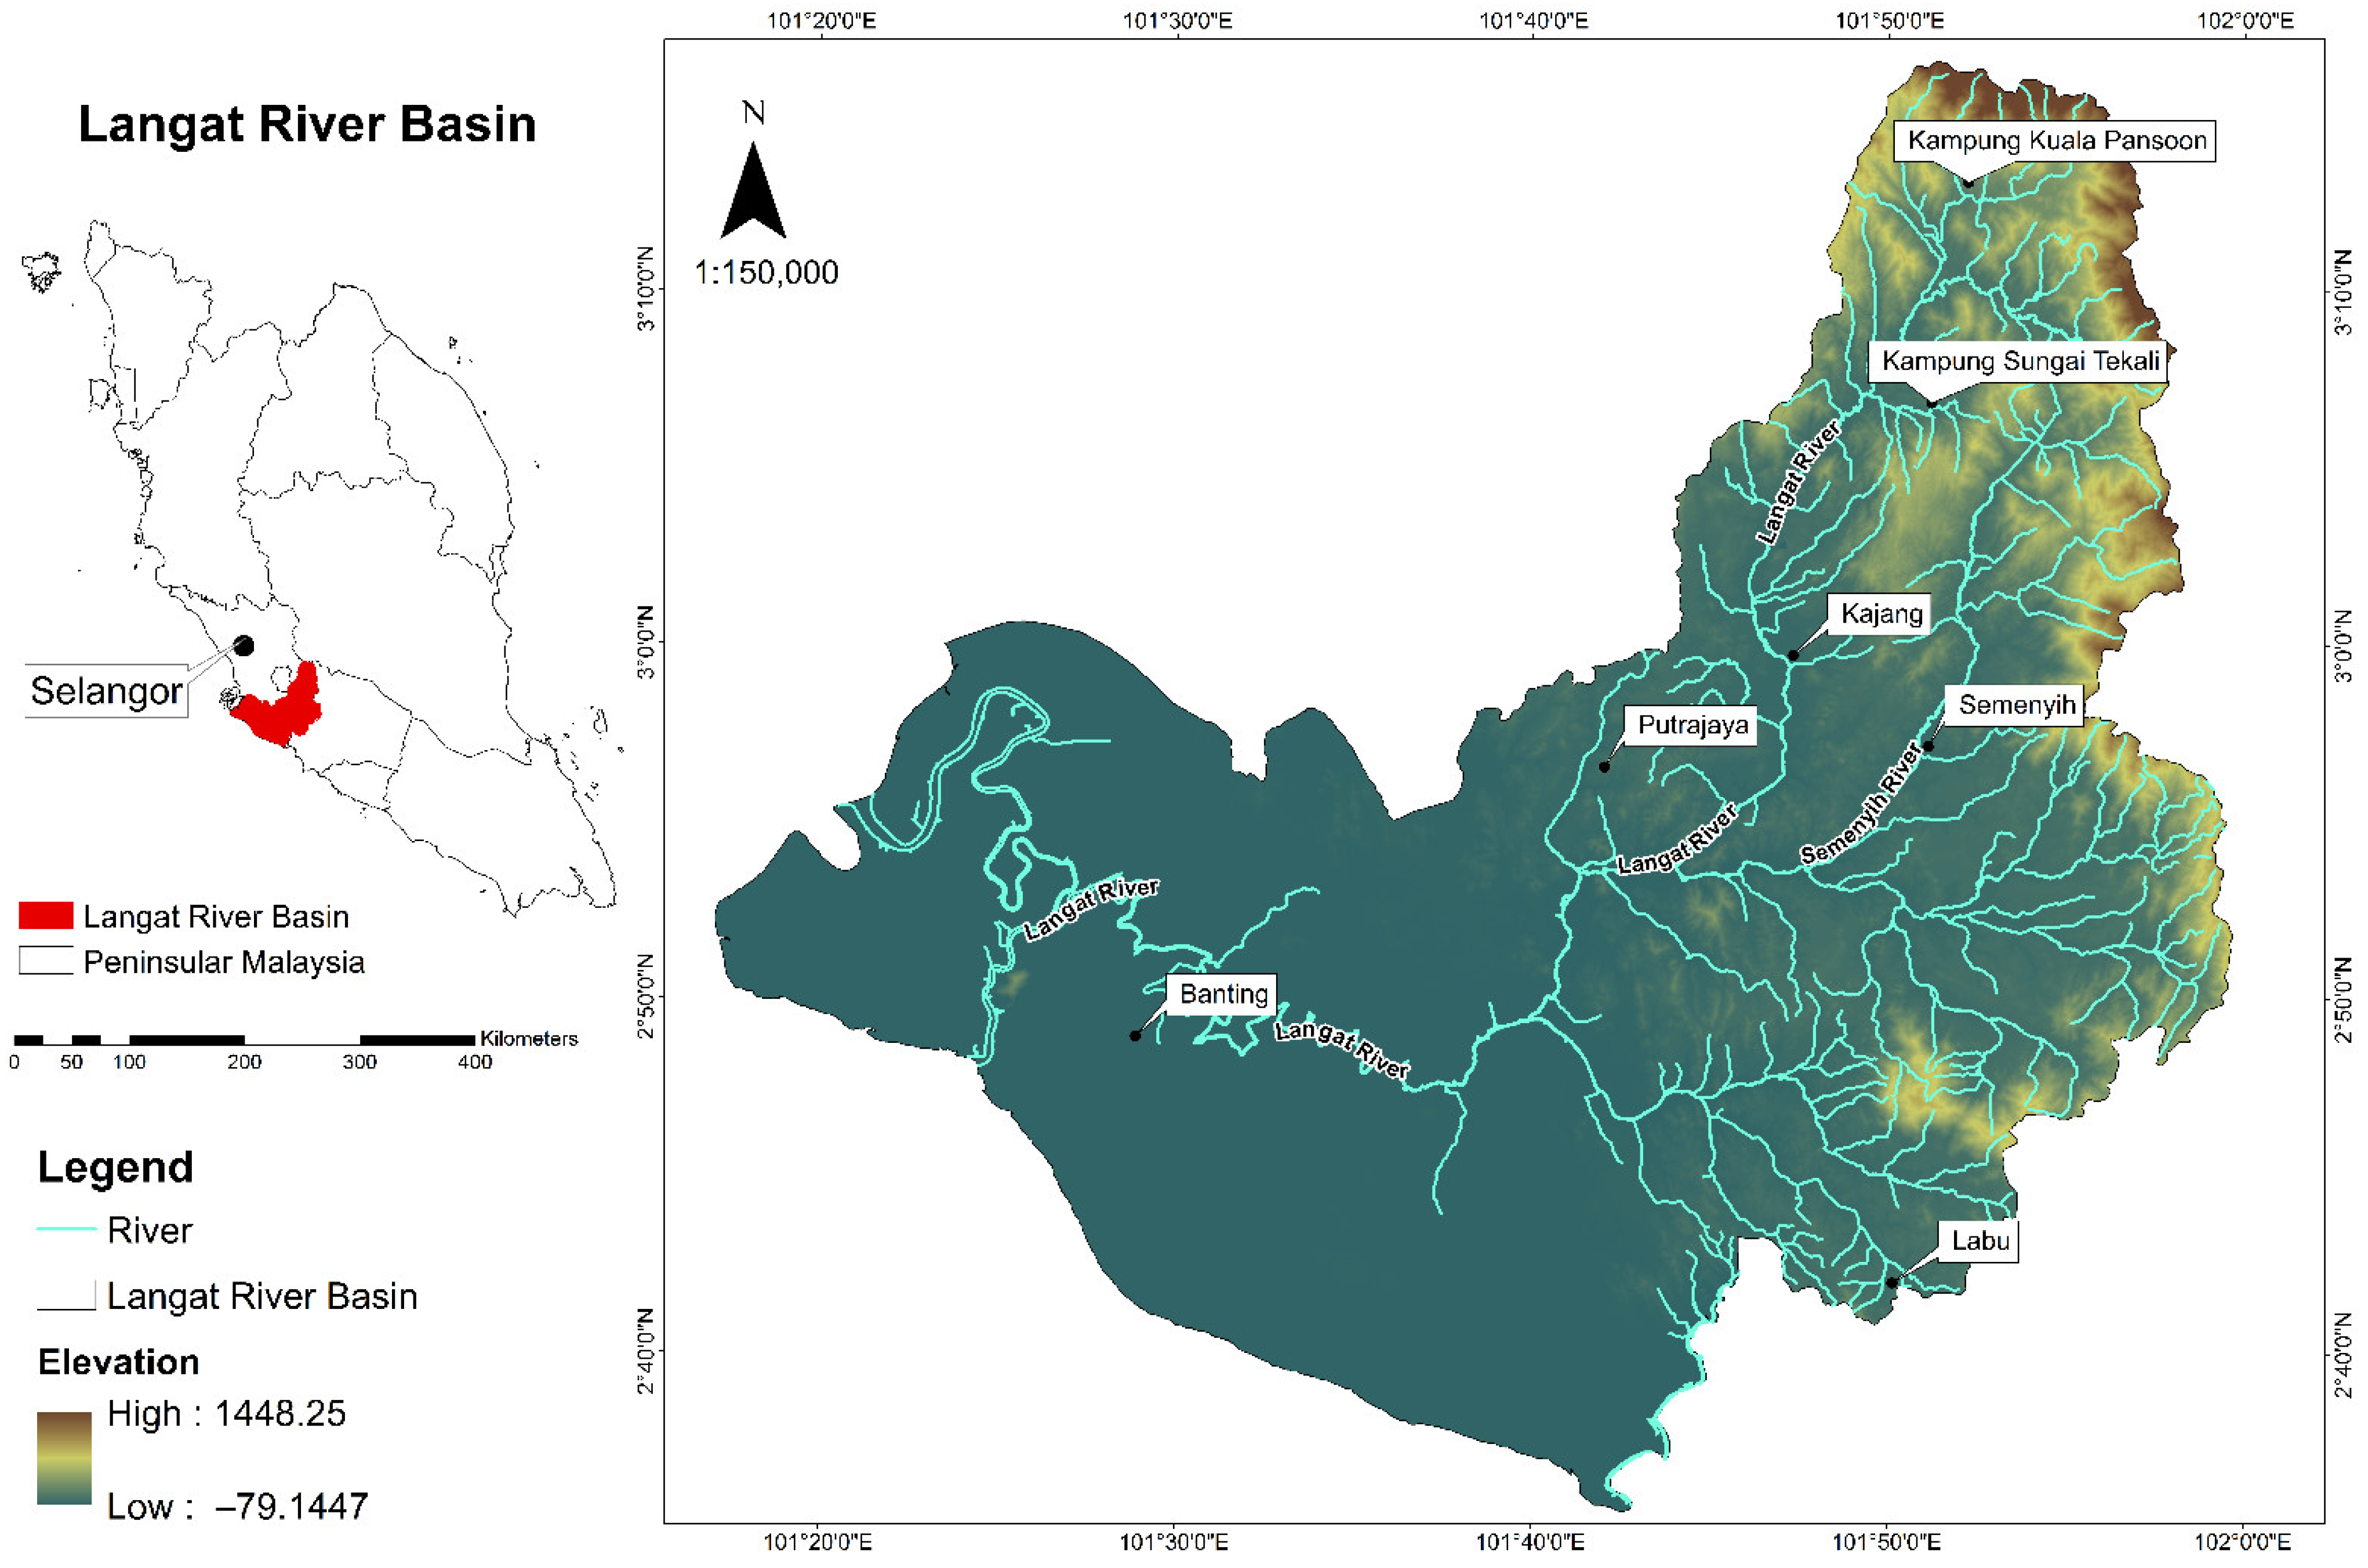
2. Description of the Study Area
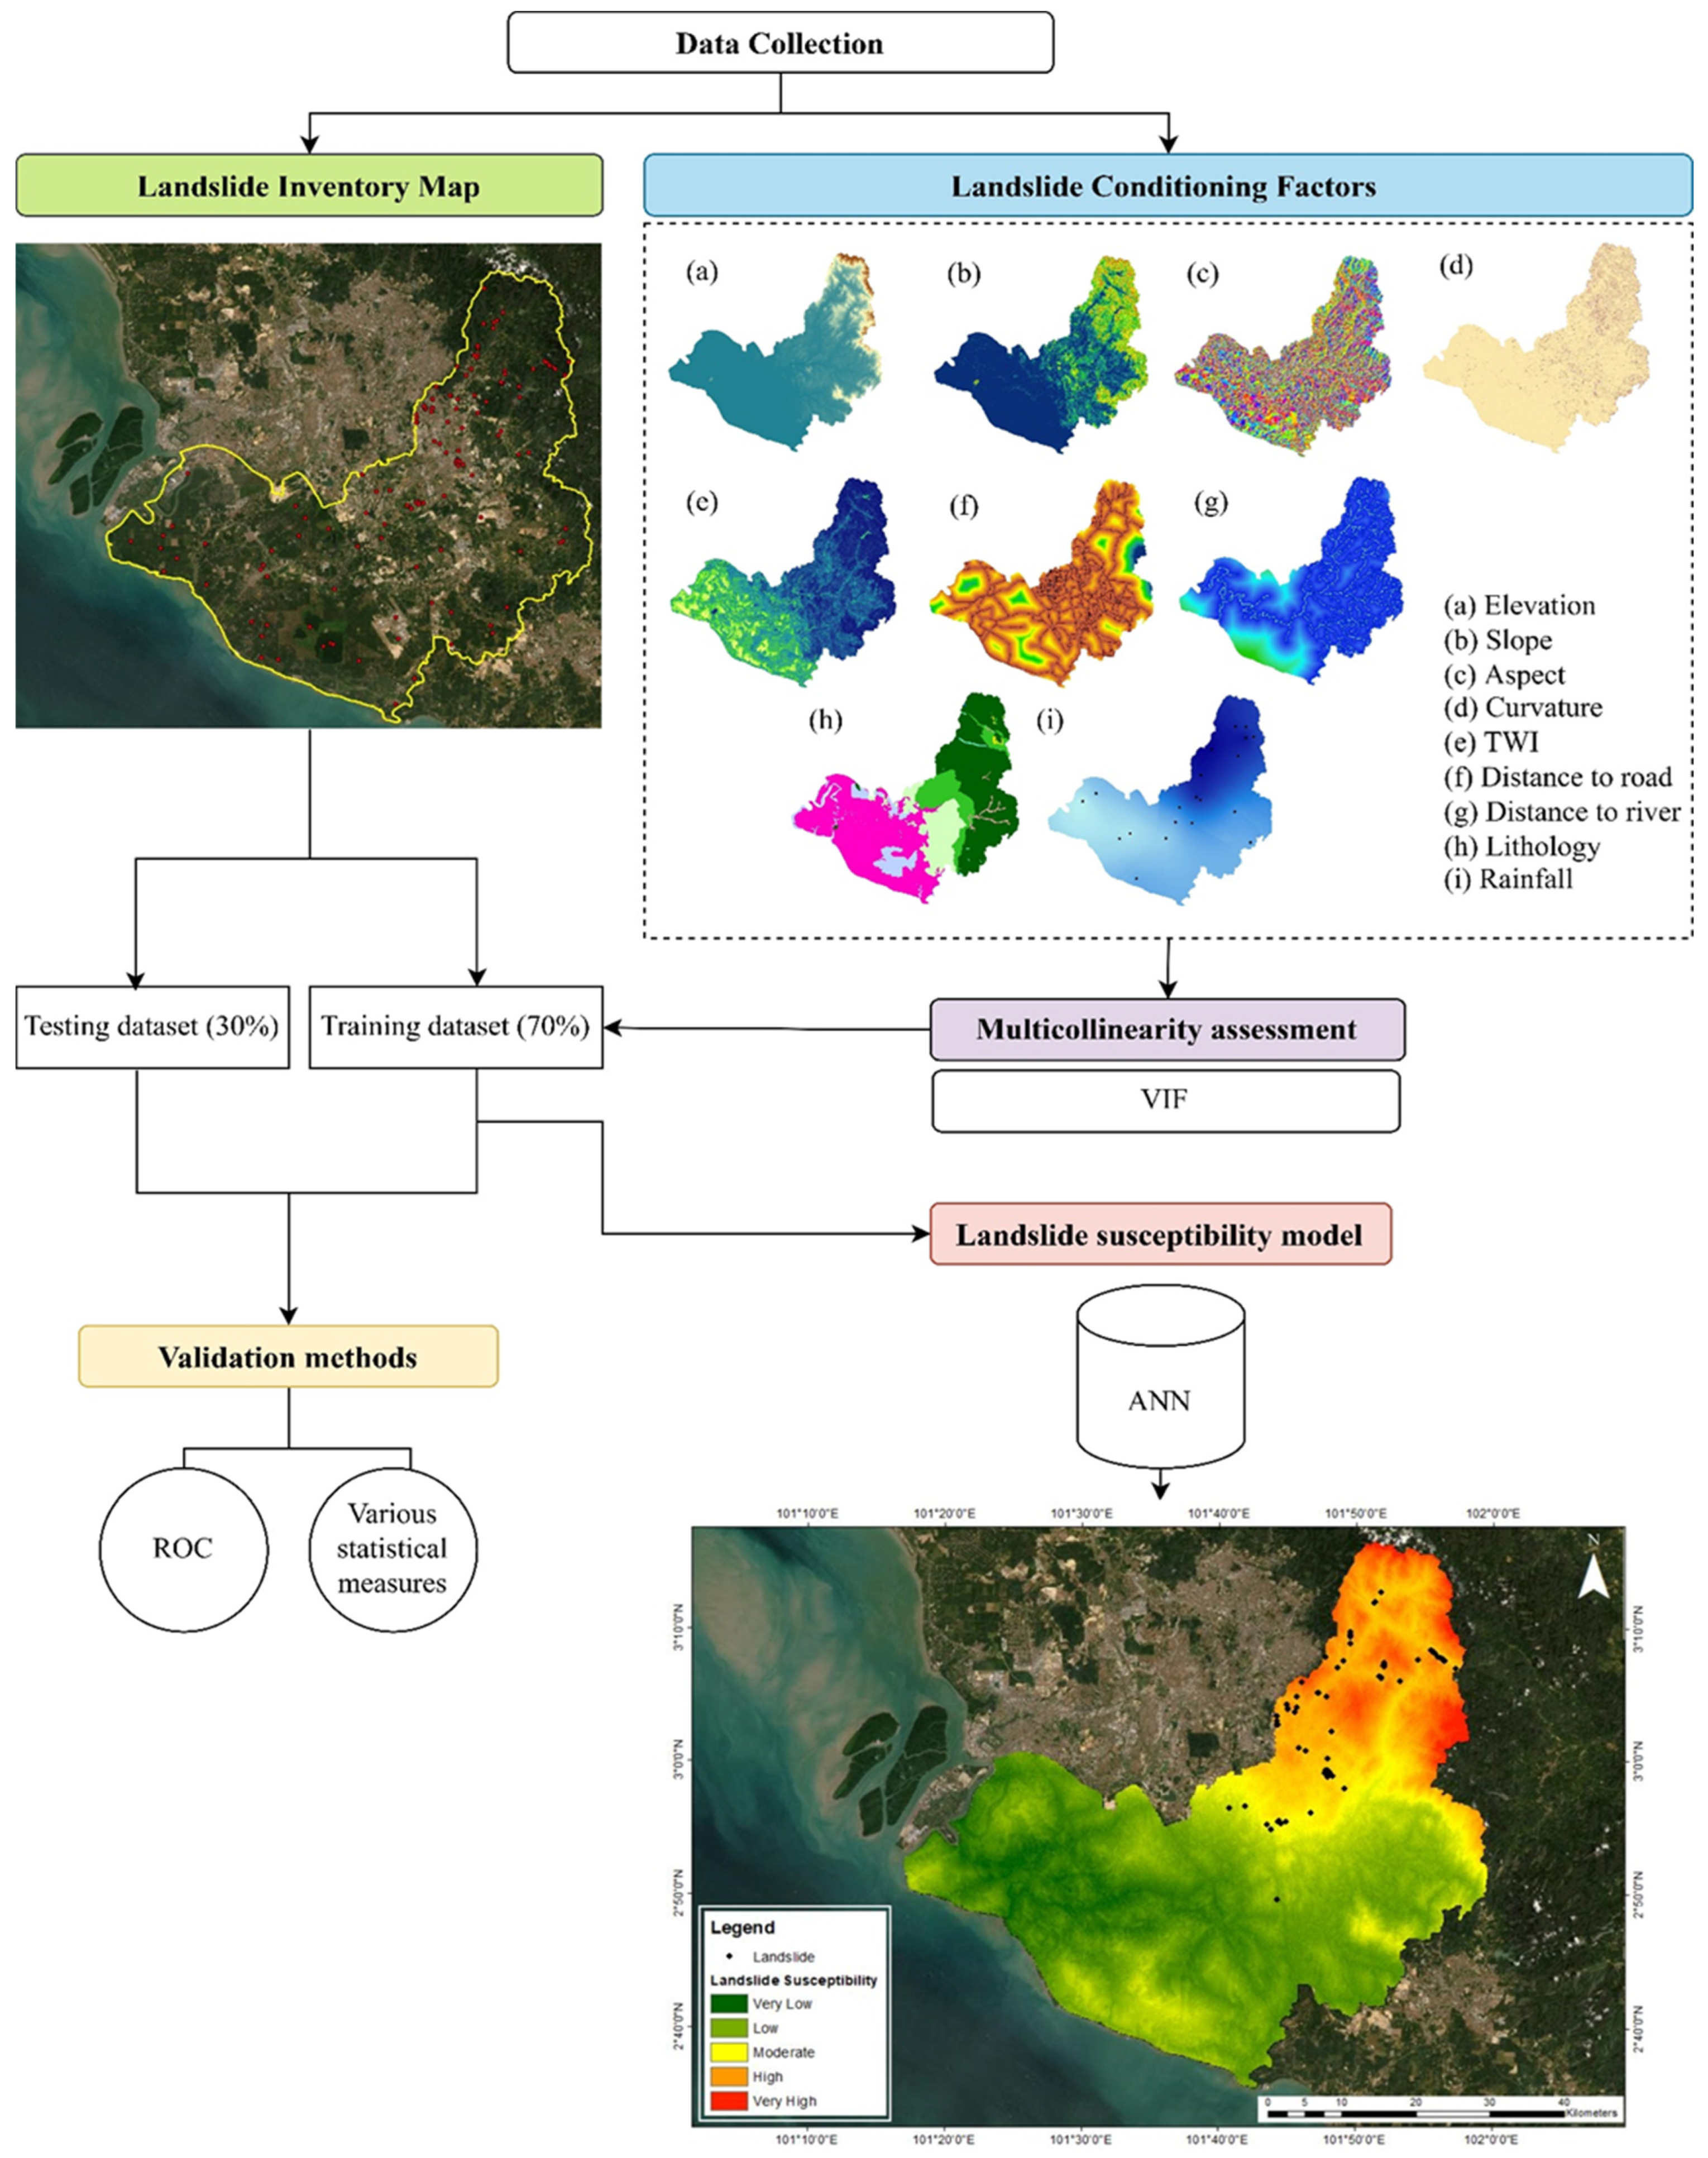
The Langat River Basin was chosen as a study area, and it is located in the southern half of Selangor and the northern part of Negeri Sembilan, as shown in Figure 1. The Langat River Basin area encompasses several districts, including Hulu Langat, the Federal Territory of Putrajaya, Sepang, Kuala Langat, and part of the Seremban area. Langat River Basin is a major water source for two-thirds of the state of Selangor, and it is the most urbanized river basin in Malaysia [61]. According to Köppen climate classification, the climate is classified under Group Af climate, representing the tropical rainforest climate. Malaysia has been classified as a tropical country with hot, humid, and rainy weather throughout the year. The average temperature for the whole year is about 18 °C, which is constantly demonstrated by the high temperatures at sea level and low elevations. Meanwhile, the average relative humidity is anything from 70 to 90% [62]. The monsoon seasons in the country lasting from May to September and November to March increase the rainfall intensity significantly. The Langat River Basin receives an average annual rainfall of 144.586 to 296.251 mm. The Langat River Basin is characterized by hilly terrain in the northeast part and progressive sloping in the southwest as it extends to the Straits of Malacca. The highest and lowest elevation of the Langat River Basin area is 1448.25 m and −79.1447 m, with the highest point being on top of a hilly area and the lowest point being in the water bodies area. The dominant lithologies in this study area are clay, silt, sand, peat, minor gravel, and acid invasion.

3. Methodology

This research involved several steps and processes (Figure 2), presented in the following list:
Landslide inventory map: Primary and secondary data sources were used to construct the landslide inventory map. Reports, case studies, and newspaper articles serve as primary sources of information for this study. Secondary data were located using Google Earth images, and the location was verified through site investigation.
Selection of landslide conditioning factors: The landslide conditioning factors were chosen from a previous literature review based on the geo-environmental condition of Langat River Basin area. ArcGIS software was used to prepare all the spatial data for the landslide conditioning factors that were selected.
Multicollinearity assessment: Multicollinearity analysis was used to choose appropriate landslide conditioning factors for landslide susceptibility modeling.
Landslide susceptibility model: In this study, a machine learning approach was used to develop a landslide susceptibility model using an Artificial Neural Network (ANN). The statistical analysis and ANN model were produced using statistical package SPSS 26. The landslide susceptibility map represents the spatial distribution of the probability of having landslide occurrences. In this study, the landslide susceptibility map was generated using ArcGIS software.
Validation methods: Assessment of the landslide model was performed to evaluate the accuracy of model prediction.

3.1. Landslide Inventory Map

The creation of a landslide inventory map is an important step in any landslide investigation. Landslide inventory is important in developing accurate and efficient landslide vulnerability models through the collection of accurate landslide inventories [32]. In addition, landslide inventory is the most critical assessment criterion that includes the basic information and landslide characteristics needed to produce landslide vulnerability, hazard, and risk maps [63]. Thus, the use of accurate inventory information can produce a good prediction model and valuable information to be well-recognized as a critical component in decision making for disaster prevention and mitigation. This study used a combination of primary and secondary landslide inventory.
In order to gather primary data, field investigation was conducted in 2020 to identify the exact location of the landslide and collect the landslide coordinates using a global positioning system (GPS) data collector. Figure 3 shows the landslide occurrences in the Langat River Basin area. The secondary data source was derived from historical landslide information and satellite imagery between the years 2000 and 2020. As the landslide occurred in an inaccessible area, high-resolution Google Earth images were used to detect the landslide location [31]. In this study area, 70 landslide events were recorded.
The landslide locations were randomly separated into two groups in order to provide the training and testing datasets required for the modeling process. The training dataset is used to develop the landslide model, while the testing dataset is used to assess the predictive model. Since there were 70 landslide locations in this study, 49 landslides were used as the training dataset (70%), and 21 landslides were used as the testing dataset (30%). It is necessary to create random samples to represent non-landslide points since this study used a binary classification model to develop a predictive model between landslide and non-landslide events [11,64]. In addition, the non-landslide points were randomly created and mapped on the landslide inventory map to avoid overfitting issues in modeling [65]. A total of 70 non-landslide events were randomly created using ArcGIS software. The non-landslide location was likewise randomly divided into training and testing datasets using the same 70:30 ratio. Finally, the total training and testing datasets are 98 and 42, respectively.

3.2. Selection of Landslide Conditioning Factors

There are many factors that contribute to the probability of a landslide occurring. This paper selected nine landslide conditioning factors for modeling based on literature and data research. These factors include elevation, slope, aspect, curvature, Topographic Wetness Index (TWI), distance to river, distance to road, lithology, and rainfall, as shown in Figure 4. The accuracy of landslide susceptibility mapping is affected by the resolution of the input dataset and accuracy is achieved when the spatial resolution is increased [66,67]. In this study, each input dataset for landslide conditioning factors was performed in raster format with a 5 m resolution. The resolution was determined using the Digital Elevation Model (DEM) dataset.

3.2.1. Elevation

The DEM in this study used an IFSAR image with a spatial resolution of 5 m × 5 m for elevation information. In this Langat Basin area, the range of elevation is between −79.15 to 1448.25 m (Figure 4a). The negative value represents an elevation in the water bodies area, while the positive value represents elevation on land.

3.2.2. Slope

Patterns of slope angle could influence moisture content, pore pressure, and the hydrologic behavior of a slope [68]. In proportion to the increase in slope angle, it will decrease the capability of soil strength [69]. In this study, slope angle was created from DEM and the slope distribution range is between 0° and 73.537° (Figure 4b).

3.2.3. Aspect

The aspect indicates the change in highest rate in the direction of downslope from a specific cell to the surrounding areas and it is considered as a slope direction [70], where these conditioning factors also affect the hydrological process. Evapotranspiration has an impact on hydrological processes, which ultimately have an impact on soil moisture and vegetation cover [37]. The slope direction is identified like a compass for a whole circle direction with 360°. The aspect map was constructed from DEM and classified into nine directions, which were flat (–1), north (0–22.5 and 337.5–360), northeast (22.5–67.5), east (67.5–112.5), southeast (112.5–157.5), south (157.5–202.5), southwest (202.5–247.5), west (247.5–292.5), and northwest (292.5–337.5), as shown in Figure 4c.

3.2.4. Curvature

Curvature is defined as the relationship between the ground shape of the earth and the corresponding runoff. Curvature can influence landslide movement direction and resistance stress since this conditioning factor controls the speed and convergence of displaced and water flowing down the slope [71]. Landslides can be triggered by this factor, by influencing the mass motion velocity and direction [72]. A negative value represents a concave surface for the curvature conditioning factor. A zero value represents a flat surface, and a positive value indicates a convex surface. In this study, curvature was generated using DEM and the related map of curvature is presented in Figure 4d.

3.2.5. TWI

TWI represents the upslope contributing area and slope to calculate the steady-state wetness and water flow across the region [73]. The index is extensively used in hydrological processes to quantify water flow disposition and topographic impact [74]. TWI is a quantitative value that refers to the control of the terrain against the spatial distribution of soil moisture [75]. This conditioning factor considers the impact of topography and soil characteristics on the distribution of soil moisture [76]. TWI represents the degree of wetness of the surface calculated in Equation (1) as follows [77]:
T W I = In   ( α tan β )
where α is cumulative upslope area drainage through a point (per unit contour length) and β is the angle of the slope at the point. The map of TWI is shown in Figure 4e.

3.2.6. Distance to Road

The development of road as an alternative network for human activities in the hilly area was categorized as an anthropogenic activity leading to landslide occurrences. The manual excavations of slope toes and blasting are part of the road construction process [75]. Therefore, these actions will change the original rock and soil structure stability and leave concealed hazards that trigger landslide occurrences. The distance to road analysis was conducted using a Euclidean distance method, which is shown in Figure 4f.

3.2.7. Distance to River

The slope stability is negatively affected by the distance from the river, which is an important conditional factor in landslide studies [78]. The erosion process in the river area leads the slope to become saturated with pore water near the bottom, reducing slope stability in this area [79]. In this study, the distance to river analysis was generated using a Euclidean distance method, as shown in Figure 4g.

3.2.8. Lithology

Lithology is one of the most crucial conditioning elements in landslide study since there is a variety of rocks and soils with distinct inner structures and mineral composition [80]. The formation material strength is influenced by the structure, composition, and permeability of the different formations [81]. The lithology map was provided by the Department of Mineral and Geoscience Malaysia and classified into several classes, as displayed in Figure 4h.

3.2.9. Rainfall

Rainfall is the triggering factor that causes landslide occurrences, raising the groundwater level and increasing pore water pressure beneath the surface [82,83]. Over the last decade, previous research has found the presence of an empirical relationship between rainfall and landslide occurrences [84,85]. Rainfall is classified as a natural phenomenon where it is regarded as a potential contributor that significantly impacts the occurrence of landslides [86]. Rainwater infiltration increases soil moisture, shear strength, and cohesiveness of the soil decrease, causing slope instability [87]. As a consequence, the rainfall factor will affect the nature of the soil, such as the decrease in the strength of the soil structure, causing liquefaction of the mass of soil. The rainfall data were obtained from the Department of Irrigation and Drainage, Malaysia. The Langat River Basin has a total of 21 rainfall stations. Daily rainfall data were used to determine the annual average rainfall data for 30 years (from 1990 to 2020). In this study, an interpolation approach was used to determine and estimate the annual average of rainfall value for unknown points using numerical analysis. Rainfall data were spatially analyzed using the Kriging interpolation method, as shown in Figure 4i. Interpolating rainfall data using the Kriging method has been found as an effective way for rainfall estimation analysis and provides low error [88].

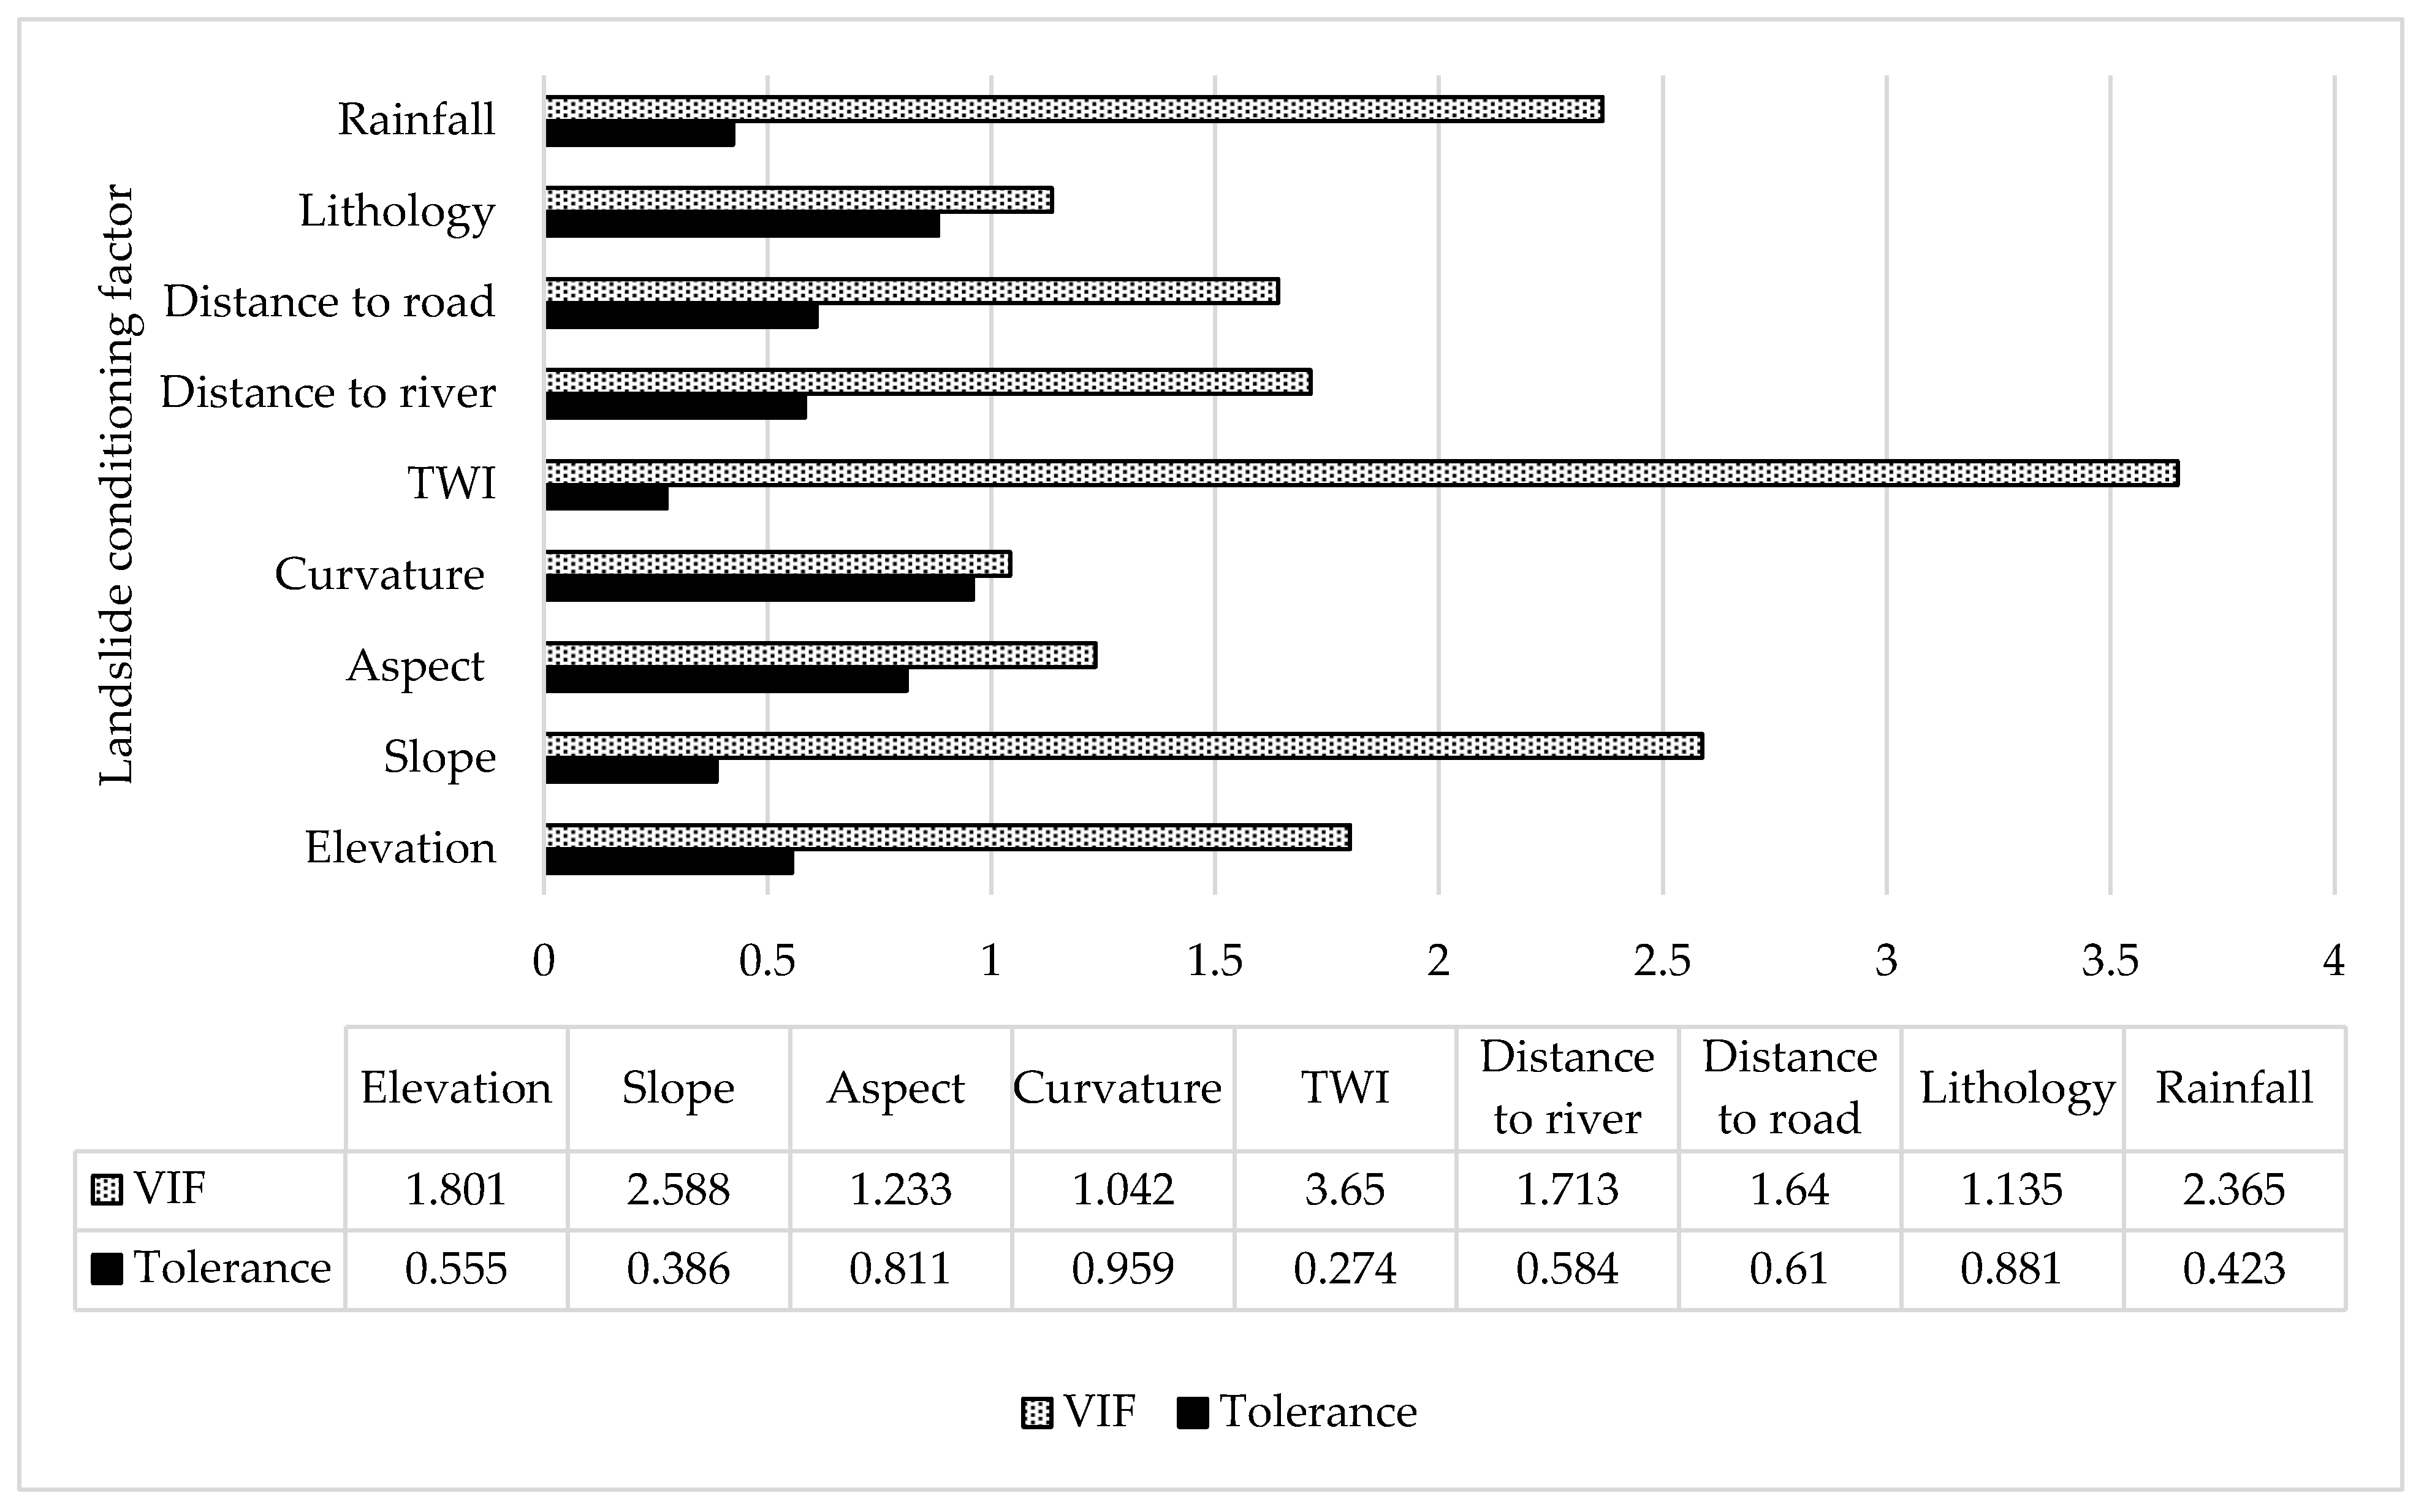
3.3. Multicollinearity Assessment

Multicollinearity analysis in statistics has been used to deal with the issue of a strong correlation between conditioning factors in the initial dataset resulting in the incorrect systematic analysis [89]. Multicollinearity occurs when the correlation between two or more independent variables is high. The high correlation factors have the same effect and respond in the same way, which can affect the prediction model [90]. Assessing the correlations between the selected conditioning factors is a crucial process because the presence of collinearity reduces the predictive model’s performance [91]. A strong correlation between landslide conditioning factors will have a significant impact on the weight distribution of each feature in the process of model development, especially on the learning process [92]. Consequently, the landslide conditioning factor may have multicollinearity issues, which can lead to overfitting in modeling. Thus, multicollinearity evaluation can reduce the processing time, the number of calculations, and the risk of overfitting a model [93].
In order to increase the precision of predicting results, a multicollinearity analysis must be conducted. There are several types of multicollinearity assessment commonly used, including Variance Inflation Factor (VIF) and Tolerance (TOL) [94,95,96], Pearson correlation [97], Condition Number Test, and Bivariate Correlation Analysis. The VIF and TOL methods were chosen for this study to assess multicollinearity. The VIF is a measure of standard deviation variation that is due to collinearity between landslide conditioning factors. Intercorrelation between predictive variables is measured using the following Equation (2):
V I F = 1 1 R 2
where R stands for the correlation coefficient. The size of the VIF and tolerance can be used to measure the extent of multicollinearity.

3.4. Landslide Susceptibility Model

Artificial Neural Network (ANN) is a machine learning approach that is used to generate new information by analyzing and processing relations in data as a generic nonlinear function approximation algorithm [98]. It is a complex network of neurons that processes data according to the connection weight, outputting the results to the next layer [75]. The learning process of the ANN model is the process of continuously adjusting the network parameters. All the layers are located adjacently and connected to each other with the assigned weight from layer to layer. Then, all weights for the adjacent layers will be calculated [75]. In addition, the ANN model can also forecast based on the input data even if the forms of interaction of the input factors are unclear or their physical explanation is difficult to express [99]. Thus, the ANN model is widely used to map landslide susceptibility and is a valuable tool in the landslide field.
ANN consists of three components, which are input layer, hidden layer, and output layer. The input layers are constructed according to the landslide conditioning factors that are selected for model development. The input layer has its own neuron for each landslide conditioning factor connecting with the hidden layers. The hidden layers are unnoticed classifier components accountable for processing and transforming data from input to output. The input neurons from hidden layers were developed with additional complexity by multiple neurons. The output layer had only one neuron that correlated to the final output, which in this study was utilized to classify the landslide or non-landslide area. The model structure is displayed in Figure 5. In this study, a back-propagation algorithm was used, which is frequently used by landslide researchers [100]. A back-propagation algorithm is used to calculate the weights utilized in the network by determining a gradient [101].
The landslide susceptibility map was prepared based on the weight of landslide conditioning factors. Once the networks were successfully trained, the weighted value for each landslide conditioning factor was computed. All the weighted landslide conditioning factors were computed using normalized ranges between 0 and 1. The map was reclassified into five categories which are very low, low, moderate, high, and very high susceptibility. The classification uses the natural break classification approach [33,102]. The map shows landslide susceptibility values ranging from 0 (very low) to 1 (very high).

3.5. Validation Methods

Landslide susceptibility model performance can be evaluated using various statistical measures. This study used several types of validation model assessment such as Receiver Operating Characteristics (ROC), Area Under Curve (AUC), sensitivity, specificity, accuracy, Positive Predictive Value (PPV), and Negative Predictive Value (NPV) to validate the performance of the prediction model. In recent years, the ROC curves method has been widely used for evaluating the performance of landslide prediction [88,103]. The ROC curve was plotted with the true positive that represents correctly predicted landslide on x-axis and false positive that represent falsely predicted landslide on y-axis as inputs. The area under the ROC curves (AUC), which is a statistic assessment of the overall performance of the landslide models was utilized for quantitative comparison. The AUC value for training and testing dataset were separately generated. The ability of Landslide Susceptibility mapping is shown by the AUC value in the training dataset [104]. Meanwhile, the AUC value for the testing dataset represents the accuracy of future landslide prediction [104,105]. There is a quantitative relationship between AUC and prediction model accuracy, which is classified as weak (0.5–0.6), moderate (0.6–0.7), good (0.7–0.8), and extraordinary (0.8–0.9) [14]. Hence, the accuracy of a prediction model can be assessed using AUC values as a reference.
The proportion of landslide locations that are accurately identified as landslide occurrence is known as the sensitivity of a detection method, and the proportion of non-landslide locations that are accurately identified as non-landslide occurrence is known as the specificity [64,106]. Moreover, accuracy assesses the proportion of landslide and non-landslide locations that are correctly detected. Besides that, the probability that a predicted landslide location has actual landslide occurrences is expressed as PPV, and the probability that a predicted non-landslide location has actual non-landslide occurrences is expressed as NPV. In this study, these statistical measures were calculated using following the Equations (3)–(7) [105]:
S e n s i t i v i t y = TP TP   +   FN  
S p e c i f i c i t y = TN TN   +   FP  
A c c u r a c y = TP   +   TN TP   +   NT   +   FP   +   FN
P o s i t i v e   P r e d i c t i v e   V a l u e   ( P P V ) = TP FP   +   TP
N e g a t i v e   P r e d i c t i v e   V a l u e   ( N P P ) = TN FN   +   TN
where true positive (TP) is the number of landslide points categorized correctly as landslides and true negative (TN) denotes the number of landslide points correctly classified as non-landslide points. Meanwhile, false positive (FP) and false negative (FN) refer to the number of landslide points that were incorrectly classified as landslide or non-landslide points.

4. Results

4.1. Analysis of Multicollinearity

A multicollinearity analysis can be used to examine the suitability of the underlying assumption used to select the conditioning factors based on non-independence among factors. Implementation of VIF and TOL helped to detect and quantify multicollinearity among the nine landslide conditioning factors. Tolerance values of less than 0.2 indicate marginal multicollinearity among selected independent variables, whereas tolerance values of less than 0.1 strongly support multicollinearity [107]. Based on the results, the highest value of VIF was 3.650 and the lowest value of tolerance was 1.042. The multicollinearity assessment among the nine conditioning factors satisfied the critical thresholds, where all the VIF values were less than theoretical critical value (5 or 10). All the TOL values were greater than theoretical critical value (0.1 and 0.2). The highest and lowest VIF values were 3.650 and 1.042, and the minimum and maximum TOL value were 0.274 and 0.959, representing TWI and curvature, respectively. Thus, all the selected conditioning factors represent no multicollinearity between each factor (Figure 6).

4.2. Analysis of Landslide Conditioning Factors

In this study, a total of nine landslide conditioning factors were selected and sensitive analysis was performed in the neural network to compute the criticality of landslide conditioning factors. Rainfall was the most critical conditioning factor, with a weighted value of 0.248, followed by distance to road (0.200), elevation (0.136), TWI (0.132), curvature (0.102), lithology (0.069), slope (0.052), distance to river (0.041), and aspect (0.021), as shown in Figure 7.

4.3. Validation and Accuracy Assessments

The validation and assessment of the landslide prediction model was performed on the training and testing datasets, as shown in Table 1. Based on the results, the training dataset was validated with sensitivity (0.950), specificity (0.887), accuracy (0.938), PPV (0.914), NPV (0.959), and AUC (0.940). The testing dataset showed sensitivity (0.957, specificity (0.833), accuracy (0.894), PPV (0.846), NPV (0.952), and AUC (0.940). The sensitivity value of the training dataset is 0.950, while the testing dataset exhibited the higher value with 0.957. It is notable that the prediction model correctly defined the landslide locations as landslide events. Furthermore, the NPV value for the training and testing datasets was 0.959 and 0.952, respectively. This demonstrates that the resulting model predicts the possibility that a predicted non-landslide location will have actual non-landslide occurrences. The AUC value for training and testing datasets was 0.940. AUC equal to 1 indicates that the resulting predictive model was a perfect model for properly classifying all landslide and non-landslide locations, whereas AUC 0 indicates that the model is uninformative and incorrectly classifies landslide events. The AUC values for this predictive model are in the excellent category [14]. Therefore, the predictive model created in this study can be classified as a good predictive model.

4.4. Landslide Susceptibility Map

The landslide susceptibility map was created using the selected landslide conditioning factors. The landslide susceptibility map was divided into five categories as follows: very low, low, moderate, high, and very high, as shown in Figure 8. The possibility of a landslide occurring was very low in the very low and low categories. In general, the elevation in these categories was less than 70 m and the slope was less than 15 degrees. Clay, silt, sand, peat, and minor gravel dominated the lithology in these areas. Due to these factors, the distribution of landslides was very low in comparison to the other zones. Next is the moderate class. The distribution of landslide occurrence in this class is moderate in comparison to the other classes. Medium range of elevation and slope were found in this class. This area had medium annual average rainfall. Schist and gneiss are the dominant lithologies in this area. Due to these factors, this area was designated as stable. The high and very high landslide susceptibility area was located in the north-east of Langat River Basin. The landslide distribution of this area is denser and in the highest annual average rainfall area, ranging from 180.311 mm to 296.251 mm. Furthermore, human activities in this area, such as road development in hilly areas, contributed negative impact to triggering landslide occurrence. Most of the landslide events occurred nearest to the road area. This class of area is among the most unstable and fragile areas in Langat River Basin. Regarding this condition, Langat River Basin demands priority and special focus for management of land-use planning, especially in high and very high landslide susceptibility areas. This issue makes it imperative for government and non-governmental organizations to work together to ensure that the most vulnerable areas receive attention for mitigation, prevention, and risk reduction.

5. Discussion

Landslide are consequences of complex factors, including various causes and triggers. Landslides may occur due to being triggered by one or more factors. The understanding of landslide factors is required for efficient hazard management. Therefore, landslide studies are essential in order to improve landslide prevention and risk assessment.
In this study, GIS application and an ANN approach successfully made predictions on a landslide model using spatial information from ground surfaces as landslide conditioning factors. The ANN model is designed to simulate how the human brain computes information, in which multiple nodes are connected to perform more complex calculations. This model is able to learn complex relationships between input and output variables, which neither humans nor other computer technologies are able to notice [105]. ANN models have been suggested as an appropriate machine learning approach for predicting non-linear and complex phenomena [108,109]. Hence, the ANN model constitutes one of the best techniques used to predict landslides with good accuracy [110].
A total of nine landslide conditioning factors (elevation, slope, aspect curvature, TWI, distance to road, distance to river, lithology, and rainfall) were selected due to a literature review of existing landslide susceptibility studies. On all nine selected landslide conditioning factors was performed multicollinearity analysis. This analysis was used to explain the non-independence of conditioning factors that might occur in datasets due to excessive correlation, resulting in inaccurate system analysis [14]. In this study, VIF and TOL method were used. Based on the results, all the selected landslide conditioning factors satisfied critical threshold values, and were appropriate for landslide study in the Langat River Basin area.
The ANN approach was used to generate a landslide model. In this study, the landslide model was built using the Multilayer Perceptron (MLP). The dataset was divided into training (70%) and testing (30%). The training dataset is used to calculate the weights and build the landslide model. Meanwhile, the testing data identify errors during the training mode and prevent overtraining. In this study, the activation function for the hidden layer was a hyperbolic tangent, while the activation function for the output layer was the SoftMax function. The LSM performance was evaluated using various statistical measures, showing in a good result for the training and testing datasets. The landslide model was validated using the AUC method and several statistical measurements. This model validation revealed that the success rate for training and testing was equal, at 0.940. Based on these results, this study found that the development of the landslide susceptibility model using the ANN method was able to produce a good predictive model. These findings are consistent with the findings of a previous study [105], which discovered that the ANN model produced more accurate and reliable results in the development of the landslide susceptibility model compare with others. Furthermore, the study by [111] found that landslide susceptibility derived by ANN has better accuracy in a study conducted in Rolante River Basin, Southern Brazil.
The analysis of landslide conditioning factors showed that rainfall, distance to road, and elevation were the most critical landslide conditioning factors, while distance to river and aspect were identified as the least important factors for landslide occurrences in the study area. Landslides occurrences driven by rainfall are among the most devastating naturally occurring disasters across the world. Based on the results, rainfall was found to be the most important landslide conditioning factor in the Langat River Basin. This finding is consistent with previous research that identified rainfall as one of the most important landslide conditioning factors in Malaysia [112,113,114,115]. The average annual rainfall value in Langat River Basin ranges between 144.586 mm and 296.251 mm. Additionally, most of the landslides that occur in Langat River Basin are caused by heavy rain, which occurs most frequently from May to September in the southwest monsoon and from October to March in the northeast monsoon. These findings are consistent with [85,116,117], which found that increasing rainfall intensity throughout the monsoon season will lead to an increase in landslide occurrences. The high intensity of rainfall is frequently related to the slope stability, where it affects the run-off water pressure.
In addition, the distance to road is an important consideration triggering landslide occurrence in Langat River Basin. This study indicated that the distance to the road was the second most important factor. The landslide occurrences in the study area are mostly found in hilly areas and near road areas. Landslides occur frequently on Jalan Sungai Tekali, Jalan Sungai Lalang, and Jalan Genting Peras. Road construction in hilly areas can contribute to the occurrence of landslides. Construction in hilly areas has a substantial negative impact on slope stability since it always causes an engineering load and compromises the slope structure [118]. Thus, any activities for road construction that involve cutting the slope hills greater than 10 degrees causes discontinuity in the soil and rock [119]. Elevation is widely used in landslide studies and is thought to be an important factor that can influence the occurrence of landslides. The fundamental principle underlying this statement is that elevation influences topographical factors, resulting in spatial diversity in various landscape process [120]. Similarly, this study found that elevation is the third most important factor influencing landslide conditions in the study area.
The landslide susceptibility was created for Langat River Basin area and classified into five categories (Very Low, Low, Moderate, High, and Very High). The result showed that the most susceptible area is found in the northeast of Langat River Basin, where a high-elevation area, steep sloping, high soil moisture, and heavy rainfall are the main reasons for landslide occurrences. Langat River Basin is one of the most urbanized river basins in Malaysia due to its strategic location nearest to developing cities including Bangi, Kajang, Putrajaya, and Cheras. Therefore, the Langat River Basin is an important conurbation with a large population. The growth in population has also increased the environmental burden due to development pressure to fulfil needs and demands. Human activities, such as the development of buildings, roads, and agricultural activities, will change the slope structure and stability, thereby leading to landslide occurrences [42,115,116]. Given the importance of this region in supporting urban activities, it must be carefully preserved and managed to ensure that local communities continue with a high quality of life and benefit from any future development [117]. Langat River Basin needs more attention given to ecosystems, especially on land-use changes and human activities to prevent landslides. Therefore, the recommendation for future studies in the Langat River Basin should take into consideration elements of land-use changes in the development of a landslide susceptibility model as well as find the relationship between landslide occurrences and land-use changes.

6. Conclusions

This paper was presented to evaluate the landslide conditioning factors that influences landslide occurrence in the Langat River Basin area using a machine learning approach. In this study, nine landslide conditioning factors were used to identify the importance of landslide conditioning factors. In general, the conclusion can be listed as follows:
An Artificial Neural Network model was used to develop landslide modeling in the Langat River Basin area, Selangor, by integrating several landslide condition parameters, such as elevation, slope, aspect, curvature, Topographic Wetness Index (TWI), distance to road, distance to river, lithology, and rainfall, in a GIS application. Multicollinearity analysis was performed in this study to deal with the issue of a strong correlation between conditioning factors in the initial dataset which would result in the incorrect systematic analysis. All the selected conditioning factors were found to represent no multicollinearity between each factor.
A comprehensive validation analysis was performed in this study by using AUC and several statistical measures. The AUC value for this study was 0.940. In the Langat River Basin area, rainfall, distance to road, and elevation significantly influenced landslide occurrence. This landslide model as a landslide prediction was developed to perform a quantitative landslide assessment. As a final conclusion, this model can provide a preliminary overview of the relationship between landslide occurrences with landslide conditioning factors. It can be used as an indicator to deal with the relationship of triggering landslide conditioning factors.

Author Contributions

Conceptualization, S.N.S., N.A.M., M.R.T. and A.O.; methodology, S.N.S.; writing—original draft preparation, S.N.S.; writing—review and editing, N.A.M.; supervision, N.A.M. and M.R.T.; project administration, M.R.T. and A.O.; funding acquisition, M.R.T. All authors have read and agreed to the published version of the manuscript.

Funding

This research was funded by Dana Padanan Antarabangsa (MyPAIR) Natural Environment Research Council (NERC), grant number NEWTON/1/2018/TK01/UKM//2.

Institutional Review Board Statement

Not applicable.

Informed Consent Statement

Not applicable.

Data Availability Statement

Not applicable.

Acknowledgments

The authors are thankful to the Department of Survey and Mapping (JUPEM), Department of Irrigation and Drainage Malaysia (JPS), and Department of Mineral and Geosciences Malaysia (JMG) for sharing the spatial data.

Conflicts of Interest

The authors declare no conflict of interest.

References

  1. Sun, X.; Chen, J.; Han, X.; Bao, Y.; Zhan, J.; Peng, W. Application of a GIS-based slope unit method for landslide susceptibility mapping along the rapidly uplifting section of the upper Jinsha River, South-Western China. Bull. Eng. Geol. Environ. 2020, 79, 533–549. [Google Scholar] [CrossRef]
  2. Bao, Y.; Zhai, S.; Chen, J.; Xu, P.; Sun, X.; Zhan, J.; Zhang, W.; Zhou, X. The evolution of the Samaoding paleolandslide river blocking event at the upstream reaches of the Jinsha River, Tibetan Plateau. Geomorphology 2020, 351, 106970. [Google Scholar] [CrossRef]
  3. Regmi, A.D.; Yoshida, K.; Nagata, H.; Pradhan, A.M.S.; Pradhan, B.; Pourghasemi, H.R. The relationship between geology and rock weathering on the rock instability along Mugling–Narayanghat road corridor, Central Nepal Himalaya. Nat. Hazards 2013, 66, 501–532. [Google Scholar] [CrossRef]
  4. Walker, L.R.; Shiels, A.B. Landslide Ecology; Cambridge University Press: Cambridge, UK, 2012. [Google Scholar]
  5. Mohammadi, A.; Shahabi, H.; Bin Ahmad, B. Integration of insartechnique, google earth images and extensive field survey for landslide inventory in a part of Cameron highlands, Pahang, Malaysia. Appl. Ecol. Environ. Res. 2018, 16, 8075–8091. [Google Scholar] [CrossRef]
  6. Highland, L.; Bobrowsky, P.T. The Landslide Handbook: A Guide to Understanding Landslides; US Geological Survey Reston: Reston, VA, USA, 2008. [Google Scholar]
  7. Sousa, W.P. The role of disturbance in natural communities. Annu. Rev. Ecol. Syst. 1984, 15, 353–391. [Google Scholar] [CrossRef]
  8. Das, R.; Mukherjee, M. Earth Science in Environmental Management. In Environmental Management: Issues and Concerns in Developing Countries; Springer: Berlin/Heidelberg, Germany, 2021; pp. 23–41. [Google Scholar]
  9. Cruden, D.M.; Varnes, D.J. Landslide types and processes. Spec. Rep. Transp. Res. Board Natl. Acad. Sci. 1996, 247, 36–76. [Google Scholar]
  10. Hungr, O.; Leroueil, S.; Picarelli, L. The Varnes classification of landslide types, an update. Landslides 2014, 11, 167–194. [Google Scholar] [CrossRef]
  11. Deng, X.; Li, L.; Tan, Y. Validation of spatial prediction models for landslide susceptibility mapping by considering structural similarity. ISPRS Int. J. Geo-Inf. 2017, 6, 103. [Google Scholar] [CrossRef] [Green Version]
  12. Liu, Y.; Xu, P.; Cao, C.; Shan, B.; Zhu, K.; Ma, Q.; Zhang, Z.; Yin, H. A comparative evaluation of machine learning algorithms and an improved optimal model for landslide susceptibility: A case study. Geomat. Nat. Hazards Risk 2021, 12, 1973–2001. [Google Scholar] [CrossRef]
  13. Varo, J.; Sekac, T.; Jana, S.K.; Pal, I. GIS perspective hazard risk assessment: A study of Fiji Island. In Disaster Resilience and Sustainability; Elsevier: Amsterdam, The Netherlands, 2021; pp. 197–238. [Google Scholar]
  14. Tien Bui, D.; Tuan, T.A.; Klempe, H.; Pradhan, B.; Revhaug, I. Spatial prediction models for shallow landslide hazards: A comparative assessment of the efficacy of support vector machines, artificial neural networks, kernel logistic regression, and logistic model tree. Landslides 2016, 13, 361–378. [Google Scholar] [CrossRef]
  15. Brock, J.; Schratz, P.; Petschko, H.; Muenchow, J.; Micu, M.; Brenning, A. The performance of landslide susceptibility models critically depends on the quality of digital elevation models. Geomat. Nat. Hazards Risk 2020, 11, 1075–1092. [Google Scholar] [CrossRef]
  16. Dikshit, A.; Sarkar, R.; Pradhan, B.; Segoni, S.; Alamri, A.M. Rainfall induced landslide studies in Indian Himalayan region: A critical review. Appl. Sci. 2020, 10, 2466. [Google Scholar] [CrossRef] [Green Version]
  17. Kanungo, D.; Arora, M.; Sarkar, S.; Gupta, R. Landslide Susceptibility Zonation (LSZ) Mapping—A Review. J. South Asia Disaster Stud. 2012, 2, 81–105. [Google Scholar]
  18. Shano, L.; Raghuvanshi, T.K.; Meten, M. Landslide susceptibility evaluation and hazard zonation techniques—A review. Geoenviron. Disasters 2020, 7, 18. [Google Scholar] [CrossRef]
  19. Chen, W.; Chen, X.; Peng, J.; Panahi, M.; Lee, S. Landslide susceptibility modeling based on ANFIS with teaching-learning-based optimization and Satin bowerbird optimizer. Geosci. Front. 2021, 12, 93–107. [Google Scholar] [CrossRef]
  20. Corominas, J.; van Westen, C.; Frattini, P.; Cascini, L.; Malet, J.-P.; Fotopoulou, S.; Catani, F.; Van Den Eeckhaut, M.; Mavrouli, O.; Agliardi, F. Recommendations for the quantitative analysis of landslide risk. Bull. Eng. Geol. Environ. 2014, 73, 209–263. [Google Scholar] [CrossRef]
  21. Wu, Y.; Li, W.; Liu, P.; Bai, H.; Wang, Q.; He, J.; Liu, Y.; Sun, S. Application of analytic hierarchy process model for landslide susceptibility mapping in the Gangu County, Gansu Province, China. Environ. Earth Sci. 2016, 75, 422. [Google Scholar] [CrossRef]
  22. Panchal, S.; Shrivastava, A.K. Landslide hazard assessment using analytic hierarchy process (AHP): A case study of National Highway 5 in India. Ain Shams Eng. J. 2022, 13, 101626. [Google Scholar] [CrossRef]
  23. Wang, H.; Zhang, L.; Luo, H.; He, J.; Cheung, R. AI-powered landslide susceptibility assessment in Hong Kong. Eng. Geol. 2021, 288, 106103. [Google Scholar] [CrossRef]
  24. Kreuzer, T.M.; Damm, B.; Terhorst, B. Quantitative assessment of information quality in textual sources for landslide inventories. Landslides 2022, 19, 505–513. [Google Scholar] [CrossRef]
  25. Zhou, Q.; Xu, Q.; Peng, D.; Fan, X.; Ouyang, C.; Zhao, K.; Li, H.; Zhu, X. Quantitative spatial distribution model of site-specific loess landslides on the Heifangtai terrace, China. Landslides 2021, 18, 1163–1176. [Google Scholar] [CrossRef]
  26. Chen, Y.; Ming, D.; Ling, X.; Lv, X.; Zhou, C. Landslide susceptibility mapping using feature fusion-based CPCNN-ML in Lantau Island, Hong Kong. IEEE J. Sel. Top. Appl. Earth Obs. Remote Sens. 2021, 14, 3625–3639. [Google Scholar] [CrossRef]
  27. Cao, Y.; Wei, X.; Fan, W.; Nan, Y.; Xiong, W.; Zhang, S. Landslide susceptibility assessment using the Weight of Evidence method: A case study in Xunyang area, China. PLoS ONE 2021, 16, e0245668. [Google Scholar] [CrossRef] [PubMed]
  28. Merghadi, A.; Yunus, A.P.; Dou, J.; Whiteley, J.; ThaiPham, B.; Bui, D.T.; Avtar, R.; Abderrahmane, B. Machine learning methods for landslide susceptibility studies: A comparative overview of algorithm performance. Earth-Sci. Rev. 2020, 207, 103225. [Google Scholar] [CrossRef]
  29. Azarafza, M.; Azarafza, M.; Akgün, H.; Atkinson, P.M.; Derakhshani, R. Deep learning-based landslide susceptibility mapping. Sci. Rep. 2021, 11, 24112. [Google Scholar] [CrossRef]
  30. Dikshit, A.; Pradhan, B.; Alamri, A.M. Pathways and challenges of the application of artificial intelligence to geohazards modelling. Gondwana Res. 2021, 100, 290–301. [Google Scholar] [CrossRef]
  31. Saha, S.; Roy, J.; Hembram, T.K.; Pradhan, B.; Dikshit, A.; Abdul Maulud, K.N.; Alamri, A.M. Comparison between Deep Learning and Tree-Based Machine Learning Approaches for Landslide Susceptibility Mapping. Water 2021, 13, 2664. [Google Scholar] [CrossRef]
  32. Lee, D.-H.; Kim, Y.-T.; Lee, S.-R. Shallow landslide susceptibility models based on artificial neural networks considering the factor selection method and various non-linear activation functions. Remote Sens. 2020, 12, 1194. [Google Scholar] [CrossRef] [Green Version]
  33. Al-Najjar, H.A.H.; Pradhan, B. Spatial landslide susceptibility assessment using machine learning techniques assisted by additional data created with generative adversarial networks. Geosci. Front. 2021, 12, 625–637. [Google Scholar] [CrossRef]
  34. Saha, A.; Saha, S. Comparing the efficiency of weight of evidence, support vector machine and their ensemble approaches in landslide susceptibility modelling: A study on Kurseong region of Darjeeling Himalaya, India. Remote Sens. Appl. Soc. Environ. 2020, 19, 100323. [Google Scholar] [CrossRef]
  35. Nhu, V.-H.; Mohammadi, A.; Shahabi, H.; Ahmad, B.B.; Al-Ansari, N.; Shirzadi, A.; Geertsema, M.; Kress, V.R.; Karimzadeh, S.; Valizadeh Kamran, K.; et al. Landslide Detection and Susceptibility Modeling on Cameron Highlands (Malaysia): A Comparison between Random Forest, Logistic Regression and Logistic Model Tree Algorithms. Forests 2020, 11, 830. [Google Scholar] [CrossRef]
  36. Youssef, A.M.; Pourghasemi, H.R. Landslide susceptibility mapping using machine learning algorithms and comparison of their performance at Abha Basin, Asir Region, Saudi Arabia. Geosci. Front. 2021, 12, 639–655. [Google Scholar] [CrossRef]
  37. He, Q.; Xu, Z.; Li, S.; Li, R.; Zhang, S.; Wang, N.; Pham, B.T.; Chen, W. Novel entropy and rotation forest-based credal decision tree classifier for landslide susceptibility modeling. Entropy 2019, 21, 106. [Google Scholar] [CrossRef] [PubMed] [Green Version]
  38. Daniel, M.T.; Ng, T.F.; Kadir, A.; Farid, M.; Pereira, J.J. Landslide Susceptibility Modeling Using a Hybrid Bivariate Statistical and Expert Consultation Approach in Canada Hill, Sarawak, Malaysia. Front. Earth Sci. 2021, 9, 71. [Google Scholar] [CrossRef]
  39. Pradhan, B.; Seeni, M.I.; Kalantar, B. Performance evaluation and sensitivity analysis of expert-based, statistical, machine learning, and hybrid models for producing landslide susceptibility maps. In Laser Scanning Applications in Landslide Assessment; Springer: Berlin/Heidelberg, Germany, 2017; pp. 193–232. [Google Scholar]
  40. Udin, W.; Yahaya, N.; Shariffuddin, S. Landslide susceptibility assessment using geographic information system in Aring, Gua Musang, Kelantan. IOP Conf. Ser. Earth Environ. Sci. 2021, 842, 012008. [Google Scholar] [CrossRef]
  41. Lau, P.H.M.; Zawawi, A.A. Analysis of landslide occurrence using DTM-based weighted overlay: A case study in tropical mountainous forest of Cameron Highlands, Malaysia. Environ. Nat. Resour. J. 2021, 19, 358–370. [Google Scholar]
  42. Roslee, R.; Mickey, A.C.; Simon, N.; Norhisham, M.N. Landslide susceptibility analysis (LSA) using weighted overlay method (WOM) along the Genting Sempah to Bentong Highway, Pahang. Malays. J. Geosci. 2017, 1, 13–19. [Google Scholar] [CrossRef]
  43. Gao, H.; Fam, P.S.; Tay, L.T.; Low, H.C. Comparative landslide spatial research based on various sample sizes and ratios in Penang Island, Malaysia. Bull. Eng. Geol. Environ. 2021, 80, 851–872. [Google Scholar] [CrossRef]
  44. Nuriah, A.M.; Ruslan, R. Aplikasi Sistem Maklumat Geografi (GIS) dan Analisis Diskriminan dalam Pemodelan Kejadian Kegagalan Cerun di Pulau Pinang, Malaysia. Sains Malays. 2019, 48, 1367–1381. [Google Scholar]
  45. Jeong, S.; Kassim, A.; Hong, M.; Saadatkhah, N. Susceptibility assessments of landslides in Hulu Kelang area using a geographic information system-based prediction model. Sustainability 2018, 10, 2941. [Google Scholar] [CrossRef] [Green Version]
  46. Cui, Y.; Cheng, D.; Choi, C.E.; Jin, W.; Lei, Y.; Kargel, J.S. The cost of rapid and haphazard urbanization: Lessons learned from the Freetown landslide disaster. Landslides 2019, 16, 1167–1176. [Google Scholar] [CrossRef] [Green Version]
  47. Hasnat, G.T.; Kabir, M.A.; Hossain, M.A. Major environmental issues and problems of South Asia, particularly Bangladesh. In Handbook of Environmental Materials Management; Springer: Berlin/Heidelberg, Germany, 2018; pp. 1–40. [Google Scholar]
  48. Azmi, A.S.M.; Salleh, W.A.R.W.M.; Nawawi, A.H. Cognitive behaviour of residents toward living in landslide prone area: Ulu Klang. Procedia-Soc. Behav. Sci. 2013, 101, 379–393. [Google Scholar] [CrossRef] [Green Version]
  49. Chan, N.W. Environmental hazards associated with hill land development in Penang Island, Malaysia: Some recommendations on effective management. Disaster Prev. Manag. Int. J. 1998, 7, 305–318. [Google Scholar] [CrossRef]
  50. Chan, N.W. Unsustainable development and environmental change in Cameron Highlands. Environ. Res. Technol. 2010, 546, 546–552. [Google Scholar]
  51. Rahman, H.A.; Mapjabil, J. Landslides disaster in Malaysia: An overview. Health 2017, 8, 58–71. [Google Scholar]
  52. Majid, N.; Taha, M.; Selamat, S. Historical landslide events in Malaysia 1993–2019. Indian J. Sci. Technol. 2020, 13, 3387–3399. [Google Scholar] [CrossRef]
  53. Abd Majid, N.; Rainis, R.; Ibrahim, W.M.M.W. Spatial Modeling Various Types of Slope Failure Using Artificial Neural Network (ANN) in Pulau Pinang, Malaysia. J. Teknol. 2018, 80, 135–146. [Google Scholar]
  54. Ocal, A. Natural disasters in Turkey: Social and economic perspective. Int. J. Disaster Risk Manag. 2019, 1, 51–61. [Google Scholar] [CrossRef] [Green Version]
  55. Svalova, V.; Zaalishvili, V.; Ganapathy, G.; Nikolaev, A.; Melkov, D. Landslide risk in mountain areas. Geol. South Russ. 2019, 9, 2. [Google Scholar]
  56. Teh, D.; Khan, T. Types, Definition and Classification of Natural Disasters and Threat Level. In Handbook of Disaster Risk Reduction for Resilience; Springer: Berlin/Heidelberg, Germany, 2021; pp. 27–56. [Google Scholar]
  57. Turner, A.K. Social and environmental impacts of landslides. Innov. Infrastruct. Solut. 2018, 3, 70. [Google Scholar] [CrossRef]
  58. Agrawal, N. Natural Disasters and Risk Management in Canada; Springer: Dordrecht, The Netherlands, 2018. [Google Scholar]
  59. Wan Ibrahim, W.M.M.; Rainis, R. Modelling Landslide Using GIS and RS-A Case Study of Upper Stream of Langat River Basin, Malaysia. Malays. J. Environ. Manag. 2004, 5, 113–122. [Google Scholar]
  60. Muhamad, N.; Reza, M.I.H.; Pereira, J.J. Landslide Susceptibility Maps to Support Urban Landuse Decision-Making: Case Study of the Langat Sub-Basin, Selangor. War. Geol. 2017, 43, 340. [Google Scholar]
  61. Manap, M.A.; Nampak, H.; Pradhan, B.; Lee, S.; Sulaiman, W.N.A.; Ramli, M.F. Application of probabilistic-based frequency ratio model in groundwater potential mapping using remote sensing data and GIS. Arab. J. Geosci. 2014, 7, 711–724. [Google Scholar] [CrossRef]
  62. Chang, C.K. A Study of Changing Trends of the Ambient Dry Bulb Temperature and Relative Humidity in Malaysia and Brunei. Int. Proc. Chem. Biol. Environ. Eng. 2017, 100, 19–27. [Google Scholar]
  63. Can, A.; Dagdelenler, G.; Ercanoglu, M.; Sonmez, H. Landslide susceptibility mapping at Ovacık-Karabük (Turkey) using different artificial neural network models: Comparison of training algorithms. Bull. Eng. Geol. Environ. 2019, 78, 89–102. [Google Scholar] [CrossRef]
  64. Nhu, V.-H.; Mohammadi, A.; Shahabi, H.; Ahmad, B.B.; Al-Ansari, N.; Shirzadi, A.; Clague, J.J.; Jaafari, A.; Chen, W.; Nguyen, H. Landslide susceptibility mapping using machine learning algorithms and remote sensing data in a tropical environment. Int. J. Environ. Res. Public Health 2020, 17, 4933. [Google Scholar] [CrossRef] [PubMed]
  65. Zhang, T.; Han, L.; Chen, W.; Shahabi, H. Hybrid integration approach of entropy with logistic regression and support vector machine for landslide susceptibility modeling. Entropy 2018, 20, 884. [Google Scholar] [CrossRef] [Green Version]
  66. Mora, O.; Lenzano, M.; Toth, C.; Grejner-Brzezinska, D. Analyzing The Effects of Spatial Resolution For Small Landslide Susceptibility and Hazard Mapping. Int. Arch. Photogramm. Remote Sens. Spat. Inf. Sci. 2014, XL-1, 293–300. [Google Scholar] [CrossRef] [Green Version]
  67. Meena, S.R.; Gudiyangada Nachappa, T. Impact of spatial resolution of digital elevation model on landslide susceptibility mapping: A case study in Kullu Valley, Himalayas. Geosciences 2019, 9, 360. [Google Scholar] [CrossRef] [Green Version]
  68. Tsangaratos, P.; Ilia, I. Comparison of a logistic regression and Naïve Bayes classifier in landslide susceptibility assessments: The influence of models complexity and training dataset size. Catena 2016, 145, 164–179. [Google Scholar] [CrossRef]
  69. Jebur, M.N.; Pradhan, B.; Tehrany, M.S. Optimization of landslide conditioning factors using very high-resolution airborne laser scanning (LiDAR) data at catchment scale. Remote Sens. Environ. 2014, 152, 150–165. [Google Scholar] [CrossRef]
  70. Kadirhodjaev, A.; Kadavi, P.R.; Lee, C.-W.; Lee, S. Analysis of the relationships between topographic factors and landslide occurrence and their application to landslide susceptibility mapping: A case study of Mingchukur, Uzbekistan. Geosci. J. 2018, 22, 1053–1067. [Google Scholar] [CrossRef]
  71. Dou, J.; Yamagishi, H.; Pourghasemi, H.R.; Yunus, A.P.; Song, X.; Xu, Y.; Zhu, Z. An integrated artificial neural network model for the landslide susceptibility assessment of Osado Island, Japan. Nat. Hazards 2015, 78, 1749–1776. [Google Scholar] [CrossRef]
  72. Kornejady, A.; Ownegh, M.; Bahremand, A. Landslide susceptibility assessment using maximum entropy model with two different data sampling methods. Catena 2017, 152, 144–162. [Google Scholar] [CrossRef]
  73. Pourghasemi, H.; Pradhan, B.; Gokceoglu, C.; Moezzi, K.D. A comparative assessment of prediction capabilities of Dempster–Shafer and weights-of-evidence models in landslide susceptibility mapping using GIS. Geomat. Nat. Hazards Risk 2013, 4, 93–118. [Google Scholar] [CrossRef]
  74. Lee, S.; Lee, M.-J.; Jung, H.-S. Data mining approaches for landslide susceptibility mapping in Umyeonsan, Seoul, South Korea. Appl. Sci. 2017, 7, 683. [Google Scholar] [CrossRef] [Green Version]
  75. Li, B.; Wang, N.; Chen, J. GIS-based landslide susceptibility mapping using information, frequency ratio, and artificial neural network methods in Qinghai Province, Northwestern China. Adv. Civ. Eng. 2021, 2021, 4758062. [Google Scholar] [CrossRef]
  76. Pourghasemi, H.R.; Jirandeh, A.G.; Pradhan, B.; Xu, C.; Gokceoglu, C. Landslide susceptibility mapping using support vector machine and GIS at the Golestan Province, Iran. J. Earth Syst. Sci. 2013, 122, 349–369. [Google Scholar] [CrossRef] [Green Version]
  77. Cruden, D.M. A simple definition of a landslide. Bull. Int. Assoc. Eng. Geol.-Bull. L’association Int. Géologie L’ingénieur 1991, 43, 27–29. [Google Scholar] [CrossRef]
  78. Tang, R.-X.; Kulatilake, P.H.; Yan, E.; Cai, J.-S. Evaluating landslide susceptibility based on cluster analysis, probabilistic methods, and artificial neural networks. Bull. Eng. Geol. Environ. 2020, 79, 2235–2254. [Google Scholar] [CrossRef]
  79. Zhou, X.; Wen, H.; Zhang, Y.; Xu, J.; Zhang, W. Landslide susceptibility mapping using hybrid random forest with GeoDetector and RFE for factor optimization. Geosci. Front. 2021, 12, 101211. [Google Scholar] [CrossRef]
  80. Pham, B.T.; Tien Bui, D.; Prakash, I.; Dholakia, M.B. Hybrid integration of Multilayer Perceptron Neural Networks and machine learning ensembles for landslide susceptibility assessment at Himalayan area (India) using GIS. Catena 2017, 149, 52–63. [Google Scholar] [CrossRef]
  81. Hong, H.; Naghibi, S.A.; Pourghasemi, H.R.; Pradhan, B. GIS-based landslide spatial modeling in Ganzhou City, China. Arab. J. Geosci. 2016, 9, 1–26. [Google Scholar] [CrossRef]
  82. Kamisetty, A.; Gandhi, I.S.R.; Kumar, A. Exploring the suitability of using Foam concrete as pore pressure dissipation measure for slope Stability: A state of art review. Mater. Today Proc. 2022, in press. [Google Scholar] [CrossRef]
  83. Iverson, R.M. Landslide triggering by rain infiltration. Water Resour. Res. 2000, 36, 1897–1910. [Google Scholar] [CrossRef] [Green Version]
  84. Gariano, S.L.; Sarkar, R.; Dikshit, A.; Dorji, K.; Brunetti, M.T.; Peruccacci, S.; Melillo, M. Automatic calculation of rainfall thresholds for landslide occurrence in Chukha Dzongkhag, Bhutan. Bull. Eng. Geol. Environ. 2019, 78, 4325–4332. [Google Scholar] [CrossRef]
  85. Rosly, M.H.; Mohamad, H.M.; Bolong, N.; Harith, N.S.H. An Overview: Relationship of Geological Condition and Rainfall with Landslide Events at East Malaysia. Trends Sci. 2022, 19, 3464. [Google Scholar] [CrossRef]
  86. Tsunetaka, H. Comparison of the return period for landslide-triggering rainfall events in Japan based on standardization of the rainfall period. Earth Surf. Process. Landf. 2021, 46, 2984–2998. [Google Scholar] [CrossRef]
  87. Wang, F.; Xu, P.; Wang, C.; Wang, N.; Jiang, N. Application of a GIS-based slope unit method for landslide susceptibility mapping along the Longzi River, Southeastern Tibetan Plateau, China. ISPRS Int. J. Geo-Inf. 2017, 6, 172. [Google Scholar] [CrossRef] [Green Version]
  88. Zhao, P.; Masoumi, Z.; Kalantari, M.; Aflaki, M.; Mansourian, A. A GIS-Based Landslide Susceptibility Mapping and Variable Importance Analysis Using Artificial Intelligent Training-Based Methods. Remote Sens. 2022, 14, 211. [Google Scholar] [CrossRef]
  89. Dormann, C.F.; Elith, J.; Bacher, S.; Buchmann, C.; Carl, G.; Carré, G.; Marquéz, J.R.G.; Gruber, B.; Lafourcade, B.; Leitão, P.J.; et al. Collinearity: A review of methods to deal with it and a simulation study evaluating their performance. Ecography 2013, 36, 27–46. [Google Scholar] [CrossRef]
  90. Kalantar, B.; Ueda, N.; Saeidi, V.; Ahmadi, K.; Halin, A.A.; Shabani, F. Landslide Susceptibility Mapping: Machine and Ensemble Learning Based on Remote Sensing Big Data. Remote Sens. 2020, 12, 1737. [Google Scholar] [CrossRef]
  91. Arabameri, A.; Pradhan, B.; Rezaei, K.; Lee, C.-W. Assessment of landslide susceptibility using statistical-and artificial intelligence-based FR–RF integrated model and multiresolution DEMs. Remote Sens. 2019, 11, 999. [Google Scholar] [CrossRef] [Green Version]
  92. Lv, L.; Chen, T.; Dou, J.; Plaza, A. A hybrid ensemble-based deep-learning framework for landslide susceptibility mapping. Int. J. Appl. Earth Obs. Geoinf. 2022, 108, 102713. [Google Scholar] [CrossRef]
  93. Varmuza, K.; Filzmoser, P. Introduction to Multivariate Statistical Analysis in Chemometrics; CRC Press: Boca Raton, FL, USA, 2016. [Google Scholar]
  94. Achu, A.L.; Aju, C.D.; Reghunath, R. Spatial modelling of shallow landslide susceptibility: A study from the southern Western Ghats region of Kerala, India. Ann. GIS 2020, 26, 113–131. [Google Scholar] [CrossRef]
  95. Yi, Y.; Zhang, Z.; Zhang, W.; Jia, H.; Zhang, J. Landslide susceptibility mapping using multiscale sampling strategy and convolutional neural network: A case study in Jiuzhaigou region. Catena 2020, 195, 104851. [Google Scholar] [CrossRef]
  96. Chen, X.; Chen, W. GIS-based landslide susceptibility assessment using optimized hybrid machine learning methods. Catena 2021, 196, 104833. [Google Scholar] [CrossRef]
  97. Qin, Y.; Yang, G.; Lu, K.; Sun, Q.; Xie, J.; Wu, Y. Performance evaluation of five GIS-based models for landslide susceptibility prediction and mapping: A case study of Kaiyang County, China. Sustainability 2021, 13, 6441. [Google Scholar] [CrossRef]
  98. Can, R.; Kocaman, S.; Gokceoglu, C. A convolutional neural network architecture for auto-detection of landslide photographs to assess citizen science and volunteered geographic information data quality. ISPRS Int. J. Geo-Inf. 2019, 8, 300. [Google Scholar] [CrossRef] [Green Version]
  99. Mandal, S.; Mondal, S. Machine Learning Models and Spatial Distribution of Landslide Susceptibility. In Geoinformatics and Modelling of Landslide Susceptibility and Risk; Springer: Berlin/Heidelberg, Germany, 2019; pp. 165–175. [Google Scholar]
  100. Oh, H.-J.; Lee, S. Shallow landslide susceptibility modeling using the data mining models artificial neural network and boosted tree. Appl. Sci. 2017, 7, 1000. [Google Scholar] [CrossRef] [Green Version]
  101. Kanungo, D.; Arora, M.; Sarkar, S.; Gupta, R. A comparative study of conventional, ANN black box, fuzzy and combined neural and fuzzy weighting procedures for landslide susceptibility zonation in Darjeeling Himalayas. Eng. Geol. 2006, 85, 347–366. [Google Scholar] [CrossRef]
  102. Chen, W.; Chen, Y.; Tsangaratos, P.; Ilia, I.; Wang, X. Combining evolutionary algorithms and machine learning models in landslide susceptibility assessments. Remote Sens. 2020, 12, 3854. [Google Scholar] [CrossRef]
  103. Tingyu, Z.; Nath, S.K. GIS-Based Landslide Susceptibility Mapping in Eastern Boundary Zone of Northeast India in Compliance with Indo-Burmese Subduction Tectonics. In Geospatial Technology for Environmental Hazards; Springer: Berlin/Heidelberg, Germany, 2022; pp. 19–37. [Google Scholar]
  104. Pham, B.T.; Jaafari, A.; Prakash, I.; Bui, D.T. A novel hybrid intelligent model of support vector machines and the MultiBoost ensemble for landslide susceptibility modeling. Bull. Eng. Geol. Environ. 2019, 78, 2865–2886. [Google Scholar] [CrossRef]
  105. Gautam, P.; Kubota, T.; Sapkota, L.M.; Shinohara, Y. Landslide susceptibility mapping with GIS in high mountain area of Nepal: A comparison of four methods. Environ. Earth Sci. 2021, 80, 359. [Google Scholar] [CrossRef]
  106. Mokhtari, M.; Abedian, S. Spatial prediction of landslide susceptibility in Taleghan basin, Iran. Stoch. Environ. Res. Risk Assess. 2019, 33, 1297–1325. [Google Scholar] [CrossRef]
  107. Sujatha, E.R.; Sridhar, V. Landslide susceptibility analysis: A logistic regression model case study in Coonoor, India. Hydrology 2021, 8, 41. [Google Scholar] [CrossRef]
  108. Lee, S.; Lee, S.R.; Kim, Y. An approach to estimate unsaturated shear strength using artificial neural network and hyperbolic formulation. Comput. Geotech. 2003, 30, 489–503. [Google Scholar] [CrossRef]
  109. Shahin, M.A.; Jaksa, M.B.; Maier, H.R. State of the art of artificial neural networks in geotechnical engineering. Electron. J. Geotech. Eng. 2008, 8, 1–26. [Google Scholar]
  110. Lee, S.; Choi, J.; Min, K. Probabilistic landslide hazard mapping using GIS and remote sensing data at Boun, Korea. Int. J. Remote Sens. 2004, 25, 2037–2052. [Google Scholar] [CrossRef]
  111. Lucchese, L.V.; de Oliveira, G.G.; Pedrollo, O.C. Mamdani fuzzy inference systems and artificial neural networks for landslide susceptibility mapping. Nat. Hazards 2021, 106, 2381–2405. [Google Scholar] [CrossRef]
  112. Hashim, M.; Misbari, S.; Pour, A.B. Landslide Mapping and Assessment by Integrating Landsat-8, PALSAR-2 and GIS Techniques: A Case Study from Kelantan State, Peninsular Malaysia. J. Indian Soc. Remote Sens. 2017, 46, 233–248. [Google Scholar] [CrossRef]
  113. Pour, A.B.; Hashim, M. Application of Landsat-8 and ALOS-2 data for structural and landslide hazard mapping in Kelantan, Malaysia. Nat. Hazards Earth Syst. Sci. 2017, 17, 1285–1303. [Google Scholar] [CrossRef] [Green Version]
  114. Tien Bui, D.; Shahabi, H.; Shirzadi, A.; Chapi, K.; Alizadeh, M.; Chen, W.; Mohammadi, A.; Ahmad, B.; Panahi, M.; Hong, H.; et al. Landslide Detection and Susceptibility Mapping by AIRSAR Data Using Support Vector Machine and Index of Entropy Models in Cameron Highlands, Malaysia. Remote Sens. 2018, 10, 1527. [Google Scholar] [CrossRef] [Green Version]
  115. Al-batah, M.S.; Alkhasawneh, M.S.; Tay, L.T.; Ngah, U.K.; Hj Lateh, H.; Mat Isa, N.A. Landslide Occurrence Prediction Using Trainable Cascade Forward Network and Multilayer Perceptron. Math. Probl. Eng. 2015, 2015, 512158. [Google Scholar] [CrossRef] [Green Version]
  116. Sugumaran, D.; Blake, W.H.; Millward, G.E.; Yusop, Z.; Mohd Yusoff, A.R.; Mohamad, N.A.; Nainar, A.; Annammala, K.V. Composition of deposited sediment and its temporal variation in a disturbed tropical catchment in the Kelantan river basin, Peninsular Malaysia. Environ. Sci. Pollut. Res. 2022, 29, 1–16. [Google Scholar] [CrossRef] [PubMed]
  117. Wong, J.L.; Lee, M.L.; Teo, F.Y.; Liew, K.W. A Review of Impacts of Climate Change on Slope Stability. In Climate Change and Water Security; Springer: Singapore, 2022; pp. 157–178. [Google Scholar]
  118. Akgun, A. A comparison of landslide susceptibility maps produced by logistic regression, multi-criteria decision, and likelihood ratio methods: A case study at İzmir, Turkey. Landslides 2012, 9, 93–106. [Google Scholar] [CrossRef]
  119. Nohani, E.; Moharrami, M.; Sharafi, S.; Khosravi, K.; Pradhan, B.; Pham, B.T.; Lee, S.; Melesse, A.M. Landslide susceptibility mapping using different GIS-based bivariate models. Water 2019, 11, 1402. [Google Scholar] [CrossRef] [Green Version]
  120. Li, R.; Wang, N. Landslide Susceptibility Mapping for the Muchuan County (China): A Comparison Between Bivariate Statistical Models (WoE, EBF, and IoE) and Their Ensembles with Logistic Regression. Symmetry 2019, 11, 762. [Google Scholar] [CrossRef] [Green Version]
Figure 1. Study area at Langat Basin, Selangor.
Land 11 00833 g001
Figure 2. Flow chart of the methodology.
Land 11 00833 g002
Figure 3. The landslide location at Langat River Basin (Photos were taken in December 2021).
Land 11 00833 g003
Figure 4. Landslide conditioning factors: (a) Elevation, (b) Slope, (c) Aspect, (d) Curvature, (e) TWI, (f) Distance to road, (g) Distance to river, (h) Lithology, and (i) Rainfall. (Spatial resolution for all landslide condition factors is 5 m × 5 m).
Land 11 00833 g004
Figure 5. The structure of the Artificial Neural Network (ANN) model.
Land 11 00833 g005
Figure 6. The multicollinearity analysis for landslide conditioning factors.
Land 11 00833 g006
Figure 7. Importance of landslide conditioning factors.
Land 11 00833 g007
Figure 8. Landslide susceptibility map.
Land 11 00833 g008
Table 1. Results of model validation for training and testing datasets.
Statistical MeasuresTraining DatasetTesting Dataset
Sensitivity0.9500.957
Specificity0.8870.833
Accuracy0.9140.894
Positive Predictive Value (PPV)0.8640.846
Negative Predictive Value (NPV)0.9590.952
Area Under Curve (AUC)0.9400.940
Publisher’s Note: MDPI stays neutral with regard to jurisdictional claims in published maps and institutional affiliations.

