Urban Green Spaces—An Underestimated Resource in Third-Tier Towns in Poland


Faculty of Economics and Sociology, University of Lodz, P.O.W. 3/5, 90-255 Lodz, Poland
*
Author to whom correspondence should be addressed.
Land 2020, 9(11), 453; https://0-doi-org.brum.beds.ac.uk/10.3390/land9110453
Submission received: 6 October 2020
/
Revised: 10 November 2020
/
Accepted: 13 November 2020
/
Published: 17 November 2020
(This article belongs to the Special Issue Human-Urban Green Space Interactions and Their Integration into Urban and Green Space Planning and Management)
Abstract
:Urban green spaces are frequently presented as being important for urban quality of life and urban development in general, but more detailed interpretations and discussions are typically confined to large urban centers, the so-called first- and second-tier cities. Not enough attention has been paid to smaller urban units, the third-tier towns. The main goal of this article is to investigate the share and types of urban green spaces in five selected towns in Poland. We compare different sources of data based on satellite imagery and land-use maps with those used in public statistics, to check whether town authorities are managing all potential green spaces or only a selected part of them. We find that the predominantly used data, based on what is classified as “urban green space” for the purposes of public statistics, obscure the complexity of urban green spaces and focus on the narrowly understood formally managed public green spaces (which occupy 3.5–5.7% of town areas). Meanwhile, based on other sources, such as the national land-use map (BDOT10k), Urban Atlas, and satellite imagery (Landsat 8), what is considered to be green space turns out to cover 50–80% of the town area. The latter large numbers are associated with the predominance of arable land, grasslands, and forests, overlooked in any green space management practices based on data and definitions adopted for the purposes of public statistics. The situation found in our five case study towns resembles that identified in larger cities in Poland, and it exhibits the inadequacy of public statistics definitions and the related management practices, hindering the management of urban green spaces as an interconnected system of urban green infrastructures.
1. Introduction
Urban green spaces provide numerous benefits to urban inhabitants [1,2], and they have been recognized as having an important contribution to health and quality of life in urban areas [3,4]. For these reasons, urban green spaces are increasingly considered an essential aspect of urban planning and management [5,6].
Although most discussions on urban green spaces and the ecosystem services they provide refer to “cities and towns” [7,8,9,10], cities attract disproportionately more attention [11,12] (for exceptions, see, References [13,14]). Examples of green space governance solutions, planning practices, and ecosystem assessments typically refer to the most prominent cities, with few oft-cited examples, such as Beijing, Cape Town, New York, Singapore, or Stockholm [1]. Clearly, limited attention paid to green spaces in towns and smaller cities (hereafter collectively referred to as towns)—especially when compared to the broad debate focusing on larger cities—represents a research gap that needs to be filled. This gap is particularly important given that towns host a large share of the urban population worldwide, and even in some of the most urbanized countries in Europe, such as Belgium or Germany, more people live in towns and suburbs than in cities [15]. Meanwhile, the size of an urban area and its character is likely to influence the effects of urban nature on the health and quality of life of urban inhabitants [11].
Why then are towns so underrepresented in the broader debates on urban green spaces? One reason might be related to a tacit assumption that whatever refers to urban green spaces refers equally to all kinds of urban settlements, including both cities and towns. Another tacit assumption might be that towns are less urbanized and, in particular, less densely built-up, which means that they are likely to have more green space than cities. This, in turn, might mean that they do not require as much attention in this regard as cities. However, both of these assumptions need not necessarily be true.
Cities and towns may be different, not only in regard to their size and density, but also to their green space management capacity [16,17]. Town administrations are less complex compared to city administrations. They have fewer employees, and these employees typically have more diverse responsibilities. Especially in smaller towns, a person dealing with urban green spaces may, at the same time, be responsible for spatial planning and/or any other environmental issues. This is also related to scarcer funding. Meanwhile, towns are highly diverse, differing in terms of compactness, distances to (and influences of) larger cities, and location vis-à-vis high-quality natural areas, among other things. All of these differences translate into differences in the role of green spaces and the respective management approaches. Clearly, such problems at the level of the town deserve attention.
In the present article, we address the above issues by investigating green spaces in five towns in Central Poland. The main goals of this article are to investigate the share and types of urban green spaces in the selected towns and to discuss the similarities and differences between towns and cities in this context. Given that urban green space management in towns may be more challenging than in cities (for the abovementioned reasons), we use data sources that are available free of charge and that can potentially be used by local authorities. We compare the different sources of data based on satellite imagery with those used in public statistics, to check whether town administrations are managing all potential green spaces or only a selected part of them. Eventually, by comparing the situation in towns to the situation in larger cities, we check if, indeed, it makes sense to put cities and towns in one box when discussing urban green spaces.
The article is structured as follows: In Section 2, we describe how we selected our case study towns, where we sought the data, and which categories and indicators for urban green space availability we used. It is here that we indicate and justify that we follow a broad interpretation of urban green spaces as all vegetated areas within urban boundaries. Section 3 features the results of the study, and in Section 4, we discuss these results in the broader context of urban green space availability in smaller towns in Poland and beyond. Conclusions in Section 5 close this article.
2. Materials and Methods
2.1. Case Study Towns
In Poland, 32% of people live in towns with fewer than 100,000 inhabitants, which represents a little more than half of the country’s urban population [18]. As in other countries, most research on urban green spaces in Poland has focused on a small group of large cities, such as Warsaw, Krakow, Lodz, and Poznan [19,20,21,22,23]. A comparative study on the share of urban green spaces in all seventeen regional capitals, each larger than 100,000 inhabitants [24], provides a useful reference for comparison with smaller urban areas. Indeed, urban green spaces in towns have not been subject to systematic analysis yet, and have only been subject to ad hoc research focused on specific topics [25]. Additional research referred to suburban areas surrounding larger cities, but again with a focus on individual, specific issues related to urban green spaces [26,27], and it did not provide a systematic overview.
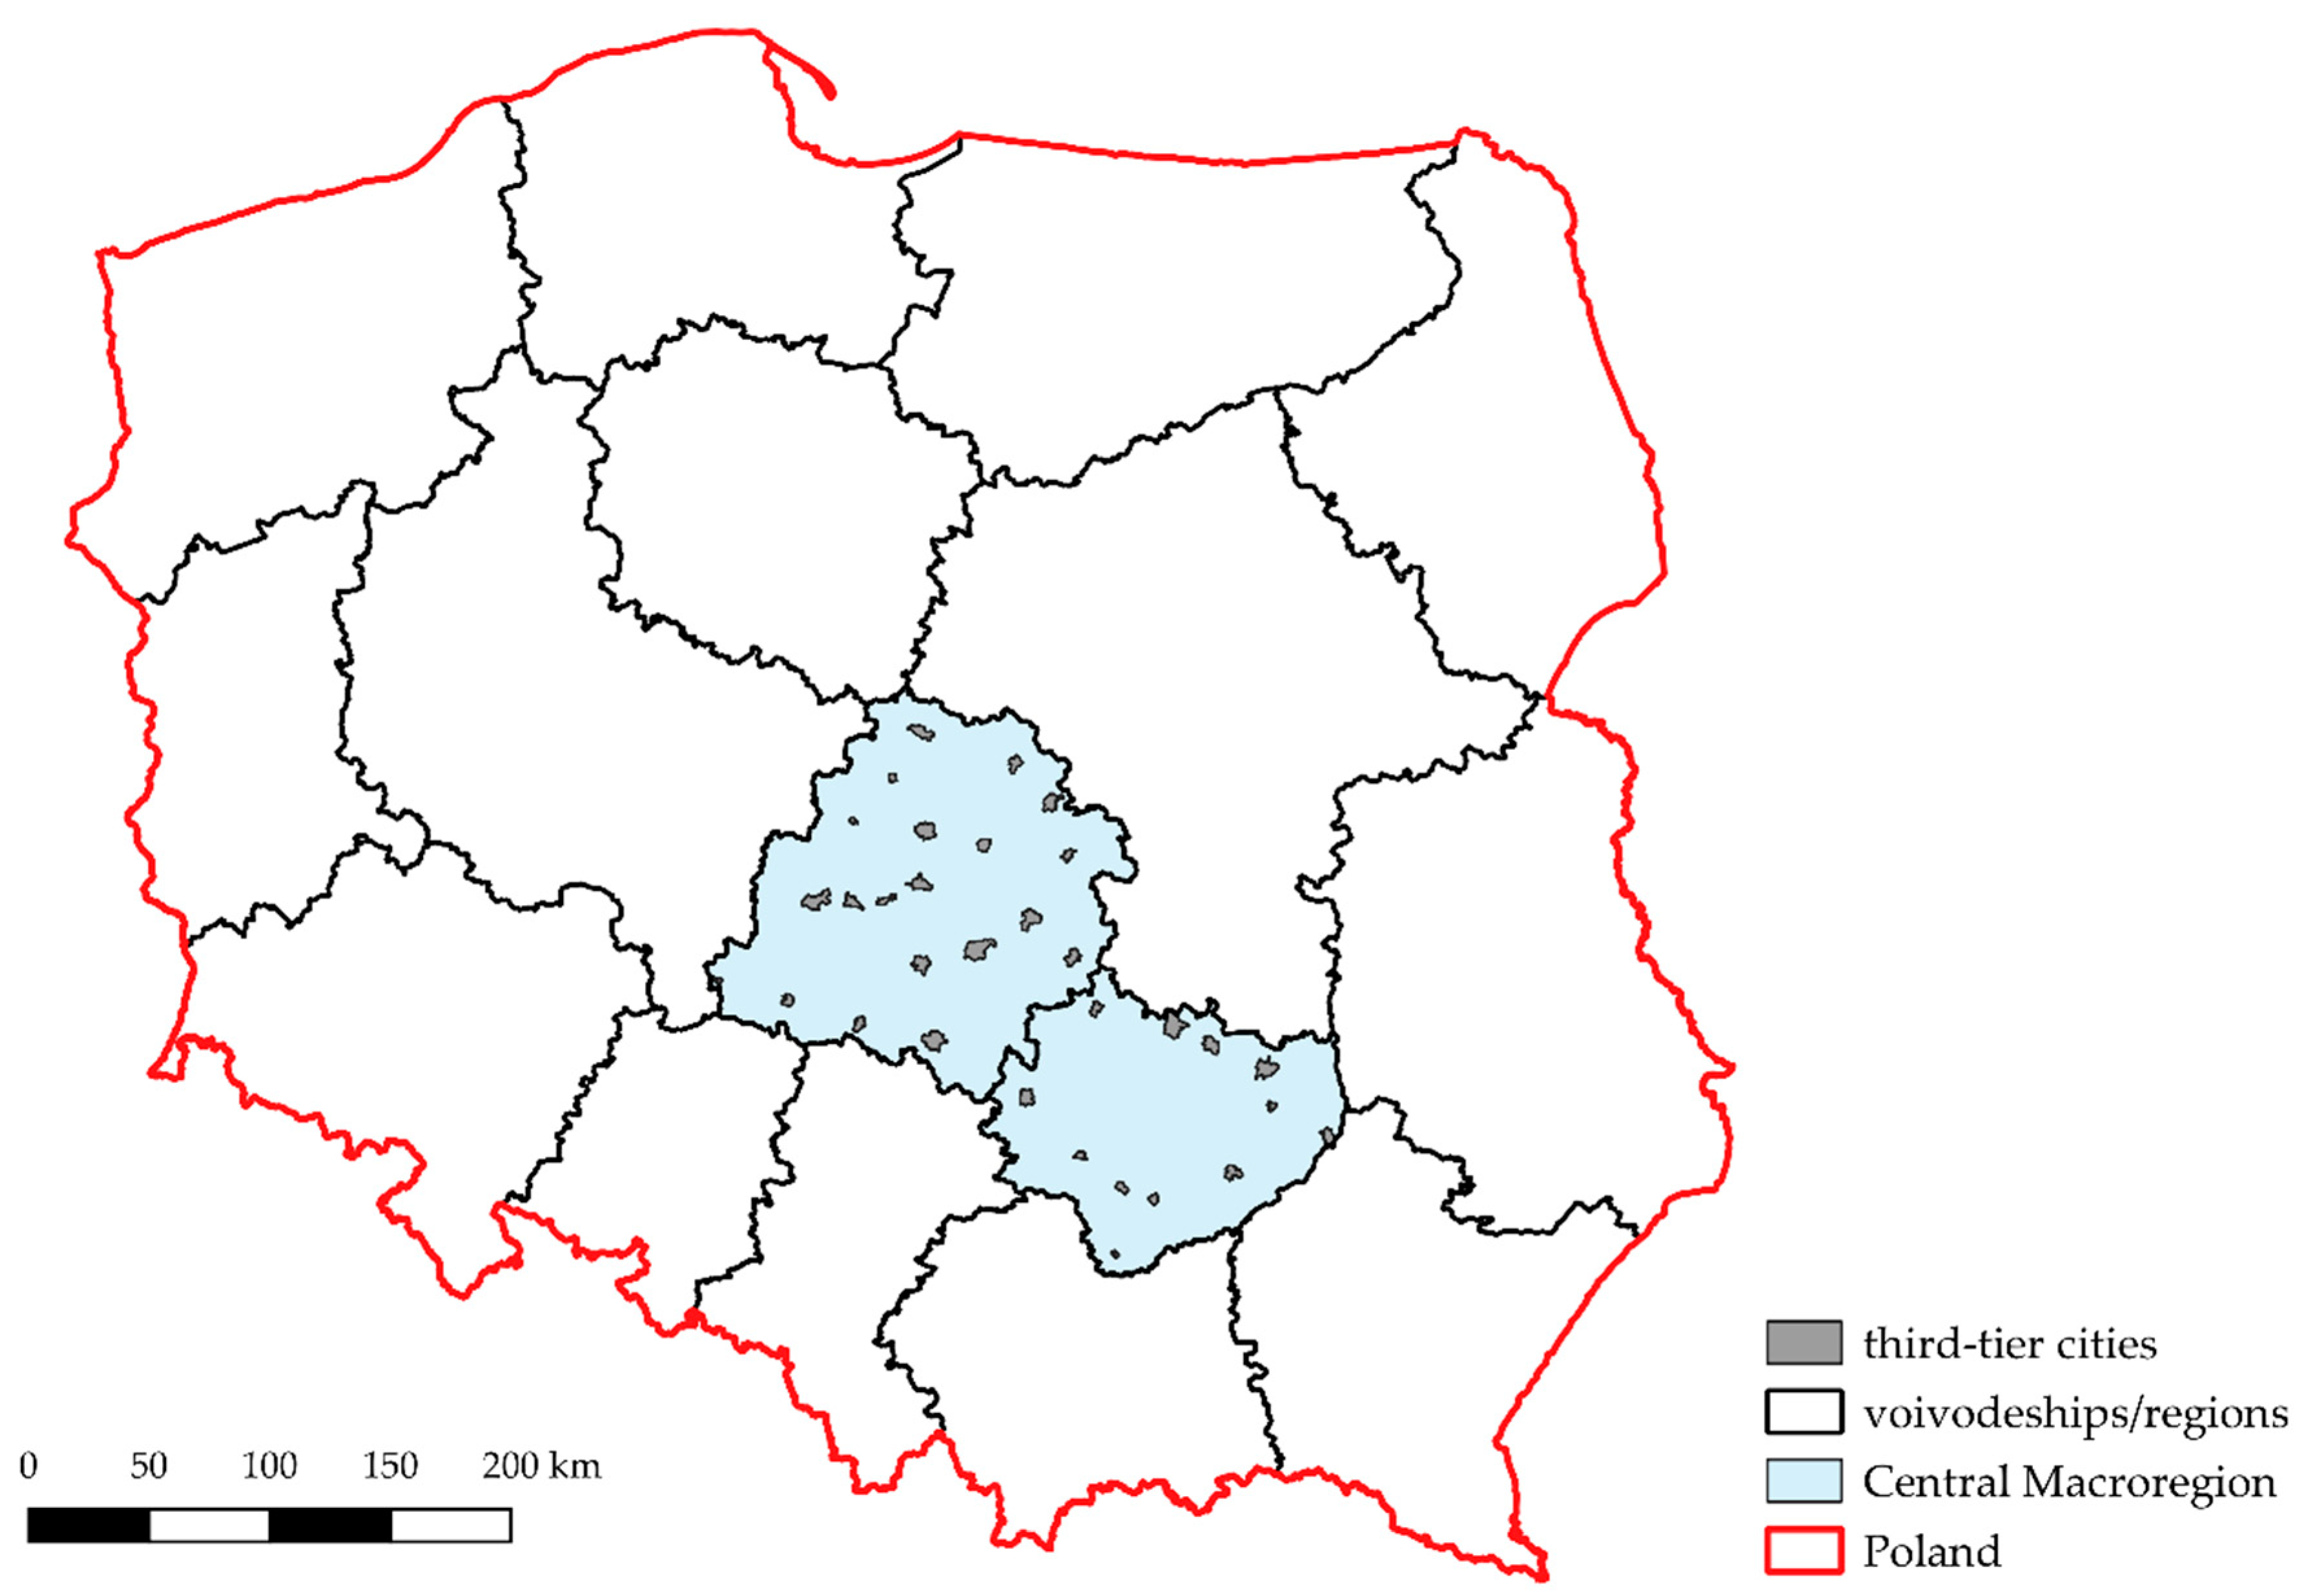
To address this gap in the literature, we selected a group of towns in central Poland, to systematically analyze their green spaces. The study area features the so-called Central Macroregion, which has been established for the purposes of Polish statistics since 1st January 2018 and comprises the Lodzkie and Swietokrzyskie regions (voivodeships). This area includes 32 towns that are the seats of administration units at the county (powiat) level and are not classed as second-tier cities, as they lack the status of regional capital (Figure 1).
Where the Lodzkie region is concerned, the distribution of third-tier towns is even. In contrast, in Swietokrzyskie, there is more of a ring of this type of urban area, with most locations closer to the border of the region. Descriptive statistics allowed for an assessment of the entire preliminary research group, as well as for the analysis of the centers in the different regions. The mean size of the urban localities in question is 30,628 inhabitants, while the median is 21,924. The largest center is Piotrkow Trybunalski, which was inhabited by more than 73,600 people as of 2018. Piotrkow is in the Lodzkie region. The smallest third-tier center, and in fact a very small town, is Kazimierza Wielka, in the Swietokrzyskie region, with a population of just over 5500 (for a comparison of basic data on the towns of both regions, see Table 1) [28].
We narrowed down the initial list of 32 towns to five that are included in the Urban Atlas (UA) dataset, which considers land use from the point of the so-called Functional Urban Areas (FUA). The selected towns are Ostrowiec Swietokrzyski (Swietokrzyskie region), Pabianice, Piotrkow Trybunalski, Tomaszow Mazowiecki, and Zgierz (Lodzkie region) (Table 2). In the selected towns, the mean population size is 65,436, while the median value is 65,283. The sample lacks outlying values, which is confirmed by a coefficient of variation equal to 9.9%. For these five towns, we analyzed the urban green spaces, as described in the following subsections.
2.2. Spatial and Statistical Data
For the purposes of our analysis, we used both statistical and vector data (Table 3). The statistical data used here are those for the “urban green space” category, collected by Statistics Poland (GUS), which includes parks, lawns, and the green areas surrounding housing estates, cemeteries, and municipal forests. These data are collected as part of all Polish local governments’ annual reporting. The analysis done for the needs of this article uses data from 2018, the most recent available thus far. Given that these data exclude many types of green spaces [24,29], we compared them with other sources.
The Urban Atlas (UA) compilation takes in 785 FUAs as they were in 2012. Unfortunately, the results for 2018 were not yet available while this article was being drawn up. We need to be aware that data from 2012 will differ somewhat from the situation in third-tier towns in 2018. UA data are accessible via the Copernicus Land Monitoring Service (CLMS) spatial database.
Data also come from the Topographic Objects Database 10k (BDOT10k), a set of vector data that corresponds with a 1:10,000 scale. This database has data on land use that allow for the generation of various compilations. The database is updated in real-time, allowing for an assessment of the real situation when the data are downloaded. The BDOT10k database covers the whole area of Poland, and it is legally binding for land surveyors.
The data from satellite imagery—Landsat 8 (US Geological Survey)—come from August 2018. Multispectral imagery was processed by QGIS 3.10 with the Semi-Automatic Classification Plugin (SCP) in version 6. Operations using the Plugin are based on the preprocessing of imagery, cutting at the limits of the studied towns, and generating an ROI (region of interest) for each. Training areas were generated to teach the program how best to recognize particular pixels from aerial images. A key benefit of QGIS programming with SCP is its ease of use, which, combined with the knowledge of local-government personnel, allows very good results to be obtained via a supervised classification process. The last stage to obtain satellite data used in the analysis involved classification and generating raster and vector files, which allowed indices to be calculated. Classification took place via the minimum-distance method and was dictated by earlier findings on the reliability of results in Poland, as well as the subject literature more generally [30,31,32].
2.3. Urban Green Spaces
There is a large diversity of approaches to urban green spaces in the academic literature, explicitly including or excluding some components [33,34]. Our definition of urban green spaces features all vegetated areas within urban boundaries, be they public or private. Indeed, private land is too often excluded from debates on urban green spaces [6,35], and too few local authorities have actually attempted to interfere with how private owners manage their land, with London being one such example [36].
The main argument for adopting such a broad definition is that all of these vegetated, impervious areas provide ecosystem services and the related benefits to urban inhabitants. Indeed, in response to challenges related to climate change, many new approaches to the planning of urban green spaces refer to the protection of any unsealed land, and, in particular, to unsealed land of higher biological value, such as the Biotope Area Factor index [37].
Depending on the dataset used, such broadly understood green spaces are represented by diverse categories (Table 4). The statistical data are based on the narrowest interpretation, featuring only the officially recognized category of formally recognized public green spaces. To make sure that our interpretation is more comprehensive, we explicitly distinguish between formal green spaces captured in the statistical data—recognized as such and managed by public authorities—and many other types of informal green spaces that escape formal classification and management, and yet which provide multiple ecosystem services [24,29,38,39,40].
The relevant land-use categories in the UA and BDOT10k datasets we used partially overlap [41,42]. We sought any natural and seminatural areas to identify areas with a dominant share of vegetation. Both datasets feature forests, pastures/grassland, orchards, and arable land (albeit with slight differences in definitions). All of these, and several other categories unique to each dataset, reflect the complexity of urban ecosystems, the source of multiple ecosystem services for urban inhabitants [43,44].
We posit that local authorities should also follow such a broad definition of urban green space and—based on the large preliminary dataset—plan a comprehensive system of green infrastructure. The ultimate system of green infrastructure will most likely be smaller than the present general urban green space due to further development pressure, but it is essential to plan it now, based on available resources, rather than try to restore some of the connections after they are lost [45]. Restoration typically costs more than preservation [46,47].
All of the data were prepared by using QGIS programming, which—in line with licensing provisions—may be used in public administration on an open-source basis. In public administration, this represents a key feature that supports the drawing-up of studies, using free datasets and open programming.
2.4. Indicators Used in This Study
Urban green spaces are of key importance for the quality of life in towns and cities, but to benefit urban inhabitants the most, they need to be planned as a consistent system of green and blue infrastructure [2,48,49]. Among other things, this means that they need to be seen as a comprehensive system, comprising different types of green and blue spaces, hence our broad interpretation. To make sure that green space data for our case study towns are complete, we investigated the share of green space in total town area, the area of urban green space per inhabitant, the number of inhabitants per hectare of urban green space, and the shares of the different green space categories, all according to the different sources of data. The indices used in this study refer to the physical presence of urban green spaces, i.e., their availability [50]. This is a key aspect that is most often covered in the respective literature [51,52,53,54,55], compared to more advanced studies on the accessibility and attractiveness of urban green spaces [19].
3. Results
3.1. Share of Green Space in Town Areas
Our results show great differences between the identified share of green space in town areas, depending on the data source. Most visibly, the official data based on public statistics stand out as an outlier, indicating 3.5–5.7% of town areas covered by green space, while other sources of data reveal about 50–80% (Table 5).
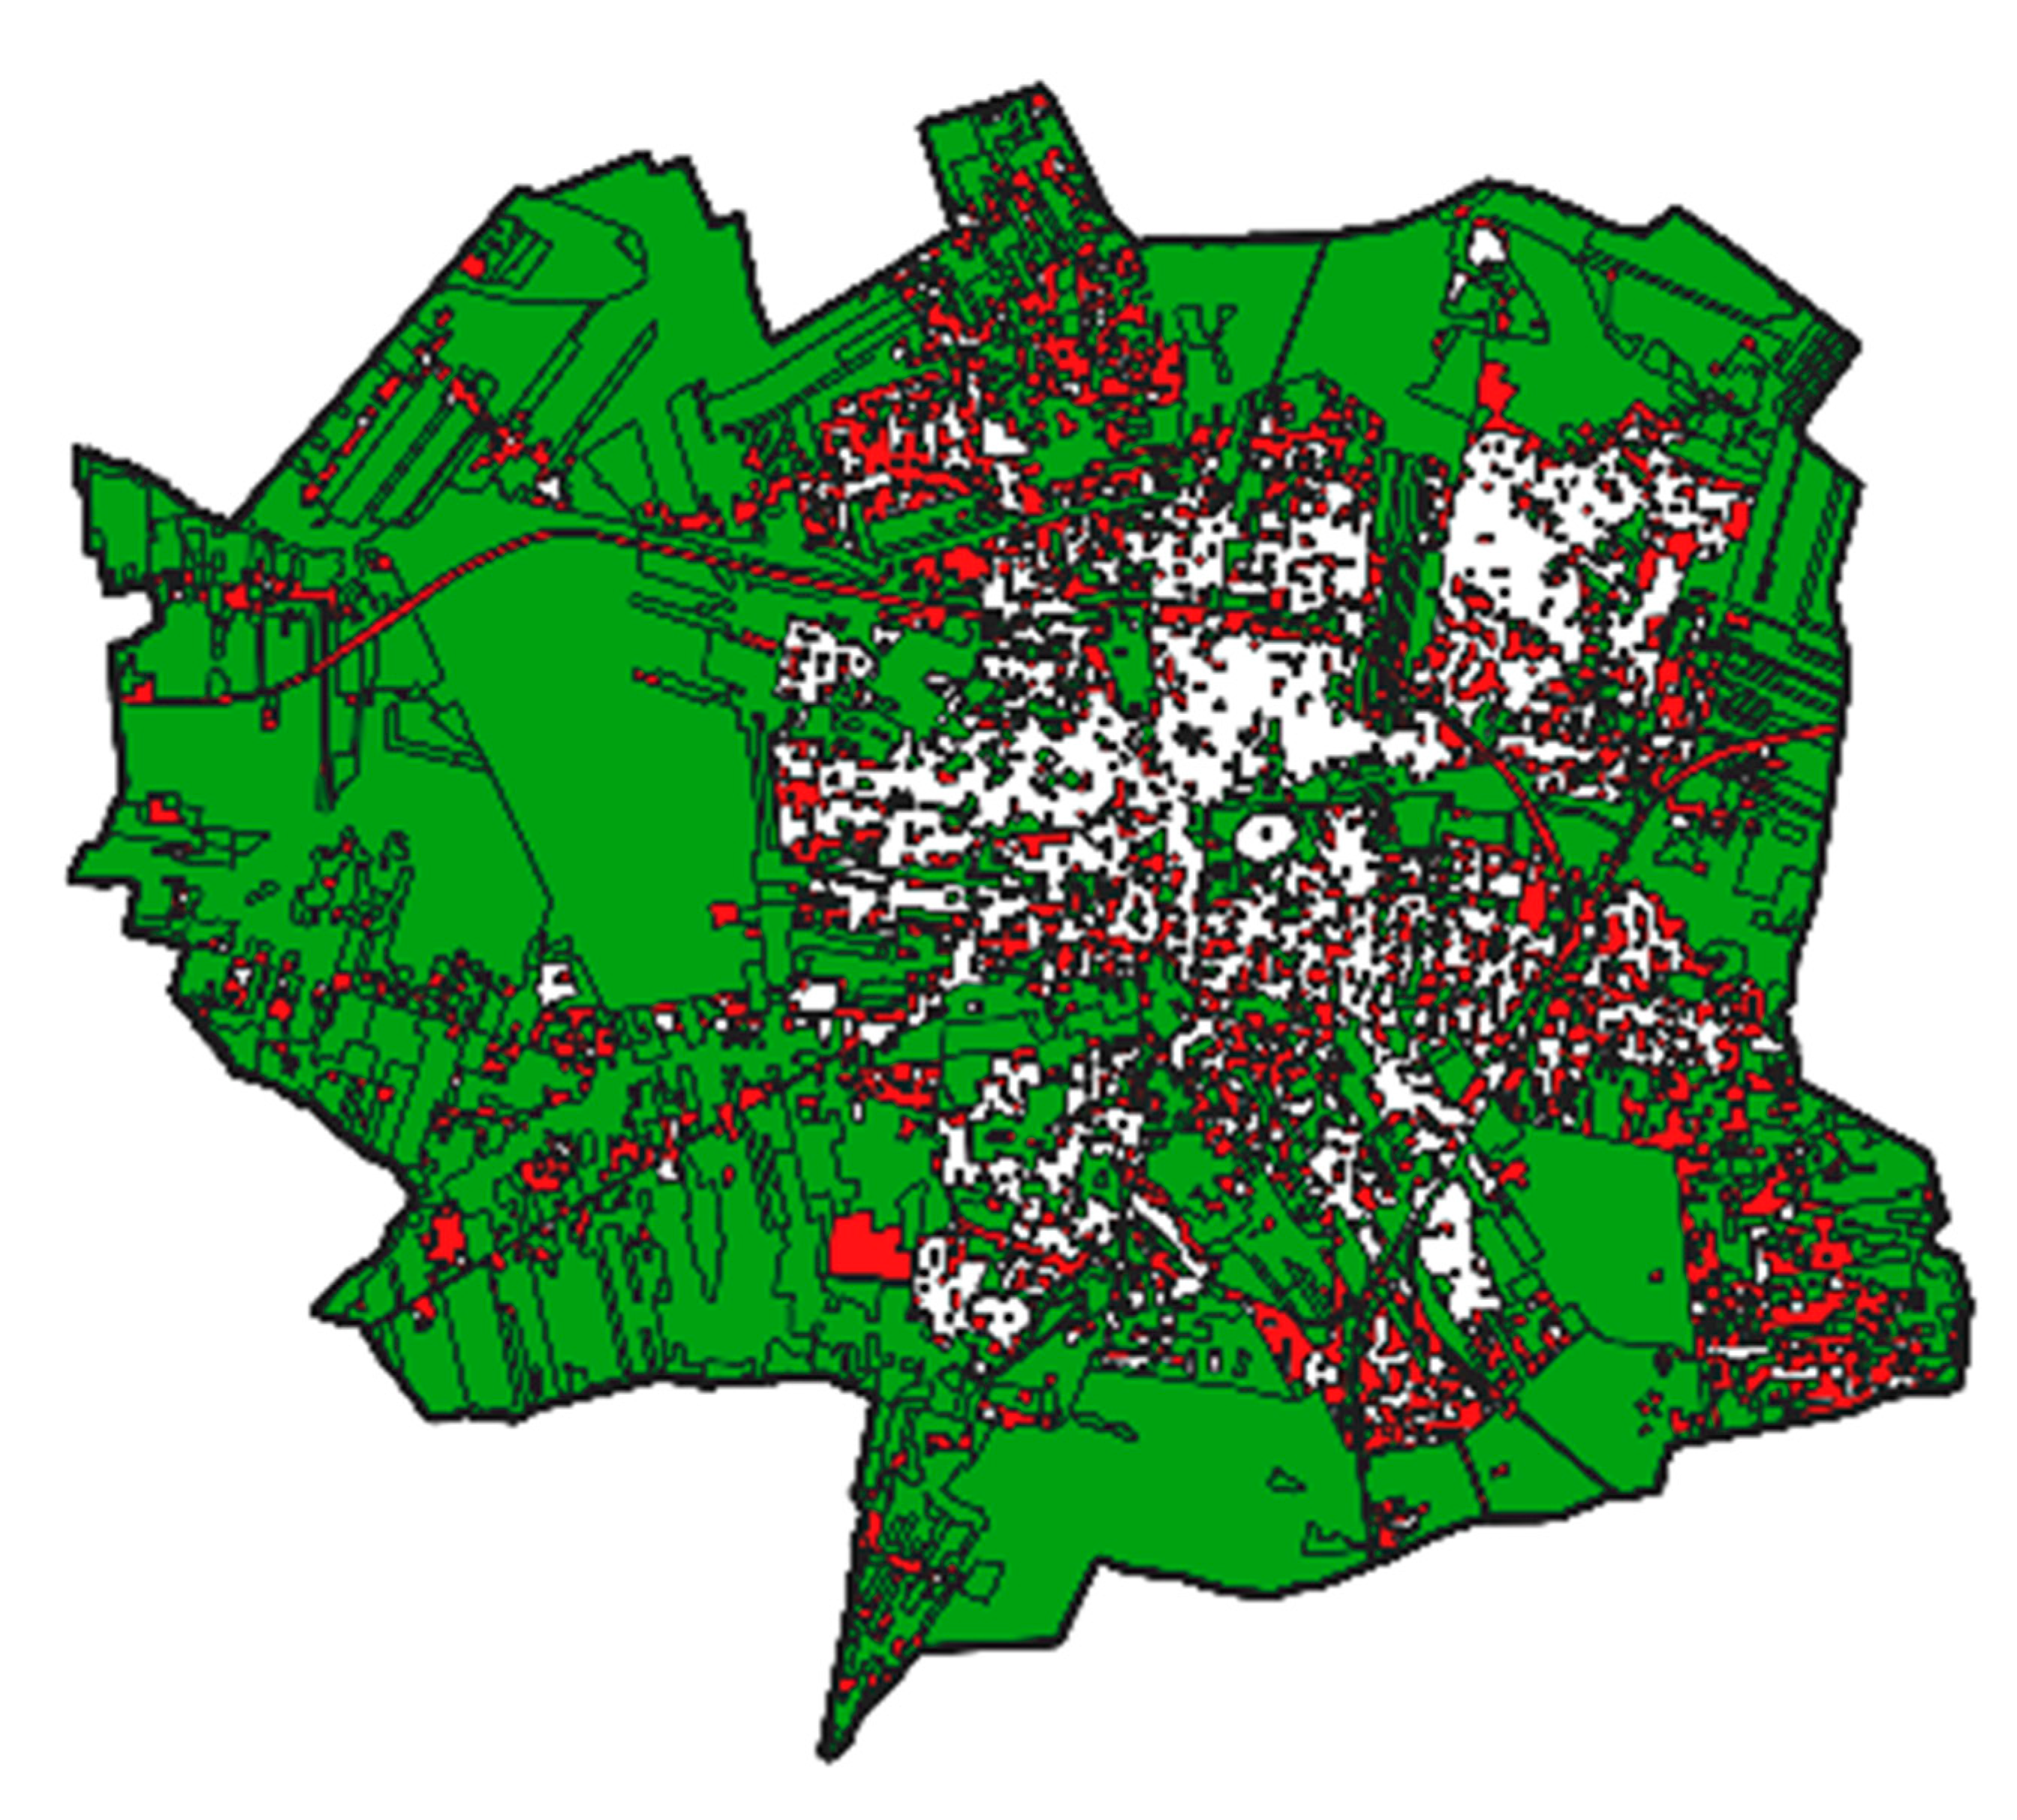
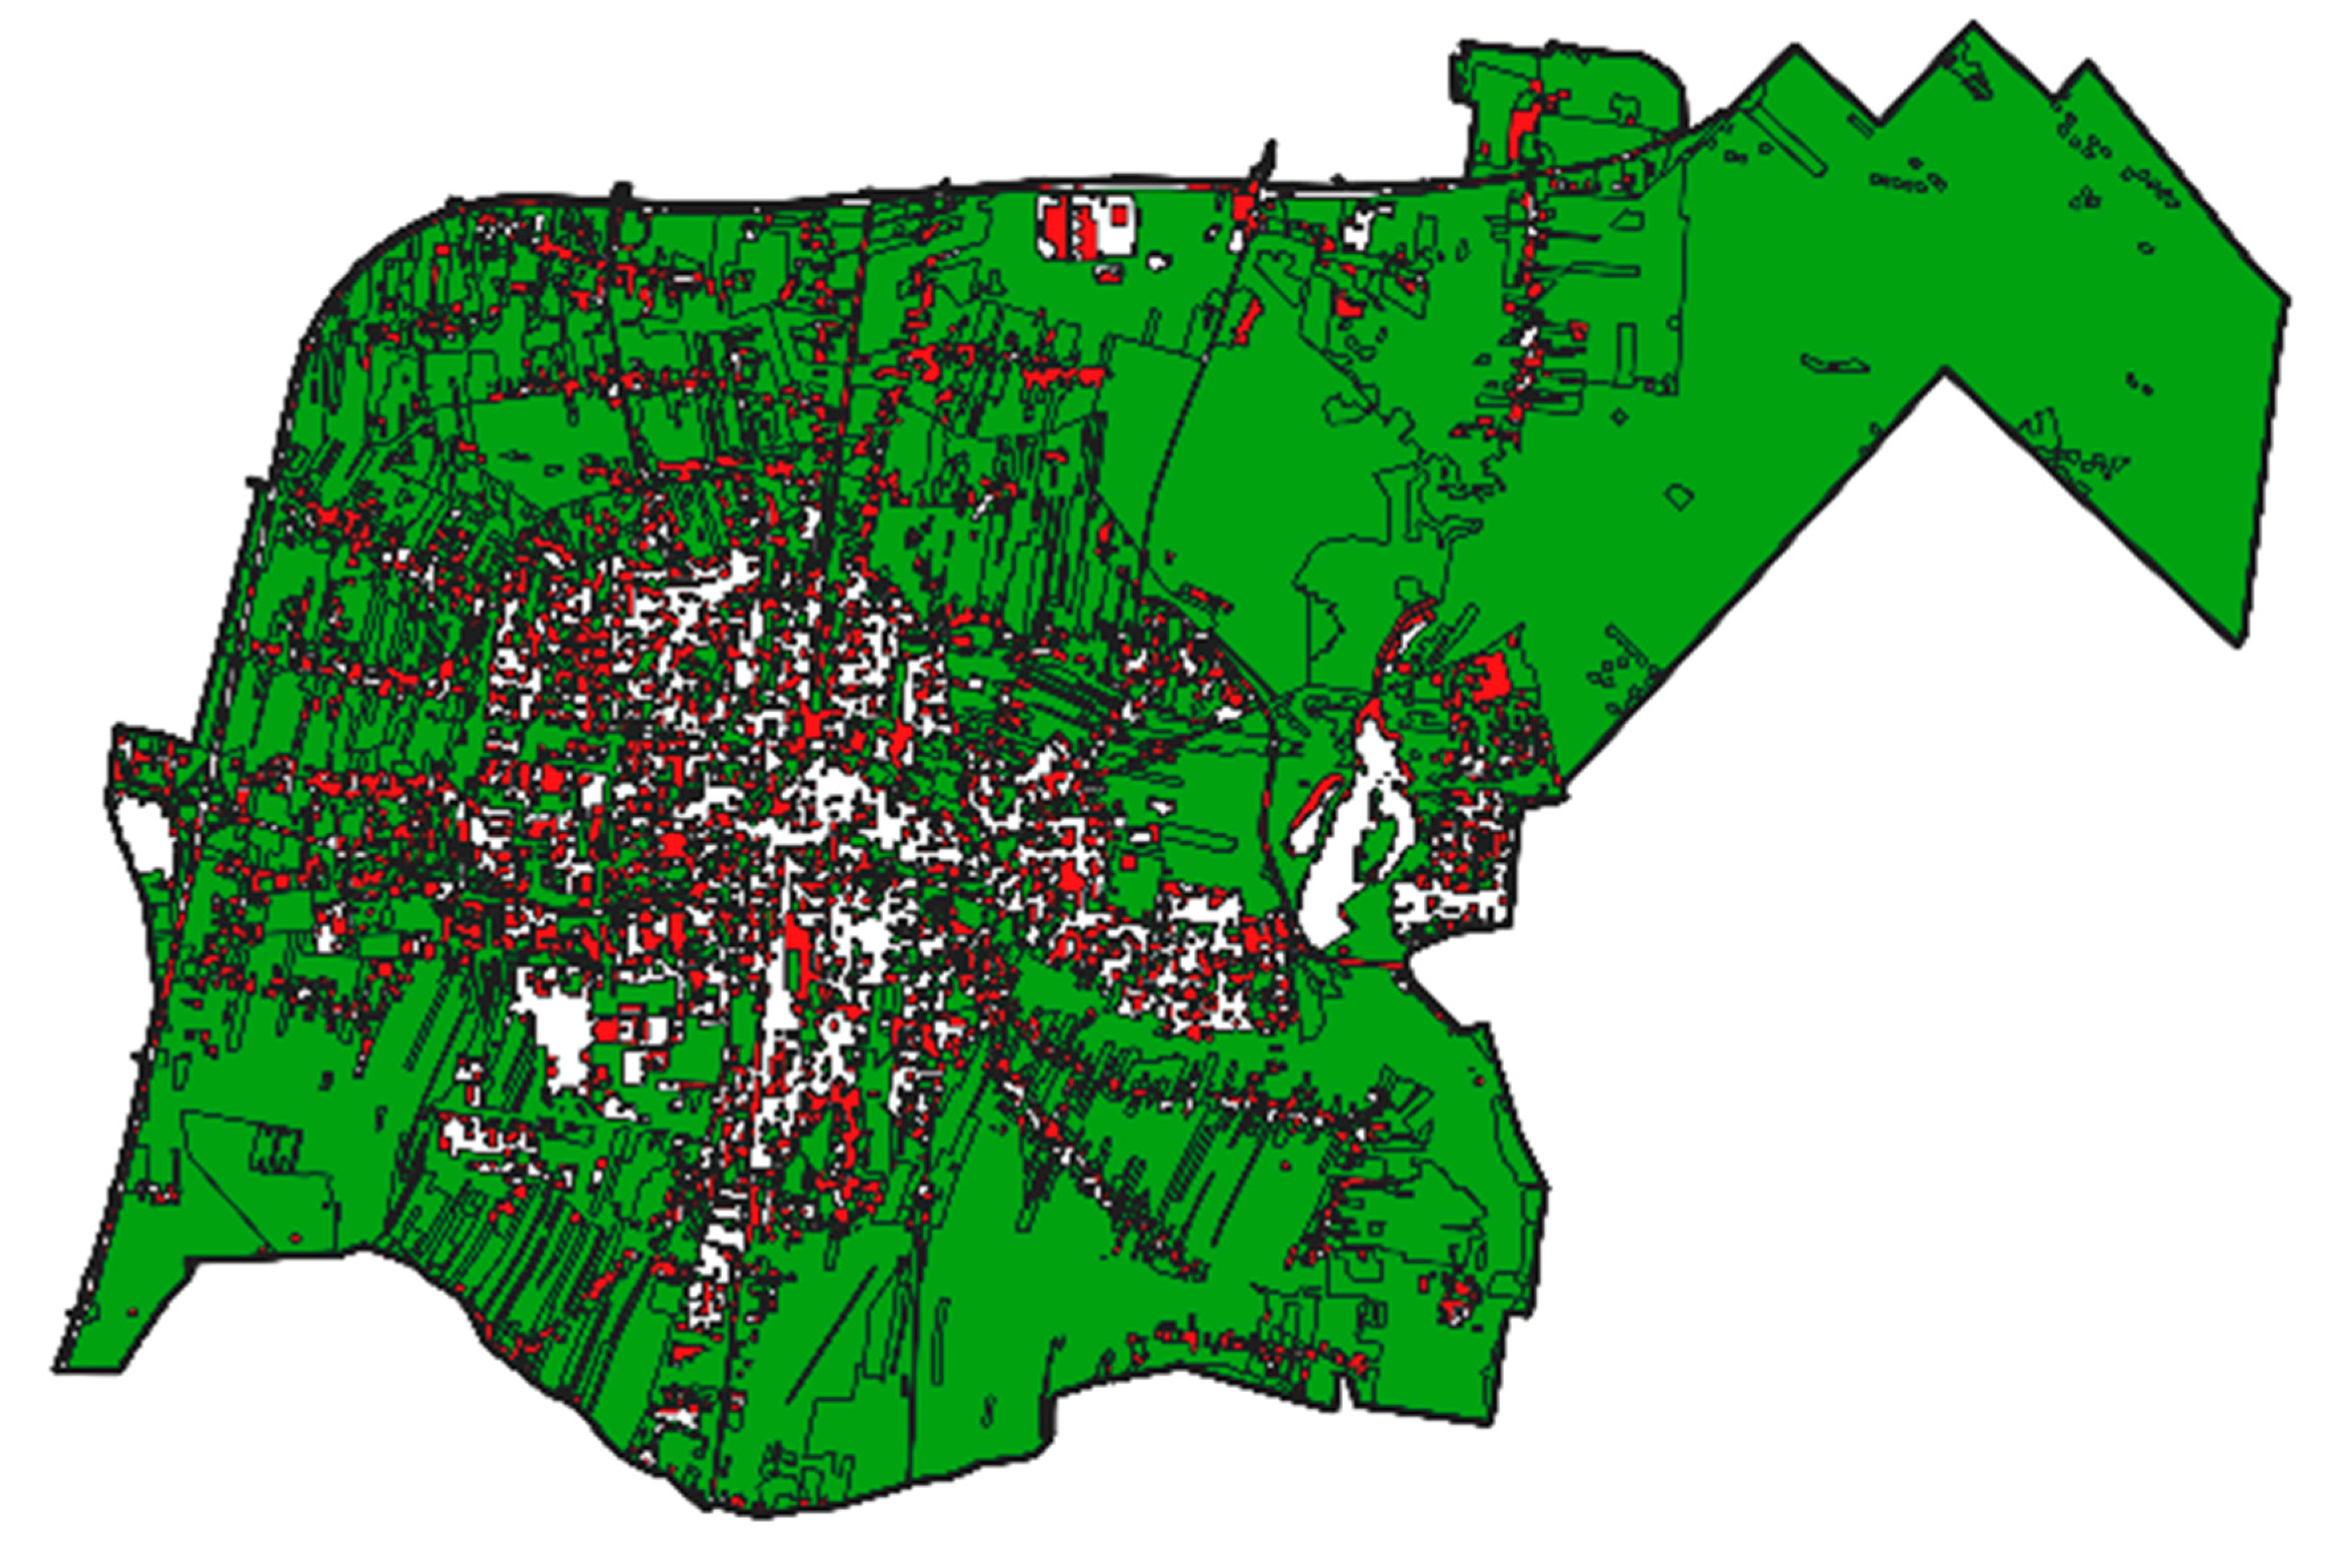
A comparison between the two most comprehensive datasets—land-use data (the BDOT10k) and the results of the supervised classification of Landsat 8 images—is shown in Table 6 and the figures in Appendix A and (in full resolution) in Supplementary Materials (S1–S5). Such differences in the sizes of areas of green space designated for the purposes of the study are from around four to over 20 percentage points of land that potentially represents urban green space, depending on which urban center is considered. The differences prove to be greater in towns that have a larger number of housing estates, as this kind of spatial configuration of a town allows for the noting of elements that may be categorized as urban green space, despite being located in housing-estates. The smallest difference between sources of data applied to Tomaszow Mazowiecki, which has a contiguous built-up area in the center, as well as a small number of settlements on the edges of the town. Ostrowiec Swietokrzyski and Piotrkow Trybunalski have similar spatial characteristics, while Pabianice and Zgierz are different, being towns bordering Lodz—the region’s capital and second-tier city—and subject to a great deal of urban sprawl.
3.2. Urban Green Space per Town Inhabitant
When it comes to the index of the area of urban green space per town inhabitant, it should be noted how the Statistics Poland data hardly correlated with the other measures obtained from different sources (correlation coefficient between 0.025 in the case of UA and BDOT10k, and 0.059 in the case of Landsat). This is also seen in the values of the indices in Table 7, where there is a visibly high level of correlation among the results obtained with UA, BDOT10k, and Landsat 8 data, for which the correlation coefficients exceed 0.97.
Similar results were obtained for the number of inhabitants per ha of urban green space. This reflected the way in which both indices were calculated by reference to the same data, i.e., the area of urban green space and the number of inhabitants (Table 8). For the number of inhabitants per ha of urban green space, the correlations between measures relating to UA, BDOT10k, and Landsat 8 had coefficients above 0.95. In contrast, the correlation between Statistics Poland data and those from the remaining sources is weak, given that the value for the coefficient does not exceed 0.3.
3.3. Predominant Green Space Categories
BDOT10k data provide the most comprehensive and consistent set of green space categories. A comparison of different green space categories (Table 9), according to BDOT10k, indicates that grassland (PTTR01) and arable land (PTTR02) constitute the most important green space categories in the studied towns, jointly representing from 35% of town area in Ostrowiec Swietokrzyski to 49% in Piotrkow Trybunalski. Forests (PTLZ01) yield an additional 11% (Pabianice) to 24% (Zgierz) of the town area.
UA data confirm the above dominance of arable land and pastures, jointly representing from 25% to 43% of town area (in Ostrowiec Swietokrzyski and Pabianice, respectively). According to UA data, forests constitute from 9.6% (in Pabianice) to 24% (in Zgierz) and 25% of the town area (in Ostrowiec Swietokrzyski and Piotrkow Trybunalski).
Meanwhile, data from public statistics neglect the above dominant categories of green spaces, focusing on publicly managed formal ones, among which residential green spaces represent the most important category (from 1% of the town area in Piotrkow Trybunalski and Zgierz, to 2.3% of the town area in Pabianice). Not only are grasslands and arable land not covered as urban green spaces according to public statistics, but also the understanding of forests is narrowed down to municipal ones, a category which shows a large discrepancy when compared to all forests considered in the other data sources.
4. Discussion
4.1. Synthesis of Results
There is a large discrepancy between what is considered “urban green space” according to public statistics (which influences formal management and conservation of the designated areas) and what constitutes a broader scope of urban green infrastructure based on other sources of data. The differences between public statistics and other types of data in the area of green space in the studied towns account for at least 45 percentage points of the town area. The dominance of agricultural land (grasslands and arable land) in the broadly understood green infrastructure means that, although these areas provide important ecosystem services (in particular, by influencing the microclimate), they are not protected as such, and their existence can be relatively easily terminated (as a result of further urban development).
When it comes to data sources alternative to public statistics, the most comprehensive identification of green space components in satellite imagery (Landsat 8) reflects the higher scale and greater accuracy provided by this source of data. A further advantage of the Landsat 8 data is the individualized approach to urban centers it allows, and hence the local knowledge that can be brought to bear in the form of supervised classification. Indeed, most recent studies indicate the necessity to rely on satellite imagery when analyzing urban green spaces, primarily because of its accuracy and availability of data over time for long time comparisons and for comparisons between different locations within a country or beyond [56,57,58]. Meanwhile, the BDOT10k land-use data, which is also typically more comprehensive than UA, are the easiest to obtain and use for most local users.
Analysis of the spatial data on urban green space (following its broader interpretation) indicates that the sizes of areas noted tend to be larger where the scale or resolution of satellite imagery or studies referred to is greater. A further factor is knowledge of the area under analysis, which is very important in identifying remnants of larger green space complexes that may still be present within block housing developments and thus rendered identifiable by supervised classification. This is true of both green spaces that play an “insulation” role and of areas between buildings. It proves especially important when it comes to establishing ROIs, allowing for the proper classification of different areas of space within a town.
4.2. Our Results in the Broader Context
Our results are in line with those of other studies carried out in Poland [23,24,55,59], obscuring the inadequacy of definitions adopted for the purposes of public statistics. In particular, when compared to the share of urban green spaces in all seventeen regional capitals in Poland [24], the present results indicate that the same problems with green space definitions and delineation affect green space management in smaller towns. Again, UA and BDOT10k offer much more appropriate datasets to account for what can be considered urban green infrastructure, compared to public statistics. The smaller size of third-tier towns means that most of such urban units are not covered by UA, which leaves BDOT10k as potentially the most important dataset available free of charge to all local authorities and other public bodies in Poland. Meanwhile, regular use of satellite imagery requires additional capacities that are typically not available in town administrations (see the following subsection).
It seems that the delineation of urban green spaces in third-tier towns is even more artificial than in larger cities, and that they include even more arable land, grasslands, and forests. This is partly due to the fact that they are typically closer to the countryside, as—unlike larger cities—they are not surrounded by extensive suburbs. Indeed, other authors have already called for the inclusion of agricultural areas into the systems or urban green infrastructure in Polish towns and cities [60]. All of the above is in line with studies that promote connecting urban areas with the surrounding landscape, acknowledging that urban areas are part of larger ecosystems that are vital for the quality of life of urban inhabitants [61,62]. Indeed, Pieńkowski et al. [61] suggested that planning urban green spaces should start with inventorying all green spaces within urban borders and in the nearest periphery, and then connecting urban ecosystems with the surrounding landscape.
Instead, formally unprotected green spaces in towns adjacent to larger urban centers are vulnerable to suburbanization, while the process of urban sprawl, characteristic of large centers, generates phenomena relating to changes of land use, even in areas not built-on, with free space among single-family or multi-family built-up areas also arising [63,64,65]. In the course of supervised classification, such a phenomenon can and must be taken note of. This phenomenon only attenuates in towns further from large urban centers, as confirmed by the results describing the “increase” in the area of urban green space noted when BDOT10k is compared with data from Landsat 8. This, in turn, reflects the less-dispersed nature of the built-up area and, in consequence, green space connectivity.
Problems of inadequate data on urban green space in smaller towns have also been observed in other countries. For example, studies carried out in South African towns, plagued by inadequate planning and governance systems, show—like our results for Polish towns—that there is much more green space there, beyond the narrowly defined public green spaces, and that, indeed, most green spaces escape the formal green space category and remain under private ownership [14].
With the present article, we echo the words of caution of Kendal et al. [11] that “care should be taken when extrapolating research findings from large global cities to smaller cities and cities in the developing world”. Indeed, the size of an urban area matters both for the inhabitants’ ability to access peri-urban green spaces and for the composition and character of the urban green spaces themselves. Finally, urban green spaces in both postsocialist and developing countries suffer from particular pressure and management challenges, especially when compared to urban areas in the most developed and the most studied contexts [66,67]. In particular, while the incremental loss of urban green space is a global phenomenon, present in towns and cities alike [68], the loss of unclassified green spaces is an even more pressing issue in urban areas worldwide—especially in postsocialist and developing countries—because of their large share in the urban area and the related importance from the point of view of delivering ecosystem services.
4.3. Urban Green Space Planning and Management Capacity
Given that data from public statistics depart considerably from those from the other sources, there is a great scope for interpretation by local authorities when making decisions pertaining to green space planning and management. The action taken by local authorities should strive to reflect reality as effectively as possible, both with regard to spatial data and in documents relating to physical development and spatial planning. Clearly, this brings about the issue of green space planning and management capacities.
A comparison of management practices and capacities in one town and four cities in Poland [16] indicates that, in the former, responsibilities related to green spaces are spread across several departments responsible for municipal management and built infrastructure, while, in the latter, these responsibilities tend to be centralized (however, only within the limits of the underlying definitions of green spaces adopted for the purposes of public statistics). Although town administrations—like city administrations—are obliged to prepare a number of policy and planning documents that focus on environmental protection, in towns, these documents typically do not cover urban green spaces (unlike in cities), as if green spaces were not even considered an important part of environmental management [16]. Finally, very few large cities in Poland have inventoried their green spaces or trees. This has not even been attempted in towns, except for specific parts of those towns where a significant number of trees are planned to be removed [16]. Clearly, green space management in towns faces even larger challenges than in cities because of scarce resources and management capacities [69]. Green space management in towns exhibits a larger gap between international policy rhetoric regarding the importance of urban green spaces and green infrastructure, and the local interpretation of these concepts [70]. In short, while challenges related to the use of green space data and the related management practices are similar in towns and cities, the same problems may be more serious in the case of towns, because of their limited institutional capacity to deal with these problems [11].
Meanwhile, in light of the broader analysis regarding urban green and blue space and enabling its benefits for inhabitants, it is crucial to strengthen the relevant institutions, including those formally responsible for the process [2]. Currently, local-government bodies typically enjoy free access to all the data presented in our analysis [24,71]. Indeed, the BDOT10k database is part of local resources used for planning purposes, anyway; it is up-to-date and reliable, and it could easily be adopted for green space management. However, for this purpose, the relevant authorities responsible for spatial planning need to be strengthened (this area is typically understaffed in Polish local authorities), and they need to collaborate closely with those responsible for urban green space management. Again, the use of BDOT10k data provides a good opportunity to make this happen, because these data are already well-known and used by planners. In contrast, the use of satellite imagery—although theoretically possible—would pose new challenges and require far more resources.
4.4. Further Research
Our comparison of green space data for five towns in Poland could be extended with the use of less precise CORINE (CO-oRdination of INformation on the Environment) data [72,73]. These are vector data, elaborated for the last time in 2018, and they are also accessible via the CLMS spatial database. The Corine Land Cover (CLC) data cover the whole area of 39 countries; hence, they extend far beyond the UA data. Indeed, the CLC data have already been used for large-scale green space comparisons among European cities [74,75]. These data could be used to increase the sample of urban areas in Poland or to compare urban green spaces explicitly in third-tier towns across Europe—in contrast to comparing larger towns and cities, which is possible based on the more precise UA data [52]. To ensure comparability with our results, the relevant CLC categories would need to include the following: artificial, non-agricultural vegetated areas (Code 141); arable land (Code 21); permanent crops (Code 22); pastures (Code 23); heterogeneous agricultural areas (Code 24); forests (Code 31); scrub and/or herbaceous vegetation associations (Code 32); open spaces with little or no vegetation (Code 33); and wetlands (Code 41).
The categories of urban green spaces identified in different sources of data are not compatible. This is especially noticeable with regard to data prepared in CLMS, as well as at the national level, where differences in categories of land cover assignable to urban green space are especially obvious [76]. In particular, at the local level, data related to green spaces should refer to all areas generating ecosystem services. The green space resource, regardless of the category and data source, should be comprehensive and linked to the present-day challenges of climate-change adaptation and urban resilience. Although this is a policy and planning issue, further research is also necessary on how to change the planners’ and urban authorities’ mindsets to cover urban green spaces more comprehensively and to translate the broad category of urban green space into urban green infrastructure.
Satellite imagery provides the ultimate resource available to study green spaces in and beyond urban areas, and it could also be used for further comparisons. However, to provide meaningful results, the images would need to be categorized into subgroups that would facilitate supervised classification. Although it is also possible to use satellite imagery for broader comparisons, it would be a far more laborious process, and even the regular use of such resources would exceed the capacities of most (if not all) local town administrations in Poland, at least for the time being.
Finally, further research should focus on how the availability of urban green spaces in Polish towns changes over time. Given the numerous institutional challenges [66,77,78], one might expect that the situation is deteriorating, especially if most green spaces are still narrowly interpreted and not formally protected, as highlighted in the present study.
5. Conclusions
The comparison of different datasets that feature data on urban green spaces indicates that, especially in the case of the most broadly used public statistics data, the underlying definitions need to be adjusted to cover UGS more comprehensively and to account for green infrastructure. The comparison highlights the variability of, as well as the correlations between data of different origins, with consistent regularities distinguishing the different datasets. The potential resource of urban green spaces—especially when considered through the lens of urban green infrastructure—clearly looks different depending on which data source is used. Unfortunately, local authorities in the urban centers studied here typically come up with management practices and documents that confine their attention to official statistical data on “urban green spaces”, i.e., the dataset of the most limited cognitive value. In contrast, BDOT10k data, shown here to be of high informational value and genuinely allowing for the development of knowledge on urban green spaces, are not used for urban-green space management. Satellite imagery, shown here with the example of data from Landsat 8, is also characterized by greater information content, although it requires a workload that is typically beyond the reach of town administrations in Poland. The data collected show huge potential and the need to complement existing narrowly understood green spaces with new ones, especially before it is too late to do so because of further development pressure.
Supplementary Materials
The following are available online at https://0-www-mdpi-com.brum.beds.ac.uk/2073-445X/9/11/453/s1. Five full resolution maps shown in the Appendix A (comparing spatial data originating from BDOT10k and from the supervised classification of Landsat 8 imagery) (S1–S5).
Author Contributions
Conceptualization, M.F. and J.K.; data curation, M.F.; formal analysis, M.F.; methodology, M.F.; resources, M.F.; software, M.F.; visualization, M.F.; writing—original draft, M.F.and J.K.; writing—review and editing, M.F. and J.K. All authors have read and agreed to the published version of the manuscript.
Funding
This research was funded through the 2015–2016 BiodivERsA COFUND call for research proposals, by the national funders: the Swedish Research Council for Environment, Agricultural Sciences, and Spatial Planning, the Swedish Environmental Protection Agency, the German Aeronautics and Space Research Centre, the National Science Centre (Poland) (grant no. 2016/22/Z/NZ8/00003), the Research Council of Norway, and the Spanish Ministry of Economy and Competitiveness.
Acknowledgments
Some desk research analysis was carried out within the MINIATURA 3 project, funded by the National Science Centre (Poland) entitled Evidence-based spatial planning—sources of greenery data in cities (grant no. 2019/03/X/HS4/00060).
Conflicts of Interest
The authors declare no conflict of interest. The funders had no role in the design of the study, in the collection, analyses, or interpretation of data, in the writing of the manuscript, or in the decision to publish the results.
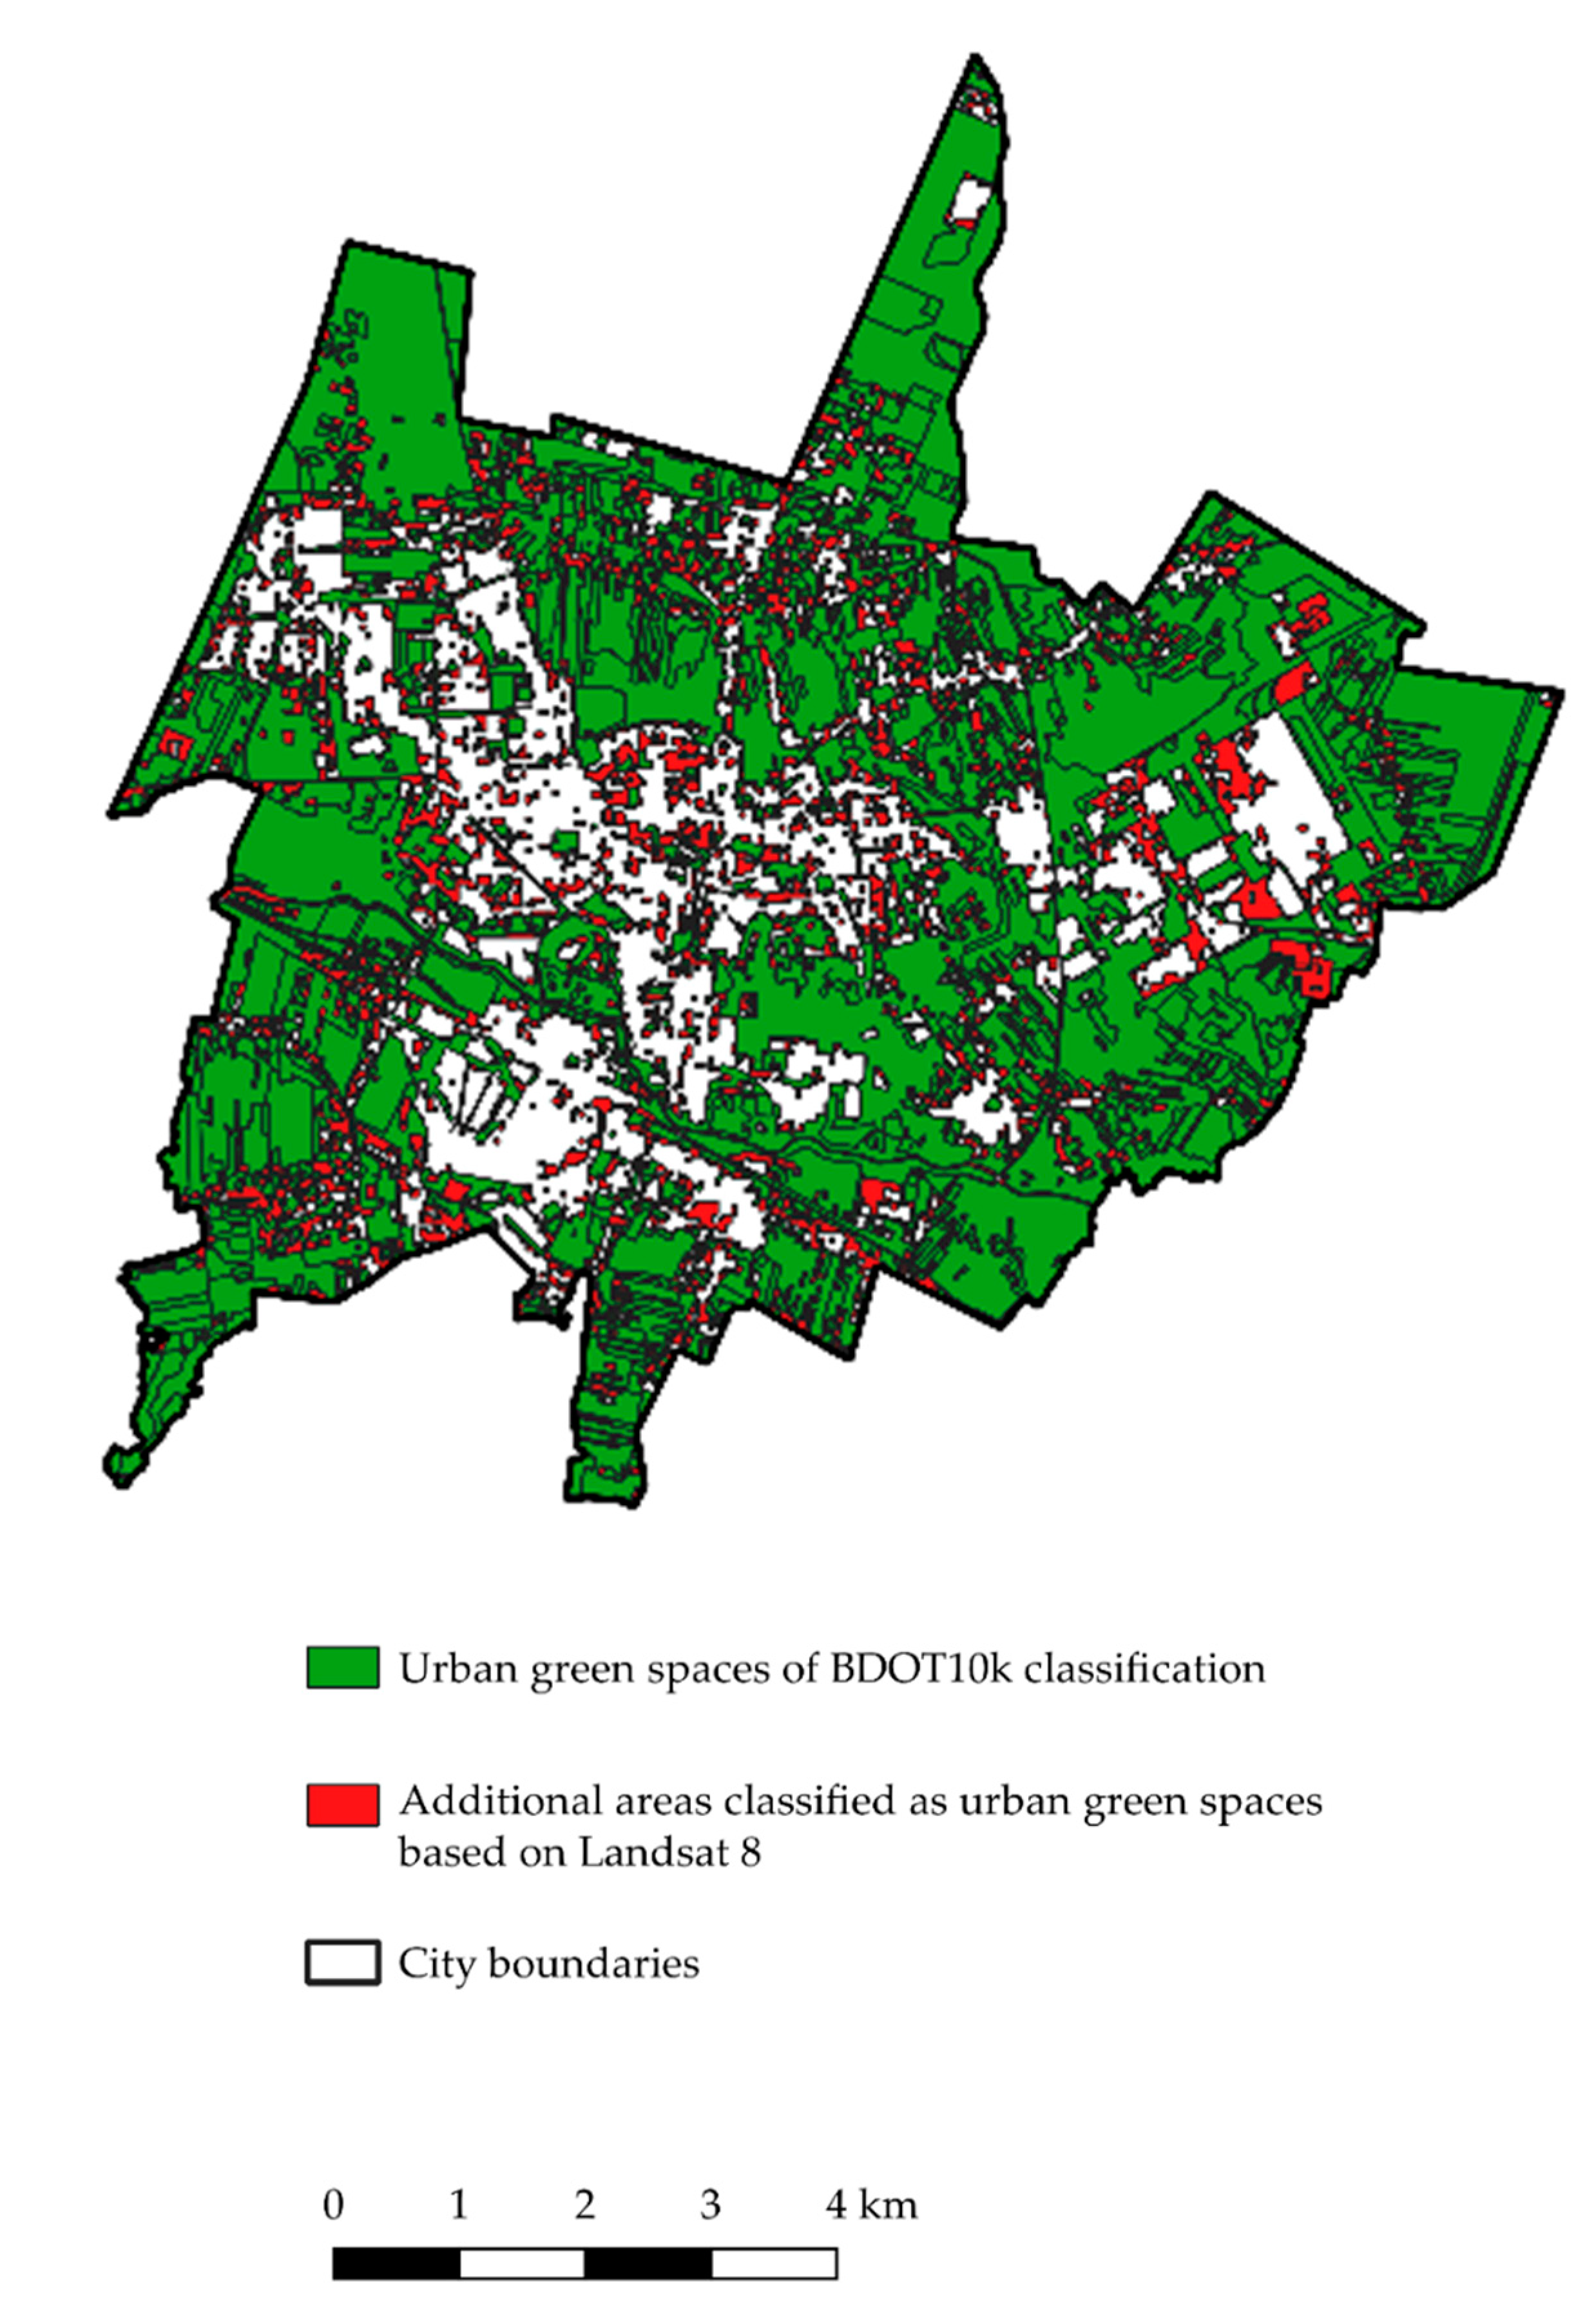
Appendix A
Comparison of spatial data originating from BDOT10k and from the supervised classification of Landsat 8 imagery. Full resolution maps are available as Supplementary Materials.
Figure A1.
Ostrowiec Swietokrzyski—comparison of spatial data originating from BDOT10k and from the supervised classification of Landsat 8 imagery.
Figure A1.
Ostrowiec Swietokrzyski—comparison of spatial data originating from BDOT10k and from the supervised classification of Landsat 8 imagery.

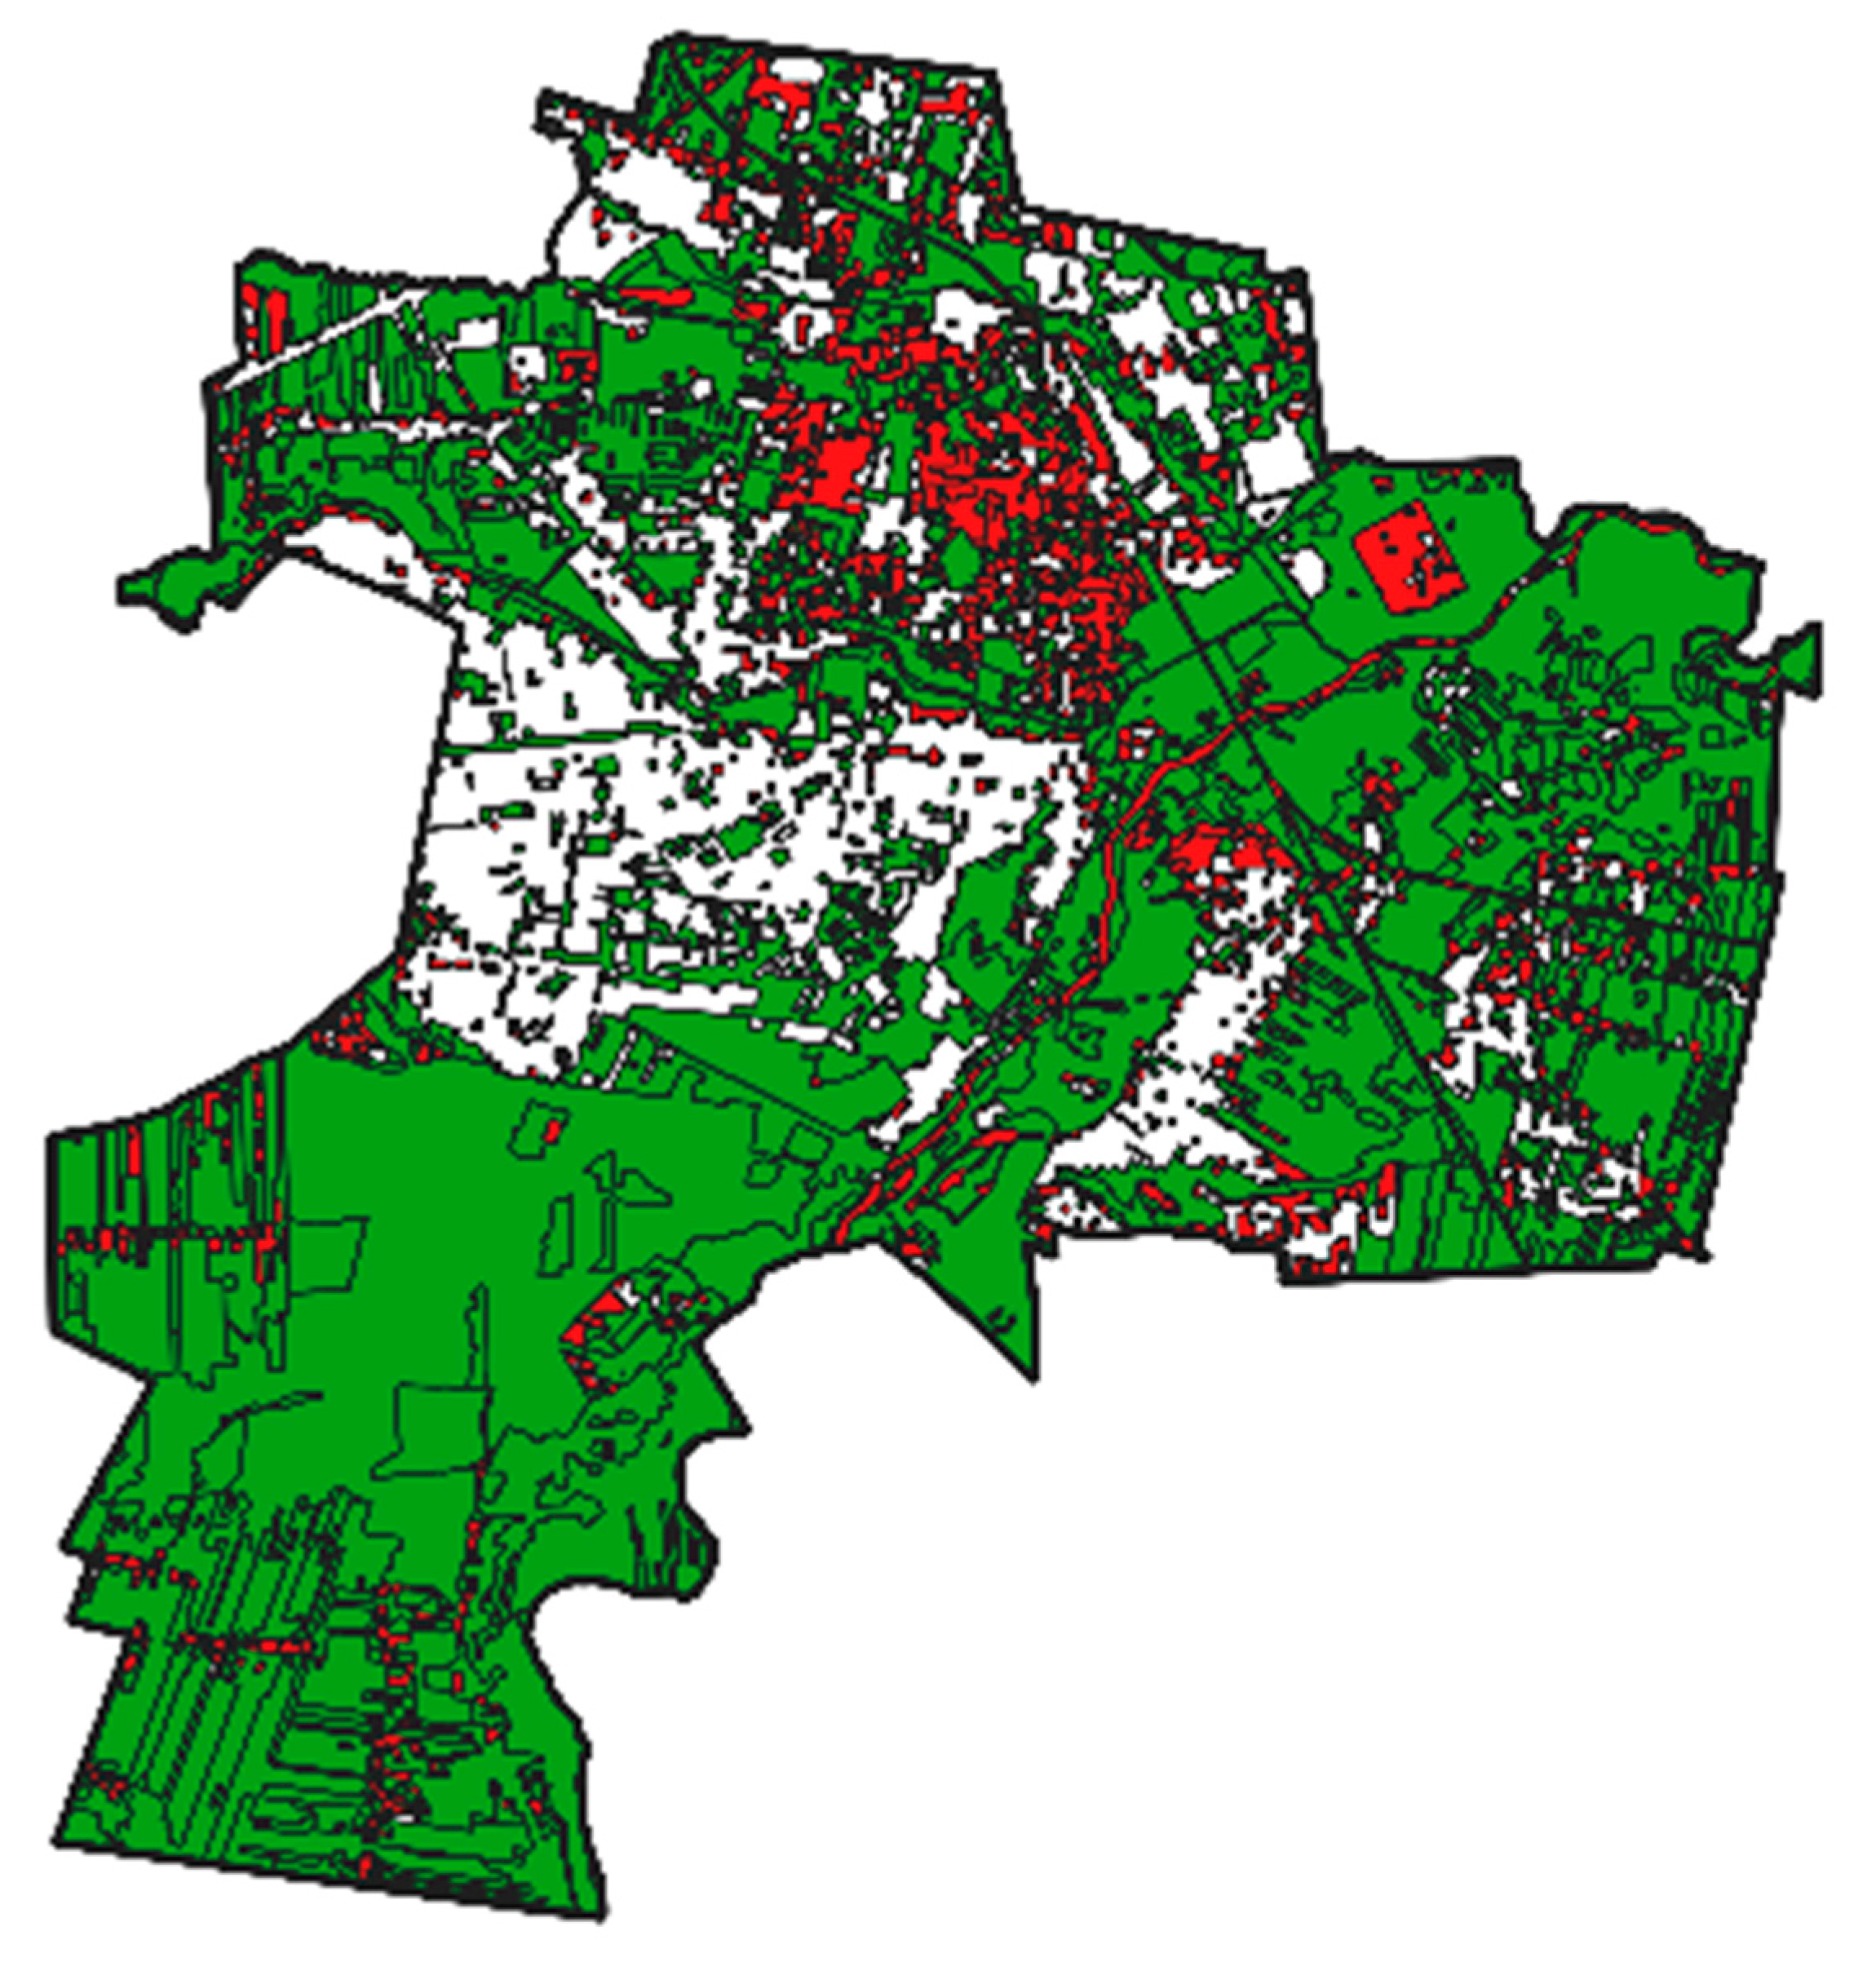
Figure A2.
Tomaszow Mazowiecki—comparison of spatial data originating from BDOT10k and from the supervised classification of Landsat 8 imagery (for legend, see Figure A1).
Figure A2.
Tomaszow Mazowiecki—comparison of spatial data originating from BDOT10k and from the supervised classification of Landsat 8 imagery (for legend, see Figure A1).

Figure A3.
Pabianice—comparison of spatial data originating from BDOT10k and from the supervised classification of Landsat 8 imagery (for legend, see Figure A1).
Figure A3.
Pabianice—comparison of spatial data originating from BDOT10k and from the supervised classification of Landsat 8 imagery (for legend, see Figure A1).

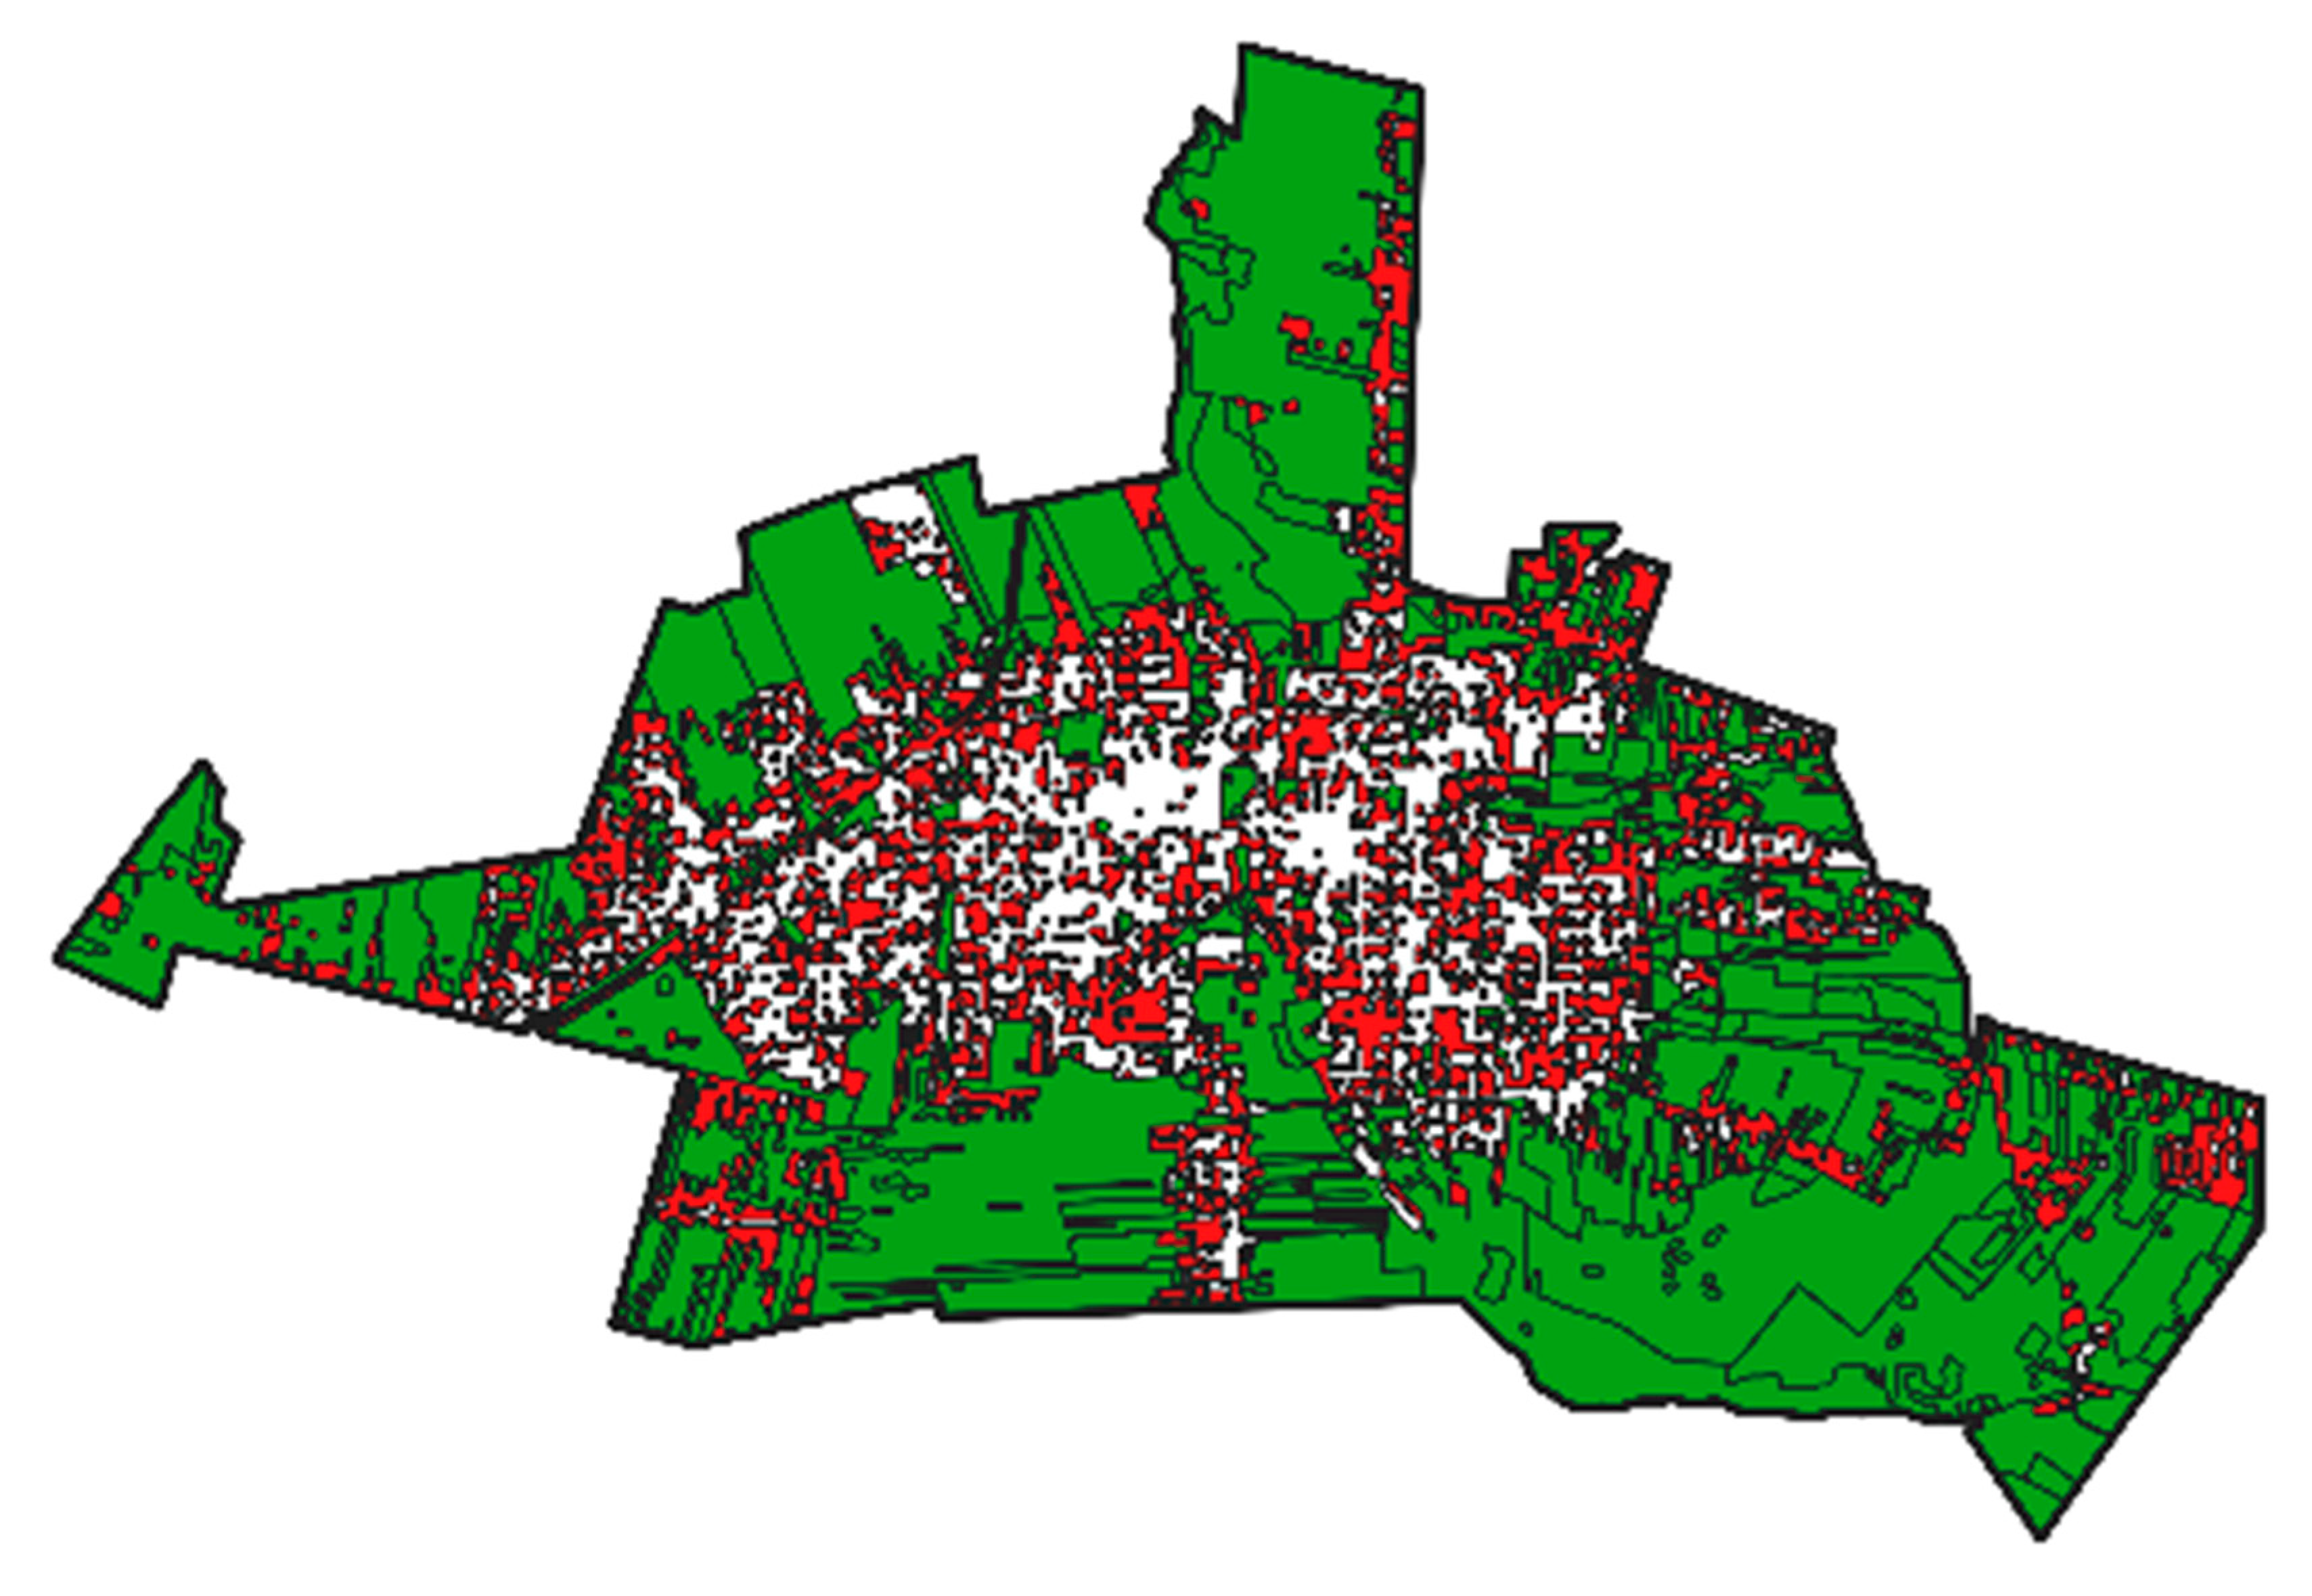
Figure A4.
Zgierz—comparison of spatial data originating from BDOT10k and from the supervised classification of Landsat 8 imagery (for legend, see Figure A1).
Figure A4.
Zgierz—comparison of spatial data originating from BDOT10k and from the supervised classification of Landsat 8 imagery (for legend, see Figure A1).

Figure A5.
Piotrkow Trybunalski—comparison of spatial data originating from BDOT10k and from the supervised classification of Landsat 8 imagery (for legend, see Figure A1).
Figure A5.
Piotrkow Trybunalski—comparison of spatial data originating from BDOT10k and from the supervised classification of Landsat 8 imagery (for legend, see Figure A1).

References
- Elmqvist, T.; Fragkias, M.; Goodness, J.; Güneralp, B.; Marcotullio, P.J.; McDonald, R.I.; Parnell, S.; Schewenius, M.; Sendstad, M.; Seto, K.C.; et al. Urbanization, Biodiversity and Ecosystem Services: Challenges And Opportunities; Springer: Dordrecht, The Netherlands, 2013; ISBN 978-94-007-7087-4. [Google Scholar]
- Andersson, E.; Langemeyer, J.; Borgström, S.; McPhearson, T.; Haase, D.; Kronenberg, J.; Barton, D.N.; Davis, M.; Naumann, S.; Röschel, L.; et al. Enabling green and blue infrastructure to improve contributions to human well-being and equity in urban systems. BioScience 2019, 69, 566–574. [Google Scholar] [CrossRef] [PubMed]
- Stigsdotter, U.K.; Urban Green Space and Health Related Quality of Life. Cheonen International Conference Citizens’ Quality of Life. 2012, pp. 91–108. Available online: http://curis.ku.dk/ws/files/45861594/Stigsdotter_2012.pdf (accessed on 14 November 2020).
- Peschardt, K.K.; Stigsdotter, U.K. Associations between park characteristics and perceived restorativeness of small public urban green spaces. Landsc. Urban Plan. 2013, 112, 26–39. [Google Scholar] [CrossRef]
- Baycan-Levent, T.; Nijkamp, P. Planning and management of urban green spaces in Europe: Comparative analysis. J. Urban Plan. Dev. 2009, 135, 1–12. [Google Scholar] [CrossRef]
- Haaland, C.; van den Bosch, C.K. Challenges and strategies for urban green-space planning in cities undergoing densification: A review. Urban For. Urban Green. 2015, 14, 760–771. [Google Scholar] [CrossRef]
- Bowler, D.E.; Buyung-Ali, L.; Knight, T.M.; Pullin, A.S. Urban greening to cool towns and cities: A systematic review of the empirical evidence. Landsc. Urban Plan. 2010, 97, 147–155. [Google Scholar] [CrossRef]
- Charlesworth, S.M.; Booth, C.A. The Benefits of Green Infrastructure in Towns and Cities. In Solutions for Climate Change Challenges in the Built Environment; Booth, C.A., Hammond, F., Lamond, J., Proverbs, D., Eds.; Wiley-Blackwell: Chichester, UK, 2012; pp. 163–180. [Google Scholar]
- Pauleit, S.; Slinn, P.; Handley, J.; Lindley, S. Promoting the natural greenstructure of towns and cities: English Nature’s Accessible Natural Greenspace Standards model. Built Environ. 2003, 29, 157–170. [Google Scholar] [CrossRef]
- Swanwick, C.; Dunnett, N.; Woolley, H. Nature, Role and Value of Green Space in Towns and Cities: An Overview. Built Environ. 2003, 29, 94–106. [Google Scholar] [CrossRef]
- Kendal, D.; Egerer, M.; Byrne, J.A.; Jones, P.J.; Marsh, P.; Threlfall, C.G.; Allegretto, G.; Kaplan, H.; Nguyen, H.; Pearson, S.; et al. City-size bias in knowledge on the effects of urban nature on people and biodiversity. Env. Res. Lett. 2020. [Google Scholar] [CrossRef]
- Luederitz, C.; Brink, E.; Gralla, F.; Hermelingmeier, V.; Meyer, M.; Niven, L.; Panzer, L.; Partelow, S.; Rau, A.-L.; Sasaki, R.; et al. A review of urban ecosystem services: Six key challenges for future research. Ecosyst. Serv. 2015, 14, 98–112. [Google Scholar] [CrossRef] [Green Version]
- McConnachie, M.; Shackleton, C.M. Public green space inequality in small towns in South Africa. Habitat Int. 2010, 34, 244–248. [Google Scholar] [CrossRef] [Green Version]
- Shackleton, C.M.; Blair, A.; De Lacy, P.; Kaoma, H.; Mugwagwa, N.; Dalu, M.T.; Walton, W. How important is green infrastructure in small and medium-sized towns? Lessons from South Africa. Landsc. Urban Plan. 2018, 180, 273–281. [Google Scholar] [CrossRef]
- Eurostat. Urban Europe—Statistics on Cities, Towns and Suburbs; Publications office of the European Union: Luxembourg, 2016. [Google Scholar]
- Biejat, K. Zarządzanie Oraz Ochrona Zieleni W Polskich Miastach; Fundacja Sendzimira: Warsaw, Poland, 2018. (In Polish) [Google Scholar]
- Fongar, C.; Randrup, T.B.; Wiström, B.; Solfjeld, I. Public urban green space management in Norwegian municipalities: A managers’ perspective on place-keeping. Urban For. Urban Green. 2019, 44, 126438. [Google Scholar] [CrossRef]
- Statistics Poland. Concise Statistical Yearbook of Poland; Statistics Poland: Warsaw, Poland, 2020.
- Biernacka, M.; Kronenberg, J.; Łaszkiewicz, E. An integrated system of monitoring the availability, accessibility and attractiveness of urban parks and green squares. Appl. Geogr. 2020, 116, 102152. [Google Scholar] [CrossRef]
- Kronenberg, J.; Krauze, K.; Wagner, I. Focusing on ecosystem services in the multiple social-ecological transitions of Lodz. In Urban Sustainability Transitions; Frantzeskaki, N., Castan Broto, V., Coenen, L., Loorbach, D., Eds.; Routledge: London, UK; New York, NY, USA, 2017; pp. 331–345. [Google Scholar]
- Łaszkiewicz, E.; Czembrowski, P.; Kronenberg, J. Creating a map of social functions of urban green spaces in a city with poor availability of spatial data—Sociotope for Lodz. Land 2020, 9, 183. [Google Scholar] [CrossRef]
- Pietrzyk-Kaszyńska, A.; Czepkiewicz, M.; Kronenberg, J. Eliciting non-monetary values of formal and informal urban green spaces using public participation GIS. Landsc. Urban Plan. 2017, 160, 85–95. [Google Scholar] [CrossRef]
- Szulczewska, B.; Kaliszuk, E. Challenges in the planning and management of “Greenstructure” in Warsaw, Poland. Built Environ. 2003, 29, 144–156. [Google Scholar] [CrossRef]
- Feltynowski, M.; Kronenberg, J.; Bergier, T.; Kabisch, N.; Łaszkiewicz, E.; Strohbach, M. Challenges of urban green space management in the face of using inadequate data. Urban For. Urban Green. 2018, 31, 56–66. [Google Scholar] [CrossRef]
- Lipińska, H.; Łojek, A.; Kościk, S. Ecosystem services of street trees on the example of Puławy. Archit. Kraj. 2017, 56, 44–67. [Google Scholar] [CrossRef]
- Chmielewski, P.J.; Wysocka, P.; Matczak, P.; Mączka, K.; Krzyżyńska, H. Connection between ecosystem services of woody plants in the municipality of Czerwonak and administrative decisions on felling trees and shrubs. Ekon. I Środowisko 2016, 59, 223–234. [Google Scholar]
- Łowicki, D.; Piotrowska, S. Monetary valuation of road noise. Residential property prices as an indicator of the acoustic climate quality. Ecol. Indic. 2015, 52, 472–479. [Google Scholar] [CrossRef]
- Statistics Poland. Local Data Bank. 2020. Available online: https://bdl.stat.gov.pl/BDL/start (accessed on 5 October 2020).
- Sikorska, D.; Łaszkiewicz, E.; Krauze, K.; Sikorski, P. The role of informal green spaces in reducing inequalities in urban green space availability to children and seniors. Environ. Sci. Policy 2020, 108, 144–154. [Google Scholar] [CrossRef]
- Moreno, A.J.P.; De Larriva, J.E.M. Comparison between new digital image classification methods and traditional methods for land-cover mapping. In Remote Sensing of Land Use and Land Cover. Principles and Applications; Giri, C.P., Ed.; CRC Press: Boca Raton, FL, USA, 2012; pp. 137–152. [Google Scholar]
- Piech, I.; Drozdz, B. Obrazy satelitarne jako źródło informacji o krajobrazie. Infrastrukt. I Ekol. Teren. Wiej. 2010, 3, 41–54. (In Polish) [Google Scholar]
- Tso, B.; Mather, P. Classification Methods for Remotely Sensed Data; CRC Press: Boca Raton, FL, USA, 2016; ISBN 978-1-4200-9074-1. [Google Scholar]
- Boulton, C.; Dedekorkut-Howes, A.; Byrne, J. Factors shaping urban greenspace provision: A systematic review of the literature. Landsc. Urban Plan. 2018, 178, 82–101. [Google Scholar] [CrossRef]
- Taylor, L.; Hochuli, D.F. Defining greenspace: Multiple uses across multiple disciplines. Landsc. Urban Plan. 2017, 158, 25–38. [Google Scholar] [CrossRef] [Green Version]
- Kronenberg, J.; Łaszkiewicz, E.; Sziło, J. Voting with one’s chainsaw: What happens when people are given the opportunity to freely remove urban trees? Landsc. Urban Plan. 2020. forthcoming. [Google Scholar]
- Green, T.L.; Kronenberg, J.; Andersson, E.; Elmqvist, T.; Gómez-Baggethun, E. Insurance value of green infrastructure in and around cities. Ecosystems 2016, 19, 1051–1063. [Google Scholar] [CrossRef] [Green Version]
- Peroni, F.; Pristeri, G.; Codato, D.; Pappalardo, S.E.; De Marchi, M. Biotope Area Factor: An Ecological Urban Index to Geovisualize Soil Sealing in Padua, Italy. Sustainability 2020, 12, 150. [Google Scholar] [CrossRef] [Green Version]
- Kim, M.; Rupprecht, C.D.D.; Furuya, K. Residents’ perception of informal green space—A case study of Ichikawa City, Japan. Land 2018, 7, 102. [Google Scholar] [CrossRef] [Green Version]
- Rupprecht, C.; Byrne, J.A. Informal urban greenspace: A typology and trilingual systematic review of its role for urban residents and trends in the literature. Urban For. Urban Green. 2014, 13, 597–611. [Google Scholar] [CrossRef] [Green Version]
- Włodarczyk-Marciniak, R.; Sikorska, D.; Krauze, K. Residents’ awareness of the role of informal green spaces in a post-industrial city, with a focus on regulating services and urban adaptation potential. Sustain. Cities Soc. 2020, 59, 102236. [Google Scholar] [CrossRef]
- European Union. Mapping guide for a European Urban Atlas; European Commission: Brussels, Belgium, 2016. [Google Scholar]
- Rozporządzenie Ministra Administracji i Cyfryzacji z Dnia 2 Listopada 2015 r. w Sprawie Bazy Danych Obiektów Topograficznych Oraz Mapy Zasadniczej. Dz. Ustaw. 2015; Volume 2028, pp. 1–332. Available online: http://isap.sejm.gov.pl/isap.nsf/DocDetails.xsp?id=WDU20150002028 (accessed on 14 November 2020). (In Polish)
- Breuste, J.; Haase, D.; Elmqvist, T. Urban landscapes and ecosystem services. In Ecosystem Services in Agricultural and Urban Landscapes; Wratten, S., Sandhu, H., Cullen, R., Costanza, R., Eds.; John Wiley & Sons: Hoboken, NJ, USA, 2013; pp. 83–104. ISBN 978-1-118-50627-1. [Google Scholar]
- Haase, D.; Schwarz, N.; Strohbach, M.; Kroll, F.; Seppelt, R. Synergies, trade-offs, and losses of ecosystem services in urban regions: An integrated multiscale framework applied to the Leipzig-Halle Region, Germany. Ecol. Soc. 2012, 17, 22. [Google Scholar] [CrossRef]
- Rudd, H.; Vala, J.; Schaefer, V. Importance of Backyard Habitat in a Comprehensive Biodiversity Conservation Strategy: A Connectivity Analysis of Urban Green Spaces. Restor. Ecol. 2002, 10, 368–375. [Google Scholar] [CrossRef] [Green Version]
- Elmqvist, T.; Setälä, H.; Handel, S.N.; van der Ploeg, S.; Aronson, J.; Blignaut, J.N.; Gómez-Baggethun, E.; Nowak, D.J.; Kronenberg, J.; De Groot, R.S. Benefits of restoring ecosystem services in urban areas. Curr. Opin. Environ. Sustain. 2015, 14, 101–108. [Google Scholar] [CrossRef] [Green Version]
- Mills, J.G.; Weinstein, P.; Gellie, N.J.C.; Weyrich, L.S.; Lowe, A.J.; Breed, M.F. Urban habitat restoration provides a human health benefit through microbiome rewilding: The Microbiome Rewilding Hypothesis. Restor. Ecol. 2017, 25, 866–872. [Google Scholar] [CrossRef] [Green Version]
- Brears, R.C. Blue and Green Cities: The Role of Blue-Green Infrastructure in Managing Urban Water Resources; Springer: Berlin/Heidelberg, Germany, 2018; ISBN 978-1-137-59258-3. [Google Scholar]
- Sinnett, D.; Smith, N.; Burgess, S. Handbook on Green Infrastructure: Planning, Design and Implementation; Edward Elgar: Cheltenham, UK; Northampton, MA, USA, 2015; ISBN 978-1-78347-400-4. [Google Scholar]
- 50 Biernacka, M.; Kronenberg, J. Classification of institutional barriers affecting the availability, accessibility and attractiveness of urban green spaces. Urban For. Urban Green. 2018, 36, 22–33. [Google Scholar] [CrossRef]
- 51 Barron, S.; Sheppard, S.R.J.; Condon, P.M. Urban Forest Indicators for Planning and Designing Future Forests. Forests 2016, 7, 208. [Google Scholar] [CrossRef]
- Kabisch, N.; Strohbach, M.; Haase, D.; Kronenberg, J. Urban green space availability in European cities. Ecol. Indic. 2016, 70, 586–596. [Google Scholar] [CrossRef]
- Kenney, W.A.; van Wassenaer, P.J.; Satel, A.L. Criteria and indicators for strategic urban forest planning and management. Arboric. Urban For. 2011, 37, 108–117. [Google Scholar]
- Korwel-Lejkowska, B.; Topa, E. Dostępność parków miejskich jako elementów zielonej infrastruktury w Gdańsku. Rozw. Reg. I Polityka Reg. 2017, 37, 63–75. (In Polish) [Google Scholar]
- Staszek, W. Wskaźniki udziału obszarów zieleni w wybranych miastach województwa pomorskiego jako podstawa działań programowych i planistycznych. Rozw. Reg. I Polityka Reg. 2017, 37, 51–61. (In Polish) [Google Scholar] [CrossRef]
- Czekajlo, A.; Coops, N.C.; Wulder, M.A.; Hermosilla, T.; Lu, Y.; White, J.C.; van den Bosch, M. The urban greenness score: A satellite-based metric for multi-decadal characterization of urban land dynamics. Int. J. Appl. Earth Obs. Geoinf. 2020, 93, 102210. [Google Scholar] [CrossRef]
- Wellmann, T.; Lausch, A.; Andersson, E.; Knapp, S.; Cortinovis, C.; Jache, J.; Scheuer, S.; Kremer, P.; Mascarenhas, A.; Kraemer, R.; et al. Remote sensing in urban planning: Contributions towards ecologically sound policies? Landsc. Urban Plan. 2020, 204, 103921. [Google Scholar] [CrossRef]
- Wellmann, T.; Schug, F.; Haase, D.; Pflugmacher, D.; van der Linden, S. Green growth? On the relation between population density, land use and vegetation cover fractions in a city using a 30-years Landsat time series. Landsc. Urban Plan. 2020, 202, 103857. [Google Scholar] [CrossRef]
- Szulczewska, B.; Giedych, R.; Maksymiuk, G. Can we face the challenge: How to implement a theoretical concept of green infrastructure into planning practice? Warsaw case study. Landsc. Res. 2017, 42, 176–194. [Google Scholar] [CrossRef]
- Bruszewska, K. Tereny rolne w polskich miastach jako potencjał do kształtowania zielonej infrastruktury. Probl. Ekol. Kraj. 2013, 36, 15–22. (In Polish) [Google Scholar]
- Pieńkowski, P.; Podlasiński, M.; Dusza-Zwolińska, E. Evaluation of the location of cities in terms of land cover on the example of Poland. Urban Ecosyst. 2019, 22, 619–630. [Google Scholar] [CrossRef] [Green Version]
- Yacamán Ochoa, C.; Ferrer Jiménez, D.; Mata Olmo, R. Green Infrastructure Planning in Metropolitan Regions to Improve the Connectivity of Agricultural Landscapes and Food Security. Land 2020, 9, 414. [Google Scholar] [CrossRef]
- Cieślak, I.; Biłozor, A.; Szuniewicz, K. The use of the CORINE Land Cover (CLC) database for analyzing urban sprawl. Remote Sens. 2020, 12, 282. [Google Scholar] [CrossRef] [Green Version]
- Congedo, L.; Marinosci, I.; Ritano, N.; Strollo, A.; De Fioravante, P.; Munafò, M. Monitoring of land consumption: An analysis of loss of natural and agricultural areas in Italy. Ann. Di. Bot. 2017, 7, 1–9. [Google Scholar] [CrossRef]
- Petrescu, F. Urban sprawl from Urban Atlas data: Romanian case study. Manag. Res. Pract. 2019, 11, 21–30. [Google Scholar]
- Kronenberg, J.; Haase, A.; Łaszkiewicz, E.; Antal, A.; Baravikova, A.; Biernacka, M.; Dushkova, D.; Filčák, R.; Haase, D.; Ignatieva, M.; et al. Environmental justice in the context of urban green space availability, accessibility, and attractiveness in postsocialist cities. Cities 2020, 106, 102862. [Google Scholar] [CrossRef]
- Siddique, G.; Roy, A.; Mandal, M.H.; Ghosh, S.; Basak, A.; Singh, M.; Mukherjee, N. An assessment on the changing status of urban green space in Asansol city, West Bengal. GeoJournal 2020. [Google Scholar] [CrossRef]
- Colding, J.; Gren, Å.; Barthel, S. The incremental demise of urban green spaces. Land 2020, 9, 162. [Google Scholar] [CrossRef]
- Feltynowski, M. The use of geoinformation in rural and urban-rural gminas of Zgierz poviat—A pilot survey. Bull. Geogr. Socio-Econ. Ser. 2013, 22, 47–53. [Google Scholar] [CrossRef] [Green Version]
- Baravikova, A. The uptake of new concepts in urban greening: Insights from Poland. Urban For. Urban Green. 2020, 56, 126798. [Google Scholar] [CrossRef]
- Čada, V.; Janečka, K. The fundamental spatial data in the public administration registers. Isprs. Int. Arch. Photogramm. Remote Sens. Spat. Inf. Sci. 2016, XLI-B4, 171–174. [Google Scholar] [CrossRef] [Green Version]
- Feltynowski, M. Miejscowe plany zagospodarowania przestrzennego a zmiana przeznaczenia gruntów leśnych w gminach miejskich w Polsce. Sylwan 2015, 159, 252–258. (In Polish) [Google Scholar]
- Pașca, A.; Năsui, D. The use of Corine Land Cover 2012 and Urban Atlas 2012 databases in agricultural spatial analysis. Case study: Cluj county, Romania. Res. J. Agric. Sci. 2016, 48, 314–322. [Google Scholar]
- Fuller, R.A.; Gaston, K.J. The scaling of green space coverage in European cities. Biol. Lett. 2009, 5, 352–355. [Google Scholar] [CrossRef] [Green Version]
- Kabisch, N.; Haase, D. Green spaces of European cities revisited for 1990–2006. Landsc. Urban Plan. 2013, 110, 113–122. [Google Scholar] [CrossRef]
- Badiu, D.L.; Iojă, C.I.; Pătroescu, M.; Breuste, J.; Artmann, M.; Niță, M.R.; Grădinaru, S.R.; Hossu, C.A.; Onose, D.A. Is urban green space per capita a valuable target to achieve cities’ sustainability goals? Romania as a case study. Ecol. Indic. 2016, 70, 53–66. [Google Scholar] [CrossRef]
- Kronenberg, J. Why not to green a city? Institutional barriers to preserving urban ecosystem services. Ecosyst. Serv. 2015, 12, 218–227. [Google Scholar] [CrossRef]
- Kronenberg, J.; Pietrzyk-Kaszyńska, A.; Zbieg, A.; Żak, B. Wasting collaboration potential: A study in urban green space governance in a post-transition country. Environ. Sci. Policy 2016, 62, 69–78. [Google Scholar] [CrossRef]
Figure 1.
Locations of third-tier towns in Poland’s Central Macroregion.


Table 1.
Population numbers in all 32 third-tier towns in the Lodzkie and Swietokrzyskie regions (as of 2018).
Table 1.
Population numbers in all 32 third-tier towns in the Lodzkie and Swietokrzyskie regions (as of 2018).
| Town | Lodzkie Region | Swietokrzyskie Region | Both Regions |
|---|---|---|---|
| Average | 34,745 | 23,768 | 30,629 |
| Median | 35,298 | 15,551 | 21,924 |
| Min value | 6781 | 5579 | 5579 |
| Max value | 73,670 | 69,051 | 73,670 |
Table 2.
Area and population of the studied towns (as of 2018).
| Town | Area (km2) | Population |
|---|---|---|
| Ostrowiec Swietokrzyski | 46 | 69,051 |
| Pabianice | 33 | 65,283 |
| Piotrkow Trybunalski | 67 | 73,670 |
| Tomaszow Mazowiecki | 42 | 62,649 |
| Zgierz | 42 | 56,529 |
Table 3.
Datasets used to elicit spatial data on urban green space.
| Data | Key Characteristics | Scale/Resolution |
|---|---|---|
| Statistical data | Data prepared by Statistics Poland (GUS) used in local governments’ reporting. | Hectare unit |
| Urban Atlas (UA) | Vector data. Elaborated in 2012. | Data available at a scale of 1:10,000, with a minimum mapping unit of 0.25 ha. |
| Land-use data (BDOT10k) | Vector data for Poland, updated in real-time. | Data available at a scale of 1:10,000 |
| Satellite imagery— Landsat 8 | Supplied every 16 days. | Data available at 30-meter resolution. |
Table 4.
Databases used to elicit data on urban green space with a list of land-use categories representing broadly understood green space in each of these datasets.
Table 4.
Databases used to elicit data on urban green space with a list of land-use categories representing broadly understood green space in each of these datasets.
| Statistical Data | UA | BDOT10k | Landsat 8 |
|---|---|---|---|
| Parks | Arable land (annual crops) (21000) | Allotments (PTUT01) | Urban green space identified by way of supervised classification |
| Green squares | Green urban areas (14100) | Arable land (PTTR02) | |
| Street greenery | Forests (31000) | Decorative plants plantation (PTUT05) | |
| Residential green spaces | Pastures (23000) | Forest (PTLZ01) | |
| Cemeteries | Permanent crops (22000) | Grassland (PTTR01) | |
| Municipal forests | Wetlands (40000) | Orchards (PTUT03) | |
| Complex and mixed cultivation patterns (24000) | Plantation (PTUT02) | ||
| Orchards (25000) | Scrub (PTRK02) | ||
| Shrubbery (PTLZ02) | |||
| Tree cover (PTLZ03) | |||
| Wetland (OIMK01; OIMK02) |
Table 5.
Percentage share of town areas occupied by green space.
| Town | Statistics Poland | UA | BDOT10k | Landsat 8 |
|---|---|---|---|---|
| Ostrowiec Swietokrzyski | 5.01 | 51.74 | 63.17 | 73.01 |
| Pabianice | 5.70 | 55.93 | 59.32 | 79.43 |
| Piotrkow Trybunalski | 3.55 | 61.17 | 75.81 | 85.97 |
| Tomaszow Mazowiecki | 4.89 | 52.72 | 66.33 | 70.31 |
| Zgierz | 3.65 | 60.95 | 68.08 | 81.08 |
Table 6.
Differences between urban green space area, depending on whether BDOT10k or Landsat 8 data are referred to.
Table 6.
Differences between urban green space area, depending on whether BDOT10k or Landsat 8 data are referred to.
| Town | Percentage Point Difference in Favor of Landsat 8 |
|---|---|
| Ostrowiec Swietokrzyski | 9.84 |
| Pabianice | 20.11 |
| Piotrkow Trybunalski | 10.16 |
| Tomaszow Mazowiecki | 3.98 |
| Zgierz | 13 |
Table 7.
Area of urban green space (m2) per town inhabitant.
| Town | Statistics Poland | UA | BDOT10k | Landsat 8 |
|---|---|---|---|---|
| Ostrowiec Swietokrzyski | 48.19 | 344.65 | 420.84 | 486.34 |
| Pabianice | 28.78 | 282.73 | 299.86 | 401.51 |
| Piotrkow Trybunalski | 32.36 | 556.35 | 689.47 | 781.83 |
| Tomaszow Mazowiecki | 24.65 | 353.42 | 444.70 | 471.35 |
| Zgierz | 35.71 | 452.87 | 505.79 | 602.38 |
Table 8.
Number of town inhabitants per ha of green space.
| Town | Statistics Poland | UA | BDOT10k | Landsat 8 |
|---|---|---|---|---|
| Ostrowiec Swietokrzyski | 208 | 29 | 24 | 21 |
| Pabianice | 347 | 35 | 33 | 25 |
| Piotrkow Trybunalski | 309 | 18 | 15 | 13 |
| Tomaszow Mazowiecki | 406 | 28 | 22 | 21 |
| Zgierz | 280 | 22 | 20 | 17 |
Table 9.
Percentage share of different categories of green spaces in relation to the town area.
| Dataset | Code/Name Of Green Area | Ostrowiec Swietokrzyski | Pabianice | Piotrkow Trybunalski | Tomaszow Mazowiecki | Zgierz |
|---|---|---|---|---|---|---|
| BDOT10k | Grassland | 29.78 | 21.68 | 28.22 | 34.94 | 25.60 |
| Forest | 21.20 | 10.77 | 23.36 | 19.66 | 23.70 | |
| Arable land | 5.56 | 21.09 | 20.77 | 6.77 | 15.24 | |
| Orchards | 2.30 | 0.76 | 0.92 | 0.21 | 0.72 | |
| Allotments | 1.75 | 2.24 | 1.48 | 1.82 | 1.16 | |
| Shrubbery | 0.73 | 0.88 | 0.72 | 1.00 | 0.62 | |
| Tree cover | 0.68 | 1.75 | 0.23 | 0.94 | 0.80 | |
| Scrub | 0.50 | 0.02 | 0.05 | 0.01 | 0.11 | |
| Wetlands | 0.42 | 0.07 | 0.02 | 0.84 | 0.03 | |
| Plantation | 0.25 | 0.06 | 0.03 | 0.14 | 0.09 | |
| Sum | 63.17 | 59.32 | 75.81 | 66.33 | 68.08 | |
| UA | Forests | 24.75 | 9.62 | 24.72 | 19.15 | 23.80 |
| Pastures | 20.07 | 33.76 | 14.53 | 24.64 | 17.36 | |
| Arable land (annual crops) | 4.70 | 9.60 | 21.21 | 7.33 | 17.40 | |
| Green urban areas | 2.20 | 2.95 | 0.71 | 1.60 | 2.40 | |
| Sum | 51.74 | 55.93 | 61.17 | 52.72 | 60.95 | |
| Statistics Poland | Residential green spaces | 1.64 | 2.33 | 1.05 | 2.08 | 1.05 |
| Street greenery | 0.90 | 0.79 | 1.72 | 0.73 | 0.38 | |
| Green squares | 0.73 | 0.10 | 0.16 | 0.20 | 0.12 | |
| Parks | 0.65 | 1.64 | 0.23 | 0.46 | 0.47 | |
| Municipal forests | 0.62 | 0.01 | 0.04 | 0.67 | 1.09 | |
| Cemeteries | 0.47 | 0.84 | 0.34 | 0.76 | 0.54 | |
| Sum | 5.01 | 5.70 | 3.55 | 4.89 | 3.65 |
Publisher’s Note: MDPI stays neutral with regard to jurisdictional claims in published maps and institutional affiliations. |
© 2020 by the authors. Licensee MDPI, Basel, Switzerland. This article is an open access article distributed under the terms and conditions of the Creative Commons Attribution (CC BY) license (http://creativecommons.org/licenses/by/4.0/).
Share and Cite
MDPI and ACS Style
Feltynowski, M.; Kronenberg, J. Urban Green Spaces—An Underestimated Resource in Third-Tier Towns in Poland. Land 2020, 9, 453. https://0-doi-org.brum.beds.ac.uk/10.3390/land9110453
AMA Style
Feltynowski M, Kronenberg J. Urban Green Spaces—An Underestimated Resource in Third-Tier Towns in Poland. Land. 2020; 9(11):453. https://0-doi-org.brum.beds.ac.uk/10.3390/land9110453
Chicago/Turabian StyleFeltynowski, Marcin, and Jakub Kronenberg. 2020. "Urban Green Spaces—An Underestimated Resource in Third-Tier Towns in Poland" Land 9, no. 11: 453. https://0-doi-org.brum.beds.ac.uk/10.3390/land9110453
Note that from the first issue of 2016, this journal uses article numbers instead of page numbers. See further details here.