Bioenergy Potential and Greenhouse Gas Emissions from Intensifying European Temporary Grasslands


1
Copernicus Institute of Sustainable Development, Utrecht University, Princetonlaan 8a, 3584 CB Utrecht, The Netherlands
2
Wageningen Environmental Research, Wageningen University and Research, Droevendaalsesteeg 3, 6708 PB Wageningen, The Netherlands
*
Author to whom correspondence should be addressed.
Land 2020, 9(11), 457; https://0-doi-org.brum.beds.ac.uk/10.3390/land9110457
Submission received: 24 September 2020
/
Revised: 3 November 2020
/
Accepted: 13 November 2020
/
Published: 18 November 2020
(This article belongs to the Special Issue Bioenergy and Land)
Abstract
:Agricultural intensification is considered essential for meeting growing demand for food and biomass for energy purposes. Intensifying grasslands is under-represented, although it is a promising option given their large land area and relatively low management levels. This study quantifies the bioenergy potential from intensifying temporary grasslands in Europe and the integral greenhouse gas emission effects in 2030. We first conducted a literature review of intensification options for European grasslands and then applied the environmental impact assessment model MITERRA-Europe to implement the key intensification option of using multi-species grass mixtures. The results showed that 853 kha (or 8%) of temporary grassland could be made sustainably available for additional biomass production. This can be translated into a bioethanol potential of 23 PJ yr−1 and an emission mitigation potential of 5.8 Mt CO2-eq yr−1 (if conventional grass mixture from surplus temporary grassland is used for energy) or 72 PJ yr−1 and 4.0 Mt CO2-eq yr−1 (if surplus temporary grassland is used for grassy energy crops). Although the bioenergy potential is limited, the key advantage of intensification measure is that it results in a better environmental performance of temporary grasslands. This makes it a key option for sustainably producing bioenergy in areas with high shares of temporary grasslands.
1. Introduction
Climate change mitigation as set out in the Paris Climate Agreement warrants a rapid reduction in the use of fossil fuels. Bioenergy is expected to play an important role in this mitigation alongside increasing energy efficiency, renewable electricity such as wind and solar as well as carbon capture and storage [1]. However, increasing production and use of bioenergy is associated with the risk of large-scale direct and indirect land-use change [2,3], which in turn can lead to additional greenhouse gas (GHG) emissions [4,5]. To avoid land use change, particularly conversion of natural land to managed land and the resulting emissions, sustainable intensification of agricultural land is proposed to help increase productivity and thereby make room for additional biomass for energy purposes [6,7,8]. But intensification of the existing agriculture may also lead to adverse environmental effects, such as increased emissions and nutrient leaching due to the increased use of agrochemicals and machinery [9], or biodiversity loss [10,11]. To provide an accurate and comprehensive picture of the (indirect) impacts of bioenergy, the impacts of intensification must be integrated in the assessment of biomass production for energy purposes, i.e., the integral effect of intensification and use of surplus land for bioenergy. So far, this integral effect of intensification and increased bioenergy production has focused on agricultural crops [7,12,13]. The productivity developments in the livestock sector, and particularly grasslands, are not yet properly assessed and are not included in existing modeling frameworks [14,15] despite the vast amount of grassland used for livestock production [16]. While Ketzer et al. [17], Qi et al. [18] and Hansson et al. [19] have shown substantial land and bioenergy potential of grasslands in parts of Europe, they did not consider the integral environmental impacts of intensification in the livestock sector as a means to allow additional biomass for energy or other purposes. Gerssen-Gondelach et al. [8] did account for livestock productivity intensification in their assessment of bioenergy potential through intensification and integral emission analysis, but they only included increased livestock stocking rates. Intensification of grassland productivity and its impacts were not included.
Given the knowledge gap defined above, this paper aims to (i) assess the sustainable supply potential of herbaceous energy crops resulting from the intensification of European grasslands and (ii) determine the integral GHG emission effects of grassland intensification, herbaceous energy crop cultivation on surplus grasslands and its conversion to bioethanol in 2030. We focus on Europe where future intensification seems inevitable due to its already high pressure on land use and expected increasing demand for biomass for meeting its ambitious renewable energy and climate mitigation targets. For the analysis, we first conduct a literature review of the intensification options for European grasslands. Based on this review, which indicates the limited data availability for intensification options for permanent grasslands, we limited the remainder of our analysis to temporary grasslands. We used the MITERRA-Europe model [20] to implement the key intensification option in order to quantify how much temporary grassland can be made available for additional herbaceous crop production for energy purposes through intensification. We then analyzed the resulting sustainable resource and bioenergy potential and evaluated the integral GHG emission effects from sustainable grassland intensification measures and bioenergy production. The analysis is focused on EU28 and was conducted at Nomenclature of Territorial Units for Statistics (NUTS) 2 regions [21] with a time frame until 2030.
2. Sustainable Intensification Measures for Grasslands
Grasslands differ in terms of management, yield, environmental value and biodiversity value, as well as intensification measures which are specific to different types of grasslands. A broad distinction of grassland types is made between semi-natural and production grasslands [22]. Production grasslands are then further differentiated between permanent and temporary grasslands (for definitions of the different types of grassland, see Table S1 in the Supplementary Materials). The intensification level in terms of manure and fertilizer inputs, grazing and cutting frequency and grassland renewal can be another level of distinction [22]. Of the production grasslands in Europe, 60 Mha are permanent grasslands and 11 Mha are temporary grasslands. For permanent and temporary grasslands, it is important to note that large differences in the size of these two types exist across countries. Thus, while the area dedicated to permanent grasslands is larger than the temporary grassland area in most countries, some countries have a very large area of temporary grasslands, such as Finland, Sweden and Denmark, where 95%, 72% and 62% of the utilized agricultural area (UAA) is temporary grassland, respectively [16] (see also Table S2).
Sustainable intensification measures are here defined as those measures that increase biomass productivity while minimizing adverse environmental effects. Three main measures for sustainable grassland intensification exist: (1) use of multi-species mixtures, (2) grazing and cutting management and (3) optimization of fertilizer application. Measures 2 and 3 are suitable for permanent grasslands. Measure 1, use of multi-species mixtures, is not considered for permanent grasslands because they often contain multi-species mixtures already and permanent grasslands are only sown if productivity becomes too low and even then farmers often choose to improve the existing grassland rather than sow new grass. Temporary grasslands are sown every few years, and the use of multi-species mixtures (Measure 1) is a suitable measure to apply to temporary grasslands. In addition, grazing and cutting management (Measure 2) as well as optimizing fertilizer application (Measure 3) are suitable for temporary grasslands.
Below we review the measures “use of multi-species mixtures” and “grazing and cutting management.” Although the third measure, “optimization of fertilizer application” is suitable for both permanent and temporary grasslands, it cannot be addressed in this review because of the lack of data and modelling studies on this measure in the existing literature.
2.1. Use of Multi-Species Mixtures
Experimental research found a positive relationship between plant species diversity and biomass yield in extensively managed grasslands (e.g., [23,24,25]) and intensively managed grasslands [26,27]. This relationship results from improved resource utilization due to niche differentiation; a greater probability of showing positive inter-specific interactions (i.e., facilitation); and increased probability of containing highly productive species (i.e., sampling effect) [28,29,30].
Both the number of species or functional groups (richness) and their relative abundance (evenness) play a role in the increased productivity of multi-species mixtures [26]. Functional diversity (i.e., the number of groups sharing the same function in an ecosystem) is found to be particularly important. The combination of grasses and legumes is highly productive through the rhizobial N-fixation ability of legumes [25].
Most experimental research on multi-species mixtures has focused on nutrient-poor, extensively managed sown grasslands [23,24,30,31]. These studies all show a positive effect of diversity on aboveground biomass. Spehn et al. [31] found that the diversity effect varied across countries and is stronger in grass–legume–forbs mixtures than grass–legume mixtures (Table 1).
In the last decade, two large pan-European projects were established to study the effect of multi-species mixtures on biomass yield for nutrient-rich, intensively managed grasslands. According to Kirwan et al. [26] (i.e., the COST Action 852 project), the aboveground biomass of grass–legume mixtures is consistently greater than that from grass or legume monocultures across a wide geographical scale (Table 1). Nyfeler et al. [32] show that mixtures fertilized with 50 kg N ha−1 yr−1 attained yields comparable to grass monocultures fertilized with 450 kg N ha−1 yr−1 at a Swiss experimental site. In the MultiSward project, Collins et al. [33] also found transgressive overyielding of grass-legume mixtures at the experimental sites in France, Wales and Switzerland in the range of 6–46% depending on location and management. Transgressive overyielding is lower when grazing instead of cutting is applied and with high nitrogen fertilizer input. No transgressive overyielding is demonstrated at the plots that were grazed and received high nitrogen input. Higher fertilizer inputs diminish the diversity effect as explained by Nyfeler et al. [32].
The yield improvement potential from the use of multi-species mixtures was calculated per climate zone for intensively managed grasslands [34] and extensively managed grasslands [35] (Table 1). Total yields include sown and unsown species as this is a measure of the total forage availability for feed and ensiling [27]. Yield ratios for overyielding and transgressive overyielding were calculated per experimental site across seed density and experimental years. Afterwards, these ratios were averaged across the countries belonging to the same climate zone to derive overyielding and transgressive overyielding ratios for each climate zone.
The nitrogen yield gain in grass–legume mixtures compared to grass monocultures has been studied by Suter et al. [39] for intensively managed grasslands. Whereas nitrogen in grass monoculture is solely derived from the soil and fertilizer, nitrogen in grass-legume mixtures also originates from atmospheric nitrogen as legumes are able to fix atmospheric nitrogen through symbiotic N2 fixation. The nitrogen yield gain results from a linear increase with legume proportion plus a non-linear surplus from positive grass–legume interactions (e.g., stimulation of symbiotic N2 fixation, nitrogen transfer) [39]. The average nitrogen yield gain, as derived from the 16 experimental sites quantified by Suter et al. [39], was 36%.
The area suitable for introduction of grass–legume mixtures is the area of temporary grassland currently sown with only grass or a mixture of only one grass and one legume species. Data on species currently sown on grassland is, however, not available for most countries. Table 2 shows a summary of FAO country pasture/forage profiles for countries with large areas of temporary grassland. For example, in France, the country with the largest temporary grassland area (see Table S2), 30% of temporary grasslands are sown with pure grass in the period of 2001–2003 [40].
2.2. Optimized Grazing and Cutting Management
Practices to optimize grazing and cutting management include adjusting grazing and mowing frequency, grazing regime (e.g., continuous, rotational grazing), pre-grazing herbage mass and stocking density. Studies examining the relation between grazing and cutting management and productivity specific to Europe are limited and generate diverse conclusions. For example, increasing the mowing frequency in grass–legume swards may either result in small positive productivity effects [41] or negative results [42]. Productivity in pure swards is positively affected when changing mowing frequency from one to two cuts per year, but negatively affected when changing from two to four cuts per year [42]. In rotational grazing systems with perennial ryegrass, a decrease in grazing frequency (i.e., longer rotations) results in a decrease in grass growth [43,44,45]. This is caused by the growth pattern of perennial ryegrass—starting slowly after which the grass grows exponentially—and prohibiting the ryegrass to reach its maximum growth rate [44]. Changing the grazing regime did not significantly affect grass growth [45,46] or grass growth in meadows with certain grass species [47].
In addition to these scattered results on the relation between grazing management and grass productivity, it seems that the use of legumes has a stronger effect on productivity than grazing management. Weigelt et al. [42] concluded that increasing species richness in grassland has a stronger effect on productivity than management intensity (i.e., fertilizer application and mowing frequency). A similar observation was found by Henderson et al. [48]. They estimated the carbon sequestration potential of improved grazing management, the use of legumes and optimized nitrogen (N) fertilization. They found a small potential from improved grazing management in Western Europe (0.05 Mg CO2 ha−1), while the use of legumes has a larger carbon sequestration potential (3.5 Mg CO2 ha−1) [48]. The highest carbon sequestration potential from the use of legumes was found for the Atlantic and Continental climate zones, thereby confirming the literature findings that management practices enhancing carbon sequestration often also enhance grass productivity [48,49].
3. Materials and Methods
The methodological framework of this study builds on de Wit et al. [7] who assessed the GHG emission balance of food and feed crop productivity increases combined with an expansion of energy crop production on the arable land that becomes available as a result of the productivity increases with the use of MITERRA-Europe [20]. In the present study, we apply a similar approach but focus on the effect of increased grassland productivity on available land for additional grass or grassy energy crop production and their environmental impacts, also using the MITERRA-Europe model. The detailed setup of the analysis is described below.
3.1. Modeling Framework: Miterra-Europe
The environmental impact assessment model MITERRA-Europe [20] is used to assess the effect of increased grassland productivity on the net GHG mitigation balance, changes in N-leaching and resulting nitrous oxide (N2O) as well as changes in soil organic carbon (SOC) stocks. The impact of conversion of temporary grassland to perennial herbaceous energy crops was also assessed for N2O soil emissions and soil carbon emissions/sequestration.
3.1.1. General Overview
MITERRA-Europe is an environmental assessment model, which calculates emissions of nitrogen (N2O, NH3, NOx and NO3) and greenhouse gasses (CO2, CH4 and N2O) on a deterministic and annual basis using emissions and leaching factors. The model was developed to assess effects and interactions of policies and measures in agriculture on nitrogen losses on a NUTS-2 level in the EU-27 [56,57]. MITERRA-Europe is partly based on the Common Agricultural Policy Regionalized Impact model (CAPRI) [57], and the Greenhouse Gas and Air Pollution Interactions and Synergies model (GAINS) [58], and supplemented with a nitrogen leaching module, a soil carbon module and a module for mitigation. CAPRI is an agricultural economic model, which can provide activity data to MITERRA-Europe. GAINS is an emission model to assess control strategies to combat air pollution and climate change. MITERRA-Europe is an established model that has been peer-reviewed and validated [7,20,59,60].
Input data consists of activity data such as livestock numbers, crop areas, animal production and crop yields derived from Eurostat and FAO. Spatially explicit environmental data such as soil data comes from the European Soil Database and climate data, and N2O and CH4 emission factors come from Intergovernmental Panel on Climate Change (IPCC) [61], with NH3 emission factors and excretion factors coming from GAINS. MITERRA-Europe has its own approach for handling nitrogen leaching and nitrogen surface runoff and does not use the default IPCC leaching factor of 30% of nitrogen input [61]. Instead, leaching fractions are determined based on soil texture, land use, precipitation surplus, soil organic carbon content, temperature and rooting depth. Surface runoff fractions are calculated based on slope, land use, precipitation surplus, soil texture and soil depth [20,62]. The model includes measures to mitigate GHG and NH3 emissions as well as NO3 leaching.
Three types of grassland are currently represented in MITERRA-Europe, namely temporary grasslands (which are part of the category “other fodder on arable land”), managed grasslands and natural grasslands, where managed grasslands and natural grasslands together make up permanent grasslands. In our study, we calculated the average grassland yields (in ton dry matter (DM) ha−1) and nitrogen yield (in kg N ha−1) per NUTS-2 region based on grasslands yields estimated by Smit et al. [63], and areas of managed grassland and natural grasslands (rough grazing) derived from Eurostat [64] (Eurostat identifier “ef_lus_pegrass”). Based on limited information on the current use of grass mixtures (Table 2), we assumed that grass–legume mixtures can be applied on 50% of temporary grasslands. For these areas, the average overyielding factor for intensive grasslands from Table 1 was applied for all climate zones. As the grass–legume mixtures can fix nitrogen through biological N fixation, less mineral fertilizer is required. Based on the N gain of 36% as found by Suter et al. [39], the mineral N fertilizer input was reduced by 26% (1/1.36).
3.1.2. N2O Emissions
N2O emissions from agricultural soils consist of direct soil emissions from application of nitrogen fertilizer and animal manure, crop residues and cultivation of organic soils, urine and feces produced during grazing. Indirect emissions come from nitrogen leaching and runoff as well as from atmospheric deposition of nitrogen volatilized from managed soils. The N2O emissions were calculated using the IPCC [61] emission factor of 1%. Indirect N2O emissions from leaching and runoff (EF = 0.75%) and from atmospheric deposition of nitrogen volatilized from managed soils (EF = 1.0%) were also taken into account. Nitrogen fertilization in our scenario analysis (see Section 3.3) is based on the concept of balanced fertilization in which nitrogen fertilizer application is equal to nitrogen demand of the crop times a crop-specific uptake factor. This uptake factor is 1 in the case of grasses, meaning that grassland is able to take up all plant-available nitrogen [56].
3.1.3. Soil Organic Carbon Stock Changes
For soil carbon, the RothC model [65] was implemented in MITERRA-Europe. RothC (version 26.3) is a model of the turnover of organic carbon in non-waterlogged soils that allows for the effects of soil type, temperature, moisture content and plant cover on the turnover process. It uses a monthly time step to calculate total organic carbon (ton C ha−1) on a years-to-centuries timescale [65]. SOC is split into four active compartments (decomposable plant material, resistant plant material, microbial biomass and humified organic matter) and a small amount of inert organic matter. Each compartment decomposes by a first-order process with its own characteristic rate. RothC was used to calculate the SOC balance for the scenario year 2030 based on carbon inputs from manure and crop residues.
The soil carbon balance is determined for 2030. However, soil organic carbon continues to change even many years after an intervention. The period for reaching a new equilibrium is here set as 20 years which is the IPCC default [61].
3.2. Applied Sustainable Intensification Measures
Based on the literature review of sustainable intensification measures for grasslands (Section 2), we focus only on the measure of using multi-species mixtures for temporary grasslands. For the two other measures, the lack of sufficient scientific literature and data or ambiguous experimental results did not allow for model implementation. The yield effect from introducing multi-species mixtures is based on the data derived from large scale experiments at 33 sites [34] (Table 1). In the modeling, we assumed the average of overyielding and transgressive overyielding for intensively managed grasslands.
3.3. Land Use Scenarios
Once MITERRA-Europe implemented the sustainable intensification measures, it was able to spatially (NUTS-2) assess how much surplus grassland could be generated. This land can be used in different ways (e.g., left fallow, growing and harvesting regular grass mixture or planting grassy energy crops). To assess how the different land uses affect the energy potential and resulting GHG balance from European grasslands, we assessed three scenarios for 2030 (Table 3).
The scenarios built on the CAPRI reference scenario for 2030 as a basis for the representation of agricultural land use and livestock production in 2030. The reference 2030 scenario assumes similar management practices in 2030 as today, and grassland areas are based on the CAPRI reference scenario. The reference 2030 scenario is used for comparison with scenario 1 and 2 to determine surplus grassland area generated from intensification and resulting changes in emissions. Scenarios 1 and 2 assume increased grass productivity through the implementation of sustainable intensification measures (Section 3.2), fulfilling livestock demand in the CAPRI reference 2030 run. The difference between scenarios 1 and 2 and the reference suggests the surplus grassland area in our study is used in two different ways. In scenario 1, the total area of surplus grassland continues to be managed as before and the grass mixture is used for energy purposes. In scenario 2, the surplus grassland area is used for the production of herbaceous energy crops. The suitability of herbaceous energy crop cultivation depends on climatic and agro-ecological factors. This suitability, the cultivation requirements and resulting yields for the herbaceous energy crops miscanthus, switchgrass and reed canary grass are incorporated in MITERRA-Europe [7]. Thus, for each region it is assessed which herbaceous energy crop is most suitable, which is in turn selected and used for further calculations.
3.4. Grass Options and Conversion Techniques
In order to determine the energy potential and GHG emission abatement, this study considers grass from surplus temporary grasslands to be used for advanced biofuel production. Here, we consider the biochemical conversion route because technology is currently more advanced than the thermochemical conversion route [66]. Biochemical conversion of lignocellulosic biomass (i.e., here grasses) is based on hydrolysis of pretreated biomass and then fermentation of simple sugars. During the distillation of the fermentation broth, ethanol is extracted. The solid waste from the distillation (e.g., lignin, unreacted cellulose and hemicellulose) is combusted for electricity and heat, which fuel the conversion process [66]. Research has focused on herbaceous energy crops (switchgrass, miscanthus, reed canary grass, scenario 2), but also conventional grass mixtures can be used for ethanol production [67], as tested in scenario 1 (Table 3). Energy content and conversion efficiency for grasses to ethanol are provided in Table 4.
Additional options for using the grass for energy and/or material andchemical purposes are based on grass biorefinery processes (see e.g., [71,72,73,74,75,76]). In a grass biorefinery process, the grass is split in grass juice and grass fibers. From the grass juice, proteins are extracted and used for producing high-value protein-rich livestock feed, and the phosphate and nitrogen may be extracted and used for fertilizer [75]. The grass fibers are used either for livestock feed (e.g., Grassa [77]) or for biogas (e.g., Harvestagg [78]). Alternatively, the cellulose and hemicellulose from the fibers can be used for ethanol production (see e.g., Grass [79]). While some of these options are in an early commercialization stage, little or inconsistent data is available in the literature on the juice and fiber fractions, extraction rates, conversion efficiencies and substitution ratios. Therefore, this conversion route is not included in the analysis. However, a more detailed discussion of the options is given in Section 5.
3.5. GHG Emission Abatement through Biofuels from Surplus Grasslands
GHG emissions from intensification of temporary grasslands in Europe, specifically changes in N2O and soil organic carbon (SOC), are determined with MITERRA-Europe as described in Section 3.1. In order to determine the overall GHG emission balance of bioethanol made from grass (whether conventional grass mixture or herbaceous energy crops) grown on surplus grasslands made available through intensification, the emissions from the crop-to-biofuel supply chain also need to be determined. The emissions from the crop-to-biofuel supply chain are determined based on Gerssen-Gondelach et al. [8]. We exclude emissions from fertilizer application for feedstock production as these are already determined by MITERRA-Europe (Table 5).
We calculate total emissions from grassland intensification, herbaceous energy crop production and supply chain emissions for a net balance of GHG emissions, i.e., the integral effect of intensification and use of surplus land for bioenergy. We compare this to the emissions from fossil fuels (Table 5) in order to determine the total GHG emission abatement of intensifying temporary grasslands in Europe. In addition, we determine the average supply chain emissions from bioethanol by first summing up the total emissions caused by changes in N2O and SOC (from MITERRA-Europe) and the supply chain emissions for bioethanol, and then dividing by the total bioethanol production potential. This emission factor is then compared to the fossil fuel comparator to assess the average, per unit bioethanol emission reduction potential.
4. Results
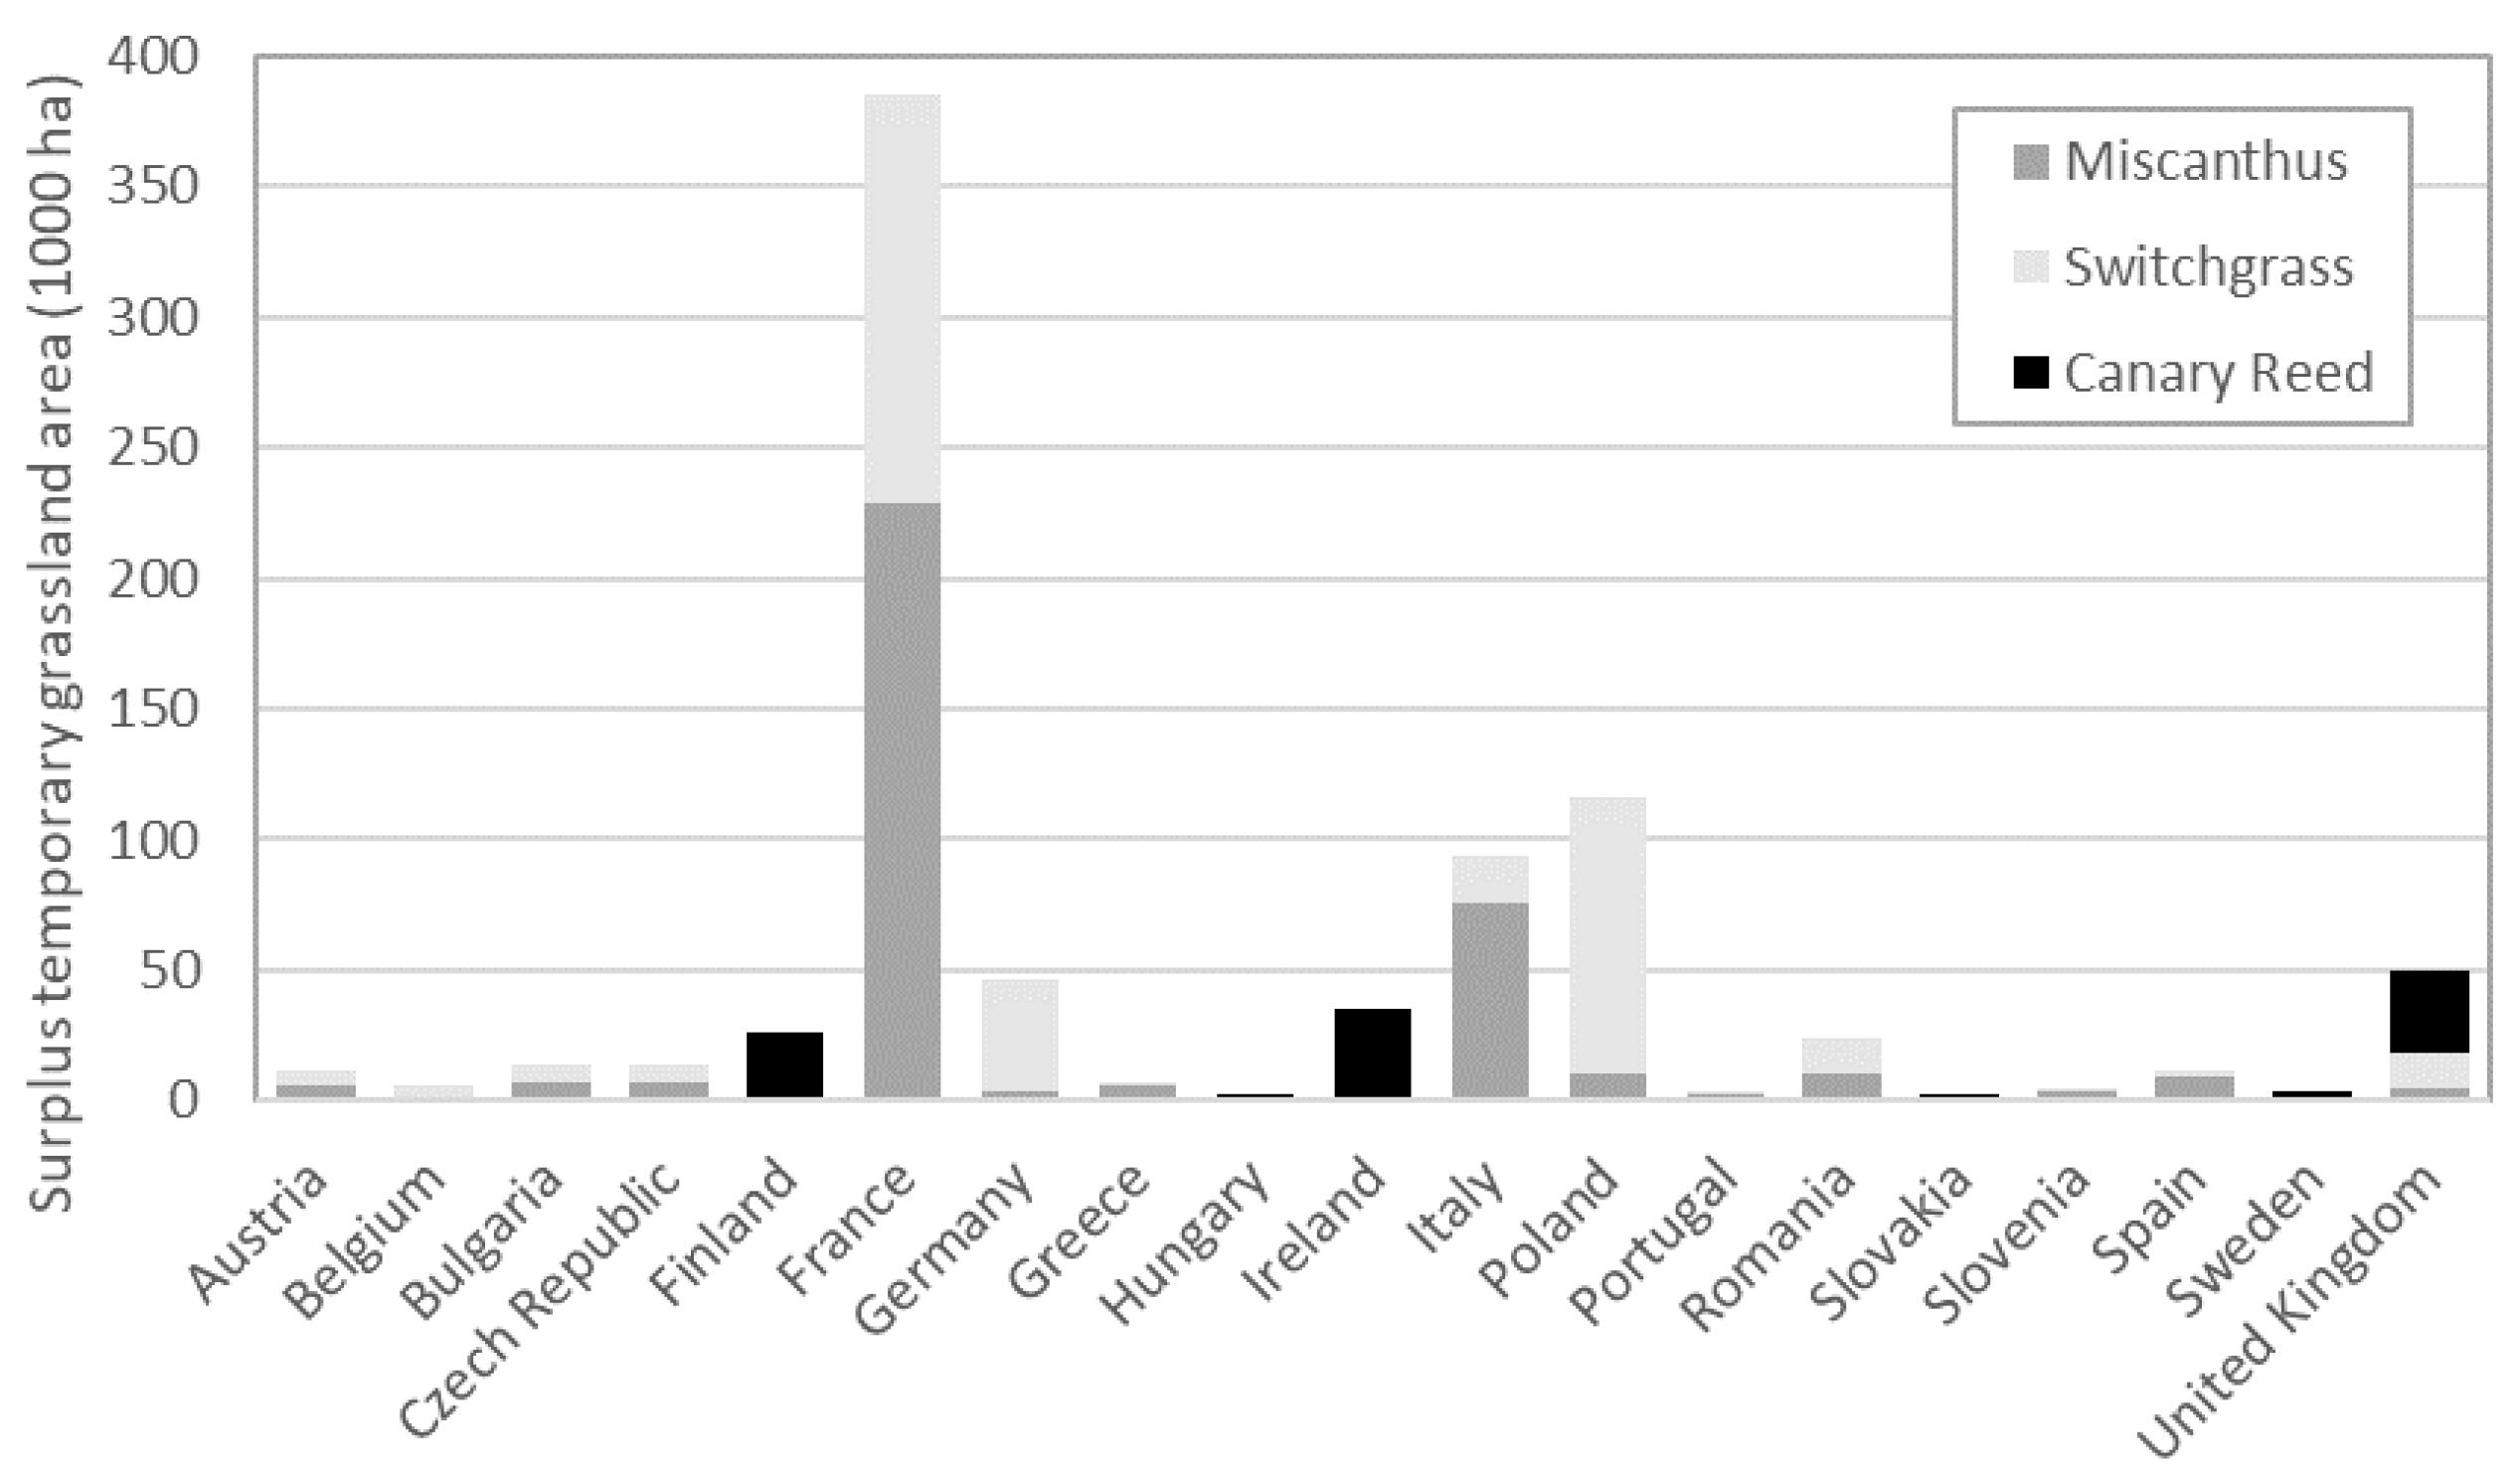
Intensification of temporary grasslands can make a total of 853 kha surplus area available for energy production (Figure 1). The largest surplus area is found in France (386 kha), Poland (117 kha) and Italy (94 kha), which together make up 70% of the surplus grassland. Switchgrass and miscanthus are the most suitable grasses for these surplus areas, both making up 44% of the surplus area. The remaining 12% are most suitable for canary reed. In two of the countries with the largest surplus areas (France and Italy), large shares of miscanthus can be seen, while in Poland, switchgrass is more suitable.
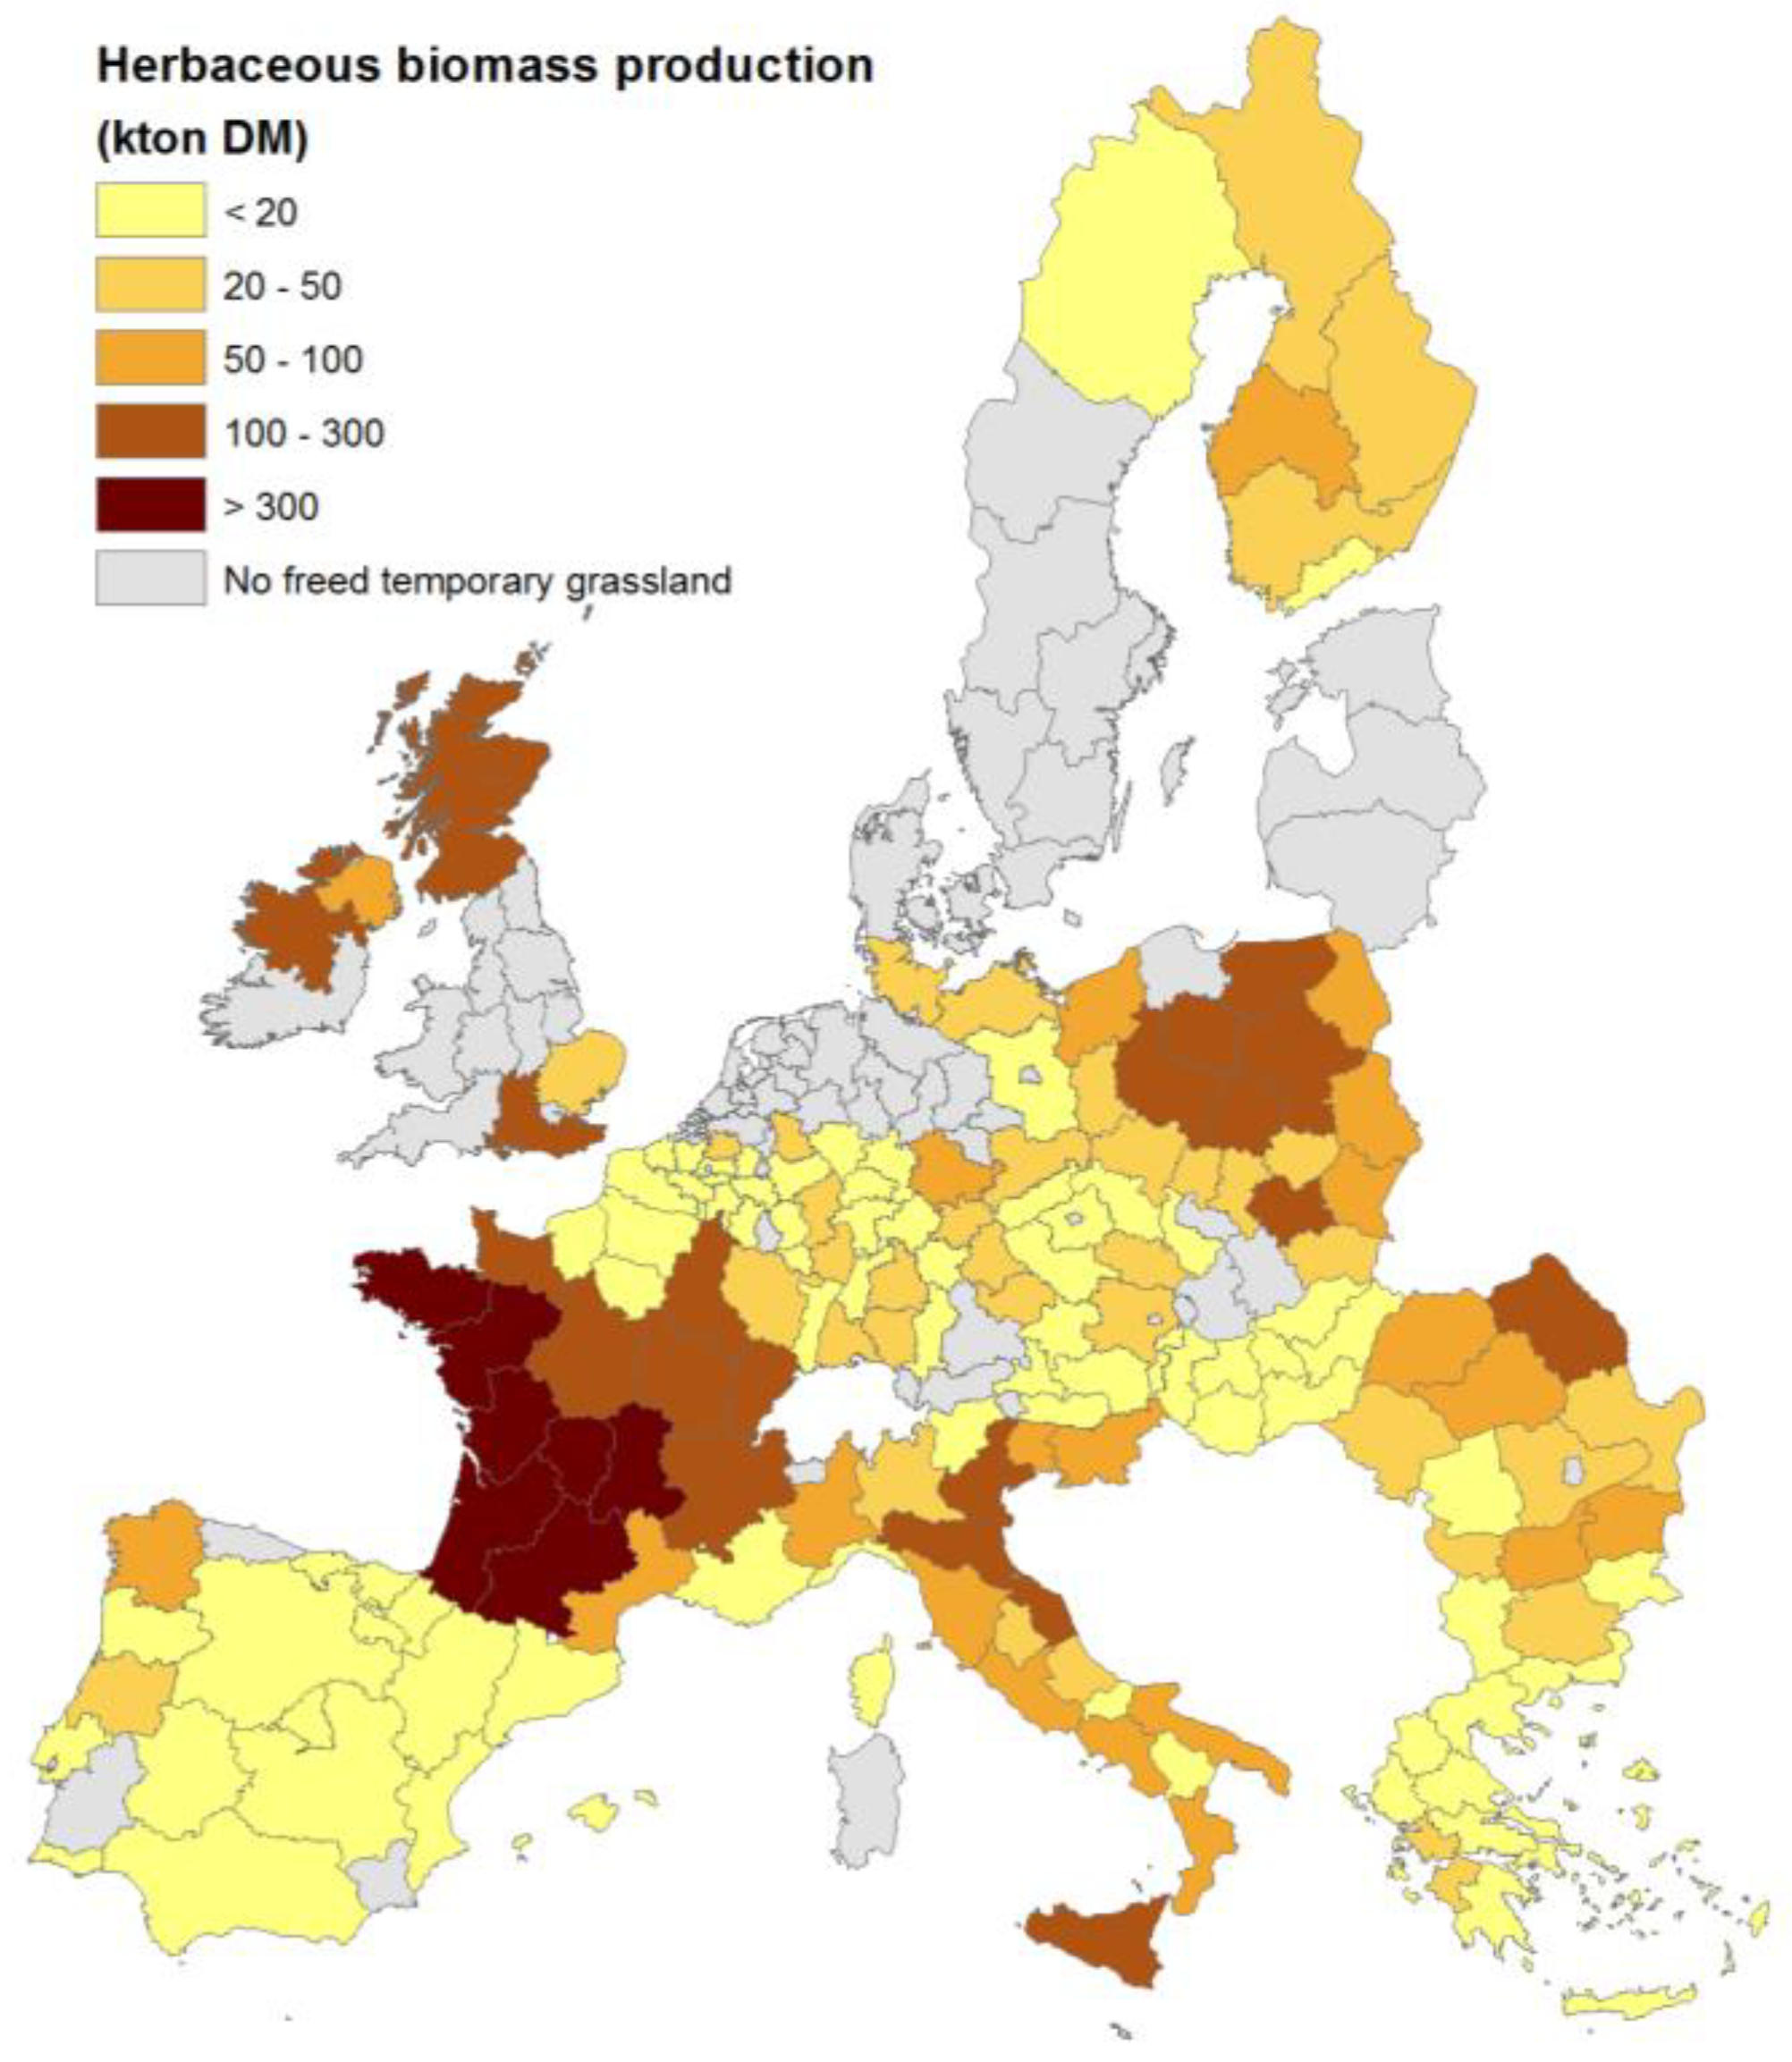
Spatial distribution of the surplus areas and yields result in biomass potentials by NUTS-2 regions as shown in Figure 2. Besides large potentials in the above-mentioned three countries, there are also significant potentials in Scotland, certain regions of Ireland (border, midland and western) and Northeast Romania.
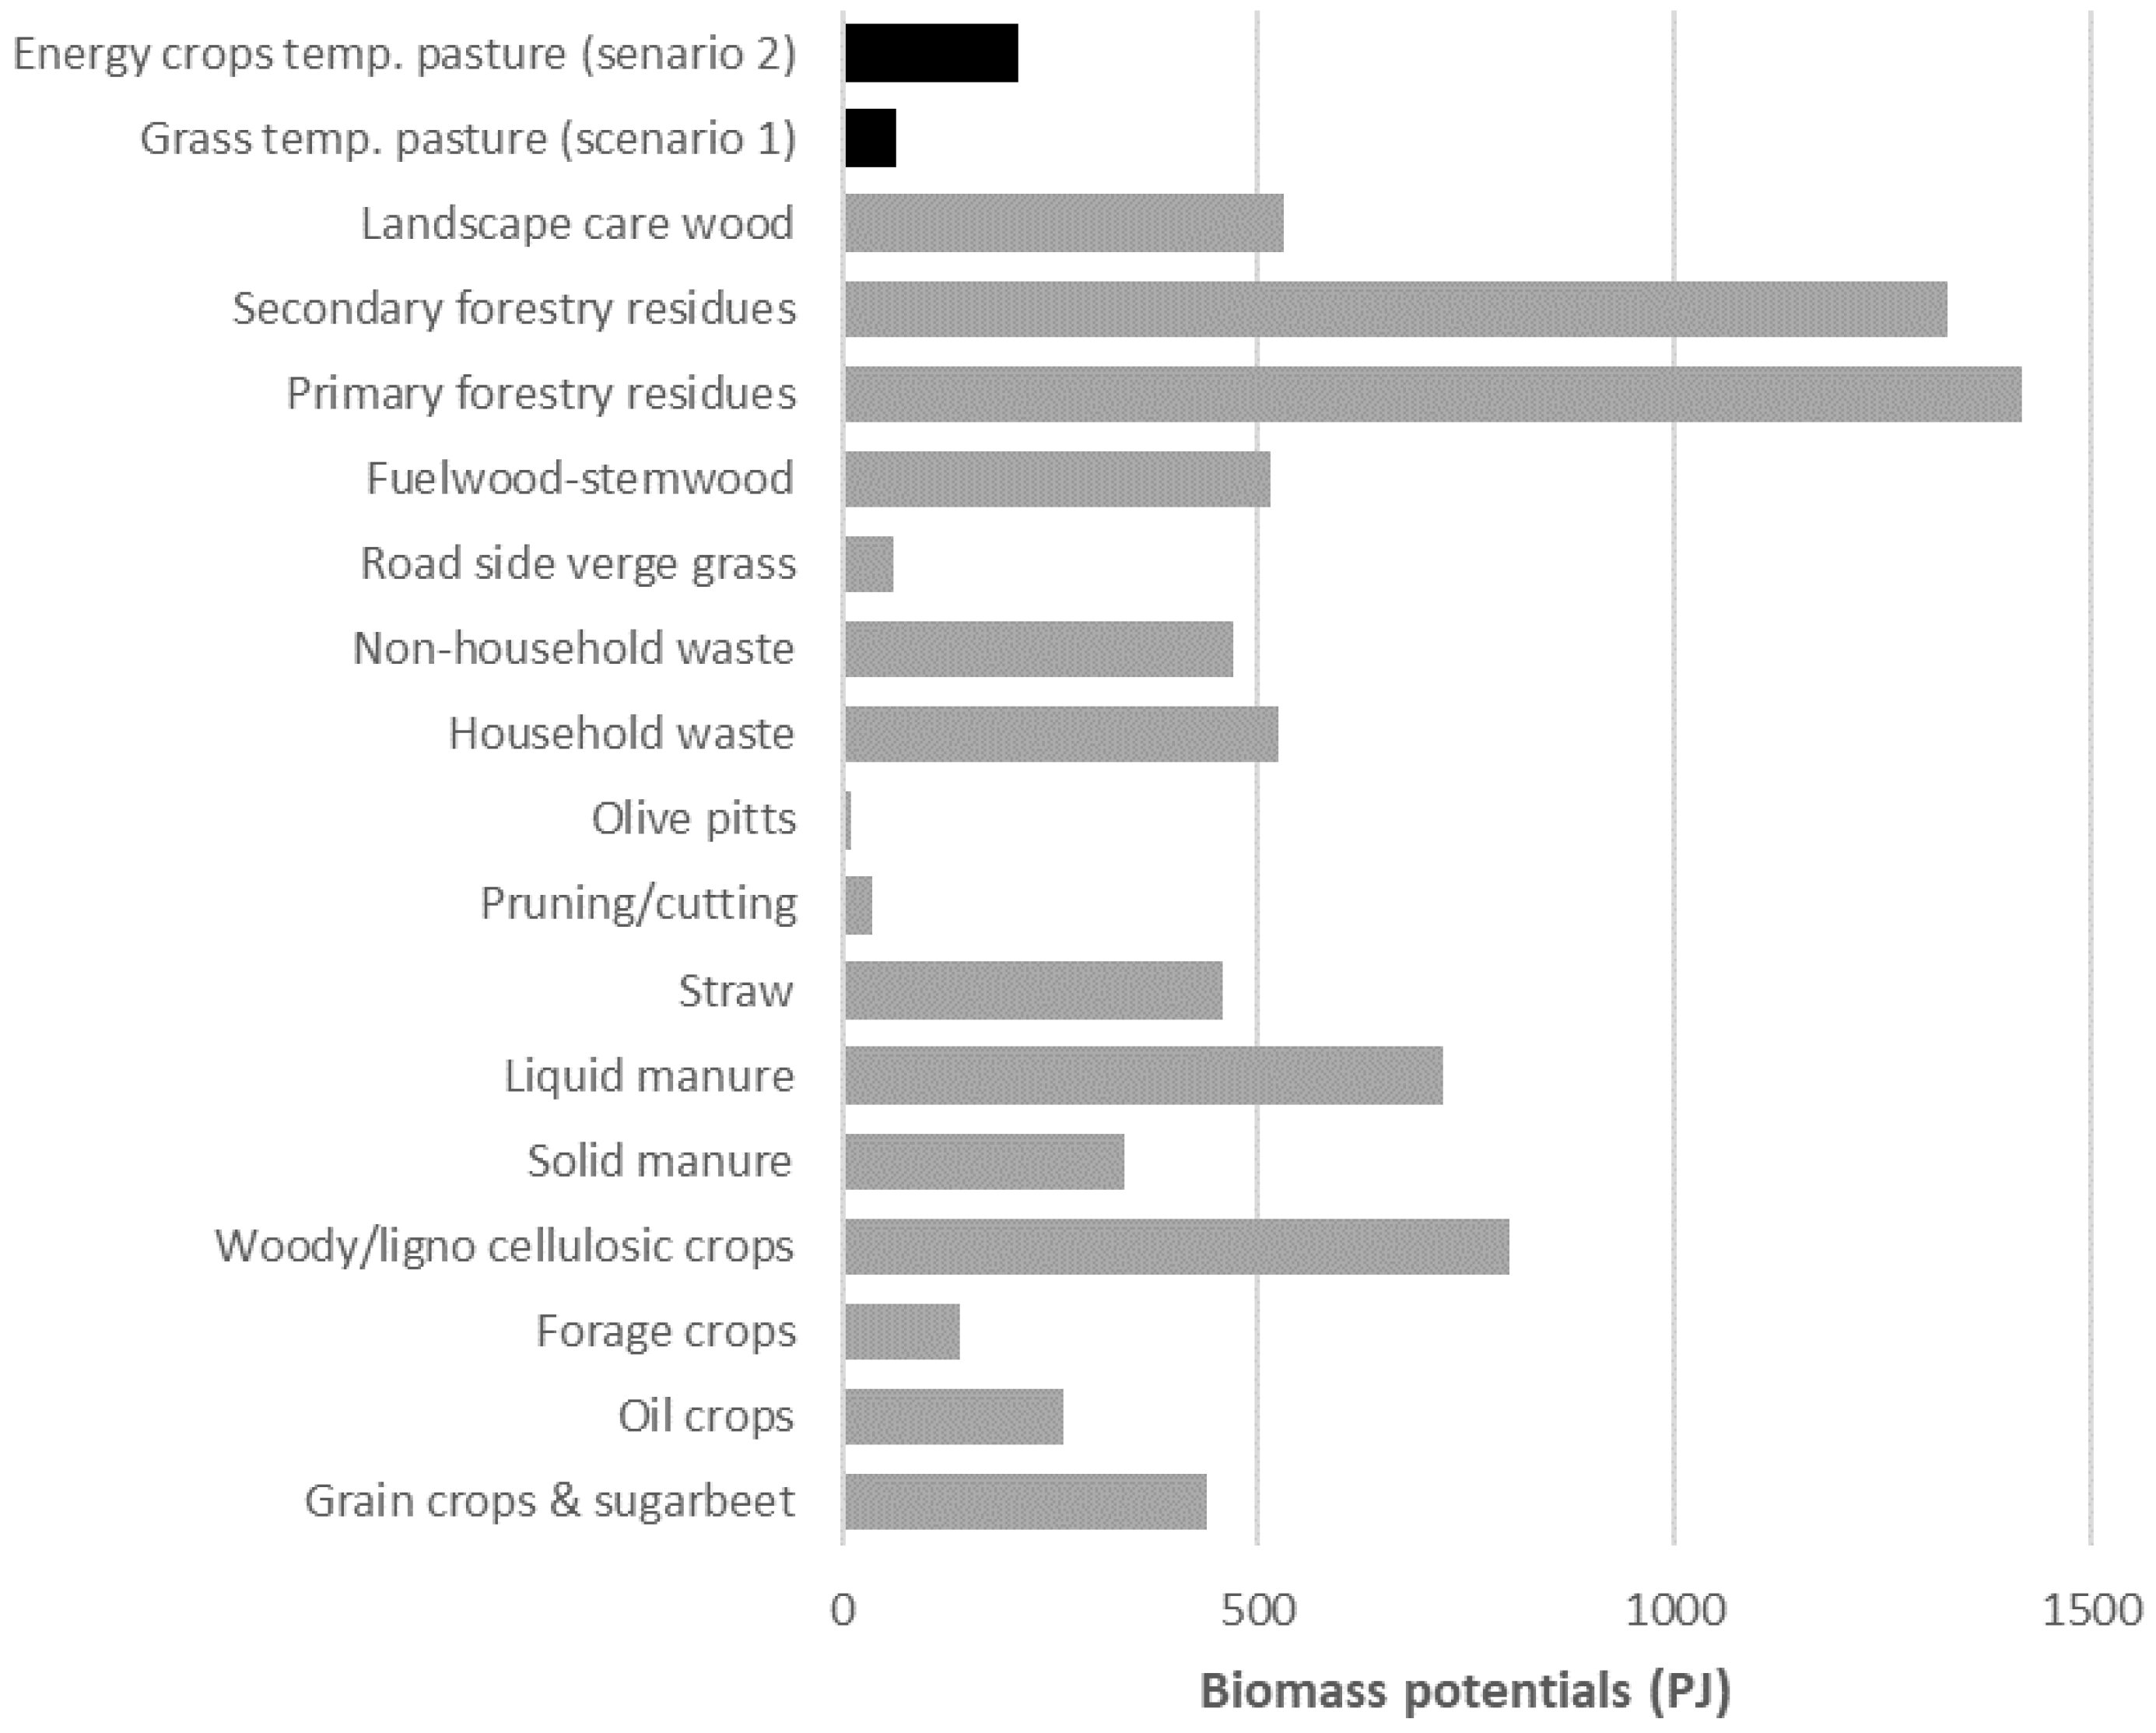
The total surplus area of 853 kha temporary grasslands in the EU-28 is estimated to produce 3.7 million ton dry matter of biomass from conventional grass species (Scenario 1) or 11 million ton dry matter of biomass if grassy energy crops are grown (Scenario 2). The biomass energy potential is 67 PJ yr−1 for scenario 1 and 213 PJ yr−1 for scenario 2 (Table 6). The results of our study are also compared to previous estimates of other fractions of the European biomass potential (Figure 3). This shows that sustainable intensification of temporary grasslands can provide small additional sources of biomass. The share of the total potential shown in Figure 3 is 0.8% for conventional grass (Scenario 1) or 2.5% for energy crops (Scenario 2). Although these potentials are limited, it is important to emphasize that the applied measure enhances the environmental performance of temporary grasslands and the potentials are therefore considered sustainable potentials.
Table 6 presents an overview of the key results for the two scenarios in terms of potential biomass and bioethanol production, and the GHG emission impacts from sustainably intensification grassland and producing bioethanol from additional grass production on surplus grassland. Using conventional grass species (scenario 1) indicates a much lower potential than energy crops (scenario 2), which is not only due to lower grass yields but also due to a lower conversion efficiency to ethanol.
The overall net GHG emission balance is in both scenarios negative, indicating that the implementation of the intensification measures results in an overall carbon sequestration. This is largely due to increased soil organic carbon and due to avoided emissions from substituting fossil fuels. In the scenario of using surplus grass directly for energy rather than growing grassy energy crops, nitrous oxide (N2O) emissions are also lower than in the reference scenario. This is due to the lower fertilizer demand of multi-species mixtures because legumes help fix nitrogen. The trade-off is that less biomass and bioenergy is produced as a result of lower yields and lower conversion efficiencies.
Overall, using conventional grass from surplus grassland for bioethanol production (scenario 1) reduces more emissions than growing grassy energy crops like switchgrass, miscanthus and canary reed (scenario 2) when compared to the reference scenario. Scenario 1 mitigates 5.8 Mt CO2-eq yr−1 while scenario 2 mitigates 4 Mt CO2-eq yr−1. For scenario 1, these emission savings largely come from reduced N2O emissions and to a smaller extent from replacing fossil fuels. For scenario 2, emission mitigation comes from a large amount of avoided emissions from fossil fuels, which compensates for increased N2O emissions. These findings are also represented in the average supply chain emissions for bioethanol (Table 6). Scenario 1 has a large negative emission factor of approximately −170 g MJ−1 while this is 28 g MJ−1 for scenario 2. This results in emission reductions compared to fossil fuels of 302% and 66%, respectively. When the focus is more on mitigating emissions, scenario 1 is preferred, while scenario 2 performs better in terms of the bioethanol potential. Still, bioenergy produced in scenario 2 still meets the 65% emission savings threshold mandated by the European Renewable Energy Directive II [82].
5. Discussion
In order to interpret these results, three main points of discussion are important to consider. First, regarding intensification options, overall data availability on grassland yields and management practices is low, which is a key point of uncertainty related to this study. A key assumption relates to the share of temporary grassland which applies grass-legume mixtures, here assumed to be 50% of all temporary grasslands. A lower or higher percentage would result in a proportional decrease or increase of the potential. However, more data on temporary grassland mixtures and research on strategies for overcoming barriers are needed to develop these assumptions further. In order to estimate the potential yield increases from introducing multi-species mixtures, we applied the average of overyielding and transgressive overyielding in this study (see also Table 1). This assumption was made because farmers do not necessarily choose to sow the best-performing monoculture due to not knowing which species (mixture) performs best and/or due to yield not being the only selection criterion for farmers [27].
Time also has an effect on the productivity of grass-legume mixtures, although differences exist for different management levels: Extensively managed grasslands show that the relationship between number of species and productivity becomes more positive over time [31,83]. However, for intensively managed grasslands the diversity effect declined over time [26,27,39].
In addition to assessing the effect of multi-species use in temporary grasslands, this study also made a first-order approximation of productivity increases for permanent pastures (see Table S3 in supplementary material). This approximation shows that productivity increases in permanent grasslands has a 3–4 times higher carbon sequestration potential than what can be achieved in temporary grasslands. The most promising option for increasing productivity of permanent pastures is fertilizer management, but not much data is available. Grazing and cutting management might also contribute but, in order to be able to more precisely estimate its contribution, it must first be investigated in detail under which conditions productivity is actually increased.
Besides intensification measures, an important element in grassland availability for bioenergy production is the observation that there is a general decline in grazing lands in Europe. Reasons for this decline are the difficulties of managing large herds even with automatic milking systems, less control over feed rations, uncertainty on whether grass supply meets the feed demand of grazing cows in countries where grass growth is delayed in the summer, better grassland utilization, environmental restrictions on reducing mineral losses and labor intensity [84]. These reasons indicate that there is a risk of abandoning more of these pastures in the future. This might provide opportunities for introducing herbaceous energy crops.
Another important point of discussion relates to the farmer’s perception of the use of grass–legumes mixtures and, if surplus grassland becomes available, on farming grassy energy crops. Regarding the use of grass–legume mixtures, van den Pol-van Dasselaar et al. [85,86] have found that farmers often perceive grass–legume mixtures to have a greater temporal and spatial variation than grass only. Legumes are more susceptible to diseases and have less resistance to winter stress than grasses, and grass–legume mixtures are less productive but more difficult to cultivate than grass only. Thus, a lot of different points are raised that are not necessarily in line with research findings, especially those on yields, as described in Section 2. Promotion and implementation of multi-species mixtures must therefore include further knowledge transfer and working with farmers in order to overcome potential implementation barriers. Regarding the farmer’s perspective on farming grassy energy crops, it must be assessed what their interest and willingness is to do so, what they perceive as implementation barriers and how these can be overcome.
Regarding alternative uses of grasses, grasses are not only suitable for direct energy conversion but can also be used as feedstocks for grass biorefineries. Various concepts exist, but they are all largely based on splitting the grass in grass juice and grass fibers and then further refining these to produce high value products [76,87]. Interest and efforts have increasingly been put into investigating higher value applications of the fibers. Klop et al. [75] have shown that grass fibers can be fermented (silage) and then used as livestock feed without effects on feed uptake by dairy cows and milk production. This could also be economically more interesting than energy due to the higher value of feed than energy. A first order estimate by Sanders et al. [74] shows the economic feasibility of the process and economic benefits of higher value end-products. In addition, the biorefinery process has additional environmental impacts as a result of reduced soy imports (the high protein feed from biorefinery can substitute soy meal) while also producing roughage, and phosphate recovery [74]. The displacement of soy meal is particularly interesting from an environmental perspective given that soy production in Latin America is associated with (directly or indirectly) causing deforestation [88] and therefore high land use change emissions. A co-product is biogas or, if upgraded, biomethane [70]. More research is needed in order to better understand the net environmental impacts and the economic performance of grass biorefineries. This includes analysis of the system performance of different grass biorefinery options over the entire life cycle and its sensitivities to assumptions on grass yields, grass type, fractions of grass fibers and juice, conversion efficiencies, substitutability of soy meal and other feed by protein feed from grass biorefinery, and nutrient efficiency/recovery. Based on such assessments, a comparative analysis of costs and different environmental impacts of different grass biorefinery options and bioenergy production systems can then shed light onto the advantages and disadvantages of different options.
6. Conclusions
Our study assessed the sustainable bioenergy potential from intensifying European temporary grasslands and the integral greenhouse gas (GHG) emission effects of both grassland intensification and resulting biomass production for energy in 2030. The key measure to intensify temporary grasslands is the use of multi-species mixtures. When applying this measure, this study found that 853 kha (or 8%) of temporary grassland could be made sustainably available for additional herbaceous biomass production for energy and material purposes. This can be translated to a bioethanol potential of 23 PJ yr−1 (if conventional grass mixture from surplus temporary grassland is used for energy, scenario 1) or 72 PJ yr−1 (if surplus temporary grassland is used for grassy energy crops, scenario 2). The increased bioenergy potential in scenario 2, however comes with a trade-off in terms of GHG emissions. The overall net emission balance is negative in both scenarios, indicating that the implementation of the intensification measures results in an overall emission mitigation. However, more emissions can be mitigated when growing the conventional grass mixture in scenario 1, namely 5.8 Mt CO2-eq yr−1 compared to the reference scenario. In the case of growing grassy energy crops (Scenario 2), 4.0 Mt CO2-eq yr−1 are sequestered. This is largely due to increased soil organic carbon and avoided emissions from substituting fossil fuels. The main reason for the conventional grass mixture to perform better is a strong reduction in nitrous oxide emissions.
This study shows that sustainable intensification of temporary grasslands can provide additional sources of biomass. However, the potential is limited compared to the total European bioenergy potential of other measures such as using agricultural and forestry residues or intensifying crop production. Still, using multi-species mixtures for intensifying temporary grasslands and growing grassy energy crops on surplus land could account for 2.5% of the total European bioenergy potential estimated in the literature while also enhancing the GHG emission performance of temporary grasslands. Moreover, our analysis shows that particularly in France, Poland and Italy, as well as in Scotland, Northeast Romania, and parts of Ireland, large potentials can be found, indicating that regionally this measure could have high added value.
In addition, given that the intensification of temporary grasslands is based on introducing multi-species grasses, this measure does not have the risk of causing biodiversity loss. On the contrary, it is beneficial for biodiversity. Thus, the potential determined in this study is considered sustainable and therefore may be given preference over other measures to increase biomass production for energy. Important next steps are the assessment of costs, identification of other implementation barriers for farmers and strategies for promoting multi-species grass production.
Supplementary Materials
The following are available online at https://0-www-mdpi-com.brum.beds.ac.uk/2073-445X/9/11/457/s1, Table S1: Definitions of grassland types. Figure S1: Distribution of grasslands by type and Table S2: Overview of grasslands in Europe including-Utilized agricultural area and area of permanent and temporary grasslands in EU-28 Member States, Norway and Switzerland in 2013; and Table S3: Intensification of permanent grasslands—First-order approximation.
Author Contributions
Conceptualization, B.W., I.K. and J.P.L.; methodology, I.K. and J.P.L.; software, J.P.L.; formal analysis, B.W., I.K. and J.P.L.; writing—Original draft preparation, I.K. and B.W.; writing—Review and editing, B.W., I.K. and J.P.L.; supervision, B.W.; project administration, B.W.; funding acquisition, B.W. All authors have read and agreed to the published version of the manuscript.
Funding
This research was funded by EIT Climate-KIC through (i) the Fuel Supply Chain Development and Flight Operations (RENJET) project, grant number APSP0002 and (ii) the PhD project “Integrated modelling framework for sustainable European land use change scenarios for the biobased economy, agriculture and economic development”, grant number APEC0044.
Acknowledgments
The authors would like to thank Ric Hoefnagels for his advice on the proposal for this project, Sarah Gerssen-Gondelach for providing data on the GHG emissions for grass-based ethanol production, Nicolette Klijn from HarvestaGG for providing information on the grass biorefinery concept, and Andre Faaij and Rik Leemans for suggestions during the initial development of this research.
Conflicts of Interest
The authors declare no conflict of interest. The funders had no role in the design of the study; in the collection, analyses, or interpretation of data; in the writing of the manuscript, or in the decision to publish the results.
References
- Bauer, N.; Rose, S.K.; Fujimori, S.; Van Vuuren, D.P.; Weyant, J.; Wise, M.; Cui, Y.; Daioglou, V.; Gidden, M.; Kato, E.; et al. Global energy sector emission reductions and bioenergy use: Overview of the bioenergy demand phase of the EMF-33 model comparison. Clim. Chang. 2018, 1–16. [Google Scholar] [CrossRef]
- Fargione, J.; Hill, J.; Tilman, D.; Polasky, S.; Hawthorne, P. Land Clearing and the Biofuel Carbon Debt. Science 2008, 319, 1235–1238. [Google Scholar] [CrossRef] [Green Version]
- Searchinger, T.D.; Heimlich, R.; Houghton, R.A.; Dong, F.; Elobeid, A.; Fabiosa, J.; Tokgoz, S.; Hayes, D.; Yu, T.-H. Use of U.S. Croplands for Biofuels Increases Greenhouse Gases Through Emissions from Land-Use Change. Science 2008, 319, 1238–1240. [Google Scholar] [CrossRef]
- Daioglou, V.; Doelman, J.; Wicke, B.; Faaij, A.; Van Vuuren, D.P. Integrated assessment of biomass supply and demand in climate change mitigation scenarios. Glob. Environ. Chang. 2019, 54, 88–101. [Google Scholar] [CrossRef] [Green Version]
- Searchinger, T.D.; Estes, L.; Thornton, P.K.; Beringer, T.; Notenbaert, A.; I Rubenstein, D.; Heimlich, R.; Licker, R.; Herrero, M. High carbon and biodiversity costs from converting Africa’s wet savannahs to cropland. Nat. Clim. Chang. 2015, 5, 481–486. [Google Scholar] [CrossRef]
- Humpenöder, F.; Popp, A.; Bodirsky, B.L.; Weindl, I.; Biewald, A.; Lotze-Campen, H.; Dietrich, J.P.; Klein, D.; Kreidenweis, U.; Müller, C.; et al. Large-scale bioenergy production: How to resolve sustainability trade-offs? Environ. Res. Lett. 2018, 13, 024011. [Google Scholar] [CrossRef] [Green Version]
- De Wit, M.; Londo, M.; Faaij, A. Productivity developments in European agriculture: Relations to and opportunities for biomass production. Renew. Sustain. Energy Rev. 2011, 15, 2397–2412. [Google Scholar] [CrossRef]
- Gerssen-Gondelach, S.J.; Wicke, B.; Faaij, A.P.C. GHG emissions and other environmental impacts of indirect land use change mitigation. GCB Bioenerg. 2016, 9, 725–742. [Google Scholar] [CrossRef] [Green Version]
- Burney, J.A.; Davis, S.J.; Lobell, D.B. Greenhouse gas mitigation by agricultural intensification. Proc. Natl. Acad. Sci. USA 2010, 107, 12052–12057. [Google Scholar] [CrossRef] [Green Version]
- Donald, P.F.; Green, R.E.; Heath, M.F. Agricultural intensification and the collapse of Europe’s farmland bird populations. Proc. R. Soc. B Boil. Sci. 2001, 268, 25–29. [Google Scholar] [CrossRef]
- Kleijn, D.; Kohler, F.; Báldi, A.; Batáry, P.; Concepción, E.; Clough, Y.; Díaz, M.; Gabriel, D.; Holzschuh, A.; Knop, E.; et al. On the relationship between farmland biodiversity and land-use intensity in Europe. Proc. R. Soc. B Boil. Sci. 2009, 276, 903–909. [Google Scholar] [CrossRef]
- Melillo, J.M.; Reilly, J.M.; Kicklighter, D.W.; Gurgel, A.C.; Cronin, T.W.; Paltsev, S.; Felzer, B.S.; Wang, X.; Sokolov, A.P.; Schlosser, C.A. Indirect Emissions from Biofuels: How Important? Science 2009, 326, 1397–1399. [Google Scholar] [CrossRef] [Green Version]
- Stehfest, E.; Ros, J.; Bouwman, L. Indirect Effects of Biofuels: Intensification of Agricultural Production; Netherlands Environmental Assessment Agency PBL: Bilthoven, The Netherlands, 2010. [Google Scholar]
- Wicke, B.; Van Der Hilst, F.; Daioglou, V.; Banse, M.; Beringer, T.; Gerssen-Gondelach, S.J.; Heijnen, S.; Karssenberg, D.; Laborde, D.; Lippe, M.; et al. Model collaboration for the improved assessment of biomass supply, demand, and impacts. GCB Bioenergy 2014, 7, 422–437. [Google Scholar] [CrossRef] [Green Version]
- Kluts, I.; Wicke, B.; Leemans, R.; Faaij, A.P. Sustainability constraints in determining European bioenergy potential: A review of existing studies and steps forward. Renew. Sustain. Energy Rev. 2017, 69, 719–734. [Google Scholar] [CrossRef] [Green Version]
- Eurostat. Fodder crops: Number of Farms and Areas by Agricultural Size of Farm (UAA) and Size of Fodder Crops Area (ef_lsfodderaa). Available online: https://appsso.eurostat.ec.europa.eu/nui/show.do?dataset=ef_lsfodderaa&lang=en (accessed on 15 September 2019).
- Ketzer, D.; Rösch, C.; Haase, M. Assessment of sustainable Grassland biomass potentials for energy supply in Northwest Europe. Biomass Bioenergy 2017, 100, 39–51. [Google Scholar] [CrossRef]
- Qi, A.; Holland, R.A.; Taylor, G.; Richter, G.M. Grassland futures in Great Britain—Productivity assessment and scenarios for land use change opportunities. Sci. Total. Environ. 2018, 634, 1108–1118. [Google Scholar] [CrossRef]
- Hansson, J.; Berndes, G.; Stupak, I.; Freitas, F.L.M.; Sparovek, G.; De Freitas, F.L.M. How is biodiversity protection influencing the potential for bioenergy feedstock production on grasslands? GCB Bioenergy 2018, 11, 517–538. [Google Scholar] [CrossRef]
- Velthof, G.L.; Oudendag, D.; Witzke, H.; Asman, W.; Klimont, Z.; Oenema, O. Integrated Assessment of Nitrogen Losses from Agriculture in EU-27 using MITERRA-EUROPE. J. Environ. Qual. 2009, 38, 402–417. [Google Scholar] [CrossRef]
- European Commission. Regulation (EC) 1059/2003 of the European Parliament and of the Council of 26 May 2003 on the Establishment of a Common Classification of Territorial Units for Statistics (NUTS); Office for Official Publications of the European Communities: Luxembourg, 2018. [Google Scholar]
- Lesschen, J.P.; Elbersen, B.; Hazeu, G.; van Doorn, A.; Mucher, S.; Velthof, G. Defining and Classifying Grasslands in Europe; Wageningen University and Research: Wageningen, The Netherlands, 2014. [Google Scholar]
- Hector, A. Plant Diversity and Productivity Experiments in European Grasslands. Science 1999, 286, 1123–1127. [Google Scholar] [CrossRef] [Green Version]
- Hooper, D.U.; Dukes, J.S. Overyielding among plant functional groups in a long-term experiment. Ecol. Lett. 2003, 7, 95–105. [Google Scholar] [CrossRef]
- Tilman, D.; Knops, J.; Wedin, D.; Reich, P.; Ritchie, M.; Siemann, E. The Influence of Functional Diversity and Composition on Ecosystem Processes. Science 1997, 277, 1300–1302. [Google Scholar] [CrossRef] [Green Version]
- Kirwan, L.; Lüscher, A.; Sebastià, M.T.; Finn, J.A.; Collins, R.P.; Porqueddu, C.; Helgadottir, A.; Baadshaug, O.H.; Brophy, C.; Coran, C.; et al. Evenness drives consistent diversity effects in intensive grassland systems across 28 European sites. J. Ecol. 2007, 95, 530–539. [Google Scholar] [CrossRef]
- Finn, J.A.; Kirwan, L.; Connolly, J.; Sebastià, M.T.; Helgadóttir, Á.; Baadshaug, O.H.; Bélanger, G.; Black, A.; Brophy, C.; Collins, R.P.; et al. Ecosystem function enhanced by combining four functional types of plant species in intensively managed grassland mixtures: A 3-year continental-scale field experiment. J. Appl. Ecol. 2013, 50, 365–375. [Google Scholar] [CrossRef] [Green Version]
- Loreau, M. Biodiversity and ecosystem functioning: Recent theoretical advances. Oikos 2000, 91, 3–17. [Google Scholar] [CrossRef] [Green Version]
- Tilman, D. The Ecological Consequences of Changes in Biodiversity: A Search for General Principles. Ecology 1999, 80, 1455. [Google Scholar] [CrossRef]
- Tilman, D. Diversity and Productivity in a Long-Term Grassland Experiment. Science 2001, 294, 843–845. [Google Scholar] [CrossRef] [Green Version]
- Spehn, E.M.; Hector, A.; Joshi, J.; Scherer-Lorenzen, M.; Schmid, B.; Bazeley-White, E.; Beierkuhnlein, C.; Caldeira, M.C.; Diemer, M.; Dimitrakopoulos, P.G.; et al. Ecosystem effects of biodiversity manipulatons in European grasslands. Ecol. Monogr. 2005, 75, 37–63. [Google Scholar] [CrossRef] [Green Version]
- Nyfeler, D.; Huguenin-Elie, O.; Suter, M.; Frossard, E.; Connolly, J.; Lüscher, A. Strong mixture effects among four species in fertilized agricultural grassland led to persistent and consistent transgressive overyielding. J. Appl. Ecol. 2009, 46, 683–691. [Google Scholar] [CrossRef]
- Collins, R.P.; Delagarde, R.; Husse, S. Biomass production in multispecies and grass monoculture swards under cutting and rotational grazing. In Proceedings of the European Grassland Federation EGF at 50: The Future of European Grasslands, Aberystwyyth, Wales, UK, 7–11 September 2014; pp. 719–721. [Google Scholar]
- Kirwan, L.; Connolly, J.; Brophy, C.; Baadshaug, O.; Bélanger, G.; Black, A.; Carnus, T.; Collins, R.; Čop, J.; Delgado, I.; et al. The Agrodiversity Experiment: Three years of data from a multisite study in intensively managed grasslands. Ecology 2014, 95, 2680. [Google Scholar] [CrossRef] [Green Version]
- Spehn, E.M.; Hector, A.; Joshi, J.; Scherer-Lorenzen, M.; Schmid, B.; Bazeley-White, E.; Beierkuhnlein, C.; Caldeira, M.C.; Diemer, M.; Dimitrakopoulos, P.G.; et al. Data from the BIODEPTH project (15 ecosystem-process variables measured at eight different European grassland field sites over three years) together with metadata and a table with site information. Ecol. Arch. 2005, 75, M075-001-S. [Google Scholar]
- Sánchez, B.; Medina, F.; Iglesias, A. Typical Farming Systems and Trends in Crop and Soil Management in Europe. SmartSOIL Project Deliverable 2.2; Universidad Politécnica de Madrid: Madrid, Spain, 2013; Available online: https://smartsoil.eu/fileadmin/www.smartsoil.eu/WP2/D2_2_Final.pdf (accessed on 3 November 2020).
- Metzger, M.J.; Shkaruba, A.D.; Jongman, R.; Bunce, R. Descriptions of the European Environmental Zones and Strata Wageningen University and Research: Wageningen, The Netherlands. 2012. Available online: https://edepot.wur.nl/197197 (accessed on 3 November 2020).
- Trenbath, B. Biomass Productivity of Mixtures. Adv. Agron. 1974, 26, 177–210. [Google Scholar] [CrossRef]
- Suter, M.; Connolly, J.; Finn, J.A.; Loges, R.; Kirwan, L.; Sebastià, M.-T.; Lüscher, A. Nitrogen yield advantage from grass-legume mixtures is robust over a wide range of legume proportions and environmental conditions. Glob. Chang. Biol. 2015, 21, 2424–2438. [Google Scholar] [CrossRef] [Green Version]
- Huyghe, C. Country Pasture/Forage Resource Profile for France; FAO: Rome, Italy, 2012. [Google Scholar]
- Brum, O.B.; López, S.; Garcia, R.; Andrés, S.; Calleja, A. Influence of harvest season, cutting frequency and nitrogen fertilization of mountain meadows on yield, floristic composition and protein content of herbage. Rev. Bras. Zootec. 2009, 38, 596–604. [Google Scholar] [CrossRef] [Green Version]
- Weigelt, A.; Weisser, W.W.; Buchmann, N.; Scherer-Lorenzen, M. Biodiversity for multifunctional grasslands: Equal productivity in high-diversity low-input and low-diversity high-input systems. Biogeosci. Discuss. 2009, 6, 3187–3214. [Google Scholar] [CrossRef] [Green Version]
- McEvoy, M.; O’Donovan, M.; Kennedy, E.; Murphy, J.P.; Delaby, L.T.M. Boland Effect of pregrazing herbage mass and pasture allowance on the lactation performance of Holstein-Friesian dairy cows. J. Dairy Sci. 2009, 92, 414–422. [Google Scholar] [CrossRef]
- Wims, C.M.; Delaby, L.; Boland, T.M.; O’Donovan, M. Effect of pre-grazing herbage mass on dairy cow performance, grass dry matter production and output from perennial ryegrass (Lolium perenne L.) pastures. Animal 2014, 8, 141–151. [Google Scholar] [CrossRef] [Green Version]
- Tuñon, G.E. Improving the Use of Perennial Ryegrass Swards for Dairying in Ireland. Ph.D. thesis, Massey University, Palmerston North, New Zealand, 2013. [Google Scholar]
- Lanta, V.; Dolezal, J.; Lantová, P.; Kelíšek, J.; Mudrák, O. Effects of pasture management and fertilizer regimes on botanical changes in species-rich mountain calcareous grassland in Central Europe. Grass Forage Sci. 2009, 64, 443–453. [Google Scholar] [CrossRef]
- Fernández-Núñez, E.; Pires, J.M.; Fernandes, A.; Pires, J.; Aguiar, C.; Galvão, L.; Moreira, N. Grazing regimes and fertilisation rates: Effects on dry matter yields, crude protein content and digestibility of meadows in the Northeast of Portugal. In Proceedings of the 24th General Meeting of the European Grassland Federation, Lublin, Poland, 3–7 June 2012; Volume 17, pp. 311–313. [Google Scholar]
- Henderson, B.B.; Gerber, P.J.; Hilinski, T.E.; Falcucci, A.; Ojima, D.S.; Salvatore, M.; Conant, R.T. Greenhouse gas mitigation potential of the world’s grazing lands: Modeling soil carbon and nitrogen fluxes of mitigation practices. Agric. Ecosyst. Environ. 2015, 207, 91–100. [Google Scholar] [CrossRef]
- Conant, R.T. Challenges and opportunities for carbon sequestration in grassland systems. A technical report on grassland management and climate change mitigation. Integr. Crop Manag. 2010, 9, 55. [Google Scholar]
- Peeters, A. Country Pasture/Forage Resource Profile for Belgium; FAO: Rome, Italy, 2010. [Google Scholar]
- Selge, A. Country Pasture/Forage Resource Profile for Estonia; FAO: Rome, Italy, 2006. [Google Scholar]
- O’Mara, F. Country Pasture/Forage Resource Profile for Ireland; FAO: Rome, Italy, 2008. [Google Scholar]
- Adamovich, A. Country Pasture/Forage Resource Profile for Latvia; FAO: Rome, Italy, 2005. [Google Scholar]
- Hamnett, R.G. Country Pasture/Forage Resource Profile for Lithuania; FAO: Rome, Italy, 2006. [Google Scholar]
- Hamnett, R.G. Country Pasture/Forage Resource Profile for Slovak Republic; FAO: Rome, Italy, 2006. [Google Scholar]
- Hopkins, A. Country Pasture/Forage Resource Profile for United Kingdom; FAO: Rome, Italy, 2008. [Google Scholar]
- Britz, W.; Witzke, P. CAPRI Model Documentation 2014; Bonn University: Bonn, Germany, 2014; Available online: https://www.capri-model.org/docs/capri_documentation.pdf (accessed on 16 November 2020).
- Klimont, Z.; Brink, C. Modelling of Emissions of Air Pollutants and Greenhouse Gases from Agricultural Sources in Europe; IIASA IR 04-048 2004; International Institute of Applied Systems Analysis: Laxenburg, Austria, 2004. [Google Scholar]
- Lesschen, J.P.; Berg, M.V.D.; Westhoek, H.; Witzke, H.; Oenema, O. Greenhouse gas emission profiles of European livestock sectors. Anim. Feed. Sci. Technol. 2011, 16–28. [Google Scholar] [CrossRef]
- De Vries, W.; Leip, A.; Reinds, G.; Kros, J.; Lesschen, J.; Bouwman, L. Comparison of land nitrogen budgets for European agriculture by various modeling approaches. Environ. Pollut. 2011, 159, 3254–3268. [Google Scholar] [CrossRef] [PubMed]
- IPCC 2006. IPCC Guidelines for National Greenhouse Gas Inventories; Institute for Global Environmental Strategies: Hayama, Japan, 2006. [Google Scholar]
- Velthof, G.L.; Oudendag, D.A.; Oenema, O. Development and Application of the Integrated Nitrogen Model MITERRA-EUROPE; Wageningen University and Research: Wageningen, The Netherlands, 2007. [Google Scholar]
- Smit, H.; Metzger, M.; Ewert, F. Spatial distribution of grassland productivity and land use in Europe. Agric. Syst. 2008, 98, 208–219. [Google Scholar] [CrossRef]
- EUROSTAT. Permanent Grassland by NUTS 2 Regions. Available online: https://appsso.eurostat.ec.europa.eu/nui/show.do?dataset=ef_lus_pegrass&lang=en (accessed on 19 June 2020).
- Coleman, K.; Jenkinson, D.; Crocker, G.; Grace, P.; Klír, J.; Körschens, M.; Poulton, P.; Richter, D. Simulating trends in soil organic carbon in long-term experiments using RothC-26.3. Geoderma 1997, 81, 29–44. [Google Scholar] [CrossRef]
- Tong, Z.; Pullammanappallil, P.; Teixeira, A.A. How Ethanol Is Made from Cellulosic Biomass. AE493, University of Florida (IFAS Extension). 2012. Available online: http://edis.ifas.ufl.edu/pdffiles/AE/AE49300.pdf (accessed on 19 June 2020).
- Sharma, H.S.; Lyons, G.; McRoberts, C. Biorefining of perennial grasses: A potential sustainable option for Northern Ireland grassland production. Chem. Eng. Res. Des. 2011, 89, 2309–2321. [Google Scholar] [CrossRef]
- Vienna University of Technology. BIOBIB—A Database for Biofuels. Available online: http://www.vt.tuwien.ac.at/biobib/EN/ (accessed on 19 June 2020).
- Phyllis2. Database for the Physico-Chemical Composition of (Treated) Lignocellulosic Biomass, Micro- and Macroalgae, Various Feedstocks for Biogas Production and Biochar. Available online: https://phyllis.nl/ (accessed on 8 December 2019).
- Djomo, S.N.; Knudsen, M.T.; Martinsen, L.; Andersen, M.S.; Ambye-Jensen, M.; Møller, H.B.; Hermansen, J.E. Green proteins: An energy-efficient solution for increased self-sufficiency in protein in Europe. Biofuels Bioprod. Biorefining 2020, 14, 605–619. [Google Scholar] [CrossRef]
- Sharma, H.; Mandl, M. Green Biorefinery. Sustain. Bioenerg. Prod. 2014, 535–564. [Google Scholar] [CrossRef]
- Kumar, D.; Murthy, G.S. Life cycle assessment of energy and GHG emissions during ethanol production from grass straws using various pretreatment processes. Int. J. Life Cycle Assess. 2012, 17, 388–401. [Google Scholar] [CrossRef]
- Charlton, A.; Elias, R.; Fish, S.A.; Fowler, P.; Gallagher, J. The biorefining opportunities in Wales: Understanding the scope for building a sustainable, biorenewable economy using plant biomass. Chem. Eng. Res. Des. 2009, 87, 1147–1161. [Google Scholar] [CrossRef]
- Sanders, J.P.M.; van Liere, J.; de Wilt, J.G. Geraffineerd Voeren: Naar een Sluitende Mineralenkringloop Door Raffinage van Lokaal Geteeld Veevoor; Wageningen University and Research: Wageningen, The Netherlands, 2016. [Google Scholar]
- Klop, A.; Durksz, D.; Zonderland, J.; Koopmans, B. Grasraffinage en Gebruik van Grasvezel in de Rundveevoeding; Wageningen University and Research: Wageningen, The Netherlands, 2015. [Google Scholar]
- Kamm, B.; Schönicke, P.; Hille, C. Green biorefinery—Industrial implementation. Food Chem. 2016, 197, 1341–1345. [Google Scholar] [CrossRef]
- Grassa, B.V. Bioraffinage. Available online: http://grassa.nl/ (accessed on 31 October 2016).
- HarvestaGG. Het HarvestaGG Green Goods Concept. Available online: http://www.harvestagg.nl/green-goods-concept1.html (accessed on 31 October 2016).
- Grass, S. Utilization of Grass for Production of Fibres, Protein and Energy. In Biomass and Agriculture: Sustainability, Markets and Policies; OECD, Ed.; OECD Publishing: Paris, France, 2004. [Google Scholar]
- European Commission. Directive 2009/28/EC of the European Parliament and of the Council of 23 April 2009 on the Promotion of the Use of Energy from Renewable Sources and Amending and Subsequently Repealing Directives 2001/77/EC and 2003/30/EC; Office for Official Publications of the European Communities: Luxembourg, 2009. [Google Scholar]
- Elbersen, B.; Staritsky, I.; Hengeveld, G.; Jeurissen, L.; Lesschen, J.-P. Outlook of Spatial Biomass Value Chains in EU 28—Deliverable 2.3 of the Biomass Policies Project; Wageningen University and Research: Wageningen, The Netherlands, 2016. [Google Scholar]
- European Parliament and Council. Directive (Eu) 2018/2001 of the European Parliament and of the Council of 11 December 2018 on the Promotion of the Use of Energy from Renewable Sources (Recast); Office for Official Publications of the European Communities: Luxembourg, 2018. [Google Scholar]
- Cardinale, B.J.; Wright, J.P.; Cadotte, M.W.; Carroll, I.T.; Hector, A.; Srivastava, D.S.; Loreau, M.; Weis, J.J. Impacts of plant diversity on biomass production increase through time because of species complementarity. Proc. Natl. Acad. Sci. USA 2007, 104, 18123–18128. [Google Scholar] [CrossRef] [Green Version]
- Van den Pol-van Dasselaar, A.; Pinxterhuis, A.; de Vliegher, D.; Hennessy, J.B.; Peyraud, J.L. Research Methodology of Grazing Report 405; Wageningen University and Research: Wageningen, The Netherlands, 2011; p. 19. [Google Scholar]
- Van den Pol-van Dasselaar, A.; Golinski, P.; Hennessy, D.; Huyghe, C.; Parente, G.; Peyraud, J.L. Appreciation of the functions of grasslands by European stakeholders. In Proceedings of the 25th General Meeting of the European Grassland Federation, Aberystwyth, Wales, UK, 7–11 September 2014; Volume 19, pp. 766–770. [Google Scholar]
- Van den Pol-van Dasselaar, A.; Goliński, P.; Hennessy, D.; Huyghe, C.; Parente, G.; Peyraud, J.L.; Pinxterhuis, J.B. Stakeholders’ requirements and expectations with respect to multi-functionality of grasslands in Europe. In Proceedings of the 25th General Meeting of the European Grassland Federation, Aberystwyth, Wales, UK, 7–11 September 2014; Volume 17, pp. 762–764. [Google Scholar]
- Hermansen, J.E.; Jørgensen, U.; Lærke, P.E.; Manevski, K.; Jensen, S.K.; Weisbjerg, M.R.; Dalsgaard, T.K.; Asp, T.; Amby-Jensen, M.; Aage, C.; et al. Green Biomass—Protein Production through Bio-Refining; Aarhus University/Danish Center for Food and Agriculture: Aarhus, Danmark, 2017; Available online: https://orgprints.org/31701/1/DCArapport093.pdf (accessed on 3 November 2020).
- Barona, E.; Ramankutty, N.; Hyman, G.; Coomes, O.T. The role of pasture and soybean in deforestation of the Brazilian Amazon. Environ. Res. Lett. 2010, 5, 024002. [Google Scholar] [CrossRef]
Figure 1.
Surplus temporary grassland from sustainable intensification measures, by country and type of energy grass that is suitable on the surplus land in 2030 (Scenario 2).
Figure 1.
Surplus temporary grassland from sustainable intensification measures, by country and type of energy grass that is suitable on the surplus land in 2030 (Scenario 2).

Figure 2.
Spatial distribution of herbaceous biomass production on surplus temporary grasslands made available through sustainable intensification in 2030. The results are presented for Scenario 2. Although biomass production volume differs the spatial pattern is the same for Scenario 1.
Figure 2.
Spatial distribution of herbaceous biomass production on surplus temporary grasslands made available through sustainable intensification in 2030. The results are presented for Scenario 2. Although biomass production volume differs the spatial pattern is the same for Scenario 1.

Figure 3.
Biomass production potential from sustainable intensification of temporary grasslands (in black) compared to other fractions of the European biomass potential (in grey) as determined in the Biomass Policies project [81].
Figure 3.
Biomass production potential from sustainable intensification of temporary grasslands (in black) compared to other fractions of the European biomass potential (in grey) as determined in the Biomass Policies project [81].


Table 1.
Yield ratios of average mixture and average monoculture (overyielding) and average mixture and best performing monoculture (transgressive overyielding) in intensively and extensively managed grasslands per climate zone 1.
Table 1.
Yield ratios of average mixture and average monoculture (overyielding) and average mixture and best performing monoculture (transgressive overyielding) in intensively and extensively managed grasslands per climate zone 1.
| Climate Zone 1 | Intensively Managed Grasslands 2 | Extensively Managed Grasslands 3 | ||||
|---|---|---|---|---|---|---|
| Grass–Legume Mixture | Grass–Legume Mixture | Grass–Legume–Forbs Mixture | ||||
| Overyielding 4 | Transgressive overyielding 4 | Overyielding 4 | Transgressive overyielding 4 | Overyielding 4 | Transgressive overyielding 4 | |
| Alpine | 1.48 | 1.12 | n.a.5 | n.a. 5 | n.a. 5 | n.a. 5 |
| Atlantic | 1.45 | 1.30 | 1.11 | 0.78 | 1.51 | 1.04 |
| Boreal | 1.18 | 1.06 | 2.95 | 1.28 | 2.04 | 0.88 |
| Continental | 1.54 | 1.31 | 1.98 | 1.38 | 2.25 | 1.57 |
| Mediterranean | 1.36 | 1.00 | 1.02 | 0.5 | 1.17 | 0.58 |
1 Climate zones as defined in MITERRA-Europe [36,37]. 2 Kirwan et al. [34]. 3 Spehn et al. [35]. 4 To measure the performance of multi-species mixtures compared to monocultures, the concepts of overyielding and transgressive overyielding are used. As the best performing monoculture can be selected in temporary grasslands, the mixture should perform better than the best-performing monoculture. This is called transgressive overyielding, where the average yield of the mixture exceeds the yield of the best-performing monoculture. Overyielding is the situation when the average yield of the mixture exceeds the average yield of the monoculture [38]. 5 n.a.: not available. No experimental site in the Alpine climate zone was included in Spehn et al. [35].
Table 2.
Use of multi-species mixtures in countries with large shares of temporary grasslands.
| Country 1 | Use of Mixtures | Source |
|---|---|---|
| Belgium | Mainly one or two species, except in the Ardennes (NUTS-2 region Luxembourg) where multi-species mixtures, usually up to five species, are common | [50] |
| Estonia | Tendency towards the use of mixtures with few species, but traditionally multi-species mixtures with 5–6 species were used | [51] |
| France | Thirty percent of temporary grassland is sown with pure grass in 2001–2003, 70% with multi-species mixtures | [40] |
| Ireland | Very few pastures that derive significant nitrogen from clover | [52] |
| Latvia | Sown grasslands for grazing are usually sown with a mixture of 4–6 species, while grasslands for cutting are sown with two species mixtures | [53] |
| Lithuania | Seed mixtures tend to contain several species | [54] |
| Slovakia | Seed mixtures are based on complex combinations and consists more species than typical for Western European mixtures. However, grasslands for grazing could be improved by using limited species than the current seed mix | [55] |
| United Kingdom | Temporary grassland usually consists of perennial ryegrass only | [56] |
1 Other countries with high shares of temporary grassland area that are missing here due to lack of data on the use of multi-species mixtures are Denmark, Finland, Sweden, Norway, Italy, Luxembourg, the Netherlands and Switzerland.
Table 3.
Overview of the land use scenarios for 2030.
| Land Use Scenario | Description |
|---|---|
| Reference excl. intensification measures |
|
| Scenario 1: intensification and conventional grass (mixture) |
|
| Scenario 2: intensification and herbaceous energy crop |
|
Table 4.
Input data for converting grass to ethanol.
| Parameter | Unit | Value | Source |
|---|---|---|---|
| Miscanthus—energy content | MJ kg−1 DM (HHV) | 19.1 | [67] |
| Switchgrass—energy content | MJ kg−1 DM (HHV) | 18.4 | [67] |
| Reed canary grass—energy content | MJ kg−1 DM (HHV) | 18.1 | [67] |
| Grass mixture—energy content | MJ kg−1 DM (HHV) | 18.0 1 | [68,69] |
| Conversion efficiency of bioethanol (biochemical conversion) | MJ ethanol MJ−1 raw biomass (HHV) | 0.34 2 (0.34–0.39) | [8] |
1 The energy content of different grass species can vary strongly [69]. As a mixture of species is applied here, but shares and species are not defined, we make an assumption on the energy content of the grass mixture being slightly lower than the average of miscanthus, switchgrass and reed canary grass. We acknowledge that this may still be an optimistic estimate (see e.g., [70] who apply a value for a grass/clover grass = 13.5 MJ kg−1 (LHV); no indication is given though whether this is dry or fresh biomass). 2 Based on a brief literature review of recent publications on advanced bioethanol conversion, Gerssen-Gondelach et al. [8] applied a grass-to-bioethanol conversion efficiency (HHV) of 35% for the short term. However, they also accounted for grass storage losses of 3%, which is considered in the value presented here. Other studies have applied higher conversion efficiencies. For example, de Wit et al. [7] applied 0.43 (0.38–0.48) MJfuel MJ−1raw biomass based on JRC (2008 in [7]) results for farmed wood ethanol and farmed wood Fischer-Tropsch disesel (range). Given the more recent review by Gerssen-Gondelach which also includes data from the first commercial lignocellulosic biofuel plants, these values are considered more realistic estimates.
Table 5.
Input data for GHG emission balance.
| Parameter | Unit | Value |
|---|---|---|
| Emission factor ethanol (without emissions from fertilizer use; sum of cultivation, processing, conversion and transport) | g CO2-eq MJ−1 | −2.1 |
| - Cultivation (without emissions from fertilizer use) 1 | g CO2-eq MJ−1 | 5.8 |
| - Processing 2 | g CO2-eq MJ−1 | 1.0 |
| - Conversion 3 | g CO2-eq MJ−1 | −9.1 |
| - Transport 2 | g CO2-eq MJ−1 | 0.2 |
| Fossil fuel comparator (average diesel and gasoline, including supply chain and combustion) 4 | g CO2-eq MJ−1 | 83.8 |
1 The emissions for cultivation exclude emissions from fertilizer application in the cultivation stage and from changes in soil organic carbon because these emissions are determined by MITERRA. Other emissions from cultivation (e.g., fertilizer production, grass rhizome production and diesel consumption) are based on [8]. 2 Processing and transport emissions are based on [8]. 3 Conversion includes pre-treatment, hydrolysis and fermentation. While pre-treatment is energy intensive, fermentation co-produces electricity. Part of this electricity is used in the conversion process and the remainder can displace fossil fuel-based electricity (we apply an average fuel mix for Europe, [8]). Both the emission burden and benefit are accounted for in the emissions from converting grass to ethanol. The net effect is a negative emission factor for conversion. For a detailed description of how the emission factor is determined and what assumptions it is based on, see Table 4 in [8]. 4 The fossil fuel comparator is taken from [80].
Table 6.
Biomass and bioethanol production from grassland intensification and resulting changes in GHG emissions, by scenario.
Table 6.
Biomass and bioethanol production from grassland intensification and resulting changes in GHG emissions, by scenario.
| Parameter | Unit | Scenario 1: Intensification and Use Surplus Grass for Energy | Scenario 2: Intensification and Use of Land for Grassy Energy Crops |
|---|---|---|---|
| Area addressed by measures | Mha | 0.85 | 0.85 |
| Biomass production and conversion to ethanol | |||
| Biomass production (mass) | Mt DM yr−1 | 3.7 | 11 |
| Biomass production | PJ yr−1 | 67 | 213 |
| Bioethanol production | PJ ethanol yr−1 | 23 | 72 |
| GHG emissions from intensification, bioethanol production and replacement of fossil fuels | |||
| A: Change in N2O emissions compared to reference 1 | Mt CO2-eq yr−1 | −2.8 | 3.5 |
| B: Change in SOC compared to reference 1 | Mt CO2-eq yr−1 | −1 | −1.3 |
| C: Supply chain emissions bioethanol (without fertilizer & SOC) 1 | Mt CO2-eq yr−1 | 0.0 | −0.2 |
| D: Avoided emissions from replacing fossil fuels | Mt CO2-eq yr−1 | 1.9 | 6.1 |
| Net emission balance (= A + B + C − D) 1 | Mt CO2-eq yr−1 | −5.8 | −4.0 |
| Average supply chain emissions from bioethanol (= (A + B + C)/total bioethanol production) 1 | g CO2-eq MJ−1 | −168.9 | 28.3 |
| Emission reduction compared to fossil fuel comparator | % | 302 | 66 |
1 A negative emission refers to less emissions than in the reference scenario (i.e., carbon sequestration).
Publisher’s Note: MDPI stays neutral with regard to jurisdictional claims in published maps and institutional affiliations. |
© 2020 by the authors. Licensee MDPI, Basel, Switzerland. This article is an open access article distributed under the terms and conditions of the Creative Commons Attribution (CC BY) license (http://creativecommons.org/licenses/by/4.0/).
Share and Cite
MDPI and ACS Style
Wicke, B.; Kluts, I.; Lesschen, J.P. Bioenergy Potential and Greenhouse Gas Emissions from Intensifying European Temporary Grasslands. Land 2020, 9, 457. https://0-doi-org.brum.beds.ac.uk/10.3390/land9110457
AMA Style
Wicke B, Kluts I, Lesschen JP. Bioenergy Potential and Greenhouse Gas Emissions from Intensifying European Temporary Grasslands. Land. 2020; 9(11):457. https://0-doi-org.brum.beds.ac.uk/10.3390/land9110457
Chicago/Turabian StyleWicke, Birka, Ingeborg Kluts, and Jan Peter Lesschen. 2020. "Bioenergy Potential and Greenhouse Gas Emissions from Intensifying European Temporary Grasslands" Land 9, no. 11: 457. https://0-doi-org.brum.beds.ac.uk/10.3390/land9110457
Note that from the first issue of 2016, this journal uses article numbers instead of page numbers. See further details here.