
Ozone Ice as an Oxygen Release Reagent for Heap Leaching of Gold Ore


1
School of Civil and Resource Engineering, University of Science and Technology Beijing, Beijing 100083, China
2
School of Energy and Environmental Engineering, University of Science and Technology Beijing, Beijing 100083, China
*
Author to whom correspondence should be addressed.
Minerals 2021, 11(11), 1251; https://0-doi-org.brum.beds.ac.uk/10.3390/min11111251
Submission received: 14 October 2021
/
Revised: 5 November 2021
/
Accepted: 9 November 2021
/
Published: 11 November 2021
(This article belongs to the Section Mineral Processing and Extractive Metallurgy)
Abstract
:The issue of poor aeration efficiency and low oxygen transfer in the heap leaching of gold has gained considerable attention. In this study, ozone ice was studied as an oxygen release reagent in the cyanide heap leaching of gold at a low temperature of approximately 5 °C, owing to its effective oxidation and clean and green properties. Quartz Crystal Microbalance with Dissipation (QCM-D) was used to monitor the effect of different ratios of cyanide and oxygen concentrations on the gold leaching rate. The results showed that the leaching rate doubled when the dissolved oxygen (DO) was increased from 8.2 mg/L to 12 mg/L at a relatively high cyanide concentration of 60 mg/L. The release of oxygen during the process of ozone ice melting was analyzed by simulating the oxygen-deficient condition of the ore heap in column leaching. In the first stage of ice melting, the DO in the solution increased dramatically, and the rate of increase improved with increased initial ozone concentration in the ice. In the second stage of ice melting, the rate of increase in the DO of the solution was not significantly affected by the initial ozone concentration in the ice; this was consistent with the decomposition rate of ozone. The addition of ozone ice containing 300 mg/L ozone increased the gold extraction by 4.1% in the ore column leaching experiment, compared to a column with no ozone ice. However, continuously increasing the ozone concentration up to 600 mg/L had no further significant effect, because the dissolved oxygen in the leaching solution reached saturation. The results facilitate a better understanding of the decomposition law of ozone in the melting process of ozone ice and help to improve the oxygen deficit state in gold leaching heaps.
1. Introduction
Heap leaching is a process extensively used by the mining industry to recover valuable metals (especially gold) from low-grade ores, owing to its low cost and operational advantages [1,2]. In 2016, total Chinese mined gold production was about 455 tones and China has become the world’s largest producer for the last 10 years. Meanwhile, heap leaching accounts for 10% of China’s total gold production [3]. Since 2002, cyanide heap leaching of gold ore has been practiced in more than 100 operations worldwide [4]. Nevertheless, heap leach recovery was about 80%, below the 92% that could be achieved in an agitated leach plant [3]. A cyanide heap leaching system consisting of solid–liquid–gas phases is a series of transport and kinetic processes, which begins with the transport of substances, including cyanide, lime, water, and oxygen, from the heap surface to the particles [5]. The leaching reaction can be described by the well-known Elsner Equation:
2Au + 4CN− + 1/2O2 + H2O = 2Au(CN)2− + 2OH−
Leaching also requires the presence of an oxidant; thus, an essential source of oxygen (typically air) is introduced into the leaching environment [6]. The two sources of oxygen during cyanide heap leaching are dissolved oxygen (DO) in the feed solution and gaseous oxygen in the heap interspace [7]. In the cyanide heap leaching of gold ore, associated minerals, such as copper sulfide and pyrite, consume abundant oxygen [8]. As the ore heap height gradually increases over time, the liquid flows from the top through the particles in preferential flow paths, limiting the reaction at the bottom of the heap [9]. Additionally, mechanical compaction and weathering result in poor permeability and low DO in the solution at the bottom of the heap [10,11,12]. Research by Pantelis et al. [13] shows that by natural diffusion, oxygen is not able to diffuse the heap void below 5 m. Therefore, increasing the concentration of oxygen at the bottom of the gold heap is an effective method for improving leaching extraction.
Peroxide reagents are a means of supplying DO to the ore heap [14]. Significant developments in the application of inorganic peroxides (e.g., hydrogen, calcium, and sodium peroxides) in hydrometallurgy began in the 1980s [12]. Inorganic peroxides act as effective oxidants in the reaction and provide oxygen for the cyanide leaching of gold under certain oxygen deficiency conditions [15,16]. Peroxide-assisted leaching exhibits enhanced kinetics and improved gold recovery [17]. However, peroxides have not been applied to the large-scale leaching of minerals because of their instability, relative rapidity (except at high concentrations), and high cost [18].
Cheap and available ozone is currently attractive to hydrometallurgy as a green and highly effective oxidant [19]. At present, the use of ozone to pre-oxidize sulfide ores has been studied to eliminate sulfur as sulfur dioxide or sulfate. The results obtained have shown that pre-treatment with ozone permits a greater extraction of gold during cyanidation [20]. Ozone is a highly unstable triatomic molecule of oxygen with a brief average half-life of approximately 22 min [21]. To revert to a more stable state (diatomic oxygen), ozone releases a single oxygen atom to generate a single molecule of oxygen. [22,23]. Ozone is effectively applied in gaseous and aqueous forms. However, ozone dissolved in aqueous solution quickly breaks down into oxygen and is difficult to maintain for extended periods [24]. Consequently, water ice containing dissolved gaseous ozone was studied to slow the release of ozone as the ice melts to extend its duration [25,26]. The ultra-slow release of reactants from melting ice was successfully achieved in solution synthesis [27], providing a novel approach for releasing and replenishing oxygen into the leaching heap at low temperatures.
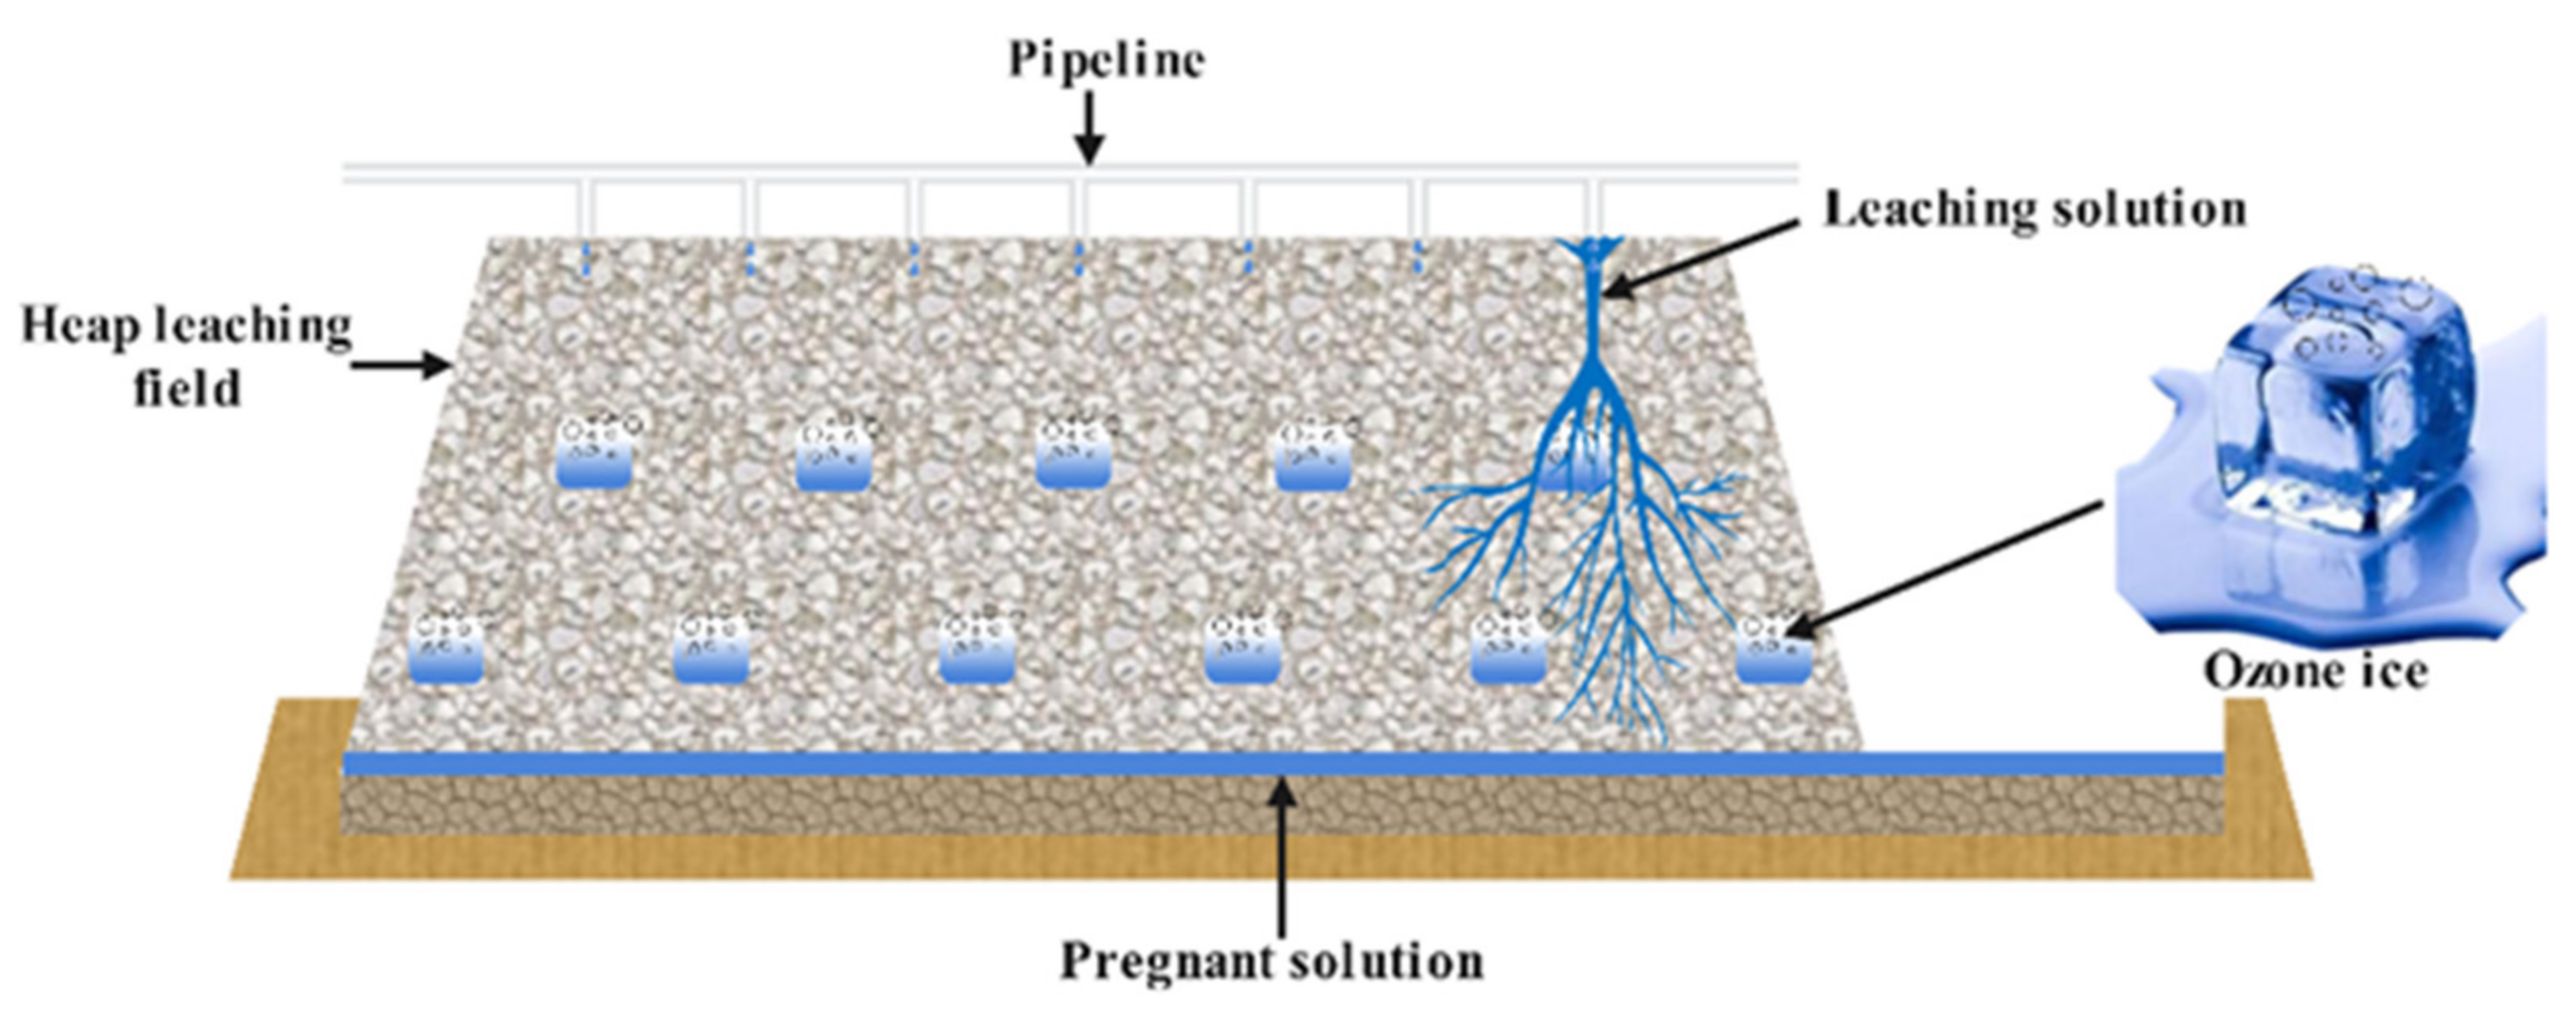
With the development of heap leaching technology, heap leaching operations have expanded to more extreme climates, and heap leaching operations are carried out in increasingly cold climate conditions [28]. A low-grade heap leaching mine in northern China with an average grade of 0.65 g/t was the research background in this study. The mining area is located in the alpine region of northern Inner Mongolia Province (41°40′9″ N, 109°15′64″ E), with a frost period from October to April; the minimum temperature is −34 °C. The ore heap temperature must be maintained at 1–8 °C for the slow melting of ice. In this study, an aqueous solution containing ozone was made into ice as an oxygen release reagent to supply DO to the leaching solution inside the ore heap to improve gold extraction (Figure 1). The effect of [CN−]/[O2] on the cyanide leaching of gold was monitored in real time using a quartz crystal microbalance with dissipation (QCM-D). The regulation of oxygen release during the ozone ice melting process was investigated by a column leaching simulation experiment, and the facilitating effect of the leaching extraction of gold by ozone ice in an oxygen-deficient environment was verified.
2. Experimental Section
2.1. Ore Samples Preparation
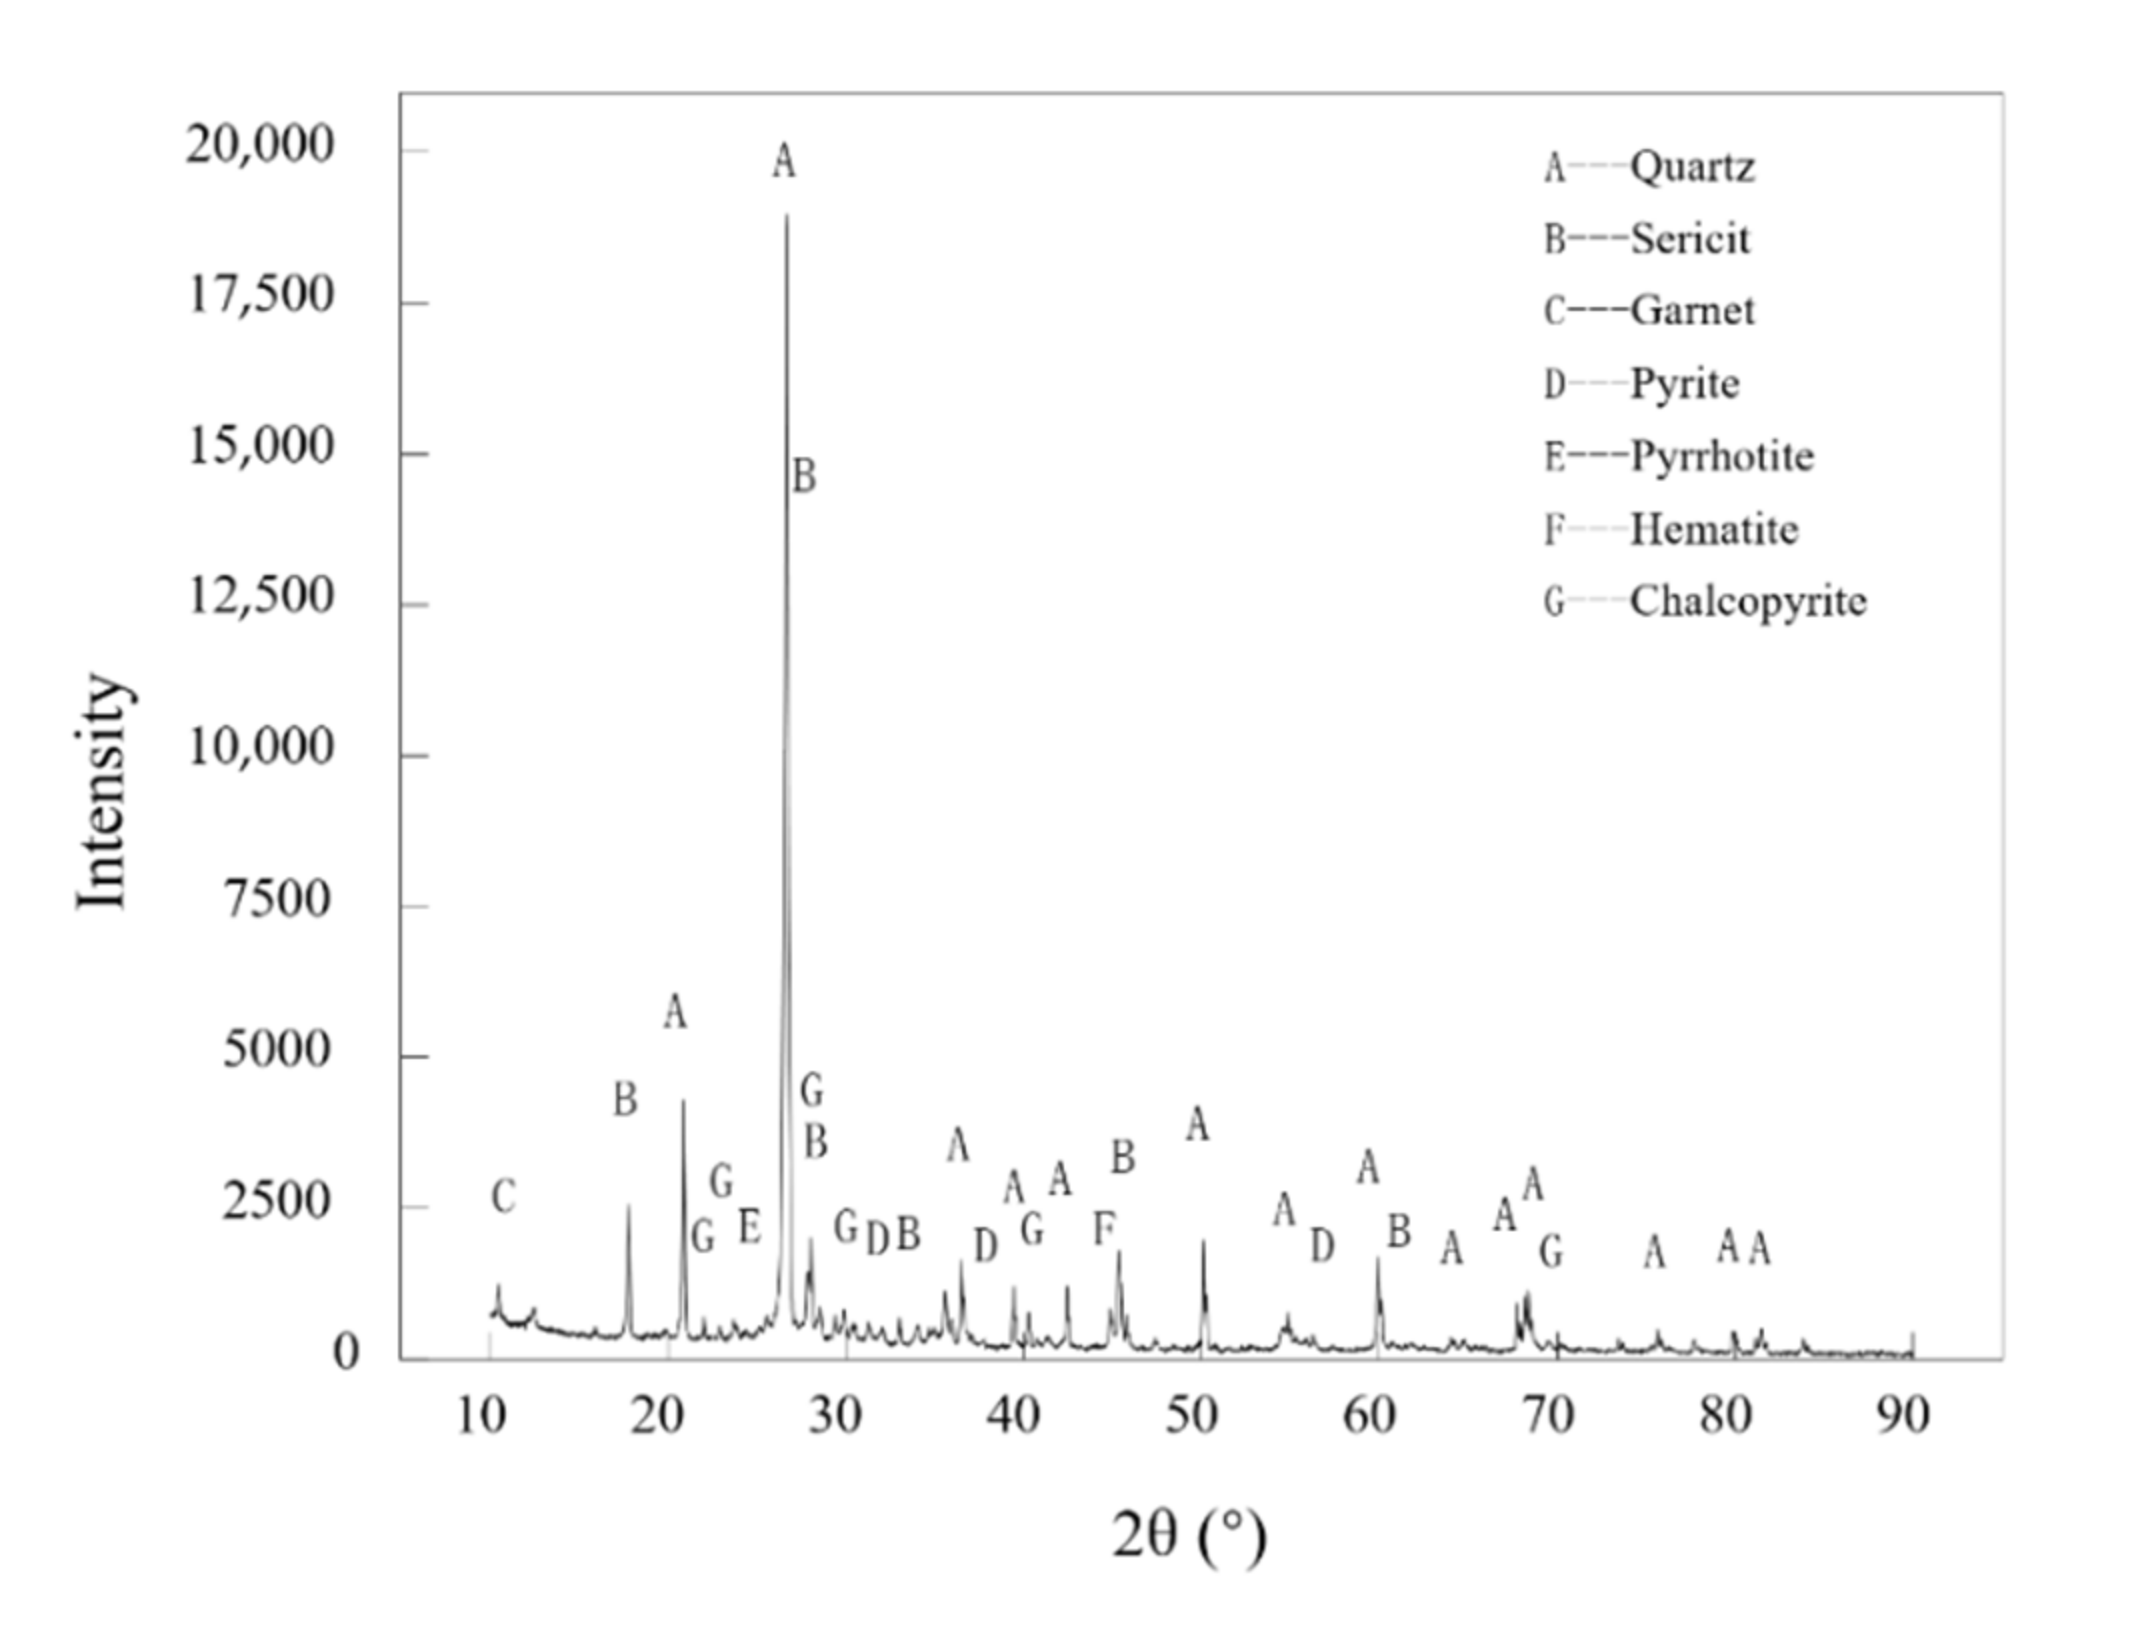
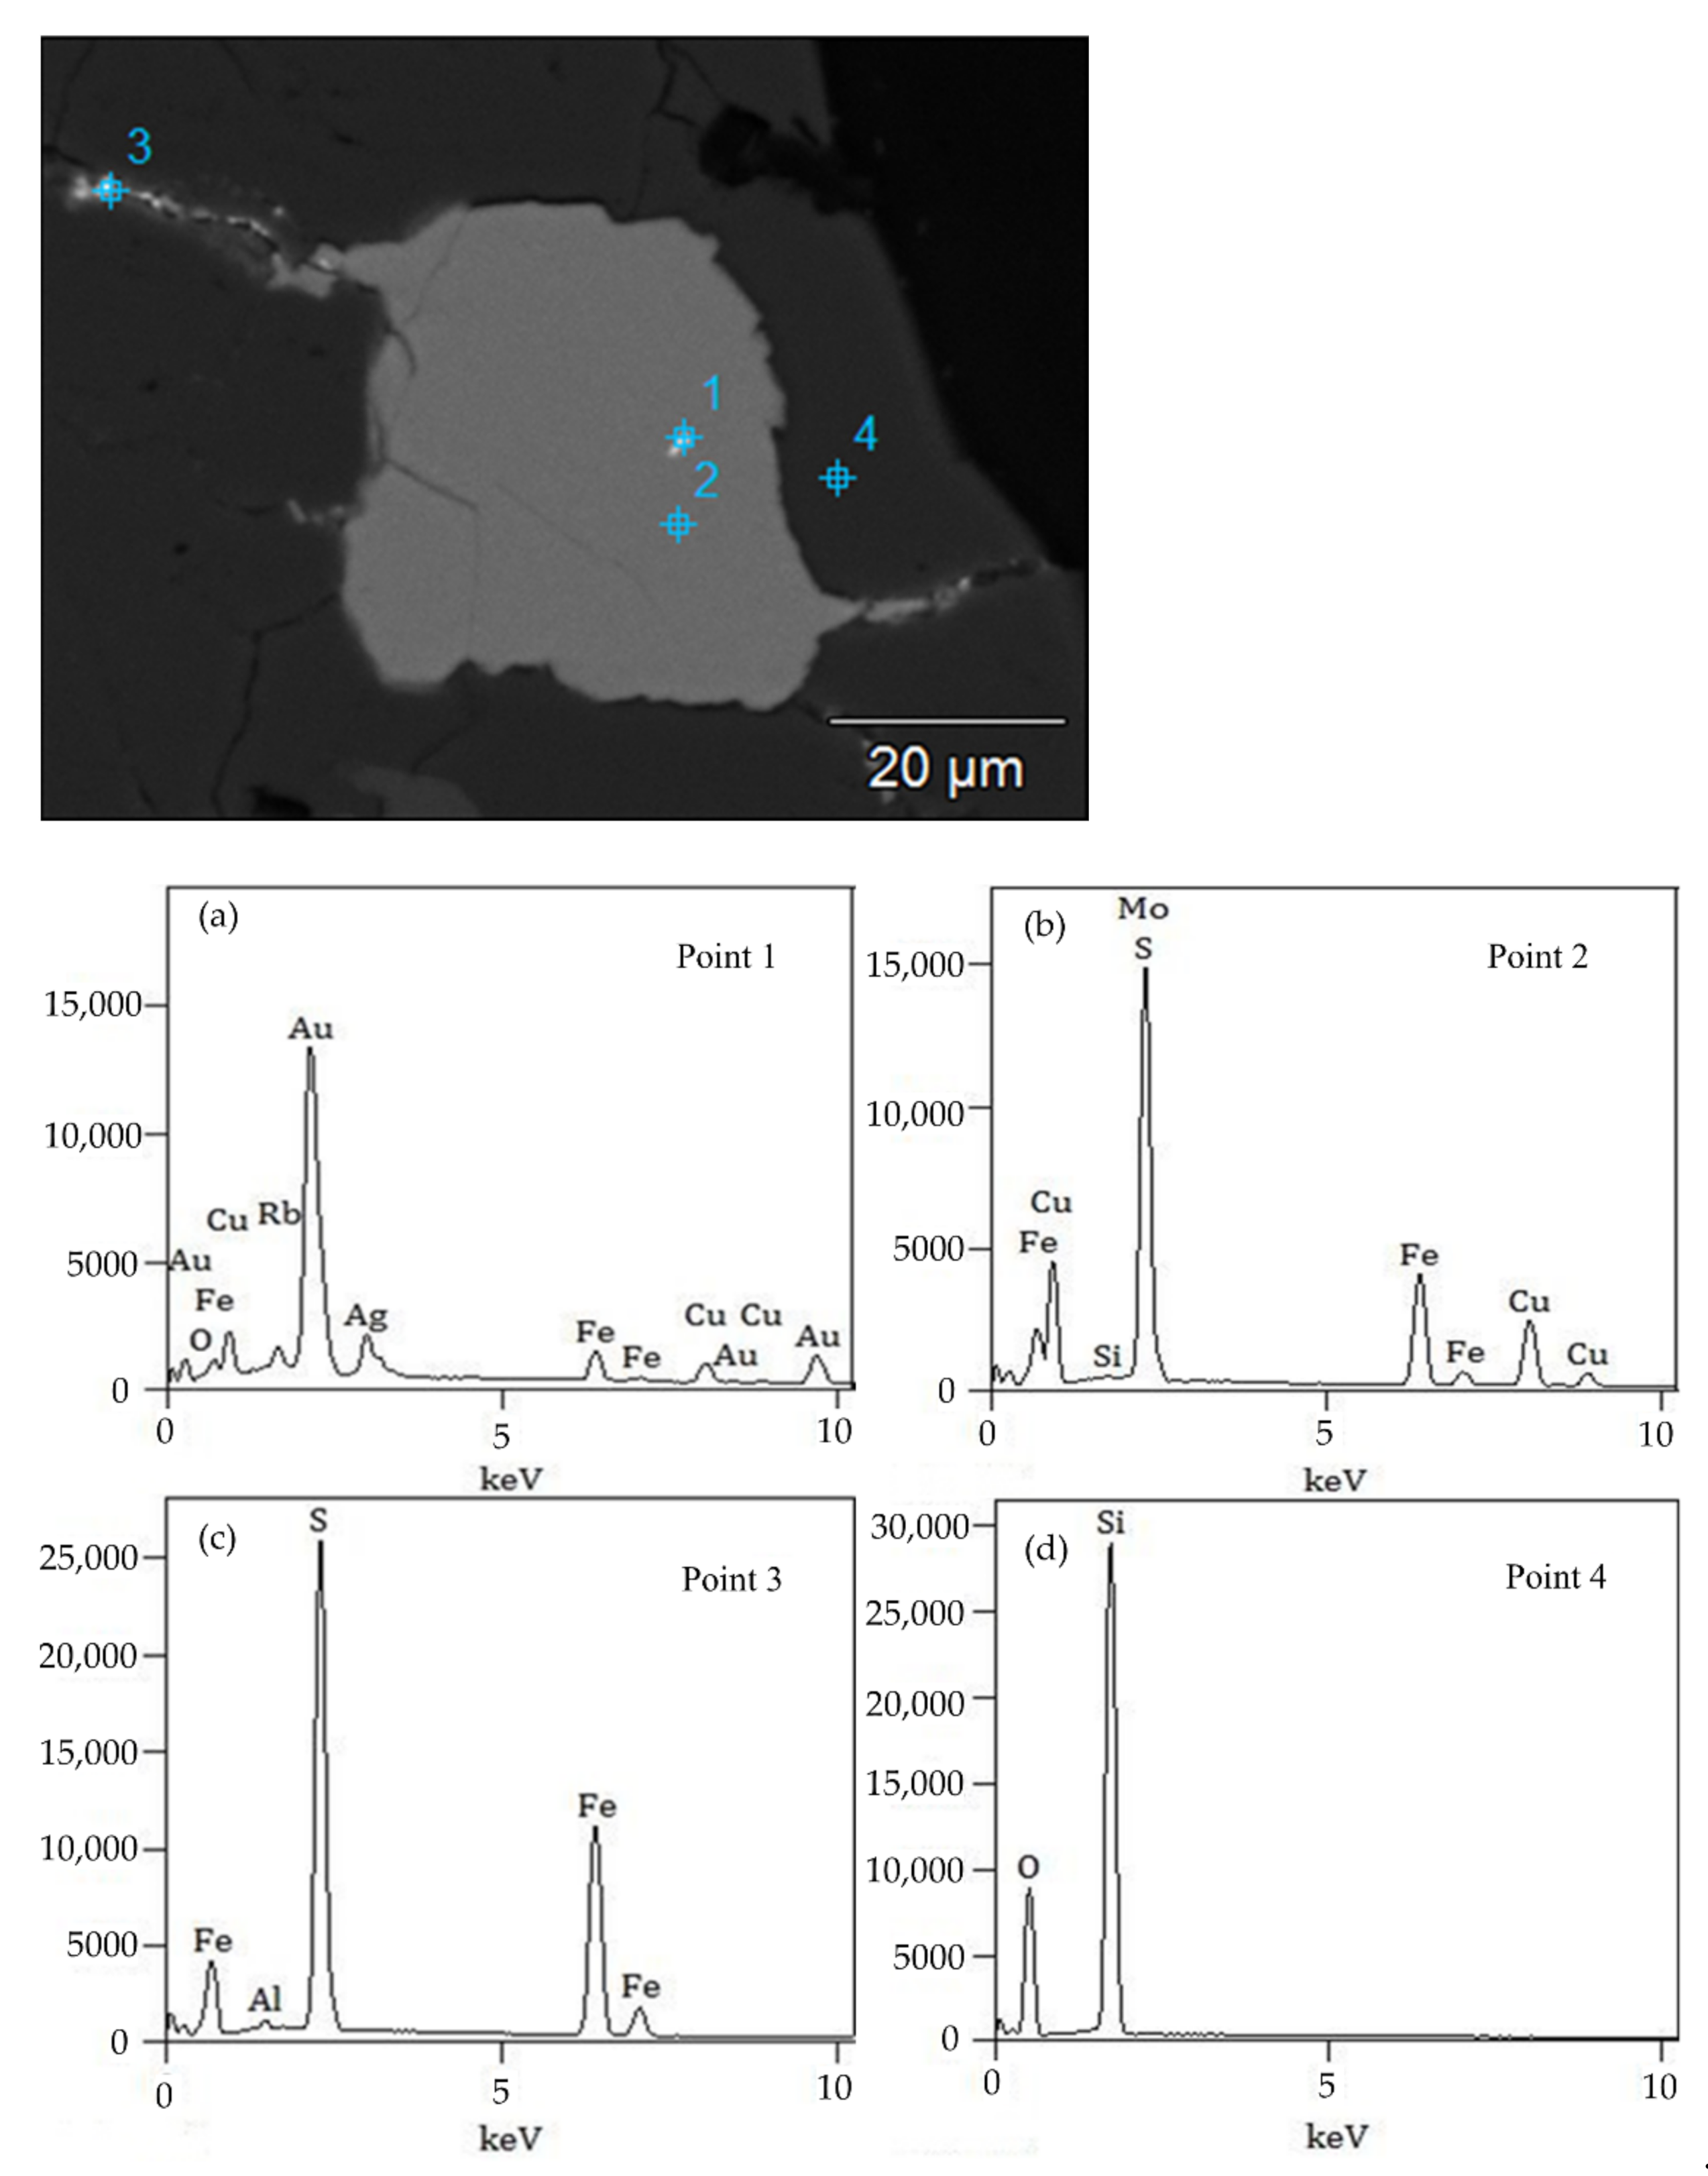
The ores were crushed by 80% to a size of 9 mm to construct the ore heap in the laboratory columnar facilities (see Section 2.2.3 for column devices parameters) to evaluate the cyanide soluble gold under different conditions. Table 1 lists the principal chemical constituents of the test samples. The primary valuable metals are gold and silver, with grades of 0.61 g/t and 1 g/t, respectively. The mineral composition of the gold ore sample was analyzed using X-ray diffraction (XRD), as shown in Figure 2. It was performed on a Rigaku-RA high power rotating anode X-ray diffractometer) (Ultima IV, Rigaku, Japan) with Cu-Kα radiation (40 kV, 100 mA) at a scanning rate of 10°/min, from 10° to 90°. Figure 3 shows a backscattering electron detection of the SEM micrograph image (EVO-18, Carl Zeiss, Oberkochen, Germany), of gold in the sample. Gold minerals mainly exist in the form of natural gold, a small amount of silver gold. The occurrence state of gold is mainly in symbiosis with sulfide minerals. To calculate the gold extraction, the feed and final leaching residues were analyzed for gold by fire assay.
2.2. Experimental Ozone Ice Preparation
2.2.1. Ozone Ice Formation
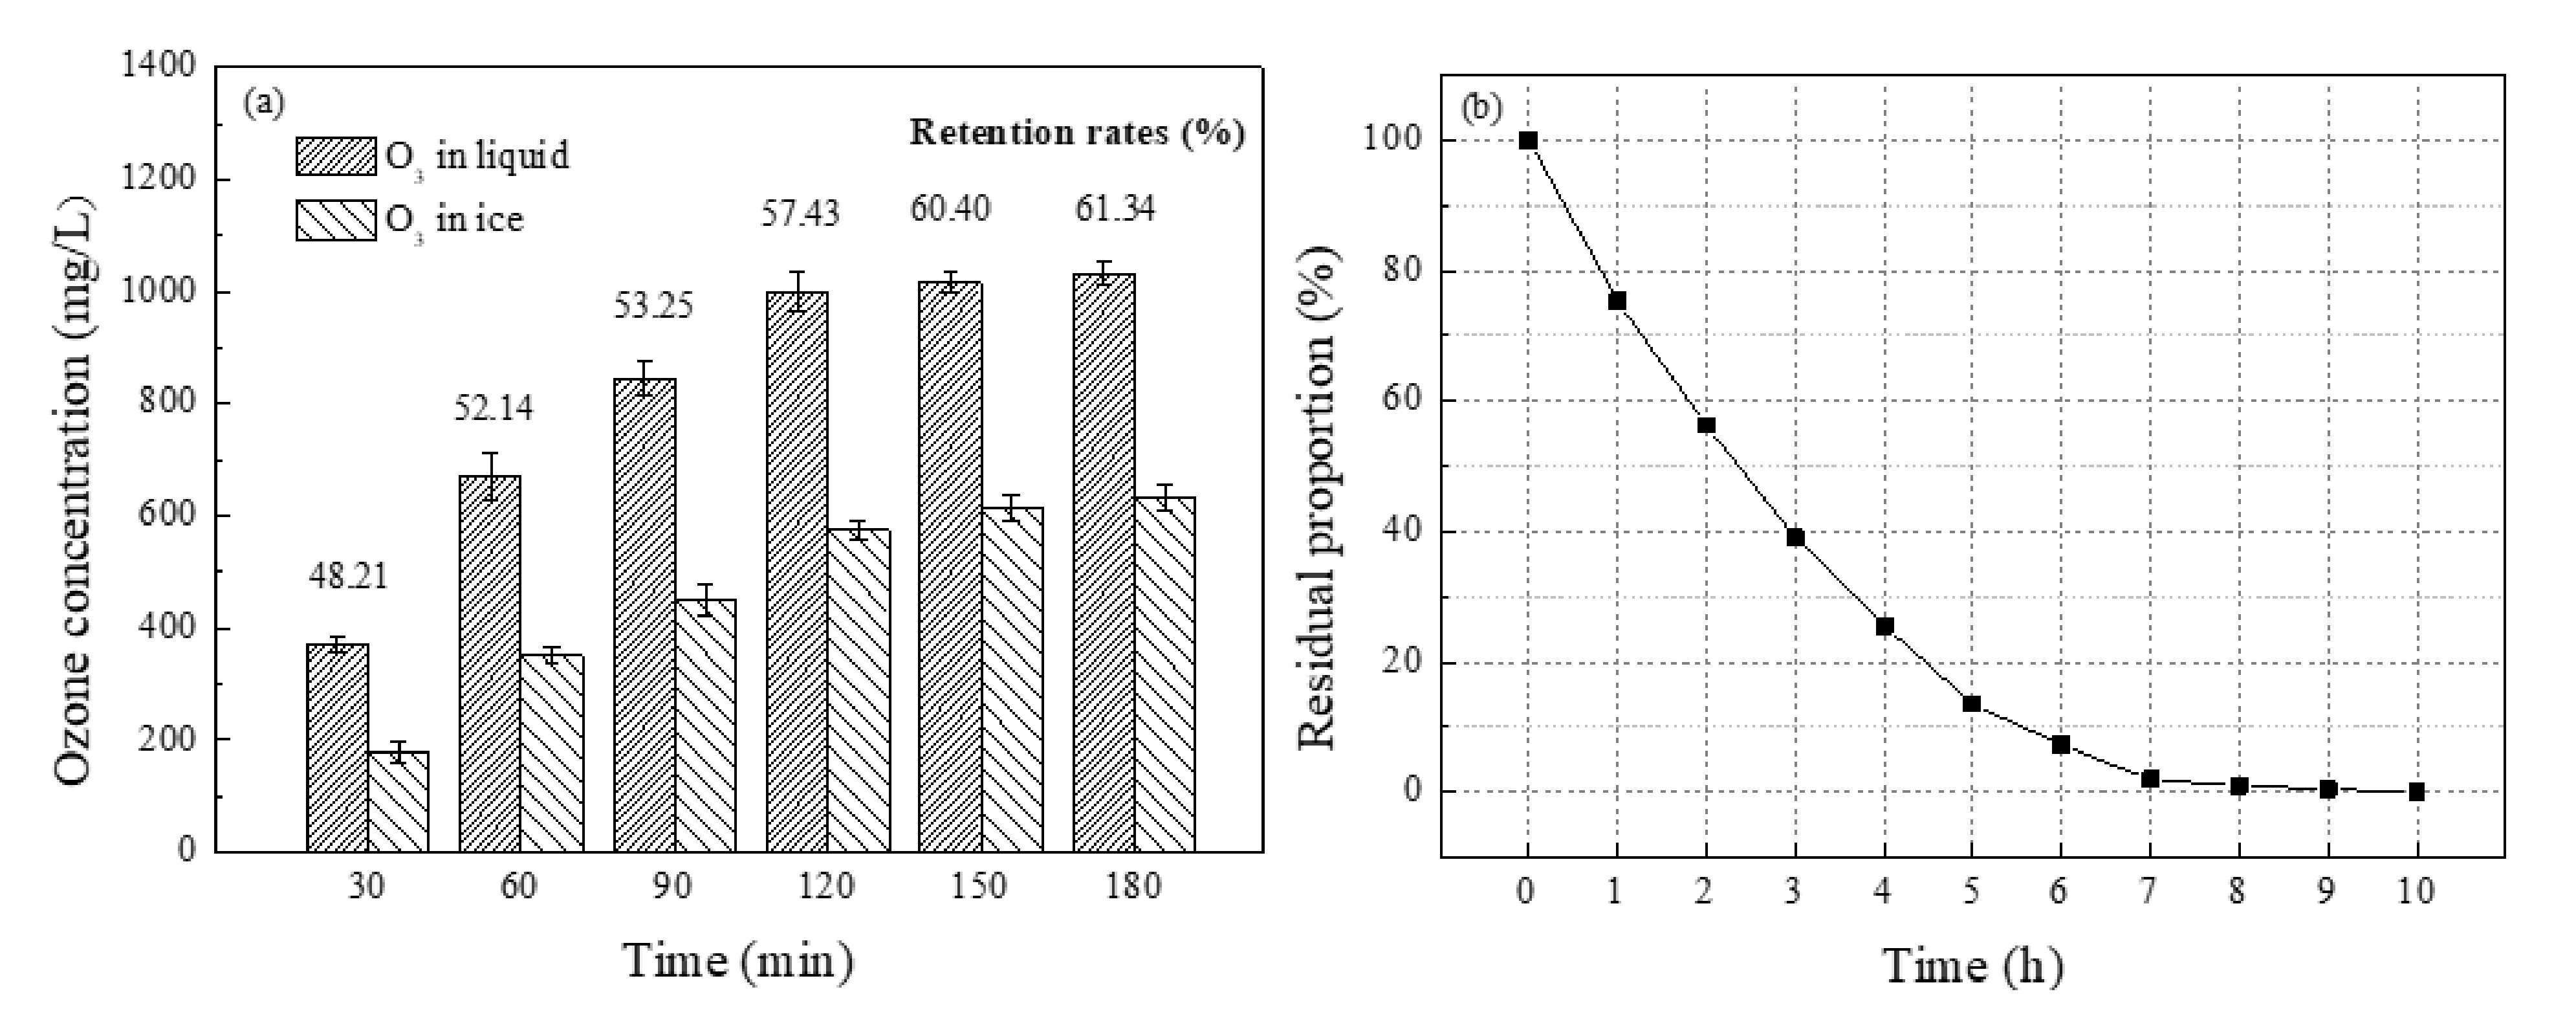
Table 2 presents the experimental conditions. The ozone was generated by an air source ozonizer and flowed in deionized water in a gas-washing bottle at 1 L/min. The decomposition rate of ozone in water depends on the pH [18], which was set to 7 in the deionized water. Figure 4a shows the relationship between the aeration time and the ozone concentration in 100 mL of deionized water. The solution dissolved in ozone was then poured into a cubic box with a size of 30 × 30 × 30 mm and stored in a cryogenic refrigerator at −65 °C for 1 h. The amount of ice melted in 8 h was 98.96% at 5 °C; Figure 4b shows the relationship between the ice-melting residual ratio and time. The ice was removed from the refrigerator immediately after the completion of ice formation. We measured the concentration of ozone in the ice and found that the ozone retention rate during the ice-making process was approximately 45–65%, and this increased as the ozone concentration in the initial aqueous solution increased.
2.2.2. Measured Method of Ozone Concentration
The concentration of ozone in water was determined using the potassium iodide method; iodine was separated by the reaction of ozone in water with potassium iodide, and the solution turned purple. The concentration of ozone in water was determined by Na2S2O3 titration under acidic conditions [29]. As per Equations (2) and (3), the color of the solution becomes colorless after the formation of sodium iodide, and the ozone concentration can be calculated according to the amount of sodium thiosulfate standard solution consumed. The potassium iodide (KI, ≥98.5%) and sodium thiosulfate (Na2S2O3·5H2O, ≥99%) were purchased from XiLong SCIENTIFIC Co., Ltd. (Shantou City, Guangdong Province, China). The measurement method for ozone in ice is based on a previous report [26]. The ice was placed in a sealed opaque container, and the container was immersed in ice in hot water at approximately 100 °C. The ice was completely melted after 3 min. The fixed ozone concentration in the ice was subsequently measured using the KI method, and the decomposition amount of ozone during complete melting was estimated as less than 0.2% [30]. Thus, the authors believe that the above-mentioned method for estimating the concentration of ozone in ice is appropriate.
O3 + 2KI + H2O = I2 + 2KOH + O2
I2 + 2NaS2O3 = Na2S4O6 + 2NaI
2.2.3. Experimental Apparatus for Melting of Ozone Ice
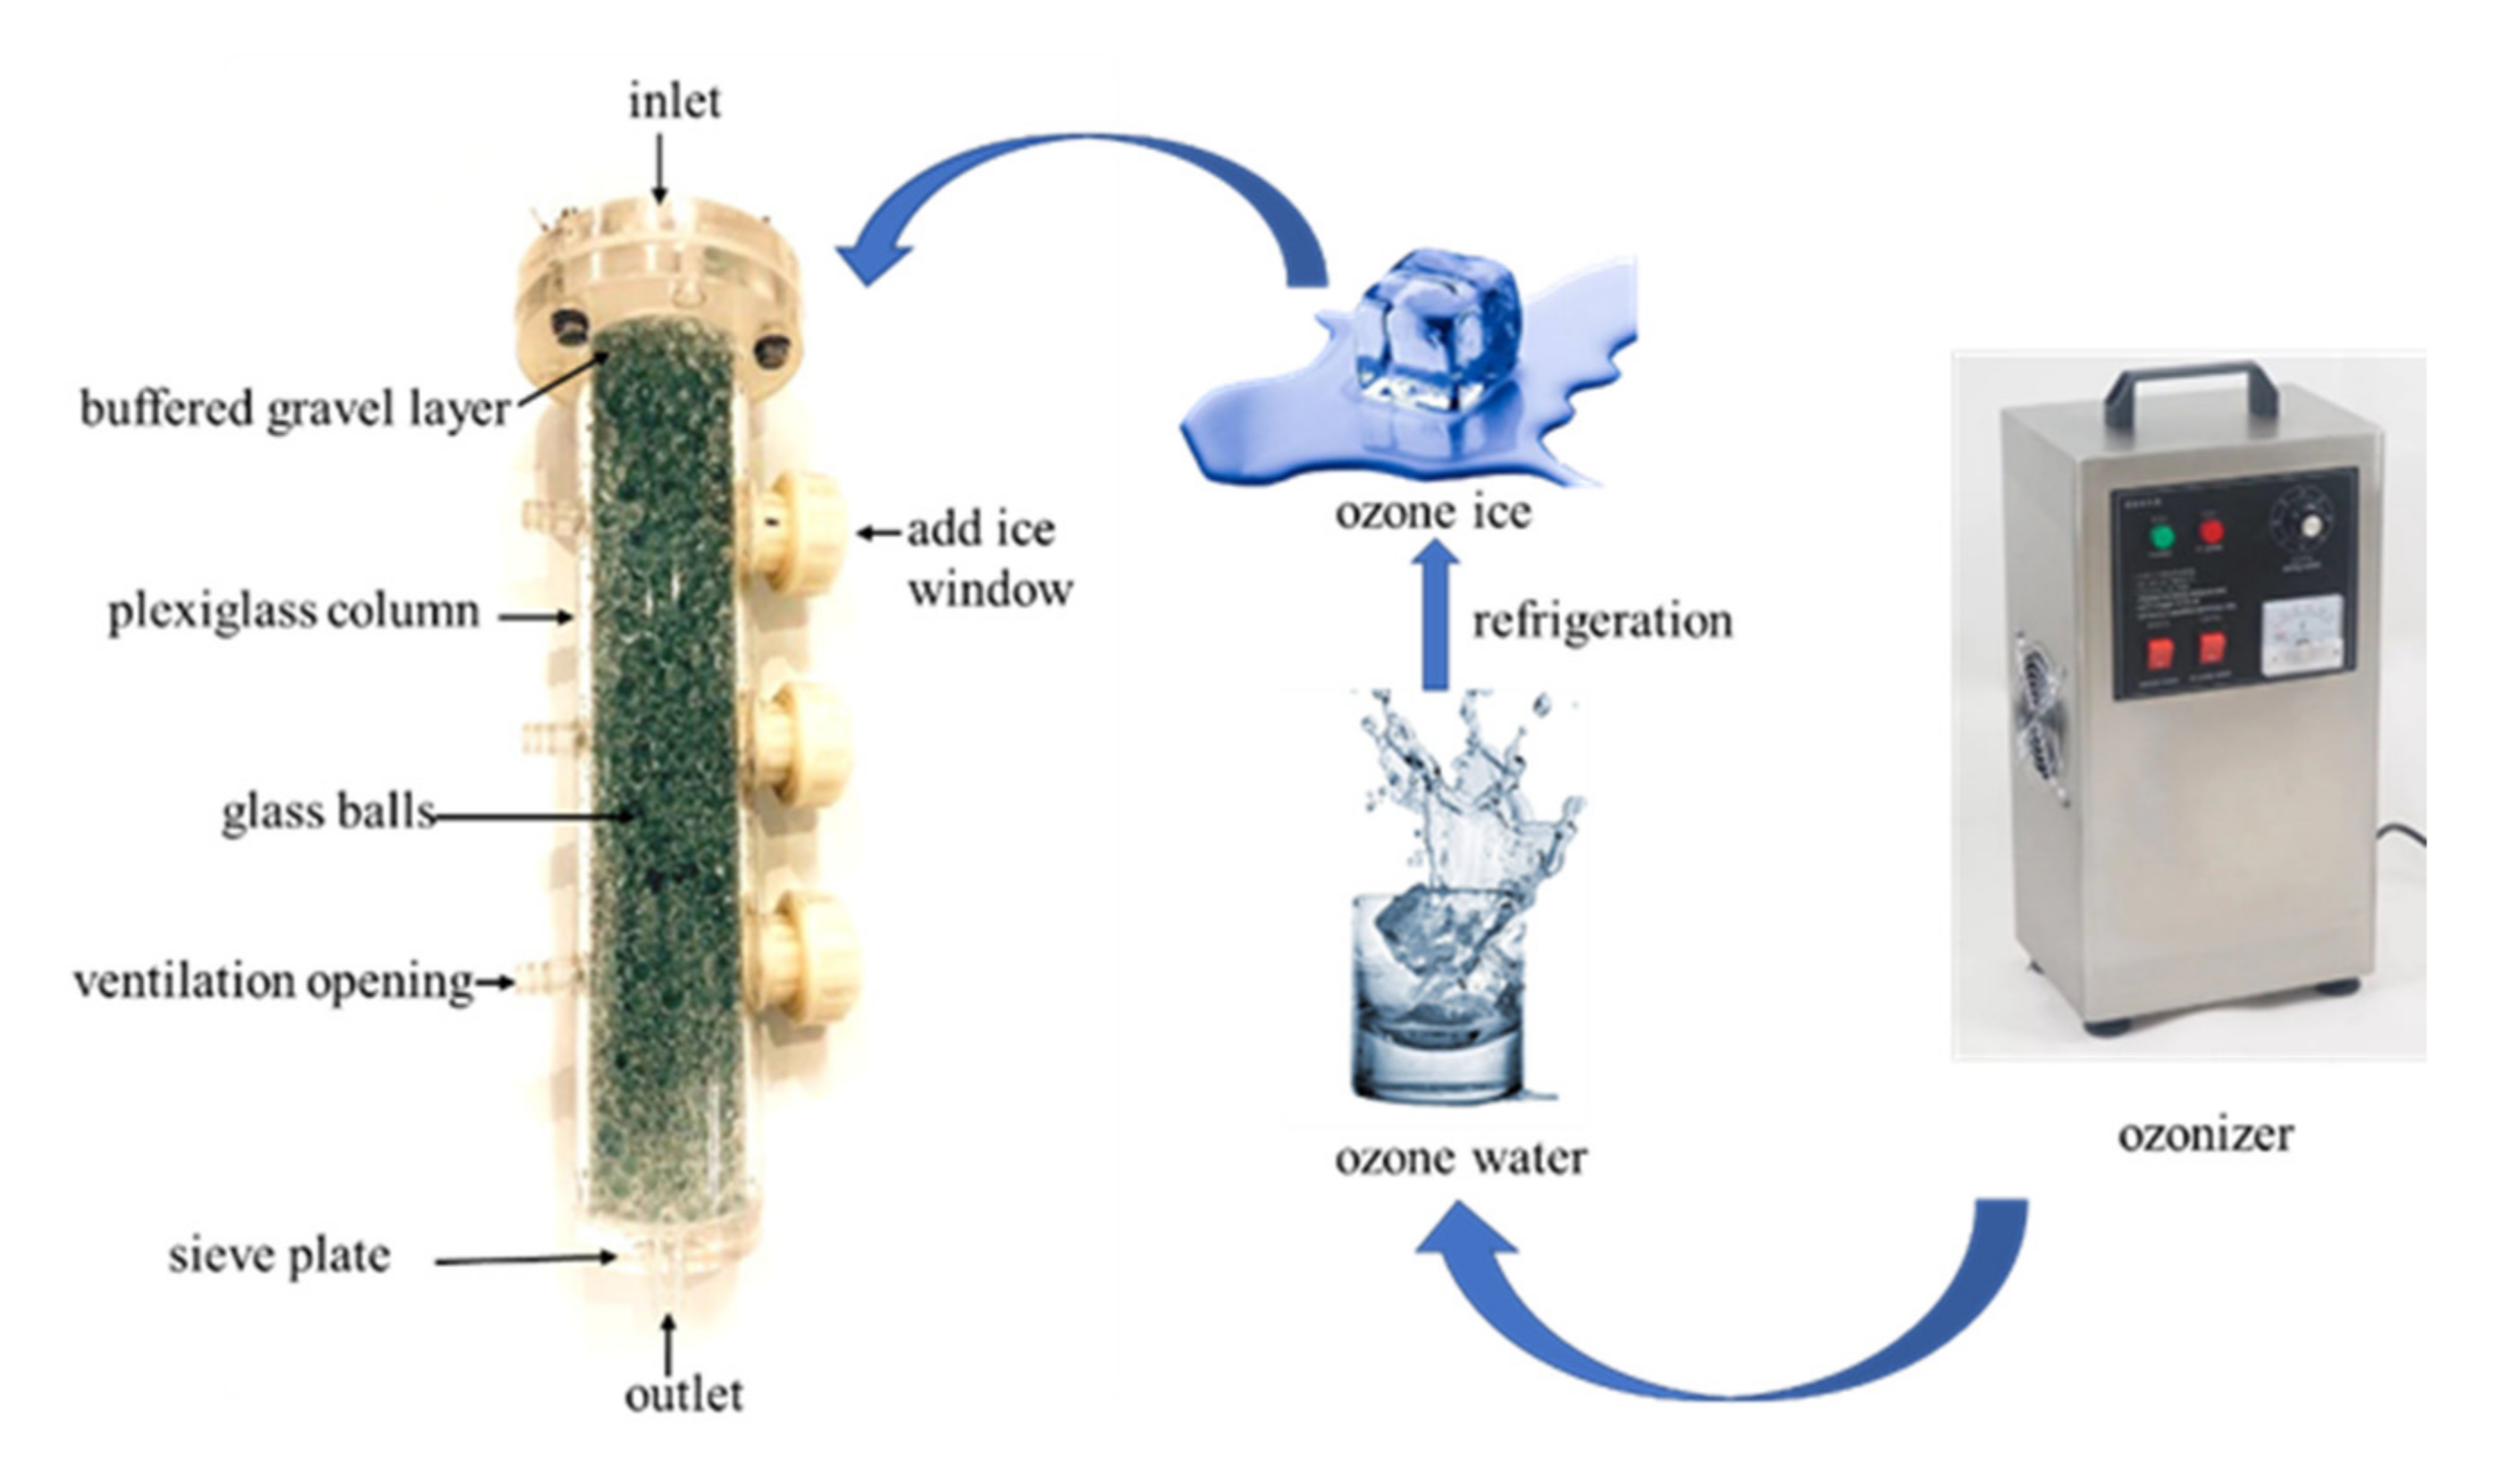
In this work, the experimental system to study the characteristics of oxygen release during the melting process of ozone ice primarily consisted of a column leaching apparatus, a substitute for ore particles, and a liquid distribution with a peristaltic pump. Figure 5 shows that the main body of the column leaching apparatus was a self-made plexiglass column (50-mm inner diameter, 300-mm height). A buffer layer and a sieve plate with uniform circular holes were fixed at the top and bottom of the column, respectively.
Transparent glass balls were used to represent the ore particles in the study of characteristics of ozone release from ice in the heap. A particle size distribution ranging from 3 to 9 mm was chosen for its low cost and stability; additionally, the transparent glass balls allow the melting of ice to be observed from outside the column. The glass balls were randomly stacked and distributed in the column to construct the internal pore structure of the leach heap. The voidage of each experimental group was 20%. Before the experiment, the mixed glass balls of different particle sizes and ozone ice were placed in a plexiglass column. Nitrogen was used to quickly remove air from the column, and the device was sealed and placed in an incubator. The leaching solution containing 200 ppm of free cyanide at pH 11 was added from the top of the column at a rate of 15 L/(m2·h) using a peristaltic pump.
2.3. Leaching Test Procedure
All experiments were performed using analytical reagents and a deionized water solution. Unless otherwise specified, all experiments were conducted in a temperature-controlled incubator. Ore mixed with CaO (98%, XiLong SCIENTIFIC Co., Ltd. Shantou City, Guangdong Province, China) was added to the leaching column at a mass ratio of 125:1. After adjusting the pH of the leaching solution to the target value, nitrogen was used to purge the oxygen in the NaCN solution to create an oxygen-deficient condition. The solution addition rate was set to 15 L/(m2·h), and the pregnant solution was collected at 24 h intervals. The cyanide concentration was analyzed by titration with silver nitrate. The gold and DO contents in the liquid were determined using ICP-OES (Thermo Fisher Scientific, Waltham, MA, USA) and HQ portable DO meters (Hach Company, Loveland, CO, USA), respectively.
2.4. Quartz Crystal Microbalance with Dissipation (QCM-D)
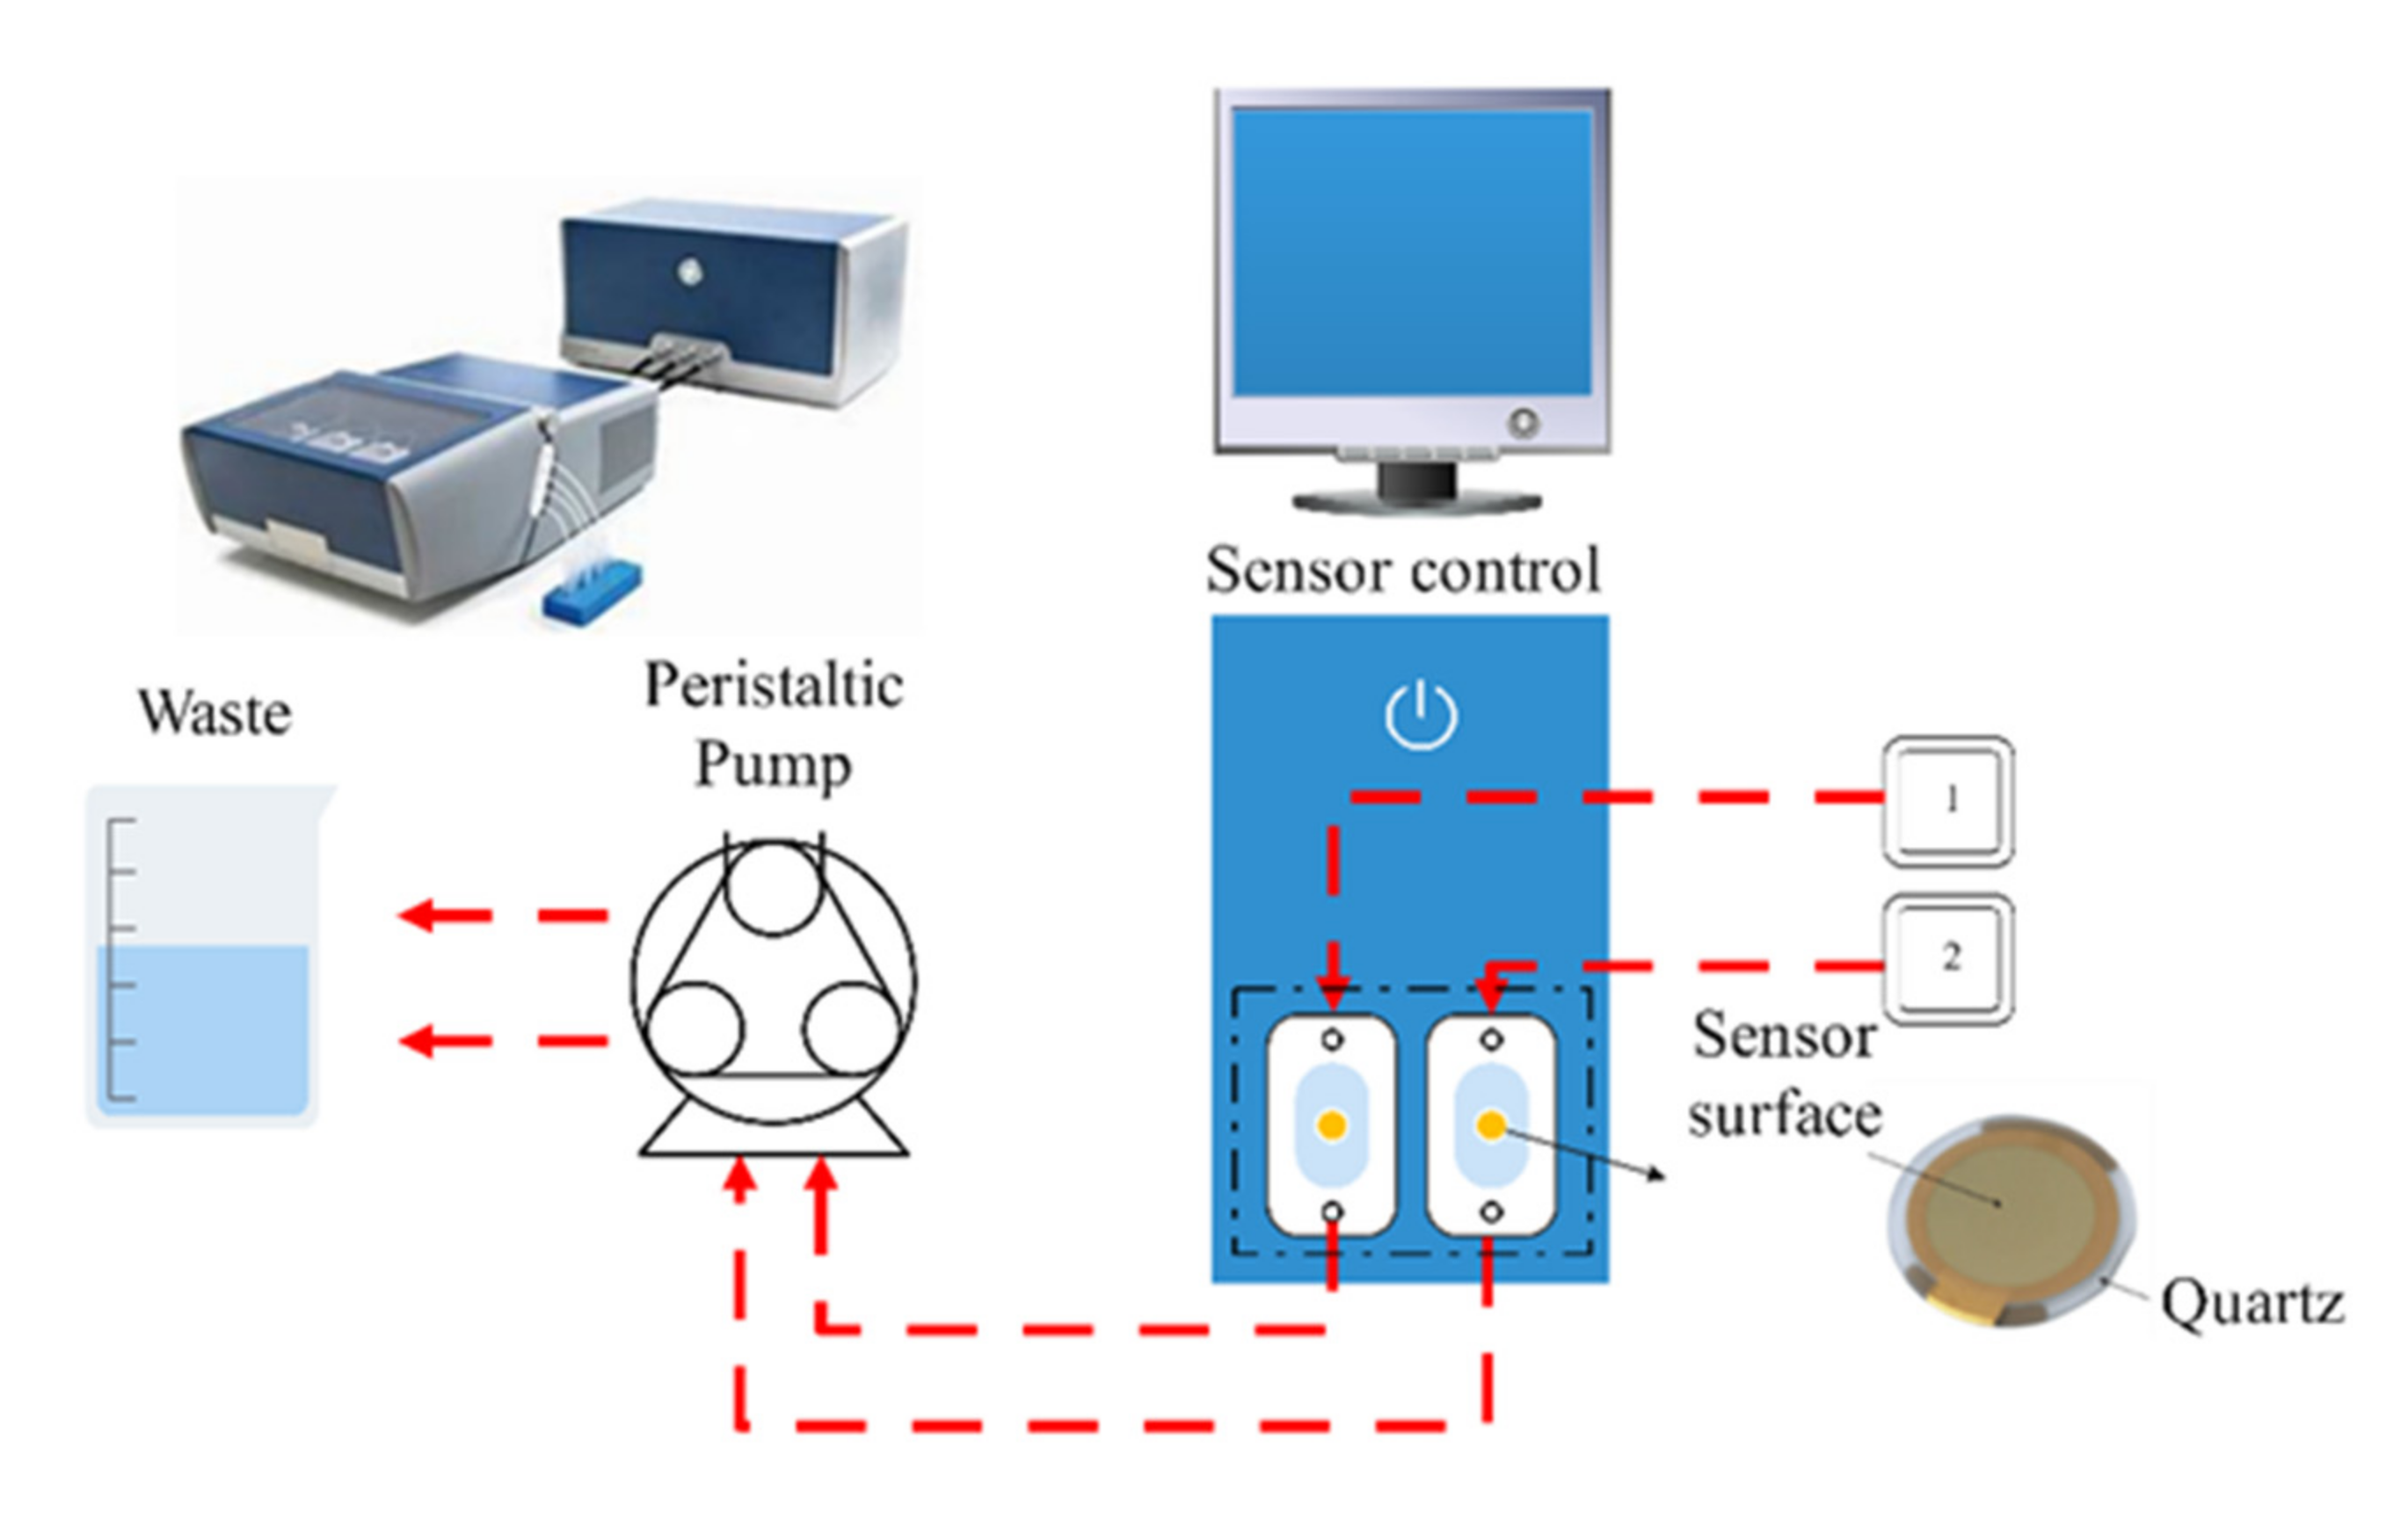
QCM-D (Biolin Scientific, Gothenburg, Sweden) is a real-time measuring instrument used for surface reaction analysis. A piezoelectric AT-cut quartz crystal (cut at 35° from the Z-axis of the quartz crystal) between the metal film electrodes was the principal component of the QCM-D [31,32]. The application of an electric field in the crystal polarization direction mechanically deforms the quartz crystal. Therefore, alternating currents cause mechanical vibration on the quartz crystal, and crystal resonance occurs when the current frequency is the same as the natural frequency of the crystal [32]. The resonant frequency (∆f) of the quartz crystal varies with the mass (∆m) of the metal film electrode [33]. Measuring the changes in energy dissipation (∆D) reveals the surface property changes of the quartz crystal. The Sauerbrey equation (Equation (4) describes the relationship between ∆m and ∆f [34]:
where ρq is the density of the quartz crystal used as the sensor, tq is the thickness of the quartz crystal, and n is the harmonic number, equal to 1, 3, 5, 7, … (when n = 1, f0 = 5 MHz) [35]. The seventh overtone data were used in the plot in this study, because the signal-to-noise ratio was the lowest. The resonant frequency of the quartz crystal resonator changes linearly with the surface mass of the quartz crystal and decreases during the leaching process. This relationship is applicable to the corrosion process on the surface of the coated quartz resonators [36], and the mass sensitivity is 0.9 ng/cm2 in water [37]. The QCM-D measurement equipment was a Q-Sense E4 system (Biolin Scientific, Gothenburg, Sweden) (Figure 6). This system consists of three principal components: the chamber platform (which holds the sensor crystal modules), the electronics unit (which controls the sensors), and the software used for data analysis [38].
The AT-Cut quartz crystal sensor (Biolin Scientific, Gothenburg, Sweden) was prepared with 100 nm thick gold electrodes as a coat for the quartz crystals, and a 5 nm chromium coat was placed in the intermediate for enhanced adhesiveness. The fundamental frequency of the quartz crystal sensor was 5 MHz—the above-mentioned f0 value. Before the test, the sensor was cleaned with deionized water and dried with nitrogen. The temperature was limited to 25 °C by equipment conditions, and the flow rate of the solution was set to 50 μL/min in all experiments, unless otherwise specified.
3. Results and Discussion
3.1. QCM-D Monitoring of the Effect of [CN−]/[O2] on the Cyanide Leaching of Gold
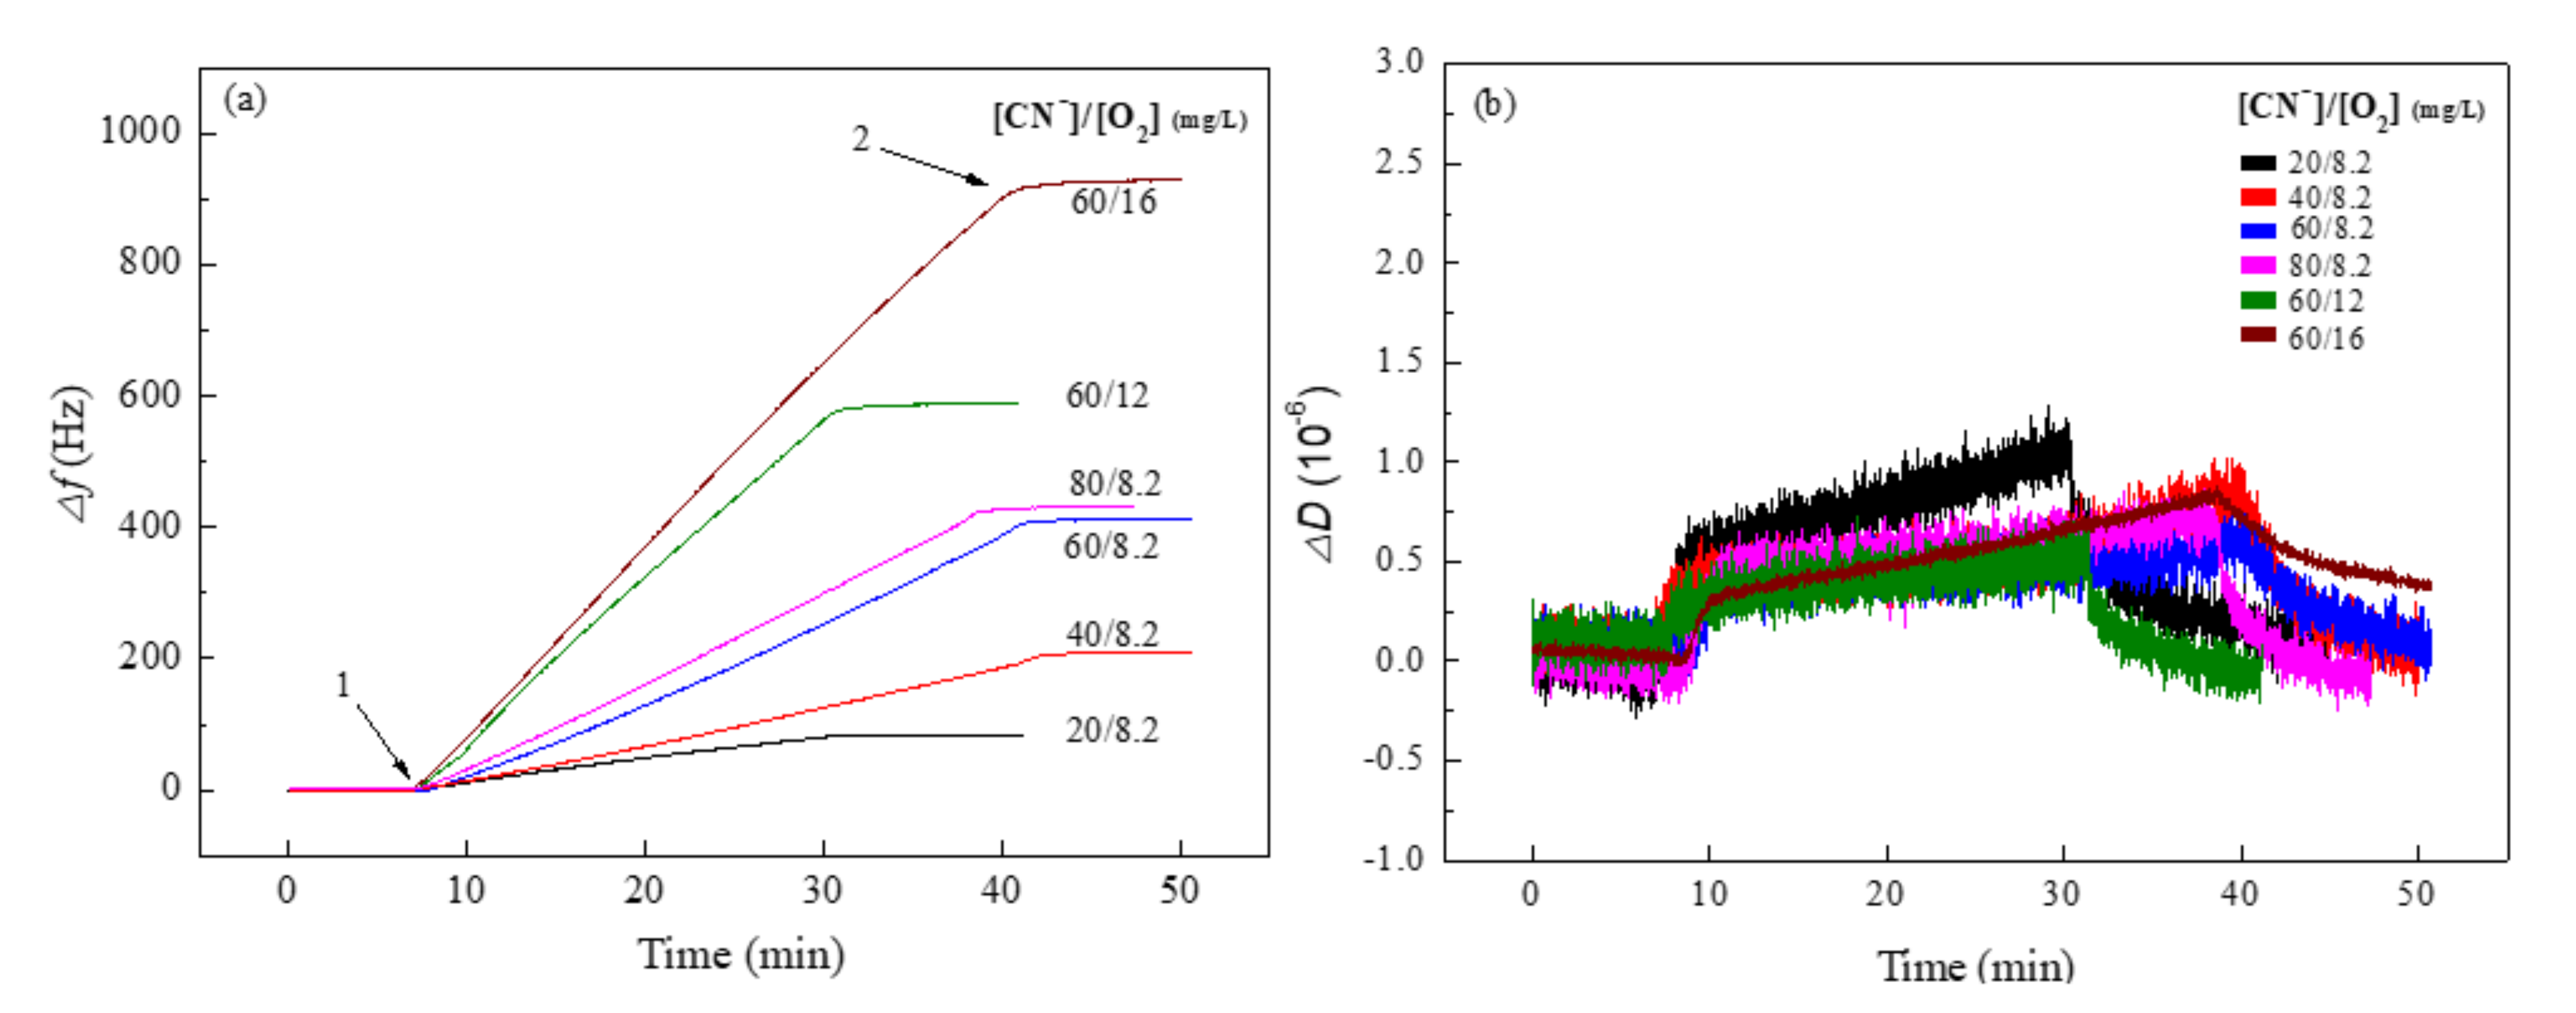
The effect of gold leaching for different mass concentration ratios of free cyanide and oxygen in the solution was monitored with a pure Au sensor by QCM-D. The real-time experimental data of the frequency shift over time were obtained from the seventh overtone (resonance frequency = 35 MHz). All operations ensured that the baseline before the test was less than 1 Hz within 5 min. Figure 7 shows the frequency shift (∆f) and the dissipation shift (∆D) of the leaching process. Arrow 1 indicates that the cyanide solution is injected into the system, and arrow 2 indicates that the background solution (deionized water) enters the system after the leaching rate stabilizes.
The injection of NaCN solution sharply increased ∆f and ∆D and increased ∆f at a constant rate over time. Thus, the leaching reagent reacts with gold on the sensor surface at an invariable rate. The ∆D of the system briefly increases steeply before gradually stabilizing, and the value of ∆D in the entire reaction process is less than 1.5 × 10⁻⁶ under all conditions. Because the gold coating changed from dense to fluffy during gold leaching, a rigid dissipative layer formed on the sensor surface. When the background solution was pumped into the system, ∆f exhibited a slightly slower upward trend and ultimately reached an equilibrium at a nonzero value, indicating that irreversible reactions occurred between the NaCN solution and the gold. In contrast, ∆D declined nearly to its initial state, suggesting that the surface properties of the gold sensor did not change significantly.
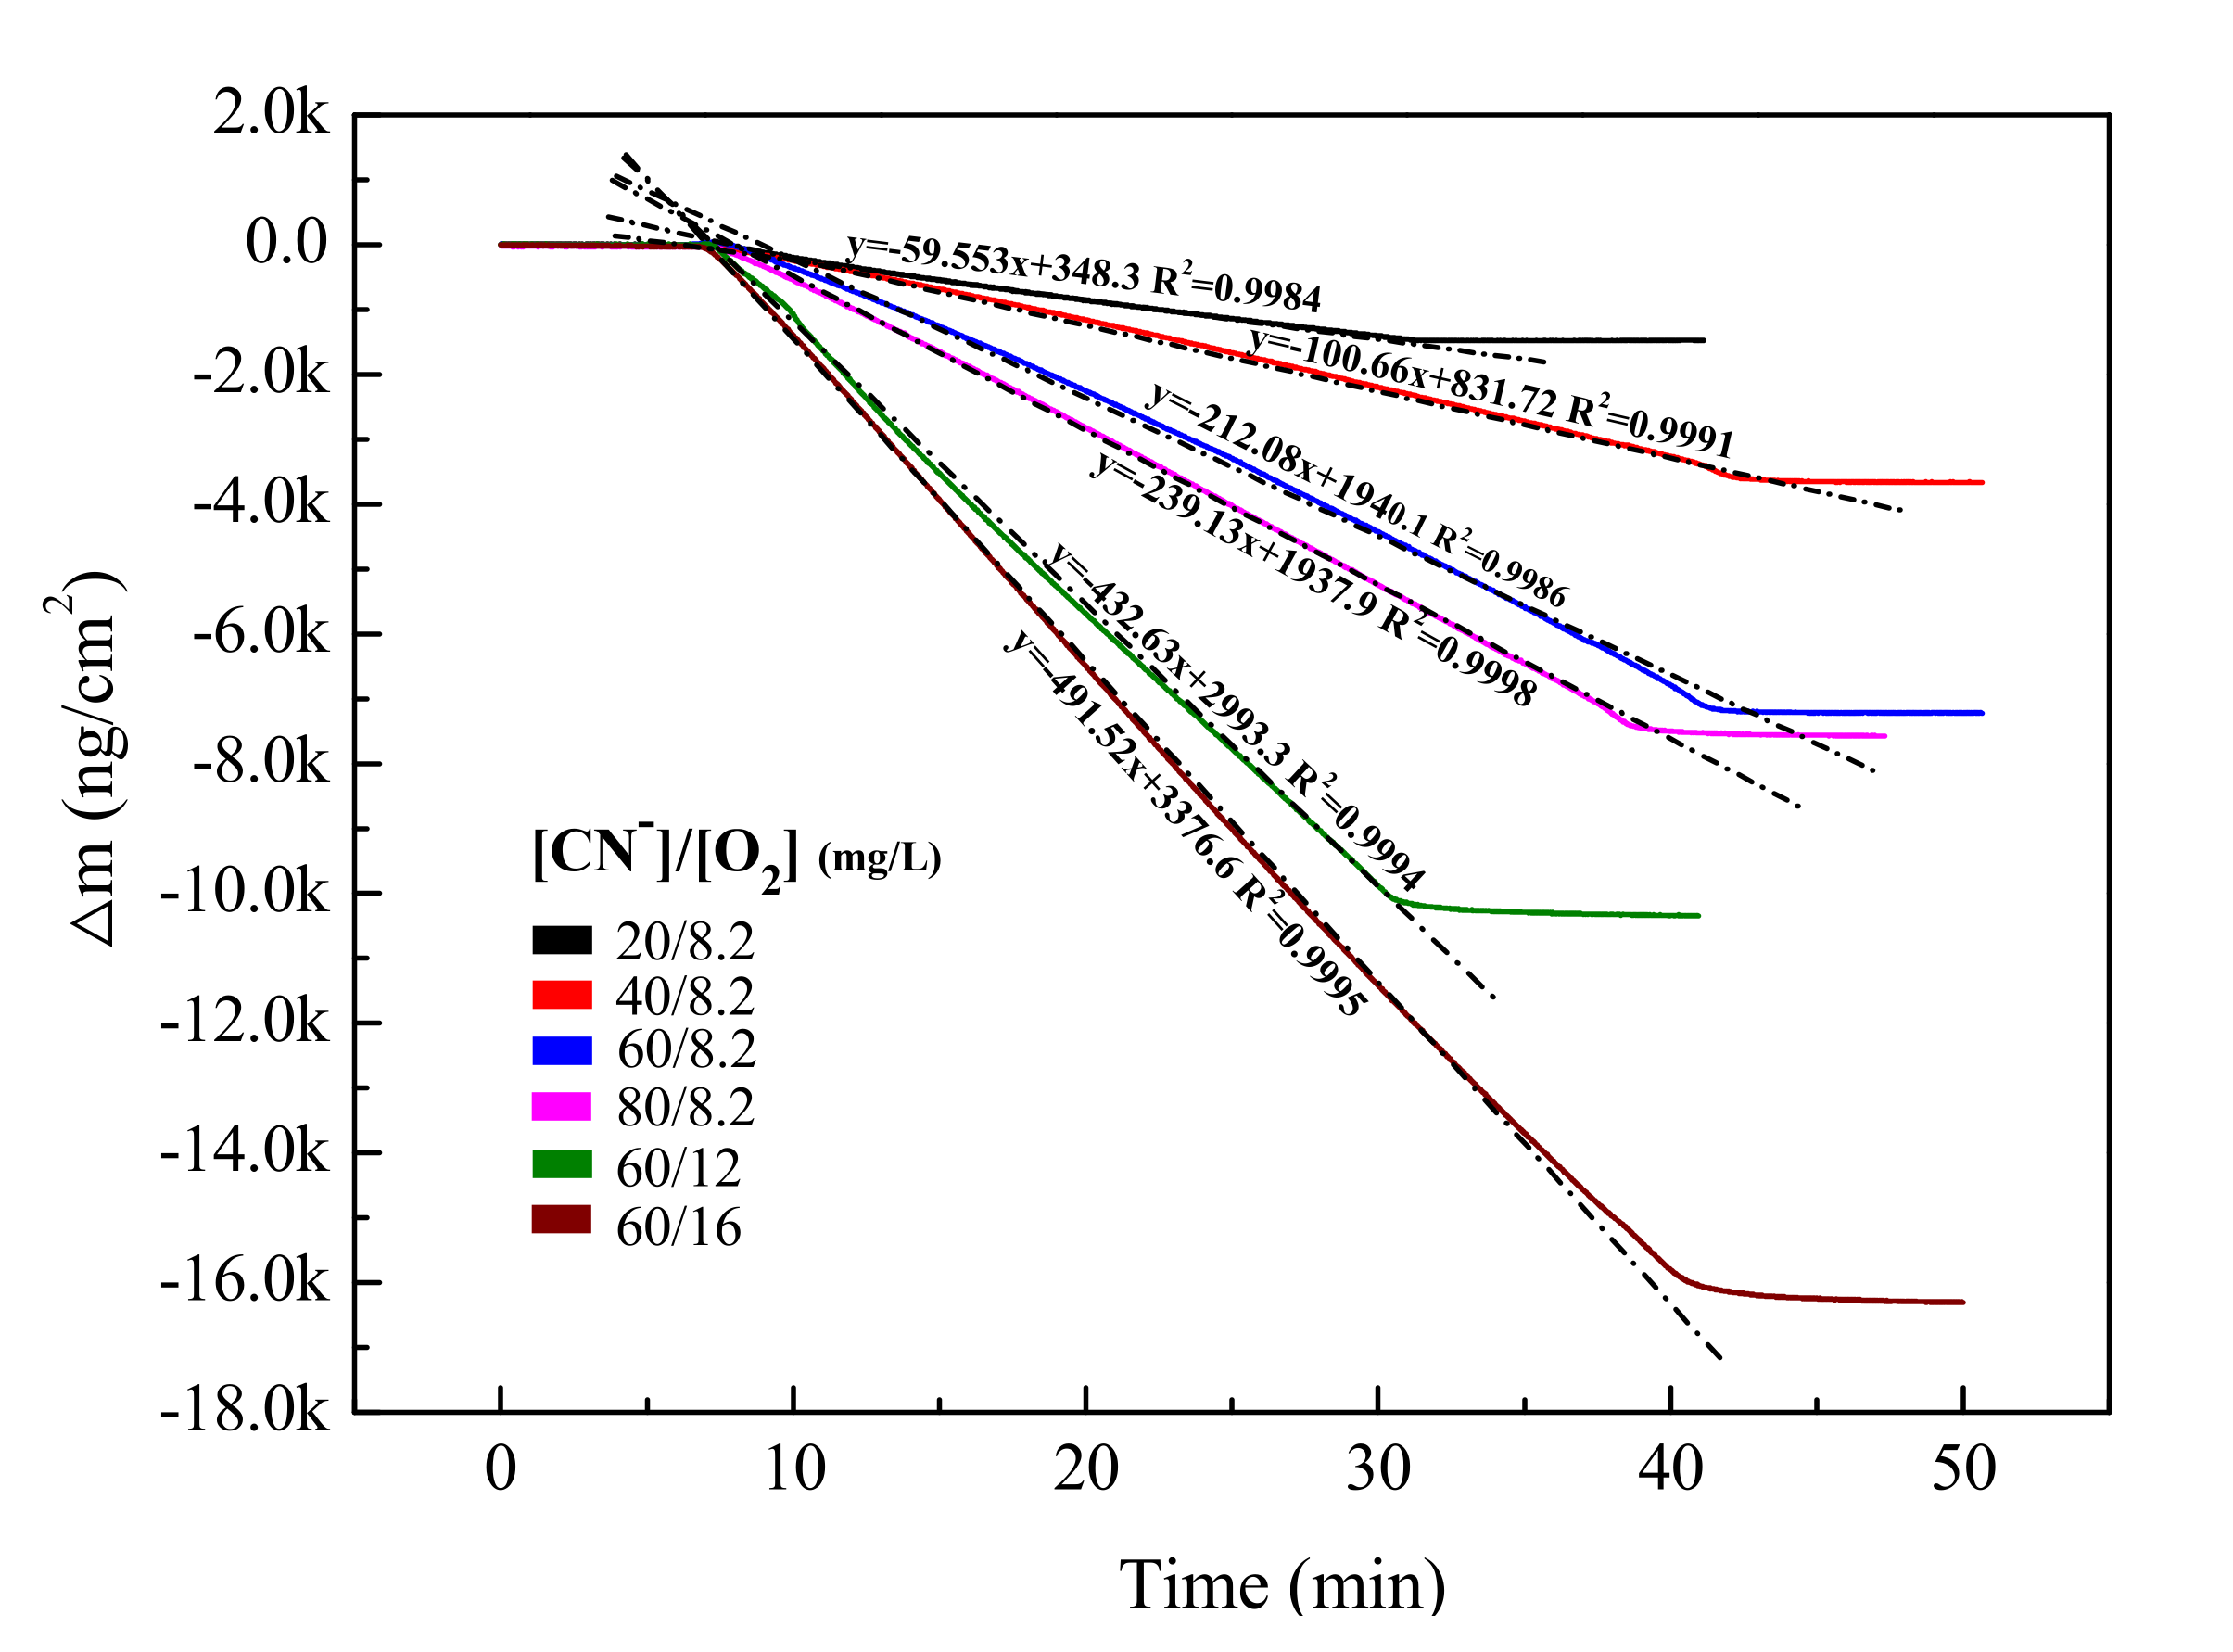
The relationship between the quality of the gold on the sensor surface and time was obtained using the Sauerbrey equation and the leaching rate was calculated by linear fitting (Figure 8). Under reaction conditions of 8.2 mg/L DO at normal temperature and pressure, [CN−]/[O2] was adjusted by changing the concentration of free cyanide in the solution. As the free cyanide concentration increased, the gold leaching rate rapidly increased before stabilizing. When the concentration of free cyanide was increased from 60 to 80 mg/L, the leaching rate increased by 27 ng/(cm2·min). However, the gold leaching rate increased significantly to 432.63 ng/(cm2·min) by increasing the DO in the solution to 12 mg/L and maintaining the free cyanide concentration at 60 mg/L. Further increasing DO to 16 mg/L raised the leaching rate of gold by 58.89 ng/(cm2·min). Therefore, the dissolution rate is a function of cyanide concentration at low cyanide concentrations, and a function of DO at high cyanide concentrations.
Cyanide is one of the primary causes of gold dissolution and cannot be viewed in isolation, especially in the context of the relationship between cyanide and oxygen derived from Elsner’s equation. By calculating the leaching of pure gold, the stoichiometry of Elsner’s reaction gives the required molar ratio of free cyanide to oxygen as 8:1 [39]. The dissolution of gold is an electrochemical reaction, in which oxygen absorbs electrons in one part of the metal surface (the cathode area); the metal releases electrons in the anode area. The concentration of cyanide determines the anodic dissolution rate of gold, and the concentration of oxygen determines the cathodic reduction rate of oxygen. The heterogeneous reaction was controlled by the Nernst boundary layer diffusion as two reactive species (O2 and CN−). According to the mixed potential theory of [CN−]/[O2], the optimal concentration ratio of [CN−]/[O2] was determined on the basis of the anodic oxidation of gold; the cathodic reduction of oxygen should be performed at the same rate. According to Fick’s law calculation, the molar ratio of free cyanide to oxygen in the solution is approximately 6:1 when the dissolution rate of gold reaches a maximum [8]. The above-mentioned theories confirm that appropriate concentrations of [CN−]/[O2] improve the gold leaching rate, which is consistent with the previously analyzed effect of [CN−]/[O2] on the cyanide leaching of gold.
3.2. Characteristics of Ozone Release in Ice
In this section, experiments were conducted to confirm the characteristics of oxygen release during the melting of ozone ice. The entire experiment process was performed in a thermostatic incubator at 5 °C. Ozone dissolved in water breaks down much faster than that in oxygen or air. In addition to the spontaneous decomposition of ozone for oxygen conversion, ozone in the aqueous phase involves the accelerated decomposition of ozone induced by the initiator (e.g., hydroxyl molecules that produce highly reactive hydroxyl radicals) [21]. The hydroxyl (·OH = 2.80 V) produced by the indirect reaction pathway has a stronger oxidation capacity than that of ozone (O3 = 2.07 V) [40].
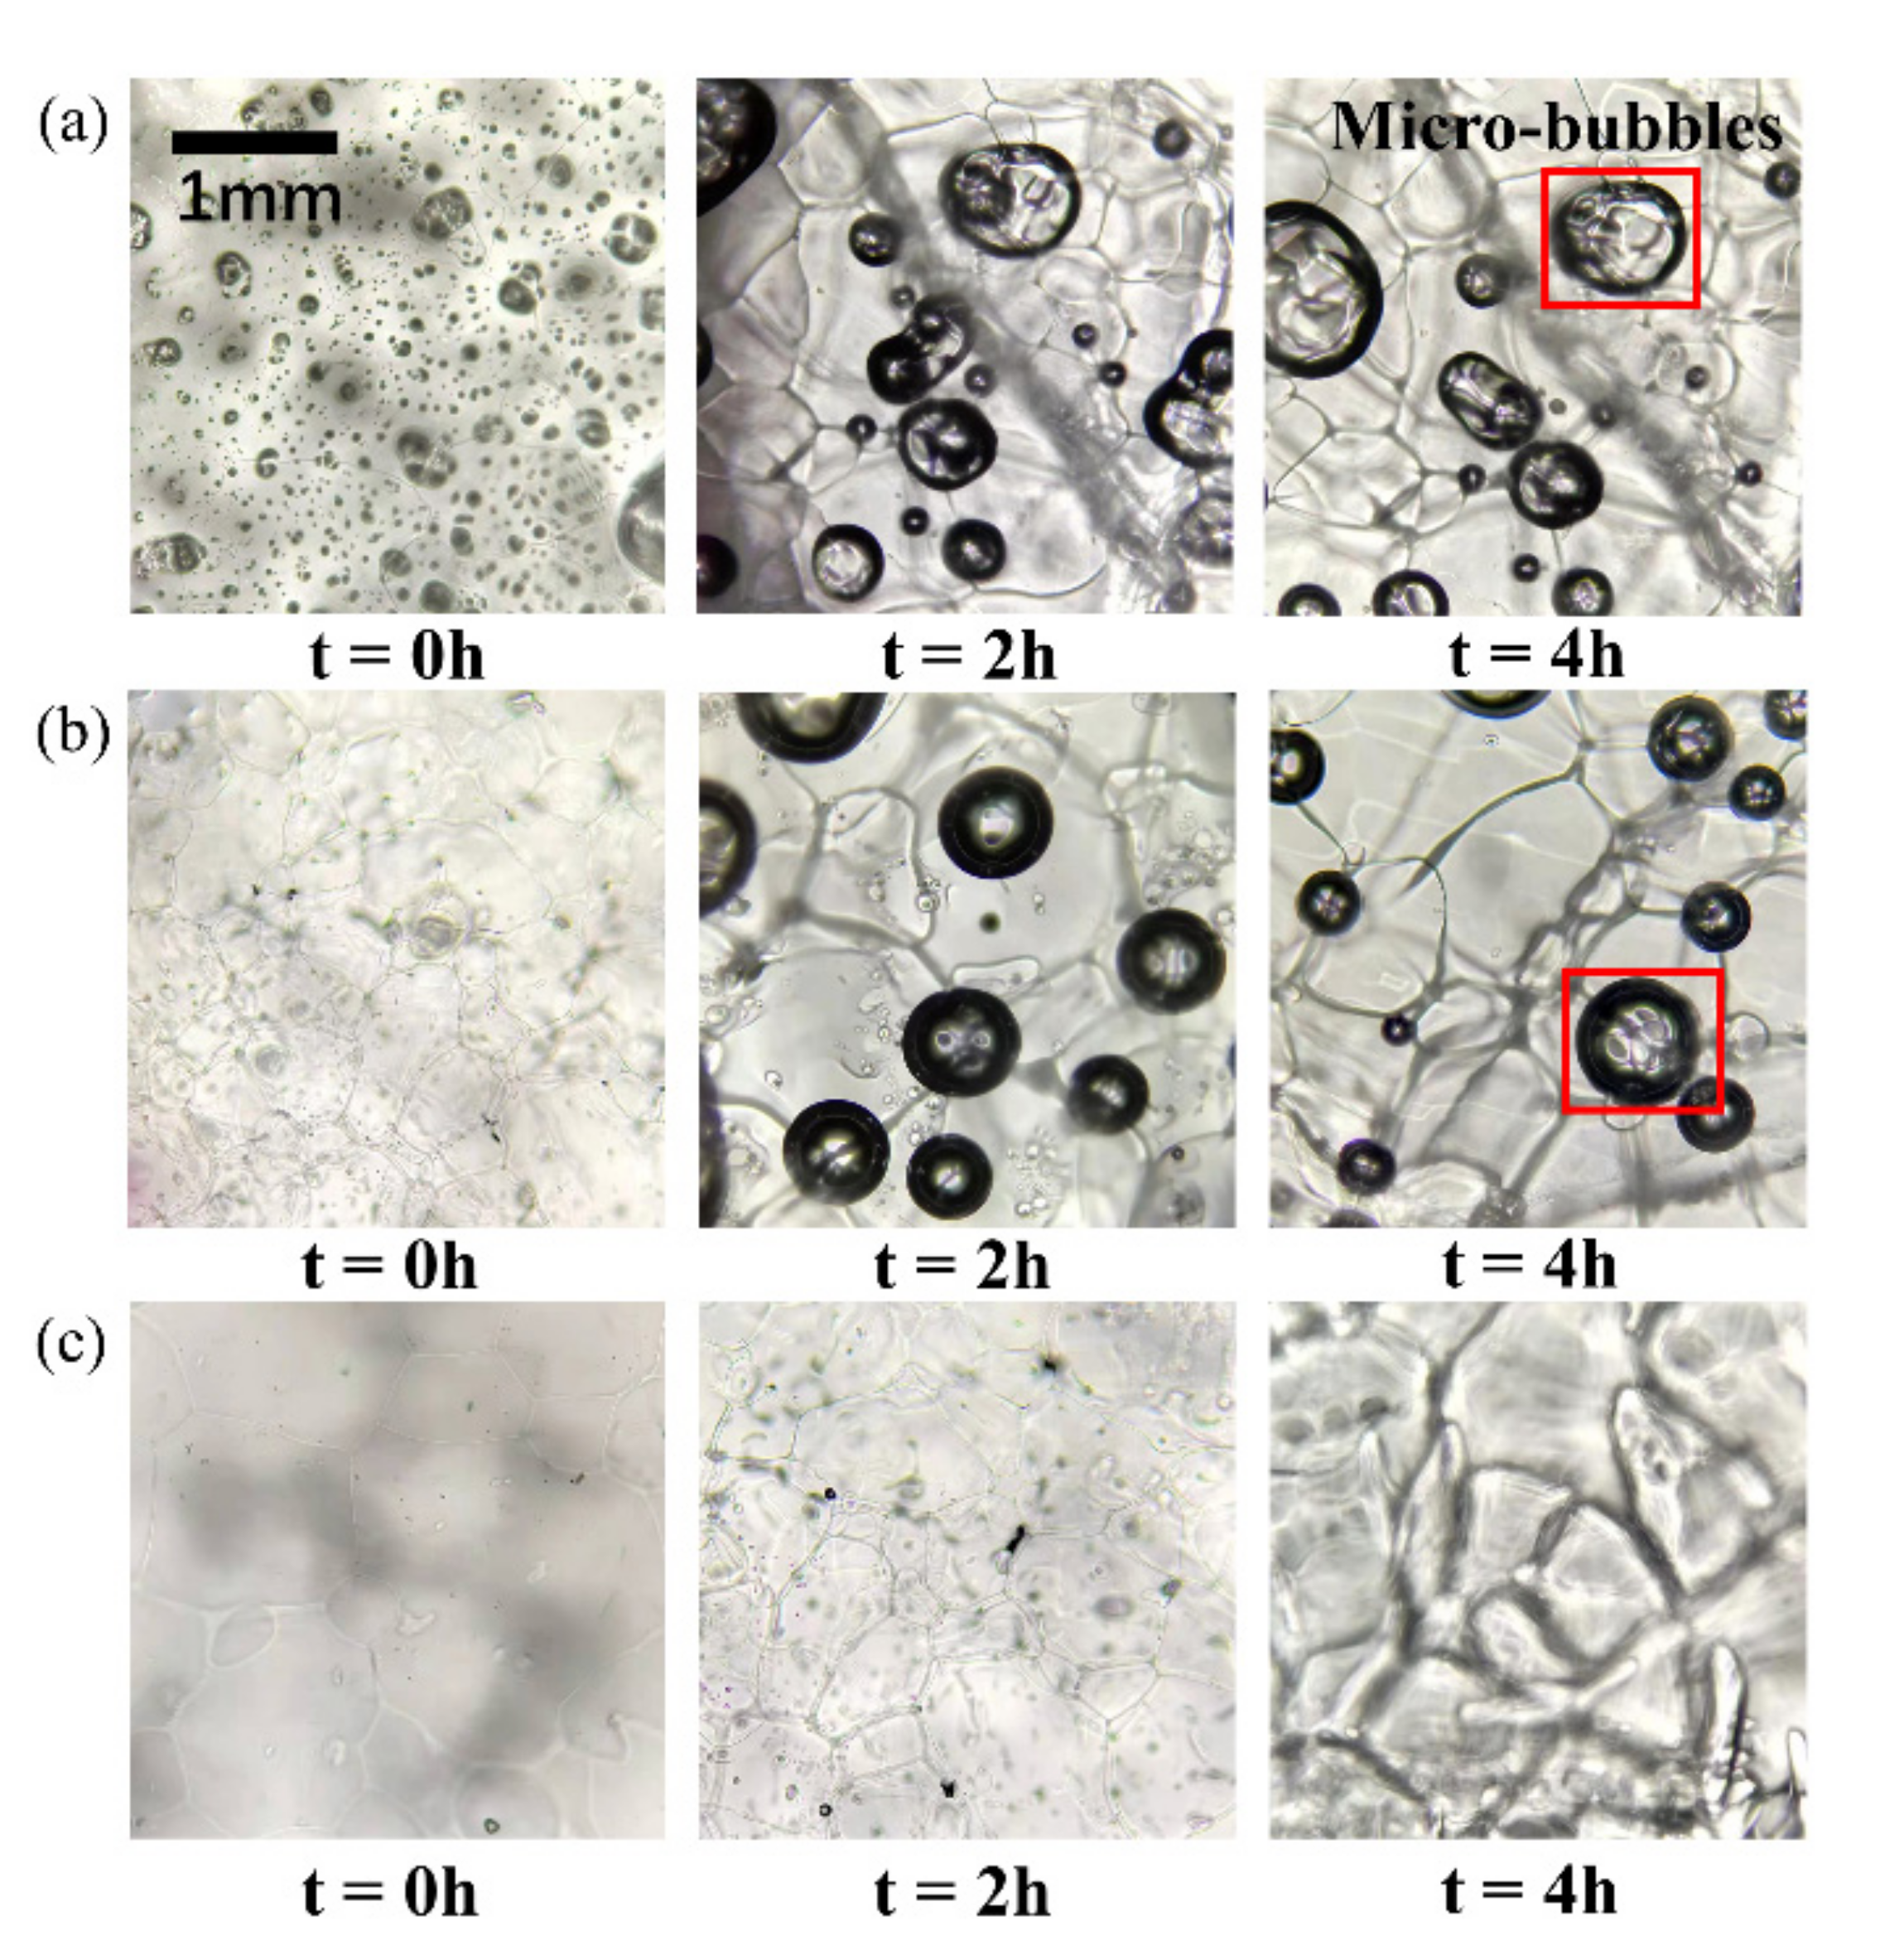
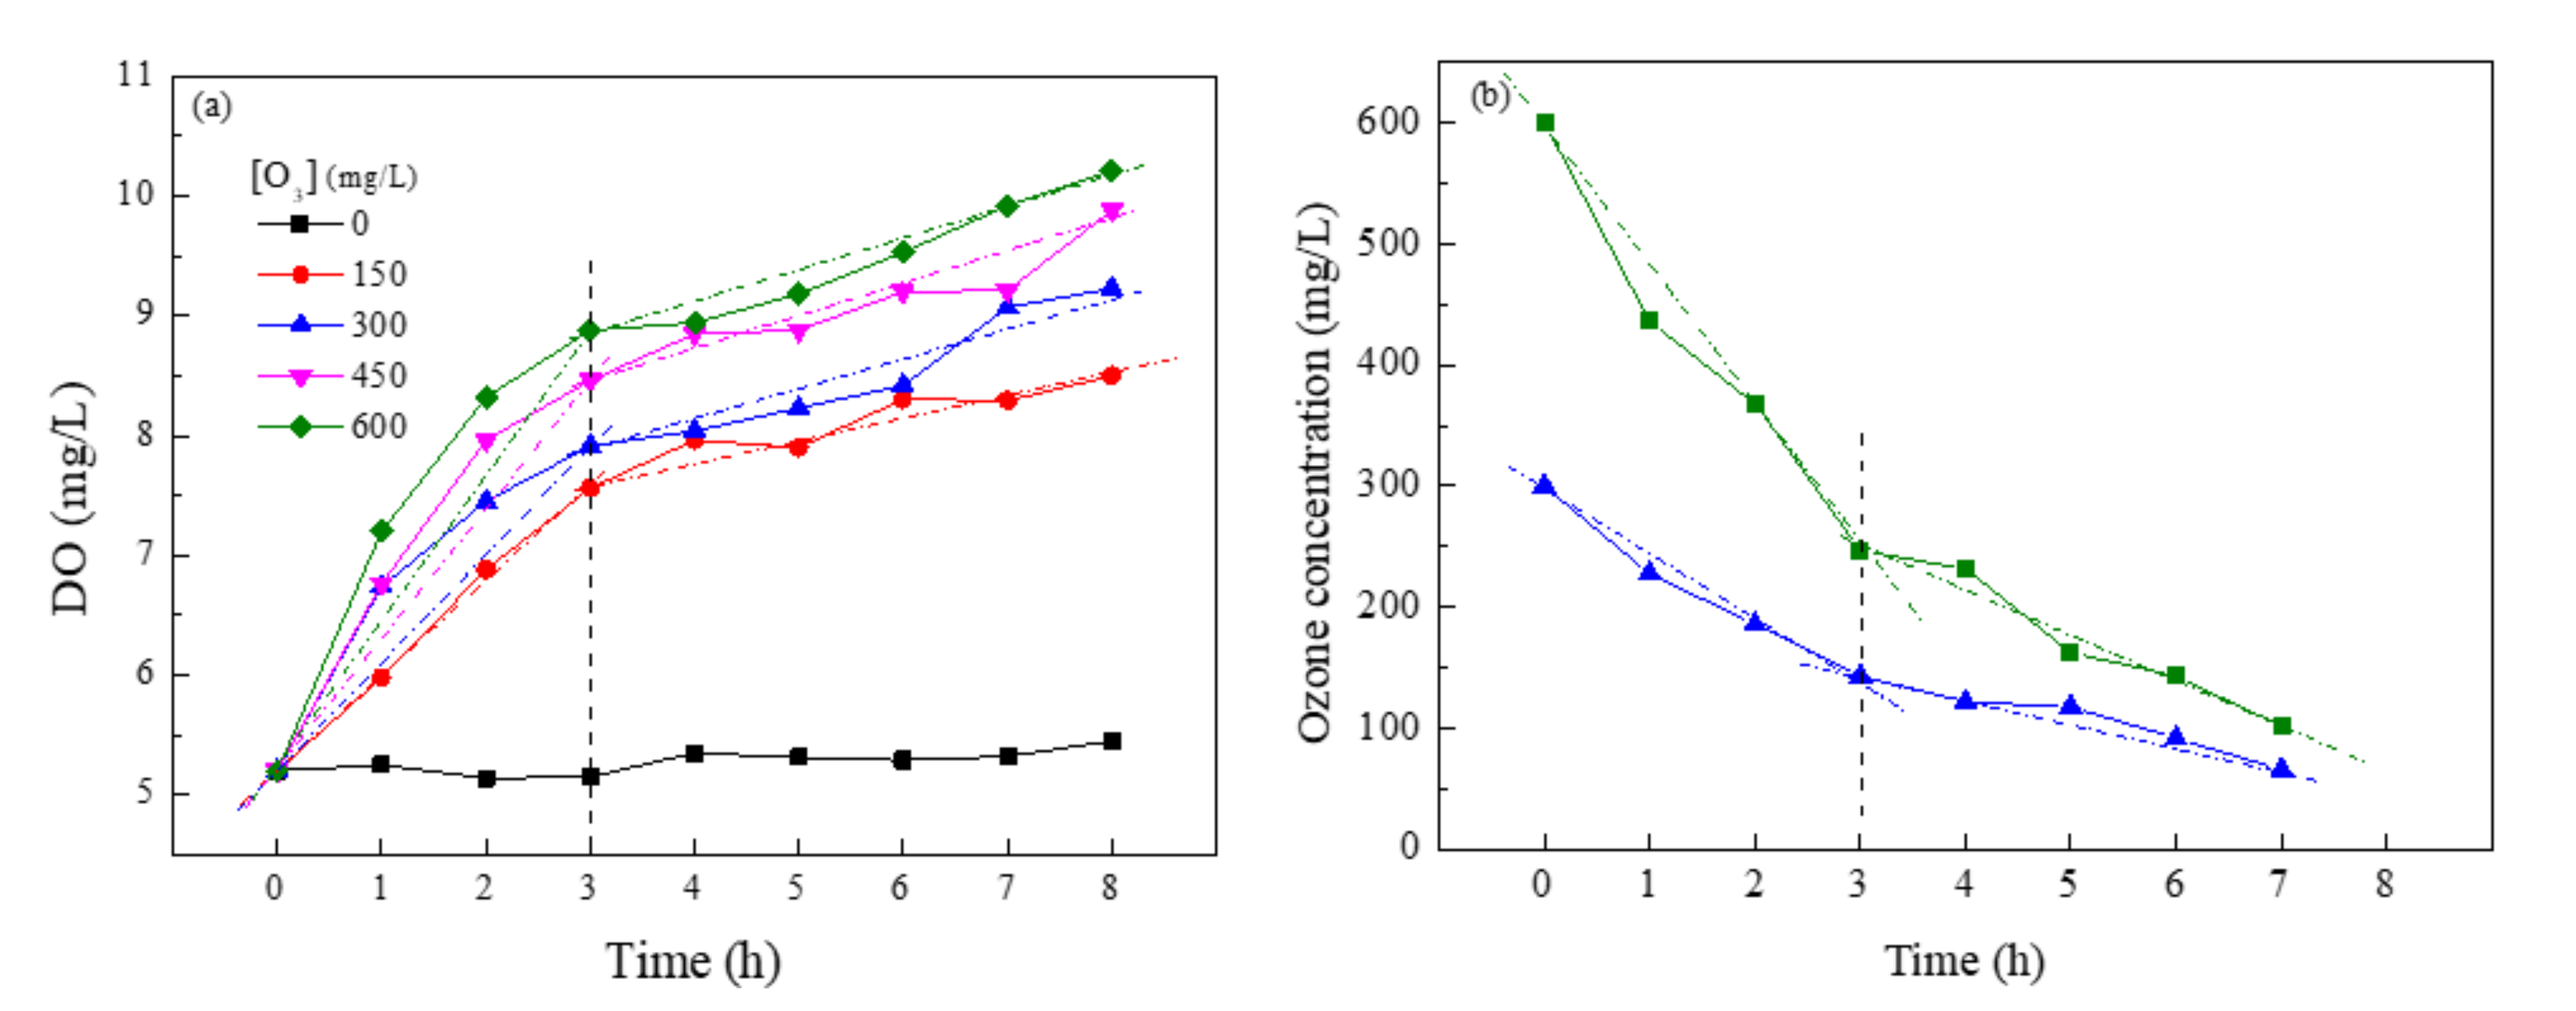
Figure 9 shows images taken from the ice surface during the melting procedure using an optical microscope. Initial conditions with ozone concentrations of 0 mg/L, 300 mg/L, and 600 mg/L featured distinct quantity variances of tiny bubbles caused by the amount of ozone in the ice. However, as the ice melted, the difference in the number of tiny bubbles gradually decreased at ozone concentrations of 300 mg/L and 600 mg/L. Additionally, the amount of ozone remaining in the ice and the DO in the leaching solution were measured. Figure 10b shows that the two stages of the rate of ozone release are clearly divided by the 3rd hour. The ozone release rate in the early stage was higher than that in the later stages, and higher ozone concentrations in the initial ice layer correspond to faster ozone release rates.
Figure 10a shows the change in DO during the ice melting. The line parallel to the horizontal axis of the graph represents the ice produced by deionized water without ozone, suggesting that the column leaching apparatus has good tightness. In contrast, the DO in the leaching solution increased with the addition of ozone ice. In the first 3 h of melting, the DO in the solution increased rapidly, and the rate of increase was a function of ozone concentration in the ice. However, the increase rate of DO was slower and less affected by the ozone concentration in the ice during melting after 3 h. This suggests that most of the ozone is released in the early stages of melting, whereas the retention rate of ozone in the later stages of melting is relatively steady despite different initial ozone concentrations. Additionally, the faster initial rate of melting also affects the release of ozone from the ice (Figure 4a).
3.3. Effect of Ozone Ice on Gold Leaching Extraction in the Column Leaching Test
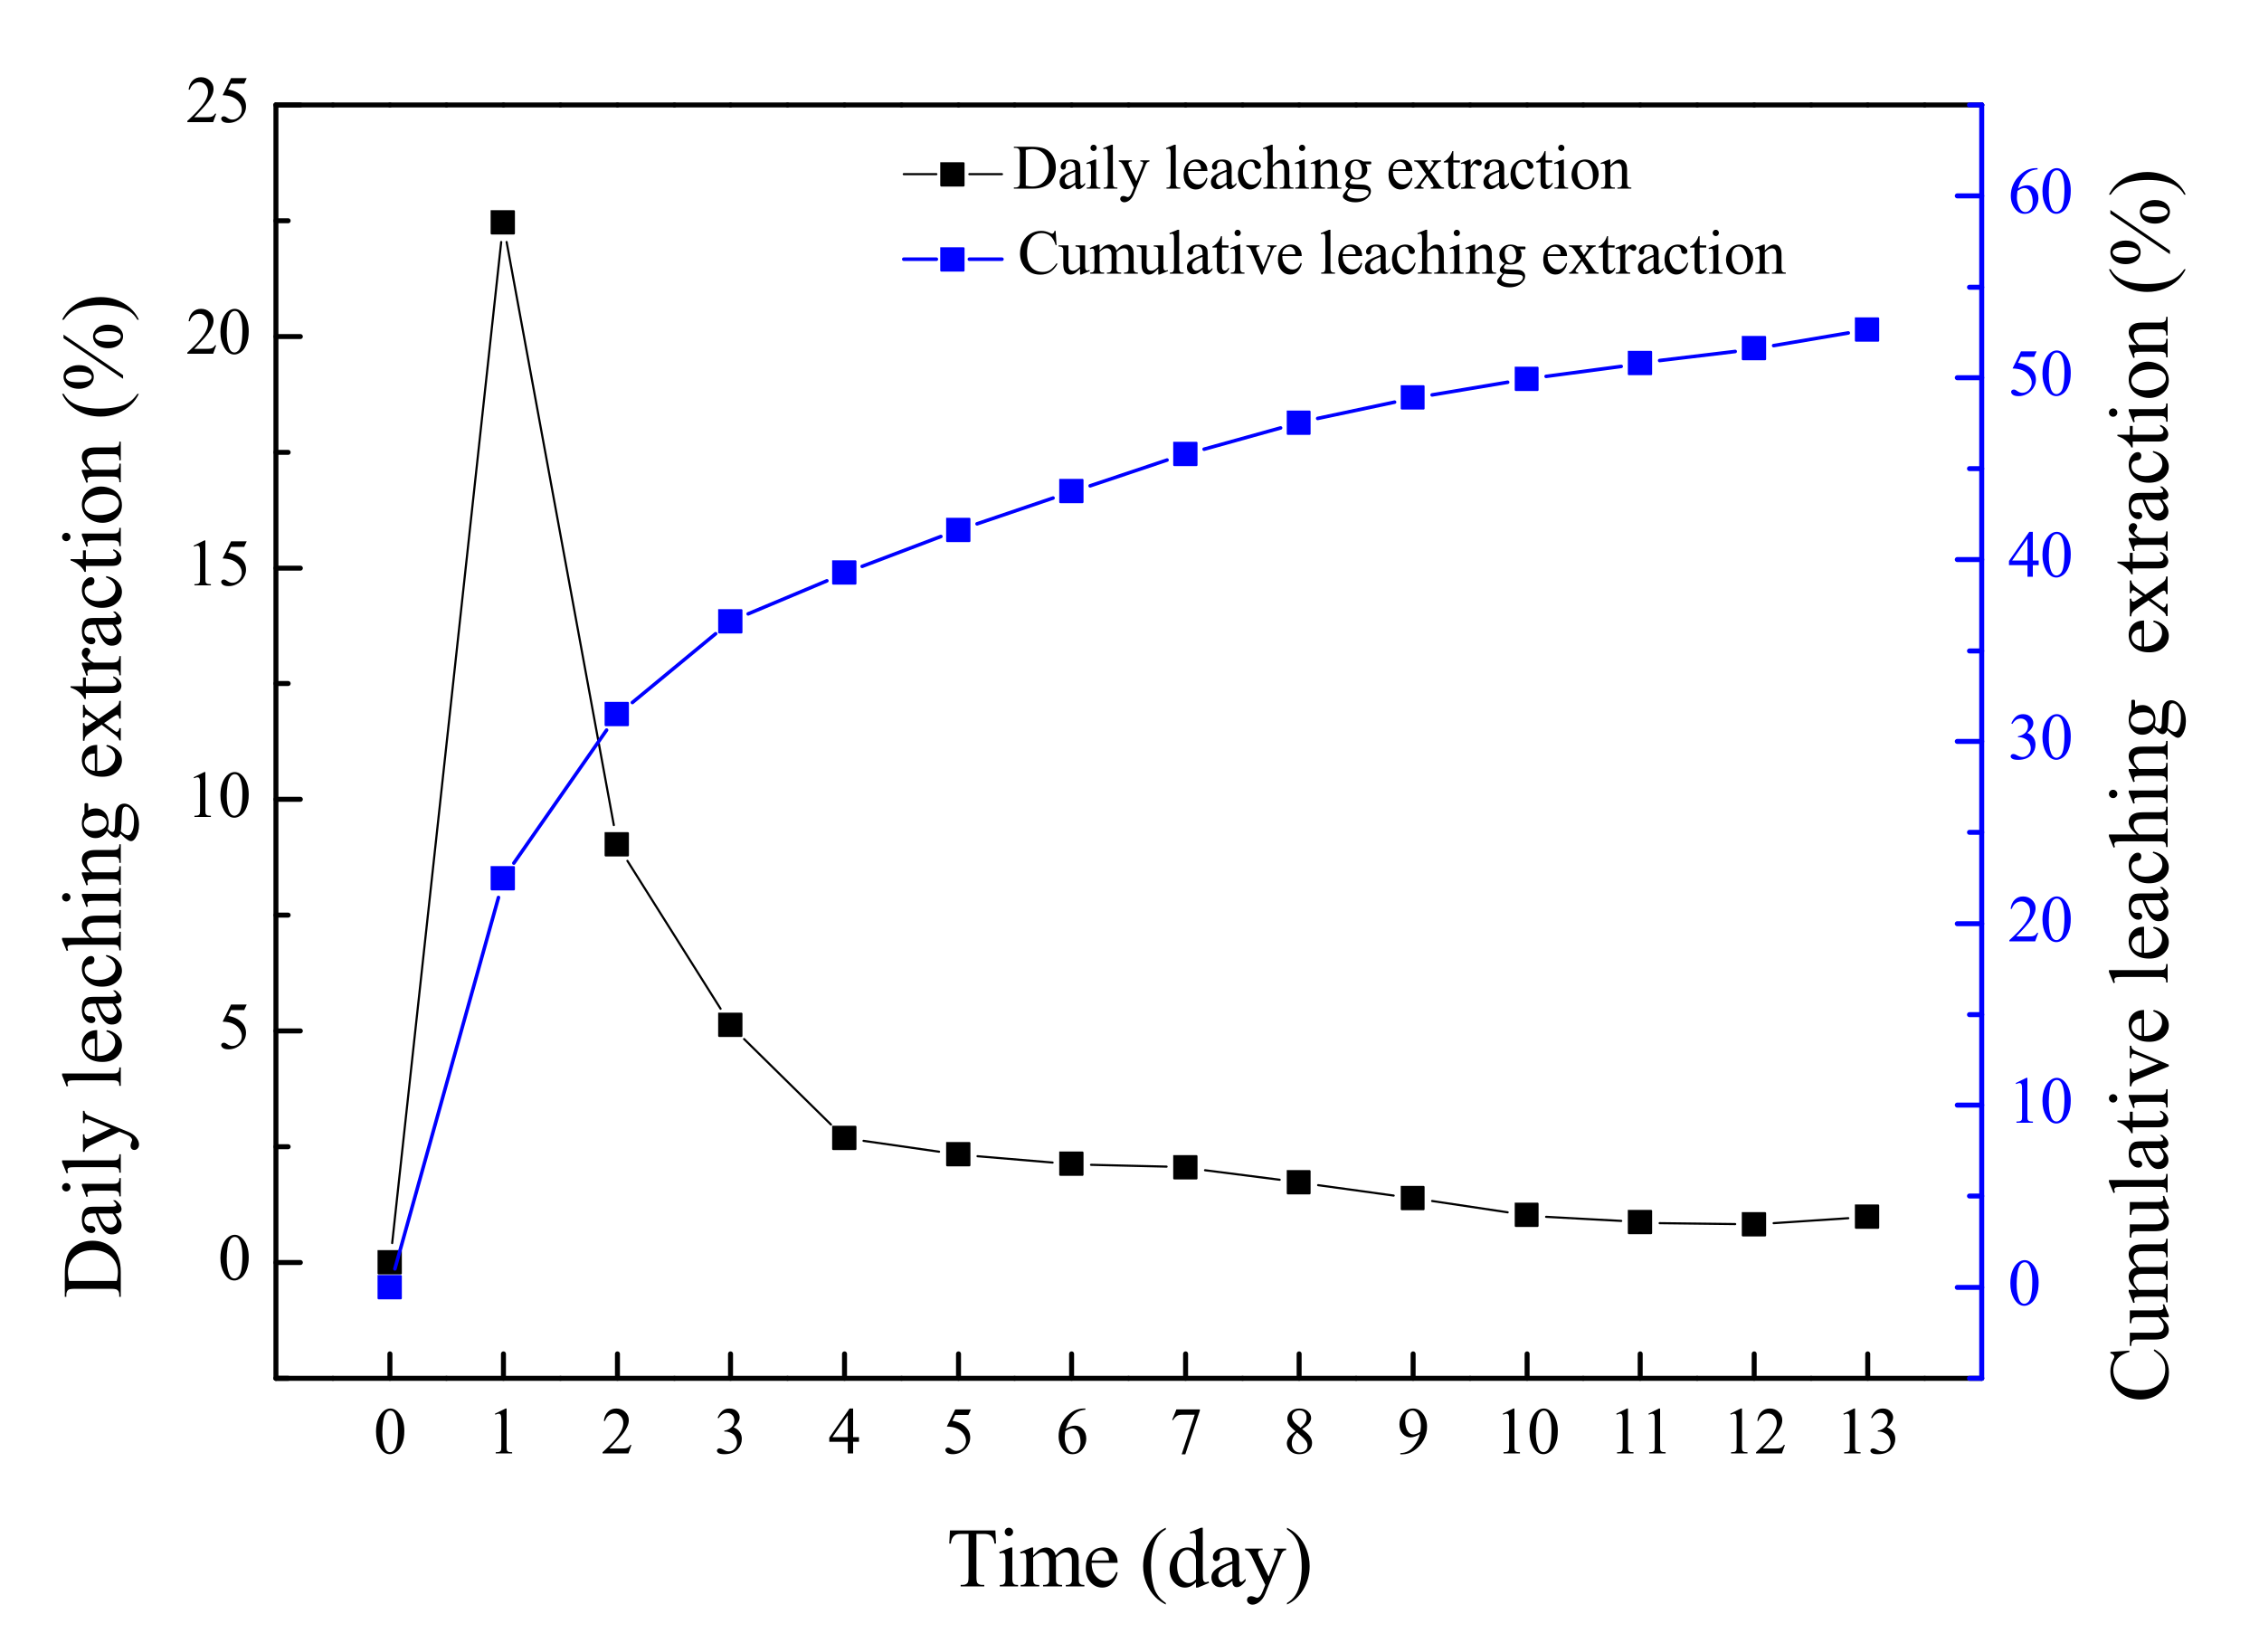
A series of column leaching experiments were conducted to investigate the effect of ozone ice on gold leaching under low-temperature and hypoxic environments. The tests were prepared using cyanide solutions containing 200 ppm of free cyanide at pH = 11. Similarly, nitrogen was used to remove oxygen from the leaching solution to ensure oxygen deficiency. Figure 11 shows that the gold in the ore is leachable cyanide, and 52.6% gold extraction was achieved in 13 d. The daily gold extraction value peaked on the first day, decreased with time, and stabilized on the fifth day with a gold concentration of less than 0.02 mg/L in the pregnant solution. A leaching cycle of 5 d was chosen to shorten the leaching time to focus on the influence of the ozone ice.
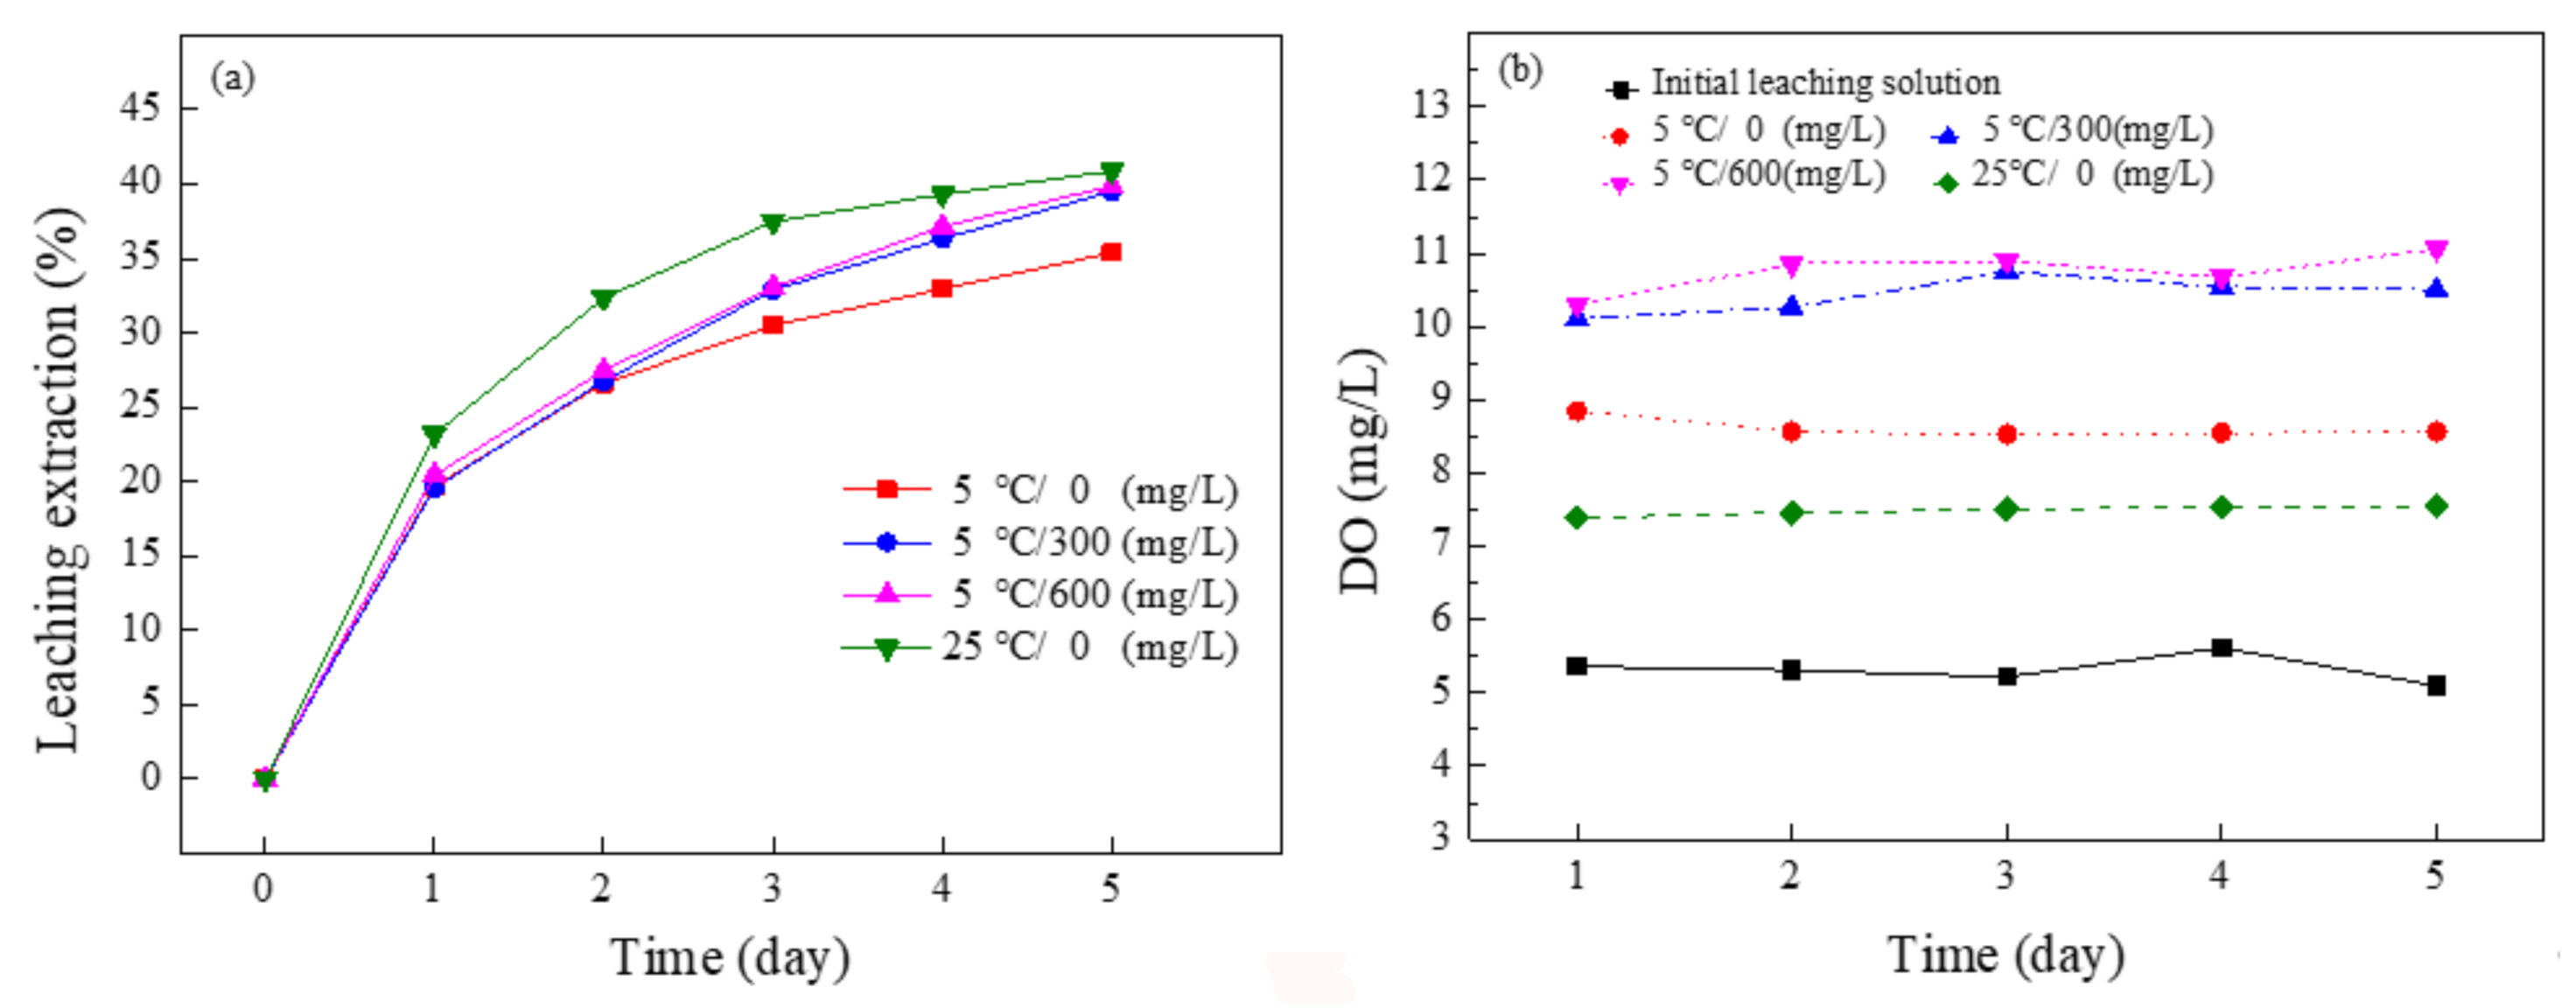
Figure 12a shows the gold extraction at different ozone concentrations in ice. Gold extraction increased by 4.1% with the addition of ozone ice containing 300 mg/L of ozone at 5 °C. However, the effect did not increase continuously as a function of gold extraction versus ozone concentration; gold extraction values at ozone concentrations of 300 and 600 mg/L were 39.5% and 39.9%, respectively. Thus, the DO in the leaching solution might have reached saturation, preventing higher ozone concentrations from improving gold extraction. Temperature is also an important factor in the leaching process; gold extraction was 5.5% higher at 25 °C than at 5 °C.
The DO concentrations in the initial leaching and pregnant solutions were determined in the above-mentioned conditions. The initial leaching solution was anoxic with a DO of approximately 5.2 mg/L. As the leaching column is an open system, DO increases as the leaching solution flows through the ore heap. Figure 12b shows that the temperature of the leaching environment significantly influences the change in DO; additionally, the DO concentration in the leaching solution was higher at low temperatures. The addition of ozone ice significantly increases DO in the leaching solution. However, higher ozone concentrations in the ice did not further increase DO in the solution at a fixed temperature of 5 °C; stabilization occurred at approximately 10.2 mg/L.
4. Conclusions
- (1)
- The effect of [CN−]/[O2] on the leaching rate of gold was monitored using QCM-D. The leaching rate increased from 212.08 to 432.63 ng/(cm2·min) as the dissolved oxygen concentration increased from 8.2 to 12 mg/L at a cyanide ion concentration of 60 mg/L. Therefore, the effective leaching of gold is undermined by oxygen deficiency inside the leaching heap.
- (2)
- The decomposition rate of ozone in ice does not change linearly. In the early stage of ozone ice melting (the first 3 h), the ozone decomposition rate was affected by the initial ozone concentration. Higher initial ozone concentrations in the ice layer produced faster ozone decomposition rates. At the later stage of ozone ice melting (after 5 h), the retention rates of ozone at different initial concentrations in the ice are similar; the increase rates of DO in the solution for different initial concentrations are also similar.
- (3)
- Gold extraction was improved by embedding ozone ice into the leaching column. At 5 °C in an oxygen-deficient environment, the addition of ozone ice with an ozone concentration of 300 mg/L increased the gold leaching extraction by 4.1%.
In summary, the study shows the potential of ozone ice as an oxygen release reagent to promote heap leaching in cold climate conditions. In the future, numerical simulation software (e.g., COMSOL Multiphysics) should be used to calculate the melting process and time of ozone ice and determine the size and distribution of ice in the actual ore heap under specific environments. The embedding scheme of ozone ice in ore heap will be formulated for industrial heap leaching.
Author Contributions
Formal analysis, Z.L.; Methodology, Z.L., P.L. and Y.Z.; Resources, C.S.; Supervision, Y.X.; Writing—original draft, Z.L.; Writing—review and editing, J.K. All authors have read and agreed to the published version of the manuscript.
Funding
This research was funded by the National Natural Science Foundation of China grant number 51974016.
Data Availability Statement
Not applicable.
Acknowledgments
This work was supported by the National Natural Science Foundation of China.
Conflicts of Interest
The authors declare no conflict of interest.
References
- Lin, C.; Miller, J.; Garcia, C. Saturated flow characteristics in column leaching as described by LB simulation. Miner. Eng. 2005, 18, 1045–1051. [Google Scholar] [CrossRef]
- Petersen, J. Heap leaching as a key technology for recovery of values from low-grade ores–A brief overview. Hydrometallurgy 2016, 165, 206–212. [Google Scholar] [CrossRef]
- Ilankoon, I.; Tang, Y.; Ghorbani, Y.; Northey, S.; Yellishetty, M.; Deng, X.; McBride, D. The current state and future directions of percolation leaching in the Chinese mining industry: Challenges and opportunities. Miner. Eng. 2018, 125, 206–222. [Google Scholar] [CrossRef] [Green Version]
- Kappes, D.W. Precious metal heap leach design and practice. Proc. Miner. Process. Plant Des. Pract. Control 2002, 1, 1606–1630. [Google Scholar]
- Ghorbani, Y.; Franzidis, J.-P.; Petersen, J. Heap leaching technology–current state, innovations and future directions: A review. Miner. Process. Extr. Met. Rev. 2015, 37, 73–119. [Google Scholar] [CrossRef] [Green Version]
- Fungene, T.; Groot, D.; Mahlangu, T.; Sole, K. Decomposition of hydrogen peroxide in alkaline cyanide solutions. J. S. Afr. Inst. Min. Met. 2018, 118, 1259–1264. [Google Scholar] [CrossRef] [Green Version]
- Bouffard, S.C.; Dixon, D.G. Evaluation of kinetic and diffusion phenomena in cyanide leaching of crushed and run-of-mine gold ores. Hydrometallurgy 2007, 86, 63–71. [Google Scholar] [CrossRef]
- Liu, G.; Yen, W. Effects of sulphide minerals and dissolved oxygen on the gold and silver dissolution in cyanide solution. Miner. Eng. 1995, 8, 111–123. [Google Scholar] [CrossRef]
- Ilankoon, I.; Neethling, S. Liquid spread mechanisms in packed beds and heaps. The separation of length and time scales due to particle porosity. Miner. Eng. 2016, 86, 130–139. [Google Scholar] [CrossRef]
- Ellis, S.; Senanayake, G. The effects of dissolved oxygen and cyanide dosage on gold extraction from a pyrrhotite-rich ore. Hydrometallurgy 2004, 72, 39–50. [Google Scholar] [CrossRef]
- Yu, S.; Wu, A.; Wang, Y. Insight into the structural evolution of porous and fractured media by forced aeration during heap leaching. Int. J. Min. Sci. Technol. 2019, 29, 803–807. [Google Scholar] [CrossRef]
- Monhemius, A. Recent Applications of Peroxygen Reagents in Hydrometallurgy. Miner. Process. Extr. Met. Rev. 1992, 8, 35–46. [Google Scholar] [CrossRef]
- Pantelis, G.; Ritchie, A. Rate-limiting factors in dump leaching of pyritic ores. Appl. Math. Model. 1992, 16, 553–560. [Google Scholar] [CrossRef]
- Ball, S.; Monhemius, J.A.; Wyborn, J.P. The use of inorganic peroxides as accelerators for gold heap leaching. Precious Met. 1988, 89, 149–162. [Google Scholar]
- Loroesch, J.; Knorre, H.; Griffiths, A. Developments in gold leaching using hydrogen peroxide. Eng. Geol. 1989, 41, 963–965. [Google Scholar]
- Nugent, A.; Brackenbury, K.; Kinner, J. AuPLUS systems for the treatment of gold ores using hydrogen peroxide and calcium peroxide. Australas. Inst. Min. Metall. 1991, 91, 173–176. [Google Scholar]
- Arslan, F.; Ozdamar, D.; Muduroglu, M. Cyanidation of Turkish gold-silver ore and the use of hydrogen peroxide. Eur. J. Miner. Process. Environ. Prot. 2003, 3, 309–315. [Google Scholar]
- Nicol, M.J. The role and use of hydrogen peroxide as an oxidant in the leaching of minerals. II. alkaline solutions. Hydrometallurgy 2020, 194, 105365. [Google Scholar] [CrossRef]
- Elorza-Rodríguez, E.; Nava-Alonso, F.; Jara, J.; Lara-Valenzuela, C. Treatment of pyritic matrix gold–silver refractory ores by ozonization–cyanidation. Miner. Eng. 2006, 19, 56–61. [Google Scholar] [CrossRef]
- Carrillo Pedroza, F.R.; Aguilar, M.D.J.S.; Martínez Luévanos, A.; Gonzalez Anaya, J.A. Ozonation Pretreatment of Gold-Silver Pyritic Minerals. Ozone Sci. Eng. 2007, 29, 307–313. [Google Scholar] [CrossRef]
- Kim, J.-G.; Yousef, A.E.; Khadre, M.A. Ozone and its current and future application in the food industry. In Advances in Food and Nutrition Research; Academic Press Inc.: Cambridge, MA, USA, 2003; Volume 45, pp. 167–218. ISBN 0120164450. [Google Scholar]
- Shezi, S.; Magwaza, L.S.; Mditshwa, A.; Tesfay, S.Z. Changes in biochemistry of fresh produce in response to ozone postharvest treatment. Sci. Hortic. 2020, 269, 109397. [Google Scholar] [CrossRef]
- Prabha, V.; Barma, R.D.; Singh, R.; Madan, A. Ozone Technology in food processing: A review. Trends Biosci. 2015, 8, 4031–4047. [Google Scholar]
- Brodowska, A.J.; Nowak, A.; Śmigielski, K.B. Ozone in the food industry: Principles of ozone treatment, mechanisms of action, and applications: An overview. Crit. Rev. Food Sci. Nutr. 2018, 58, 2176–2201. [Google Scholar] [CrossRef] [PubMed]
- Matsumoto, K.; Sameshima, K.; Teraoka, Y.; Furuya, K.; Murahashi, K.; Hayashi, K.; Shirai, D. Formation of ozone ice by freezing water containing ozone micro-bubbles (Investigation into the influence of surfactant on characteristics of ice containing oxygen micro-bubbles). Int. J. Refrig. 2012, 36, 842–851. [Google Scholar] [CrossRef]
- Matsumoto, K.; Furuya, K.; Zhang, S.; Teraoka, Y.; Tsubaki, D.; Furudate, Y. Investigation on concentration characteristics of ozone micro-bubbles fixed in ice and ozone gas released from ice. Int. J. Refrig. 2015, 53, 13–19. [Google Scholar] [CrossRef]
- Wei, H.; Huang, K.; Zhang, L.; Ge, B.; Wang, D.; Lang, J.; Ma, J.; Wang, D.; Zhang, S.; Li, Q.; et al. Ice Melting to Release Reactants in Solution Syntheses. Angew. Chem. Int. Ed. 2018, 57, 3354–3359. [Google Scholar] [CrossRef]
- McBride, D.; Gebhardt, J.; Croft, T.; Cross, M. Modeling the hydrodynamics of heap leaching in sub-zero temperatures. Miner. Eng. 2016, 90, 77–88. [Google Scholar] [CrossRef] [Green Version]
- Rachmat, T.T.; Dhesy, G.R.; Sri, W. Ozone determination: A comparison of quantitative analysis method. J. Pure Chem. Res. 2012, 1, 18–25. [Google Scholar]
- McClurkin, J.D.; Maier, D.E.; Ileleji, K.E. Half-life time of ozone as a function of air movement and conditions in a sealed container. J. Stored Prod. Res. 2013, 55, 41–47. [Google Scholar] [CrossRef]
- Jeffrey, M.I.; Woods, R. Frequency changes observed with the EQCM resulting from hydrophilic/hydrophobic transitions. Colloids Surf. A 2007, 302, 488–493. [Google Scholar] [CrossRef]
- Kou, J.; Xu, S. In situ kinetics and conformation studies of dodecylamine adsorption onto zinc sulfide using a quartz crystal microbalance with dissipation (QCM-D). Colloids Surf. A Physicochem. Eng. Asp. 2016, 490, 110–120. [Google Scholar] [CrossRef]
- Hieda, M.; Garcia, R.; Dixon, M.; Daniel, T.; Allara, D.; Chan, M.H.W. Ultrasensitive quartz crystal microbalance with porous gold electrodes. Appl. Phys. Lett. 2004, 84, 628–630. [Google Scholar] [CrossRef]
- Sauerbrey, G. Verwendung von Schwingquarzen zur Wägung dünner Schichten und zur Mikrowägung. Z. Phys. 1959, 155, 206–222. [Google Scholar] [CrossRef]
- Swiatek, S.; Komorek, P.; Jachimska, B. Adsorption of β-lactoglobulin A on gold surface determined in situ by QCM-D measurements. Food Hydrocoll. 2019, 91, 48–56. [Google Scholar] [CrossRef]
- Jeffrey, M.; Linda, L.; Breuer, P.; Chu, C. A kinetic and electrochemical study of the ammonia cyanide process for leaching gold in solutions containing copper. Miner. Eng. 2002, 15, 1173–1180. [Google Scholar] [CrossRef]
- Josefsson, P.; Henriksson, G.; Wågberg, L. The Physical Action of Cellulases Revealed by a Quartz Crystal Microbalance Study Using Ultrathin Cellulose Films and Pure Cellulases. Biomacromolecules 2008, 9, 249–254. [Google Scholar] [CrossRef]
- Gutig, C.; Grady, B.P.; Striolo, A. Experimental Studies on the Adsorption of Two Surfactants on Solid−Aqueous Interfaces: Adsorption Isotherms and Kinetics. Langmuir 2008, 24, 4806–4816. [Google Scholar] [CrossRef] [PubMed]
- Vorster, B.J.; Flatman, S.R. Cyanide control in the metallurgical process of gold extraction in AngloGold (S.A.). J. S. Afr. Inst. Min. Metall. 2001, 101, 359–365. [Google Scholar]
- Kepa, U.; Stanczyk-Mazanek, E.; Stepniak, L. The use of the advanced oxidation process in the ozone + hydrogen peroxide system for the removal of cyanide from water. Desalination 2008, 223, 187–193. [Google Scholar] [CrossRef]
Figure 1.
Diagram of ozone ice pre-embedding in gold ore leaching heap.

Figure 2.
XRD patterns of the sample.

Figure 3.
Backscattering electron detection of SEM micrograph of Au in the sample: (a) natural gold, (b) copper pyrites, (c) pyrite, (d) quartz.
Figure 3.
Backscattering electron detection of SEM micrograph of Au in the sample: (a) natural gold, (b) copper pyrites, (c) pyrite, (d) quartz.

Figure 4.
(a) Relationship between ventilation time and ozone concentration. (b) Relationship between ice residual proportion and time at 5 °C.
Figure 4.
(a) Relationship between ventilation time and ozone concentration. (b) Relationship between ice residual proportion and time at 5 °C.

Figure 5.
Experimental column leaching apparatus system.

Figure 6.
QCM-D instrumental system.

Figure 7.
QCM-D data showing the changes in frequency, ∆f (a) and dissipation, ∆D (b), for different [CN−]/[O2] values in the injection solutions.
Figure 7.
QCM-D data showing the changes in frequency, ∆f (a) and dissipation, ∆D (b), for different [CN−]/[O2] values in the injection solutions.

Figure 8.
The Sauerbrey equation calculated a mass shift in ∆m and was fitted to be linear at different [CN−]/[O2] in the injection solutions.
Figure 8.
The Sauerbrey equation calculated a mass shift in ∆m and was fitted to be linear at different [CN−]/[O2] in the injection solutions.

Figure 9.
Optical microscope images of the ozone ice surface during melting: (a) 600 mg/L; (b) 300 mg/L; (c) 0 mg/L.
Figure 9.
Optical microscope images of the ozone ice surface during melting: (a) 600 mg/L; (b) 300 mg/L; (c) 0 mg/L.

Figure 10.
(a) Effect of ozone concentration in ice on the DO in the leaching solution. (b) Retention of ozone in the ice.
Figure 10.
(a) Effect of ozone concentration in ice on the DO in the leaching solution. (b) Retention of ozone in the ice.

Figure 11.
Gold leaching efficiency from ores by column leaching for 13 d. Cyanidation: pH 11, 200 ppm CN−, 8.2 mg/L DO.
Figure 11.
Gold leaching efficiency from ores by column leaching for 13 d. Cyanidation: pH 11, 200 ppm CN−, 8.2 mg/L DO.

Figure 12.
(a) Effect of ozone concentration in ice on gold recovery. (b) DO in the leaching solution.
Figure 12.
(a) Effect of ozone concentration in ice on gold recovery. (b) DO in the leaching solution.


Table 1.
Primary chemical components of the test sample (%).
| Au * | Ag * | Fe | Cu | As | Zn |
|---|---|---|---|---|---|
| 0.61 | 1.0 | 6.30 | 0.008 | 0.027 | 0.010 |
| Pb | S | CaO | MgO | Al2O3 | SiO2 |
| <0.010 | 1.38 | 2.69 | 2.95 | 14.92 | 60.60 |
* Unit is g/t.
Table 2.
Experimental ice-making conditions.
| Water Temperature in Gas-Washing Bottle (°C) | 1.0–4.0 |
|---|---|
| Water volume in gas-washing bottle (mL) | 100 |
| The pH of deionized water | 7 |
| Ozone gas flow rate (L·min−1) | 1 |
| Cooling temperature (°C) | −65 |
| Ice-making time (min) | 60 |
Publisher’s Note: MDPI stays neutral with regard to jurisdictional claims in published maps and institutional affiliations. |
© 2021 by the authors. Licensee MDPI, Basel, Switzerland. This article is an open access article distributed under the terms and conditions of the Creative Commons Attribution (CC BY) license (https://creativecommons.org/licenses/by/4.0/).
Share and Cite
MDPI and ACS Style
Liu, Z.; Kou, J.; Xing, Y.; Sun, C.; Liu, P.; Zhang, Y. Ozone Ice as an Oxygen Release Reagent for Heap Leaching of Gold Ore. Minerals 2021, 11, 1251. https://0-doi-org.brum.beds.ac.uk/10.3390/min11111251
AMA Style
Liu Z, Kou J, Xing Y, Sun C, Liu P, Zhang Y. Ozone Ice as an Oxygen Release Reagent for Heap Leaching of Gold Ore. Minerals. 2021; 11(11):1251. https://0-doi-org.brum.beds.ac.uk/10.3390/min11111251
Chicago/Turabian StyleLiu, Ziyuan, Jue Kou, Yi Xing, Chunbao Sun, Peng Liu, and Yuxin Zhang. 2021. "Ozone Ice as an Oxygen Release Reagent for Heap Leaching of Gold Ore" Minerals 11, no. 11: 1251. https://0-doi-org.brum.beds.ac.uk/10.3390/min11111251
Note that from the first issue of 2016, this journal uses article numbers instead of page numbers. See further details here.