
Thermal-Hydrological-Chemical Modeling of a Covered Waste Rock Pile in a Permafrost Region


1
Department of Earth, Ocean, and Atmospheric Sciences, The University of British Columbia, 2207 Main Mall, Vancouver, BC V6T 1Z4, Canada
2
Institut de Recherche en Mines et en Environnement, Université du Québec en Abitibi-Témiscamingue, 445 Boulevard de l’Université, Rouyn-Noranda, QC J9X 5E4, Canada
*
Author to whom correspondence should be addressed.
Minerals 2021, 11(6), 565; https://0-doi-org.brum.beds.ac.uk/10.3390/min11060565
Submission received: 7 February 2021
/
Revised: 11 May 2021
/
Accepted: 22 May 2021
/
Published: 26 May 2021
(This article belongs to the Special Issue Environmental Geochemistry in the Mining Environment)
Abstract
:In order to reduce contaminant mass loadings, thermal cover systems may be incorporated in the design of waste rock piles located in regions of continuous permafrost. In this study, reactive transport modeling was used to improve the understanding of coupled thermo-hydrological and chemical processes controlling the evolution of a covered waste rock pile located in Northern Canada. Material properties from previous field and laboratory tests were incorporated into the model to constrain the simulations. Good agreement between simulated and observational temperature data indicates that the model is capable of capturing the coupled thermo-hydrological processes occurring within the pile. Simulations were also useful for forecasting the pile’s long-term evolution with an emphasis on water flow and heat transport mechanisms, but also including geochemical weathering processes and sulfate mass loadings as an indicator for the release of contaminated drainage. An uncertainty analysis was carried out to address different scenarios of the cover’s performance as a function of the applied infiltration rate, accounting for the impacts of evaporation, runoff, and snow ablation. The model results indicate that the cover performance is insensitive to the magnitude of recharge rates, except for limited changes of the flow regime in the shallow active layer. The model was expanded by performing an additional sensitivity analysis to assess the role of cover thicknesses. The simulated results reveal that a cover design with an appropriate thickness can effectively minimize mass loadings in drainage by maintaining the active layer completely within the cover.
1. Introduction
Large volumes of waste rock (considered non-economically viable materials) are generated and removed from the subsurface during mining operations. This waste rock (which is usually stored in large and unsaturated stockpiles at ground surface) poses long-term environmental risks related to acid rock drainage (ARD) or contaminated neutral drainage (CND), if sufficient pH-buffering minerals are present in the waste rock, such as carbonate minerals. The weathering of potentially acid-generating (PAG) materials, in particular sulfide minerals, may trigger the release of ARD/CND and dissolved metals [1,2,3]. Different techniques have been proposed to control the release of contaminants and limit adverse impacts of ARD/CND, such as the placement of covers (including water covers, covers with capillary barrier effects, elevated water table with monolayer covers, low saturated hydraulic conductivity covers, store-and-release covers, inorganic or organic coatings, electrochemical covers, and thermal covers) [4,5,6,7,8]. Thermal covers (also known as insulation covers) are a unique option in cold regions where permafrost is typically found due to prevailing cold temperatures, implying that soils remain perennially frozen for at least two consecutive years [5,9,10,11,12]. In this scenario, non-potentially acid-generating (NPAG) waste rock also extracted from the site can be used as the cover material to encapsulate the PAG material. The role of the cover is to provide an insulating effect to maintain permafrost in the underlying waste rock, while the active layer, defined as the top layer subject to seasonal thawing, remains within the cover material. The low temperatures maintained in the reactive waste rock control the oxidation of sulfide minerals, whereas freezing conditions reduce the potential for transport of contaminated water [7]. Therefore, the design for cover thickness will depend on site-specific conditions (e.g., permafrost extent, climate, soil properties) [13,14].
In addition to laboratory and field tests, regarded as essential methods to understand waste rock behavior, reactive transport modeling (RTM) can also provide insights into the coupled thermo-hydrological-chemical (THC) processes occurring within a waste rock pile (WRP), responsible for controlling conditions in the field. Another practical application of modeling is to assist with improving the design of reclamation methods for mine wastes to minimize their environmental impacts. Increasing attention has been given to the capabilities of RTM to address various mine waste related issues [15,16,17,18,19,20,21,22,23]. While several codes have been developed to simulate dynamic freezing and thawing processes in permafrost regions [24,25,26,27], only a few studies have applied this functionality to mining environments. In this paper, the reactive transport code MIN3P-HPC [28,29] was used to assess the performance of thermal covers placed on WRPs, based on the example of the Meadowbank mine, located in the Kivialliq region in Nunavut, Canada. At this site, a thermal cover system of 4-m thickness was emplaced to avoid potential ARD/CND [30]. Laboratory experiments were performed to characterize the Meadowbank materials, and field measurements were taken to improve understanding of the overall thermal behavior of the WRP. However, a quantitative two-dimensional analysis of the coupling of THC processes has not been conducted to date. The main objectives of this study are to: (1) assess the long-term THC behavior of a sulfide-bearing WRP in a cold-climate region featuring a thermal cover, (2) assess the sensitivity of the modeling results to uncertainties with respect to the magnitude of seasonal recharge, and (3) evaluate the functionality and effectiveness of thermal cover designs on controlling the weathering of waste rock and ARD/CND release.
2. Conceptual Model
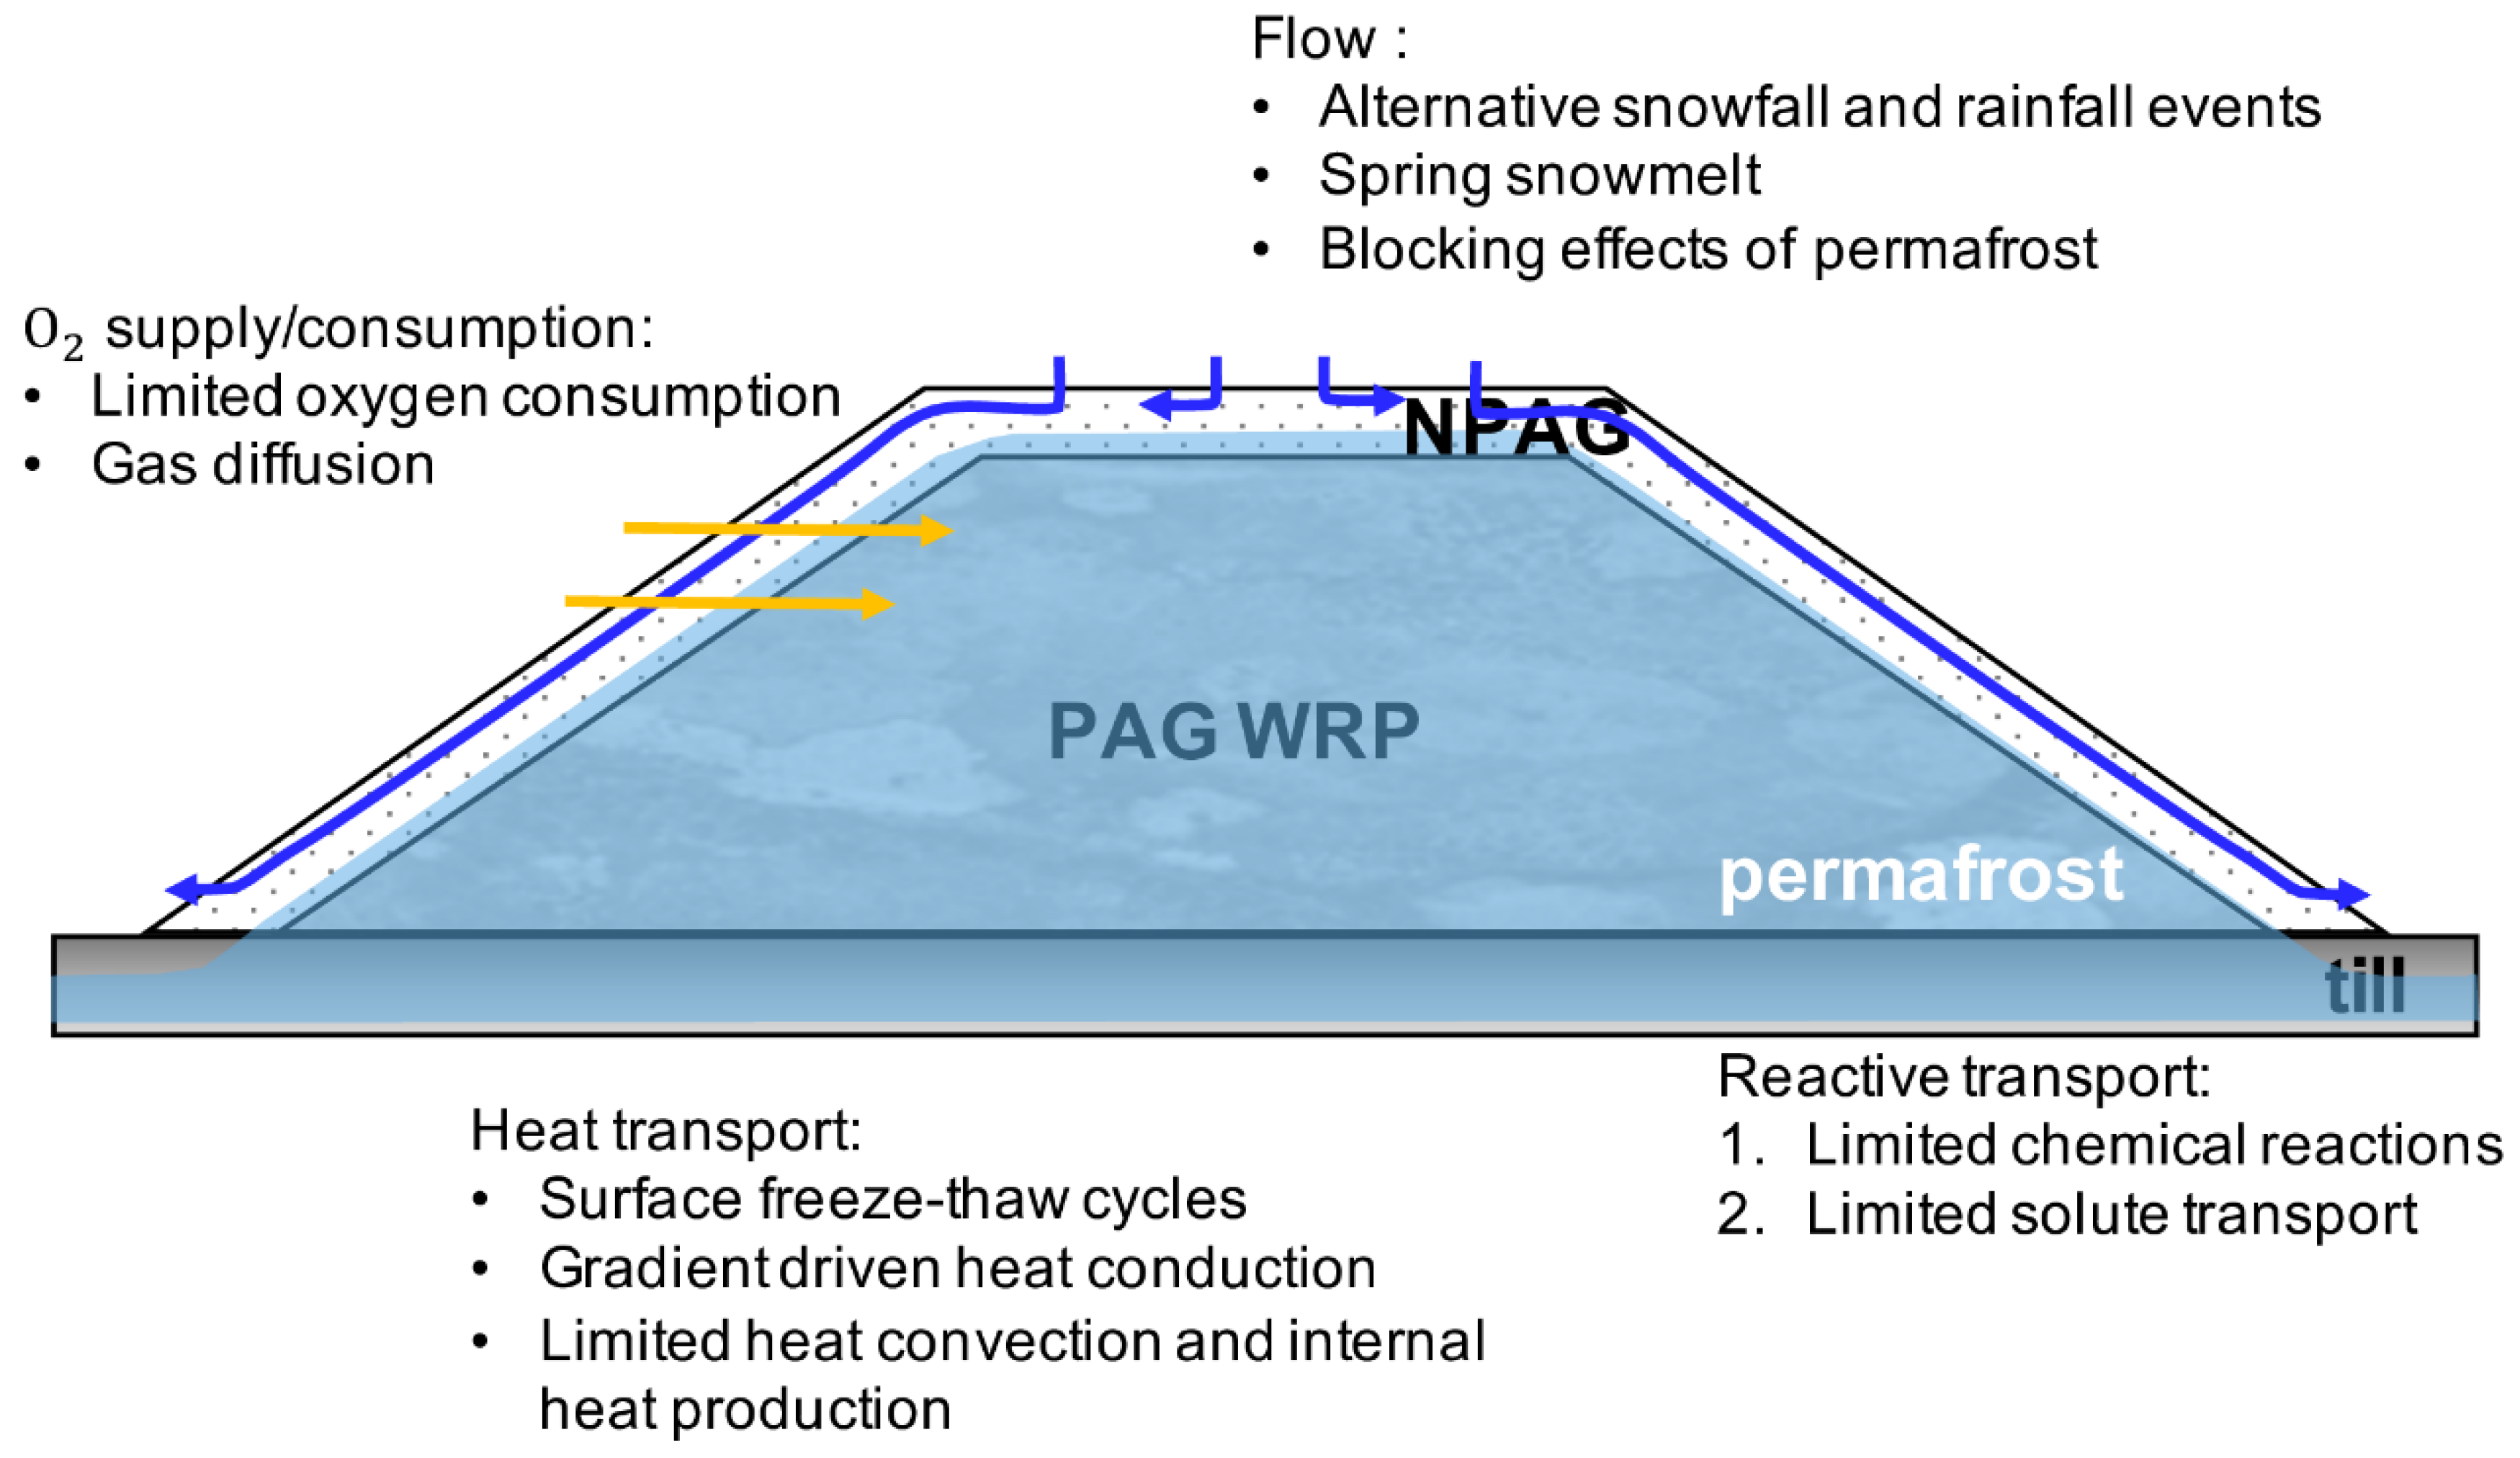
The simplified conceptual model presented here was developed to capture the coupling of the most important processes with respect to freeze-thaw cycling in sulfidic mine waste rock encapsulated by a thermal cover. Under cold-region climate conditions, large-scale WRPs usually allow for the development of permafrost within the waste rock and the relocation of the active layer from the underlying soil to near the pile surface, as shown in Figure 1 [31]. Permafrost established within the waste rock can be conceptualized as a nearly impermeable barrier, limiting deep recharge, and in this way altering internal water routing and enhancing lateral flow [31]. Unlike in temperate climates, where precipitation is often dominated by rainfall and the duration of ground freezing is relatively short and restricted to the shallow ground, infiltration into WRPs is more complex in cold regions, due to extended periods of frozen ground during the winter months and the presence of permafrost at depth. During the winter months, snow can either accumulate at or ablate from the pile surface. The accumulation and ablation rates are determined by a variety of parameters such as topographic features, vegetation, climate, and wind [10]. In cold regions, spring snowmelt is a particularly significant event for water infiltration into piles [32] and has important influences on solute transport and moisture content.
Cold-region climates also influence chemical reactions and gas transport within the pile. The establishment of permafrost as well as the freezing of porewater can result in a significant reduction in chemical reaction rates, effectively leading to cessation of reaction progress [33,34]. Moreover, the limited thickness of the active layer and short period of thawed conditions also limit chemical reactions as well as the release and transport of solutes. Oxygen consumption is associated with the oxidation of PAG minerals present in a WRP. However, the cover is designed to minimize the effects of freeze-thaw cycling within the WRP, restricting oxidation processes, oxygen consumption. Therefore, also oxygen ingress. As a result, the oxygen content within the pile is expected to remain relatively stable at atmospheric levels.
In addition, heat transfer processes occurring within a WRP are tightly associated with above-mentioned processes. A temperature gradient is present between the frozen core and the seasonally thawed surface layer, which can drive heat transport through conduction in or out of the pile. The magnitude of the conductive energy flux is controlled by temperature gradients and thermal properties of both NPAG materials in the cover and PAG materials in the core [3]. Another heat transfer mechanism is convection in association with pore water and pore gas. The limitation on deep infiltration of water due to the presence of permafrost is accompanied by limited convective heat flux by water flow. The oxidation of sulfide minerals is known as strongly exothermic, potentially causing internal heat production. However, the mostly frozen state of the WRP may slow down oxidation processes and associated heat production. In the case of low internal sulfide oxidation rates, convection driven by pore gas is also restricted.
3. Site Description
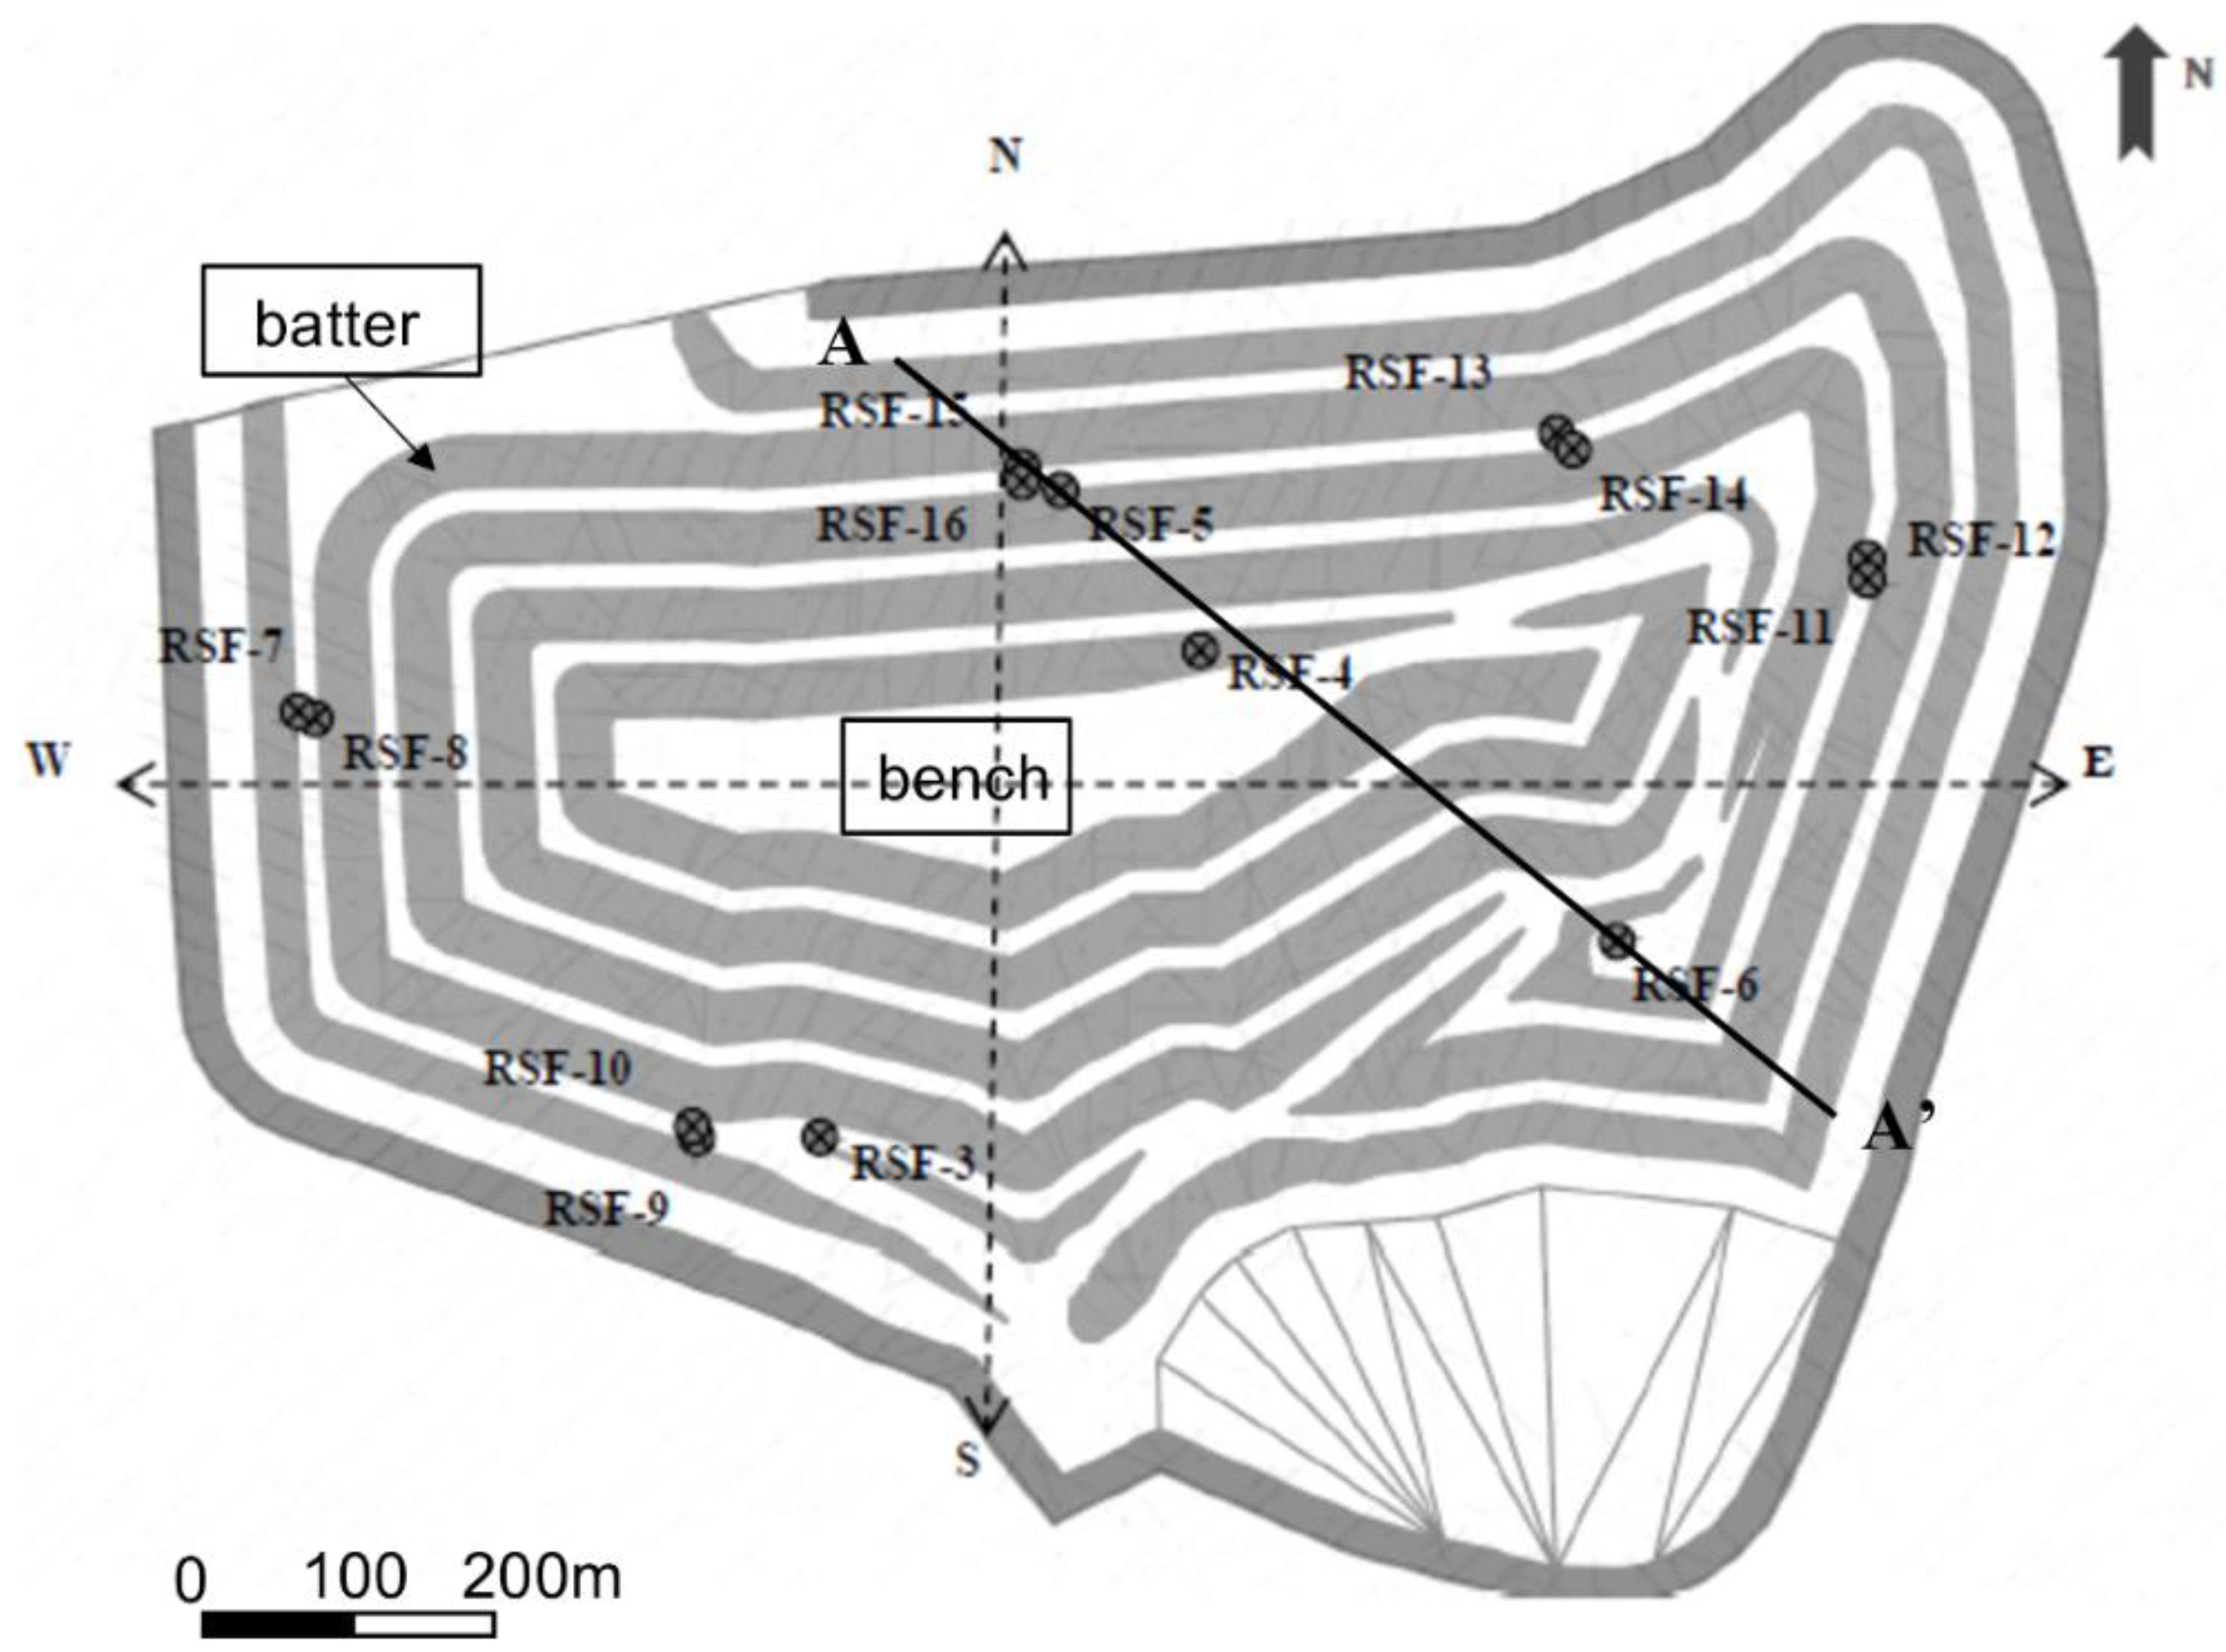
In this study, the Meadowbank Gold Mine is used as an example for quantitatively evaluating cover performance in cold-region climates. The mine is located approximately 300 km from Hudson Bay in the Kivialliq region (65 °N 96 °W), which is subject to typical low Arctic eco-climatic conditions with a mean annual air temperature (MAAT) of −11 °C [35]. The mine site has been in operation by Agnico Eagle Mines Limited since 2010, generating large quantities of both PAG and NPAG waste rock. Previous baseline studies show that the thicknesses of the active layer and the underlying permafrost in the region typically vary from 1.3 to 4 m and 450 to 550 m, respectively [35,36]. Based on these observations, it has been decided to construct a 4-m insulation cover WRP made of NPAG waste rock to control contaminant generation from the WRP. To validate the cover design, two field experimental cells with a cover of 2 m and 4 m were constructed over 1–2 m tailings to aid with closure planning for the reactive tailing storage facilities (TSFs) [12]. Since the test results from monitoring the temperatures showed that 4m is effective for the TSFs, it was assumed that this cover configuration would also work for the WRP. As shown in Figure 2, the waste rock pile contains five benches, which are covered with 4m NPAG waste rock, resulting in a large pile (118 m in height × 650 m × 1020 m), located on a layer of till. The batters of the pile are sloped at 27° (2H:1V) [37].
A total of fourteen vertically instrumented multipoint thermistor strings were installed into borehole casings within the WRP in 2013 (YSI 44031 from GKM Consultants, Sainte-Julie, QC, Canada) and 2015 (G176-TH002 from Hoskin Scientific Ltd., Burnaby, BC, Canada), to monitor the temperature and thermal behavior of the entire covered system. Thermistor strings were installed inside borehole casings surrounded by gravel rejects of ¾ inches. All thermistor sensors had an interchangeable tolerance of ± 0.1 °C. Figure 2 shows the locations of the thermistors distributed across the pile. Detailed information about the thermistors, including the thermistors’ elevations, depths, string lengths, and the total number of sensors, are available in [37]. Strings that span through all pile benches include RSF-3, RSF-4, RSF-5, and RSF-6, containing more than 26 sensors. Based on the available sensors, cross section AA’ (Figure 2) was selected for the numerical analysis performed in this work. Except for RSF-4, which was installed on a higher bench (and was not measured from 2015 to 2017 due to its loss of functionality), strings were installed on the second or third benches. Daily air temperature and precipitation were also recorded on site at a meteorological station 1km away from the WRP [37]. Additional laboratory tests were completed at the Université du Québec en Abitibi-Témiscamingue (UQAT, Rouyn, QC, Canada) to characterize the hydrogeological, thermal, physical, and chemical properties of both NPAG and PAG materials. Detailed method descriptions and results of these laboratory tests are available in [35,37,38,39,40,41,42,43,44].
4. Methods
4.1. Modeling Approach
4.1.1. Reactive Transport Code MIN3P-HPC
MIN3P-HPC [28,29] (a parallel version of the MIN3P-THCm code) is a multicomponent reactive transport code designed for simulating the primary thermo-hydro-chemical and mechanical (THCm) processes in variably saturated porous media with unstructured grid capabilities. Key features of the code include density dependent flow and solute transport, gas transport, biogeochemical reactions, heat transport, and one-dimensional hydromechanical coupling [20,28,29,45,46]. In addition, the code has recently been enhanced to simulate freeze-thaw related processes. The cessation of flow due to freezing is considered through lowering the hydraulic conductivity as a surrogate for phase transformation between ice and water phases. Previous studies have shown that the temperature dependence of reaction rates is adequately described by the Arrhenius equation, even at or slightly below the freezing point [33,47,48]. More recent work has shown that, for sub-zero temperatures, sulfide mineral reactivity is negligible, implying that the Arrhenius equations cannot represent sulfide oxidation rates for completely frozen conditions [12]. The effects of freezing on sulfide oxidation can therefore be simplified by defining a threshold temperature (site-specific) below which the reaction progress ceases [12]. The Arrhenius equation was also modified for sulfide mineral oxidation in high temperature environments, to account for the decline of microbial activity under these conditions [49]. Furthermore, the energy balance equation in the code was enhanced by including heat generation from pyrite oxidation as a source term. The governing equations for flow, reactive transport, and heat transport, along with details regarding abovementioned relationships can be found in [50]. For this study, the code was used to simulate a base case scenario with specific focus on coupled thermal-hydrological and geochemical evolution of a covered WRP, constrained by data from field observations and laboratory experiments, followed by uncertainty analyses. Details regarding the parameterization and assigned boundary conditions are provided in the following sections.
4.1.2. Spatial Discretization
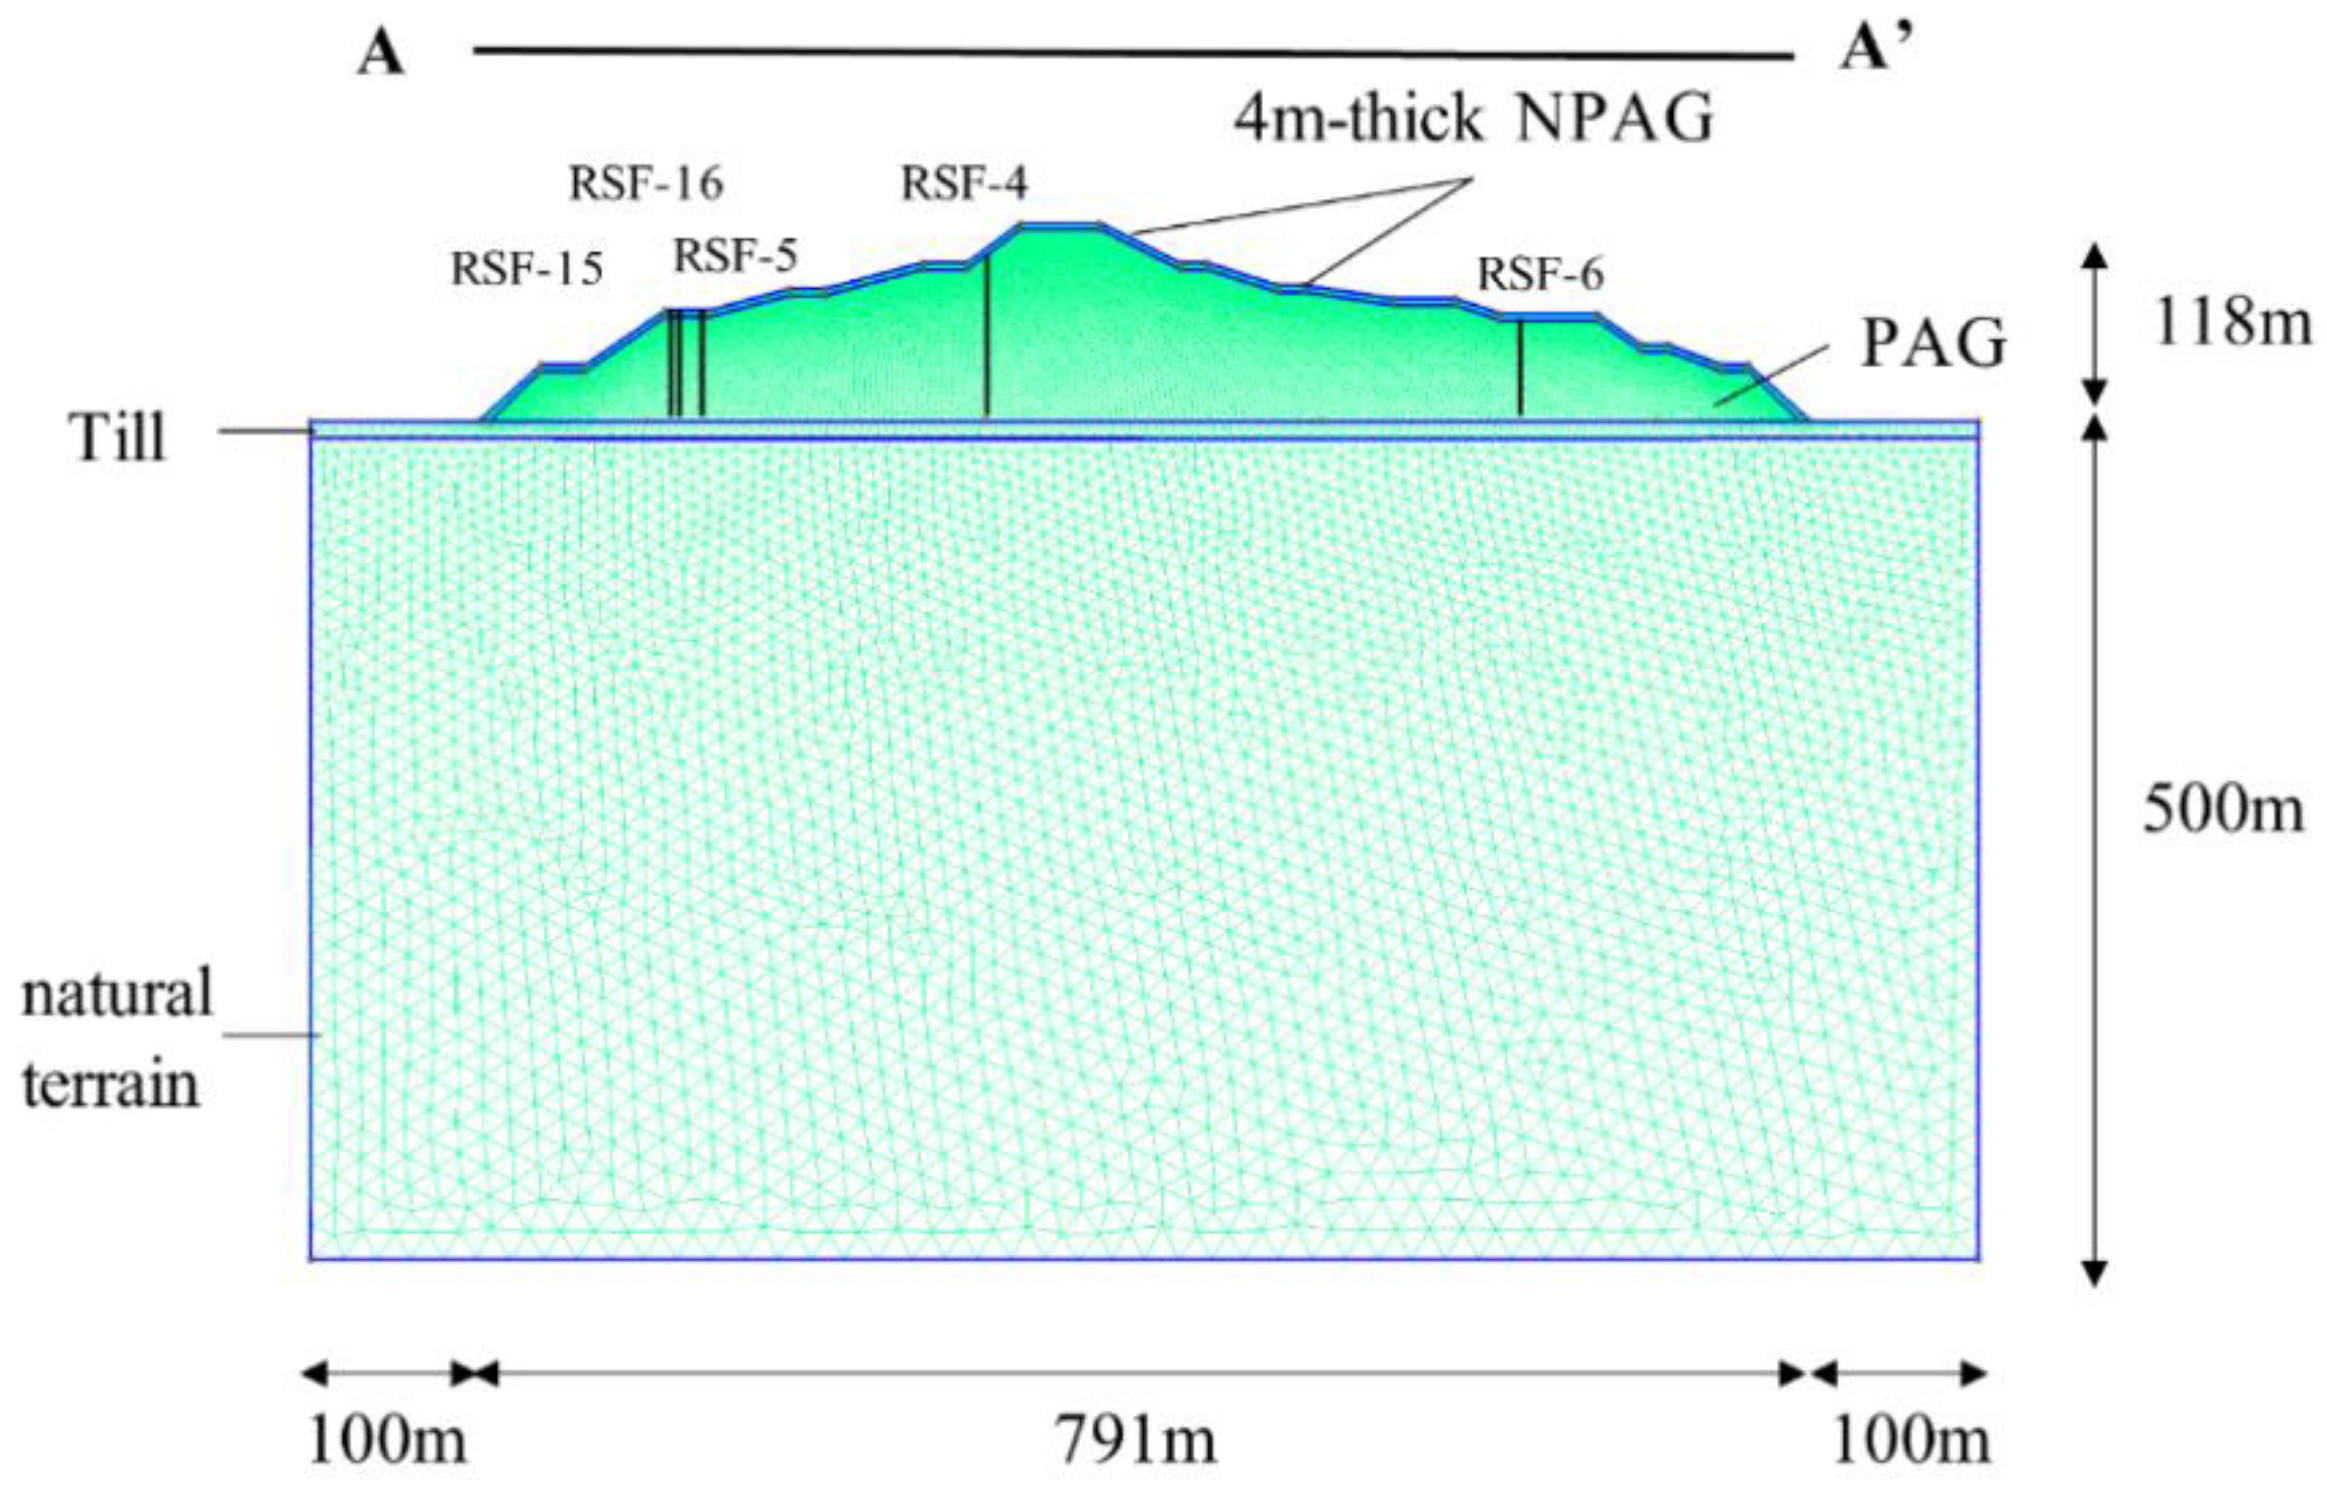
The model domain was constrained by the dimensions of the covered waste rock pile at the Meadowbank mine. The 2D-model was set up following cross section A-A’ (Figure 2) to facilitate quantitative interpretation of field observations, accounting for pile geometry. A deep and wide section of natural terrain (991 m × 500 m) underlying the WRP has been included in the model. The vertical dimension was extended to the base of the continuous permafrost where the geothermal heat flux could be reasonably estimated based on literature [51]. The domain was also extended laterally in order to avoid interference of lateral heat flux with the boundaries. Figure 3 shows the model configuration and spatial discretization, along with the locations of the thermistors, which provided the data to constrain the model. The enhanced unstructured grid capabilities of the MIN3P-HPC code [29] allow for inclusion of multiple benches and sloped surfaces, as well as grid refinements in areas of interest to simulate the covered pile. The domain was discretized by using 22,455 nodes. Discretization of the cover and waste rock is more refined than that of the underlying soil, since the focus on the study is on processes occurring in the WRP.
4.1.3. Base Case Specific Input Parameters
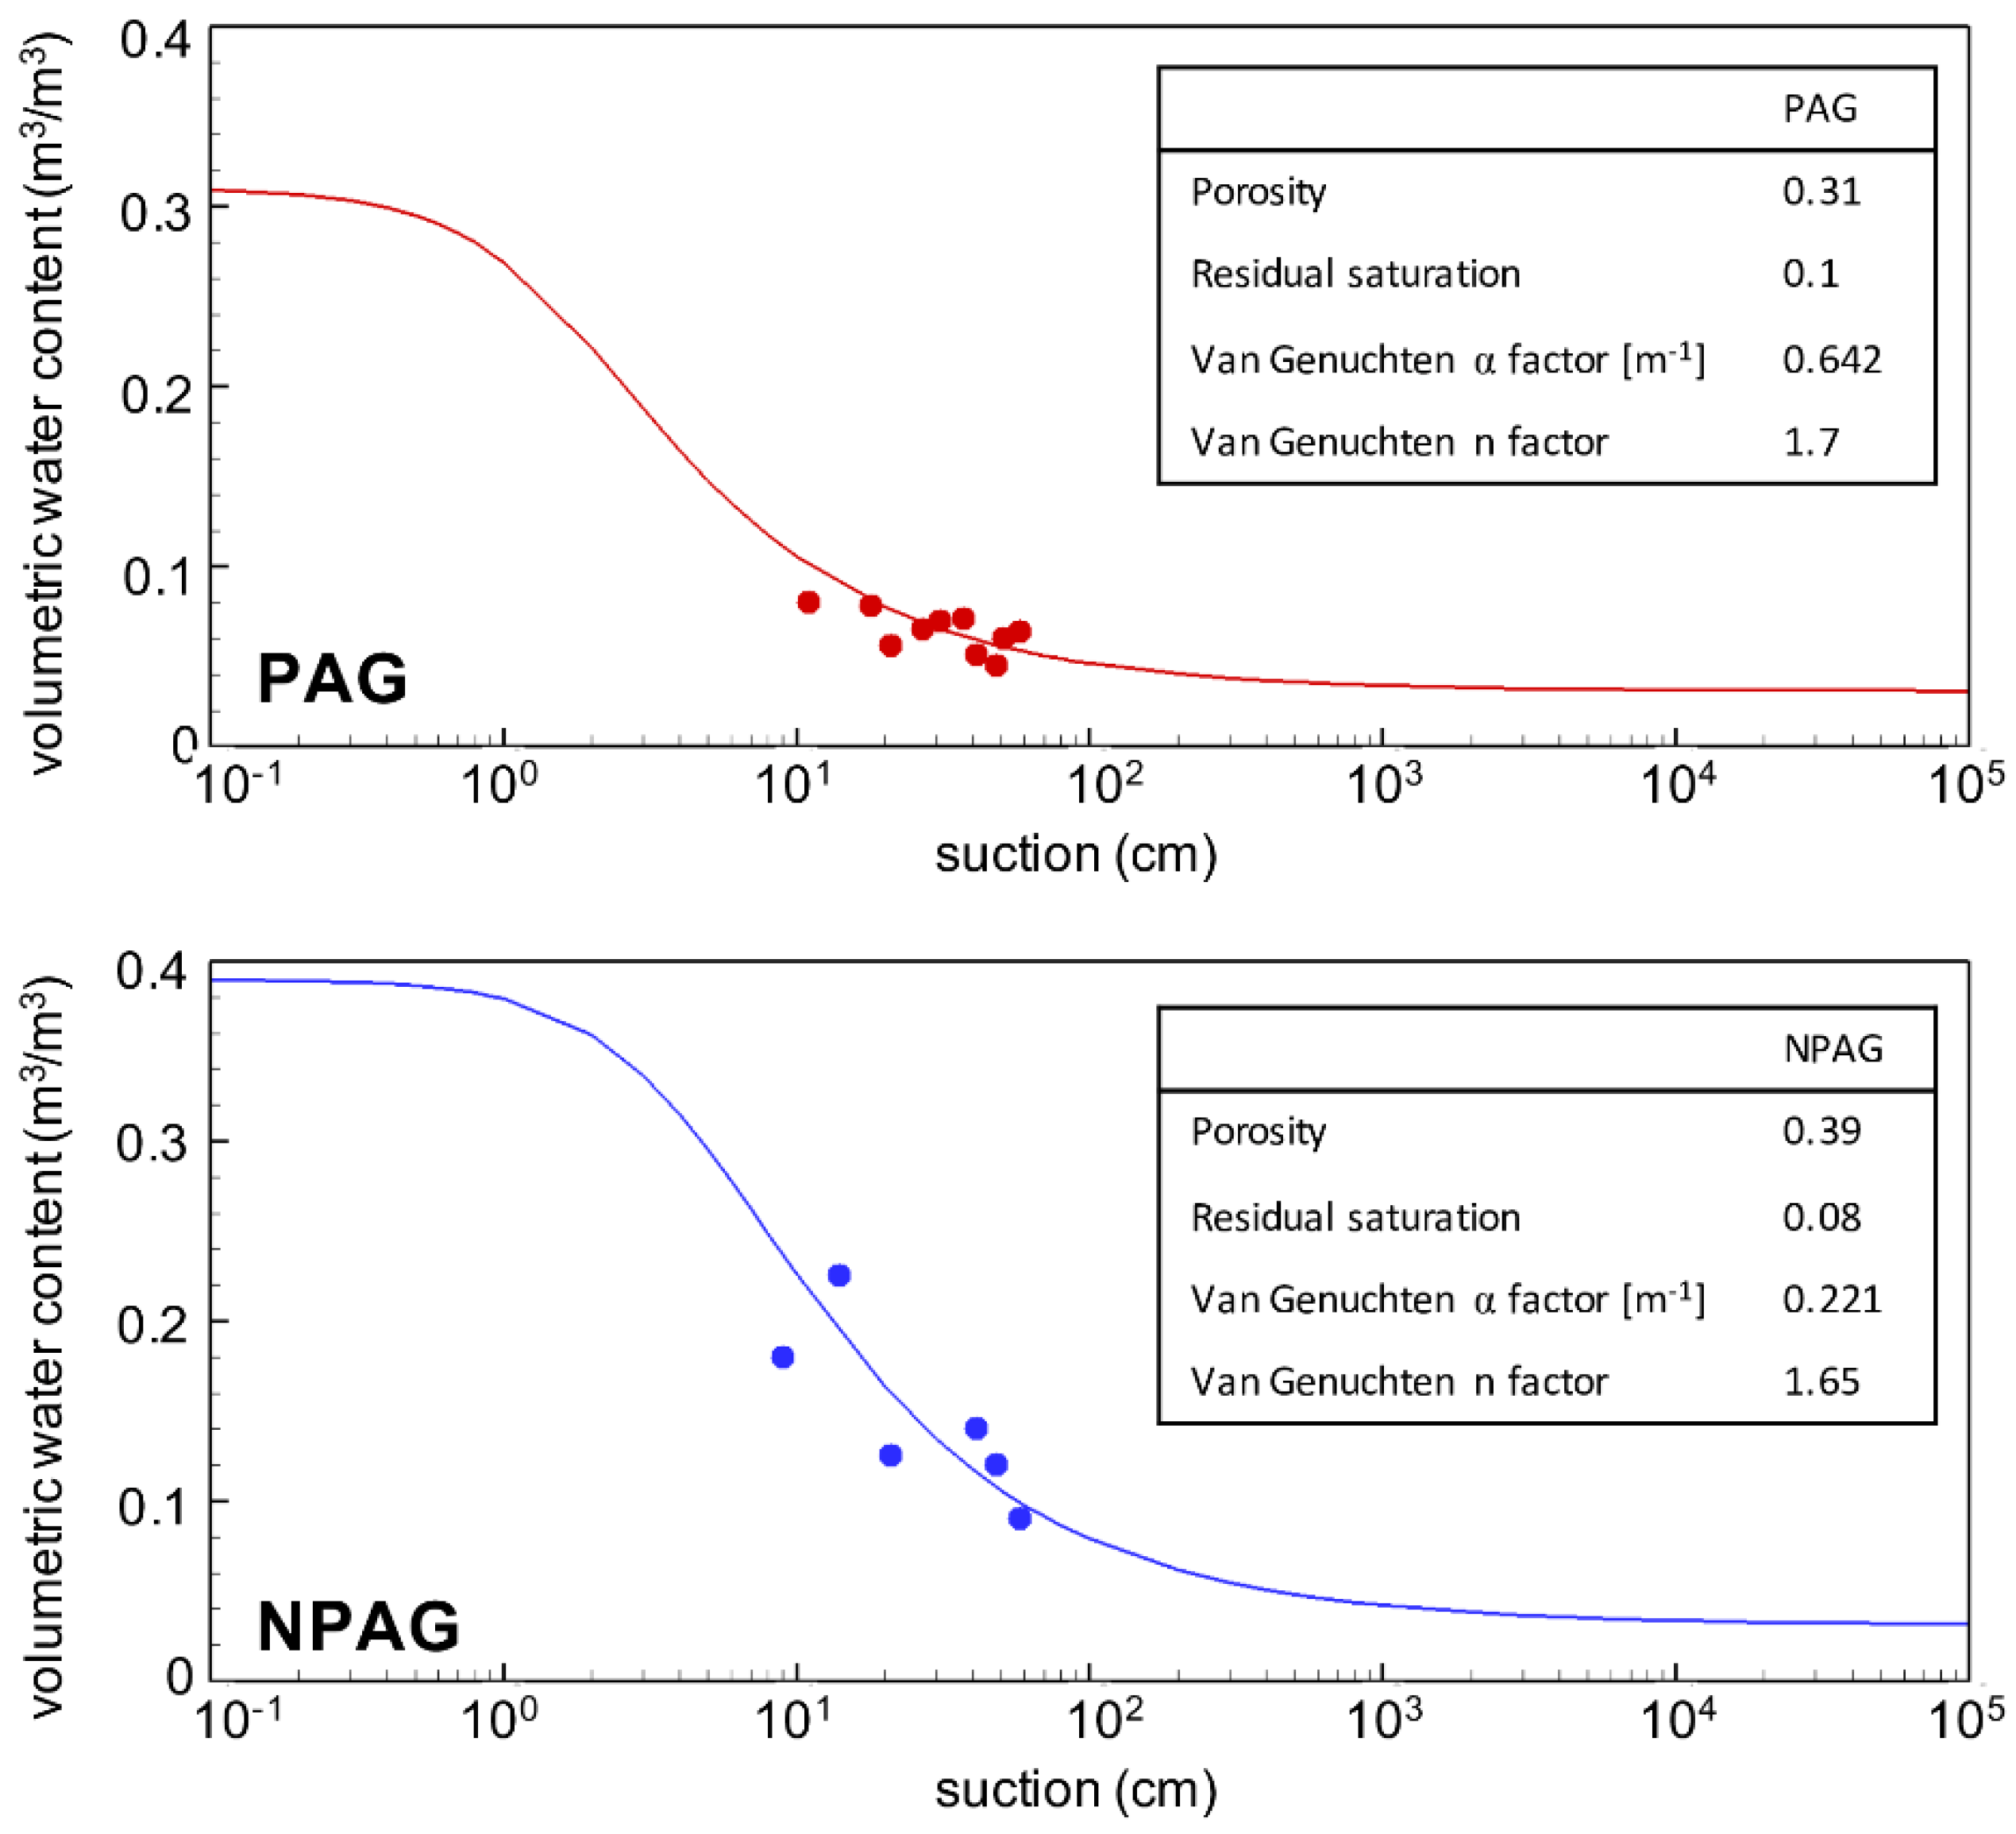
The base case was designed to investigate the short- and long-term performance of the covered WRP, for comparison with temperature data collected at the site. The model was constrained by measured physical, hydrogeological, thermal, and chemical parameters of both NPAG and PAG materials, summarized in Table 1. The bulk densities, porosities, and saturated hydraulic conductivities were directly derived from laboratory experiments [37,38,39], while thermal conductivities [38] were obtained from a generalized thermal model reported in [41,43]. The hydraulic conductivity under frozen conditions was drastically reduced to a value low enough to represent the cessation of flow under permafrost conditions. The van Genuchten model was used to parameterize the relationships between volumetric water content and suction [37] (Figure A1, Appendix A). The parameters used for the underlying natural soil were obtained from [50].
Mineralogical composition in the models were justified based on previous studies [37,38] (Table A1, Appendix A). With specific focus on the generation of acid rock drainage and generation of heat, only pyrite and carbonates (expressed as equivalent calcite) were included in the model as primary mineral phases to represent acidification potential (AP) and neutralization potential (NP). At this site, pyrite oxidation dominates the contribution of mineral dissolution precipitation reactions towards the energy balance due its strong exothermic nature. The contribution of dolomite towards pH-buffering reactions was combined with calcite based on total carbonate content to capture the full NP. The volumetric abundances of both primary minerals were constrained by field observations [37,38] (Table A1, Appendix A). Although abundant, silicate minerals were neglected, since they are not expected to make significant contributions to pH buffering and the energy budget of the pile. Secondary mineral phases ferrihydrite and gypsum were allowed to precipitate to provide solubility controls for iron, carbonate, and sulfate. Therefore, the aqueous components and species considered in the simulations were restricted to those involved in these mineral reactions, including SO42−, Fe2+, Fe3+, Ca2+, CO32−, H+, and O2(aq). The initial porewater compositions in both materials were assumed similar to dilute rainwater with concentrations of 10−10 mol·L−1 for SO4, Fe(II/III), and Ca, and in equilibrium with O2 and CO2 at atmospheric concentrations. Table 2 gives information about the reaction stoichiometries, rate expressions, equilibrium constants, and rate constants of included primary and secondary phases. Reaction rates for calcite, ferrihydrite and gypsum reflect quasi-equilibrium conditions, while the reference rate constant for pyrite oxidation is within the range of values reported in the literature [50]. Previous laboratory tests performed on Meadowbank tailings suggest negligible reactivity of the tailings below 0 °C [12]. In line with these findings, it was assumed that mineral reaction rates are negligible in the waste rock, if temperatures are below freezing, while above freezing, the rate constant for pyrite oxidation was varied with temperature as a function of the Arrhenius equation and equilibrium constants were temperature-compensated by the van’t Hoff equation.
Infiltration into the pile was simulated as seasonally controlled discontinuous events, based on cumulative precipitation data shown in Table 3. Details of the recorded daily precipitation rates are available in [37]. In the simulations, recharge was assumed to only occur when the air temperature was above freezing. Specifically, a constant rate of infiltration was applied for average daily air temperatures above freezing, assuming a value of 0.32 mm day−1 for the base case, derived from cumulative rainfall between 2014 and 2017, accounting for evaporation and runoff, which was assumed to comprise 70% of rainfall. The percentage was selected from the midpoint of the evaporation ranges between 50% and 90% in other mining studies located in similar climates [54,55]. In addition, recharge due to snowmelt was considered during the first month after spring thaw. During this period, infiltration from melting snow was set at 0.55 mm day−1, assuming that 50% of snowmelt infiltrates and that 25% of cumulative snowfall remains at the surface when spring arrives. The percentage of snowmelt represents the contribution of snowmelt to the infiltration that was derived from the midpoint of the range (10–90%) reported in the literature [32], and the percentage of accumulated snowfall was selected from the midpoint of the model calibration conducted for the Meadowbank mine, which determined that 5–45% of snowfall forms the snowpack at the surface at the onset of spring thaw [37].
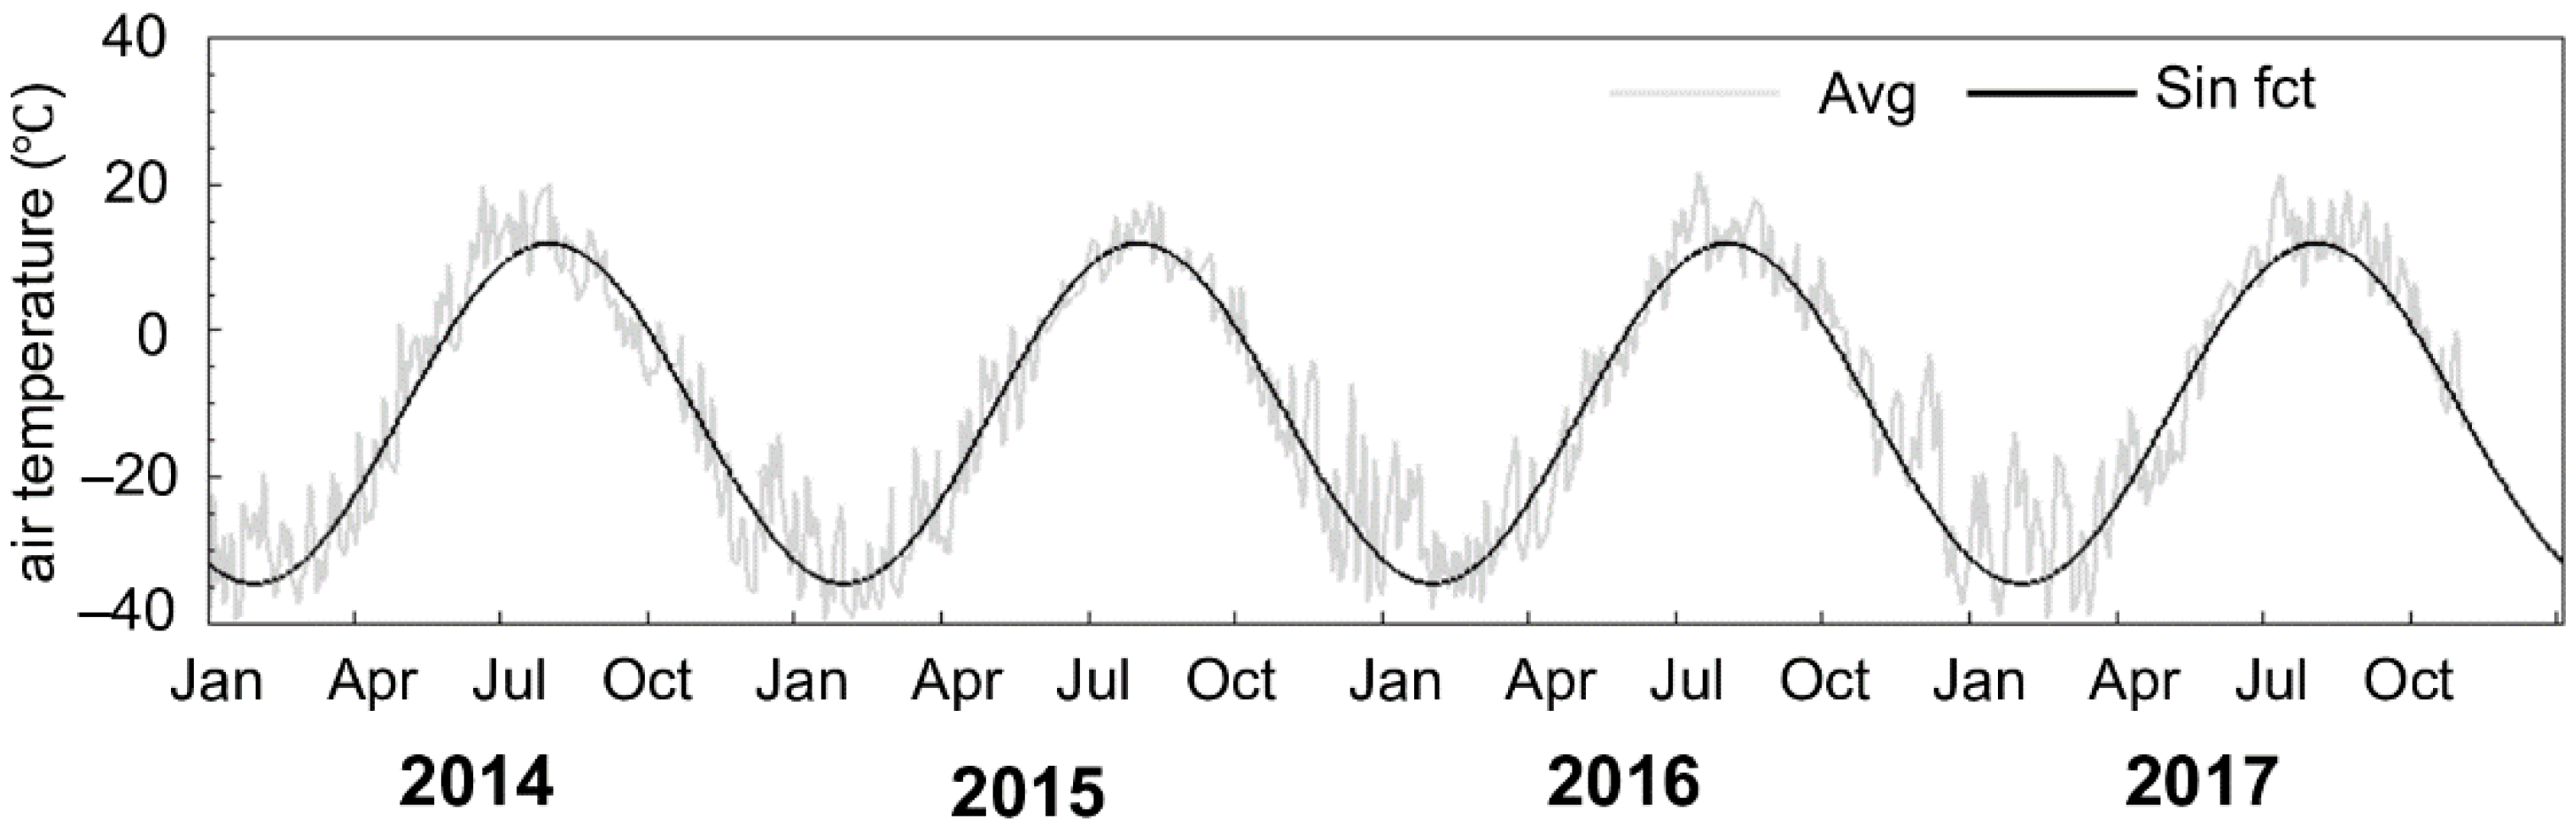
The exposure of the covered pile to atmospheric conditions necessitated the incorporation of seasonal temperature fluctuations. The average daily temperatures () from January 2014 to October 2017 are shown in Figure 4, and a sinusoidal function dependent on time (t) captures the seasonal variations adequately [37]:
The temperature fluctuates around the mean annual air temperature (MAAT = −11.4 °C), and 23.2 °C represents the annual amplitude of temperature variations. The geothermal heat flux at the model base was assumed to be 0.087 W m−2 [51], yielding the permafrost thickness observed in this region. All other boundaries were considered impermeable for both water flow and heat flux (Figure A2, Appendix B). The base case simulation was run for 50 years starting from 2014.
4.2. Infiltration Uncertainty Analysis
Although infiltration rates used for the base case simulation separately consider contributions from rainfall and snowmelt, account for snow ablation, evaporation and runoff, as well as seasonal controls, uncertainty remains due to a lack of site-specific infiltration measurements into the pile. Expanding on the base case study, additional simulations for both increased and reduced infiltration rates were performed to investigate the sensitivity on pile-internal flow patterns, moisture contents, as well as thermal and geochemical evolution. The infiltration rates in the uncertainty analysis used the upper limits of the literature ranges for the increased infiltration scenario and the lower limits for the reduced infiltration scenario, as summarized in Table 4. The model geometry and other parameter inputs remain the same as for the base case.
4.3. Cover Thickness Scenario Analysis
Expanding on previous studies on cover thickness [12], an additional three simulations were performed with no cover, a 2 m cover, and a 6 m cover. The purpose of these simulations was to evaluate and illustrate the effect of the presence and thickness of the cover system on sulfide oxidation, long-term drainage evolution, and mass loadings. The WRP configuration remained the same as for the base case, except for the presence or thickness of the cover. The material properties of both cover and pile remained unchanged relative to the base case and all boundary conditions also remained as specified for the base case.
4.4. Assumption and Simplifications
Some simplifications and assumptions had to be made when building the conceptual and numerical models. Infiltration rates were based on seasonal averages rather than individual daily rates, and no infiltration was considered when the surficial ground was frozen. The magnitude of the infiltration rate was estimated by removing assumed fractions of evaporation, runoff, and snow ablation from precipitation data, according to the suggested ranges reported in the literature. Furthermore, the temperature and infiltration patterns assigned to the pile surface were assumed to be repetitive over the 50-year simulation period, while all other boundary conditions remain unchanged. Consideration of the potential meteorological changes in the long term was beyond the scope of the study. Other input parameters derived from related experiments and the literature were assumed homogeneous for the various materials. The consideration of the effect of heterogeneities was also beyond the scope of the study, and preferential flow was neglected. In addition to the simplified mineralogy simulated, pyrite oxidation was simplified without consideration of dynamic evolution of oxidation processes as a function of porewater geochemistry (complex parallel reactions or multiple oxidation pathways), since geochemical data were unavailable and geochemical conditions are expected to remain relatively stable due to the presence of carbonate minerals and the assumption of abundant oxygen [3,15]. A simple zero-order reaction expression was used for pyrite oxidation, since the main focus was on temperature dependence. In order to highlight and isolate the contribution towards sulfate mass loadings from the weathering of PAG waste rock, it was also assumed that limited sulfur content present in the cover material is negligible. In addition, it was assumed that the pile is well aerated and that O2 concentrations remain at atmospheric levels throughout the whole pile (pO2 was fixed at 0.2 atm), in line with previous observations at WRPs located in permafrost environments (pore gas including O2 level were found to closely resemble those of air) [56,57]. This implies that the simulations neglect gas phase diffusion, gas advection, and gas supply through soil gas. The heat convection with pore gases is therefore not included in the simulations. For the conditions at this site, neglecting this process is not expected to have any significant implications on the energy balance, since the heat capacity of air is much lower than that of the waste rock and water. The contribution of water–gas phase transitioning on the energy balance was considered in the model, but that of ice–water phase transitioning was not included explicitly due to its irreversible nature which alternates seasonally in the active layer where flow and reactive transport processes occur, and its relatively low latent heat of melting when compared to that of vaporization. The effects of hydrodynamic dispersion and freezing point depression due to salinity were also neglected.
5. Results and Discussion
5.1. Base Case Results
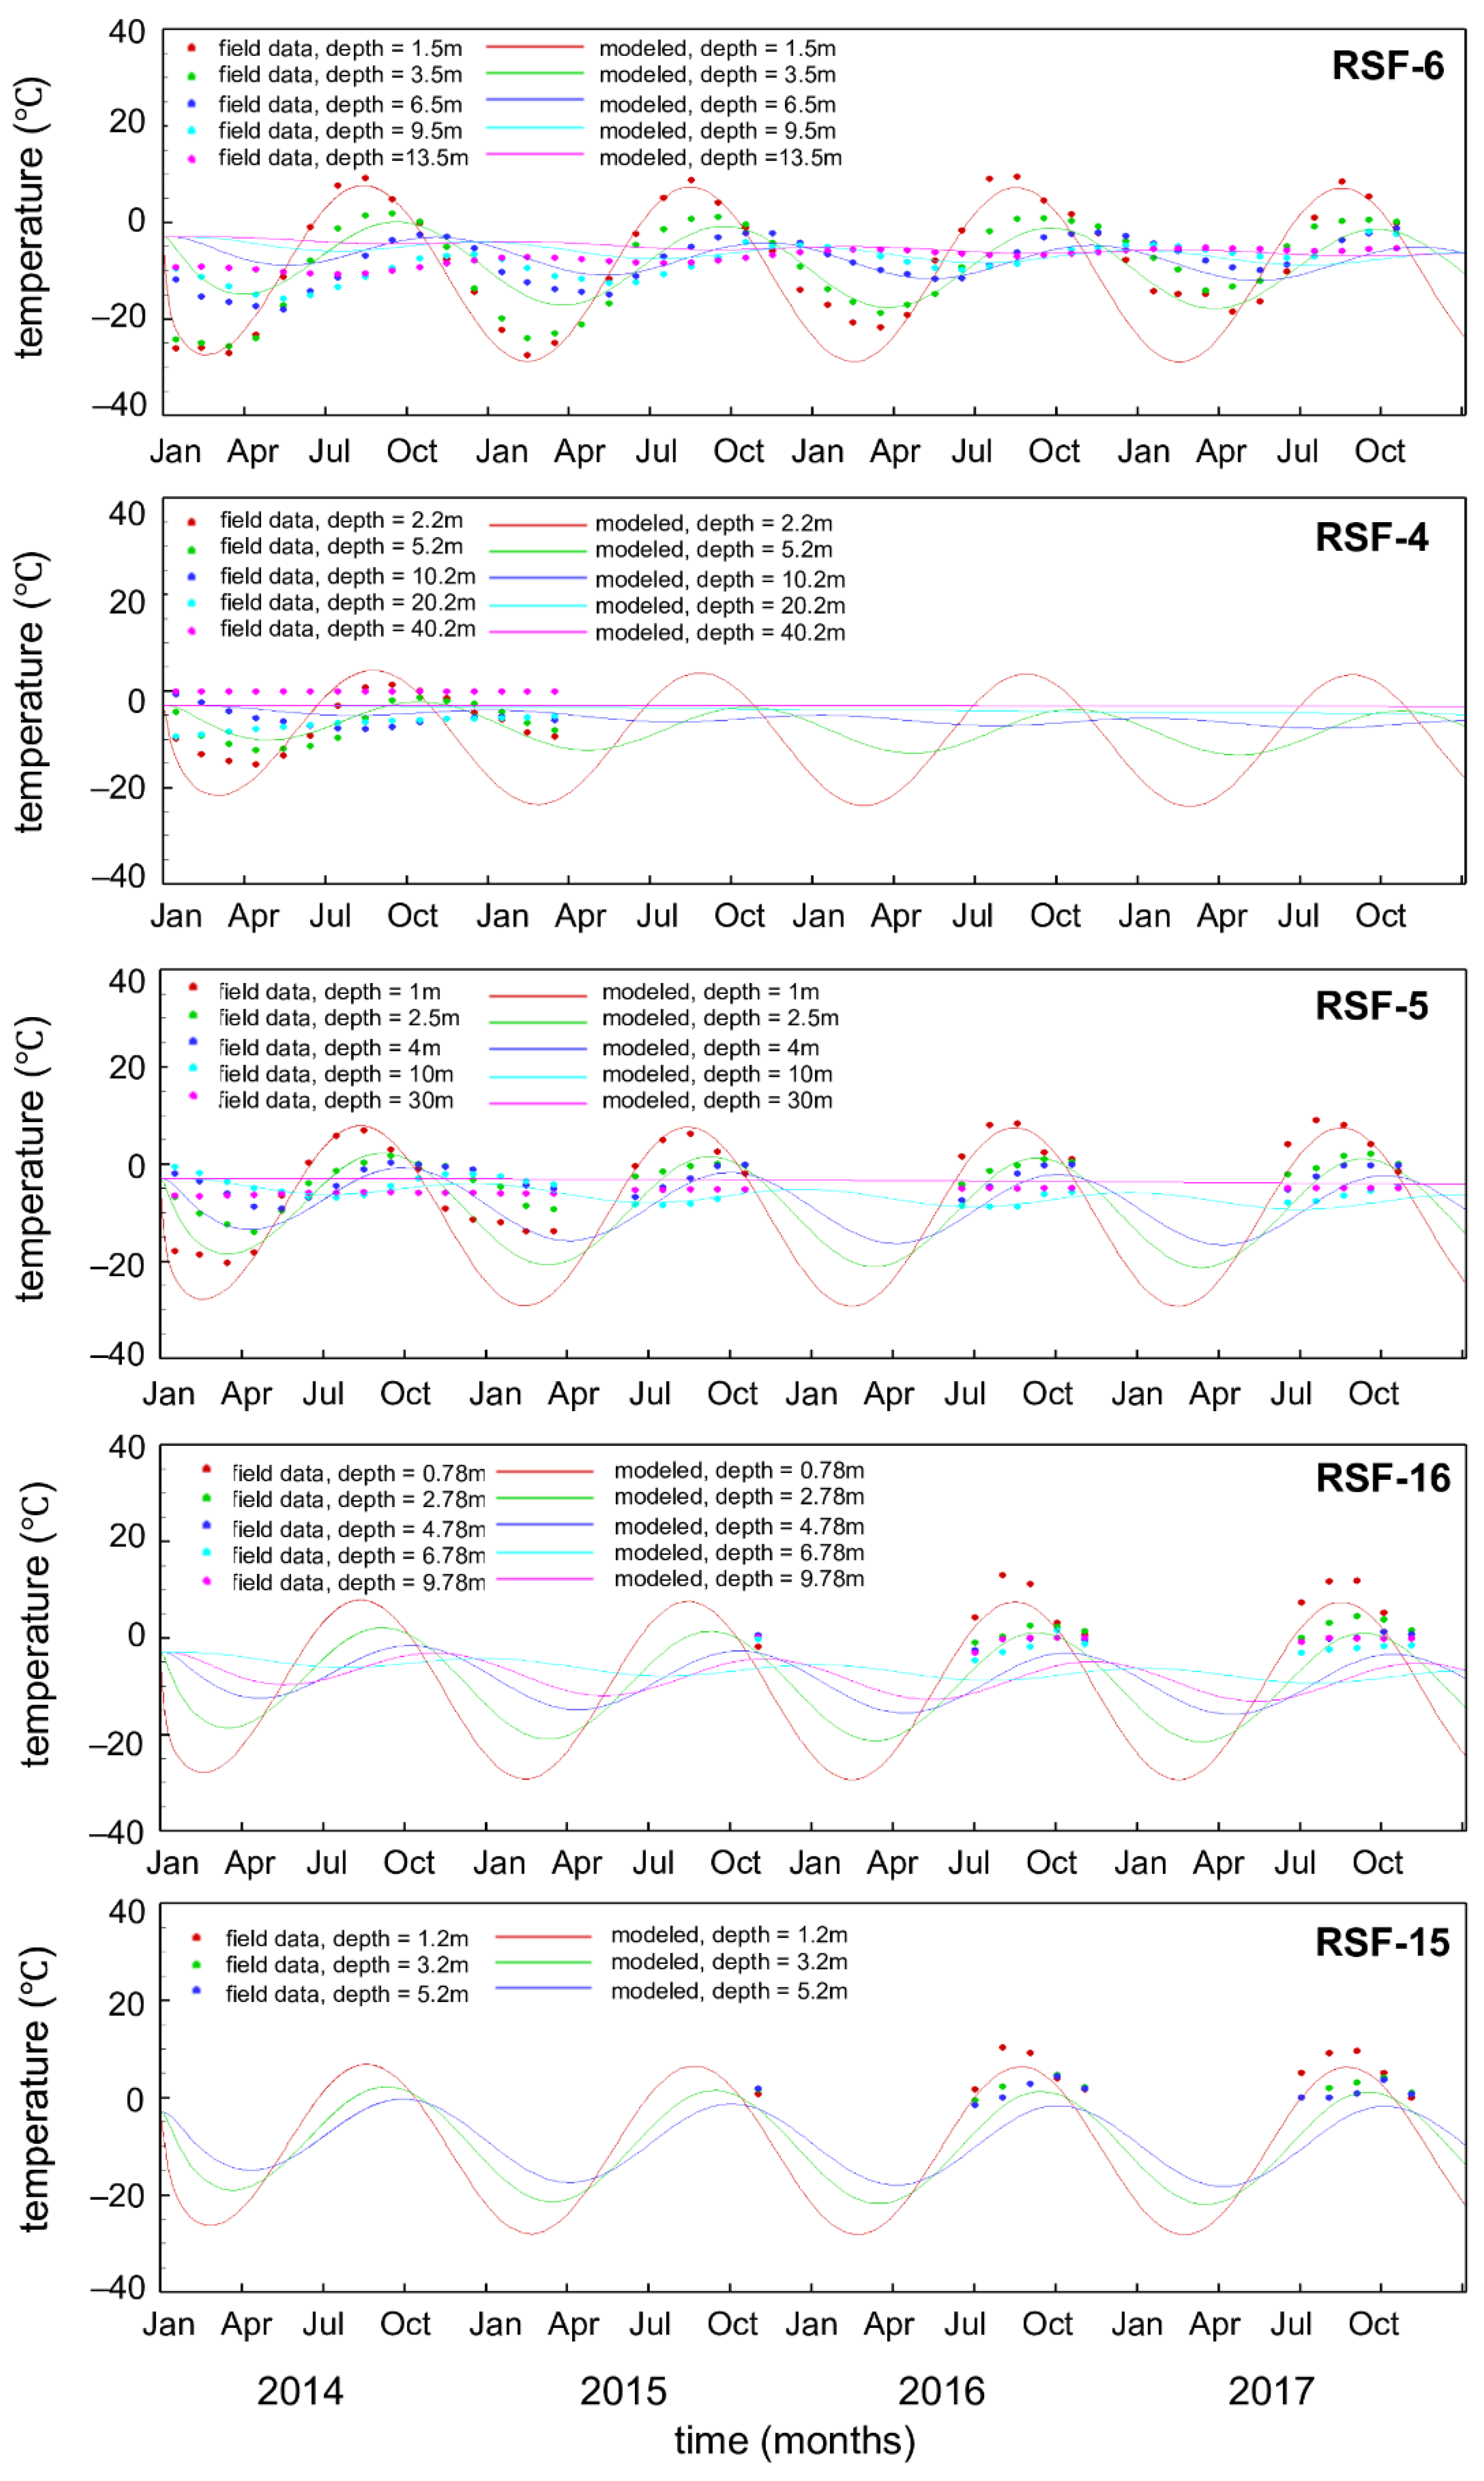
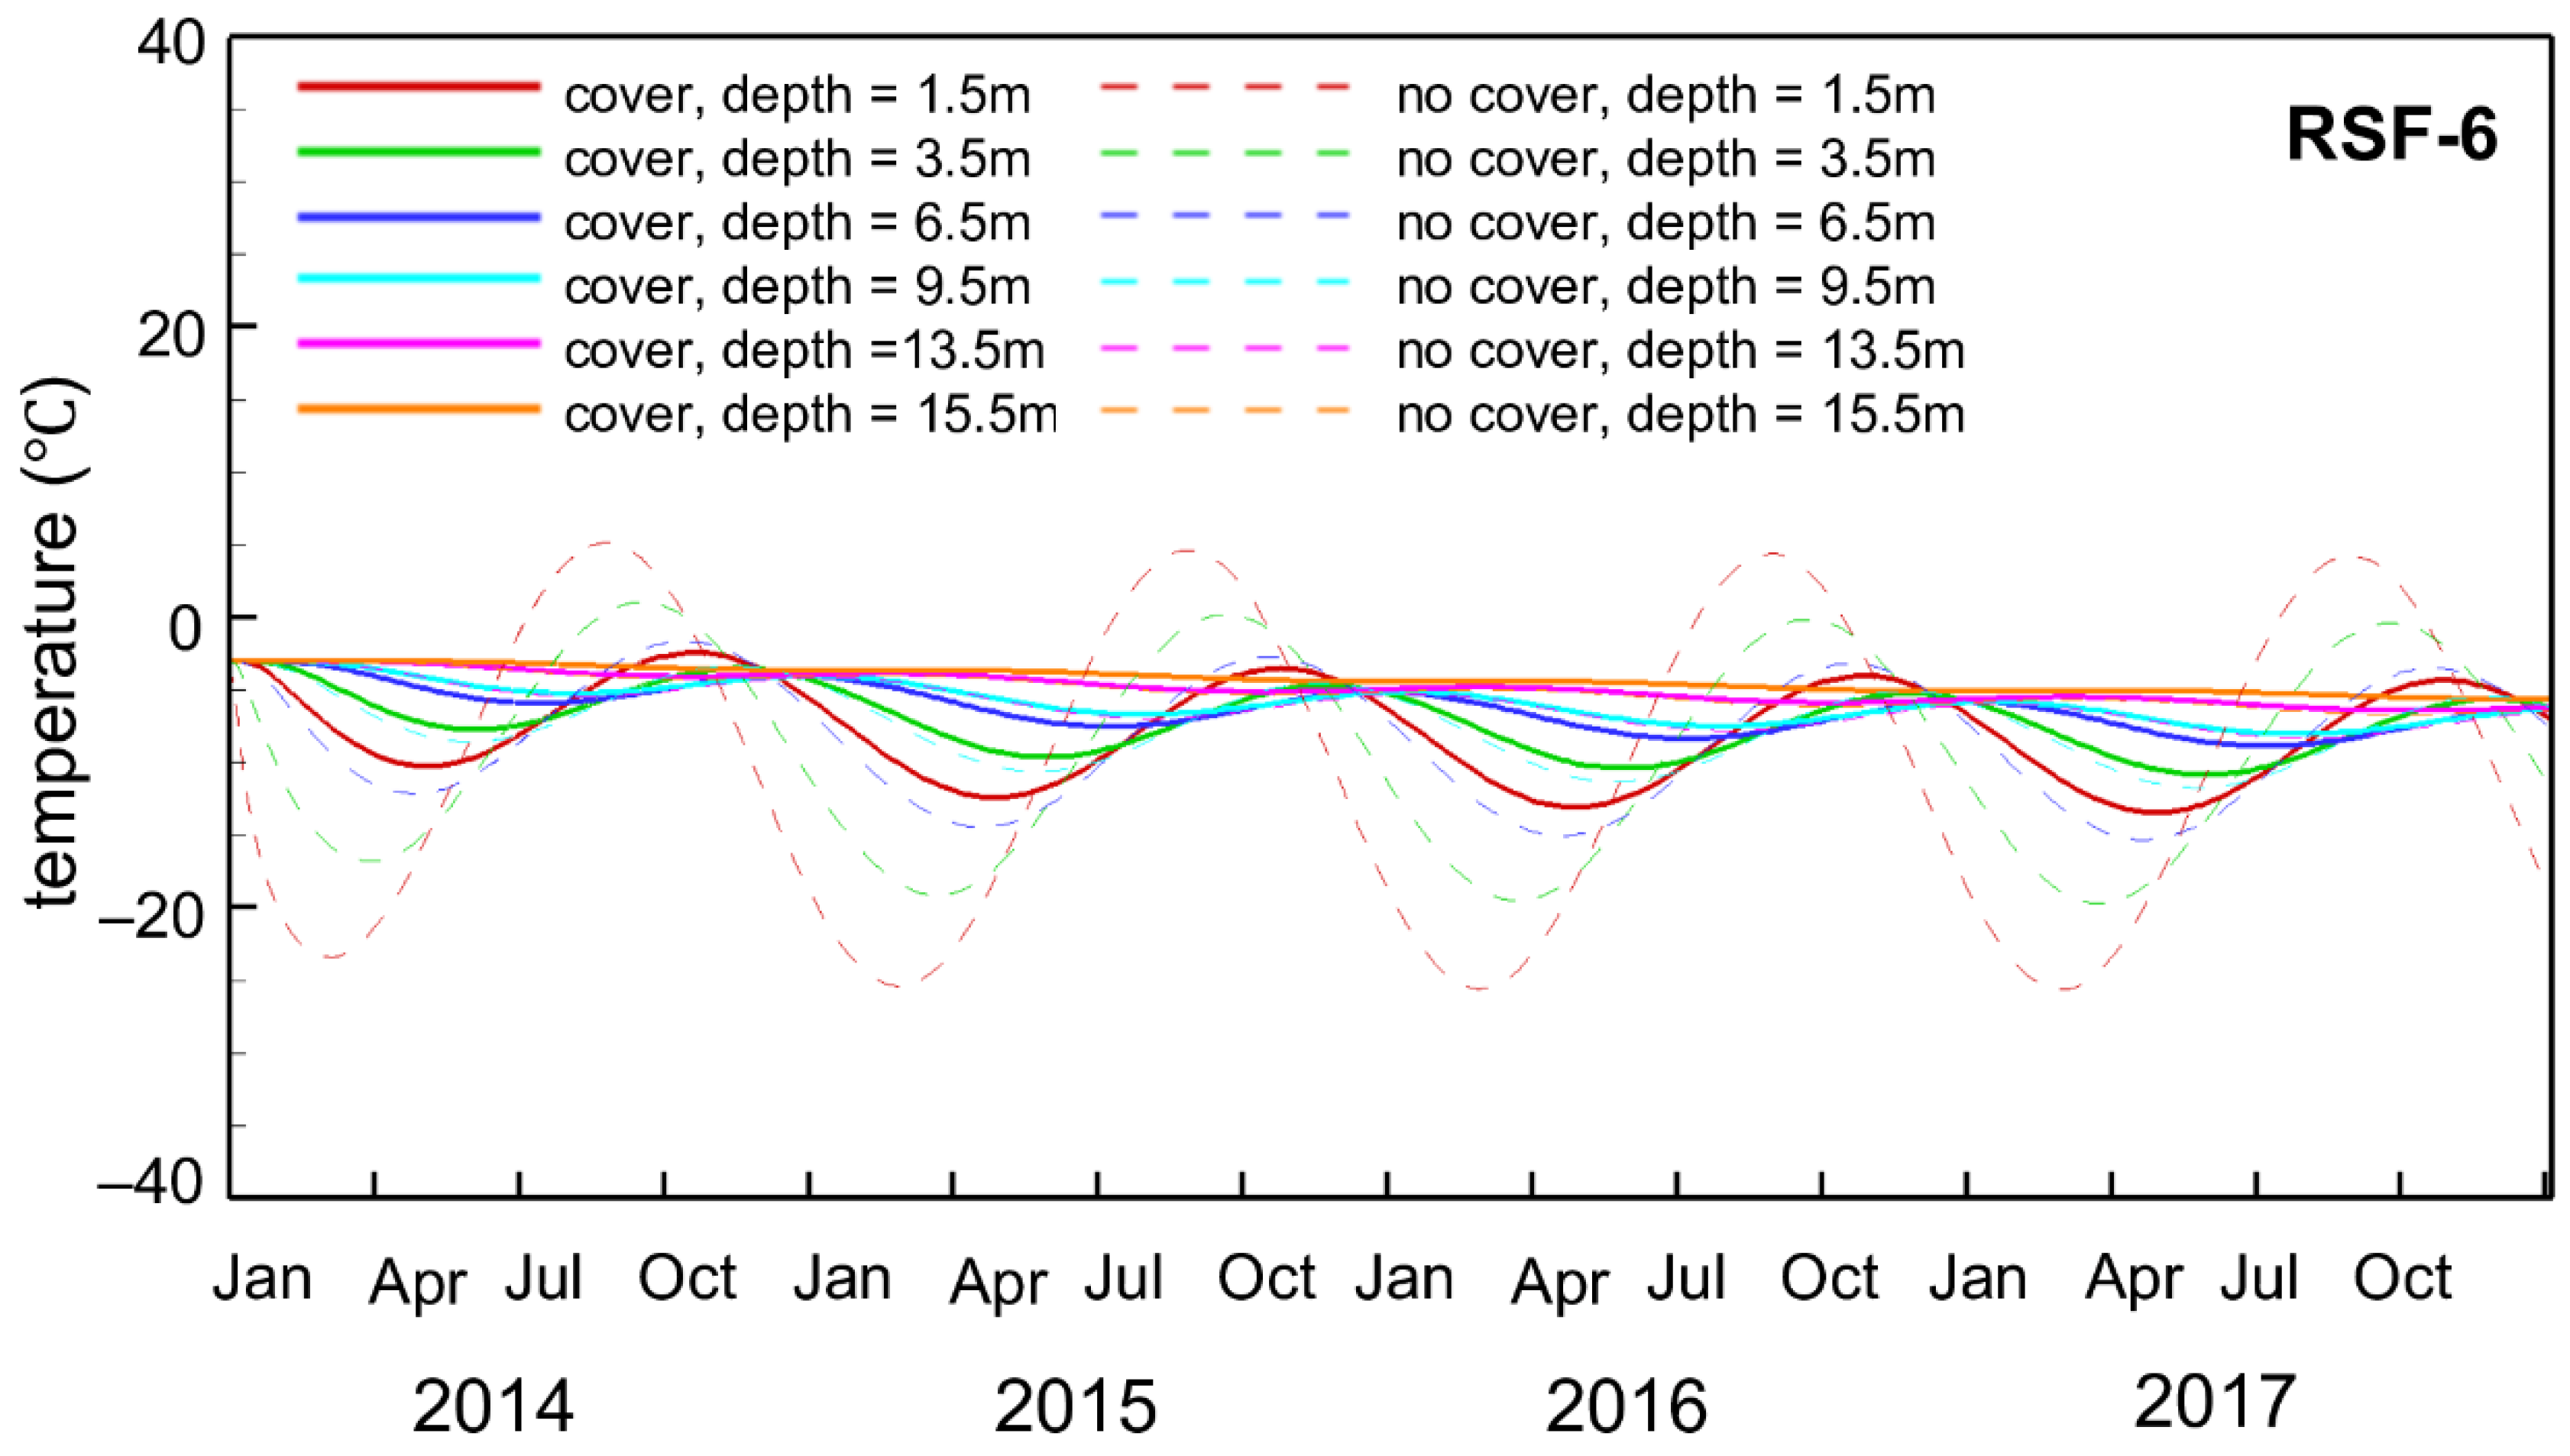
Comparing simulated temperature fluctuations from January 2014 to October 2017 at RSF-4, RSF-5, RSF-6, RSF-15, and RSF-16 to the measured temperature data at the site indicates the simulations provide an adequate representation of the thermal regime in the covered pile (Figure 5). Simulated temperature values from June to November in each year show good agreement to the measured values at all stations, especially at the stations with the most complete data sets (i.e., RSF-4, RSF-5, and RSF-6). Although simulated temperatures were lower than the measured values at RSF-15 and RSF-16, the simulation results adequately capture the two peaks in 2016 and 2017. Overall, simulated results capture the penetration of the seasonally induced thermal waves, with a penetration depth limited to the upper 10–15 m of the WRP. Simulations show that seasonal temperature fluctuations at greater depth are much lower and lag significantly behind temperature changes near the surface due to the effects of heat conduction, consistent with observed patterns. Both measured and simulated results show that the core of the WRP remains frozen and nearly constant in extent, even in the warm seasons for the first 4 years, with only the cover thawing in summer and early fall. Winter temperature data was limited and only available over the four-year period at RSF-6, and over the first year at RSF-4 and RSF-5. These field measurements show a multiyear warming trend from 2015 to 2017, most clearly seen for the winter season, ranging from about 3 to 7 °C as a function of depth (as shown at RSF-6), while the simulations yielded identical minimum temperatures over the four-year period. These results indicate the covered pile in the field was warmer than predicted by the model, especially for the shallow depths in the winter months (1.0–2.2 m). These differences are at least in part caused by insulating effects of the surface snowpack [9], which is only seasonally present and was not considered in the model. Other differences, also visible in the warm seasons, were likely to result from (1) neglecting heterogeneity of material properties in the numerical simulations (such as thermal conductivity), which influence heat transport; (2) wind effects at the batters of the pile (i.e., RSF-15 and RSF-16), leading to gas advection and convective heat transport into or out of the pile; (3) variations in cover thickness over the pile surface of the constructed WRP; (4) preferential flow through large pores in the pile; and (5) the slope orientation. Specifically, the surface temperatures along south-facing slopes are expected to be higher than on north-facing slopes. The model fit increases later during the simulations since early results are strongly affected by the initial condition relevant to temperature evolution during the process of pile construction, which is difficult to take into consideration. When simulating the pile behavior and implement the conceptual model based on measured data, no attempt was made to calibrate the model parameters to improve the fit at individual locations to observed temperature data. Discrepancies between observed and simulated data exist, especially during early time, limiting the predictive capabilities of the model. However, seasonal trends and the dampening of the temperature amplitude with depth are well represented by the model, providing confidence in the modeling approach for waste rock weathering and cover functionality in cold-region climates.
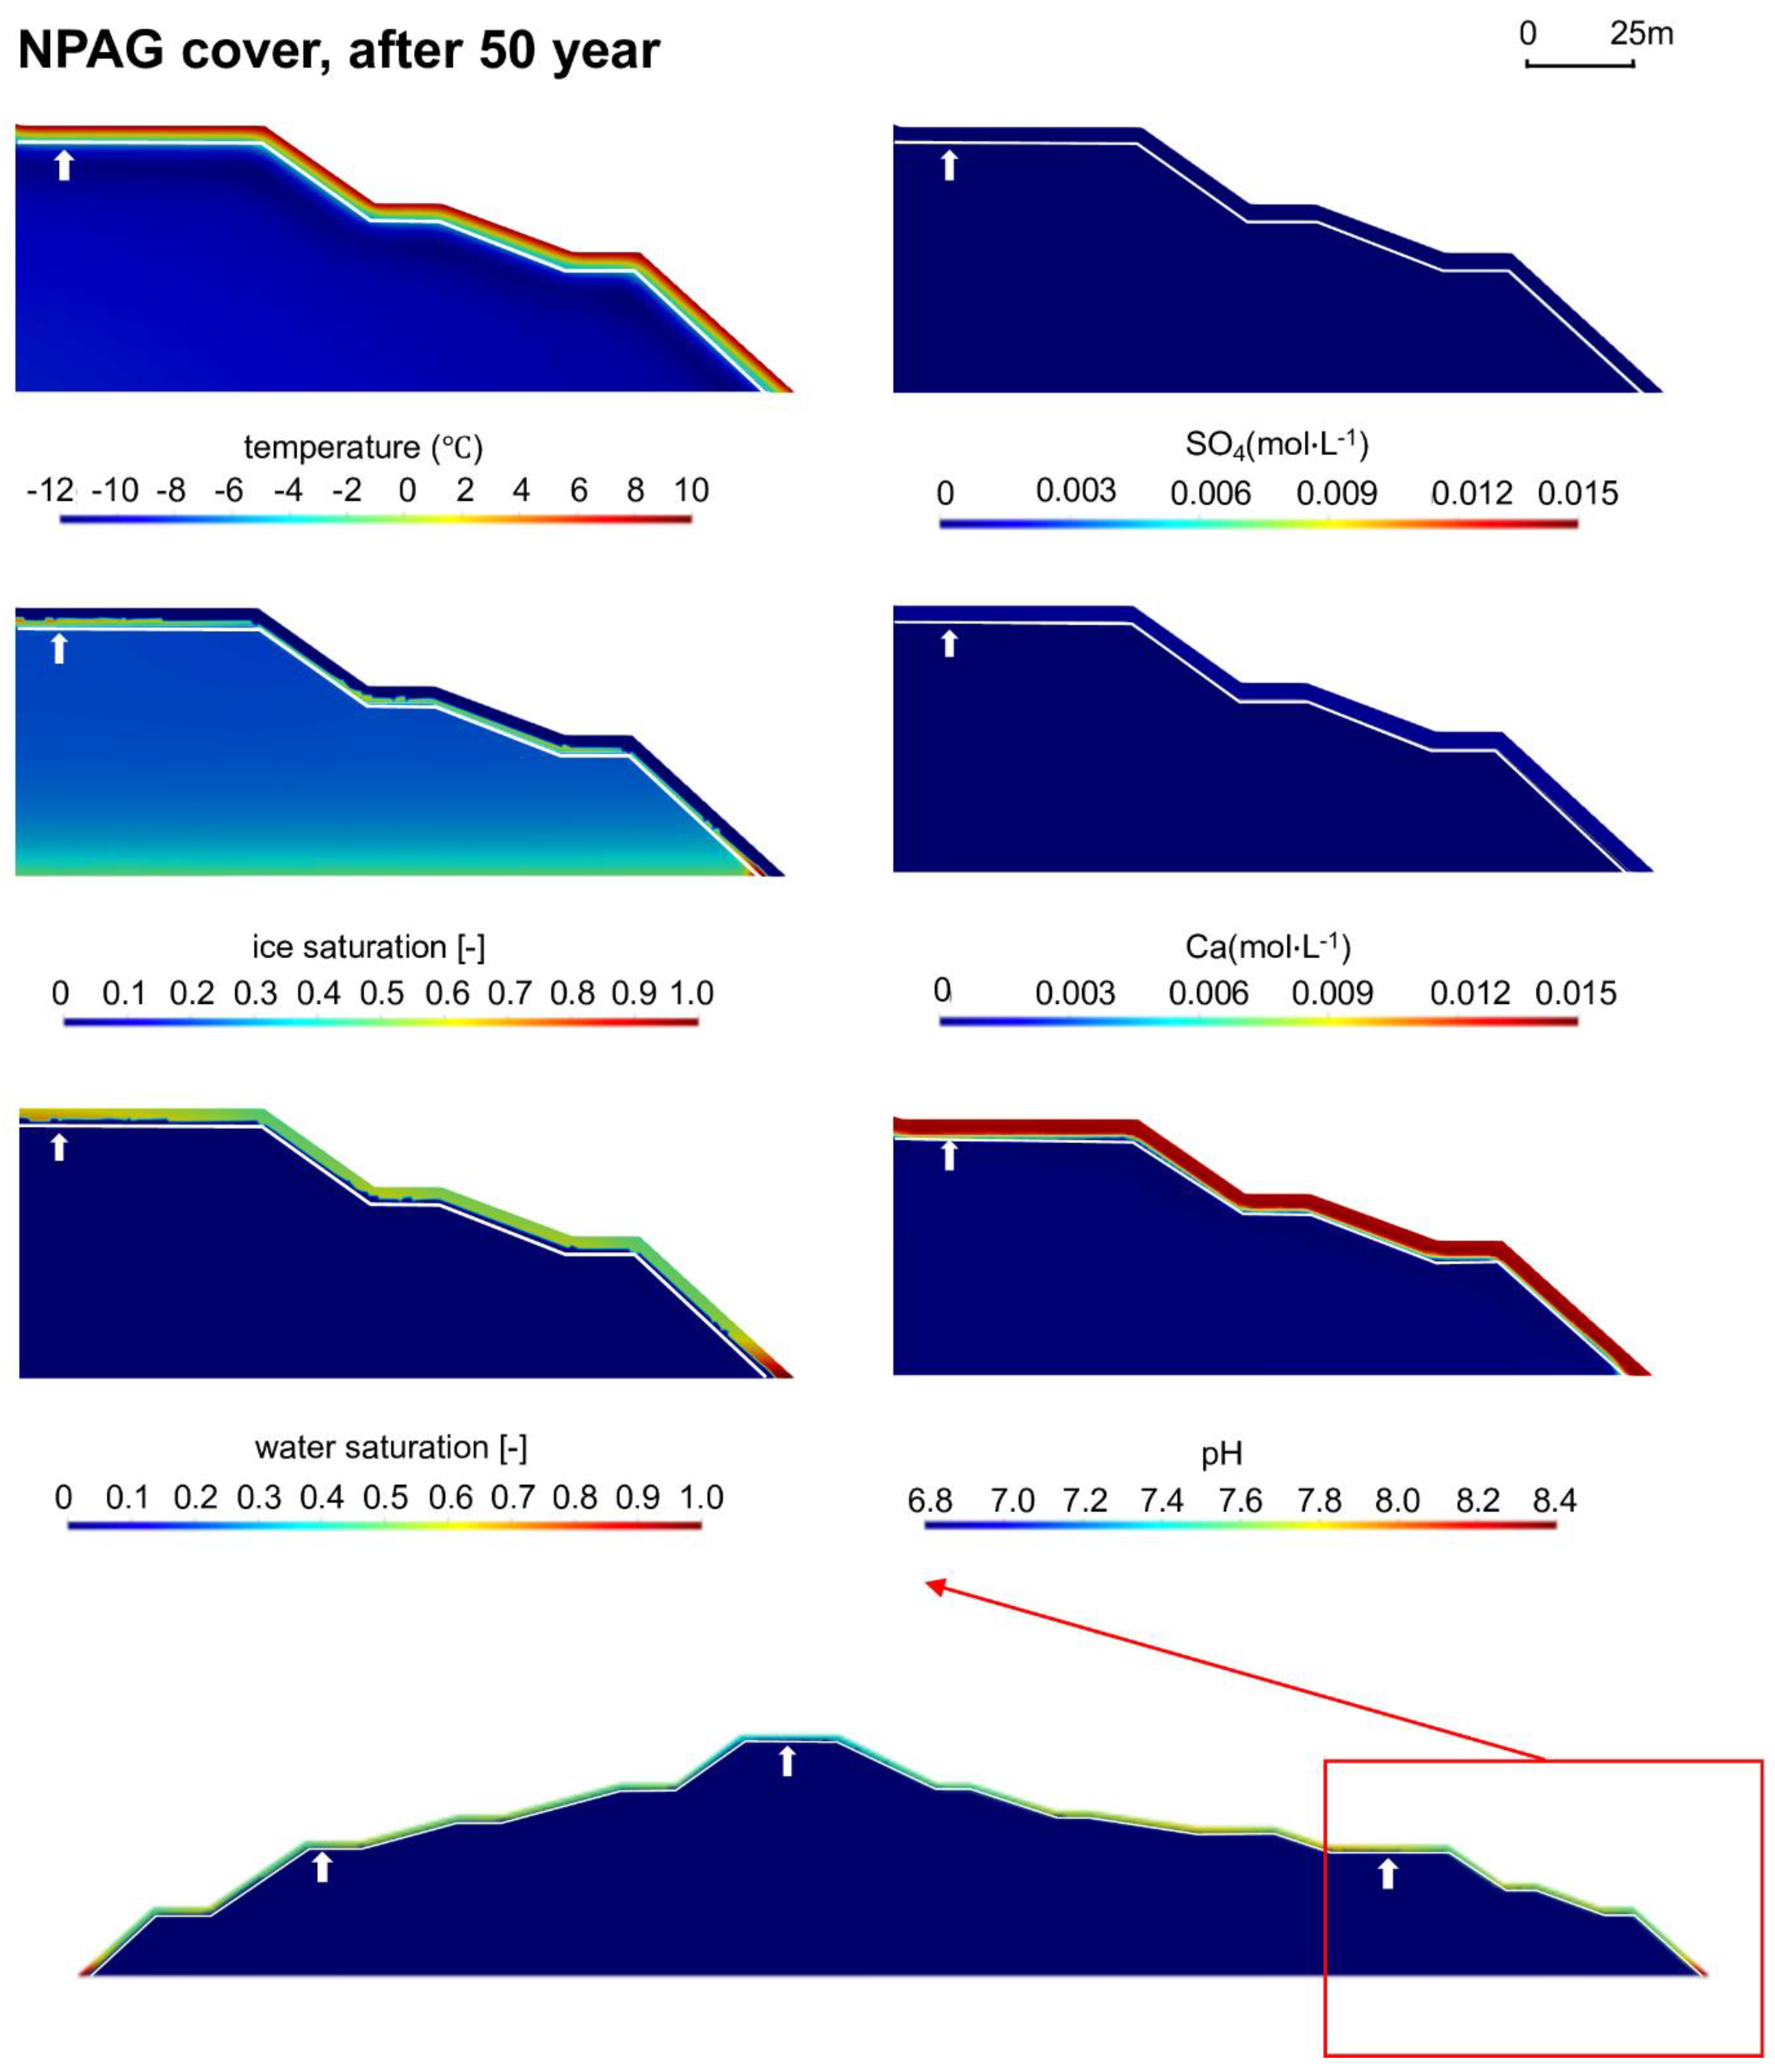
The long-term thermal evolution of the covered pile is shown in Figure 6. Since the seasonally controlled temperature function is assigned for the entire 50-year simulation period, the core temperature of the WRP approaches the average yearly value (i.e., MAAT = −11.4 °C) (due to the main controls of climatic condition and geothermal heat flux), surrounded by temperature gradients (due to freeze thaw processes in the active layer) towards the surface. The simulations indicate that the 0 °C isotherm remains in the surficial 4m NPAG material (above the PAG waste rock) in the long term, implying that the active layer is maintained within the cover.
Temperature fluctuations and seasonal thawing in the active layer allow for the percolation of water. In Figure 6, the observed ice-free layer near the surface, present in the summer, is another indicator of the active layer extent. The distribution of ice and water in the waste rock pile, and in particular the presence of ice within the cover material and above the waste rock, confirms that the active layer is restricted to the cover and does not extend into the waste rock. The simulations indicate that some limited ponding of water occurs within the cover above an ice layer (especially on the benches near the toes of the batters), resulting from the blocking effect of permafrost to deeper infiltration, facilitating the accumulation of infiltrating water within the cover, followed by lateral diversion towards the toes of the pile during the warm seasons. The underlying low permeability till blocks infiltration into natural soils at the toe of the WRP, which explains the increased water-saturation zones at the base of the slopes.
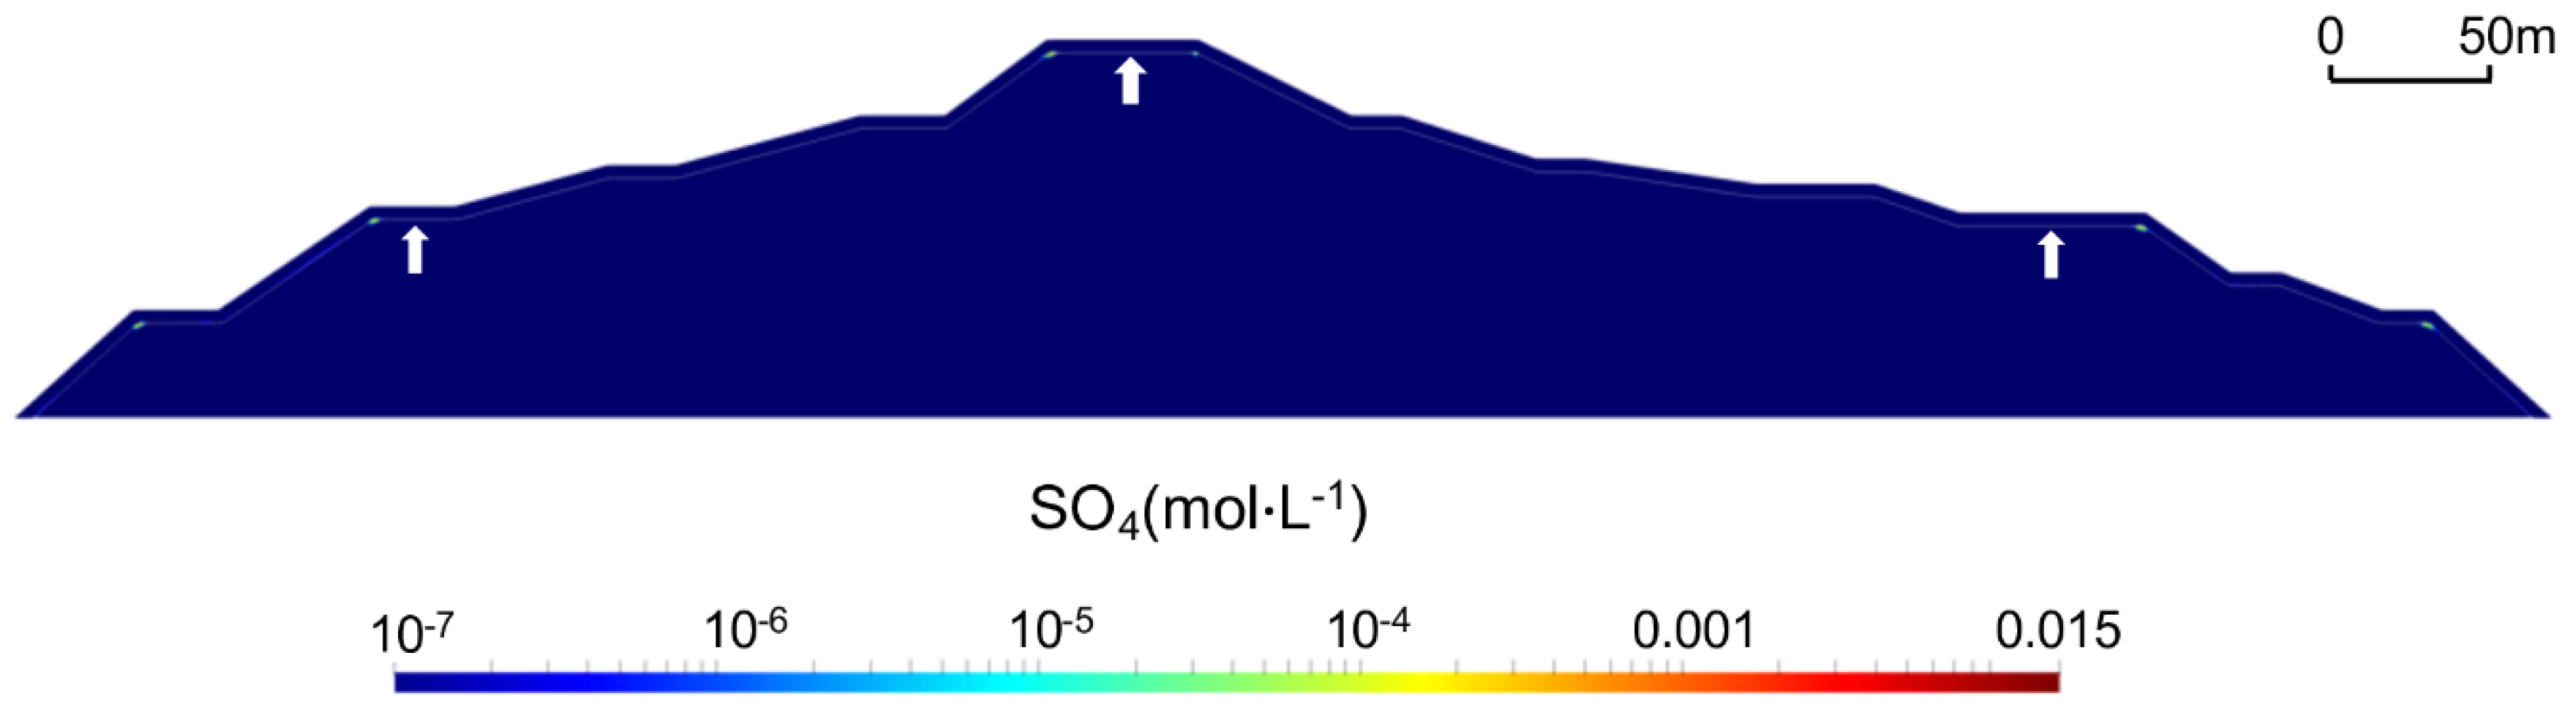
In the absence of geochemical data on pore water chemistry, the model is used to illustrate the expected long-term geochemical evolution of the system (Figure 6). Sulfate and calcium concentrations are good indicators for the occurrence of pyrite oxidation and calcite dissolution, respectively. Very low concentrations of sulfate observed in the system indicates a lack of pyrite oxidation and acidity production, except for spatially constrained zones within the steep slopes (Figure A3, Appendix C). These results illustrate the functionality of the cover, showing that sulfide oxidation is very limited, since the PAG waste rock will remain frozen in the longer term. At the top of each tipping face (where the pile bench meets the sloped face, referred to as a “break”), multi-directional heat conduction enhances the thaw depth (i.e., down from the bench and from the batters) leading to some sulfate release. However, the simulations indicate that basal drainage remains free of sulfate for the entire simulation period. Calcite (which was considered as the primary pH-buffering mineral) dissolves in the cover mostly in response to slightly acidic infiltration from rain and snow, establishing equilibrium under atmospheric conditions and leading to slightly basic pH-values in the near surface pore water (Figure 6).
5.2. Uncertainty Analysis to Infiltration
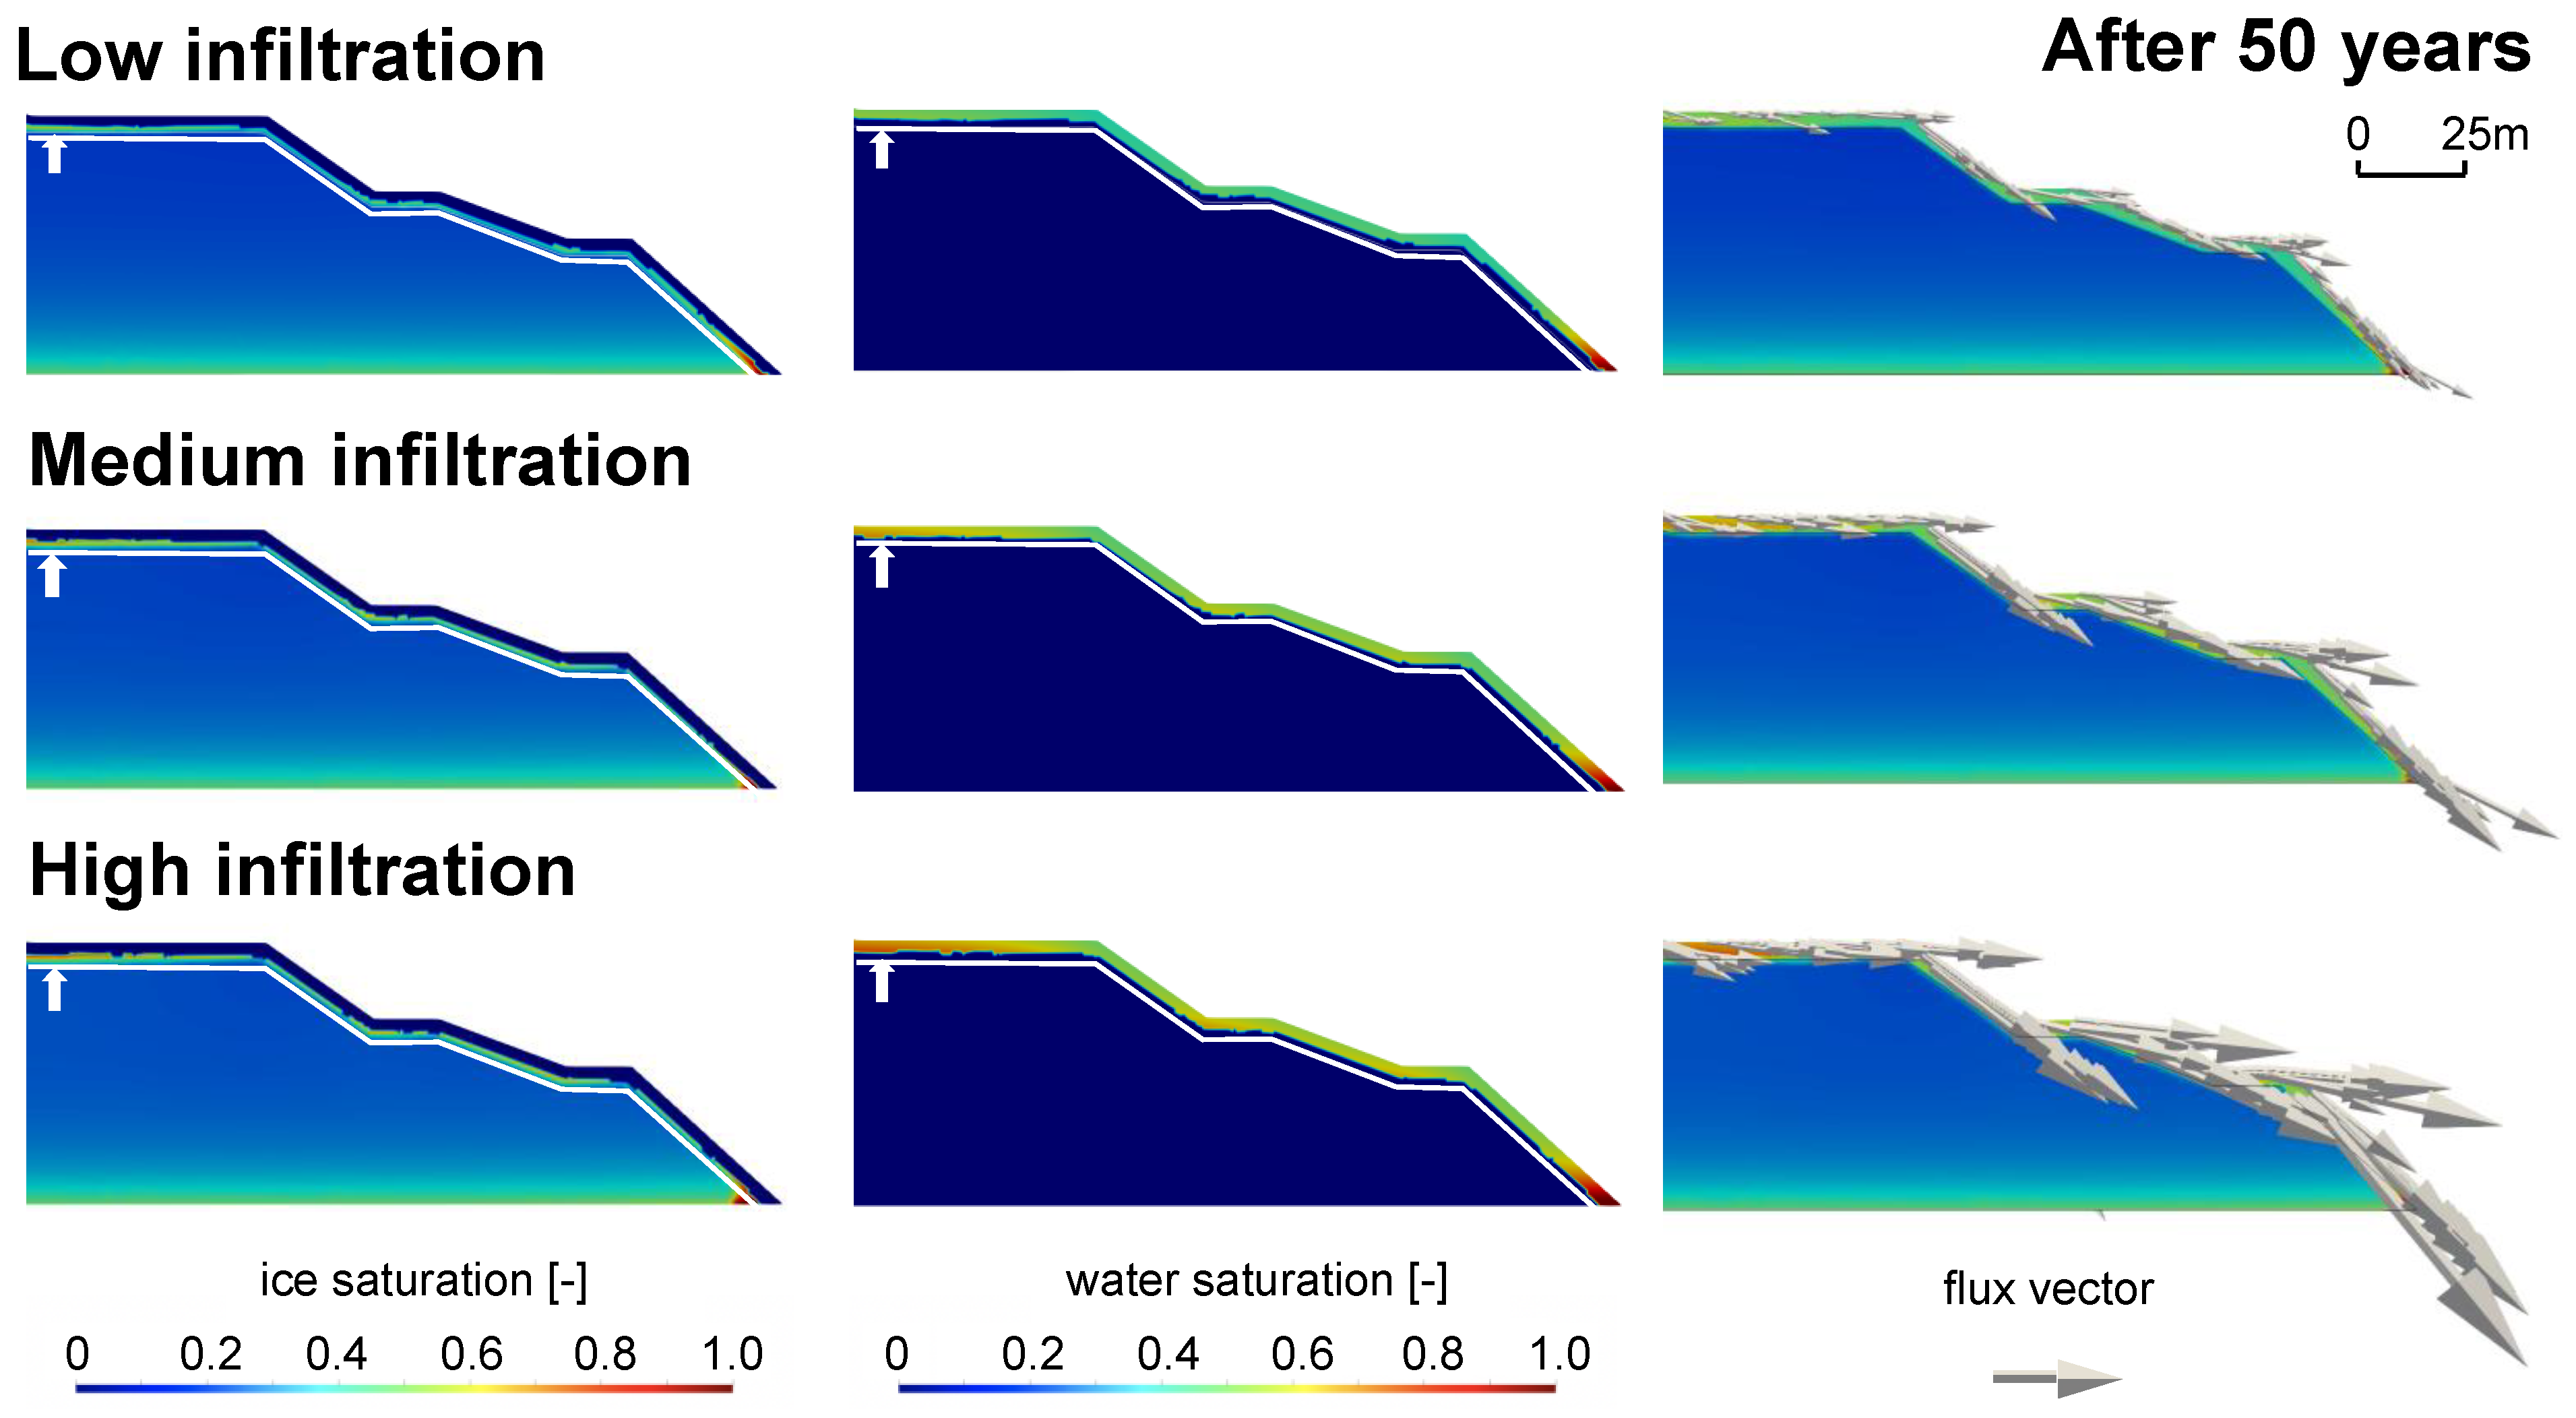
Simulated ice and water saturations for increased and reduced infiltration rates are depicted in Figure 7 for the summer after 50 years in comparison to the base case results. An ice-free layer of similar thickness is observed near the surface in all infiltration scenarios, indicating that the active layer is maintained within the cover and the waste rock remains frozen in the long term, regardless of the infiltration rate. The distributions of water saturations are directly related to the flow regime and infiltration rates. In the increased infiltration scenario, water accumulation within the cover is more pronounced, depicted by the higher average water saturations and more pronounced internal water ponding in Figure 7. The occurrence of the water ponding is related due to the blocking effect of permafrost. Ponding also becomes more obvious at the breaks of each batter, where the direction of flow instantly changes to lateral flow. As for the base case scenario, the toes of the piles become water-saturated due to underlying low-permeability materials, leading to outflow during the summer months. Darcy flux vectors, presented by scaled arrows, are used to visualize flow patterns for the different scenarios. In the scenario with a reduced infiltration rate, flux vectors suggest that water is also laterally diverted through the cover during the summer months, although it moves more slowly than for the base case. Conversely, flow is faster in the scenario with an increased infiltration, while flow patterns remain similar. The simulations indicate that, in the long term, basal drainage at the toes of the pile is to be expected, with the magnitude of outflow a function of the recharge.
The sensitivity analysis for infiltration was designed to assess how uncertainties related to infiltration will affect flow processes and the thermal regime within the pile, with an emphasis on cover performance. Simulation results illustrate that the applied recharge has an insignificant impact on the thickness of the active layer, since flow patterns and locations, as well as the ice distributions, are similar for all infiltration scenarios. Due to a lack of observational data, further analysis of the effects of the recharge on drainage water chemistry was not performed. However, since the simulation indicate that active layer thickness is not significantly affected, it can be postulated that mass loadings will also not be affected materially, although drainage water volumes will be a function of the infiltration rates in the long term.
5.3. Sensitivity Analysis to Cover Thickness
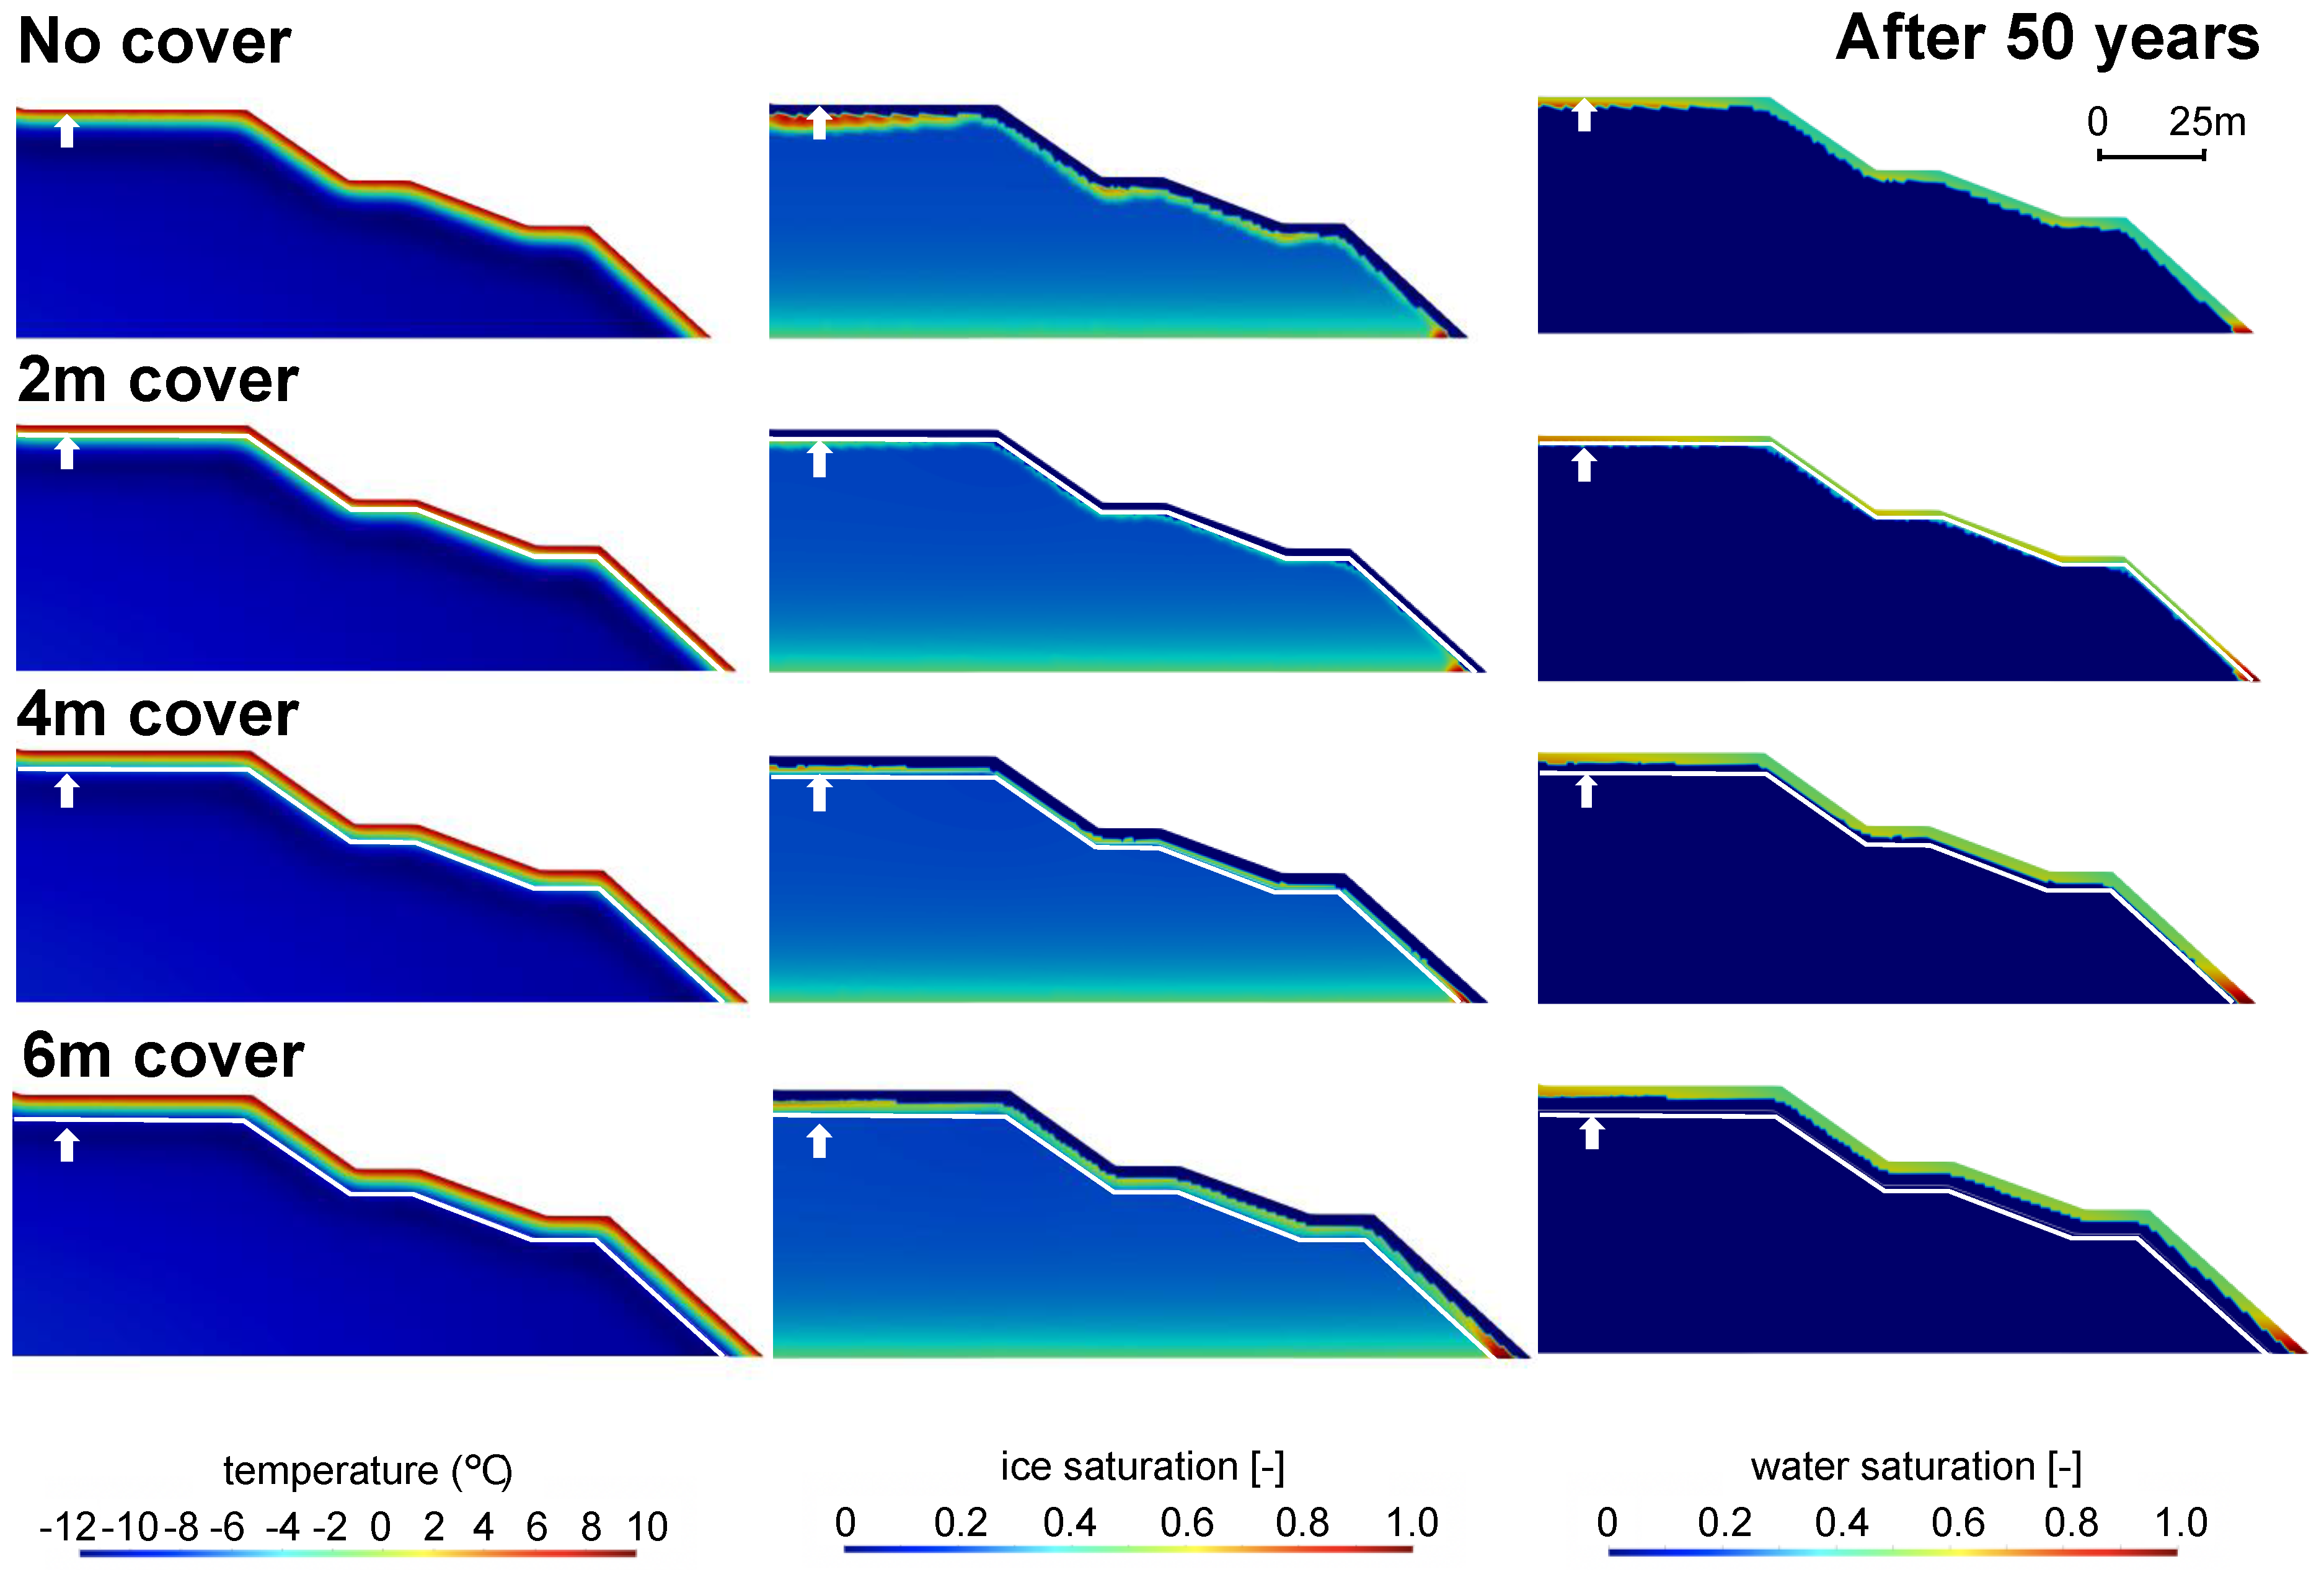
The simulated results of the internal temperature and ice saturation distributions for the four cover-thickness scenarios are shown in Figure 8. Simulated active layer thickness is similar for the different scenarios in spite of differences of variations of heat capacities between NPAG and PAG materials. This result is not unexpected, considering that heat capacities of the two materials differ by less than 15% (Table 1). However, for a thinner cover, the simulations indicate that the active layer extends into the PAG material. The 0 °C isotherm in the scenarios with no cover and 2 m cover are located within the PAG material, while this isotherm remains near, but above the interface between the cover and the PAG waste rock for the scenarios with 4 m and 6 m covers. In other words, the results suggest that PAG material near the pile surface will be affected by seasonal thaw in the long-term for the scenarios with a 2 m cover or no cover (Figure A4, Appendix C). Although the cover thickness has little impact on the active layer thickness, it determines whether the PAG rock will experience thaw and allow for the oxidation of sulfides solute transport of reaction products through this material in the warm seasons. The distribution of ice and water saturations are reflective of the flow regime. All four scenarios show a similar active layer extent, indicated by the thickness of the ice-free layer near the surface, but their distributions are different with respect to the cover thickness. Although the waste rock remains mostly frozen for the no-cover case, a shallow active layer forms in the summer, with increased water saturations and pronounced internal ponding, resulting from deeper infiltration due to the relatively high hydraulic conductivity of the PAG waste rock in combination with the blocking effect of permafrost. For the cases including a cover, the cover with its lower hydraulic conductivity adds more complexity to the ice and water distribution. Zones of water and ice saturations are both observed within the cover material in the 4 m cover and 6 m cover scenarios. The ice layer formed above the interface between the waste rock and cover is thicker in the 6 m cover scenario, whereas elevated water saturations can be seen slightly extending into the PAG waste rock in the 2 m cover scenario (i.e., partial thawing of the shallow waste rock). These results confirm that the active layer is likely to penetrate into PAG material for covers with a thickness of less than 4 m.
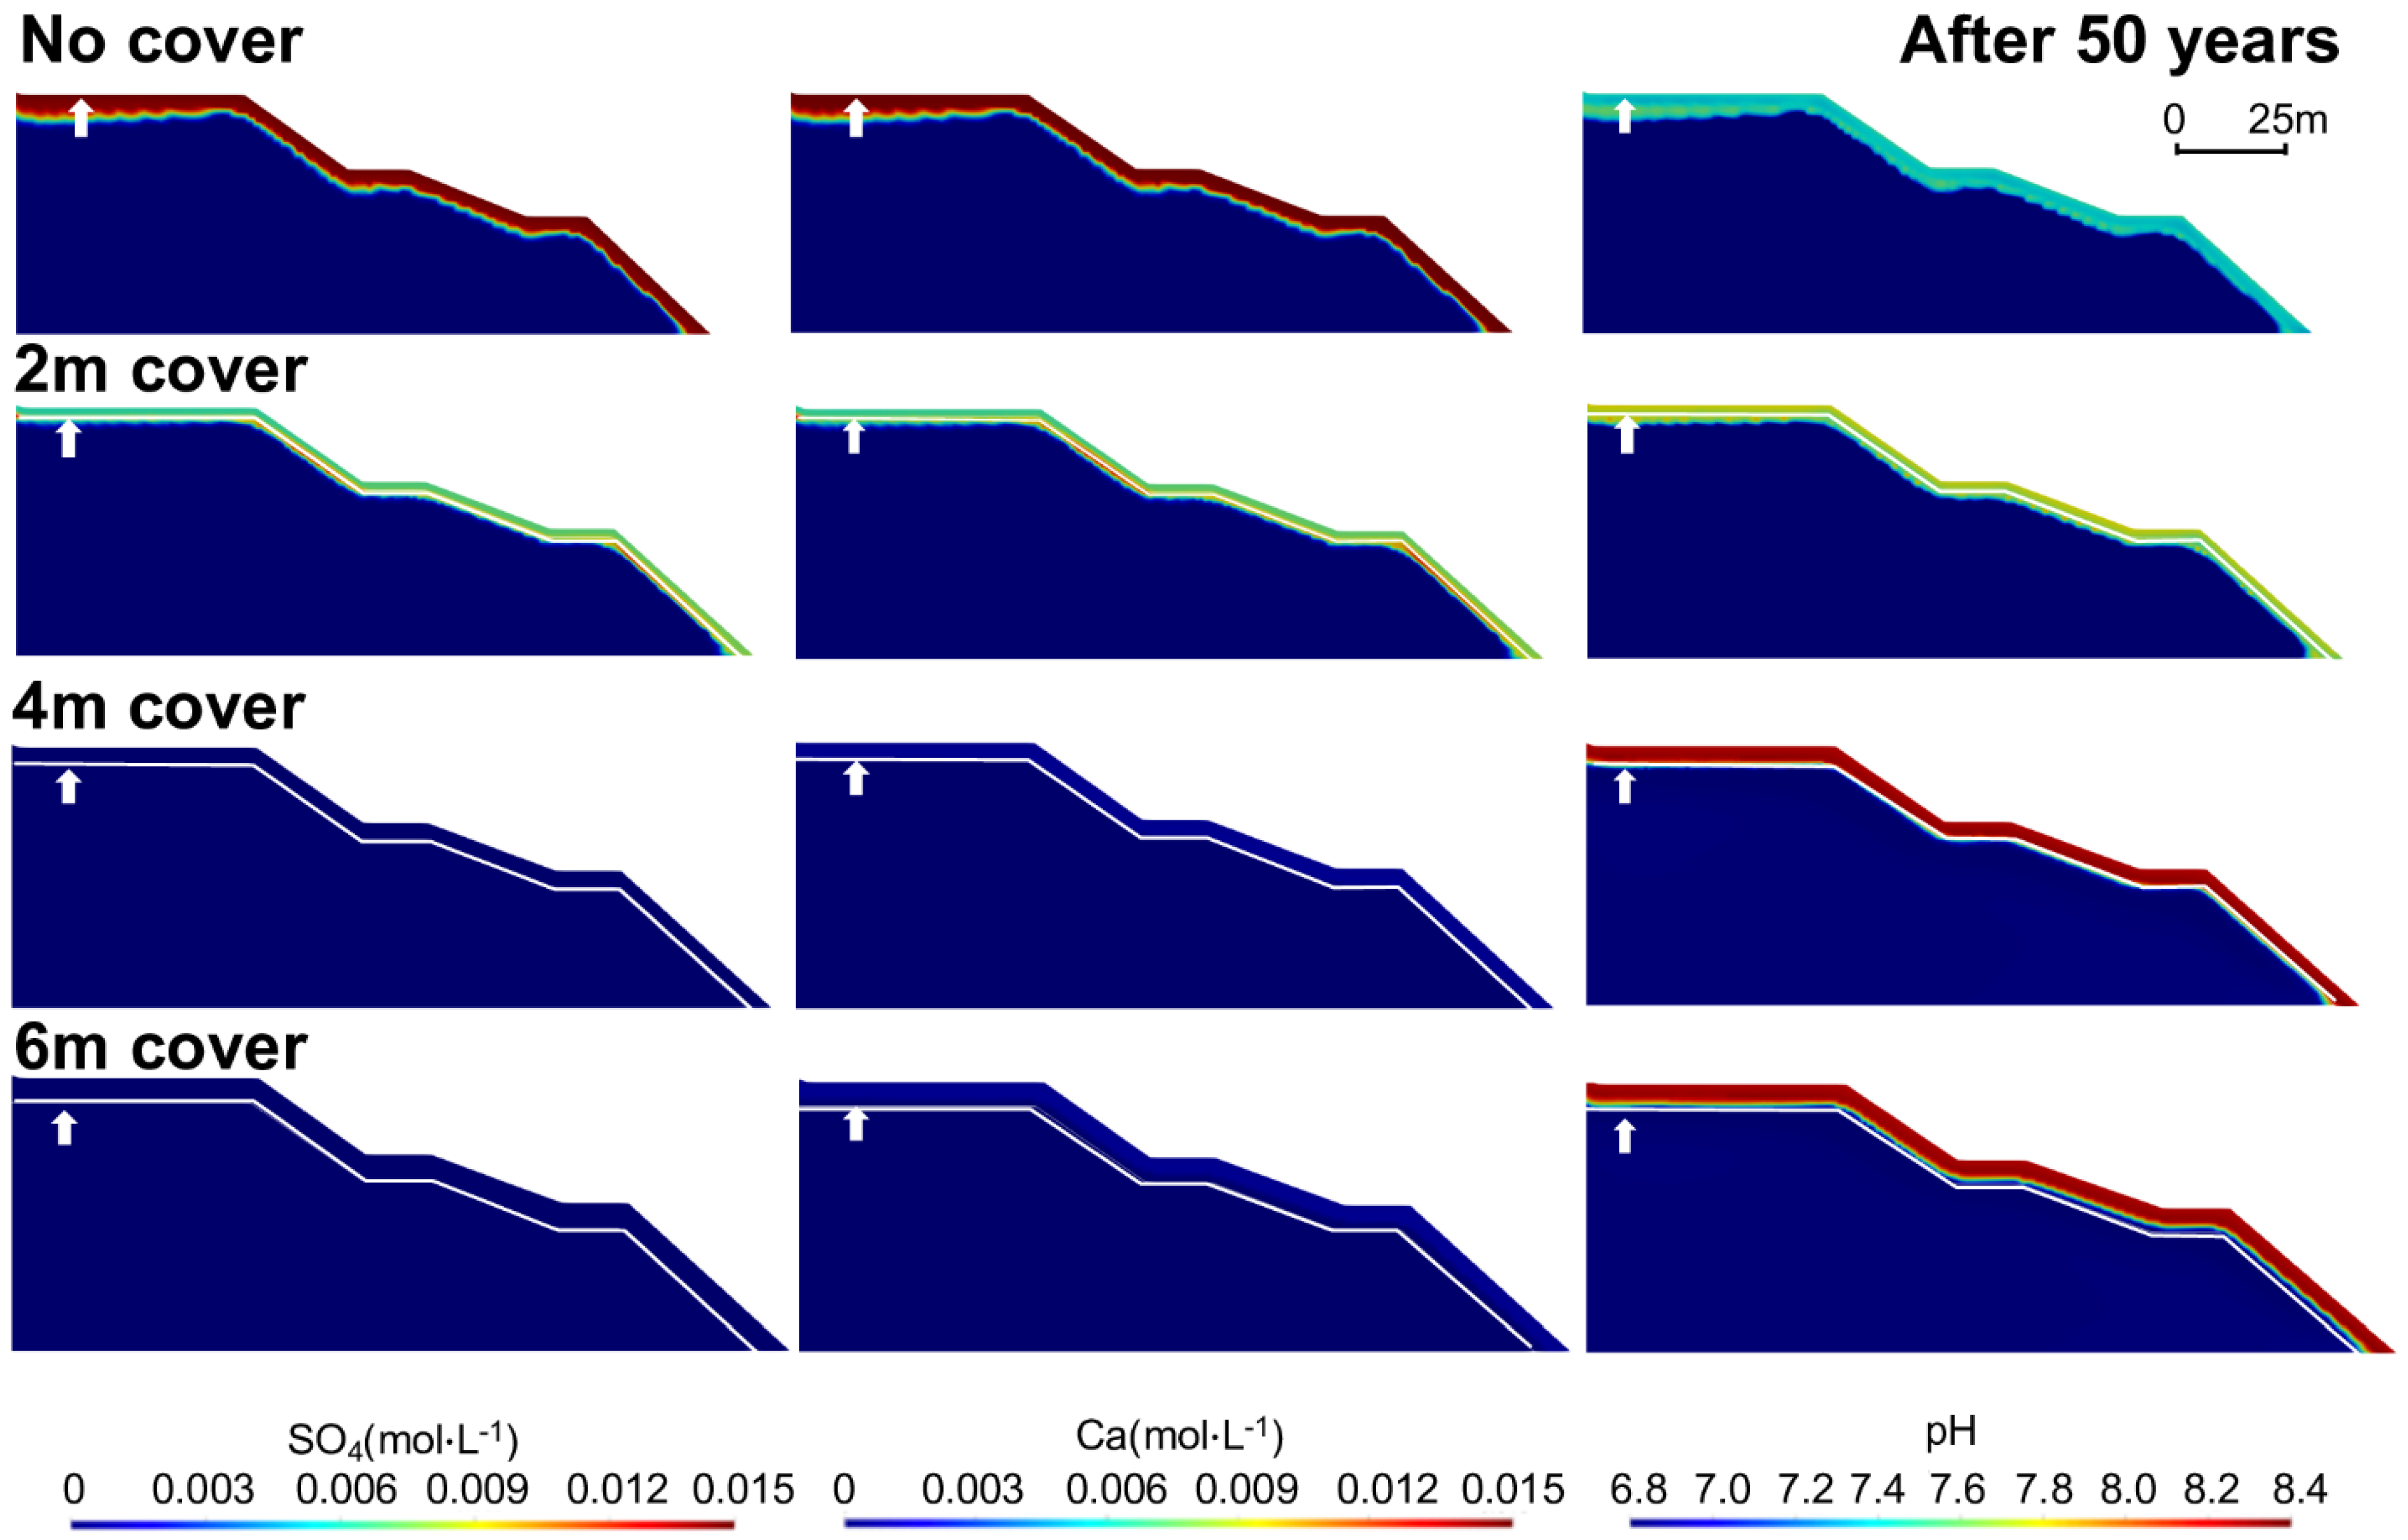
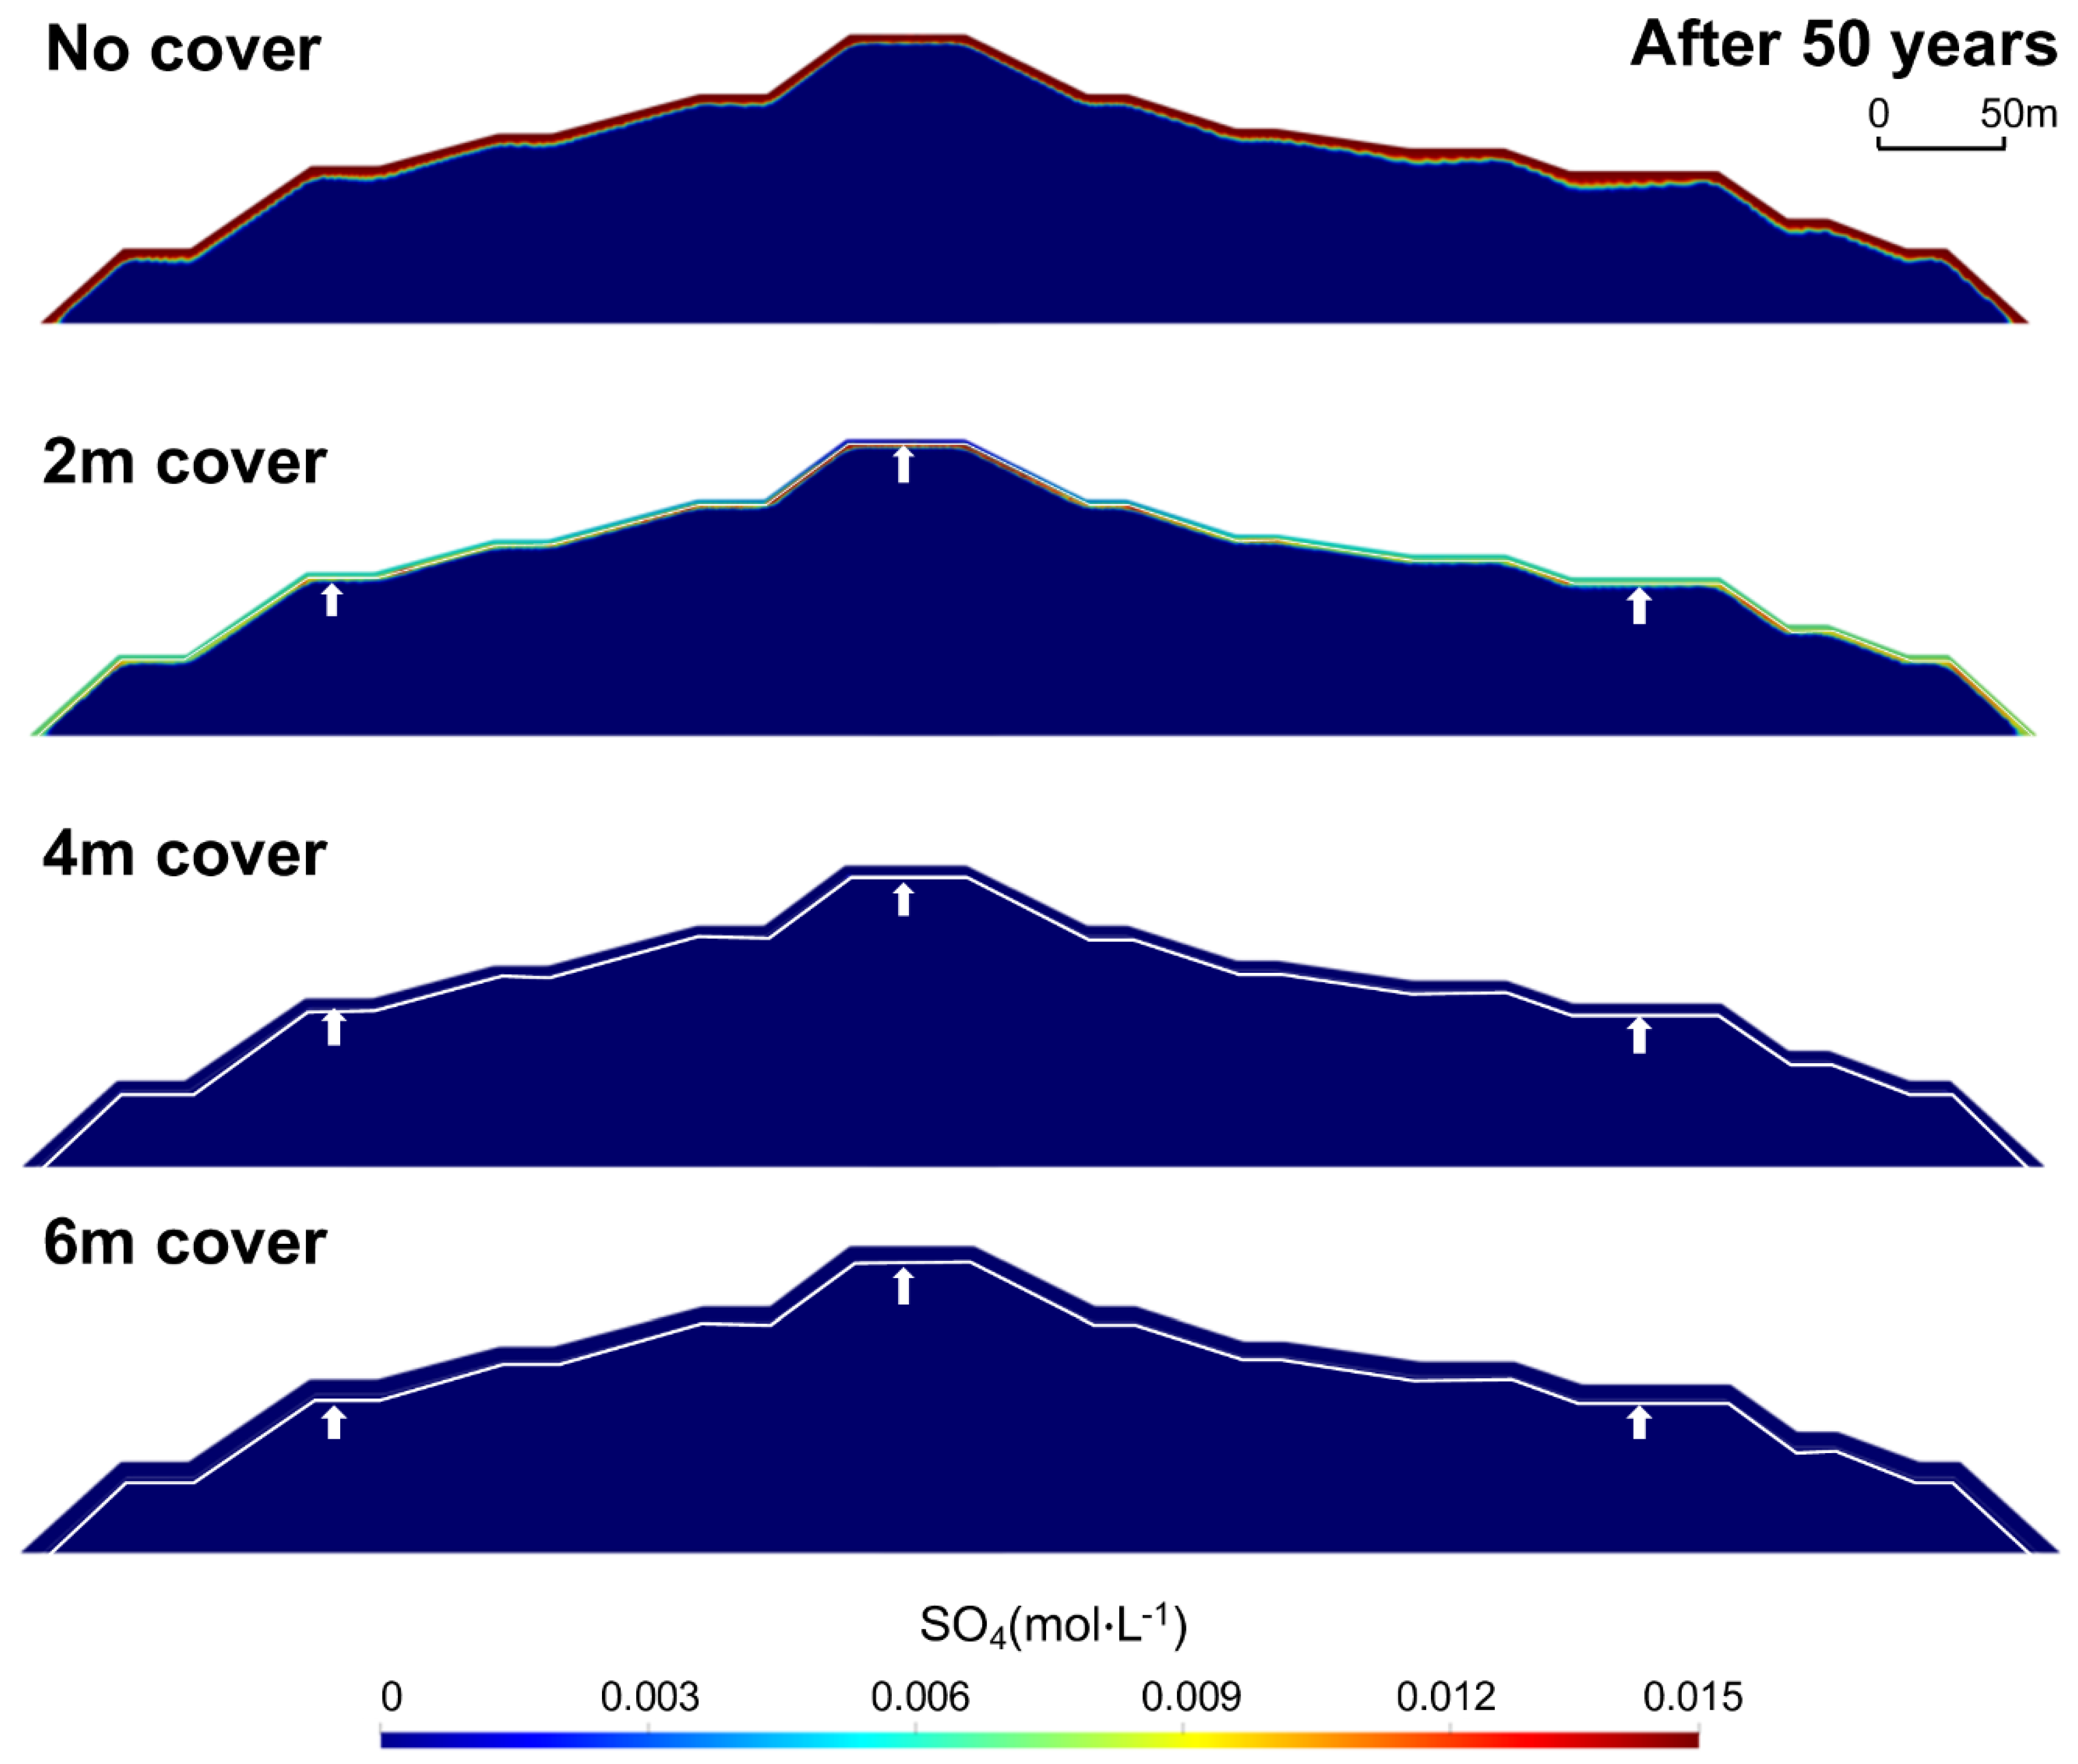
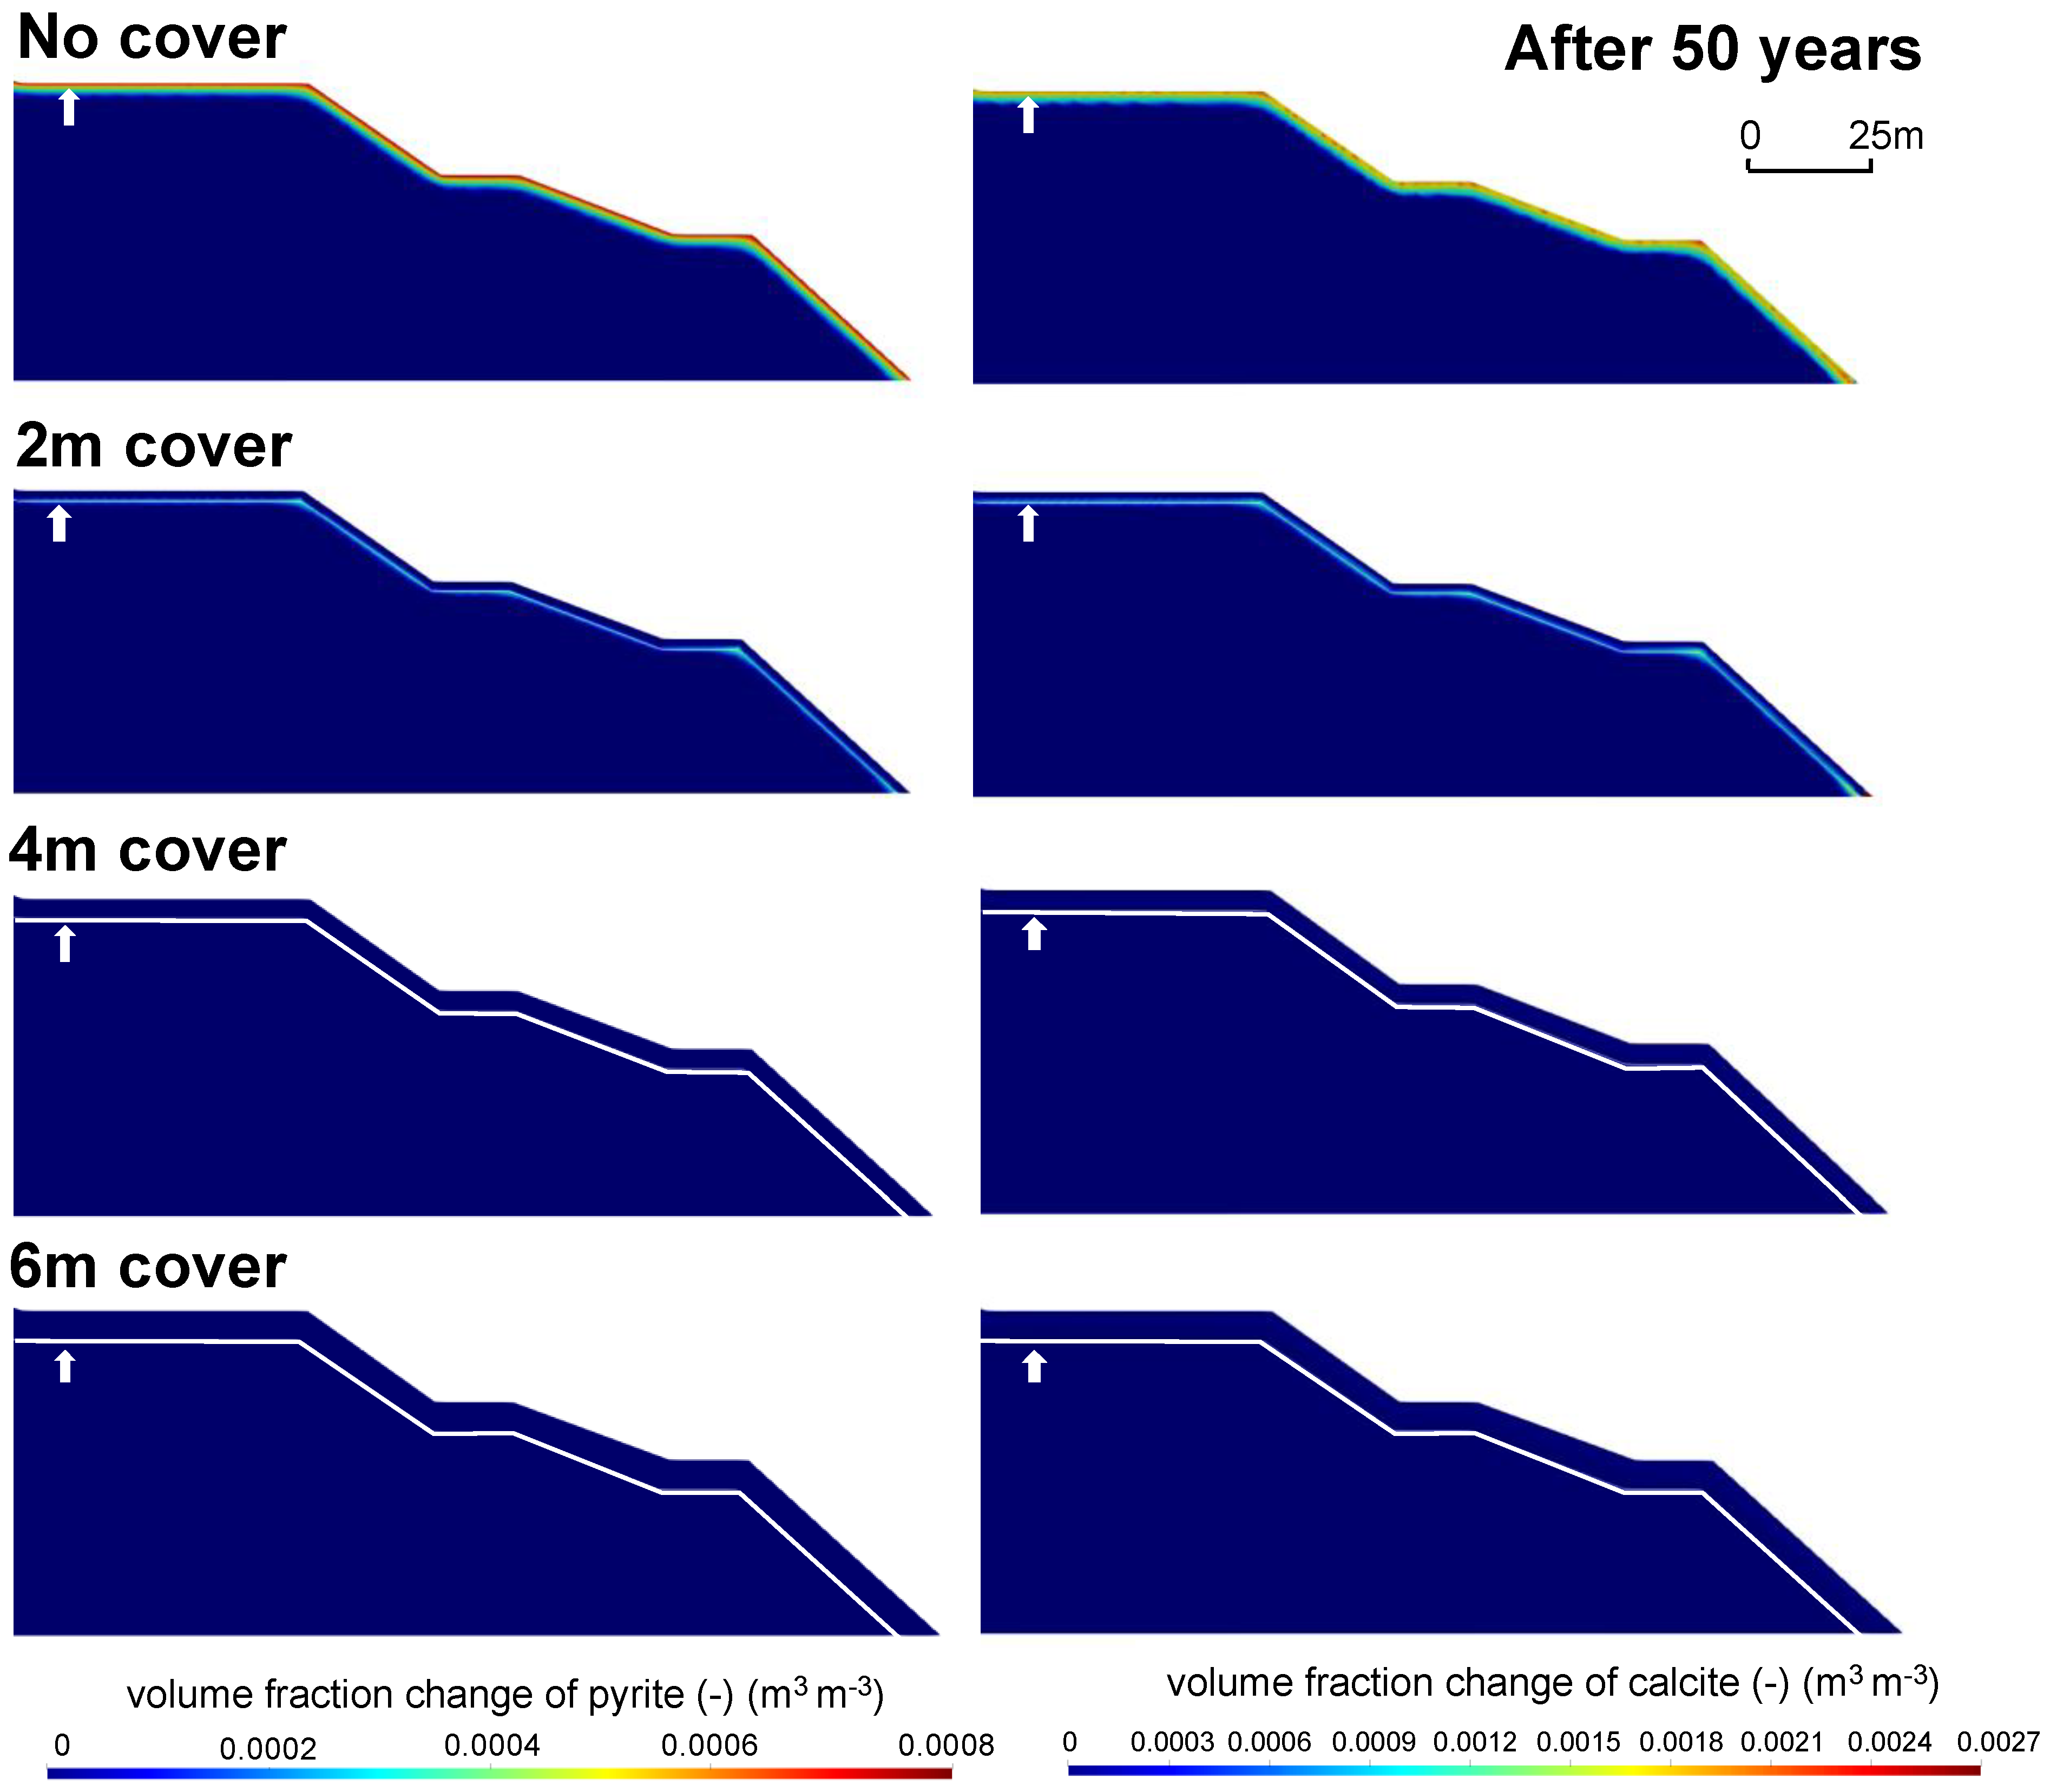
As a function of the presence of the cover and cover thickness, the occurrence of freeze-thaw cycles in the active layer affects geochemical processes within the WRP in different ways. Simulated changes of pyrite volume fractions in the no-cover and 2 m-cover scenarios indicate pyrite oxidation is occurring in the sulfide-bearing rock during the summer months (Figure A5, Appendix C). Pyrite oxidation is more extensive in the no-cover scenario since the active layer is entirely in the PAG material, whereas the active layer in the 2 m cover scenario straddles both NPAG and PAG materials, which leads to a thin zone of pyrite oxidation immediately below the cover. However, with thicker cover designs (4 and 6 m cover scenarios), barely any pyrite is oxidized due to persistent frozen conditions in the PAG waste rock over the 50-year simulation period. The oxidation of pyrite during the warm seasons in the no-cover and 2 m cover scenarios release sulfate, as shown in Figure 9. As expected, sulfate concentrations are the highest in the active layer of the no-cover scenario. In the 2 m cover scenario, the release of sulfate is concentrated in the PAG-material located directly below the cover with some spreading into the cover material, which results from mixing in response to lateral flow as well as solute diffusion. In this case, sulfate release is most visible the uppermost bench (Figure A5, Appendix C), followed by a downslope flushing with infiltrating water. However, the covered pile in the 4 m- and 6 m-cover designs remain sulfate-free, because pyrite oxidation does not occur in the long-term.
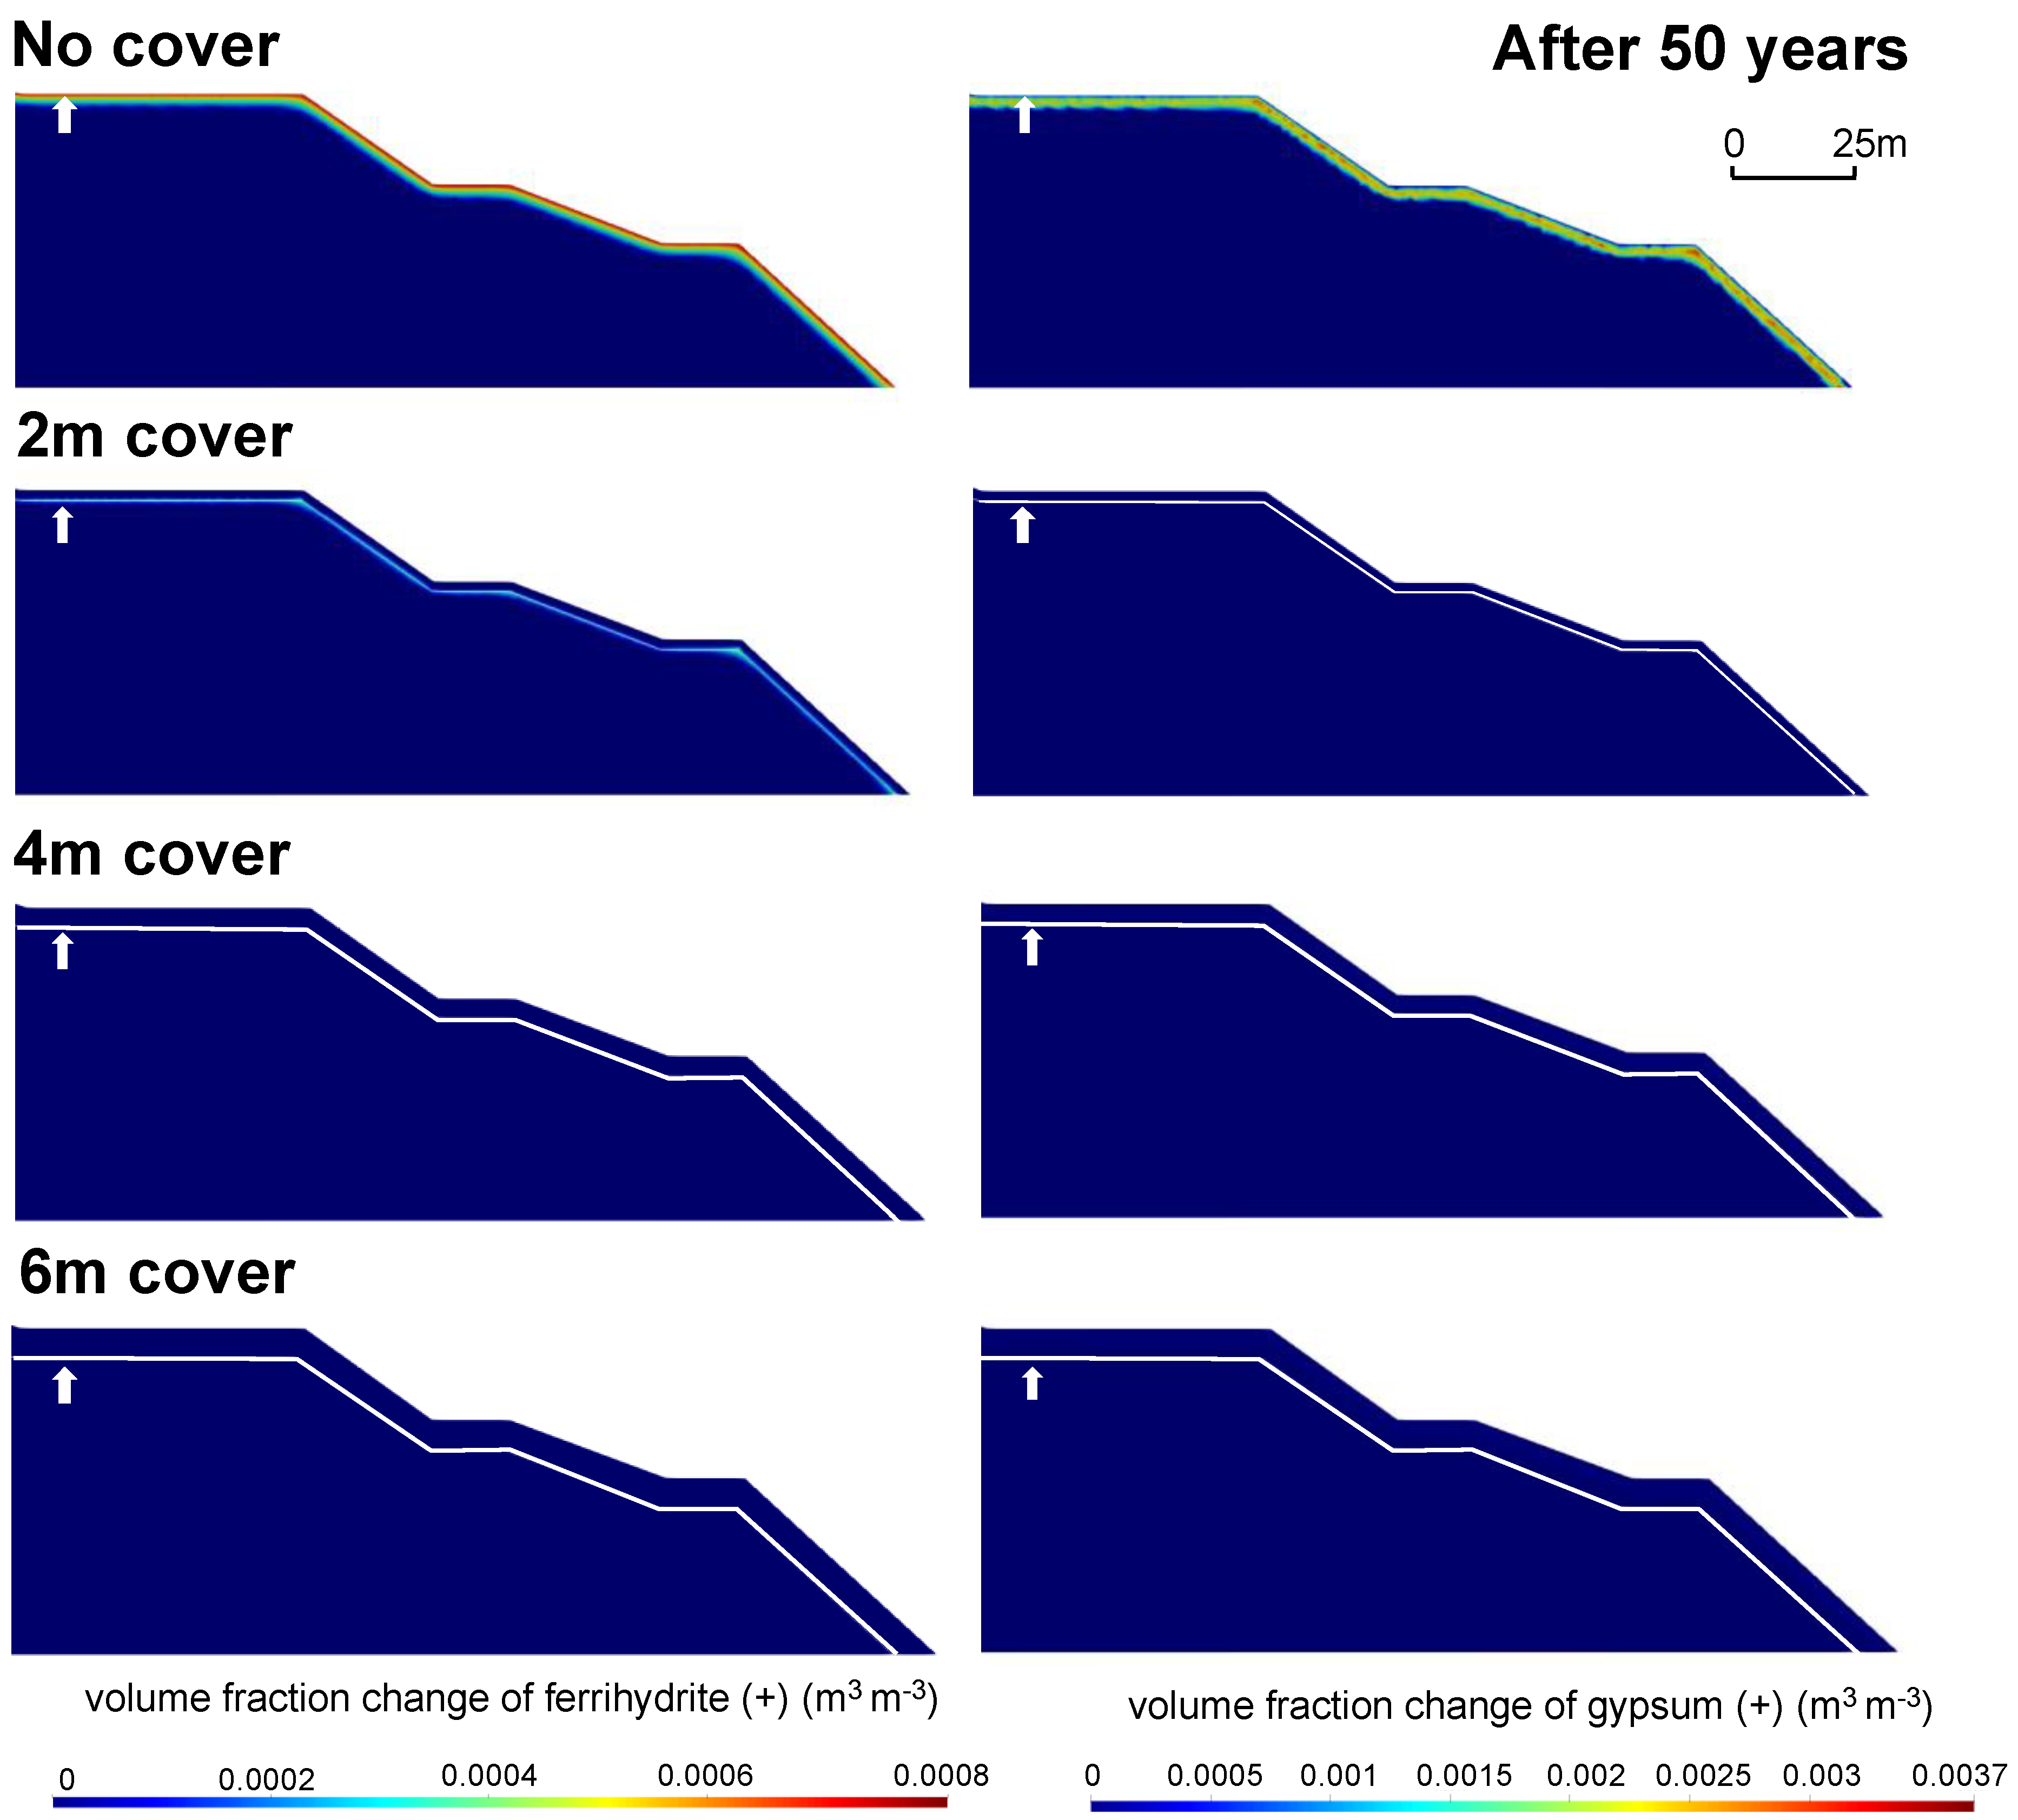
Both the cover material and PAG waste rock contain carbonate materials. The dissolution of calcite, as the sole carbonate mineral included in the model, was tightly correlated with pyrite oxidation and sulfate production as seen in Figure 9. In the no-cover scenario, pyrite oxidation in the active layer promotes calcite dissolution to buffer acidity. Iron, calcium, and sulfate produced from pyrite oxidation along with calcite dissolution drives the secondary precipitation of both ferrihydrite and gypsum (Figure A6 and Figure A7, Appendix C). Although pH is buffered in the no cover and 2 m cover scenarios, pH is lower than in the other scenarios, because pyrite oxidation adds acidity to the system. For the 4m- and 6m-cover scenarios, calcite dissolution leads to mildly basic conditions in the cover.
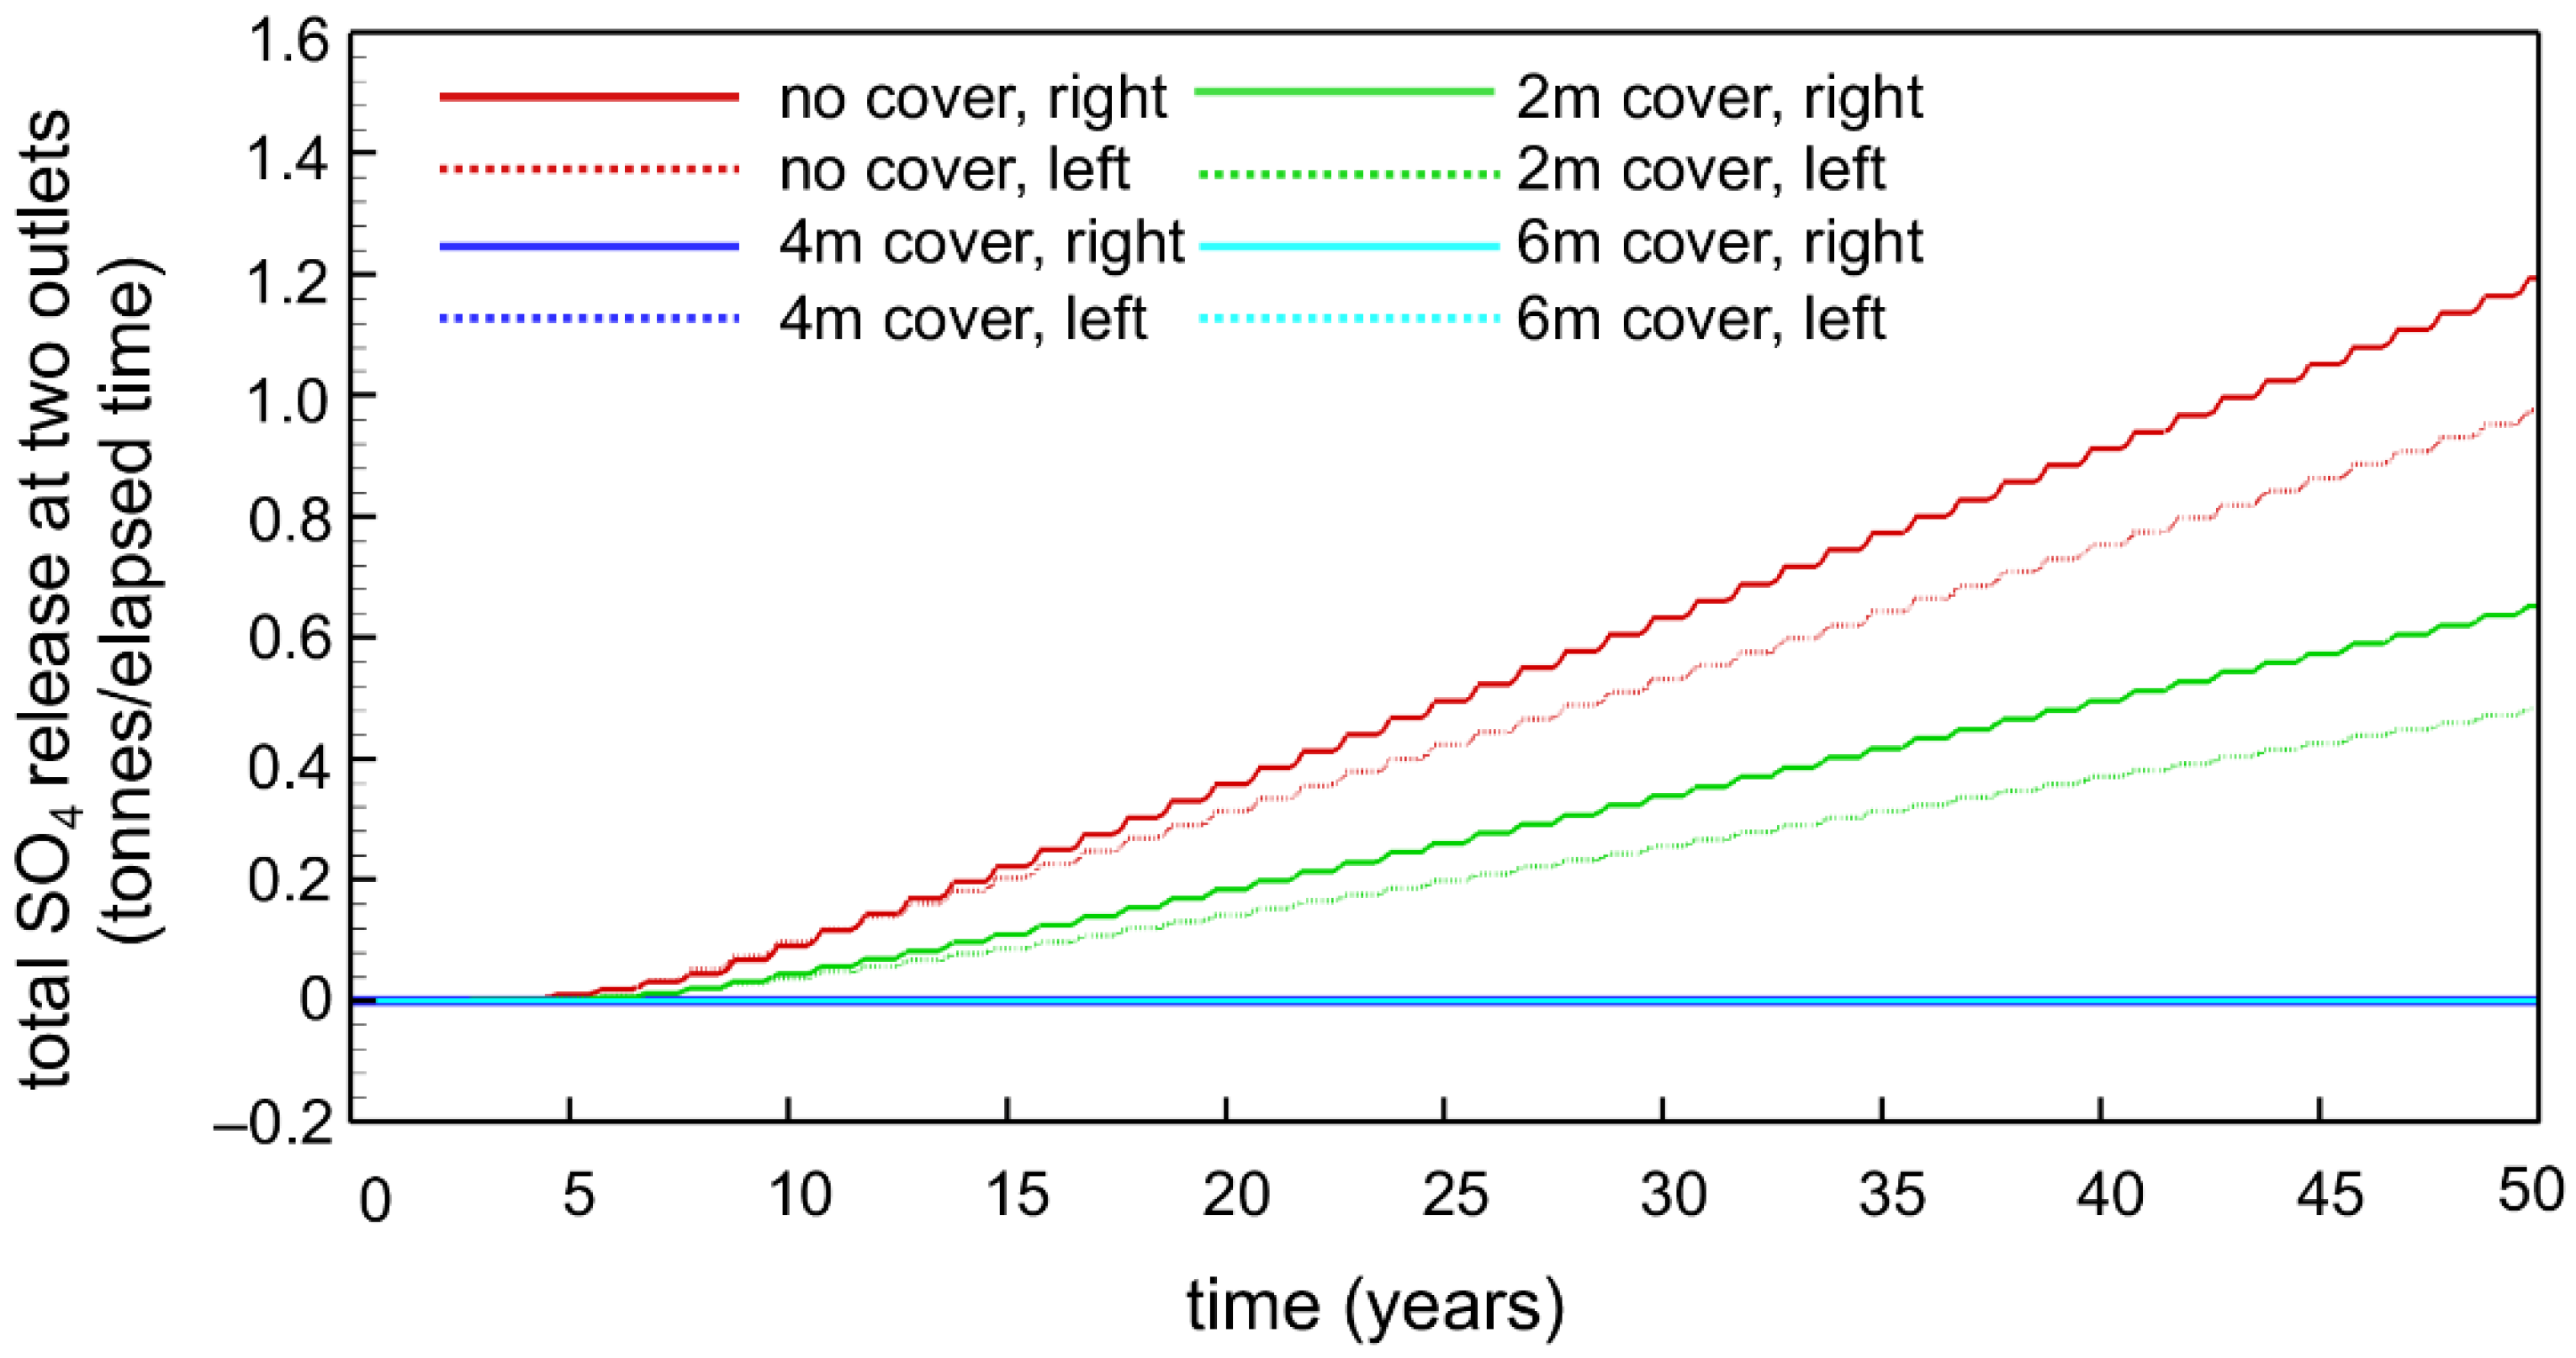
Geochemical reactions occurring within the PAG waste rock control the effluent geochemistry at the toes of the pile (Figure 10). Results for both the 4 m and 6 m cover designs indicate that basal drainage remains nearly free of dissolved sulfate over the 50-year simulation period. However, the simulations also show that sulfate mass loadings in basal drainage are higher for the 2 m cover and the no-cover scenarios. In addition, sulfate mass loadings are not equally distributed at each of the toes of the pile due to pile geometry (longer and gentler slope on the right side). Although simplifications have been made regarding the mineralogical composition and corresponding reactions, the sensitivity analysis is helpful at illustrating the effectiveness of thermal covers in a geochemical and mass loading context. The simulations results suggest that for the climate conditions and materials considered, a cover with a thickness of less than 4 m would likely allow the active layer to extend into the PAG material, possibly leading to the release of the contaminated drainage at the toes of the pile. It is reassuring to note that there were negligible differences in mass loadings between 4 and 6 m cover designs.
5.4. Implications for Cover Design and Construction
The base case simulation results, which are constrained by experimental data and field measurements, provide insights into the coupled processes occurring in sulfide-bearing WRPs in permafrost environments. The results forecasted by the model illustrate the influences of freeze-thaw cycles on flow, thermal, and geochemical regimes of the covered pile in the short term, consistent with available observations for a four-year time period. Long-term simulations suggest that, for the given climate conditions and material parameters, conditions in the WRP will remain stable, subject to seasonally driven dynamic equilibrium conditions. Although some assumptions had to be made regarding infiltration rates and uncertainties regarding the magnitude and temporal distribution of infiltration remains, the simulations indicate that the performance of thermal covers is not very sensitive to infiltration. The simulation results suggest that the thickness of the active layer is not significantly affected by uncertainties in infiltration rates, with impacts mostly restricted to changes in the shallow active layer flow system. In this context, the results indicate that the impacts of infiltration on mass loadings are likely limited, as long as the active layer remains entirely within the thermal cover. Additional sensitivity analysis related to the cover design demonstrates the functions and effectiveness of the thermal cover as a unique reclamation approach commonly used for WRPs in cold-region climates. The simulation results confirm and provide confidence in the cover’s ability to prevent the sulfide-bearing waste rock from being oxidized and to effectively manage the effluent quality in the long-term. Simulated results for mass loadings also imply that the drainage quality is affected by the cover thickness. In general, the overall results from this study indicate that modeling can be used as a guiding tool to help identify and design suitable reclamation approaches. Different scenarios can be simulated in the design planning stage, prior to the costly construction of field experimental studies, and the simulation results can provide insights into the ability of different proposed cover designs to control potential ARD/CND. Reactive transport modeling of thermal-hydrological and geochemical processes can be used to address parameter uncertainties, assess different future scenarios, and illustrate thermal, hydrological, and geochemical processes in WRPs.
6. Conclusions
In addition to experimental or field tests, RTM provides a versatile tool for assessing the performance of thermal covers in permafrost environments and their impact on limiting sulfide mineral oxidation and mass loadings. MIN3P-HPC, the modeling tool used in this study, has the ability of to simulate thermo-hydrological-geochemical interactions in a covered WRP under permafrost conditions. Simulation results provide insights and also build confidence for using modeling to analyze other similar scenarios through sensitivity and uncertainty analyses.
This study demonstrates the capabilities of MIN3P-HPC to simulate the problems related to mine waste in permafrost regions undergoing frequent freeze-thaw cycles. Freeze-thaw processes and their impact on water flow, geochemical reactions, and mass transport are incorporated into the code, facilitating an integrated assessment of these coupled processes. The recently added capability of unstructured grids allows to consider complex geometries with angled surfaces and multiple layers, common at mine sites. Future studies on thermal cover performance in cold-region climates could address additional complexity, by considering physical and chemical heterogeneity, a more detailed geochemical reaction network, and climate warming. In addition, future simulations could consider insulating effects of seasonal snow covers, which may aid to further improving the understanding of covered and uncovered WRPs in cold-region climates, and the prognostic value of the model.
Author Contributions
Conceptualization, X.Y., K.U.M. and D.S.; data curation and methodology, experimental work, laboratory measurements, B.B.; computer simulations by X.Y. with guidance from D.S. and K.U.M.; code development by X.Y. with assistance from D.S.; validation, X.Y., K.U.M. and D.S. with site-specific guidance from B.B.; formal analysis and investigation, X.Y. and K.U.M.; resources, B.B., K.U.M., and D.S.; writing—original draft preparation, X.Y.; writing—review and editing, K.U.M. and B.B.; visualization, X.Y. and D.S.; supervision, K.U.M.; funding acquisition, K.U.M. and B.B. All authors have read and agreed to the published version of the manuscript.
Funding
This research was funded by the Natural Sciences and Engineering Research Council of Canada (NSERC) through the strategic network grant “Toward Environmentally Responsible Resource Extraction Network (TERRE-NET)” (Program director D.W. Blowes), grant number 479708-2015.
Acknowledgments
The Meadowbank mine geotechnical team is greatly appreciated for their involvement and collaboration throughout the project. K. Raymond at UBC is also thanked for the assistance with the manuscript.
Conflicts of Interest
The authors declare no conflict of interest. The funders had no role in the design of the study; in the collection, analyses, or interpretation of data; in the writing of the manuscript, or in the decision to publish the results.
Appendix A. Material Properties
Figure A1.
Estimated water retention curves with parameters for both NPAG and PAG materials, based on laboratory data reported in [37].
Figure A1.
Estimated water retention curves with parameters for both NPAG and PAG materials, based on laboratory data reported in [37].


Table A1.
Mineralogical composition.
| Mineral 1 | Volume Fraction | |
|---|---|---|
| NPAG | PAG | |
| Actinolite | 0.054 [35] | - |
| Calcite | 0.052 [35] | 0.028 [35] |
| Chlorite | 0.178 [35] | 0.105 [35] |
| Dolomite | 0.117 [35] | 0.025 [35] |
| Magnetite | - | 0.034 [35] |
| Muscovite | - | 0.052 [35] |
| Quartz | 0.047 [35] | 0.334 [35] |
| Pyrite | - | 0.002 [35] |
| Talc | 0.198 [35] | 0.050 [35] |
| Stilpnomelane | - | 0.081 [35] |
| Other Parameters | ||
| Ssulfide (%) | 0.03 [37] | 0.36 [37] |
| Ctotal (%) | 1.92 [37] | 0.27 [37] |
| AP (kg CaCO3/t) | 1.0 [37] | 11 [37] |
| NP (kg CaCO3/t) | 120 [37] | 20 [37] |
| NP/AP | 120 [37] | 1.8 [37] |
1 Calculated volume fractions of mineral phases from weight fraction (wt. %) reported in [35].
Appendix B. Initial Conditions and Boundary Conditions
Figure A2.
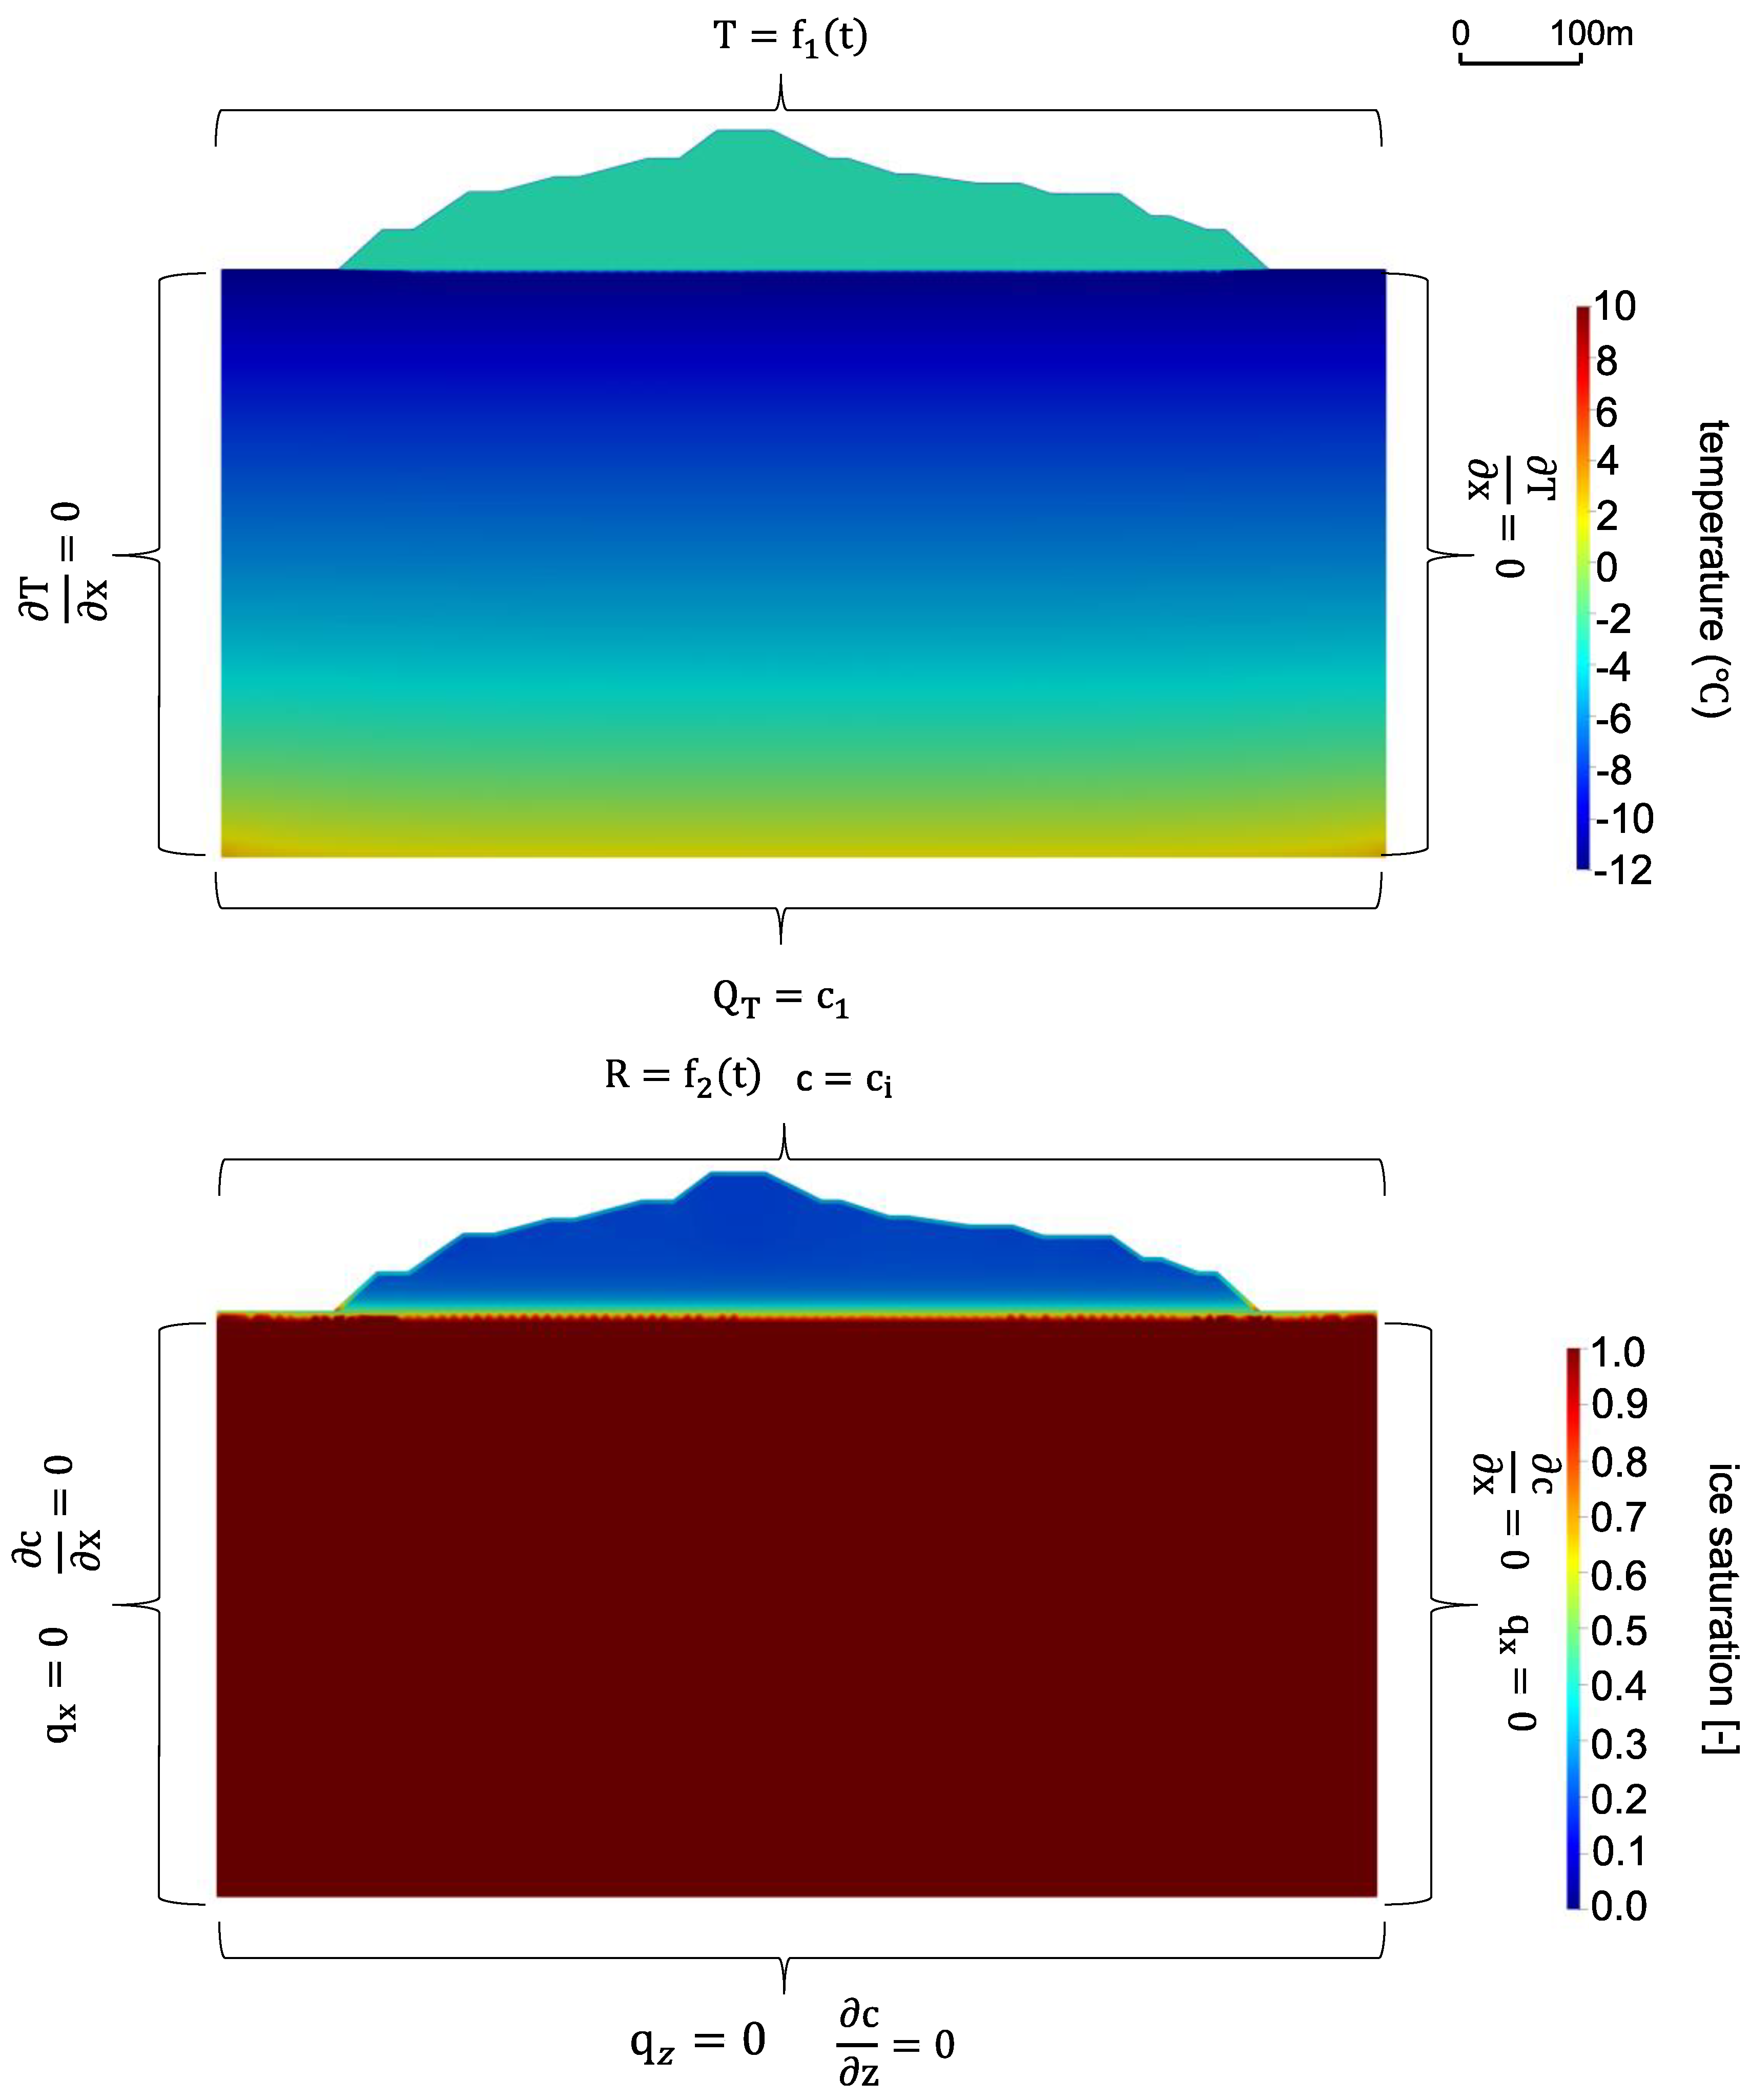
Initial conditions for ice saturation and temperature. Initial temperature given to the WRP is assumed homogeneous with a temperature of −3 °C, while the temperature of natural soil was simulated with MAAT = −11.4 °C at the surface and geothermal heat flux of −0.087 W m−2 at the base until reaching a steady state. Initial ice saturation of the system was estimated based on the water retention curves for NPAG and PAG materials as well as the underlying soil. Boundary conditions for flow, reactive transport, and heat transport are assigned at each boundary. Transient flow and temperature boundaries were assigned at the surface, while a constant geothermal heat flux boundary was assigned at the base. Other boundaries were assumed as impermeable for flow and transport.
Figure A2.
Initial conditions for ice saturation and temperature. Initial temperature given to the WRP is assumed homogeneous with a temperature of −3 °C, while the temperature of natural soil was simulated with MAAT = −11.4 °C at the surface and geothermal heat flux of −0.087 W m−2 at the base until reaching a steady state. Initial ice saturation of the system was estimated based on the water retention curves for NPAG and PAG materials as well as the underlying soil. Boundary conditions for flow, reactive transport, and heat transport are assigned at each boundary. Transient flow and temperature boundaries were assigned at the surface, while a constant geothermal heat flux boundary was assigned at the base. Other boundaries were assumed as impermeable for flow and transport.

Appendix C. Results of Sensitivity Analysis to Cover Thickness
Figure A3.
Log-scale sulfate concentrations for base case after 50 years (i.e., sulfate concentrations shown in Figure 6 are presented here in log-scale). The purpose of this figure is to highlight the limited sulfate content at the breaks of between some of the benches and slopes. The white arrows indicate the interface between waste rock and cover materials.

Figure A4.
Comparison of internal temperature fluctuations over time between the base case (4 m cover) and the no cover scenario in the short term. The depth is measured from the surface of PAG waste rock.
Figure A4.
Comparison of internal temperature fluctuations over time between the base case (4 m cover) and the no cover scenario in the short term. The depth is measured from the surface of PAG waste rock.

Figure A5.
Sulfate concentrations for the four cover scenarios. In the 2 m-cover scenario, high sulfate content in the top bench is only observed near the interface between cover and waste rock, indicating that the active layer partially extends into the sulfide-bearing waste rock. The broader spread of sulfate concenatrtions into the cover in the lower benches is due to mixing processes occuring during lateral drainage. The white line and white arrows indicate the interface between waste rock and cover materials.

Figure A6.
Simulated contours of volumetric fraction changes of primary minerals, pyrite and calcite, for no cover, 2 m cover, and 6m cover scenarios compared to the base case with 4 m cover in the summer after 50 years. The negative sign (-) represents mineral dissolution. Only part of the pile is shown for illustrative purposes. The white line and white arrows indicate the interface between waste rock and cover materials.

Figure A7.
Simulated contours of volumetric fraction changes of secondary minerals, ferrihydrite and gypsum, for no cover, 2 m cover, and 6m cover scenarios compared to the base case with a 4 m cover in the summer after 50 years. The positive sign (+) represents mineral precipitation. Only part of the pile is shown for illustrative purposes. The white line and white arrows indicate the interface between waste rock and cover materials.

References
- Amos, R.T.; Blowes, D.W.; Bailey, B.L.; Sego, D.C.; Smith, L.; Ritchie, A.I.M. Waste-rock hydrogeology and geochemistry. Appl. Geochem. 2015, 57, 140–156. [Google Scholar] [CrossRef]
- Vriens, B.; St. Arnault, M.; Laurenzi, L.; Smith, L.; Mayer, K.U.; Beckie, R.D. Localized sulfide oxidation limited by oxygen supply in a full-scale waste-rock pile. Vadose Zone J. 2018, 17, 180119. [Google Scholar] [CrossRef]
- Lefebvre, R.; Hockley, D.; Smolensky, J.; Lamontagne, A. Multiphase transfer processes in waste rock piles producing acid mine drainage. 2. Applications of numerical simulation. J. Contam. Hydrol. 2001, 52, 165–186. [Google Scholar] [CrossRef]
- Demers, I.; Mbonimpa, M.; Benzaazoua, M.; Bouda, M.; Awoh, S.; Lortie, S.; Gagnon, M. Use of acid mine drainage treatment sludge by combination with a natural soil as an oxygen barrier cover for mine waste reclamation: Laboratory column tests and intermediate scale field tests. Miner. Eng. 2017, 107, 43–52. [Google Scholar] [CrossRef]
- MEND. Acid mine drainage in permafrost regions: Issues, control strategies and research requirements. In MEND Project 1.61.2; MEND: Smithers, BC, Canada, 1996; pp. 25–35. [Google Scholar]
- Bussière, B. Acid mine drainage from abandoned mine sites: Problematic and reclamation approaches. In Advances in Environmental Geotechnics; Springer: Berlin/Heidelberg, Germany, 2010; pp. 111–125. [Google Scholar] [CrossRef]
- Bussière, B.; Guittonny, M. Hard Rock Mine Reclamation: From Prediction to Management of Acid Mine Drainage; Bussière, B., Guittonny, M., Eds.; CRC Press: Boca Raton, FL, USA, 2020; Chapter 4–9; pp. 1–15, 93–222. [Google Scholar]
- Lin, S.M.; Hayward, G.; Leonard, S.; Gene, S. Electrochemical cover for the prevention of acid mine drainage—A laboratory test. In Proceedings of the Sudbury 2003 Mining and the Environment Conference, Sudbury, ON, Canada, 25–28 May 2003. [Google Scholar]
- Kyhn, C.; Elberling, B. Frozen cover actions limiting AMD from mine waste deposited on land in Arctic Canada. Cold Reg. Sci. Technol. 2001, 32, 133–142. [Google Scholar] [CrossRef]
- MEND. Mine waste covers in cold regions. In MEND Report 1.16.5a; MEND: Smithers, BC, Canada, 2009; pp. 35–54. [Google Scholar]
- Woo, M. Permafrost Hydrology; Springer: Berlin/Heidelberg, Germany, 2012; Volume 110, pp. 5–15. ISBN 9788578110796. [Google Scholar]
- Boulanger-Martel, V.; Bussière, B.; Côté, J. Thermal behaviour and performance of two field experimental insulation covers to control sulfide oxidation at Meadowbank mine, Nunavut. Can. Geotech. J. 2020, 58, 427–440. [Google Scholar] [CrossRef]
- Pham, H.N. Heat Transfer in Waste Rock Piles Construted in a Contiuous Permafrost Region. Ph.D. Thesis, University of Alberta, Edmonton, AB, Canada, 2013. [Google Scholar]
- Stevens, C.W.; Shapka-Fels, T.; Rykaart, M. Thermal Cover Design for Mine Waste Facilities in Cold Regions. 2018. Available online: https://www.srk.com/en/publications/thermal-cover956design-for-mine-waste-facilities-in-cold-regions (accessed on 30 September 2018).
- Lefebvre, R.; Hockley, D.; Smolensky, J.; Geélinas, P. Multiphase transfer processes in waste rock piles producing acid mine drainage. 1: Conceptual model and system characterization. J. Contam. Hydrol. 2001, 52, 137–164. [Google Scholar] [CrossRef]
- Lahmira, B.; Lefebvre, R.; Aubertin, M.; Bussière, B. Effect of heterogeneity and anisotropy related to the construction method on transfer processes in waste rock piles. J. Contam. Hydrol. 2016, 184, 35–49. [Google Scholar] [CrossRef]
- Ramasamy, M.; Power, C.; Mkandawire, M. Numerical prediction of the long-term evolution of acid mine drainage at a waste rock pile site remediated with an HDPE-lined cover system. J. Contam. Hydrol. 2018, 216, 10–26. [Google Scholar] [CrossRef] [PubMed]
- Molson, J.; Aubertin, M.; Bussière, B.; Benzaazoua, M. Geochemical transport modelling of drainage from experimental mine tailings cells covered by capillary barriers. Appl. Geochem. 2008, 23, 1–24. [Google Scholar] [CrossRef]
- Ouangrawa, M.; Molson, J.; Aubertin, M.; Bussière, B.; Zagury, G.J. Reactive transport modelling of mine tailings columns with capillarity-induced high water saturation for preventing sulfide oxidation. Appl. Geochem. 2009, 24, 1312–1323. [Google Scholar] [CrossRef]
- Bea, S.A.; Wilson, S.A.; Mayer, K.U.; Dipple, G.M.; Power, I.M.; Gamazo, P. Reactive transport modeling of natural carbon sequestration in ultramafic mine tailings. Vadose Zone J. 2012, 11, vzj2011.0053. [Google Scholar] [CrossRef]
- Demers, I.; Molson, J.; Bussière, B.; Laflamme, D. Numerical modeling of contaminated neutral drainage from a waste-rock field test cell. Appl. Geochem. 2013, 33, 346–356. [Google Scholar] [CrossRef]
- Wilson, D.; Amos, R.T.; Blowes, D.W.; Langman, J.B.; Smith, L.; Sego, D.C. Diavik Waste Rock Project: Scale-up of a reactive transport model for temperature and sulfide-content dependent geochemical evolution of waste rock. Appl. Geochem. 2018, 96, 177–190. [Google Scholar] [CrossRef]
- Raymond, K.E.; Seigneur, N.; Su, D.; Poaty, B.; Plante, B.; Mayer, K.U. Numerical modeling of a laboratory-scale waste rock pile featuring an engineered cover system. Minerals 2020, 10, 652. [Google Scholar] [CrossRef]
- Kurylyk, B.L.; Watanabe, K. The mathematical representation of freezing and thawing processes in variably-saturated, non-deformable soils. Adv. Water Resour. 2013, 60, 160–177. [Google Scholar] [CrossRef]
- McKenzie, J.M.; Voss, C.I.; Siegel, D.I. Groundwater flow with energy transport and water-ice phase change: Numerical simulations, benchmarks, and application to freezing in peat bogs. Adv. Water Resour. 2007, 30, 966–983. [Google Scholar] [CrossRef]
- Zhao, L.; Gray, D.M.; Male, D.H. Numerical analysis of simultaneous heat and mass transfer during Infiltration into Frozen Ground. J. Hydrol. 1997, 200, 345–363. [Google Scholar] [CrossRef]
- Voss, C.I.; Provost, A. Version of September 22, 2010 (SUTRA Version 2.2) Latest Version. USGS Water Resource Investigations Report 02-4231 2010. Available online: http://water.usgs.gov/nrp/gwsoftware (accessed on 1 September 2010).
- Mayer, K.U.; Frind, E.O.; Blowes, D.W. Multicomponent reactive transport modeling in variably saturated porous media using a generalized formulation for kinetically controlled reactions. Water Resour. Res. 2002, 38, 13-1–13-21. [Google Scholar] [CrossRef]
- Su, D.; Mayer, K.U.; MacQuarrie, K.T.B. Numerical investigation of flow instabilities using fully unstructured discretization for variably saturated flow problems. Adv. Water Resour. 2020, 143. [Google Scholar] [CrossRef]
- Awoh, S.A.; Bussière, B.; Batzenschlager, C.; Boulanger-Martel, V.; Lepine, T.; Voyer, E. Design, construction, and preliminary results of two insulation covers at the Meadowbank mine. Geo Chicago 2016, 2016, 185–194. [Google Scholar]
- Collette, L. Cryohydrogeology of a Covered Waste Rock Pile in Permafrost Environment: Large Scale Field Experiment and Freeze-Thaw Numerical Investigations. Master’s Thesis, University of British Columbia, Vancouver, BC, Canada, 2017. [Google Scholar]
- Mockus, V.; Mullem, J.A.V.; Garen, D.; Woodward, D.E. Chapter 11 Snowmelt. In USDA Part 630 Hydrology National Engineering Handbook; July 2004; pp. 11–12. Available online: https://directives.sc.egov.usda.gov/OpenNonWebContent.aspx?content=17753.wba (accessed on 25 May 2021).
- Elberling, B. Environmental controls of the seasonal variation ia oxygen uptake in sulfidic tailings deposited in a permafrost-affected area. Water Resour. Res. 2001, 37, 99–107. [Google Scholar] [CrossRef] [Green Version]
- Meldrum, J.L.; Jamieson, H.E.; Dyke, L.D. Oxidation of mine tailings from Rankin Inlet, Nunavut, at subzero temperatures. Can. Geotech. J. 2001, 38, 957–966. [Google Scholar] [CrossRef]
- Boulanger-Martel, V.; Bussière, B.; Côté, J.; Gagnon, P. Design, construction, and preliminary performance of an insulation cover with capillary barrier effects at Meadowbank mine, Nunavut. In Proceedings of the 70th Canadian Geotechnical Conference, Ottawa, ON, Canada, 1–10 October 2017; p. 354. [Google Scholar]
- Voyer, E.; Robert, S. Waste rock management and closure planning in Northern climate: The Meadowbank Mine, Nunavut. In Proceedings of the Symposium 2015 sur l’environnement et les mines, Rouyn-Noranda, Rouyn-Noranda, QC, Canada, 14–17 June 2015; Published by the Canadian Institute of Mining, Metallurgy and Petroleum (CIM): Ottawa, ON, Canada, 2015; pp. 1–15. [Google Scholar]
- Poirier, A. Étude du Comportement Thermique D’une Halde à Stériles en Milieu Nordique. Master’s Thesis, Université du Québec en Abitibi-Témiscamingue, Rouyn-Noranda, QC, Canada, 2019. [Google Scholar]
- Boulanger-martel, V.; Poirier, A.; Abitibi-témiscamingue, Q.; Côté, J.; Bussière, B. Thermal conductivity of Meadowbank’s mine waste rocks and tailings. In Proceedings of the 71th Canadian Geotechnical Conference, Edmonton, AB, Canada, 23–26 September 2018. [Google Scholar]
- Peregoedova, A. Étude Expérimentale des Propriétés Hydrogéologiques des Roches Stériles à une Échelle Intermédiaire de Laboratoire. Master’s Thesis, École Polytechnique de Montréal, Montréal, QC, Canada, 2012. [Google Scholar]
- Chapuis, R.P.; Masse, I.; Madinier, B.; Aubertin, M. A drainage column test for determining unsaturated properties of coarse materials. Geotech. Test. J. 2007, 30, 83–89. [Google Scholar] [CrossRef]
- Côté, J.; Konrad, J.M. Assessment of structure effects on the thermal conductivity of two-phase porous geomaterials. Int. J. Heat Mass Transf. 2009, 52, 796–804. [Google Scholar] [CrossRef]
- Côté, J.; Konrad, J.M. Indirect methods to assess the solid particle thermal conductivity of Quebec marine clays. Can. Geotech. J. 2007, 44, 1117–1127. [Google Scholar] [CrossRef]
- Côté, J.; Konrad, J.M. A generalized thermal conductivity model for soils and construction materials. Can. Geotech. J. 2005, 42, 443–458. [Google Scholar] [CrossRef]
- Van Genuchten, M.T.; Leij, F.J.; Yates, S.R. The RETC code for quantifying the hydraulic functions of unsaturated soils. Dep. Agric. Agric. Res. Serv. 1991, 65, 1–83. [Google Scholar]
- Henderson, T.H.; Mayer, K.U.; Parker, B.L.; Al, T.A. Three-dimensional density-dependent flow and multicomponent reactive transport modeling of chlorinated solvent oxidation by potassium permanganate. J. Contam. Hydrol. 2009, 106, 195–211. [Google Scholar] [CrossRef] [PubMed]
- Su, D.; Ulrich Mayer, K.; MacQuarrie, K.T.B. Parallelization of MIN3P-THCm: A high performance computational framework for subsurface flow and reactive transport simulation. Environ. Model. Softw. 2017, 95, 271–289. [Google Scholar] [CrossRef]
- Nicholson, R.V.; Gillham, R.W.; Reardon, E.J. Pyrite oxidation in carbonate-buffered solution: 1. Experimental kinetics. Geochim. Cosmochim. Acta 1988, 52, 1077–1085. [Google Scholar] [CrossRef]
- Arrhenius, S. Über die Dissociationswärme und den Einfluss der Temperatur auf den Dissociationsgrad der Elektrolyte. Z. Phys. Chem. 1889, 4, 96–116. [Google Scholar] [CrossRef] [Green Version]
- Xie, X.; Xiao, S.; He, Z.; Liu, J.; Qiu, G. Microbial populations in acid mineral bioleaching systems of Tong Shankou Copper Mine, China. J. Appl. Microbiol. 2007, 103, 1227–1238. [Google Scholar] [CrossRef] [PubMed]
- Yi, X. Reactive Transport Modeling of Waste Rock Weathering in Permafrost Environments. Master’s Thesis, University of British Columbia, Vancouver, BC, Canada, 2021. [Google Scholar]
- Booshehrian, A.; Wan, R.; Su, X. Hydraulic variations in permafrost due to open-pit mining and climate change: A case study in the Canadian Arctic. Acta Geotech. 2020, 15, 883–905. [Google Scholar] [CrossRef]
- Allison, J.D.; Brown, W.; Novo-Gradac, K.J. MINTEQA2/PRODEFA2, A Geochemical Assessment Model for Environmental Systems: Version 3.0 User’s Manual; EPA/600/3-91/021; Environmental Research Laboratory, U.S. Environmental Protectio Agency: Washington, DC, USA, 1991.
- Mayer, K.U.; Alt-Epping, P.; Jacques, D.; Arora, B.; Steefel, C.I. Benchmark problems for reactive transport modeling of the generation and attenuation of acid rock drainage. Comput. Geosci. 2015, 19, 599–611. [Google Scholar] [CrossRef]
- Amos, R.T.; Bailey, B.L.; Pham, H.N.; Fretz, N.; Hannam, S.; Blowes, D.W.; Sego, D.C.; Smith, L. Diavik Waste Rock Project: Northern Aspects and Scaling Predictions. In Proceedings of the 19th British Columbia MEND Metal Leaching/Acid Rock Drainage Workshop, Vancouver, BC, Canada, 28–29 November 2012. [Google Scholar]
- Chevé, N.; Guittonny, M.; Bussière, B. Water budget of field experimental cells with vegetated and non-vegetated soil layers placed on waste rock. Mine Clos. 2018, 2018, 549–562. [Google Scholar]
- Pham, N.H.; Sego, D.C.; Arenson, L.U.; Blowes, D.W.; Smith, L. Convective heat transfer in waste rock piles under permafrost environment. In Proceedings of the GeoEdmonton 2008: The 61th Canadian Geotechnical Conference, Edmonton, AB, Canada, 21–24 September 2008; pp. 940–947. [Google Scholar]
- Wilson, D.; Amos, R.T.; Blowes, D.W.; Langman, J.B.; Ptacek, C.J.; Smith, L.; Sego, D.C. Diavik waste rock project: A conceptual model for temperature and sulfide-content dependent geochemical evolution of waste rock—Laboratory scale. Appl. Geochem. 2018, 89, 160–172. [Google Scholar] [CrossRef]
Figure 1.
Simplified conceptual model of a waste rock pile subjected to a cold-region climate.

Figure 2.
Plan view of the waste rock pile at the Meadowbank mine site.

Figure 3.
Model configuration of 2D cross-section and grid discretization.

Figure 4.
Observed average daily air temperatures (Avg) for the period from 2014 to 2017 represented by a sinusoidal function (Sin fct).
Figure 4.
Observed average daily air temperatures (Avg) for the period from 2014 to 2017 represented by a sinusoidal function (Sin fct).

Figure 5.
Simulated temperatures compared to the observed temperatures at RSF-6, RSF-4, RSF-5, RSF-16, RSF-15 from January 2014 and October 2017.
Figure 5.
Simulated temperatures compared to the observed temperatures at RSF-6, RSF-4, RSF-5, RSF-16, RSF-15 from January 2014 and October 2017.

Figure 6.
Simulated contours of temperature, ice saturation, water saturation, pH, dissolved sulfate and calcium in the summer after 50 years (i.e., 2064). The white line and white arrows indicate the interface between waste rock and cover materials. The contours were cropped to more clearly illustrate the differences at the basal drainage location.

Figure 7.
Simulated contours of ice and water saturations with reduced or increased infiltration rates compared to the base case in the summer after 50 years. The grey arrows represent the Darcy flux vectors. The contours were cropped to more clearly illustrate the differences at the basal drainage location. The white line and white arrows indicate the interface between waste rock and cover materials.

Figure 8.
Simulated contours of temperature, ice saturation, and water distributions for no cover, 2 m cover, and 6 m cover scenarios compared to the base case with 4 m cover in the summer after 50 years. The white line and white arrows indicate the interface between waste rock and cover materials, where applicable.

Figure 9.
Simulated contours of sulfate concentration, calcium concentration, and pH for four cover scenarios in the summer after 50 years. The white line and white arrows indicate the interface between waste rock and cover materials, where applicable.
Figure 9.
Simulated contours of sulfate concentration, calcium concentration, and pH for four cover scenarios in the summer after 50 years. The white line and white arrows indicate the interface between waste rock and cover materials, where applicable.

Figure 10.
Mass loadings of sulfate at two basal drainage locations for four cover design for the 50-year simulation period.
Figure 10.
Mass loadings of sulfate at two basal drainage locations for four cover design for the 50-year simulation period.

Table 1.
Hydrogeological, thermal and selected geochemical model parameters.
| Properties | Symbols & Units | NPAG | PAG | Natural Terrain | |
|---|---|---|---|---|---|
| Thickness/Height | L/m | 4 m [37] | 118 m [37] | 500 m [50] | |
| Porous medium | |||||
| Residual saturation | /unitless | 0.08 1 [37] | 0.1 1 [37] | 0.1 [50] | |
| Van Genuchten α factor | /m−1 | 0.22 1 [37] | 0.64 1 [37] | 4.6 [50] | |
| Van Genuchten n factor | /unitless | 1.65 1 [37] | 1.70 1 [37] | 1.35 [50] | |
| Saturated hydraulic conductivity at reference temperature (25 °C) | /m s−1 | 7.9 × 10⁻⁴ [37] | 1.6 × 10⁻³ [37] | 7.4 [50] | |
| Porosity | /unitless | 0.39 [37] | 0.31 [37] | 0.30 [50] | |
| Free-phase aqueous diffusion coefficient | / | 2.1 × 10⁻⁹ [15] | |||
| Heat transport | |||||
| Thermal conductivity of water 2 | /W·m−1·°C−1 | 0.6 | |||
| Thermal conductivity of solid | /W·m−1·°C−1 | 4.8 [35] | 5.3 [35] | 2.0 [50] | |
| Heat capacity of water 2 | /J·kg−1·°C−1 | 4180 | |||
| Heat capacity of air | J·kg−1·°C−1 | 1010 | |||
| Heat capacity of solid | /J·kg−1·°C−1 | 1400 [37] | 1600 [37] | 1093 [50] | |
| Bulk density of solid phase | /kg·m–3 | 1763 [37] | 2015 [37] | 1750 [50] | |
| Threshold temperature for pyrite oxidation | /°C | 0 [50] | |||
| Pyrite oxidation | |||||
| Volume fraction of pyrite | /unitless | - | 0.002 [35] | - | |
| Standard exothermic heat | /kJ·mol−1 pyrite | - | 1409 [15] | - | |
| Arrhenius activation energy | /kJ·mol−1 pyrite | - | 64 | - | |
| Volume fraction of calcite | /unitless | 0.19 [35] | 0.06 [35] | - | |
1 Estimated porous-medium parameters based on laboratory data report in [37]. 2 Thermal conductivity and heat capacity of water have been applied to both water and ice.
Table 2.
Primary and secondary minerals with their rate expressions, stoichiometries, equilibrium constants (Ki), and effective rate constants () at 25 °C.
Table 2.
Primary and secondary minerals with their rate expressions, stoichiometries, equilibrium constants (Ki), and effective rate constants () at 25 °C.
| Mineral | Reaction | Rate Expression | logKi | |
|---|---|---|---|---|
| Primary mineral reactions | ||||
| Pyrite | - | −9.6 [50] | ||
| Calcite | −8.48 [52] | −7.3 [53] | ||
| Secondary mineral reactions | ||||
| gypsum | 4.89 [52] | −7.0 [53] | ||
| ferrihydrite | −4.58 [52] | −7.0 [53] | ||
Table 3.
Yearly cumulative precipitation (rainfall and snowfall) with corresponding event durations between 2014 and 2017 [37].
Table 3.
Yearly cumulative precipitation (rainfall and snowfall) with corresponding event durations between 2014 and 2017 [37].
| Year | Rainfall | Snowfall 1 | ||
|---|---|---|---|---|
| Event Duration (Days) | Cumulative Precipitation (mm) | Event Duration (Days) | Cumulative Precipitation (mm) | |
| 2014 | 138 | 116 | 227 | 118 |
| 2015 | 115 | 127 | 250 | 178 |
| 2016 | 122 | 166 | 243 | 135 |
| 2017 | 141 | 137 | 224 | 113 |
| Average rate (mm day−1) | 1.06 | 0.58 | ||
1 Snowfall reported as rainfall equivalents.
Table 4.
Infiltration uncertainty analysis.
| Case # | Rainfall | Snowfall | Precipitation | ||||
|---|---|---|---|---|---|---|---|
| Infiltration Fraction (% of Rainfall) | Rain Infiltration (mm day−1) | Snowpack Fraction (% of Snowfall) | Infiltration Fraction (% of Snowpack) | Snowmelt Infiltration (mm day−1) | Infiltration 1 (mm day−1) | Infiltration 2 (mm day−1) | |
| Reduced | 10 | 0.11 | 5 | 10 | 0.02 | 0.13 | 0.11 |
| Base | 30 | 0.32 | 25 | 50 | 0.55 | 0.87 | 0.32 |
| Increased | 50 | 0.53 | 45 | 90 | 1.78 | 2.31 | 0.53 |
1 Infiltration rate during first month of spring thaw. 2 Infiltration rate during other months with above-freezing average daily air temperatures.
Publisher’s Note: MDPI stays neutral with regard to jurisdictional claims in published maps and institutional affiliations. |
© 2021 by the authors. Licensee MDPI, Basel, Switzerland. This article is an open access article distributed under the terms and conditions of the Creative Commons Attribution (CC BY) license (https://creativecommons.org/licenses/by/4.0/).
Share and Cite
MDPI and ACS Style
Yi, X.; Su, D.; Bussière, B.; Mayer, K.U. Thermal-Hydrological-Chemical Modeling of a Covered Waste Rock Pile in a Permafrost Region. Minerals 2021, 11, 565. https://0-doi-org.brum.beds.ac.uk/10.3390/min11060565
AMA Style
Yi X, Su D, Bussière B, Mayer KU. Thermal-Hydrological-Chemical Modeling of a Covered Waste Rock Pile in a Permafrost Region. Minerals. 2021; 11(6):565. https://0-doi-org.brum.beds.ac.uk/10.3390/min11060565
Chicago/Turabian StyleYi, Xueying, Danyang Su, Bruno Bussière, and K. Ulrich Mayer. 2021. "Thermal-Hydrological-Chemical Modeling of a Covered Waste Rock Pile in a Permafrost Region" Minerals 11, no. 6: 565. https://0-doi-org.brum.beds.ac.uk/10.3390/min11060565
Note that from the first issue of 2016, this journal uses article numbers instead of page numbers. See further details here.