Article

An Interval Type-2 Fuzzy Logic Approach for Dynamic Parameter Adaptation in a Whale Optimization Algorithm Applied to Mathematical Functions

by
Leticia Amador-Angulo
and
Oscar Castillo
*
Division of Graduate Studies and Research, Tijuana Institute of Technology, TecNM, Tijuana 22379, Mexico
*
Author to whom correspondence should be addressed.
Submission received: 30 November 2023 / Revised: 26 December 2023 / Accepted: 28 December 2023 / Published: 31 December 2023
(This article belongs to the Special Issue Advances in Mathematical Optimization Algorithms and Its Applications)

Abstract

:
In this paper, an improved whale optimization algorithm (WOA) based on the utilization of an interval type-2 fuzzy logic system (IT2FLS) is presented. The main idea is to present a proposal for adjusting the values of the r 1 and r 2 parameters in the WOA using an IT2FLS to achieve excellent results in the execution of the WOA. The original WOA has already proven itself as an algorithm with excellent results; therefore, a wide variety of improvements have been made to it. Herein, the main purpose is to provide a hybridization of the WOA algorithm employing fuzzy logic to find the appropriate values of the r 1 and r 2 parameters that can optimize the mathematical functions used in this study, thereby providing an improvement to the original WOA algorithm. The performance of the fuzzy WOA using IT2FLS (FWOA-IT2FLS) shows good results in the case study of the benchmark function optimization. An important comparative with other metaheuristics is also presented. A statistical test and the comparative with other bio-inspired algorithms, namely, the original WOA with type-1 FLS (FWOA-T1FLS) are analyzed. The performance index used is the average of the minimum errors in each proposed method.

1. Introduction

In recent years, metaheuristic algorithms have been utilized and implemented to solve many complex problems. In this paper, a popular and efficient benchmark set of mathematical functions is used, which has been utilized by many authors to analyze and verify their proposed methods. For example, in [1], a tuna search optimization is demonstrated to have excellent results as presented by Xie et al. In [2], an algorithm based on the bird behavior is presented by Meng et al. In [3,4], a mantis search algorithm and exponential distribution optimizer are studied by Abdel-Basset et al. Additionally, in [5], a coronavirus mask protection algorithm is implemented with this problem yielding good results by Yuan et al. In [6,7], an osprey optimization algorithm and green anaconda optimization are presented by Dehghani et al. Moreover, in [8], a comparative study with the bird swarm algorithm and artificial gorilla troops optimizer is outlined with both methods showing excellent results in mathematical functions, as presented by Miramontes et al. Apart from these, several more studies have been conducted.
Nowadays, an increase in the complexity of problems has been visualized; therefore, nature-inspired algorithms have been investigated to improve their performance. A topic of interest that has been shown to yield excellent results is the improvement of the algorithm with innovative and intelligent techniques. Here, it is noteworthy to mention a few cases. In [9], a differential evolution algorithm (DEA) with dynamic adaptation in their main parameters is presented. An improved algorithm for the prediction of heart diseases is presented in [10], and an improved bio-inspired algorithm for the fog computing environment is analyzed in [11]. In [12], an improved algorithm for task mapping in networks-on-chip is presented, and an improved sparrow search algorithm is presented in [13]. A chaotic gaining and sharing knowledge optimization algorithm is presented in [14], and a chaotic dragonfly algorithm is presented in [15]. A marine predator algorithm is improved in [16], and an improved dolphin swarm algorithm is presented in [17]. The primary purpose in the hybridization of these algorithms is to find the optimal values in the main parameters that determine the achievement of an excellent performance in each algorithm; this allows us to analyze some important characteristics such as fast stabilization, high precision, the exact solution, and fast convergence rate.
In this proposal, the first relevant contribution is to explore the execution of the WOA in the case study to observe the behavioral results, and then identify the effect of the two parameters ( r 1 and r 2 ) in WOA as well as the effect on exploration and exploitation, as they are crucial for obtaining excellent results.
The remainder of the paper is organized as follows. Several research works that are relevant to this study are reviewed in Section 2. The original WOA and the proposed FWOA-T2FLS are presented in Section 3. The description of the mathematical functions is detailed in Section 4. The results of the experiments are outlined in Section 5. In Section 6, the results are analyzed, statistically compared, and discussed, and finally in Section 7, the conclusions and future works are demonstrated.

2. Related Works

Nowadays, one of the hybridizations in which several authors have shown their interest is with fuzzy systems. Metaheuristic algorithms have provided greater stabilization and better error performances when the fuzzy set method is implemented because problems have grown in complexity. For example, in [18], an adaptive neuro-fuzzy inference system and genetic algorithm (NFGA)-based MPPT controller for the PV system is presented and in [19], a synthesis of the neuro-fuzzy regulator with genetic algorithm is analyzed. Additionally, in [20], a new fuzzy approach to dynamic adaptation applied to the marine predator algorithm is presented, and in [21], an improved chimp optimization algorithm is presented. Moreover, in [22], a hybrid spiral-bacterial foraging algorithm for a fuzzy control design of a flexible manipulator is studied, and in [23], an optimal fuzzy logic controller-based PSO for the photovoltaic system is presented. Furthermore, in [24], a boosted PSO with fuzzy K-nearest neighbor classifier for predicting atopic dermatitis disease is presented.
When the complexity of the problems grows, it is necessary to provide a more precise response. As a result, the IT2FS has the main characteristic of uncertainty in the evaluation with greater potential for providing excellent results, as several authors have demonstrated. Some relevant works have been studied, for example; in [25] an optimization of the T2FL is presented with the hybridization of GSO and FA algorithms, and in [26], a shadowed type-2 FS in the improvement of the cuckoo search and flower pollination algorithms is presented. In [27], a type-2 FL is implemented in the improvement of a metaheuristic algorithm, and in [28], a bat algorithm is implemented in the optimization of an IT2FLS. In [29], a metaheuristic approach for IT2FLS is implemented, and in [30], a type-2 FS is implemented in the dynamic adaptation of harmony search optimization [31] and bee colony optimization [32]. In [33], a T2FL metaheuristic algorithm is implemented in nonlinear dynamic systems, and in [34], a high-speed IT2FS approach for dynamic parameter adaptation is presented.
In recent years, a bio-inspired algorithm called WOA has generated great interest because it has been studied and applied in various fields to solve problems and has been found to yield excellent results in the research. Some relevant works have been applied. In [35], the WOA algorithm is used in image segmentation, in [36], it is implemented to stabilize a control problem, and in [37], it is used for biomedical classification. In [38], WOA is implemented as a planning strategy for mobile robots, in [39], it is used to solve the optimal reactive power dispatch problem, and in [40], it is used as an optimizing deep learning method for software defect prediction. In [41], the WOA algorithm is used in the reconfiguration of distribution networks with simultaneous allocation of distributed generation, and in [42] it is used to classify problems.
Therefore, the WOA algorithm showed significant improvements over various methods. In particular, many authors are interested in the performance of WOA in several problems [43,44,45,46,47,48,49,50,51,52]. Some related works where this algorithm has been studied with a similar problem are presented in [53,54,55].
The proposed improvement with the hybridization using IT2FLS is a new approach in the minimization of benchmark functions.
Once the state-of-the art was analyzed, the WOA algorithm was observed as having the largest number of contributions and applications. As studied by different authors, the WOA algorithm is one of the most popular algorithms due to its rapid convergence in obtaining results. The justification for choosing this algorithm is mainly based on its popularity and this has motivated us to present a new hybridization using type-2 fuzzy logic to improve the original WOA algorithm.

3. Whale Optimization Algorithm

Mirjalili and Lewis [56] created the whale optimization algorithm, drawing inspiration from the behavior of whales in nature. Three critical behaviors have been identified. First, in some parts of their brains, whales have common cells similar to human beings. Second, as the largest mammals in the world, whales are recognized for their intelligence. Third, in the social behavior of whales, they can successfully live alone or in a group. However, they are mostly observed in groups [56].

3.1. Original WOA

A visual representation of the behavior of a whale is illustrated in Figure 1, and in Figure 2, each movement that a whale performs in the process is illustrated. The mechanism of the movement of the whale to find food is based on three interesting techniques: encircling prey (surround prey), spiral bubble-net feeding maneuver (exploitation phase), and search for prey (exploration phase) to find the objective [56]. In this case, during the WOA execution, the best whale with the best solution is updated according to the current location.
The step-by-step process in WOA is expressed by Algorithm 1.
Algorithm 1: Pseudo-Code of the WOA Algorithm
Initialize the whale population Xi (i = 1, 2,……, n)
Calculate the fitness of each search agent
X* = the best search agent
while (t < maximum number of iterations)
   for each search agent update a, A, C, l, and p
      if1 (p < 0.5)
         if2 ( A < 1 )
          Update the position of the current agent by Equation (1)
         else if2 ( A 1 )
          Select a random search agent ( X r a n d )
          Update the position of the current agent by Equation (6)
         end if2
         else if1 (p   0.5 )
          Update the position of the current search by Equation (5)
           end if1
         end for
         Check if any search agent goes beyond the search space and amend it
         Calculate the fitness of each search agent
         Update X* if there is a better solution
         t = t + 1
end while
return X*

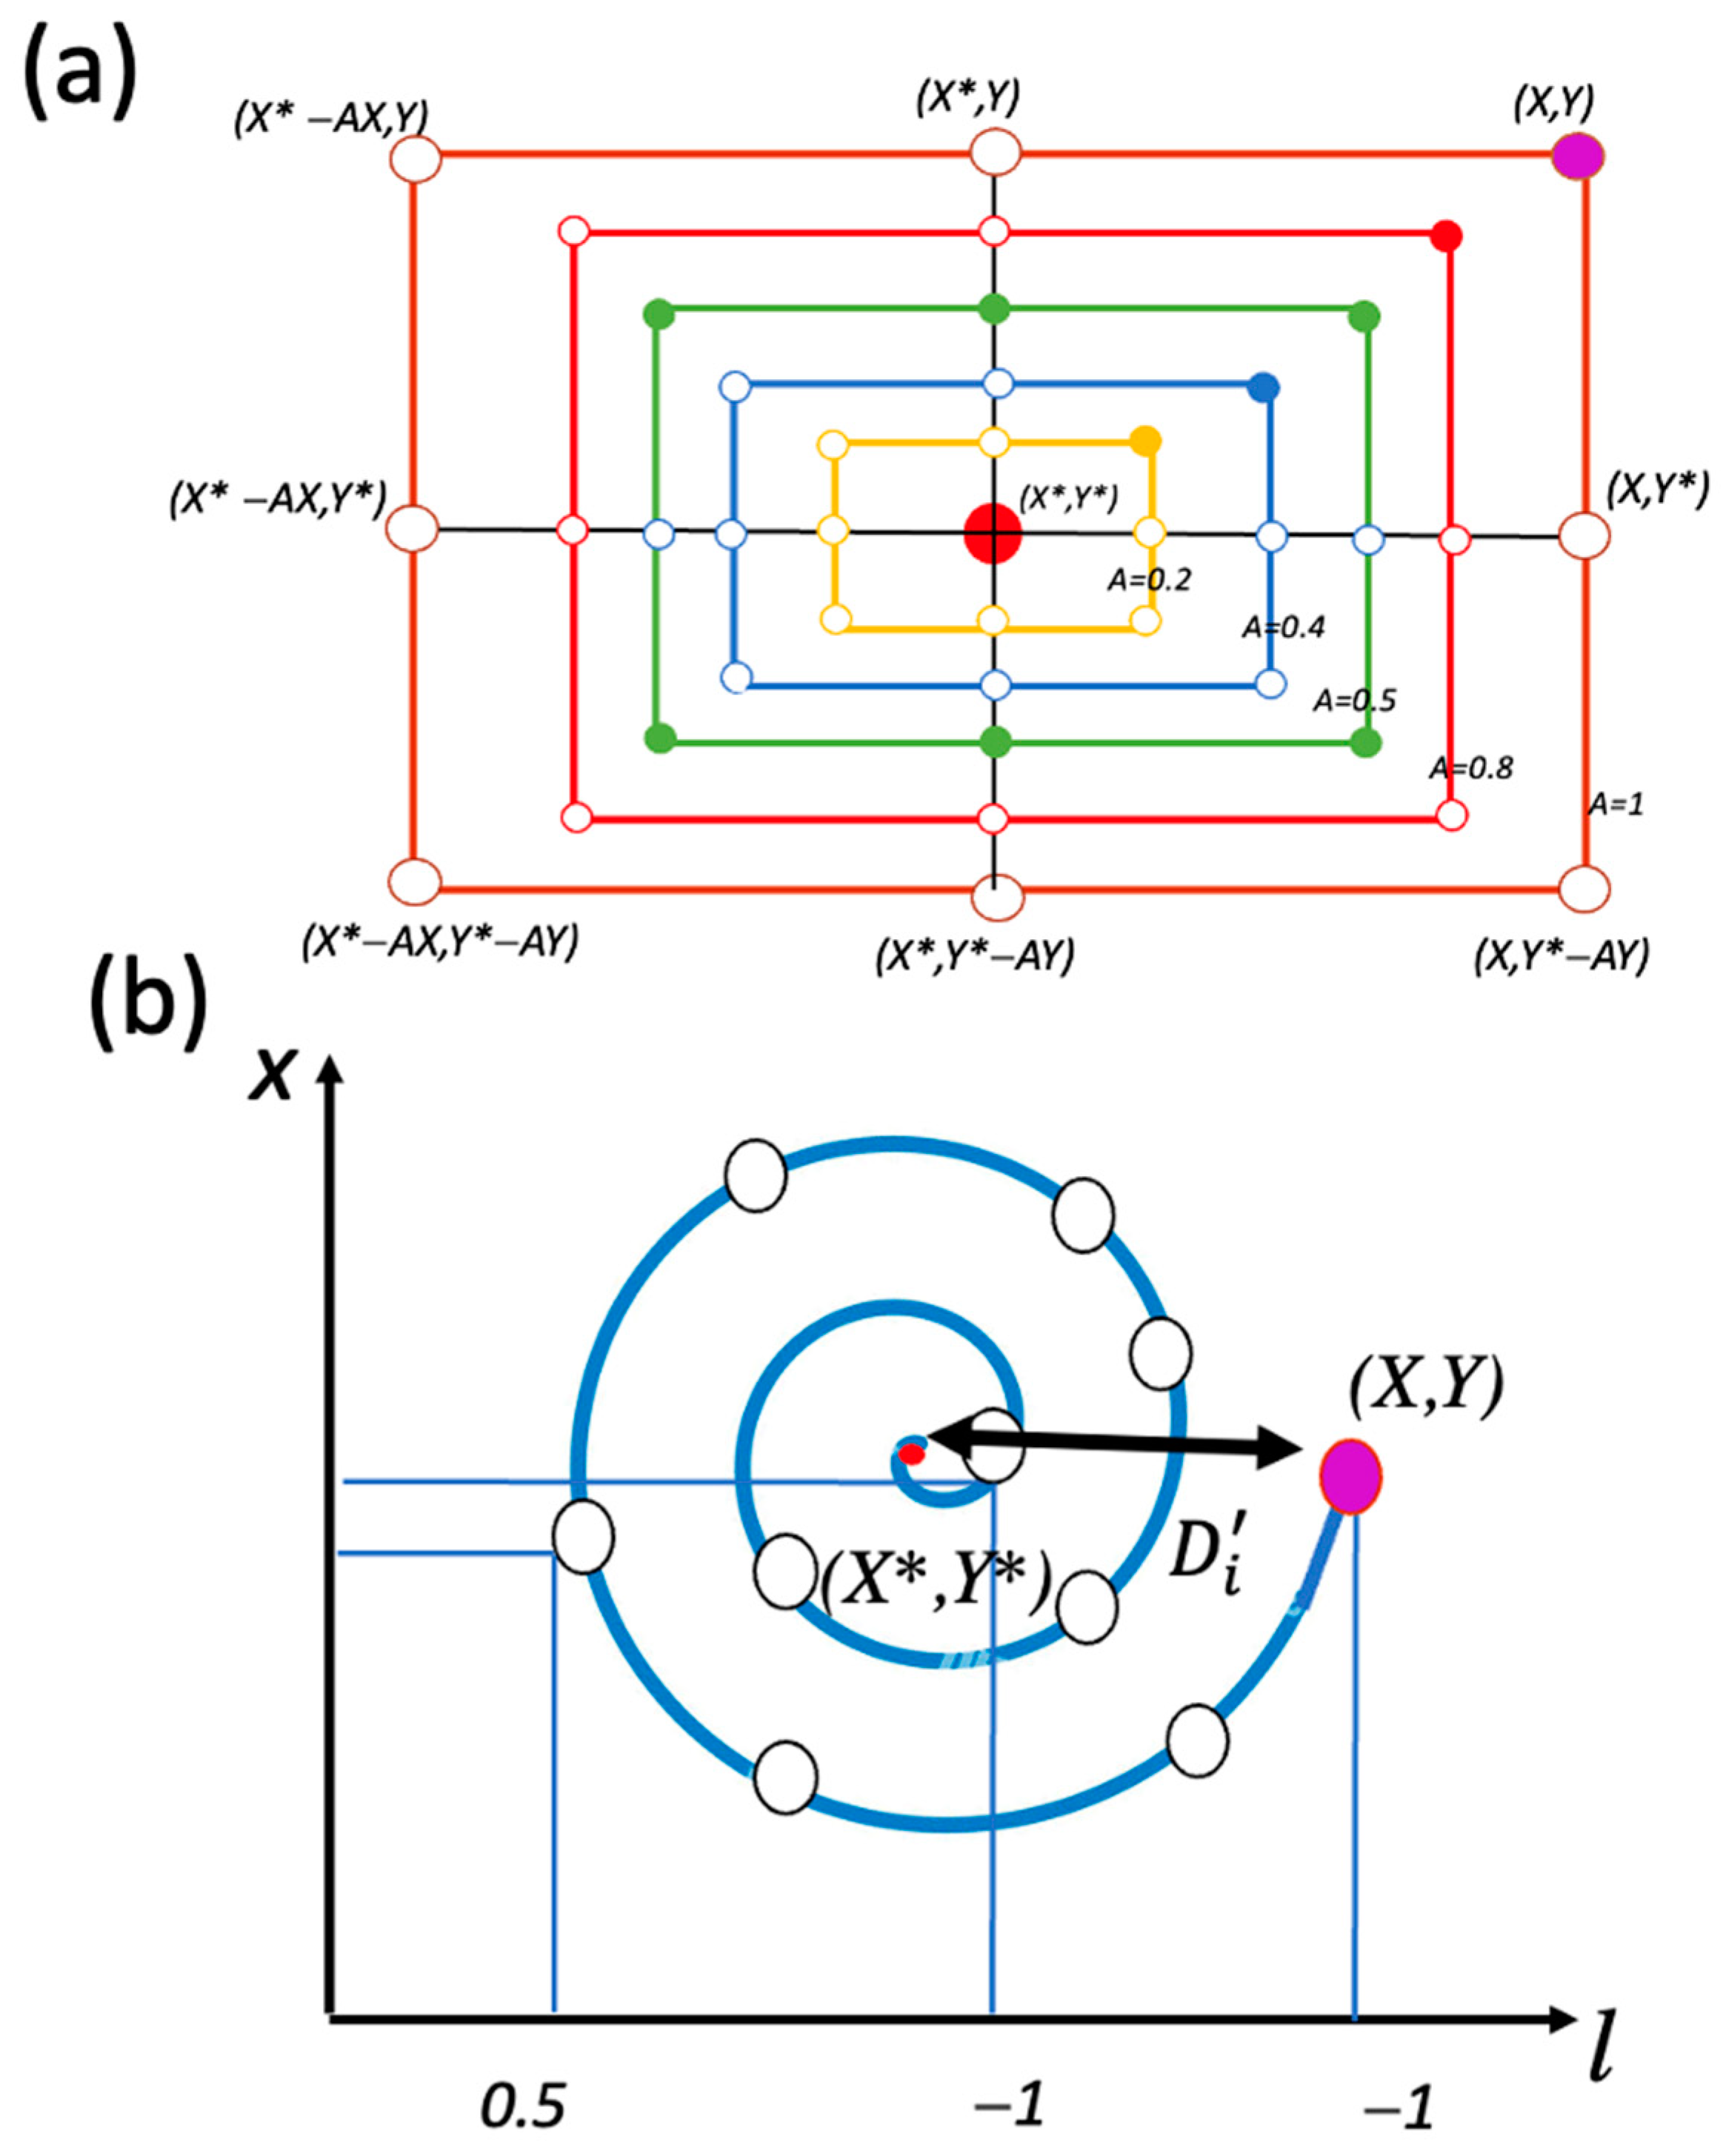
3.1.1. Surround Prey

This phase is based on the humpback whale’s foam-net feeding method. A relevant movement is that a whale can locate their prey by rotating around it. The optimal solution is defined in the start of this phase and other whales (agents) update their position towards the best individual. This behavior is expressed by Equations (1) and (2) [56]:
V = N . X   m   X ( m )
  X m + 1 = X   m   E ·   V
where the total execution in WOA is expressed by m ; the actual position in the optimal solution is expressed by X   and is updated in each iteration;   X ( m ) is the current position;   E represent the coefficients of   X ( m ) and   V , respectively and are calculated by Equations (3) and (4) [56]:
  E = 2   d ·     r 1   d
N = 2   ·   r 2
In this phase,   d slowly changes from 2 to 0, and   r 1 and   r 2 are in the range between 0 and 1. (These two parameters are studied in this paper, and the detailed explanation is presented in the following sub-section).

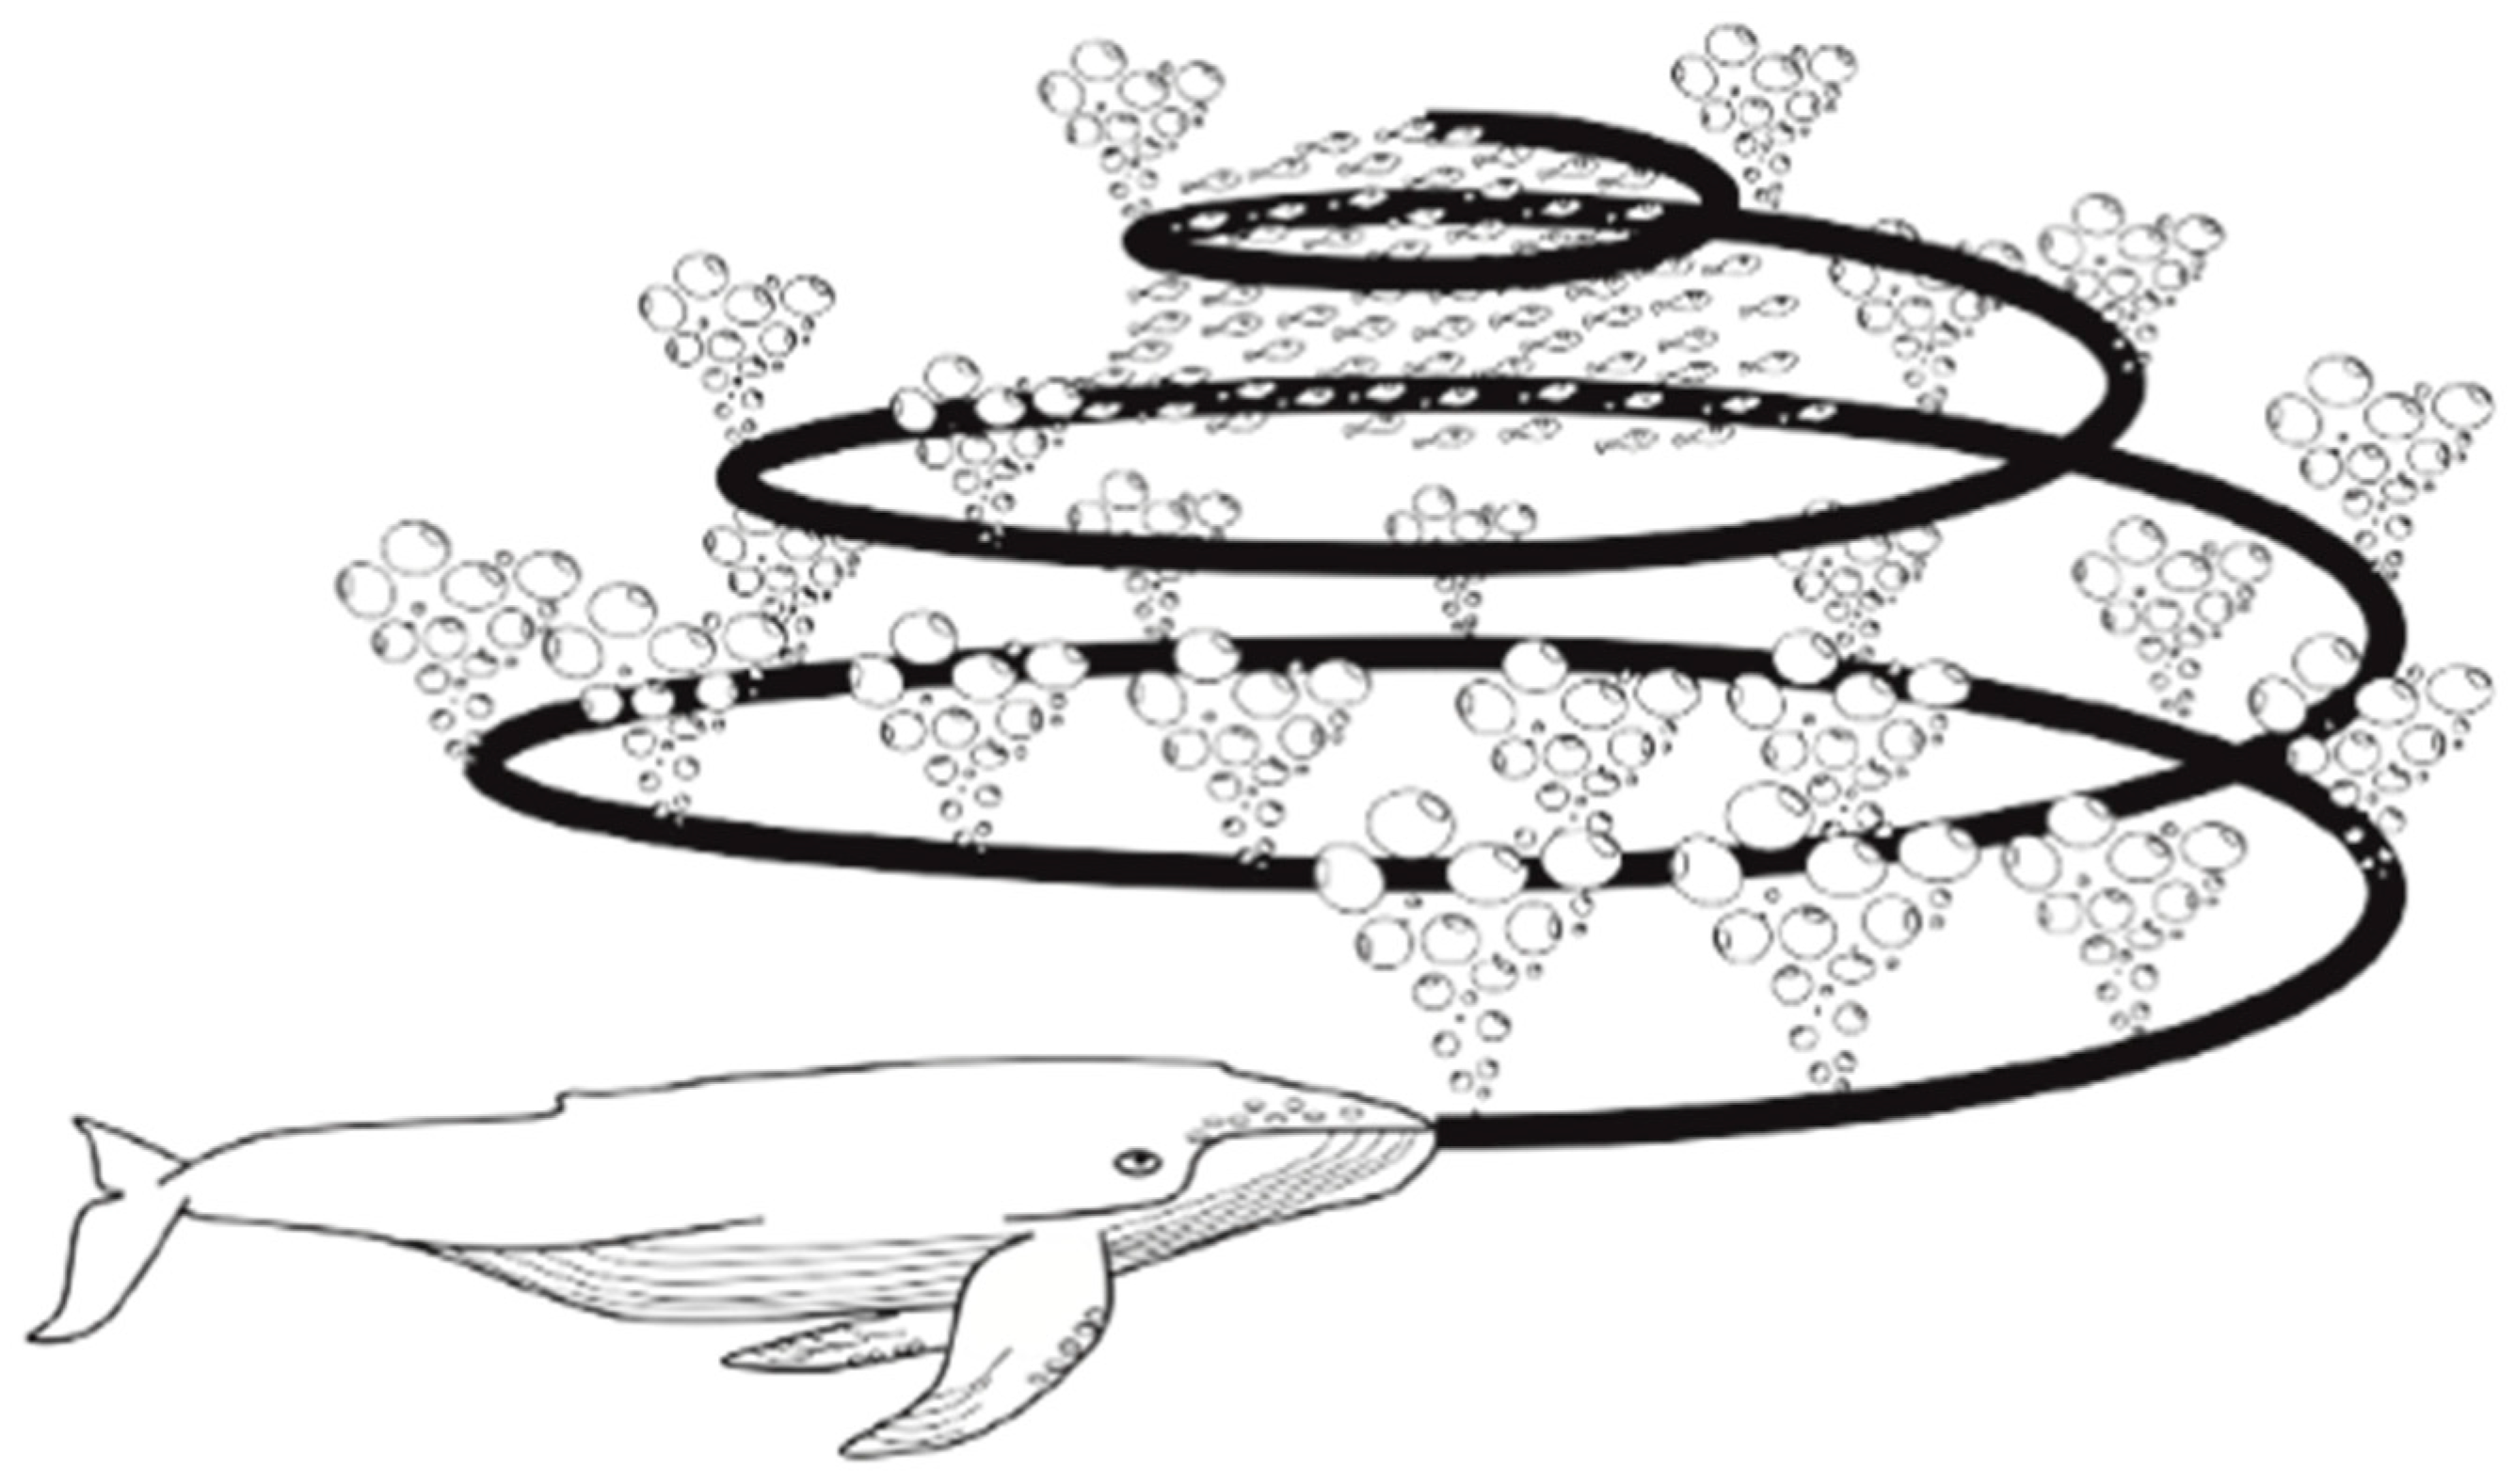
3.1.2. Bubble-Net Attacking Method

In this phase, two movements, namely, shrink and surround are performed by a whale. This is achieved by reducing   d in Equation (3). Here,   E is a random value in the interval [−d, d], where   d decreases from 2 in the iterative process to as low as 0. Set d = 1, namely,   E is a random value of [−1, 1]. In WOA, the mechanism to find the new position of a whale is expressed as a spiral equation and is indicated mathematically in Equation [5]:
  X m + 1 =   L ·   e f j · cos 2 π j + X   ( m )
where   L = X   m   X ( m )   ; f is the helix constant and a random number in [−1, 1] is indicated by j .

3.1.3. Search for Prey
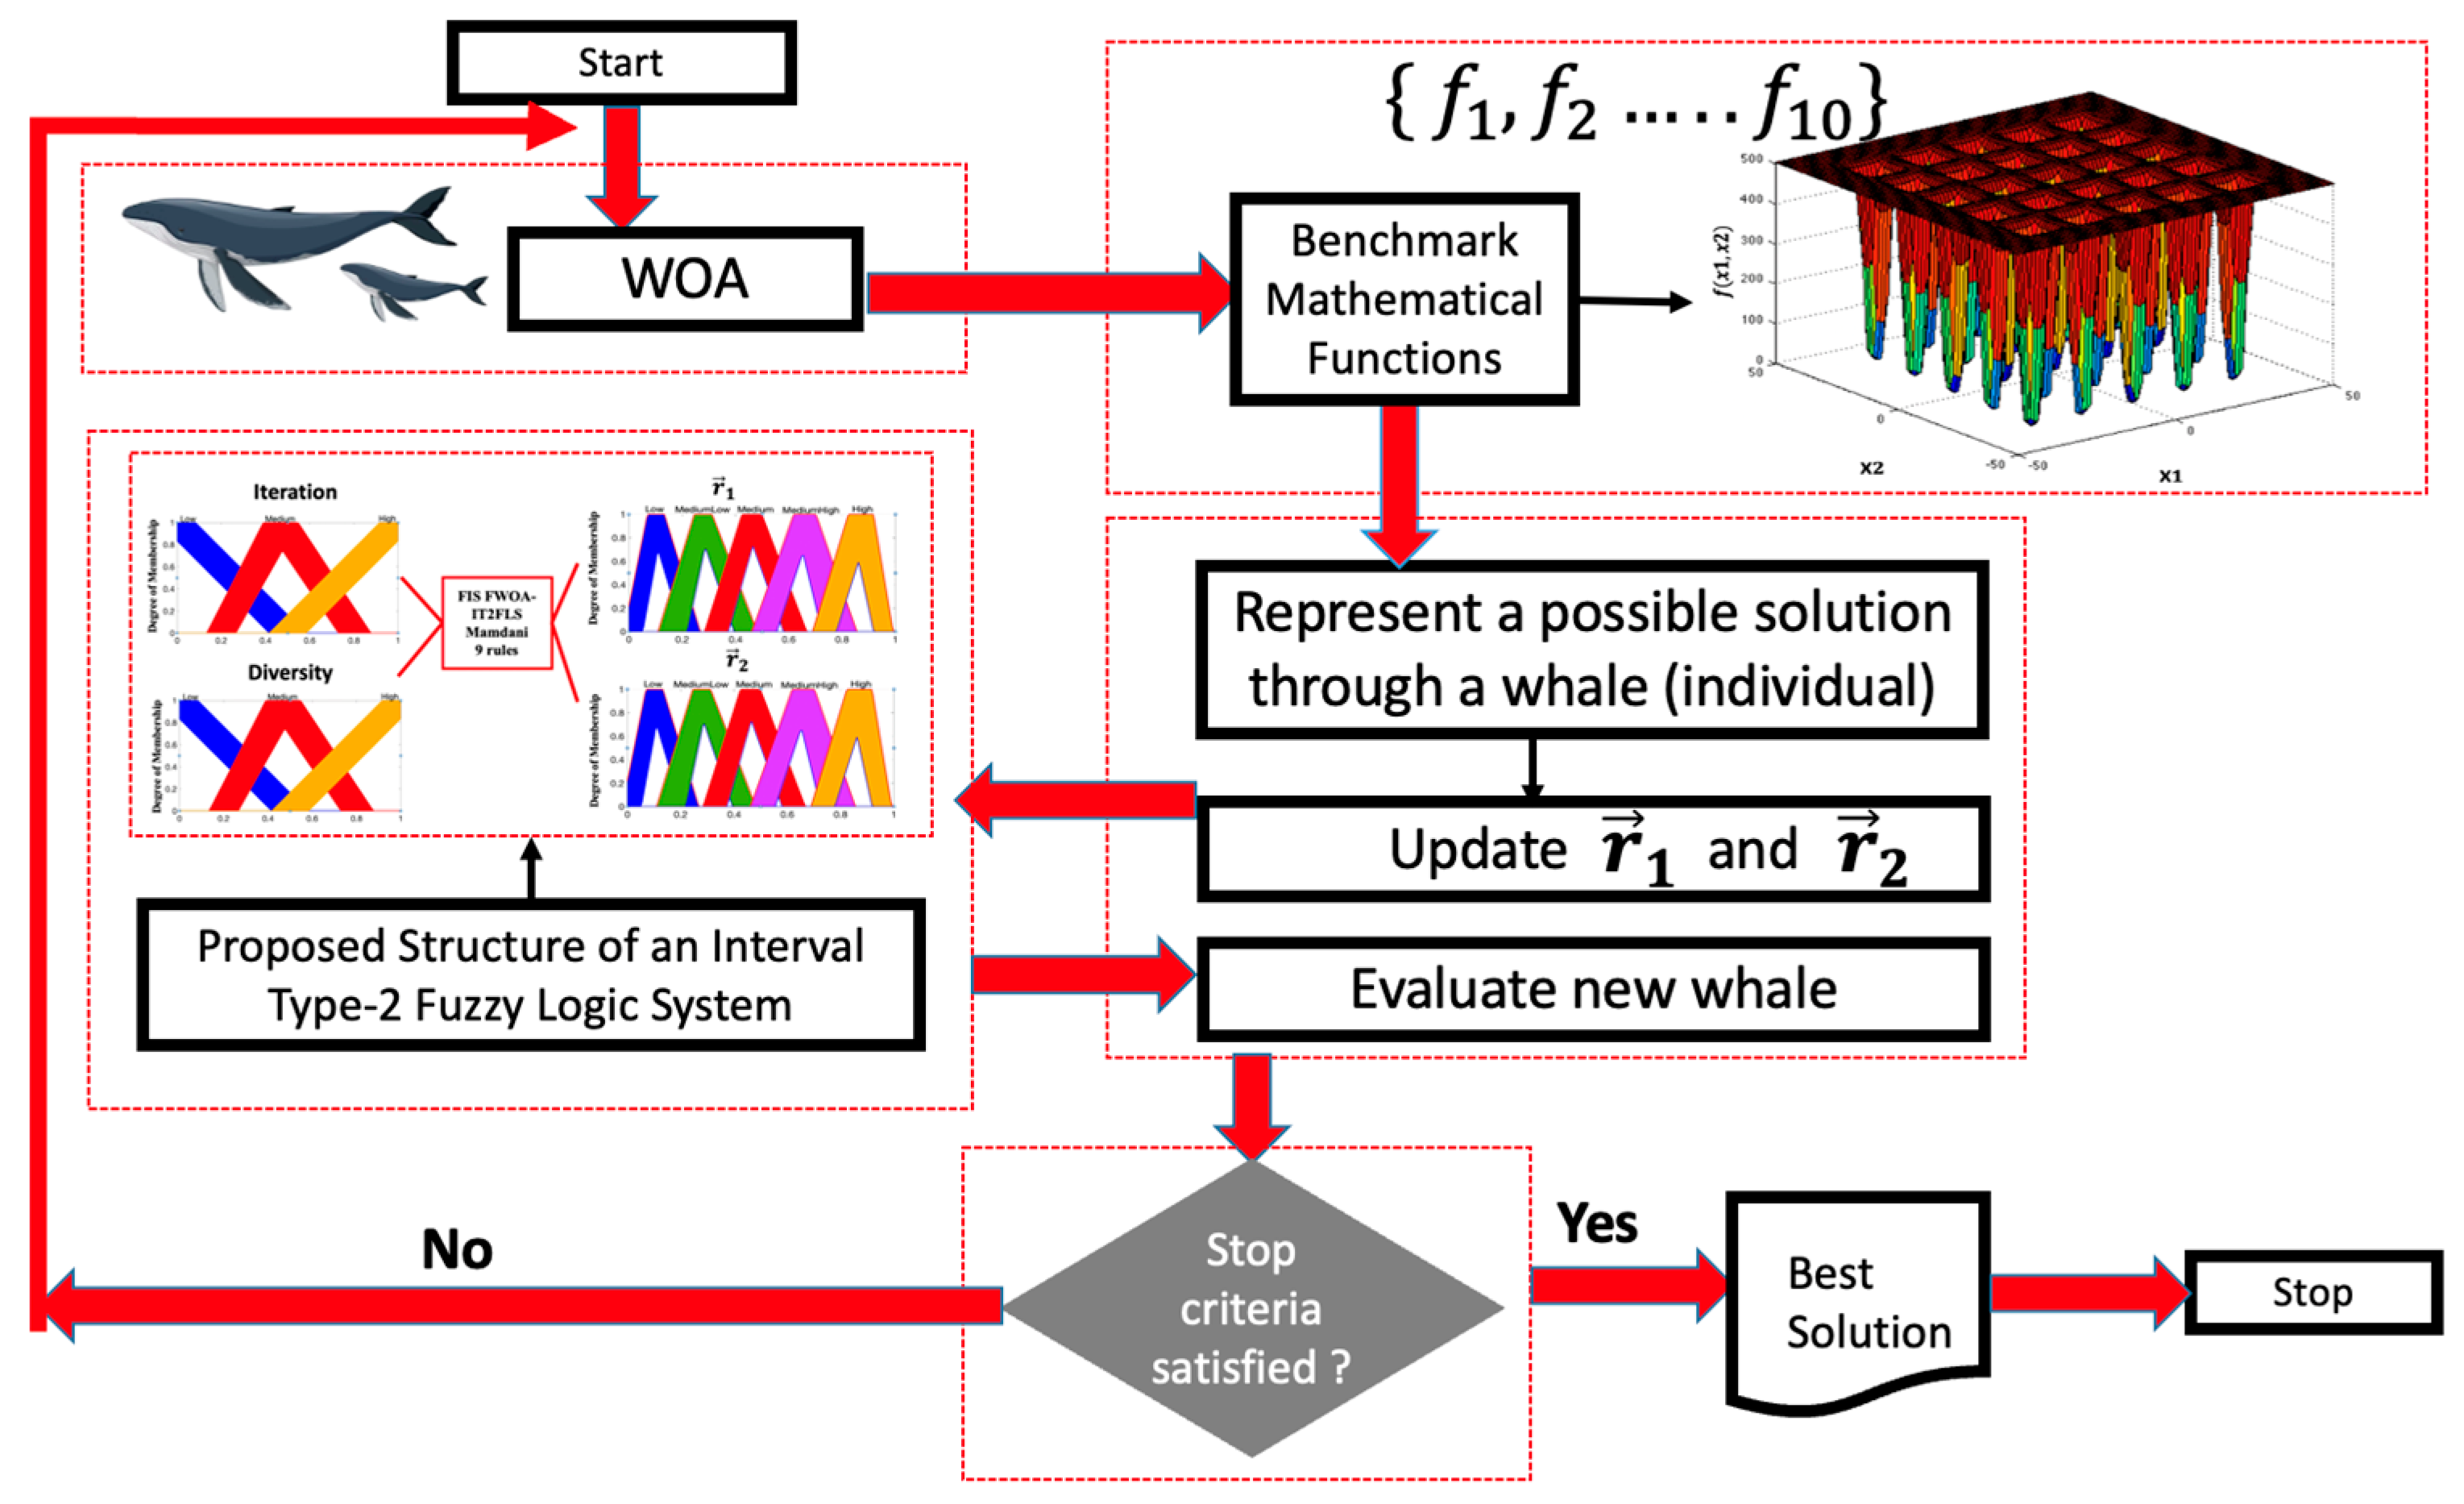
In the following phase,   E is implemented to find the prey. A random value of   E which is greater than 1 is established. This process is expressed by Equation (6) [56]:
V = N .   X r a n d   X
X   m + 1 =   X r a n d E · V
where   X r a n d indicates a random position in the current population. In each iteration, a whale chooses which way to update its location according to the value of   E . In this phase, when E > 1 , then the selection is represented by a whale (individually), and when E < 1 , then the selection is assigned to the best solution of the population.

3.2. Fuzzy WOA

Utilizing the proposed method, the mathematical functions are optimized with the main goal of obtaining minimal values. In this case, the values of r 1 and r 2 parameters affect the performance of the WOA algorithm. Based on a previous analysis, the r 1 parameter (see Equation (3)) has a relationship with the exploration of the algorithm, and r 2 parameter (see Equation (4)) has a relationship with the exploitation of the algorithm. Both parameters are obtained with the interval type-2 FLS based on fuzzy rules. These rules were designed by analyzing the performance in the original WOA algorithm in previous experiments. To find the optimal values, the IT2FLS has two inputs, namely, iteration and diversity. This section explains this interesting methodology in more detail.
A graphical representation of this paper is depicted in Figure 3.

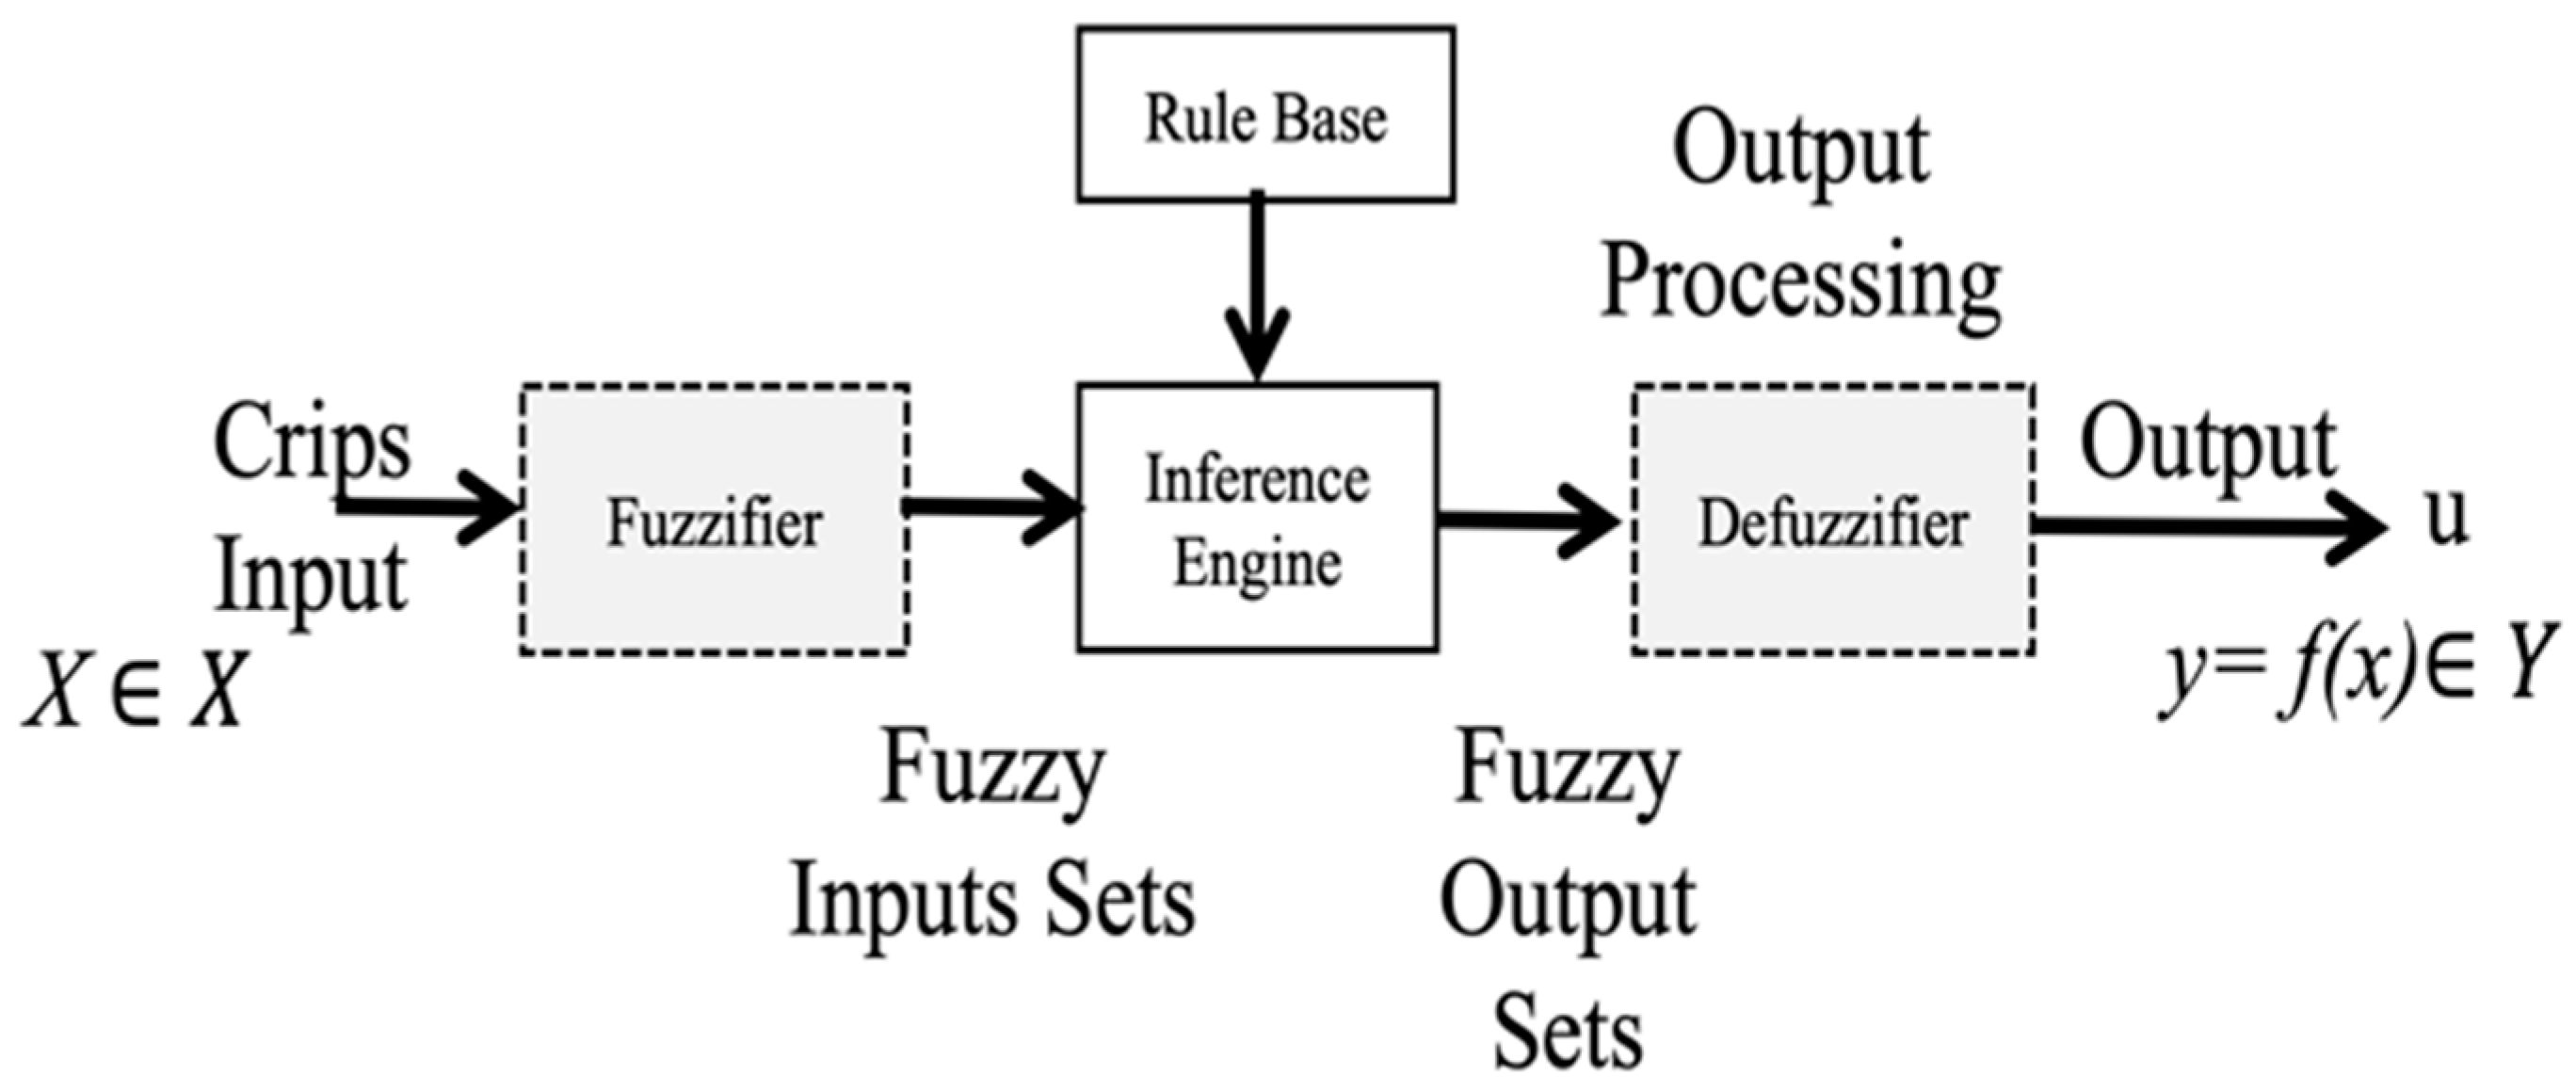
3.2.1. Type-1 Fuzzy Logic System

Zadeh created a way to analyze complex problems with uncertainty or manage the way humans make deductions, which is called a fuzzy logic system (FLS). The main components of type-1 FLS are depicted in Figure 4 [57].
Equation (7) indicates the representation of a fuzzy set (FS) in universe X [58]:
A = { ( x , μ A ( x ) )   |   x     X }
where μ A : X 0 , 1 . In Equation (7), μ A x   indicates the membership degree of element x X to set A. The main processes that compose a T1FLS are a fuzzifier which maps a crisp input into a fuzzy set, an inference engine which processes the rule base, and a defuzzifier which is used to find the output of the T1FLS as a final crisp value.

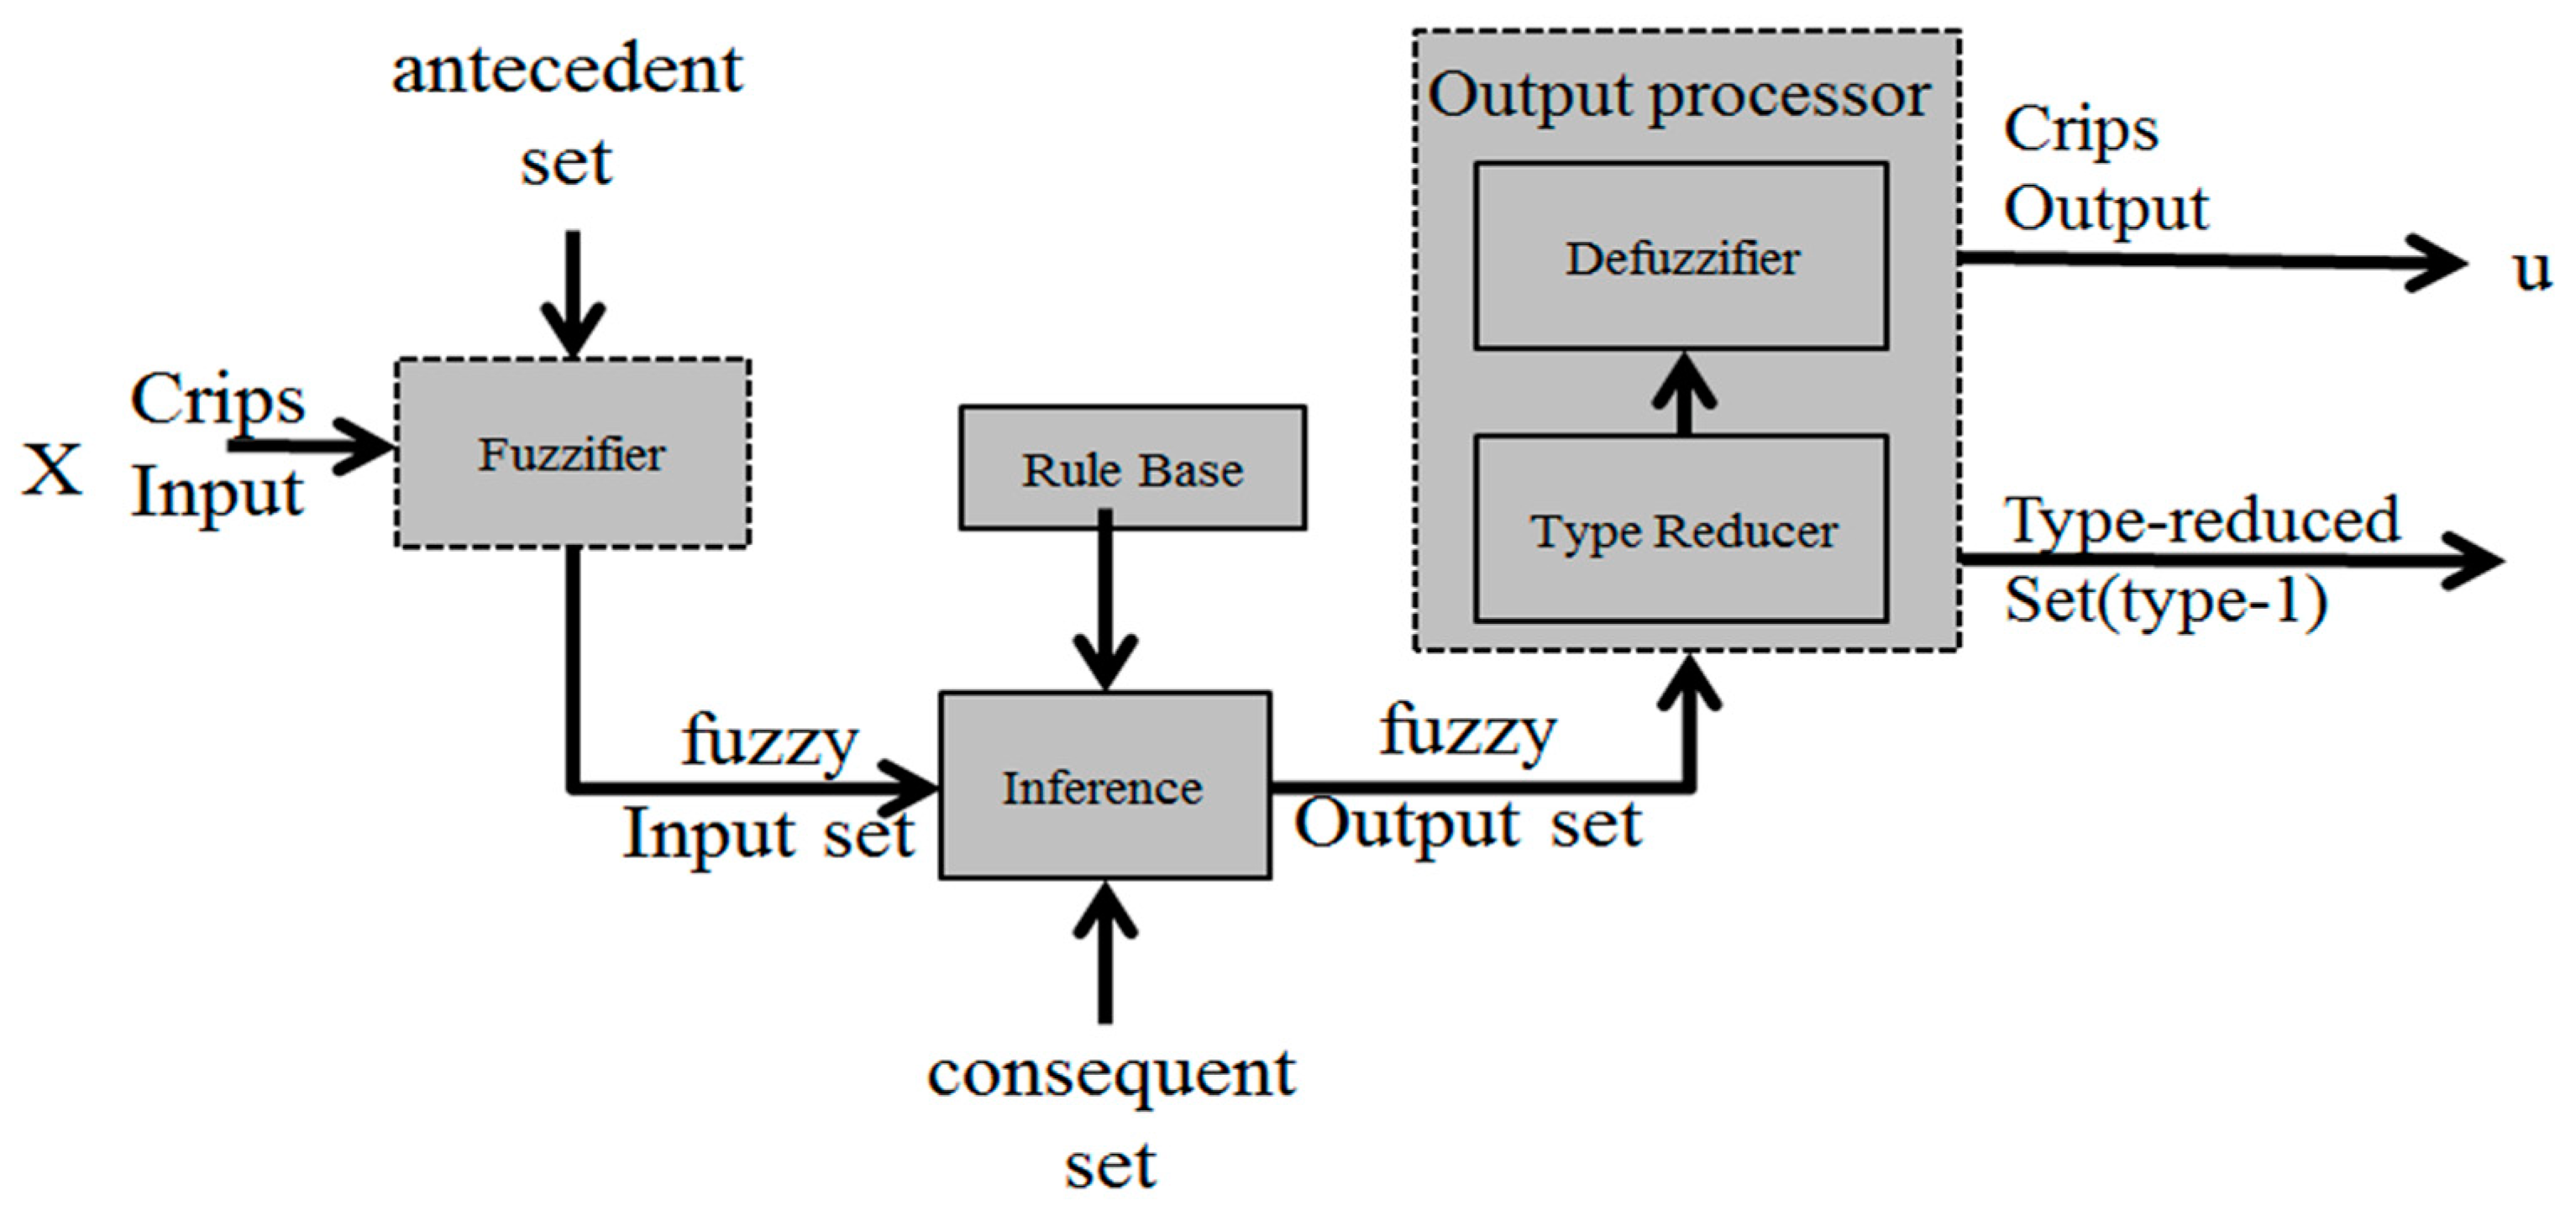
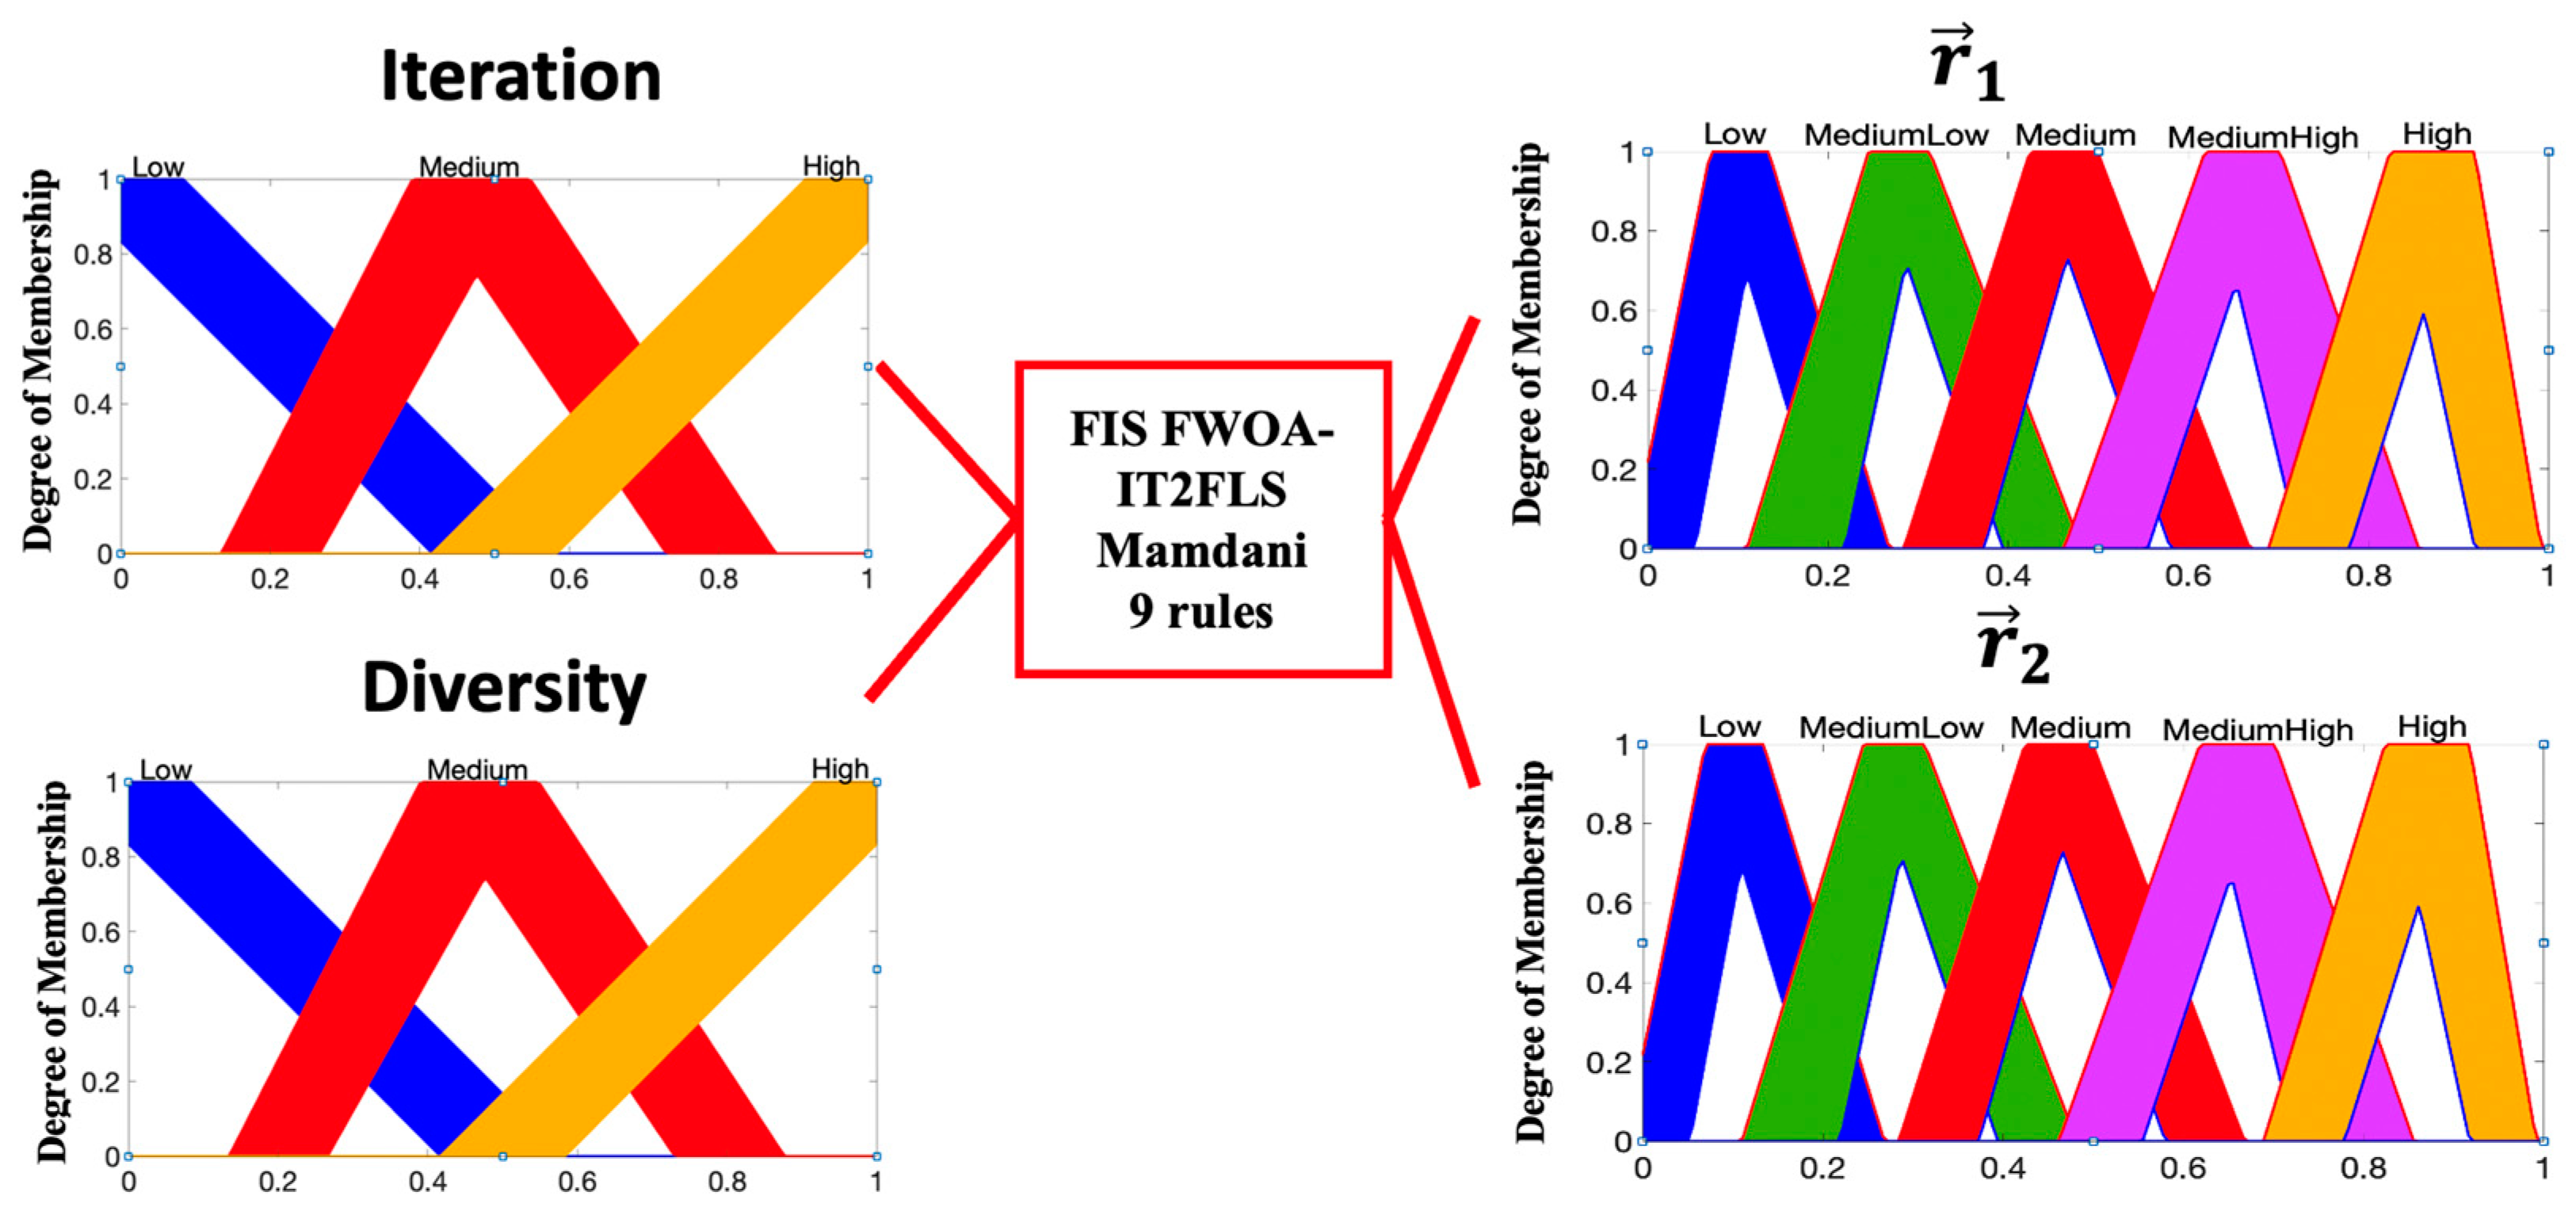
3.2.2. Interval Type-2 Fuzzy System

Based on Zadeh’s ideas, Mendel et al. presented the mathematical definition of a type-2 fuzzy set, as follows [59].
An interval type-2 fuzzy set A ~ , denoted by μ _ A ~ ( x ) and μ _ A ~ ( x ) ,   is represented by the lower and upper membership functions of μ A ( x ) , where x X . In this case, Equation (8) shows the definition of an IT2FS [60]:
A ~ = x , u , 1 | x X , u J x 0,1
where X is the primary domain and Jx is the secondary domain. All secondary degrees ( μ A ~ x , u ) are equal to 1. Figure 5 shows the representation of an interval type-2 fuzzy system.
The output processor includes a type reducer and defuzzifier that generates a type-1 fuzzy set output (from the type reducer) or a crisp number (from the defuzzifier) [60]. An interval type-2 FLS is also characterized by IF-THEN rules, but their fuzzy sets are now of the interval type-2 form. The type-2 fuzzy set can be used when circumstances are very uncertain to determine the exact membership degrees, as is the case with the membership functions (MFs) in a fuzzy controller that can take different values. Additionally, we want to find the distribution of MFs that shows better results in the stability of the fuzzy controller.
The structure of the proposal with IT2FLS to find the optimal values of the r 1 and r 2 parameters of the WOA is shown below. Figure 6 illustrates the inputs and outputs with the triangular membership functions (MFs), and Figure 7 illustrates the proposal with T1FLS.
The FLS is detailed in the following paragraphs. Triangular membership functions (MFs) are used because this type of MF has been shown to give stability in the results in previous works. A total of two inputs and two outputs with three triangular MFs in each variable are used, each MF requires six values in the solution for the IT2FLS; therefore, the IT2FLS comprises 96 values and T1FLS contains 48 values.
The idea comprises finding the values of the r 1 and r 2 parameters and is based on the methodology outlined in [31,61]. Based on the preliminary experiments, the value of r 1 is observed, which is an important parameter in the process of exploring good solutions in the algorithm. On the other hand, when the value of r 2 is close to 1, this indicates that a better solution is close to the best solution and the process is exploited in the WOA.
To verify the effect of the iterations in the WOA, the percentage of the iterations is used as a variable, then in the start of WOA, the iterations will be considered “low”; otherwise, at the end, all iterations will be considered “high” or close to 100%. The representation of the idea is expressed by Equation (9) [31,61]:
I t e r a t i o n = C u r r e n t   I t e r a t i o n M a x i m u m   o f   I t e r a t i o n s
The second input in the T1FLS is called the diversity measure as defined by Equation (10). It measures the degree of dispersion of the whales, i.e., when the whales are closer together, then there is less diversity, and when whales are separated, then the diversity is higher. This evaluation is considered as the average of the Euclidean distance between each whale and the best whale. The main idea in the use of diversity is to prevent the algorithm from running into a local minimum. This mechanism is analyzed with the fuzzy rules that integrate the T1FLS, as shown in more detail in Figure 8 [31,61]:
D i v e r s i t y S t = 1 n s i = 1 n x X i j t X ¯ j ( t ) 2
where t represents the current iteration, n s is used with the value of the population, i indicates the whale, the number of possible solutions is expressed by n x (in this case, it indicates the number of dimensions) and indicates the number of solutions, j is expressed as the next solution, X i j indicates solution j of the whale i, and finally, X ¯ j represents solution j of the best whale in the space search.
Based on the natural characteristics of a bio-inspired algorithm that present the intelligent behavior of living beings, which in this case is a whale, it is observed that when the food is closer to the current solution, then an exploitation mechanism occurs in the area. For this, the value of the r 2 parameter that represents the exploitation in the proposal is considered low or close to 0, which is part of the analysis when designing the fuzzy rules (see Figure 8). This is why the fuzzy rules start with a low exploitation when the iterations are in beginning of the algorithm. On the other hand, when the iterations are at the end of the execution, the value of the r 2 parameter is considered high or close to 1. Figure 8 shows the nine fuzzy rules are based on previous works [61].

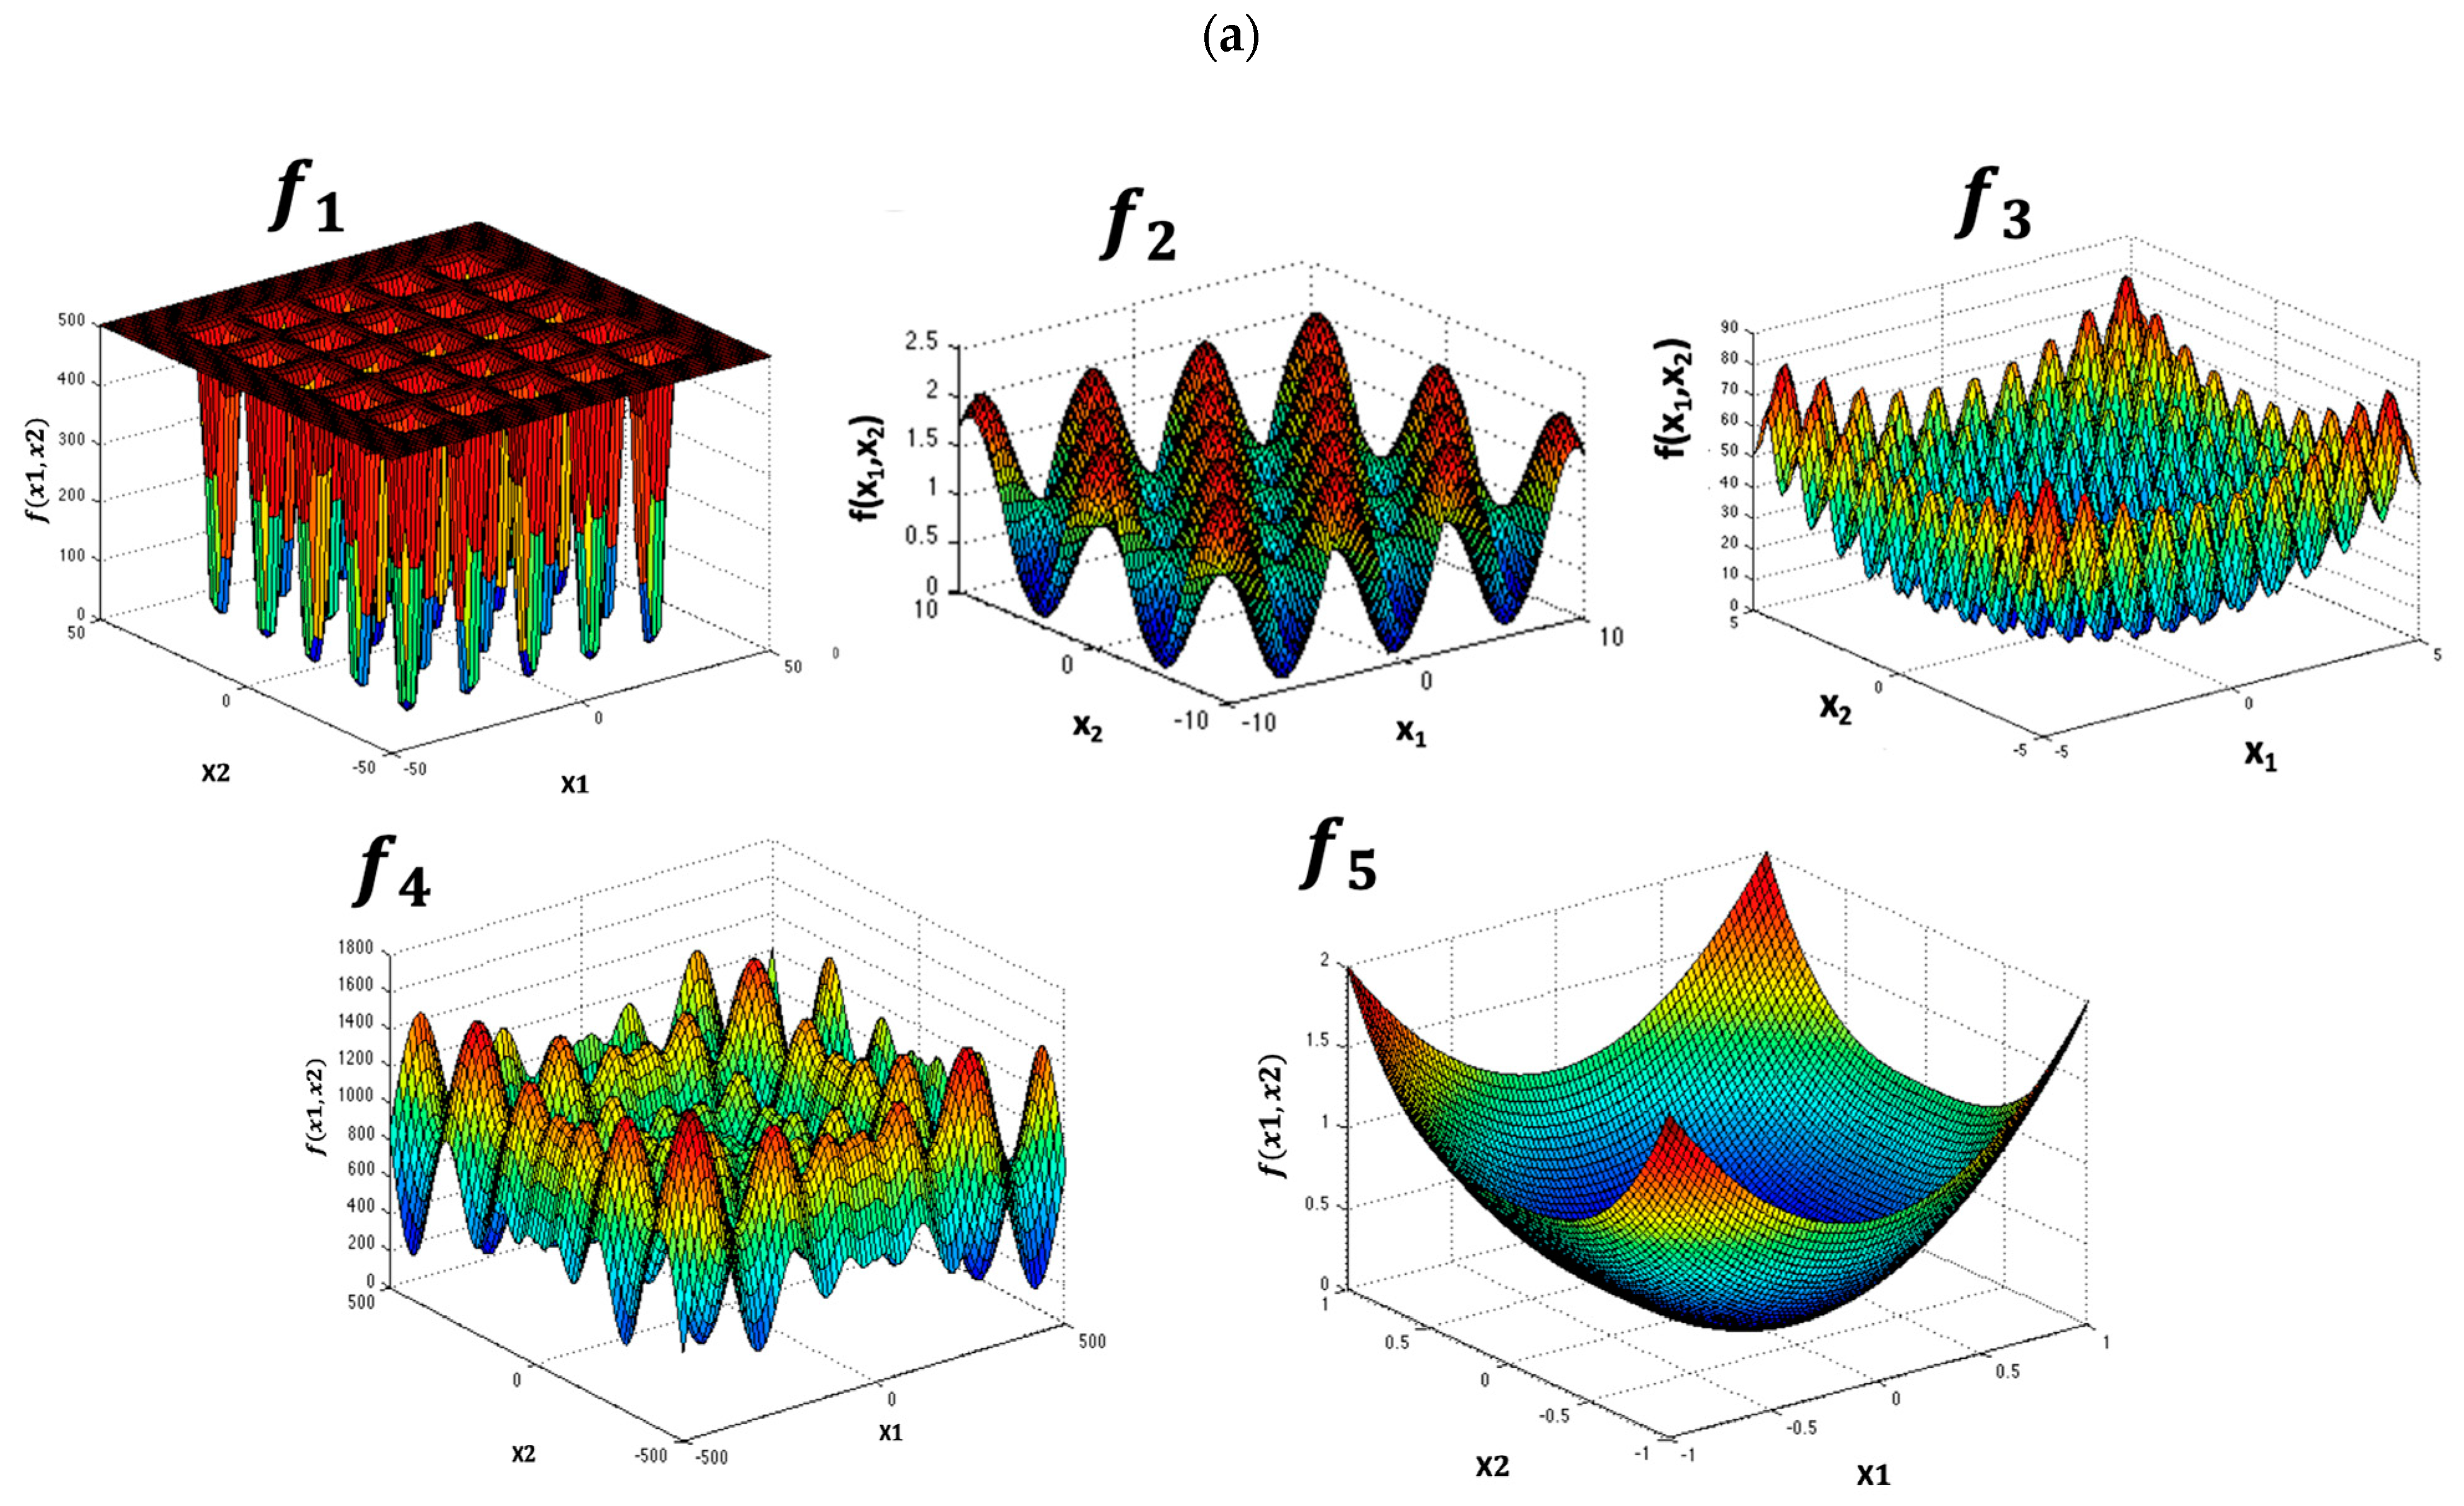
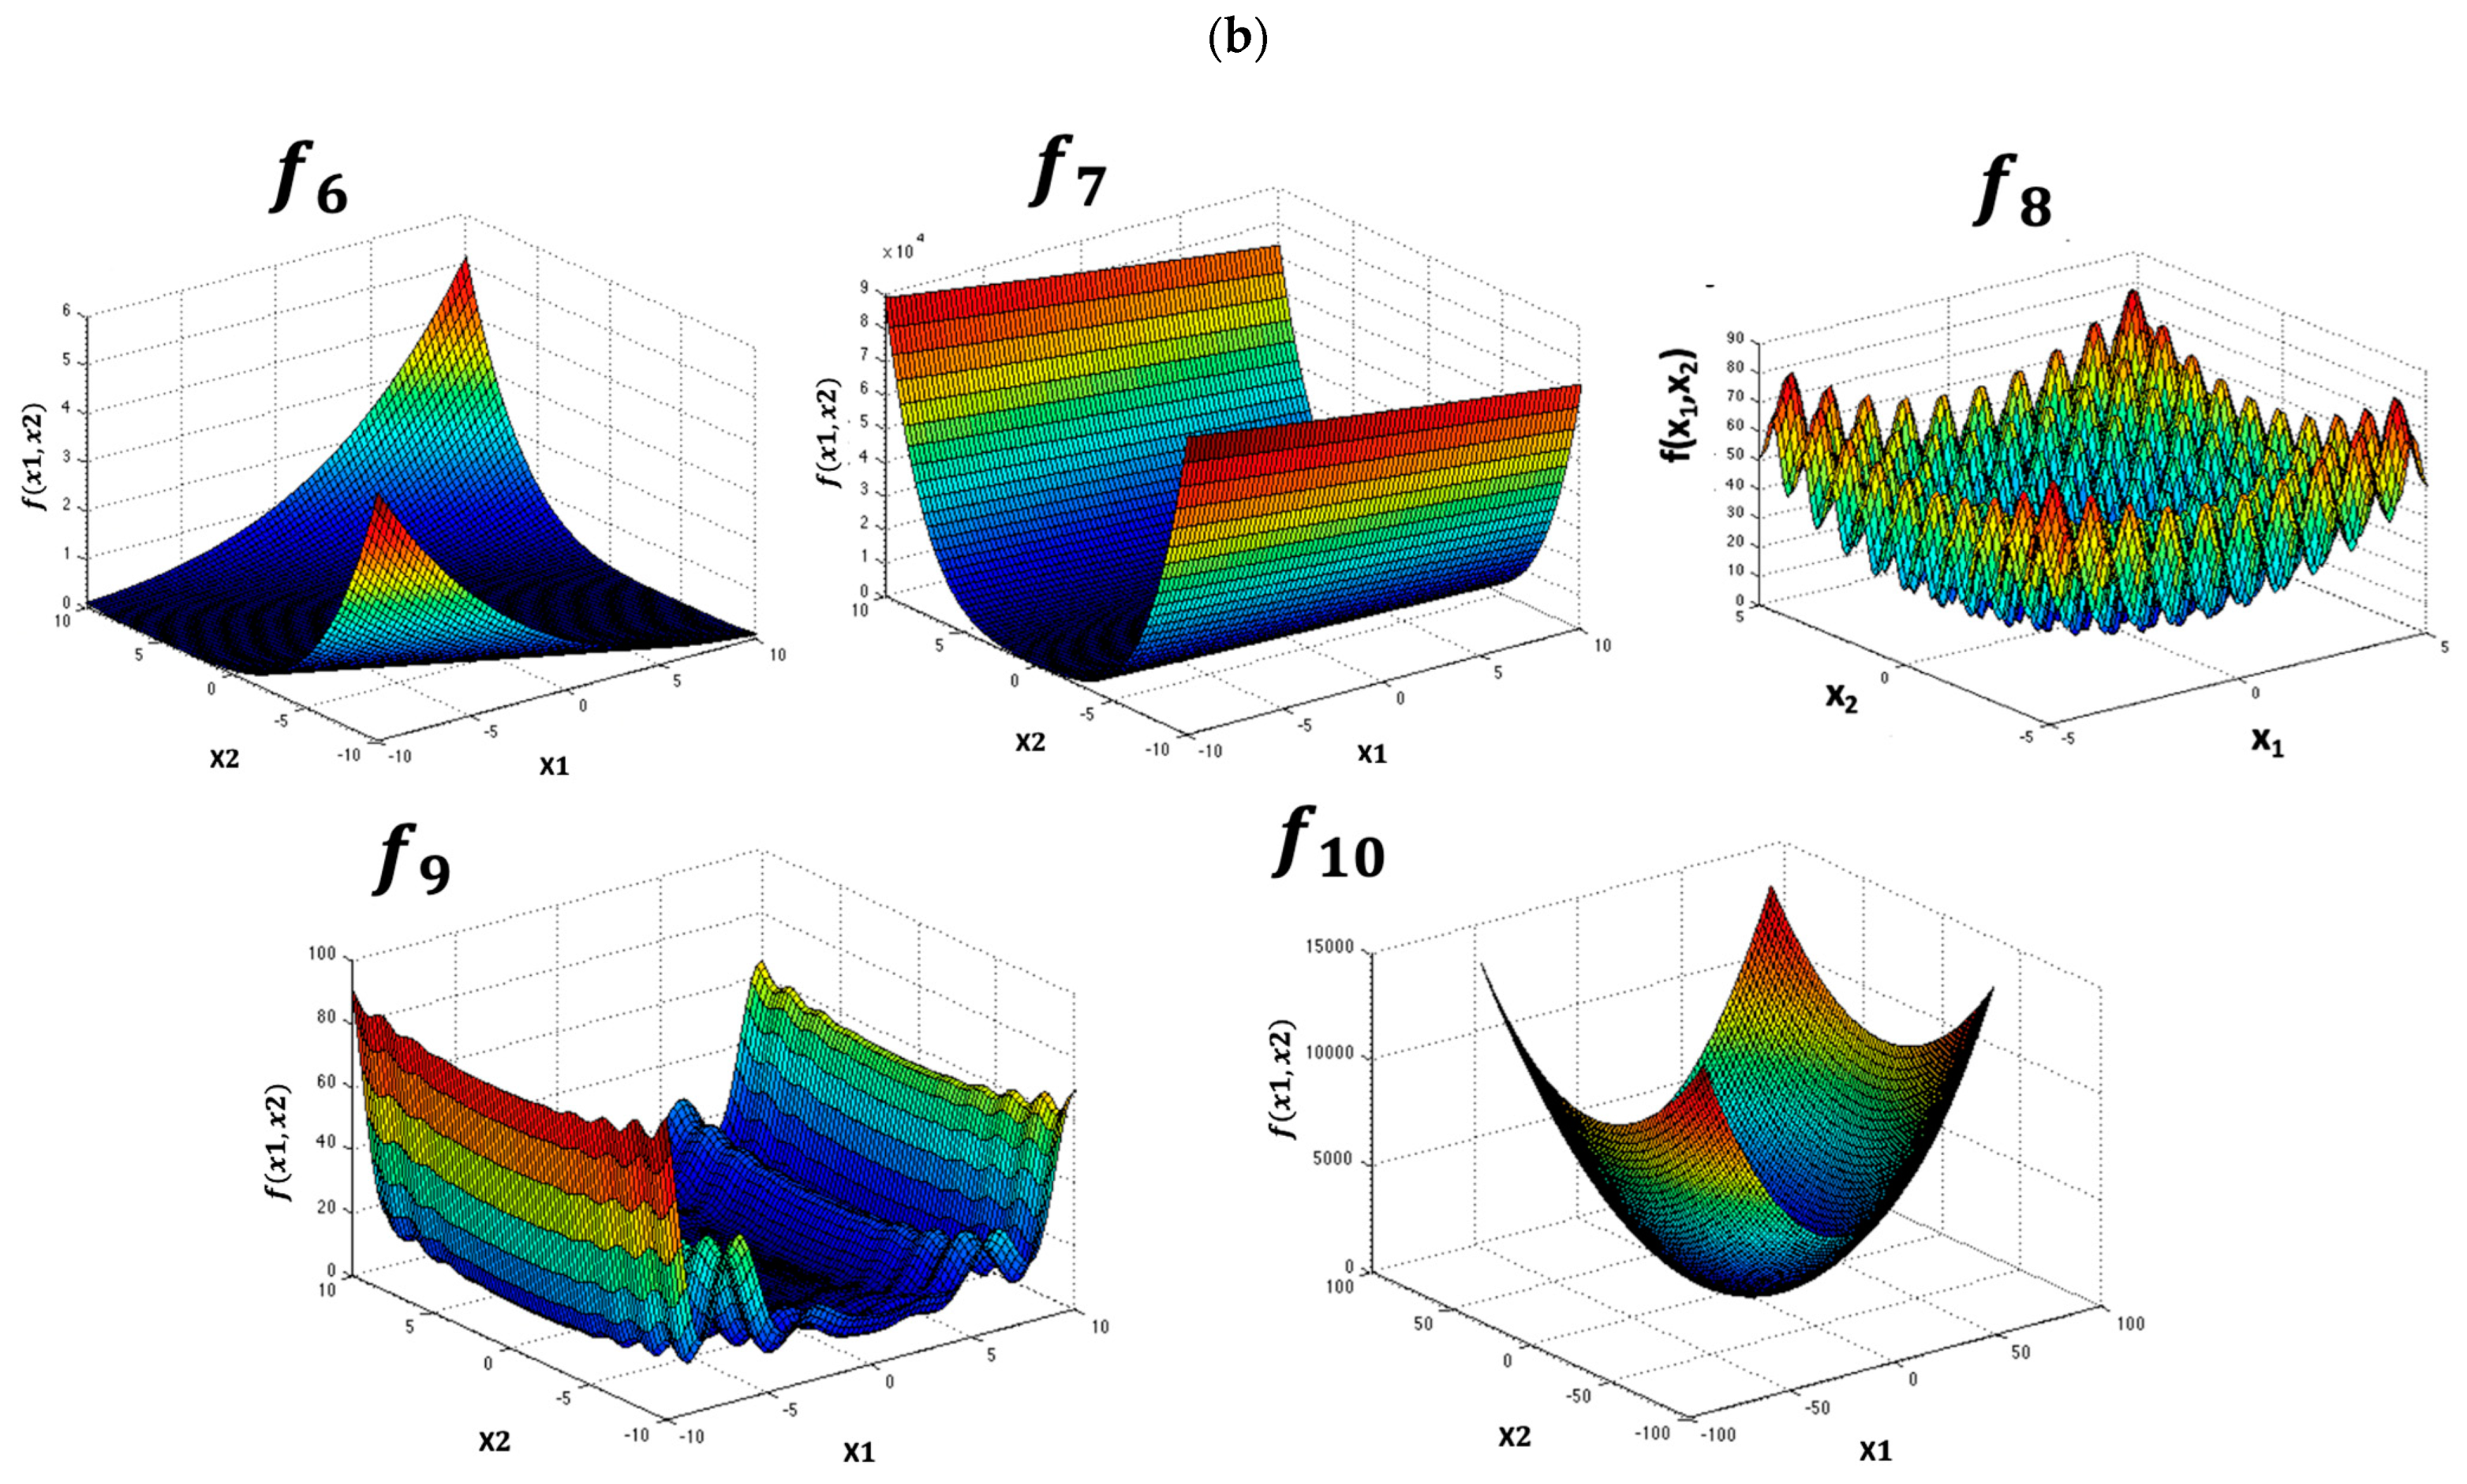
4. Set of Benchmark Functions

A case study in the optimization of benchmark functions is herein demonstrated. A total of ten classical benchmark functions are used with the idea of validating FWOA-IT2FLS such as Sphere, Griewangk, Rastringin, Shewefel, Sum of Different Powers, Zakharov, Dixon and Price, Levy, Sum of Squares, and Rotated Hyper Ellipsoid in the simulation of results. Each function was evaluated with 10, 20, 30, 50, and 100 dimensions (artificial whale). The mathematical representation for each function is shown in Table 1, and the plot for each mathematical function is illustrated in Figure 9.

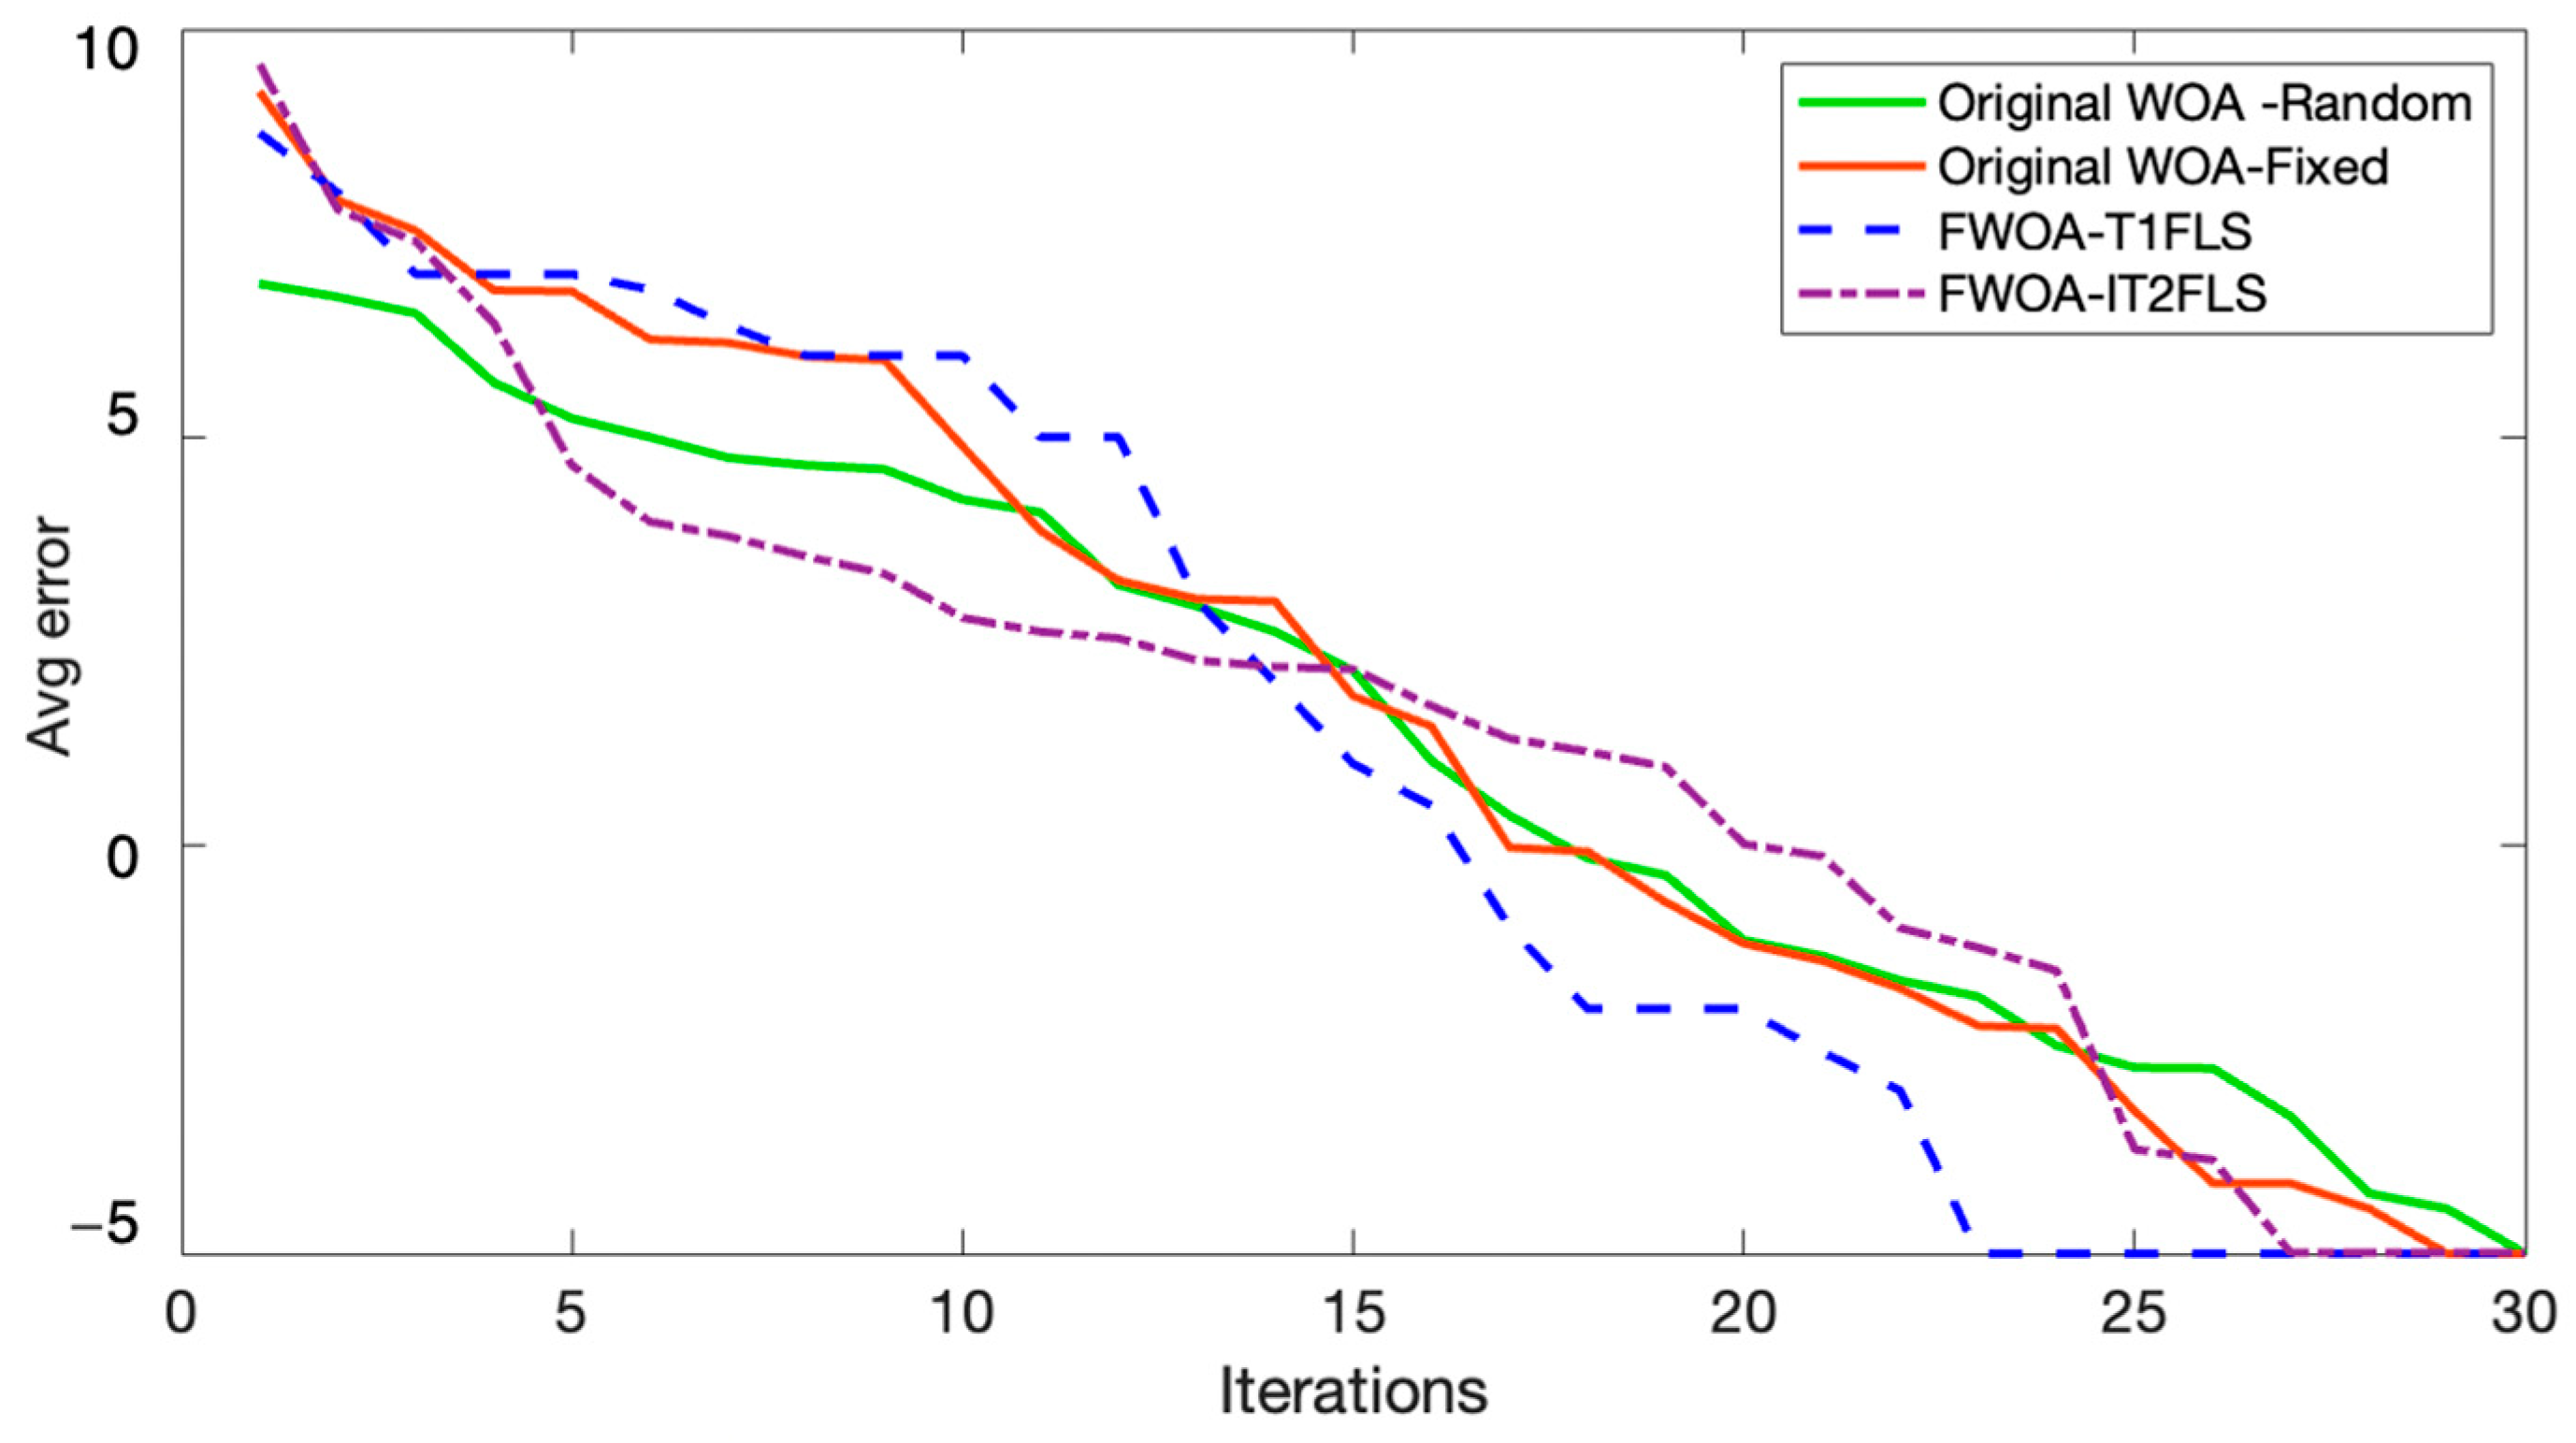
5. Experimental Results

This section outlines the results of the benchmark functions implemented in this paper. The objective of this experiment is to determine the behavior of the FWOA with IT2FLS to find the optimal values of r 1 and r 2 parameters in the WOA. Each experiment was executed with 1000 iterations in the WOA and FWOA. In the original WOA, the values of r 1 and r 2 were obtained with a random number in the range of [0, 1] and a fixed value of 0.5 for each parameter. Table 2, Table 3, Table 4, Table 5 and Table 6 demonstrate a comparative using the original WOA with fixed and random parameters, with 10 dimensions in Table 2, 20 dimensions in Table 3, 30 in Table 4, 50 in Table 5, and 100 in Table 6. The average for each execution is shown.
Table 2 shows that the FWOA-IT2FLS method with functions F1, F3, and F6 provides the best solution, while in Table 3, the FWOA-IT2FLS method with functions F2, F3, F4, and F8 is better. When the dimensions are 30, the proposed method shows an improvement in functions F3, F4, F6, and F7 (see Table 4). When the dimensions are 50, the complexity increases and functions F3, F3, F6, and F8 continue with minimum average errors (see Table 5). When the dimensions are 100, the proposed FWOA-IT2FLS method with functions F2, F6, and F8 is maintained with better results (see Table 6).

6. Analysis of Results

To verify the performance of the results obtained with the proposed FWOA-IT2FLS method, a statistical test and a comparative with the original WOA and fuzzy bee colony optimization algorithm (FBCO) [61] are presented.

6.1. Statistical Test

The parameters of the statistical z-test include the 95% confidence level, alpha of 5%, Ha = µ1 < µ2, H0 = µ1  µ2, and critical value of −1.645. The description in each hypothesis is as follows. Ho is the proposed FWOA-IT2FLS method which is greater or equal to the original WOA with random values and Ha denotes that the results of the proposed FWOA-IT2FLS method are smaller (better) than the original WOA. According to the values used in Table 3, Table 4, Table 5, Table 6 and Table 7, a sample of 30 experiments was randomly chosen, which shows a rejection zone for values lower than −1.64. Equation (11) expresses the mathematical function of the z-test:
Z = X ¯ 1 X ¯ 2 ( μ 1 μ 2 ) σ X ¯ 1 X ¯ 2
The results of the statistical test show that when the z-value is smaller than −1.645, then the evidence is “Significant” to reject the null hypothesis. As a result, the alternative hypothesis is accepted. In this case, in the comparison between FWOA-IT2FLS and original WOA, the average (avg) with 100 dimensions is presented in Table 7. A statistical test compares FWOA-T1FLS and original WOA with the results of 100 dimensions in Table 8, and the statistical test of FWOA-IT2FLS and FWOA-T1FLS is presented in Table 9.
In Table 8, the results show that the proposed method has a significant evidence to accept the null hypothesis with functions F3 and F4.
In Table 9, the results show that the FWOA-T1FLS method has a significant evidence to accept the null hypothesis with functions F3, F5, and F8.
In Table 9, the results show that the FWOA-IT2FLS method has a significant evidence to accept the null hypothesis with functions F2 and F8.
The results of the statistical tests demonstrate that our proposed method is better on average than the original WOA; therefore, it is possible to mention that FWOA-IT2FLS is statistically better than the original WOA compared to the averages. The results of the proposed FWOA-IT2FLS method are very close to the original WOA, for example, in F1, F2, and F10, the z-value is closer to the acceptance of Ha.
The comparative results with the fuzzy bee colony optimization (FBCO-IT2FLS) [61] with 50 dimensions are presented in Table 10.
The results of the statistical tests demonstrate that our proposed method is better on average than the original WOA; therefore, it is possible to state that FWOA is statistically better than the original WOA compared to the averages. The results of the proposed FWOA-IT2FLS method are very close to the original WOA.
Table 11 shows the performance index of standard deviation to FWOA-IT2FLS and original WOA and comparison with FBCO-IT2FLS algorithm.

6.2. Discussion of the Results

This paper addresses some important points in the discussion. First, the use of IT2FLS as a tool for enhancing the performance of the WOA algorithm in the optimization of mathematical functions was proposed. The results in Table 2, Table 3, Table 4, Table 5 and Table 6 show that the optimal values in the heuristic parameters improve the performance of the original WOA algorithm in the problem of benchmark functions.
Second, based on the experiments presented in Section 5, we can summarize an analysis of the results. The original WOA algorithm is an excellent technique in the optimization of 10 sets of mathematical functions. The results with 10, 20, 30, 50, and 100 dimensions show that a better performance can be achieved when the FWOA-IT2FLS algorithm is used. Another important aspect to mention with respect to the IT2FLS method is the quick convergence when the number of dimensions of the WOA algorithm are increasing.
Regarding the computational complexity of the interval type-2 fuzzy logic system, IT2FLS requires more calculations; however, we have found that WOA requires a smaller number of iterations to find a good solution. In addition, better stability is shown in the results in Figure 10 with respect to the original WOA with (random and fixed values), while FWOA-T1FLS and FWOA-IT2FLS are expressed with two mathematical functions of Zakharov (F6) with 100 dimensions.
Figure 10 shows a fast convergence when the errors are found with FWOA-IT2FLS in the experiments (see the purple line).

7. Conclusions

The research presented in this paper allows us to demonstrate that using a hybridization based on IT2FLS and T1FLS to find the optimal values of the r 1 and r 2 parameters shows good results when compared with the original WOA. This is mainly based on the fuzzy rules, as the design of the rules was obtained with the results previously found and the ability to analyze the effects of each parameter on the exploration and exploitation of the WOA. The proposed method is called FWOA-IT2FLS. The statistical test shows that the FWOA-IT2FLS algorithm has a statistically significant improvement when compared with the original WOA.
For the F1 function, the best results of the r 1 and r 2 values with 100 dimensions are in the range of [0.47, 0.85] and [0.11, 0.41]. For the F2 function, the best results are in the range of [0.47, 0.69] and [0.11, 0.24], for F3, in the range of [0.56, 0.82] and [0.17, 0.38], for F4, in the range of [0.51, 0.70] and [0.14, 0.25], for F5, in the range of [0.47, 0.47] and [0.11, 0.11], for F6, in the range of [0.47, 0.85] and [0.11, 0.44], for F7, in the range of [0.61, 0.75] and [0.20, 0.33], for F8, in the range of [0.47, 0.63] and [0.11, 0.22], for F9, in the range of [0.47, 0.75] and [0.11, 0.32], for F10, in the range of [0.47, 0.58] and [0.11, 0.19], respectively. Based on the results, it can be concluded that the optimal value of r 1 is 0.47 and r 2 is 0.11.
In future work, the FWOA-IT2FLS method will be applied to real control problems, for example, in the trajectory stabilization of an autonomous mobile robot, as using this proposed algorithm in fuzzy controllers is an excellent application. Another interesting aspect is to find the values of r 1 and r 2 parameters in the WOA through a better uncertainty analysis based on an interval type-3 FLS.

Author Contributions

Conceptualization, creation of the main idea, writing—review, formal analysis and editing, L.A.-A.; methodology and validation, O.C. All authors have read and agreed to the published version of the manuscript.

Funding

This research received no external funding.

Data Availability Statement

Data are contained within the article.

Acknowledgments

We thank the program of the Division of Graduate Studies and Research of Tijuana Institute of Technology for the support in our research and for creating an excellent team working in collaboration with all the co-authors on this paper.

Conflicts of Interest

The authors declare no conflicts of interest.

References

  1. Xie, L.; Hanm, T.; Zhou, H.; Zhang, Z.R.; Han, B.; Tang, A. Tuna swarm optimization: A novel swarm-based metaheuristic algorithm for global optimization. Comput. Intell. Neurosci. 2021, 2021, 9210050. [Google Scholar] [CrossRef] [PubMed]
  2. Meng, X.B.; Gao, X.Z.; Lu, L.; Liu, Y.; Zhang, H. A new bio-inspired optimisation algorithm: Bird Swarm Algorithm. J. Exp. Theor. Artif. Intell. 2016, 28, 673–687. [Google Scholar] [CrossRef]
  3. Abdel-Basset, M.; Mohamed, R.; Zidan, M.; Jameel, M.; Abouhawwash, M. Mantis Search Algorithm: A novel bio-inspired algorithm for global optimization and engineering design problems. Comput. Methods Appl. Mech. Eng. 2023, 415, 116200. [Google Scholar] [CrossRef]
  4. Abdel-Basset, M.; El-Shahat, D.; Jameel, M.; Abouhawwash, M. Exponential distribution optimizer (EDO): A novel math-inspired algorithm for global optimization and engineering problems. Artif. Intell. Rev. 2023, 56, 9329–9400. [Google Scholar] [CrossRef]
  5. Yuan, Y.; Shen, Q.; Wang, S.; Ren, J.; Yang, D.; Yang, Q.; Mu, X. Coronavirus mask protection algorithm: A new bio-inspired optimization algorithm and its applications. J. Bionic Eng. 2023, 20, 1747–1765. [Google Scholar] [CrossRef] [PubMed]
  6. Dehghani, M.; Trojovský, P. Osprey optimization algorithm: A new bio-inspired metaheuristic algorithm for solving engineering optimization problems. Front. Mech. Eng. 2023, 8, 1126450. [Google Scholar] [CrossRef]
  7. Dehghani, M.; Trojovský, P.; Malik, O.P. Green Anaconda Optimization: A New Bio-Inspired Metaheuristic Algorithm for Solving Optimization Problems. Biomimetics 2023, 8, 121. [Google Scholar] [CrossRef]
  8. Miramontes, I.; Melin, P. A Comparative Study Between Bird Swarm Algorithm and Artificial Gorilla Troops Optimizer. In Fuzzy Logic and Neural Networks for Hybrid Intelligent System Design; Springer International Publishing: Cham, Switzerland, 2023; pp. 223–236. [Google Scholar]
  9. Castillo, O.; Ochoa, P.; Soria, J. Differential evolution with fuzzy logic for dynamic adaptation of parameters in mathematical function optimization. In Imprecision and Uncertainty in Information Representation and Processing: New Tools Based on Intuitionistic Fuzzy Sets and Generalized Nets; Springer International Publishing: Cham, Switzerland, 2016; pp. 361–374. [Google Scholar]
  10. Kumar, G.V.; Kumar, T.R.; Das, P.R. Improved Bio-Inspired Algorithm Design for Prediction of Heart Diseases. J. Surv. Fish. Sci. 2023, 10, 327–331. [Google Scholar]
  11. Bulla, C.M.; Birje, M.N. Efficient Resource Management Using Improved Bio-Inspired Algorithms for the Fog Computing Environment. Int. J. Cloud Appl. Comput. (IJCAC) 2022, 12, 1–18. [Google Scholar] [CrossRef]
  12. Amin, W.; Hussain, F.; Anjum, S. iHPSA: An improved bio-inspired hybrid optimization algorithm for task mapping in Network on Chip. Microprocess. Microsyst. 2022, 90, 104493. [Google Scholar] [CrossRef]
  13. Yu, W.; Kang, H.; Sun, G.; Liang, S.; Li, J. Bio-inspired feature selection in brain disease detection via an improved sparrow search algorithm. IEEE Trans. Instrum. Meas. 2022, 72, 1–15. [Google Scholar] [CrossRef]
  14. Agrawal, P.; Ganesh, T.; Mohamed, A.W. Chaotic gaining sharing knowledge-based optimization algorithm: An improved metaheuristic algorithm for feature selection. Soft Comput. 2021, 25, 9505–9528. [Google Scholar] [CrossRef]
  15. Sayed, G.I.; Tharwat, A.; Hassanien, A.E. Chaotic dragonfly algorithm: An improved metaheuristic algorithm for feature selection. Appl. Intell. 2019, 49, 188–205. [Google Scholar] [CrossRef]
  16. Ramezani, M.; Bahmanyar, D.; Razmjooy, N. A new improved model of marine predator algorithm for optimization problems. Arab. J. Sci. Eng. 2021, 46, 8803–8826. [Google Scholar] [CrossRef]
  17. Qiao, W.; Yang, Z. An improved dolphin swarm algorithm based on Kernel Fuzzy C-means in the application of solving the optimal problems of large-scale function. IEEE Access 2019, 8, 2073–2089. [Google Scholar] [CrossRef]
  18. Ndiaye, A.; Faye, M.; Lefebvre, G.; Tankari, M.A. Adaptive neuro-fuzzy inference system and genetic algorithm (NFGA)-based MPPT controller for PV system: Experimental realization. In Power Electronics Converters and their Control for Renewable Energy Applications; Academic Press: Cambridge, MA, USA, 2023; pp. 265–282. [Google Scholar]
  19. Siddikov, I.; Porubay, O.; Rakhimov, T. Synthesis of the neuro-fuzzy regulator with genetic algorithm. Int. J. Electr. Comput. Eng. (IJECE) 2024, 14, 184–191. [Google Scholar] [CrossRef]
  20. Cuevas, F.; Castillo, O.; Cortes-Antonio, P. A New Fuzzy Approach to Dynamic Adaptation of the Marine Predator Algorithm Parameters in the Optimization of Fuzzy Controllers for Autonomous Mobile Robots. In New Perspectives on Hybrid Intelligent System Design Based on Fuzzy Logic, Neural Networks and Metaheuristics; Springer International Publishing: Cham, Switzerland, 2022; pp. 179–204. [Google Scholar]
  21. Saffari, A.; Khishe, M.; Zahiri, S.H. Fuzzy-ChOA: An improved chimp optimization algorithm for marine mammal classification using artificial neural network. Analog Integr. Circuits Signal Process. 2022, 111, 403–417. [Google Scholar] [CrossRef]
  22. Kasruddin Nasir, A.N.; Ahmad, M.A.; Tokhi, M.O. Hybrid spiral-bacterial foraging algorithm for a fuzzy control design of a flexible manipulator. J. Low Freq. Noise Vib. Act. Control. 2022, 41, 340–358. [Google Scholar] [CrossRef]
  23. Abdolrasol, M.G.; Ayob, A.; Mutlag, A.H.; Ustun, T.S. Optimal fuzzy logic controller based PSO for photovoltaic system. Energy Rep. 2023, 9, 427–434. [Google Scholar] [CrossRef]
  24. Li, Y.; Zhao, D.; Xu, Z.; Heidari, A.A.; Chen, H.; Jiang, X.; Xu, S. bSRWPSO-FKNN: A boosted PSO with fuzzy K-nearest neighbor classifier for predicting atopic dermatitis disease. Front. Neuroinform. 2023, 16, 1063048. [Google Scholar] [CrossRef]
  25. Bernal, E.; Lagunes, M.L.; Castillo, O.; Soria, J.; Valdez, F. Optimization of type-2 fuzzy logic controller design using the GSO and FA algorithms. Int. J. Fuzzy Syst. 2021, 23, 42–57. [Google Scholar] [CrossRef]
  26. Patel, H.R.; Shah, V.A. Shadowed Type-2 Fuzzy Sets in Dynamic Parameter Adaption in Cuckoo Search and Flower Pollination Algorithms for Optimal Design of Fuzzy Fault-Tolerant Controllers. Math. Comput. Appl. 2022, 27, 89. [Google Scholar] [CrossRef]
  27. Patel, H.R.; Shah, V.A. Type-2 fuzzy logic applications designed for active parameter adaptation in metaheuristic algorithm for fuzzy fault-tolerant controller. Int. J. Intell. Comput. Cybern. 2022. ahead-of-print. [Google Scholar] [CrossRef]
  28. Perez, J.; Valdez, F.; Castillo, O.; Roeva, O. Bat algorithm with parameter adaptation using interval type-2 fuzzy logic for benchmark mathematical functions. In Proceedings of the 2016 IEEE 8th International Conference on Intelligent Systems (IS), Sofia, Bulgaria, 4–6 September 2016; pp. 120–127. [Google Scholar]
  29. Patel, H.R.; Shah, V.A. A metaheuristic approach for interval type-2 fuzzy fractional order fault-tolerant controller for a class of uncertain nonlinear system. Autom. Časopis Za Autom. Mjer. Elektron. Računarstvo I Komun. 2022, 63, 656–667. [Google Scholar] [CrossRef]
  30. Valdez, F.; Castillo, O.; Peraza, C. Fuzzy logic in dynamic parameter adaptation of harmony search optimization for benchmark functions and fuzzy controllers. Int. J. Fuzzy Syst. 2020, 22, 1198–1211. [Google Scholar] [CrossRef]
  31. Amador-Angulo, L.; Mendoza, O.; Castro, J.R.; Rodríguez-Díaz, A.; Melin, P.; Castillo, O. Fuzzy sets in dynamic adaptation of parameters of a bee colony optimization for controlling the trajectory of an autonomous mobile robot. Sensors 2016, 16, 1458. [Google Scholar] [CrossRef] [PubMed]
  32. Ouali, M.A.; Ladjal, M. Nonlinear Dynamical Systems Modelling and Identification Using Type-2 Fuzzy Logic-Metaheuristic Algorithms Based Approach. In Proceedings of the 2020 International Conference on Electrical Engineering (ICEE), Istanbul, Turkey, 25–27 September 2020; pp. 1–6. [Google Scholar]
  33. Castillo, O.; Melin, P.; Ontiveros, E.; Peraza, C.; Ochoa, P.; Valdez, F.; Soria, J. A high-speed interval type 2 fuzzy system approach for dynamic parameter adaptation in metaheuristics. Eng. Appl. Artif. Intell. 2019, 85, 666–680. [Google Scholar] [CrossRef]
  34. Wang, J.; Bei, J.; Song, H.; Zhang, H.; Zhang, P. A whale optimization algorithm with combined mutation and removing similarity for global optimization and multilevel thresholding image segmentation. Appl. Soft Comput. 2023, 137, 110130. [Google Scholar] [CrossRef]
  35. Zhao, G.; Xiao, L.; Zhou, H. Busbar Voltage Control of DC Microgrid Group Based on Whale Optimization Algorithm and Fuzzy Control. In Journal of Physics: Conference Series; IOP Publishing: Bristol, UK, 2023; Volume 2465, p. 012022. [Google Scholar]
  36. Panigrahi, A.; Pati, A.; Sahu, B.; Das, M.N.; Nayak, D.S.K.; Sahoo, G.; Kant, S. En-MinWhale: An ensemble approach based on MRMR and Whale optimization for Cancer diagnosis. IEEE Access 2023, 11, 113526–113542. [Google Scholar] [CrossRef]
  37. Dai, Y.; Yu, J.; Zhang, C.; Zhan, B.; Zheng, X. A novel whale optimization algorithm of path planning strategy for mobile robots. Appl. Intell. 2023, 53, 10843–10857. [Google Scholar] [CrossRef]
  38. Zhang, J.; Zhang, T.; Zhang, G.; Wang, D.; Kong, M. Using the Whale Optimization Algorithm to Solve the Optimal Reactive Power Dispatch Problem. Processes 2023, 11, 1513. [Google Scholar] [CrossRef]
  39. Aihong, A.A.; Ya'u, B.I.; Ali, U.; Ahmad, A. An Optimized Deep Learning Method for Software Defect Prediction Using Whale optimization Algorithm (WOA): A Review. ATBU J. Sci. Technol. Educ. 2023, 11, 159–174. [Google Scholar]
  40. Mahdavi, E.; Asadpour, S.; Macedo, L.H.; Romero, R. Reconfiguration of Distribution Networks with Simultaneous Allocation of Distributed Generation Using the Whale Optimization Algorithm. Energies 2023, 16, 4560. [Google Scholar] [CrossRef]
  41. Anvari, S.; Abdollahi Azgomi, M.; Ebrahimi Dishabi, M.R.; Maheri, M. Weighted K-nearest neighbors classification based on Whale optimization algorithm. Iran. J. Fuzzy Syst. 2023, 20, 61–74. [Google Scholar]
  42. Houssein, E.H.; Sayed, A. Dynamic candidate solution boosted beluga whale optimization algorithm for biomedical classification. Mathematics 2023, 11, 707. [Google Scholar] [CrossRef]
  43. Tan, W.H.; Mohamad-Saleh, J. A hybrid whale optimization algorithm based on equilibrium concept. Alex. Eng. J. 2023, 68, 763–786. [Google Scholar] [CrossRef]
  44. Mostafa Bozorgi, S.; Yazdani, S. IWOA: An improved whale optimization algorithm for optimization problems. J. Comput. Des. Eng. 2019, 6, 243–259. [Google Scholar] [CrossRef]
  45. Chakraborty, S.; Saha, A.K.; Sharma, S.; Chakraborty, R.; Debnath, S. A hybrid whale optimization algorithm for global optimization. J. Ambient Intell. Humaniz. Comput. 2023, 14, 431–467. [Google Scholar] [CrossRef]
  46. Chakraborty, S.; Saha, A.K.; Chhabra, A. Improving whale optimization algorithm with elite strategy and its application to engineering-design and cloud task scheduling problems. Cogn. Comput. 2023, 15, 1497–1525. [Google Scholar] [CrossRef]
  47. Mahadeva, R.; Kumar, M.; Gupta, V.; Manik, G.; Patole, S.P. Modified Whale Optimization Algorithm based ANN: A novel predictive model for RO desalination plant. Sci. Rep. 2023, 13, 2901. [Google Scholar] [CrossRef]
  48. Uzer, M.S.; Inan, O. Application of improved hybrid whale optimization algorithm to optimization problems. Neural Comput. Appl. 2023, 35, 12433–12451. [Google Scholar] [CrossRef]
  49. Li, M.; Yu, X.; Fu, B.; Wang, X. A modified whale optimization algorithm with multi-strategy mechanism for global optimization problems. Neural Comput. Appl. 2023, 1–14. [Google Scholar] [CrossRef]
  50. Shen, Y.; Zhang, C.; Gharehchopogh, F.S.; Mirjalili, S. An improved whale optimization algorithm based on multi-population evolution for global optimization and engineering design problems. Expert Syst. Appl. 2023, 215, 119269. [Google Scholar] [CrossRef]
  51. Yang, P.; Wang, T.; Yang, H.; Meng, C.; Zhang, H.; Cheng, L. The Performance of Electronic Current Transformer Fault Diagnosis Model: Using an Improved Whale Optimization Algorithm and RBF Neural Network. Electronics 2023, 12, 1066. [Google Scholar] [CrossRef]
  52. Singh, H.; Rai, V.; Kumar, N.; Dadheech, P.; Kotecha, K.; Selvachandran, G.; Abraham, A. An enhanced whale optimization algorithm for clustering. Multimed. Tools Appl. 2023, 82, 4599–4618. [Google Scholar] [CrossRef]
  53. Elmogy, A.; Miqrish, H.; Elawady, W.; El-Ghaish, H. ANWOA: An adaptive nonlinear whale optimization algorithm for high-dimensional optimization problems. Neural Comput. Appl. 2023, 35, 22671–22686. [Google Scholar] [CrossRef]
  54. UZER, M.S.; Onur, İ.N.A.N. Combining grey wolf optimization and whale optimization algorithm for benchmark test functions. Kahramanmaraş Sütçü İmam Üniversitesi Mühendislik Bilim. Derg. 2023, 26, 462–475. [Google Scholar] [CrossRef]
  55. Deng, H.; Liu, L.; Fang, J.; Qu, B.; Huang, Q. A novel improved whale optimization algorithm for optimization problems with multi-strategy and hybrid algorithm. Math. Comput. Simul. 2023, 205, 794–817. [Google Scholar] [CrossRef]
  56. Mirjalili, S.; Lewis, A. The whale optimization algorithm. Adv. Eng. Softw. 2016, 95, 51–67. [Google Scholar] [CrossRef]
  57. Zadeh, L.A. Fuzzy sets. In Fuzzy Sets, Fuzzy Logic, and Fuzzy Systems: Selected Papers by Lotfi A Zadeh; World Scientific: Singapore, 1996; Volume 6, pp. 394–432. [Google Scholar]
  58. Zadeh, L.A. Fuzzy sets. Inf. Control. 1995, 8, 338–353. [Google Scholar] [CrossRef]
  59. Karnik, N.N.; Mendel, J.; Liang, Q. Type-2 fuzzy logic systems. IEEE Trans. Fuzzy Syst. 1999, 7, 643–658. [Google Scholar] [CrossRef]
  60. Karnik, N.N.; Mendel, J.M. Operations on type-2 fuzzy sets. Int. J. Fuzzy Sets. Syst. 2001, 122, 327–348. [Google Scholar] [CrossRef]
  61. Castillo, O.; Amador-Angulo, L. A generalized type-2 fuzzy logic approach for dynamic parameter adaptation in bee colony optimization applied to fuzzy controller design. Inf. Sci. 2018, 460, 476–496. [Google Scholar] [CrossRef]
Figure 1. Visual representation of the movement of a whale to find food.
Axioms 13 00033 g001
Figure 2. General representation of a bubble-net search mechanism in WOA (X* is the best solution obtained to date): (a) shrinking encircling mechanism and (b) spiral updating position.
Axioms 13 00033 g002
Figure 3. Proposed idea in the fuzzy WOA.
Axioms 13 00033 g003
Figure 4. Structure of a type-1 FLS.
Axioms 13 00033 g004
Figure 5. Structure of an interval type-2 fuzzy system.
Axioms 13 00033 g005
Figure 6. Design of the inputs and outputs of the proposal with IT2FLS.
Axioms 13 00033 g006
Figure 7. Design of the inputs and outputs of the proposal with T1FLS.
Axioms 13 00033 g007
Figure 8. Fuzzy rules of the IT2FLS.
Axioms 13 00033 g008
Figure 9. Plot of the mathematical functions. (a) Sphere, Griewangk, Rastringin, Shewefel, and Sum of Different Powers. (b) Zakharov, Dixon and Price, Levy, Sum of Squares, and Rotated Hyper Ellipsoid.
Axioms 13 00033 g009aAxioms 13 00033 g009b
Figure 10. Behavioral results and comparative of Zakharov function with 100 dimensions.
Axioms 13 00033 g010
Table 1. Set of benchmark functions.
f x NameSearch Domainf MinMathematical Representation
F1Sphere 5.12 ,   5.12 n 0 f x = i = 1 n x i 2
F2Griewangk 600 ,   600 n 0 f x = i = 1 n x i 2 400 i = 1 n c o s x i i + 1
F3Rastringin 5.12 ,   5.12 n 0 f x = 10 n + i = 1 n x i 2 10 c o s ( 2 x i )
F4Shewefel 500 ,   500 n −837.9658 f x = 418.9829 n i = 1 d n x i sin x i
F5Sum of Different Powers 1 ,   1 n 0 f x = i = 1 n x i i + 1
F6Zakharov 5 ,   10 n 0 f x = i = 1 n x i 2 + ( i + 1 n 0.5 i x i ) 2 + ( i = 1 n 0.5 i x i ) 4
F7Dixon and Price 10 ,   10 n 0 f x = x 1 1 2 + i = 2 n i 2 x i 2 x i 1 2
F8Levy 10 ,   10 n 0 f x = s i n 2 π ω 1 + i = 1 n 1 ( ω 1 1 ) 2 [ 1 + 10 s i n 2 ( π ω 1 + 1 ) ] + ω n 1 2 [ 1 + s i n 2 ( 2 π ω n ) ] ,   w h e r e   ω i = 1 + x i 1 4 , for all i = 1,……,n
F9Sum of Squares 10 ,   10 n 0 f x = i = 1 n i x i 2
F10Rotated Hyper Ellipsoid 65.536 ,   65536 n 0 f x = i = 1 n j = 1 i x j 2
Table 2. Benchmark functions of varying r 1   and r 2 values with 10 dimensions.
f x Methods
Original WOA
r 1   and   r 2 Fixed
Original WOA
r 1   and   r 2 Random
FWOA-T1FLSFWOA-IT2FLS
F16.92 × 10−512.49 × 10−13.41 × 10−16.29 × 10−53
F21.61 × 10−96.99 × 10+17.72 × 10+62.91 × 10⁻⁹
F38.79 × 10−102.15 × 10+11.71 × 10+133.74 × 10⁻¹⁰
F42.91 × 10−22.15 × 10+15.00 × 10+29.88 × 10+1
F56.35 × 10−358.21 × 10⁻²−1.69 × 10−151.86 × 10⁻²⁸
F64.54 × 10−13.06 × 10−18.96 × 10+133.97 × 10⁻¹
F71.20 × 10−22.90 × 10−22.90 × 10−21.26 × 10⁻²
F83.97 × 10−11.16 × 1003.84 × 10+146.20 × 10⁻¹
F94.94 × 10−541.16 × 10−13.93 × 10−321.22 × 10−48
F102.21 × 10−521.01 × 10+1−6.55 × 10+137.48 × 10−44
Table 3. Benchmark functions of varying r 1 and r 2 values with 20 dimensions.
f x Methods
Original WOA
r 1   and   r 2 Random
Original WOA
r 1   and   r 2 Fixed
FWOA-T1FLSFWOA-IT2FLS
F11.18 × 10−705.26 × 10−11.06 × 10−417.57 × 10−60
F22.57 × 10−98.75 × 10−13.33 × 10+61.75 × 10⁻¹⁰
F39.47 × 10−106.70 × 10−11.17 × 10+138.22 × 10⁻¹²
F44.06 × 10+21.33 × 10+11.40 × 10+139.20 × 10+1
F54.15 × 10−492.43 × 10−22.25 × 10−362.97 × 10−42
F62.17 × 10−13.29 × 10−11.22 × 10+133.88 × 10⁻¹
F71.13 × 10−21.06 × 1001.06 × 1001.40 × 10−2
F88.45 × 10−11.16 × 1006.27 × 10−15.67 × 10⁻¹
F93.17 × 10−724.03 × 10−11.21 × 10−525.25 × 10−55
F101.16 × 10−714.19 × 1004.29 × 10−531.25 × 10−57
Table 4. Benchmark functions of varying r 1 and r 2 values with 30 dimensions.
f x Methods
Original WOA
r 1   and   r 2 Random
Original WOA
r 1   and   r 2 Fixed
FWOA-T1FLSFWOA-IT2FLS
F19.58 × 10−842.39 × 10−11.20 × 10−512.84 × 10−59
F22.57 × 10−96.35 × 10+15.60 × 10+57.22 × 10⁻⁹
F31.36 × 10−104.36 × 10+21.17 × 10+131.39 × 10⁻⁹
F43.76 × 10+24.39 × 10+21.40 × 10+132.23 × 10+2
F53.75 × 10−541.03 × 10−14.47 × 10−271.56 × 10−42
F65.65 × 10−13.73 × 10−15.65 × 10−11.24 × 10⁻¹
F71.39 × 10−24.50 × 10−18.01 × 10+51.31 × 10⁻²
F89.39 × 10−19.35 × 10−14.77 × 10+144.32 × 10⁻¹
F96.38 × 10−816.65 × 10+1−1.28 × 10−621.19 × 10−61
F102.14 × 10−784.60 × 100−4.37 × 1007.51 × 10−66
Table 5. Benchmark functions of varying r 1 and r 2 values with 50 dimensions.
f x Methods
Original WOA
r 1   and   r 2 Random
Original WOA
r 1   and   r 2 Fixed
FWOA-T1FLSFWOA-IT2FLS
F11.69 × 10−93−3.57 × 10−11.00 × 10−562.35 × 10−60
F25.28 × 10−9−6.03 × 1001.42 × 1062.15 × 10−9
F38.64 × 10−107.55 × 10−22.16 × 1051.96 × 10−10
F44.21 × 1021.27 × 1025.00 × 10+23.03 × 10+2
F51.55 × 10−641.00 × 10−13.91 × 10−383.50 × 10−42
F65.65 × 10−11.71 × 1003.75 × 10134.35 × 10−1
F71.12 × 10−25.63 × 10−12.28 × 10141.30 × 10−2
F89.93 × 10−17.21 × 10−13.97 × 10145.81 × 10−1
F91.14 × 10−916.25 × 10⁻¹−1.33 × 1004.88 × 10−59
F101.64 × 10−89−2.57 × 100−4.37 × 1002.80 × 10−59
Table 6. Benchmark functions of varying r 1 and r 2   values with 100 dimensions.
f x Methods
Original WOA
r 1   and   r 2 Random
Original WOA
r 1   and   r 2 Fixed
FWOA-T1FLSFWOA-IT2FLS
F12.34 × 10−1012.68 × 10−15.17 × 10−632.63 × 10−59
F24.00 × 10−97.57 × 10+13.44 × 10+54.59 × 10⁻¹⁰
F38.19 × 10−104.53 × 10−11.17 × 10+138.94 × 10⁻¹⁰
F44.21 × 1025.00 × 1021.40 × 10+134.87 × 10+2
F52.40 × 10−647.40 × 10−27.65 × 10−792.67 × 10−43
F65.00 × 1001.61 × 1001.62 × 10+141.29 × 100
F71.12 × 10−21.33 × 1001.33 × 1001.20 × 10−2
F81.00 × 1006.78 × 10−17.05 × 10+144.38 × 10⁻¹
F92.52 × 10−1022.91 × 1003.33 × 10−17.47 × 10−59
F101.03 × 10−98−2.17 × 1002.53 × 10−802.01 × 10−60
Table 7. Statistical test of original WOA and FWOA-IT2FLS.
f x Methods
FWOA-IT2FLSOriginal WOA
r 1   and   r 2 Random
Z-ValueEvidence
F1−2.63 × 10−592.34 × 10−101−1.265NS
F24.59 × 10−104.00 × 10⁻⁹−1.004NS
F38.94 × 10−108.19 × 10⁻¹⁰−3.531S
F44.87 × 10+24.21 × 10+2−97.494S
F52.67 × 10−432.40 × 10−641.281NS
F61.29 × 1005.00 × 100−0.016NS
F71.20 × 10−21.12 × 10−20.0543NS
F84.38 × 10−11.00 × 10077.992NS
F97.47 × 10−59−2.52 × 10−102−0.852NS
F102.01 × 10−60−1.03 × 10−98−1.0054NS
Table 8. Statistical test of original WOA and FWOA-T1FLS.
f x Methods
FWOA-T1FLSOriginal WOA
r 1   and   r 2 Random
Z-ValueEvidence
F15.71 × 10−632.34 × 10−1010.560NS
F23.44 × 10+54.00 × 10−93.085NS
F31.17 × 10−138.19 × 10⁻¹⁰−2.902S
F41.40 × 10+134.21 × 10+2591.500NS
F57.65 × 10−792.40 × 10−64−1.600S
F61.62 × 10+145.00 × 100−0.183NS
F71.33 × 1001.12 × 10−2−1.002NS
F87.05 × 10+141.00 × 100−1.686S
F93.33 × 10−1−2.52 × 10−102−1.000NS
F102.53 × 10−80−1.03 × 10−983.122NS
Table 9. Statistical test of FWOA-IT2FLS and FWOA-T1FLS.
f x Methods
FWOA-IT2FLSFWOA-T1FLSZ-ValueEvidence
F12.63 × 10−599.04 × 10−62−1.265NS
F2−4.59 × 10−103.44 × 10+5−3.09S
F3−8.94 × 10⁻¹⁰−2.02 × 10+52.902NS
F4−4.87 × 10+2−5.02 × 10+21.4388NS
F52.67 × 10−437.65 × 10−791.281NS
F61.29 × 1005.00 × 1000.166NS
F71.20 × 10−21.22 × 10−21.807NS
F84.38 × 10−19.69 × 10⁻¹−8.242S
F97.47 × 10−593.33 × 10−11.000NS
F102.01 × 10−602.53 × 10−80−1.005NS
Table 10. Comparative results (best and worst) with FBCO, original WOA, and the proposed method.
f x Methods
Original WOA
r 1   and   r 2 Random
Fuzzy WOA-T1FLSFuzzy WOA-IT2FLSFBCO-IT2FLS [61]
BestWorstBestWorstBestWorstBestWorst
F11.60 × 10−971.98 × 10−92 5. 43 × 10−552. 23 × 10−551.74 × 10−592.94 × 10−60 7.74 × 10⁻⁸ 6.94 × 10⁻⁷
F23.57 × 10−8 1.32 × 10⁻⁸ 1.04 × 10−82.34 × 1073.73 × 10−84.02 × 10⁻⁸ 8.40 × 10⁻⁵ 3.26 × 10⁻²
F34.81 × 10−9 9.58 × 10⁻⁹ 4.67 × 10+48.69 × 10+54.78 × 10−98.90 × 10−9 7.52 × 100 1.51 × 10+1
F44.20 × 102 4.22 × 10+2 5.00 × 1025.00 × 10+23.03 × 10+23.03 × 10+2 1.01 × 10³ 2.47 × 10+3
F53.92 × 10−63 3.24 × 10−94 5.00 × 1021.35 × 10−361.77 × 10−867.93 × 10−41 1.87 × 10⁻¹⁰ 1.08 × 10⁻⁶
F64.92 × 1009.24 × 100 8.52 × 10+147.69 × 10+144.99 × 1008.53 × 100 5.46 × 10² 7.20 × 10+2
F72.18 × 10−63.33 × 10⁻¹ 1.13 × 10+81.00 × 10+14.14 × 10−43.18 × 10−1 1.76 × 100 9.06 × 100
F87.72 × 10−1 1.03 × 100 1.01 × 10+149.98 × 10+149.63 × 10−21.22 × 100 6.37 × 10⁻⁷ 1.04 × 10⁻⁵
F92.96 × 10−902.56 × 10−90 1.00 × 10+11.63 × 10−71.70 × 10−577.68 × 10−58 5.10 × 10⁶ 1.29 × 10⁻⁴
F102.56 × 10−892.88 × 10−88 6.55 × 10+15.68 × 10−76.29 × 10−595.96 × 10−58 1.35 × 10⁻⁴ 2.44 × 10⁻³
Table 11. Standard deviation results of FBCO-IT2FLS, original WOA, and the proposed method.
f x Methods
Original WOA
r 1   and   r 2 Random
FWOA-IT2FLSFBCO-IT2FLS [61]
F12.34 × 10−1012.63 × 10−591.74 × 10⁻⁷
F24.00 × 10−91.36 × 10−86.12 × 10−3
F38.19 × 10−108.14 × 10−101.98 × 100
F44.21 × 1023.37 × 10−123.59 × 10+2
F52.40 × 10−642.67 × 10−432.46 × 10⁻⁷
F65.00 × 1001.29 × 1003.89 × 10+1
F71.12 × 10−21.20 × 10−21.76 × 100
F81.00 × 1004.38 × 10−11.91 × 10⁻⁶
F92.52 × 10−1027.47 × 10−592.50 × 10⁻⁵
F101.03 × 10−982.01 × 10−606.83 × 10⁻⁴
Disclaimer/Publisher’s Note: The statements, opinions and data contained in all publications are solely those of the individual author(s) and contributor(s) and not of MDPI and/or the editor(s). MDPI and/or the editor(s) disclaim responsibility for any injury to people or property resulting from any ideas, methods, instructions or products referred to in the content.

