
Interval Type-3 Fuzzy Inference System Design for Medical Classification Using Genetic Algorithms


Tijuana Institute of Technology, Tecnológico Nacional de México, Calzada Tecnológico S/N, Fracc. Tomas Aquino, Tijuana 22379, BC, Mexico
*
Author to whom correspondence should be addressed.
Axioms 2024, 13(1), 5; https://0-doi-org.brum.beds.ac.uk/10.3390/axioms13010005
Submission received: 13 November 2023
/
Revised: 16 December 2023
/
Accepted: 19 December 2023
/
Published: 20 December 2023
(This article belongs to the Special Issue Advances in Mathematical Optimization Algorithms and Its Applications)
Abstract
:An essential aspect of healthcare is receiving an appropriate and opportune disease diagnosis. In recent years, there has been enormous progress in combining artificial intelligence to help professionals perform these tasks. The design of interval Type-3 fuzzy inference systems (IT3FIS) for medical classification is proposed in this work. This work proposed a genetic algorithm (GA) for the IT3FIS design where the fuzzy inputs correspond to attributes relational to a particular disease. This optimization allows us to find some main fuzzy inference systems (FIS) parameters, such as membership function (MF) parameters and the fuzzy if-then rules. As a comparison against the proposed method, the results achieved in this work are compared with Type-1 fuzzy inference systems (T1FIS), Interval Type-2 fuzzy inference systems (IT2FIS), and General Type-2 fuzzy inference systems (GT2FIS) using medical datasets such as Haberman’s Survival, Cryotherapy, Immunotherapy, PIMA Indian Diabetes, Indian Liver, and Breast Cancer Coimbra dataset, which achieved 75.30, 87.13, 82.04, 77.76, 71.86, and 71.06, respectively. Also, cross-validation tests were performed. Instances established as design sets are used to design the fuzzy inference systems, the optimization technique seeks to reduce the classification error using this set, and finally, the testing set allows the validation of the real performance of the FIS.
Keywords:
medical classification; classification; genetic algorithm; Interval Type-3 fuzzy logic; Cryotherapy; Haberman; Immunotherapy; PIMA Indian Diabetes; Indian Liver; Breast Cancer CoimbraMSC:
03B52; 03E72; 62P301. Introduction
In modern healthcare, the accurate diagnosis of diseases holds paramount significance. Timely and precise identification of medical conditions is pivotal for effective treatment and essential for mitigating their potentially dire consequences. In recent years, the incorporation of artificial intelligence (AI) into medical diagnostics has emerged as a transformative force, offering innovative approaches to disease classification and detection, allowing health experts more tools to provide a correct diagnosis. Artificial intelligence represents a powerful ally in pursuing more accurate and efficient disease diagnosis with its capacity to analyze extensive datasets, discern patterns, and adapt to evolving scenarios. Machine learning algorithms have demonstrated remarkable proficiency in the early detection of diseases, often preceding the manifestation of clinical symptoms [1,2,3,4]. But another area within AI is fuzzy logic (FL), which, since its creation, has had many areas of application where it has demonstrated its effectiveness in solving highly complex problems. Its applications range from the classification of foods based on their characteristics [5], fuzzy control problems where the inputs of the FIS play an important role in obtaining important output values that allow the stability of the models [6], to responses combination for pattern recognition applied to time series prediction [7] or human recognition [8], and classification problems [9] to mention a few applications. A significant contribution that FL has had is in medical applications, where, either alone or in combination with other techniques, it has allowed it to be an excellent support tool in medical diagnosis [10,11]. In Ref. [12], a fuzzy rule-based model is presented for Diabetes classification, where the results achieved demonstrated its effectiveness to be proven in the healthcare sector to help in the diagnosis. In Ref. [13], a system based on FL to predict postoperative complications is proposed using characteristics about current voltage for acupuncture points; the proposed method was successfully applied to the surgical treatment of benign prostatic hyperplasia, demonstrating it to be a tool to help in the diagnosis. In Ref. [14], a fuzzy decision tree is proposed as a classification method for medical data, where authors show that the proposed method achieved better accuracy over conventional classifiers. Comparisons among Support Vector Machine (SVM), Naive Bayes (NB), Decision Tree (DT), Artificial Neural Networks (ANN), Type 1, Interval, and General Type-2 FIS have been performed, where the FIS are optimized using particle swarm optimization, the General Type-2 FIS proved to have better results over the other techniques applied to medical diagnosis even using different level of uncertainty and cross-validation [15,16].
Many works have compared the results obtained between different types of fuzzy systems. In these works, it has been observed that depending on the complexity of the problem and the data used, the type of FL to be used will depend. In Ref. [6], The advantages of Interval Type-2 FIS are shown over Type-1 FIS, applied to a modification of Flower Pollination Optimization for Rotary Inverted Pendulum System. The application of noise effects and load disturbance mainly demonstrates the robustness and effectiveness of the method. In Ref. [17], a General Type-2 fuzzy PID (proportional integral derivative) controller is presented and compared versus PID, Type-1 fuzzy PID, and Interval Type-2 fuzzy PID using uncertainties such as controller disturbance or output noise, and the proposed PID achieved better results than the other methods shown. It is also important to mention the combination that has been made of Type-2 fuzzy logic with the Internet of Things (IoT). In Ref. [18], a control model using Type-2 fuzzy logic is presented to determine the intensity of water absorption applied to IoT infrastructure with sensors to measure humidity conditions. In Ref. [19], Type-2 fuzzy logic is applied to analyze accelerometer signals for an IoT system for driving support, showing its ability to adjust to driving expectations by collecting information about driving conditions. In Ref. [8], a comparison of T1FIS, IT2FIS, and GT2FIS optimized by a hierarchical genetic algorithm is shown for the combination of responses of modular granular neural networks applied to human recognition, where the achieved results prove the effectiveness of the GT2FIS when the biometric measures information has noise or have poor quality. Comparisons applied FL to time series prediction are also performed and applied to COVID-19-confirmed cases, where a fuzzy weighted average is proposed to obtain a final prediction of ensemble neural networks. The achieved results prove the advantages of the Interval Type-3 fuzzy weighted average in predicting information of complex time series. The parameters of the FIS are optimized using a Firefly Algorithm [7]. Although there are currently many techniques for performing optimizations, GA is one of the first methods used to search for parameters and architectures, which continues to be an excellent tool for obtaining optimized parameters related to FL [20,21,22,23]. In Ref. [24], a method combining GA and FL is applied to improve the performance of a pump as a turbine is proposed. In Ref. [25], a real-coded genetic algorithm with fuzzy control is proposed, where the fuzzy inference system establishes its parameters, such as the probability of mutation, type of crossover, and population size applied to system dynamics models. In Ref. [26], a binary-coded genetic algorithm is proposed and applied to Magnetotelluric modeling, where each gene is used to optimize the resistivity and thickness of homogenously horizontal layers. In Ref. [27], a real-coded genetic algorithm is proposed and applied to software mutation testing; the proposed method integrates the path coverage-based testing method with the novel idea of tracing a fault detection matrix. In Ref. [28], a real-coded genetic algorithm is proposed and applied to optimize the Stewart platform with rotary actuators for the flight simulator mechanism. In Ref. [29], implementing FL in a 3D printer is proposed. The authors work on modifying its base using the direct current motor, the acquisition card, and the power stage. The results show that the optimization of values of the MF of the FIS obtained better times than other techniques.
One of the main motivations of this work is to improve results obtained in previous works, where fuzzy systems were designed to classify diabetes using the PIMA Indian Diabetes dataset. The results showed the effectiveness of IT2FIS for classifying this disease. In Ref. [30], a real-coded GA is developed to design Type-1 FIS using five attributes of the dataset, where a comparison designing different fuzzy if-then rules was presented, demonstrating the importance of designing them. In Ref. [31], the design of Interval Type-2 FIS and its optimization using a GA is proposed, and the results achieved prove the effectiveness of these kinds of fuzzy systems over the Type-1 FIS applied to the PIMA Indian Diabetes dataset using the same five attributes. For both work the instances were divided into two sets: design and testing. In this work, we proposed the IT3FIS design. The novelty of the proposed method lies in the design of a general method capable of classifying by designing the IT3FIS using a percentage of instances. The design consists of establishing the ranges of the input fuzzy variables and the design of the fuzzy rules, allowing the reduction of the number of fuzzy rules, proving to be an excellent tool for classification and reducing time execution.
This paper has the following structure. A description of Type-3 fuzzy logic can be found in Section 2. In Section 3, a brief description of genetic algorithms is presented. The proposed method is described in Section 4. In Section 5, the results obtained by the proposed method are presented. In Section 6, discussion and statistical tests are shown. In Section 7, our conclusions are shown.
2. Type-3 Fuzzy Logic
Type-1 FL is a helpful intelligence technique that can be used to be applied to model elaborate problems. L.A. Zadeh proposed this technique in 1965 [32,33], where an element in part belongs with a particular membership grade with a crisp number between 0 and 1 to a set. An improvement of the FL was proposed in 1975: Type-2 FL [34]. In Type-2 FL, unlike Type-1 FL, the elements do not have a crisp number [0, 1]. A fuzzy set (FS) in [0, 1] allows the definition of the MF [35]. The description of a Type-2 fuzzy system is given by Equation (1):
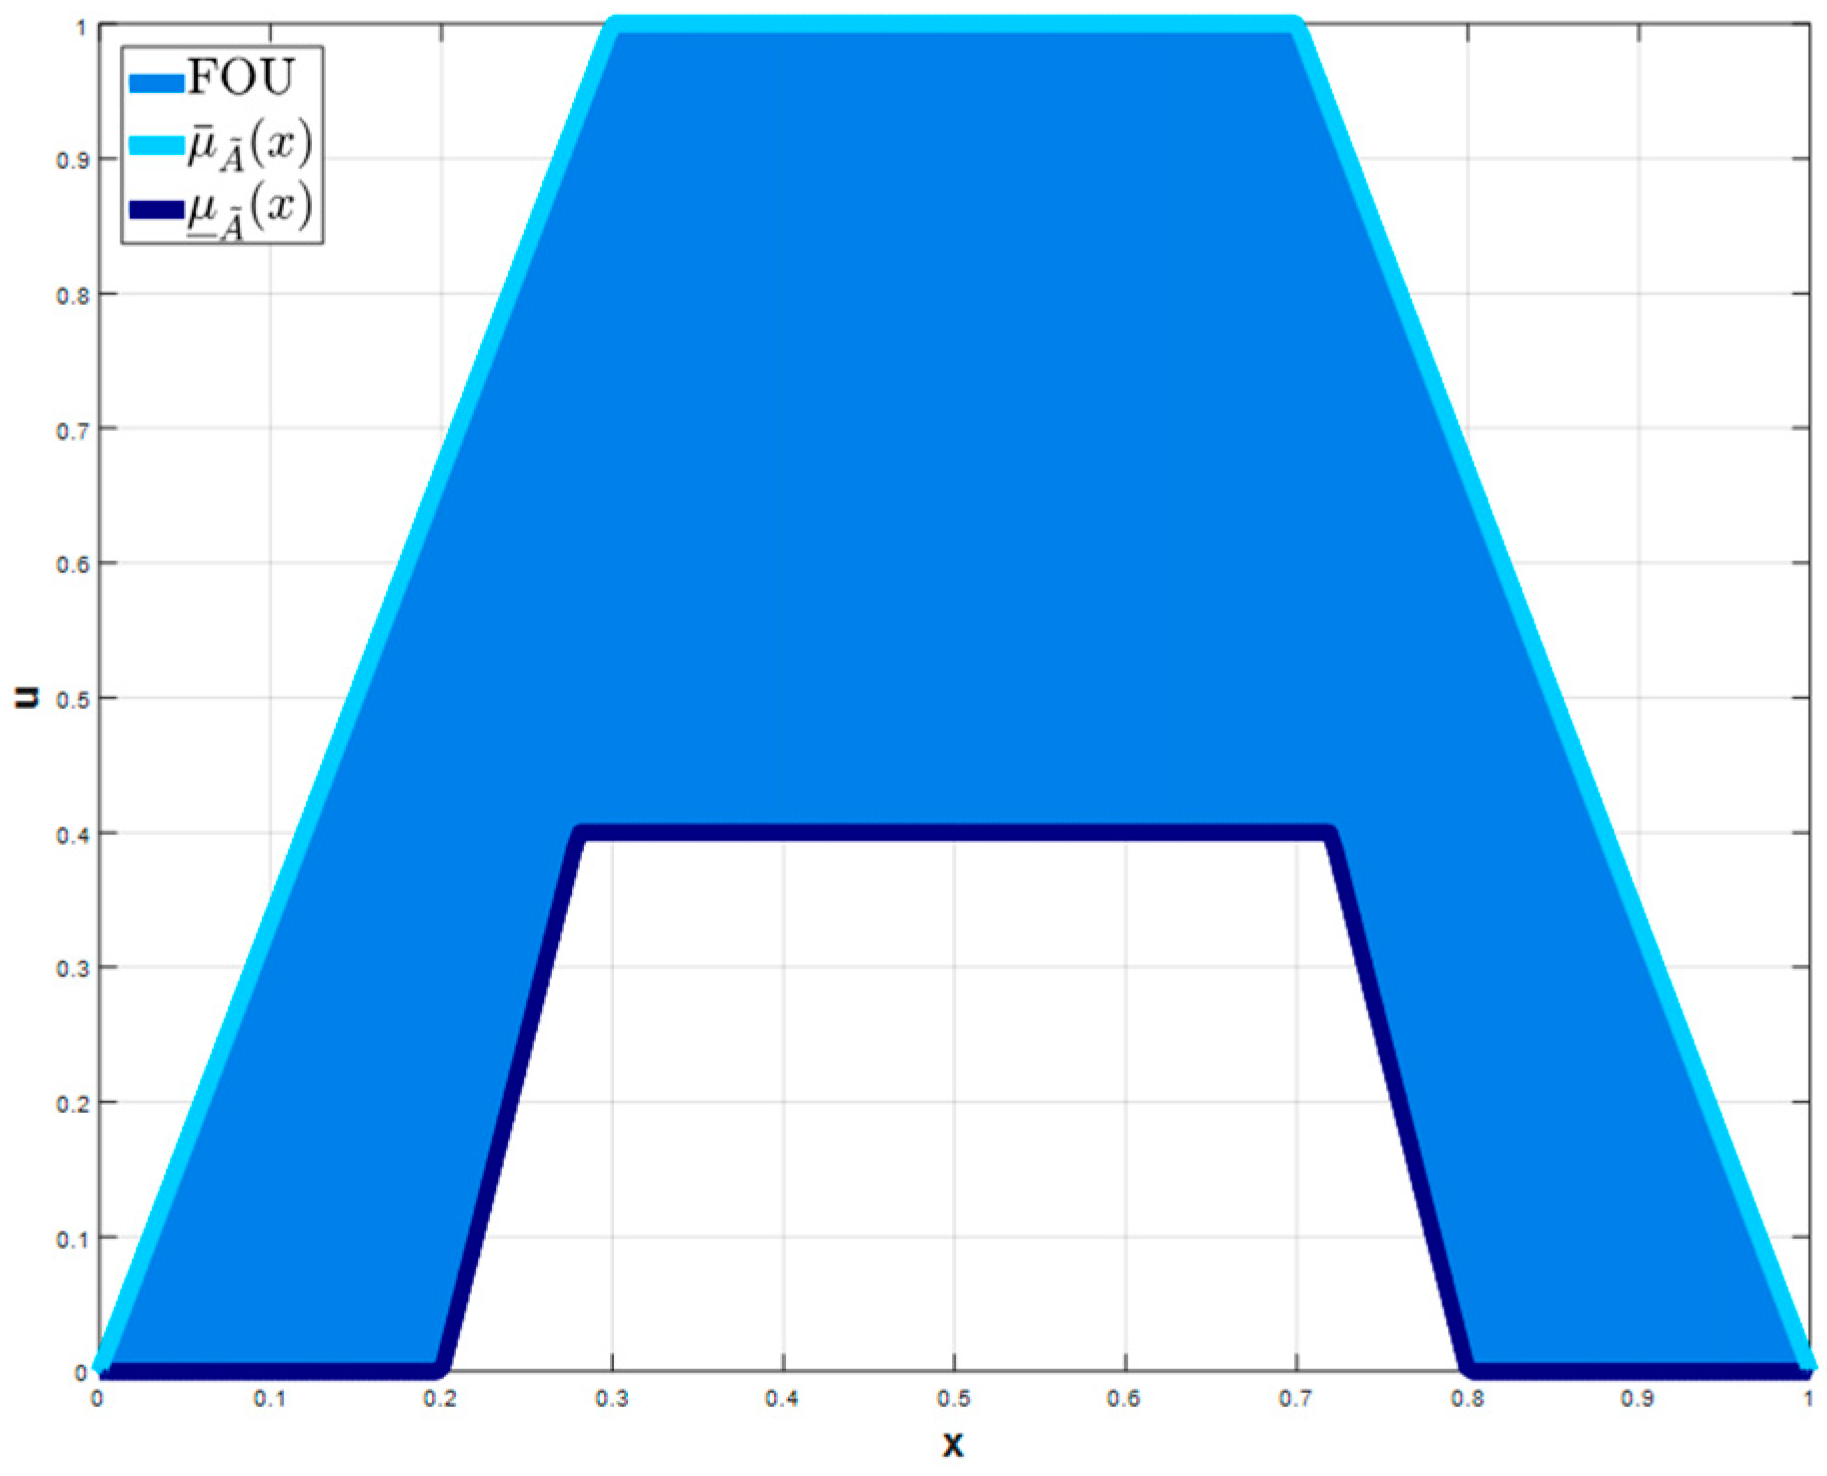
where X represents the domain of the fuzzy variable, a primary membership is represented by , and defines a secondary membership (Type-1 FS). The footprint of uncertainty (FOU) represents the uncertainty region. A Type-2 MF interval occurs when = 1, . In Figure 1, the upper and lower MF of a Trapezoidal Type-2 MF [36] is shown. An Interval Type-2 fuzzy set is determined as Equation (2).
In Type-3, we can potentially handle higher degrees of uncertainty with respect to Type-2 due to the nature of the membership functions. A Type-3 fuzzy set (T3 FS) [37,38] is represented by the notation , is the graph of a trivariate function named MF of , in the cartesian product defined by Equation (3), where the primary variable of has a universe , . The membership function of is defined by , and is a Type-3 membership function of the T3 fuzzy set defined by Equation (4):
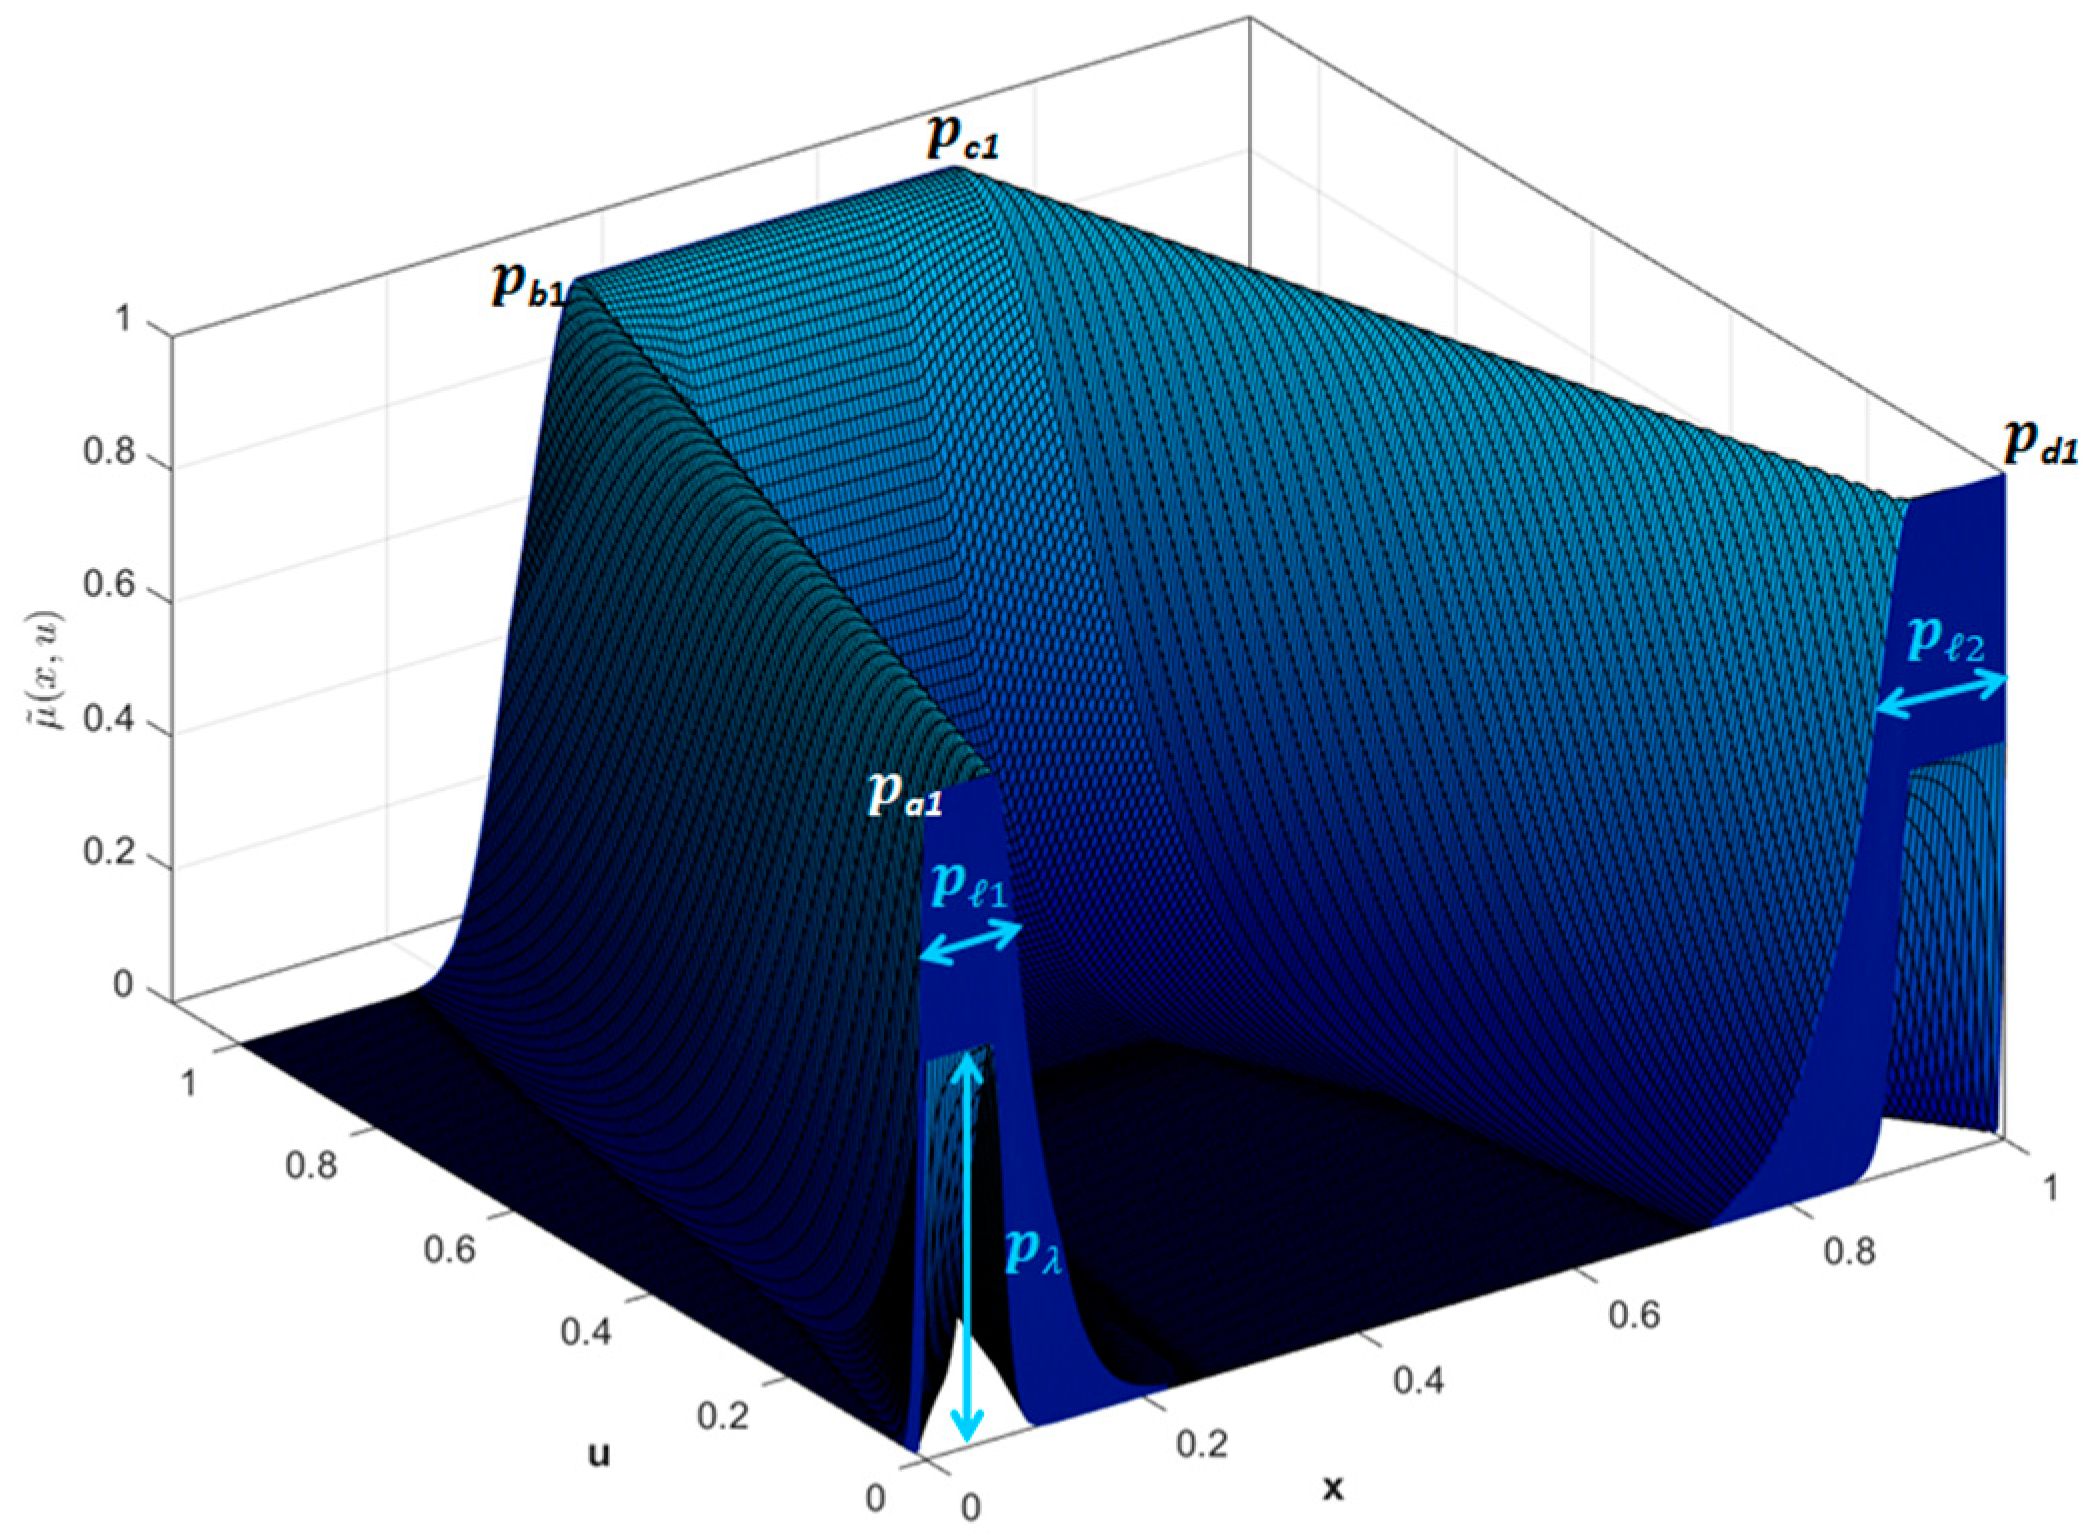
where u is the secondary variable and has the universe U, and V for the tertiary variable v. A Trapezoidal Interval Type-3 MF = ScaleTrapScaleGaussIT3MF with Trapezoidal has for the upper membership function (UMF) as parameters , and the lower membership function (LMF): (LowerScale) and (LowerLag) to form ]. The representation of this MF is given by Equation (5).
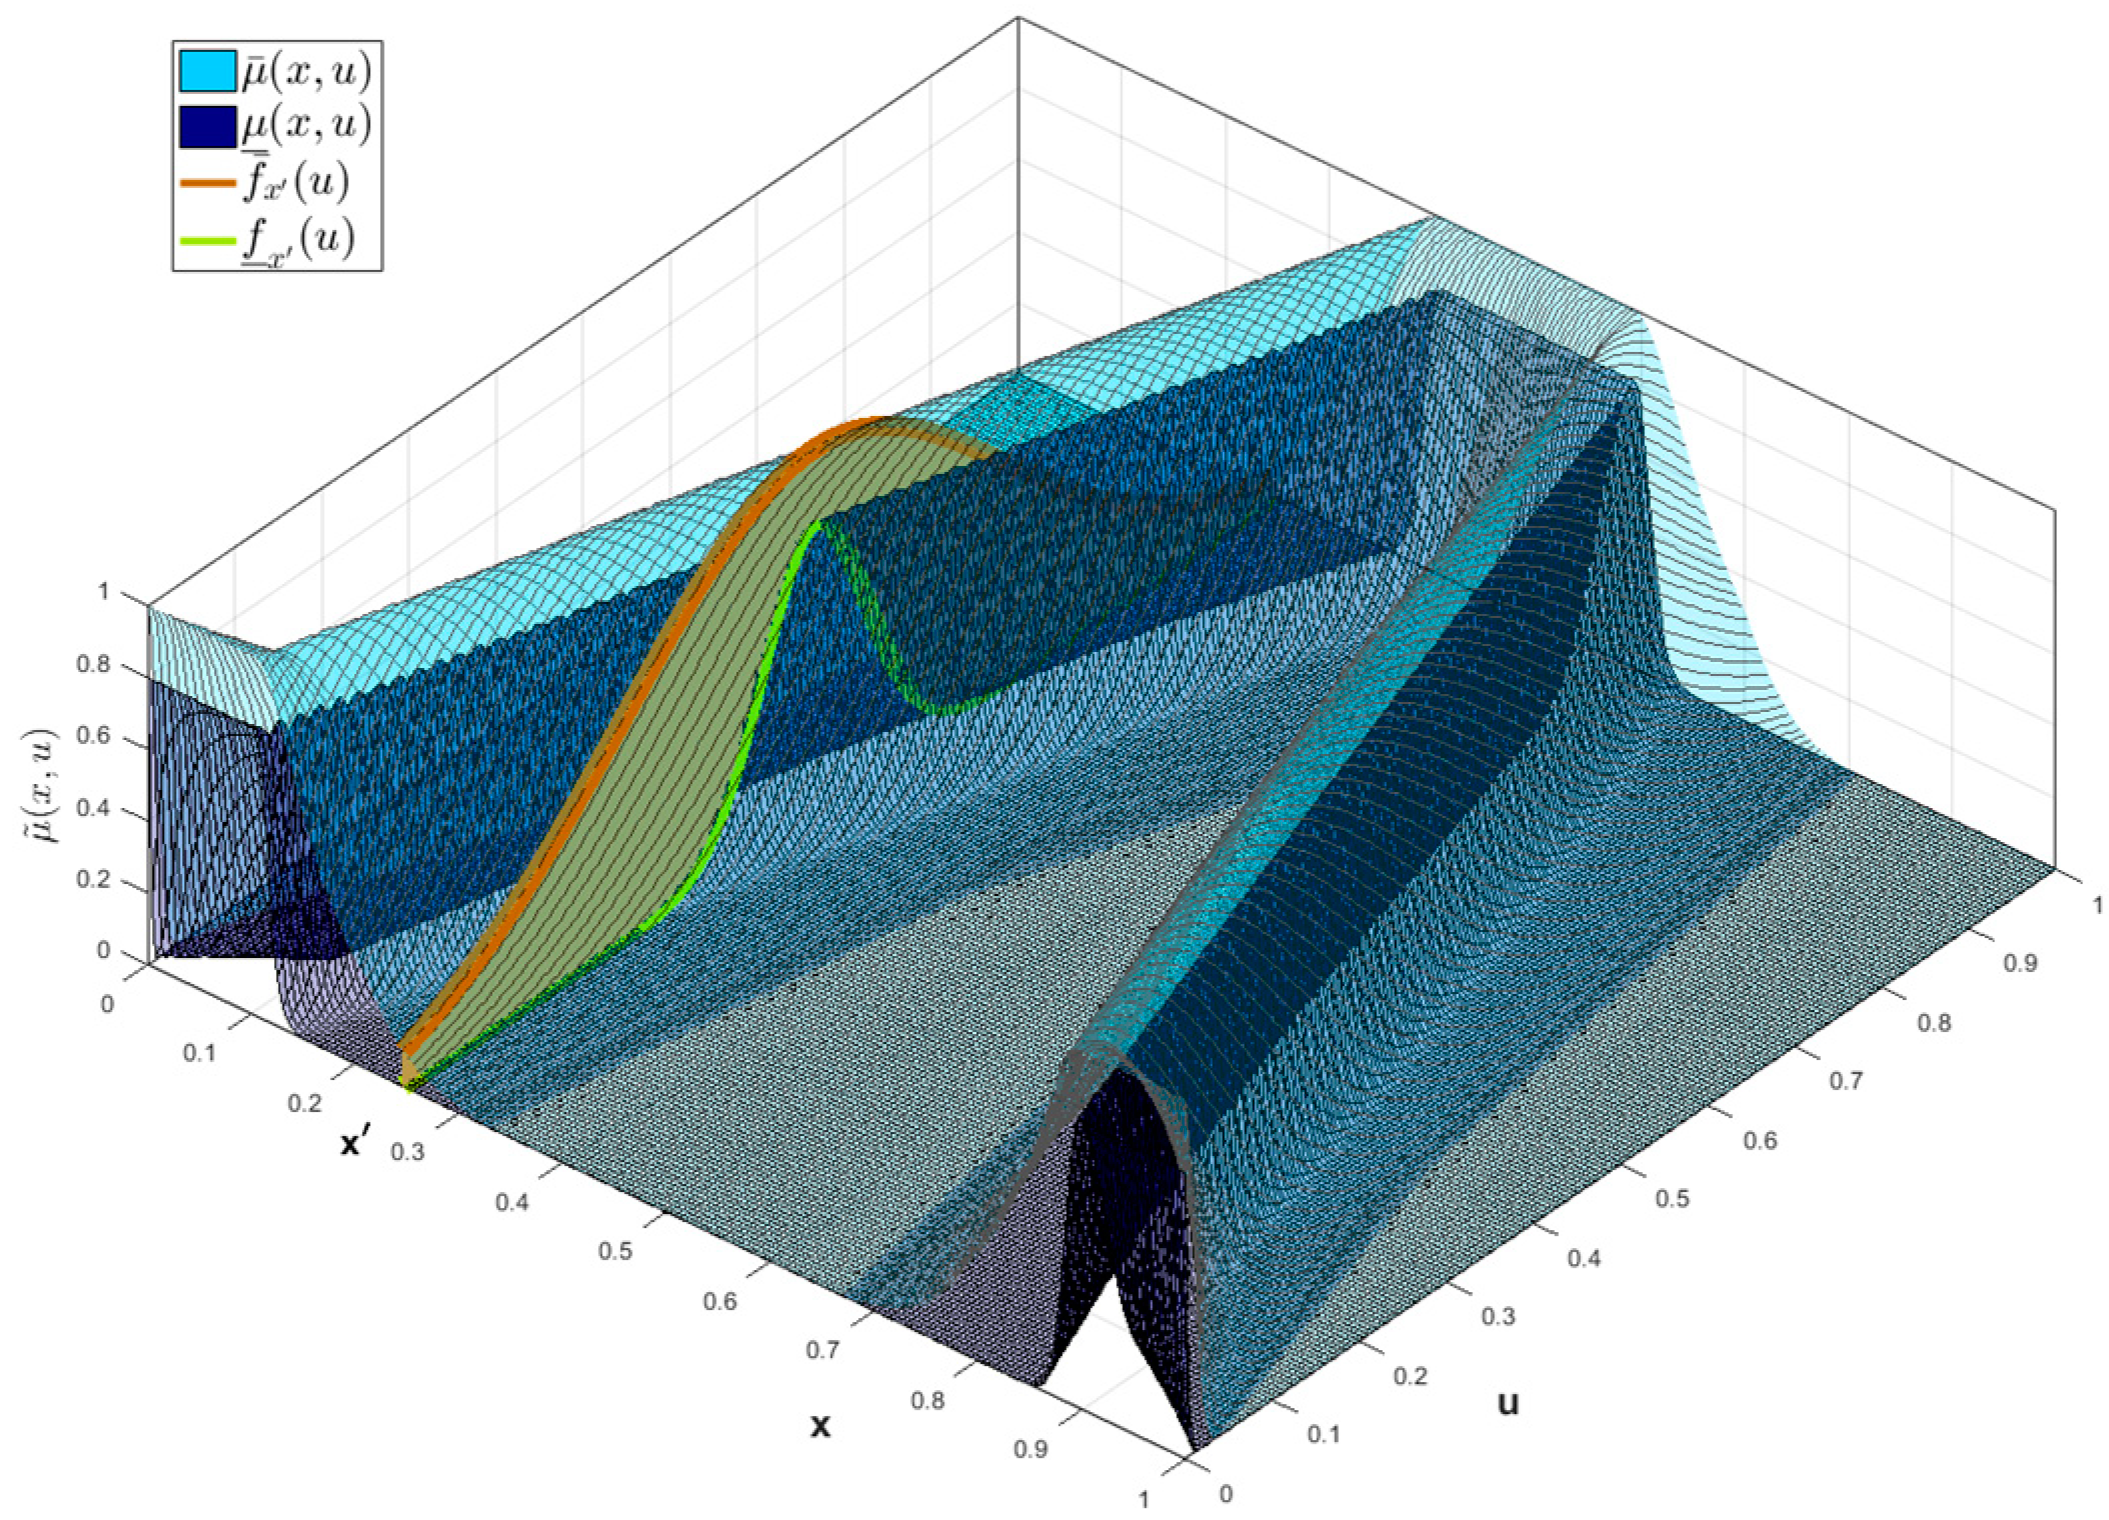
The vertical cuts identify the , these are Interval Type-2 FS with Gaussian Interval Type-2 MF, with parameters for the UMF, and for LMF: (LowerScale) and (LowerLag). An illustration of a Type-3 Trapezoidal MF with a vertical cut is shown in Figure 2. This Interval Type-3 membership function is defined with the Equation (6).
The values () determine the lower membership function of the domain of uncertainty (DOU), is determined by the values where these are functions of the parameters () of the UMF for the domain of uncertainty, , and the elements of the LowerLag () vector. i.e.,
The function and the parameter are multiplicated to create the LMF of the domain of uncertainty, , is described as the following: . Then, the upper and lower limits of the domain of uncertainty are represented respectively by and . The range, , and radio, , of the footprint of uncertainty are calculated by Equations (14) and (15).
where machine epsilon is represented by . Equation (16) defines the apex, , of the IT3 MF .
where , , and y . Then, the vertical cuts with Interval Type-2 MF, , are presented with the Equations (17) and (18).
where , . If , then . Then, and are the UMF and LMF of the vertical cuts IT2 FS of the secondary IT2 MF of the IT3 FS [39]. Figure 3 shows a representation of this IT3 MF.
3. Genetic Algorithms
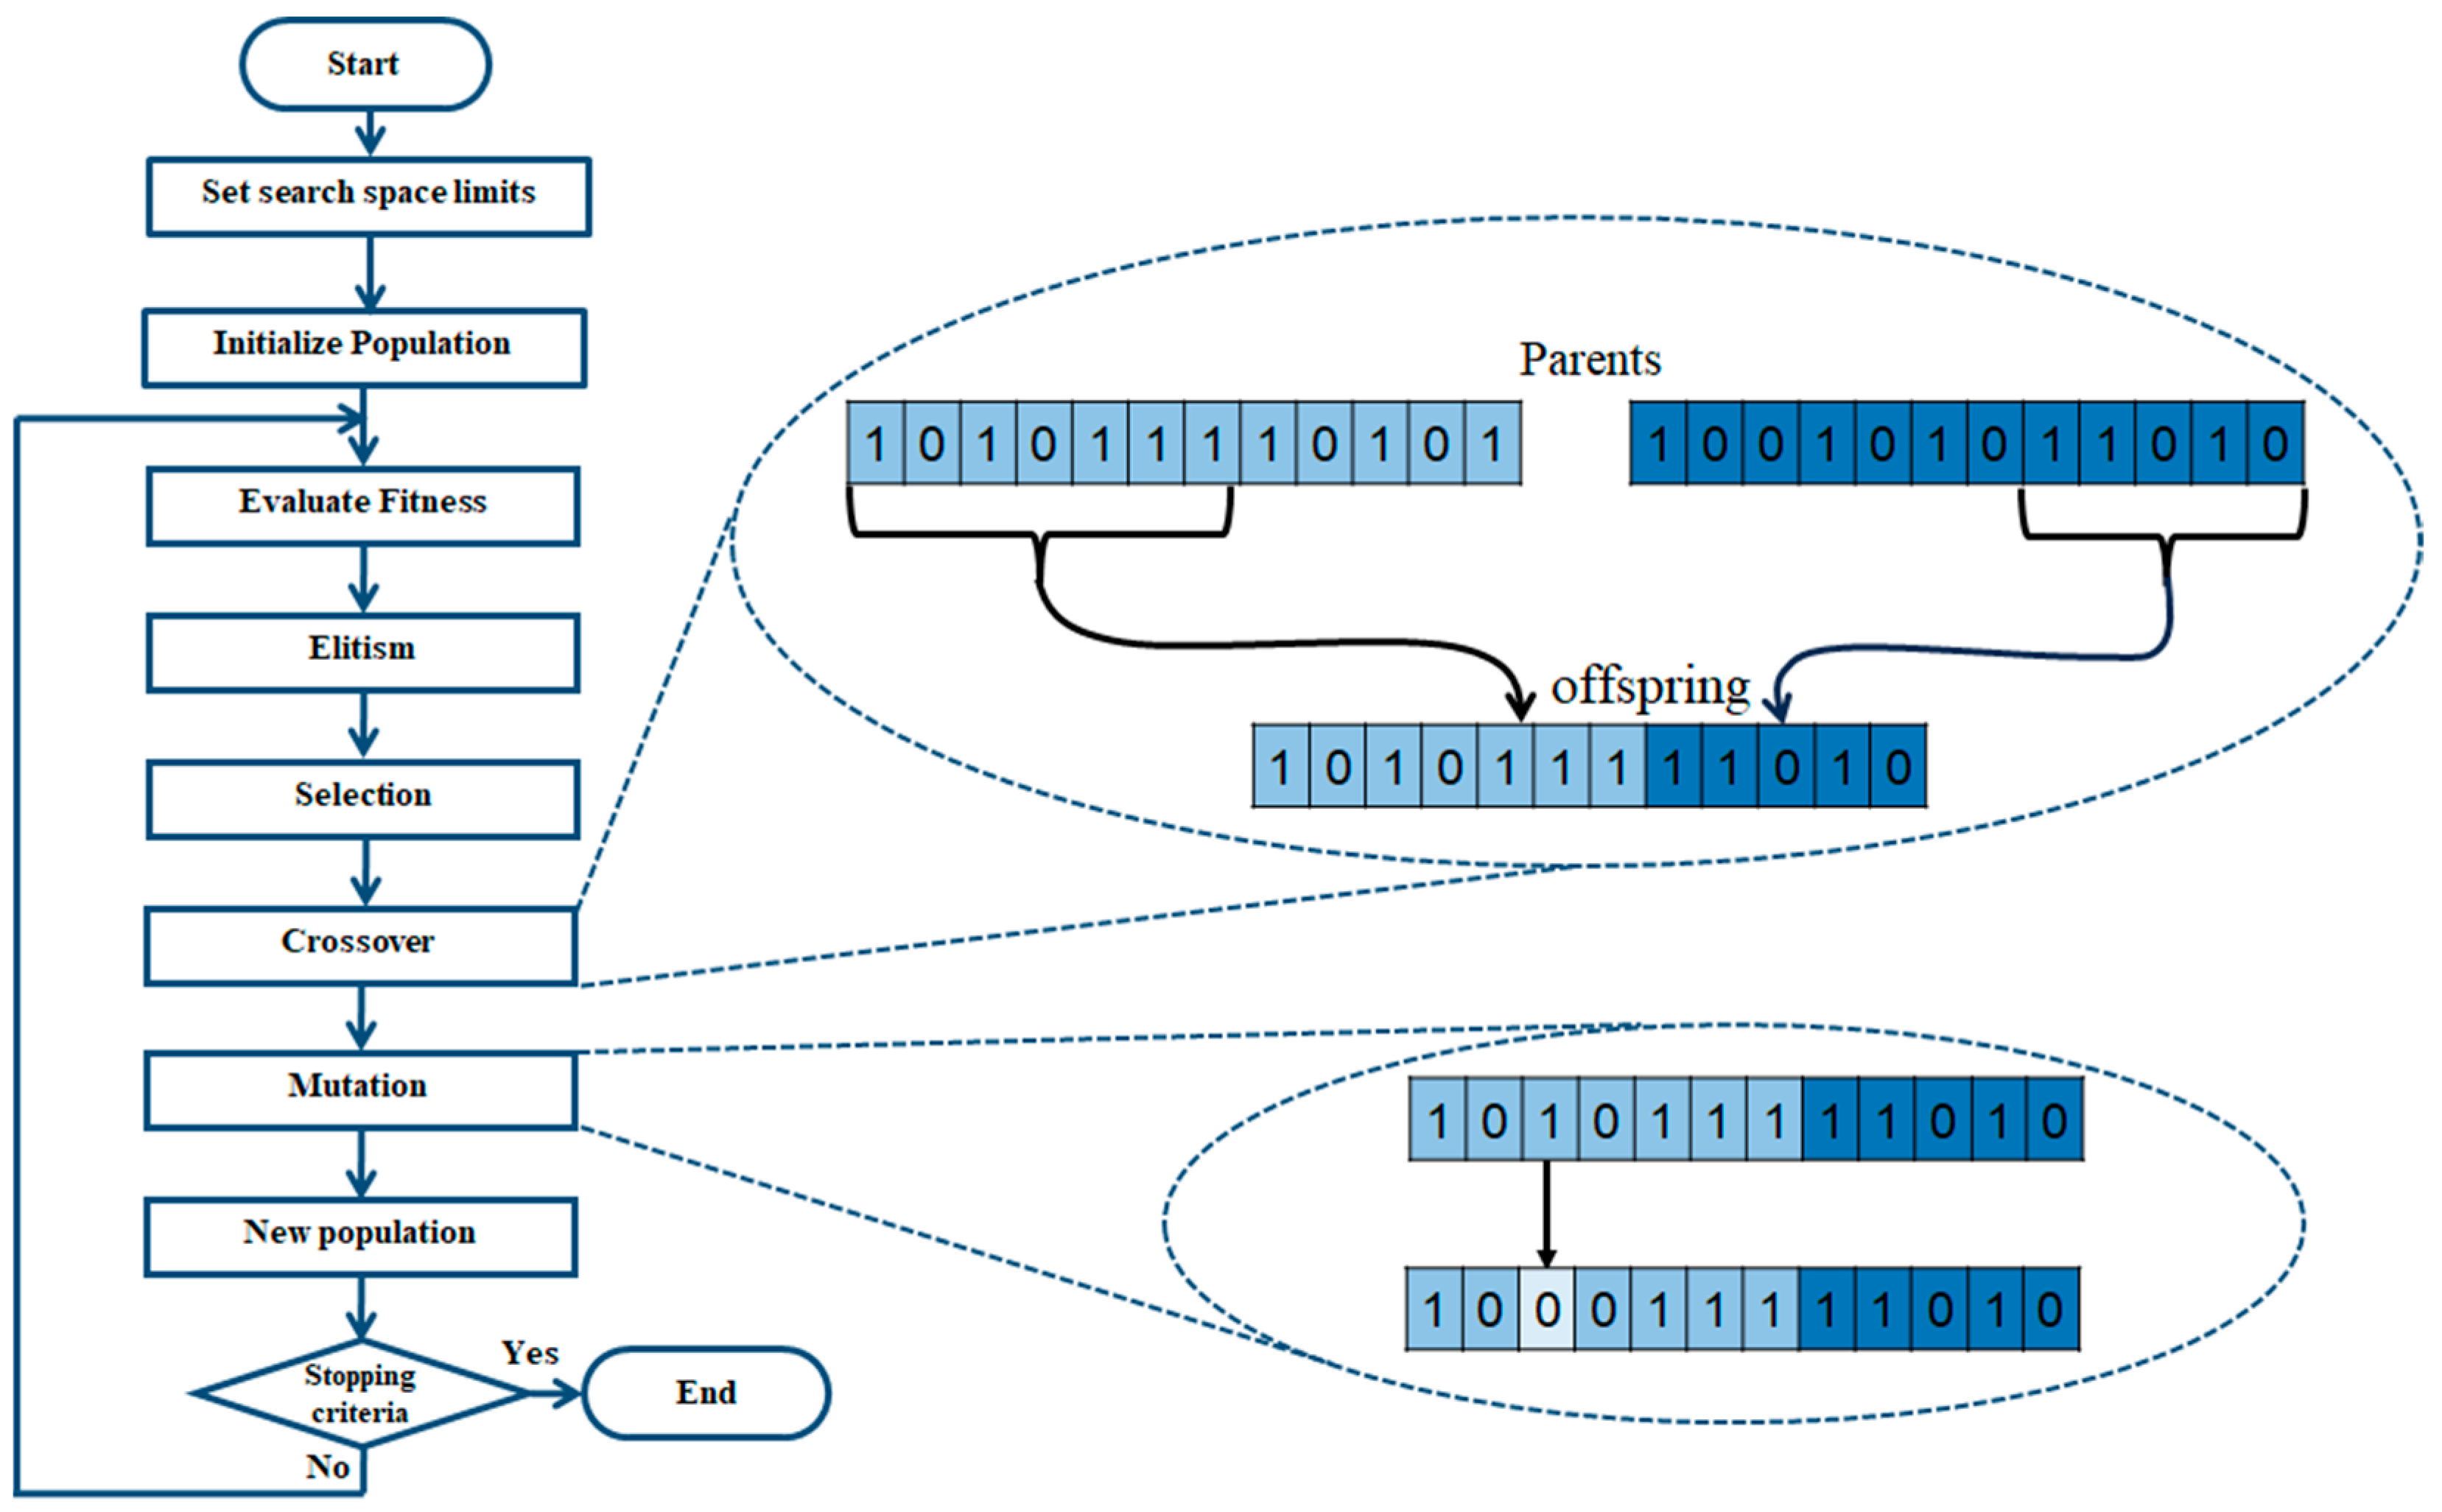
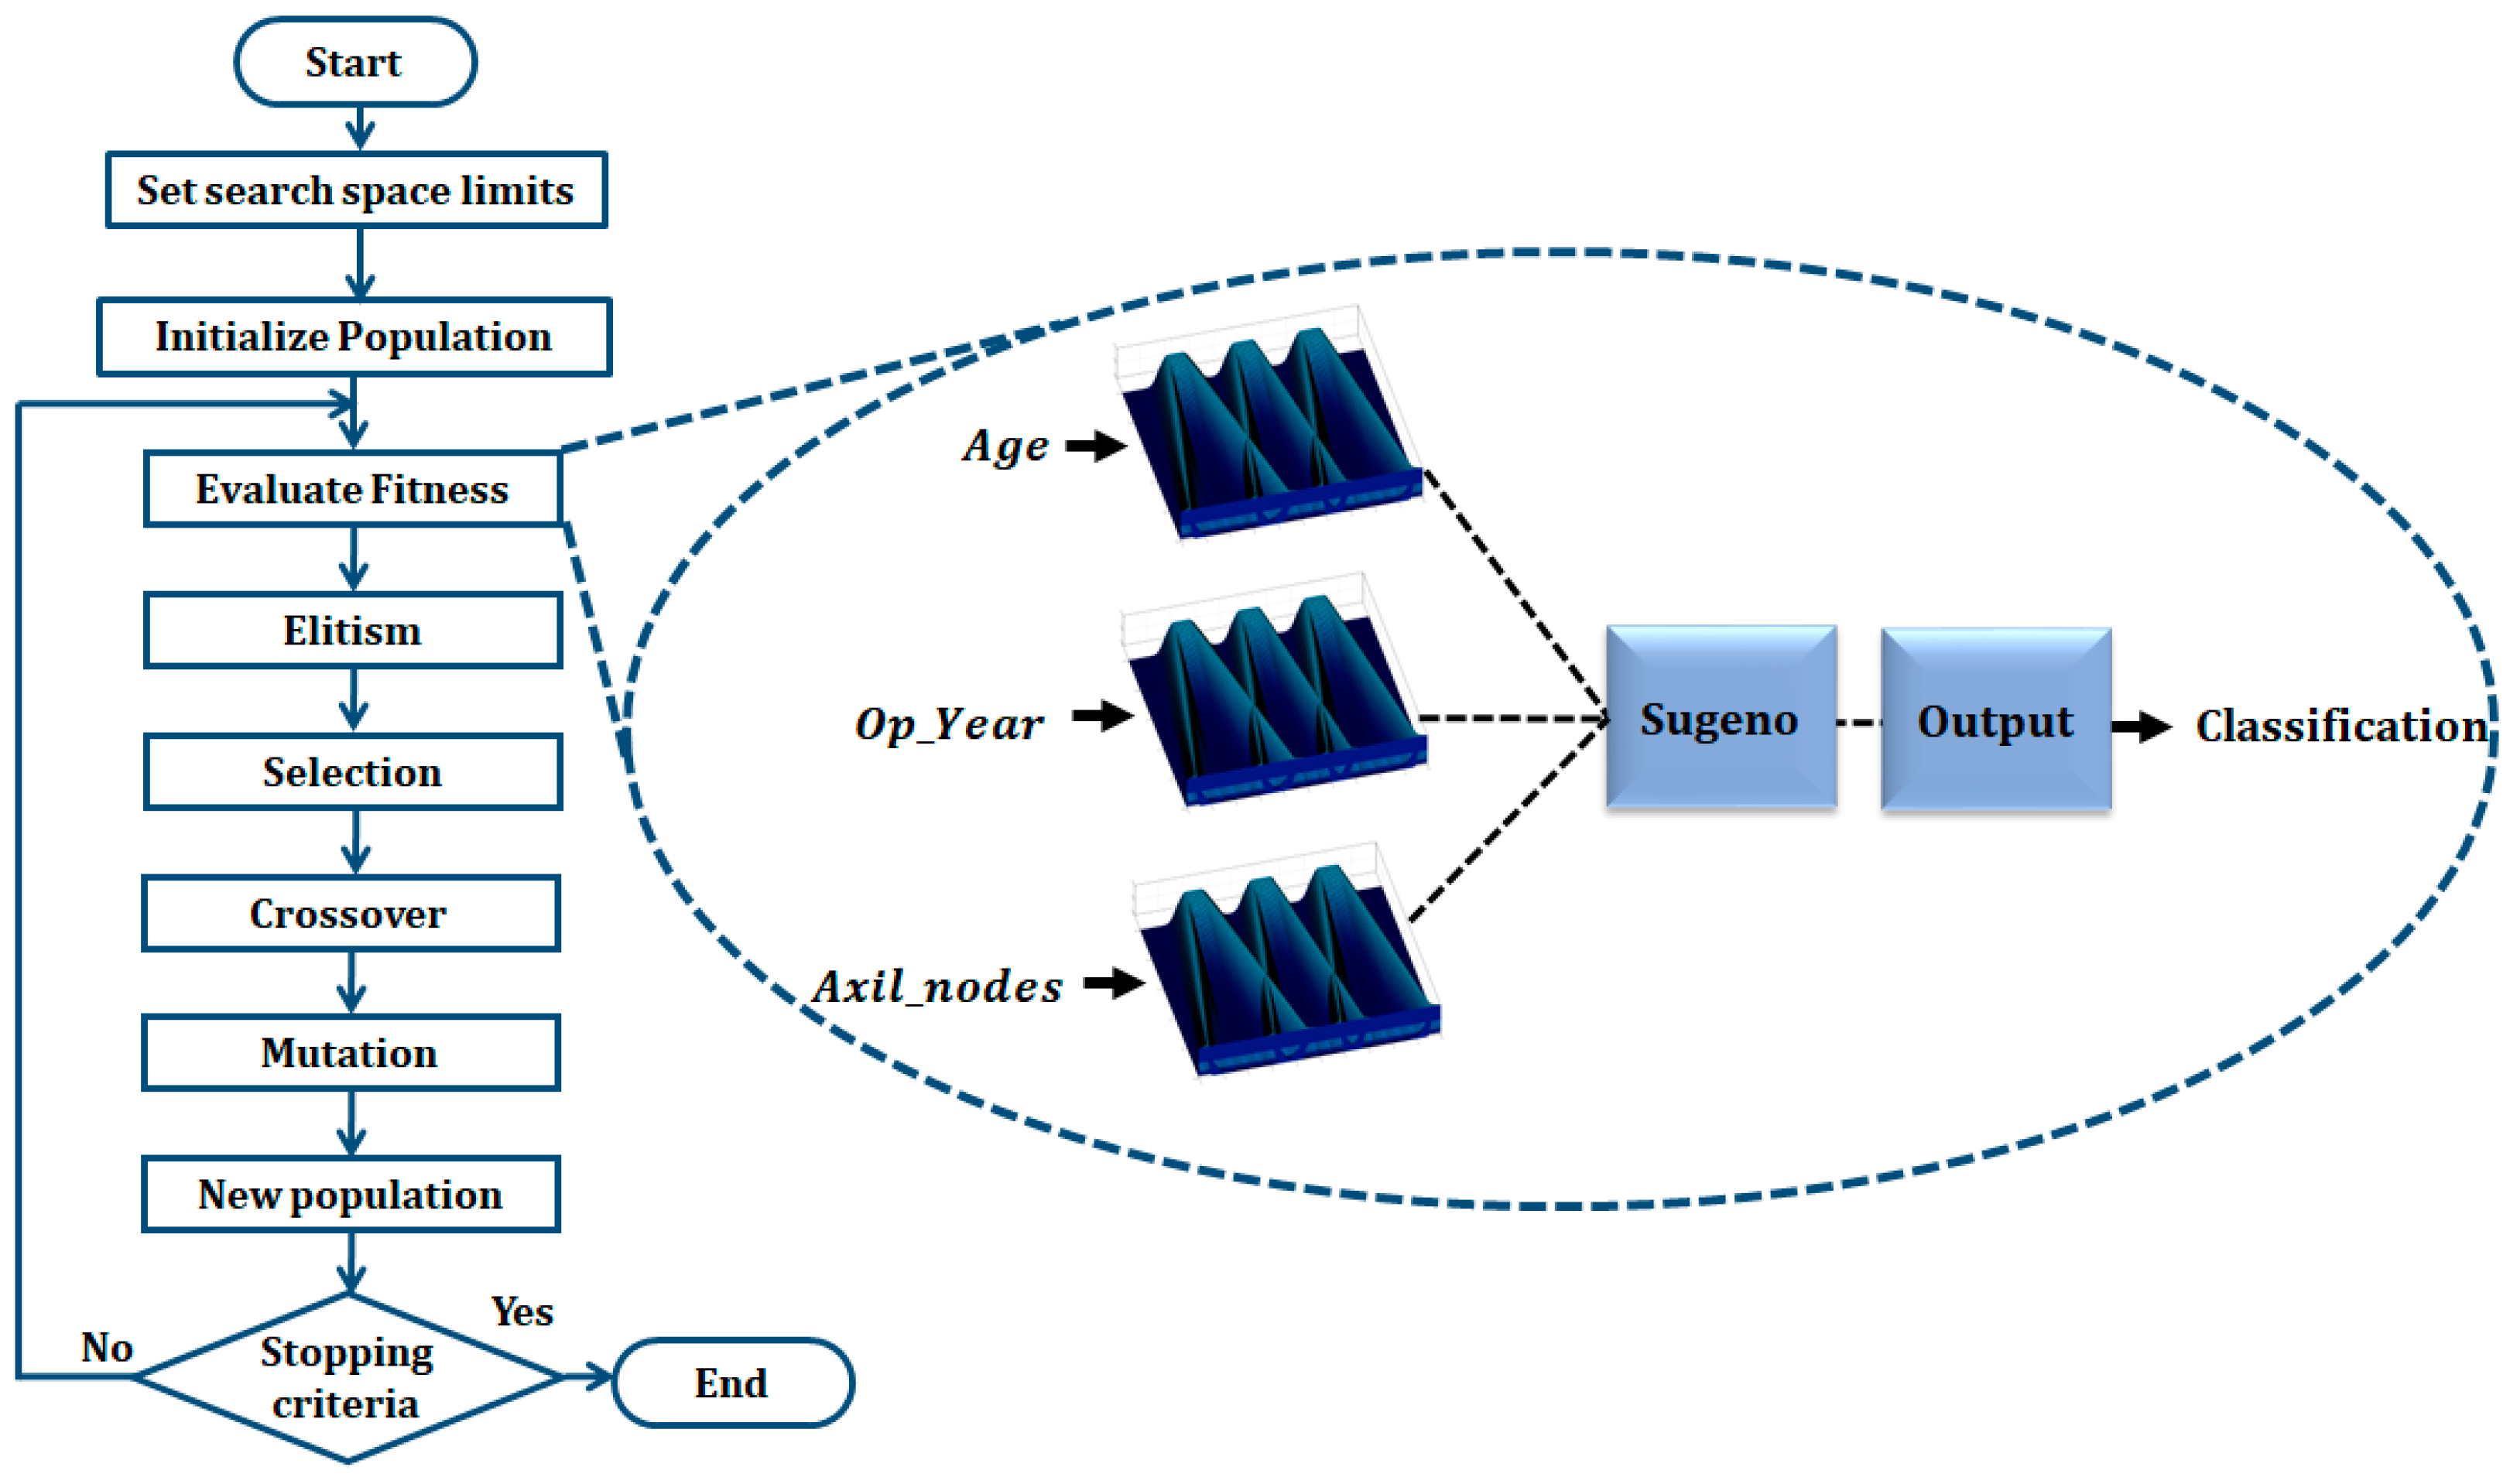
GA is based on the principles of evolution and natural selection. With this type of optimization strategy, the strongest individual survives to the following generation [40]. A chromosome functions as a representation of an individual (solution), where each chromosome contains genes that represent values to be optimized. The algorithm runs for a certain amount of generation or some other stopping criteria [41,42]. The algorithm begins by creating the population with random values within the ranges established in the search space. The next steps are repeated until the maximum number of generations or the stop criteria are achieved. The population is ranked, and the individual (solution) with the best performance is protected to avoid modifications (Elitism). The next step is called selection, where a part of the population (depending on the population rate) is modified with to application of the genetic operators. In the crossover, to create a new offspring, two individuals are taken with the roles of parent to combine their genes resulting in the exchange of information between the two individuals. This genetic operator is the mechanism to ensure the reshuffle of characteristics of the parents in their children [43]. The value of one or more genes is modified to alter the chromosome. This step is called mutation and is the main way of evolving new individuals from old ones. The next step consists of reinserting the new population the individual previously saved [44,45,46]. Two types of genetic algorithms are defined based on their coding: binary and real. A binary-coded genetic algorithm uses binary strings to represent individuals in the population. Meanwhile, a real-coded genetic algorithm uses real numbers to represent genes [43]. In Figure 4, a representation of a basic binary-coded GA flowchart is shown.
4. Proposed Method
The proposed method is implemented in medical classification. In this section, the proposed method description, implementation, and datasets are presented.
4.1. Description of the Method
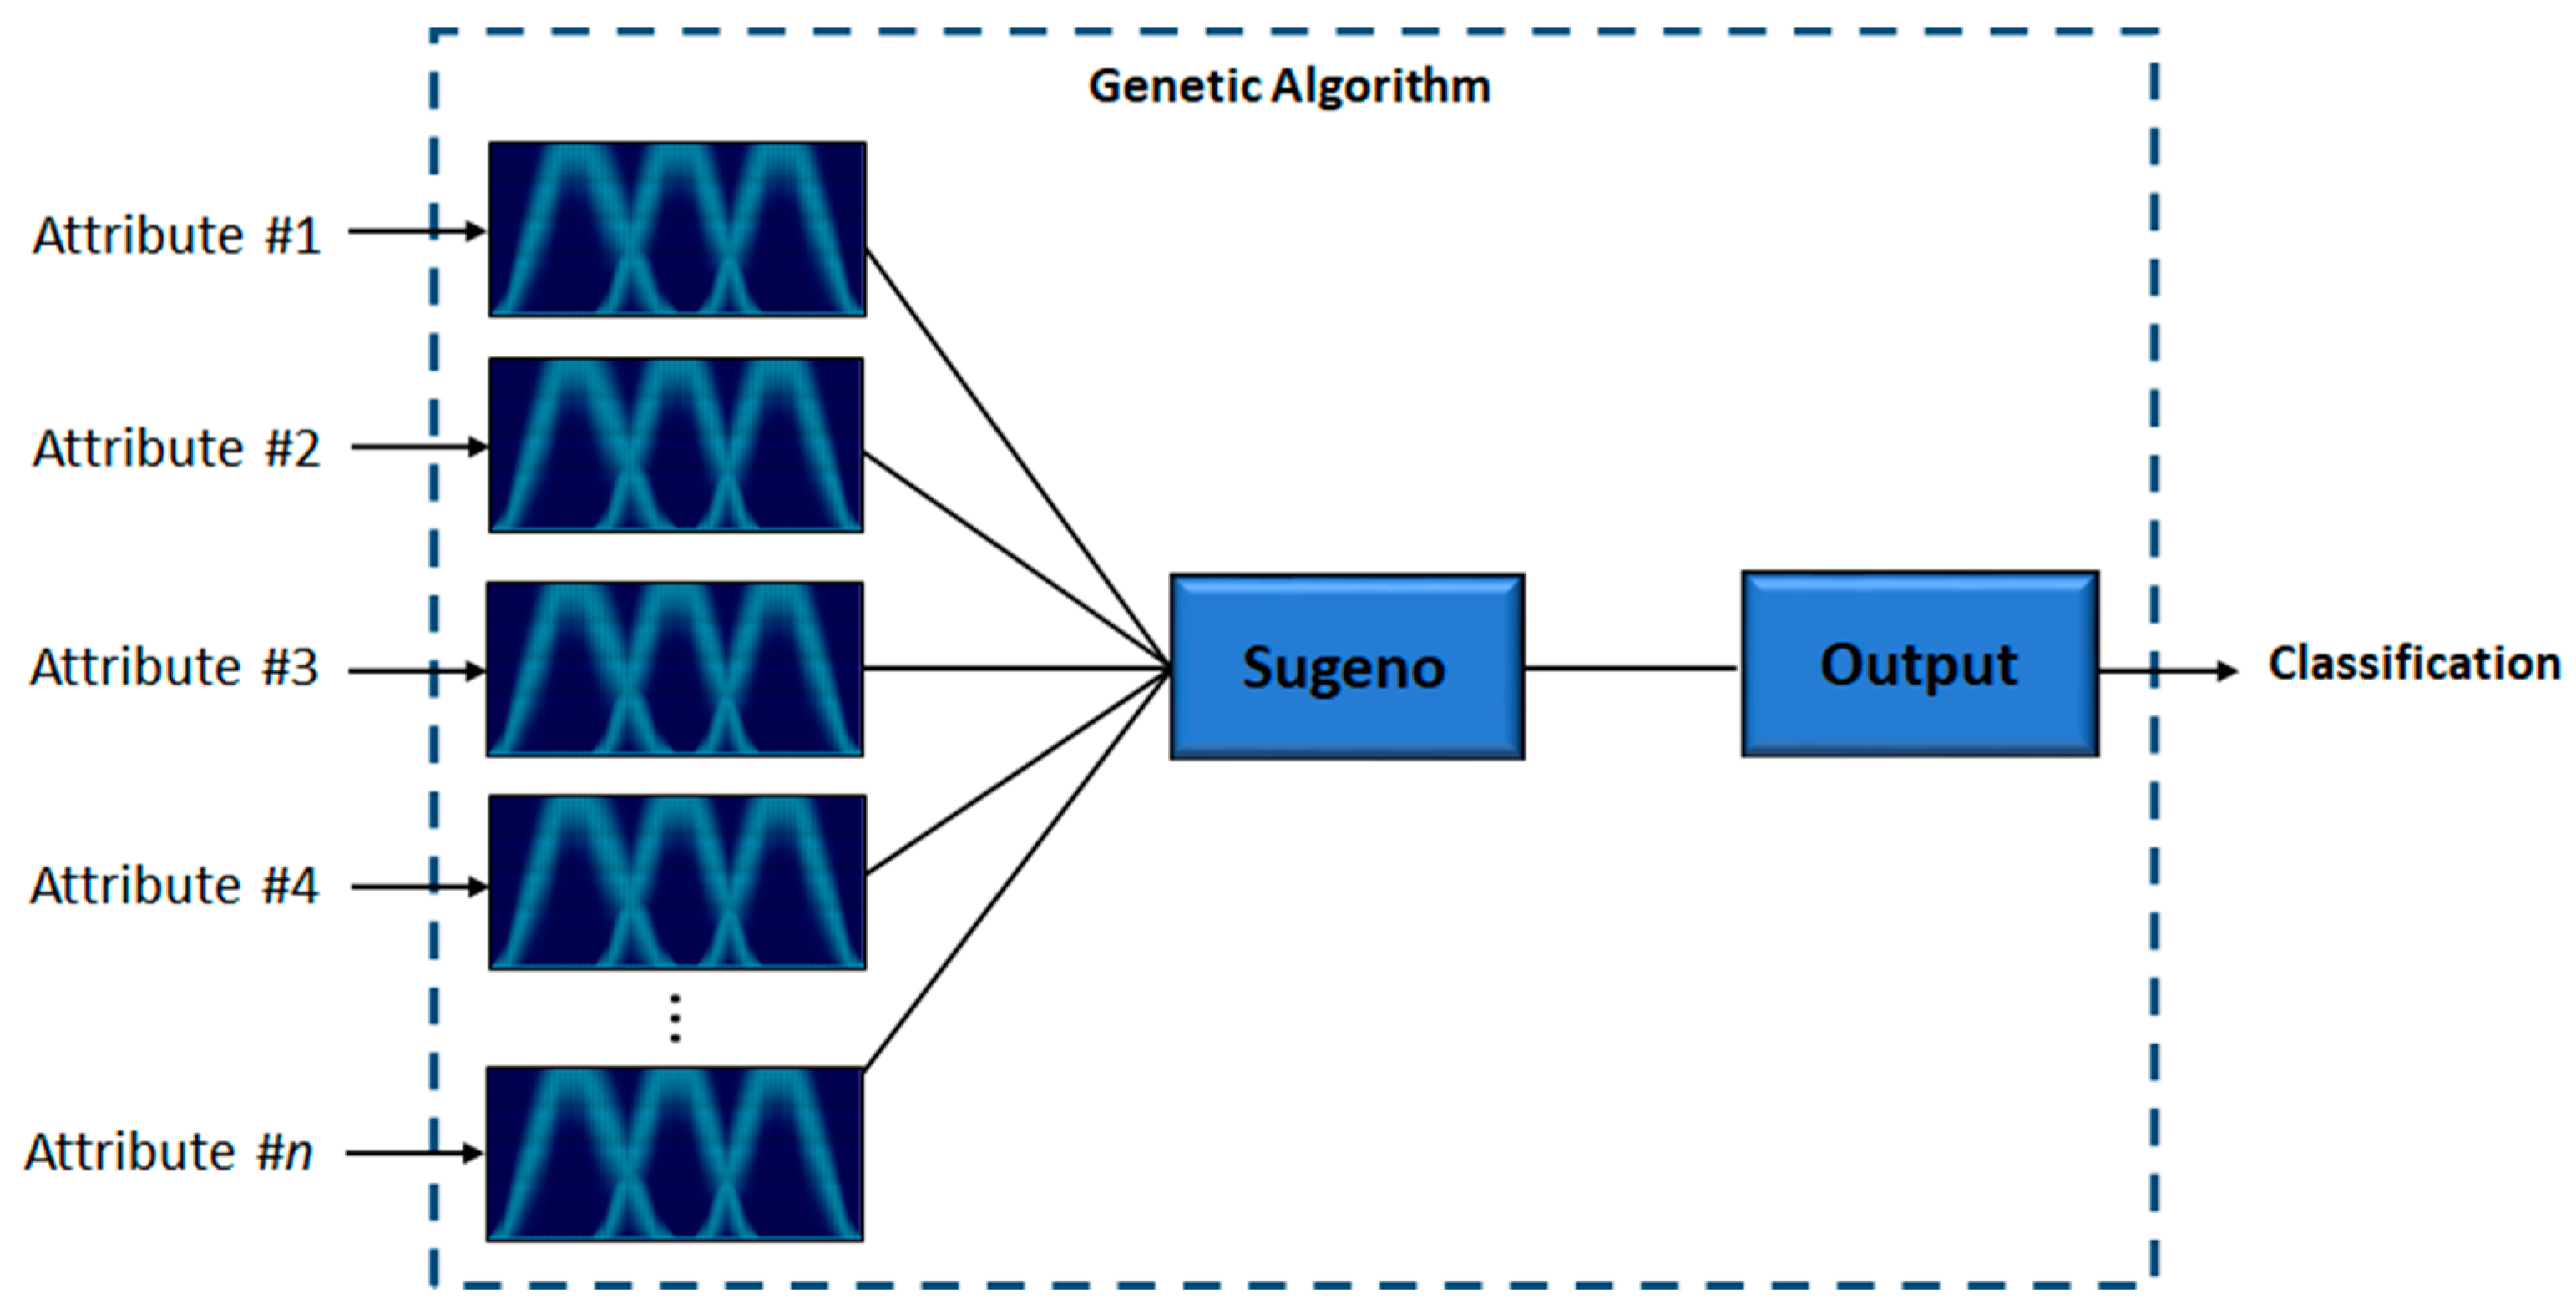
The medical classification performed by the proposed method consists of using from 1 to n attributes to obtain a final classification. The number of attributes depends on the illness or diagnosis to be given. Each attribute represents an input in the IT3FIS. In this work, Trapezoidal MF is applied to each fuzzy input variable, using 3 MFs in each one (MFLow, MFMedium, and MFHigh). In this work, the Trapezoidal membership function is used due to its ability to represent a triangular membership function by joining its central points [31]. The optimal parameters of the Type-3 Trapezoidal MF (a1, b1, c1, d1, LowerScale, and LowerLag) and the fuzzy if-then rules are designed by a real-coded GA. In Figure 5, a representation of the proposed method is shown, where a Sugeno Model is applied with n attributes to finally obtain a final result.
4.2. Datasets Description
A total of 7 datasets are utilized to design and prove the proposed method to show the potential of the proposed method. In Table 1, the number of attributes and instances of each one is shown. Two sets are created using the instances: design and testing. The creation of the FIS depends on the design set, and its real behavior is verified with the testing set.
4.3. Application to Medical Classification
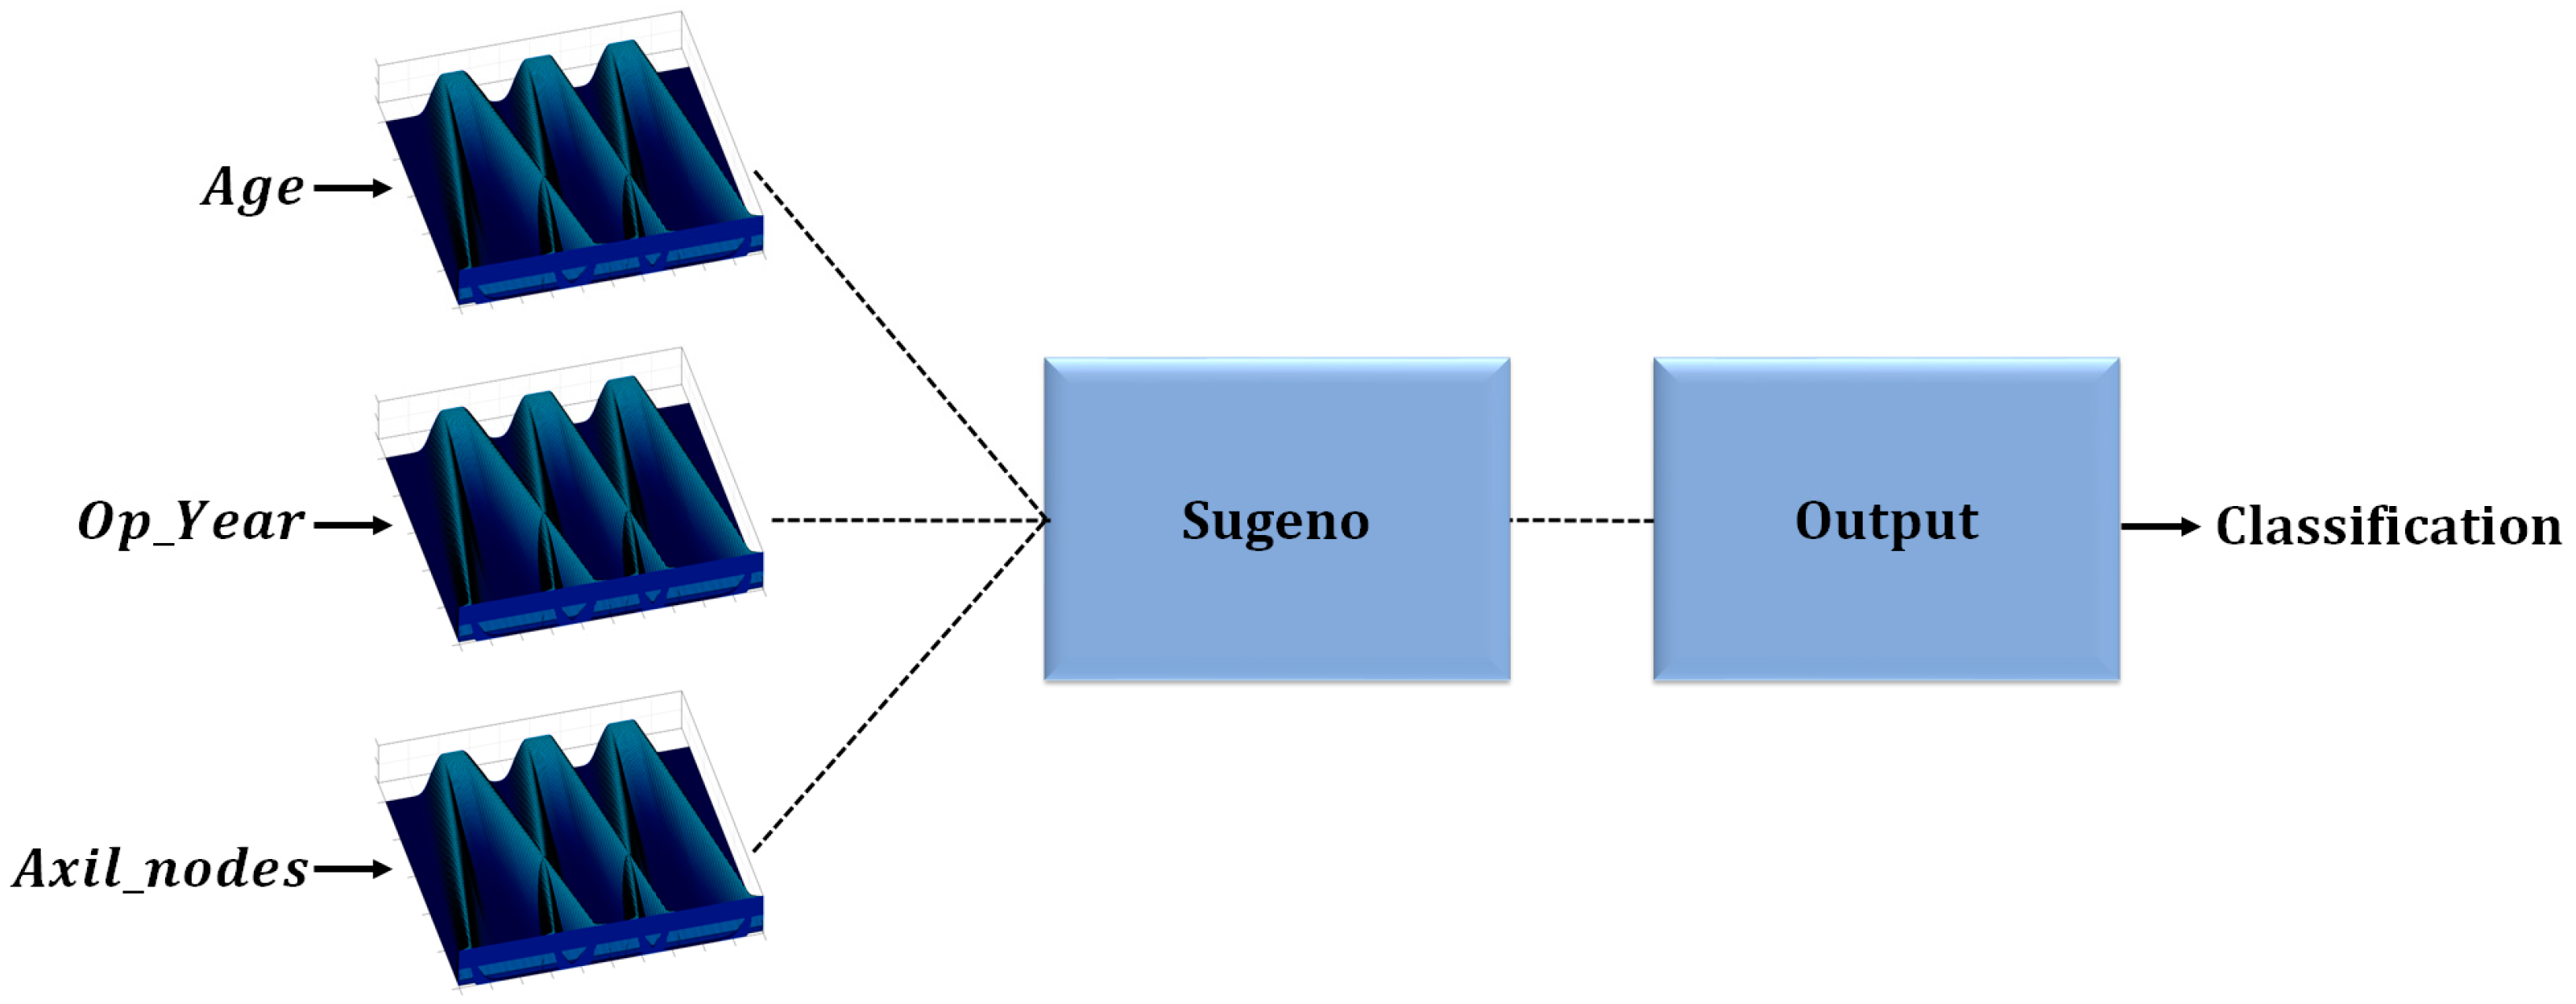
The Haberman’s Survival dataset, using its 3 attributes, are presented in Figure 6 to describe the proposed method in more detail, where each attribute corresponds to each input of the fuzzy inference systems. The information of each instance enters its corresponding fuzzy inference system input of the Sugeno Model to obtain a classification.
The search space is defined by an analysis of the design set. The minimum and maximum values of each attribute are calculated by Equations (19) and (20).
where j is the corresponding attribute (from 1 to n), and i represents the number of instances used in the design set. The minimum and maximum ranges of the fuzzy input are calculated by Equations (21) and (22).
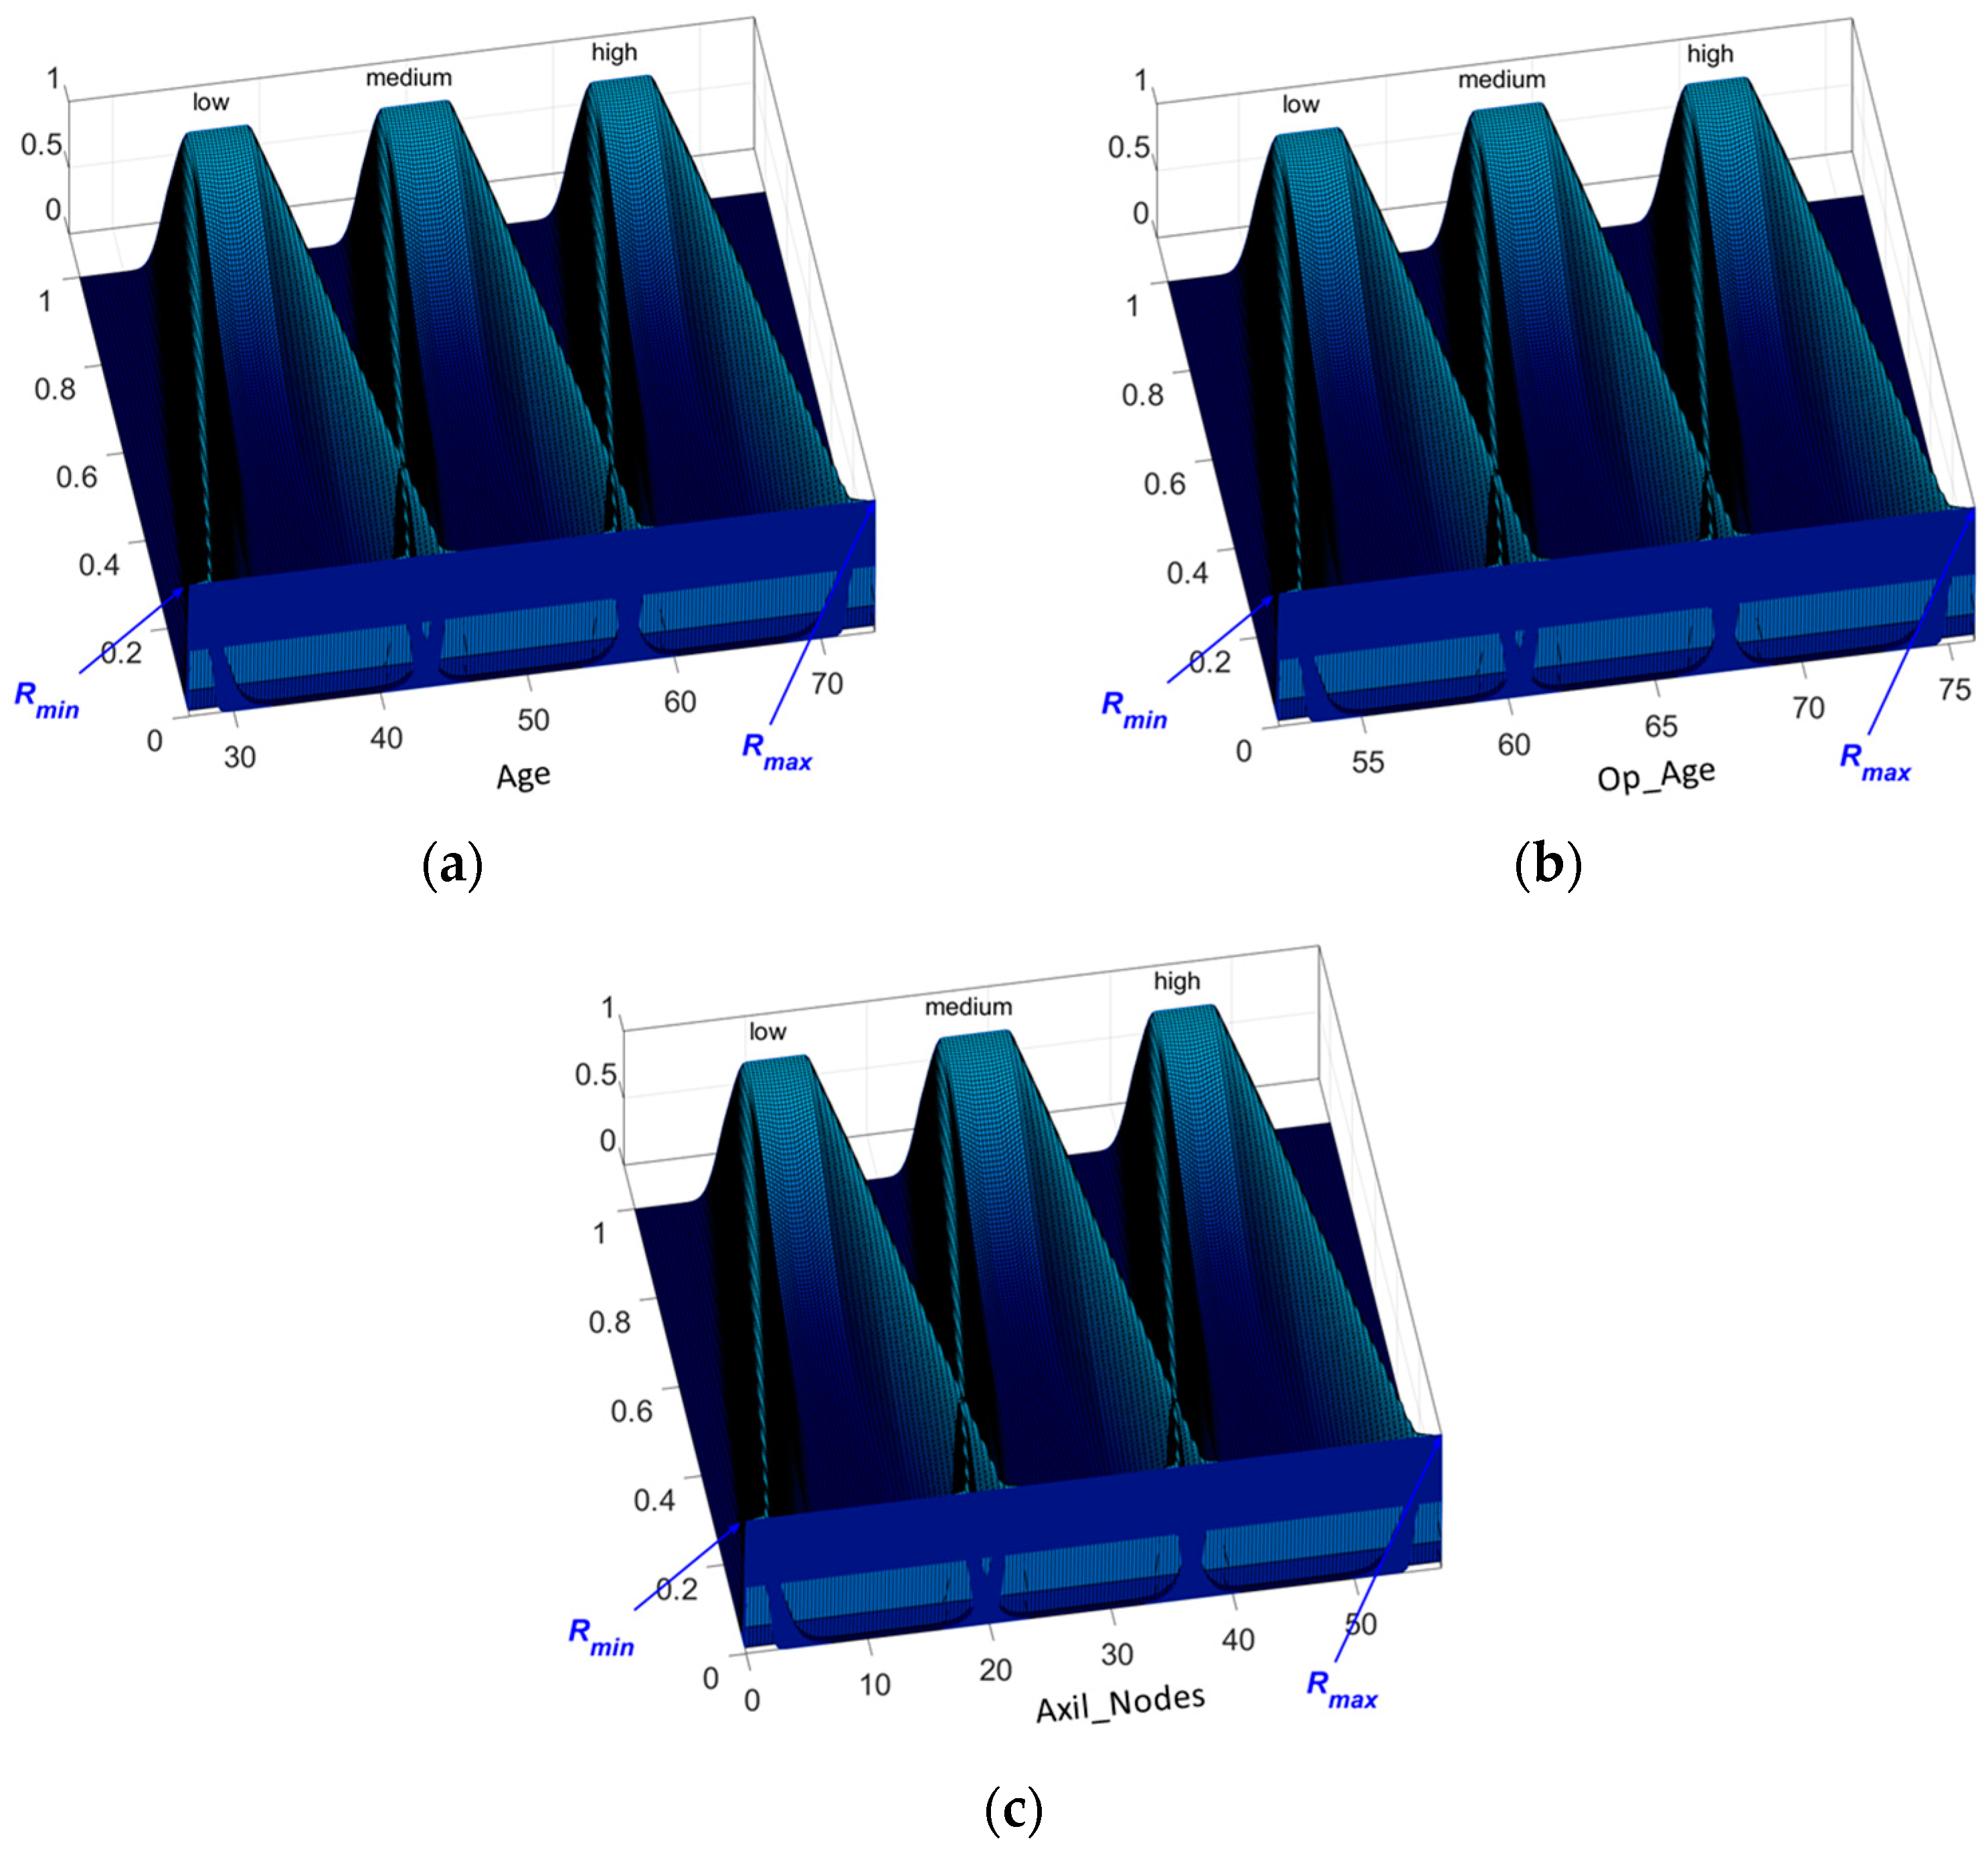
Equations (19)–(22) are used for each attribute of the dataset. With those calculations, all the ranges for the fuzzy inputs are automatically generated. An example of the ranges for Haberman’s Survival dataset is shown in Table 2.
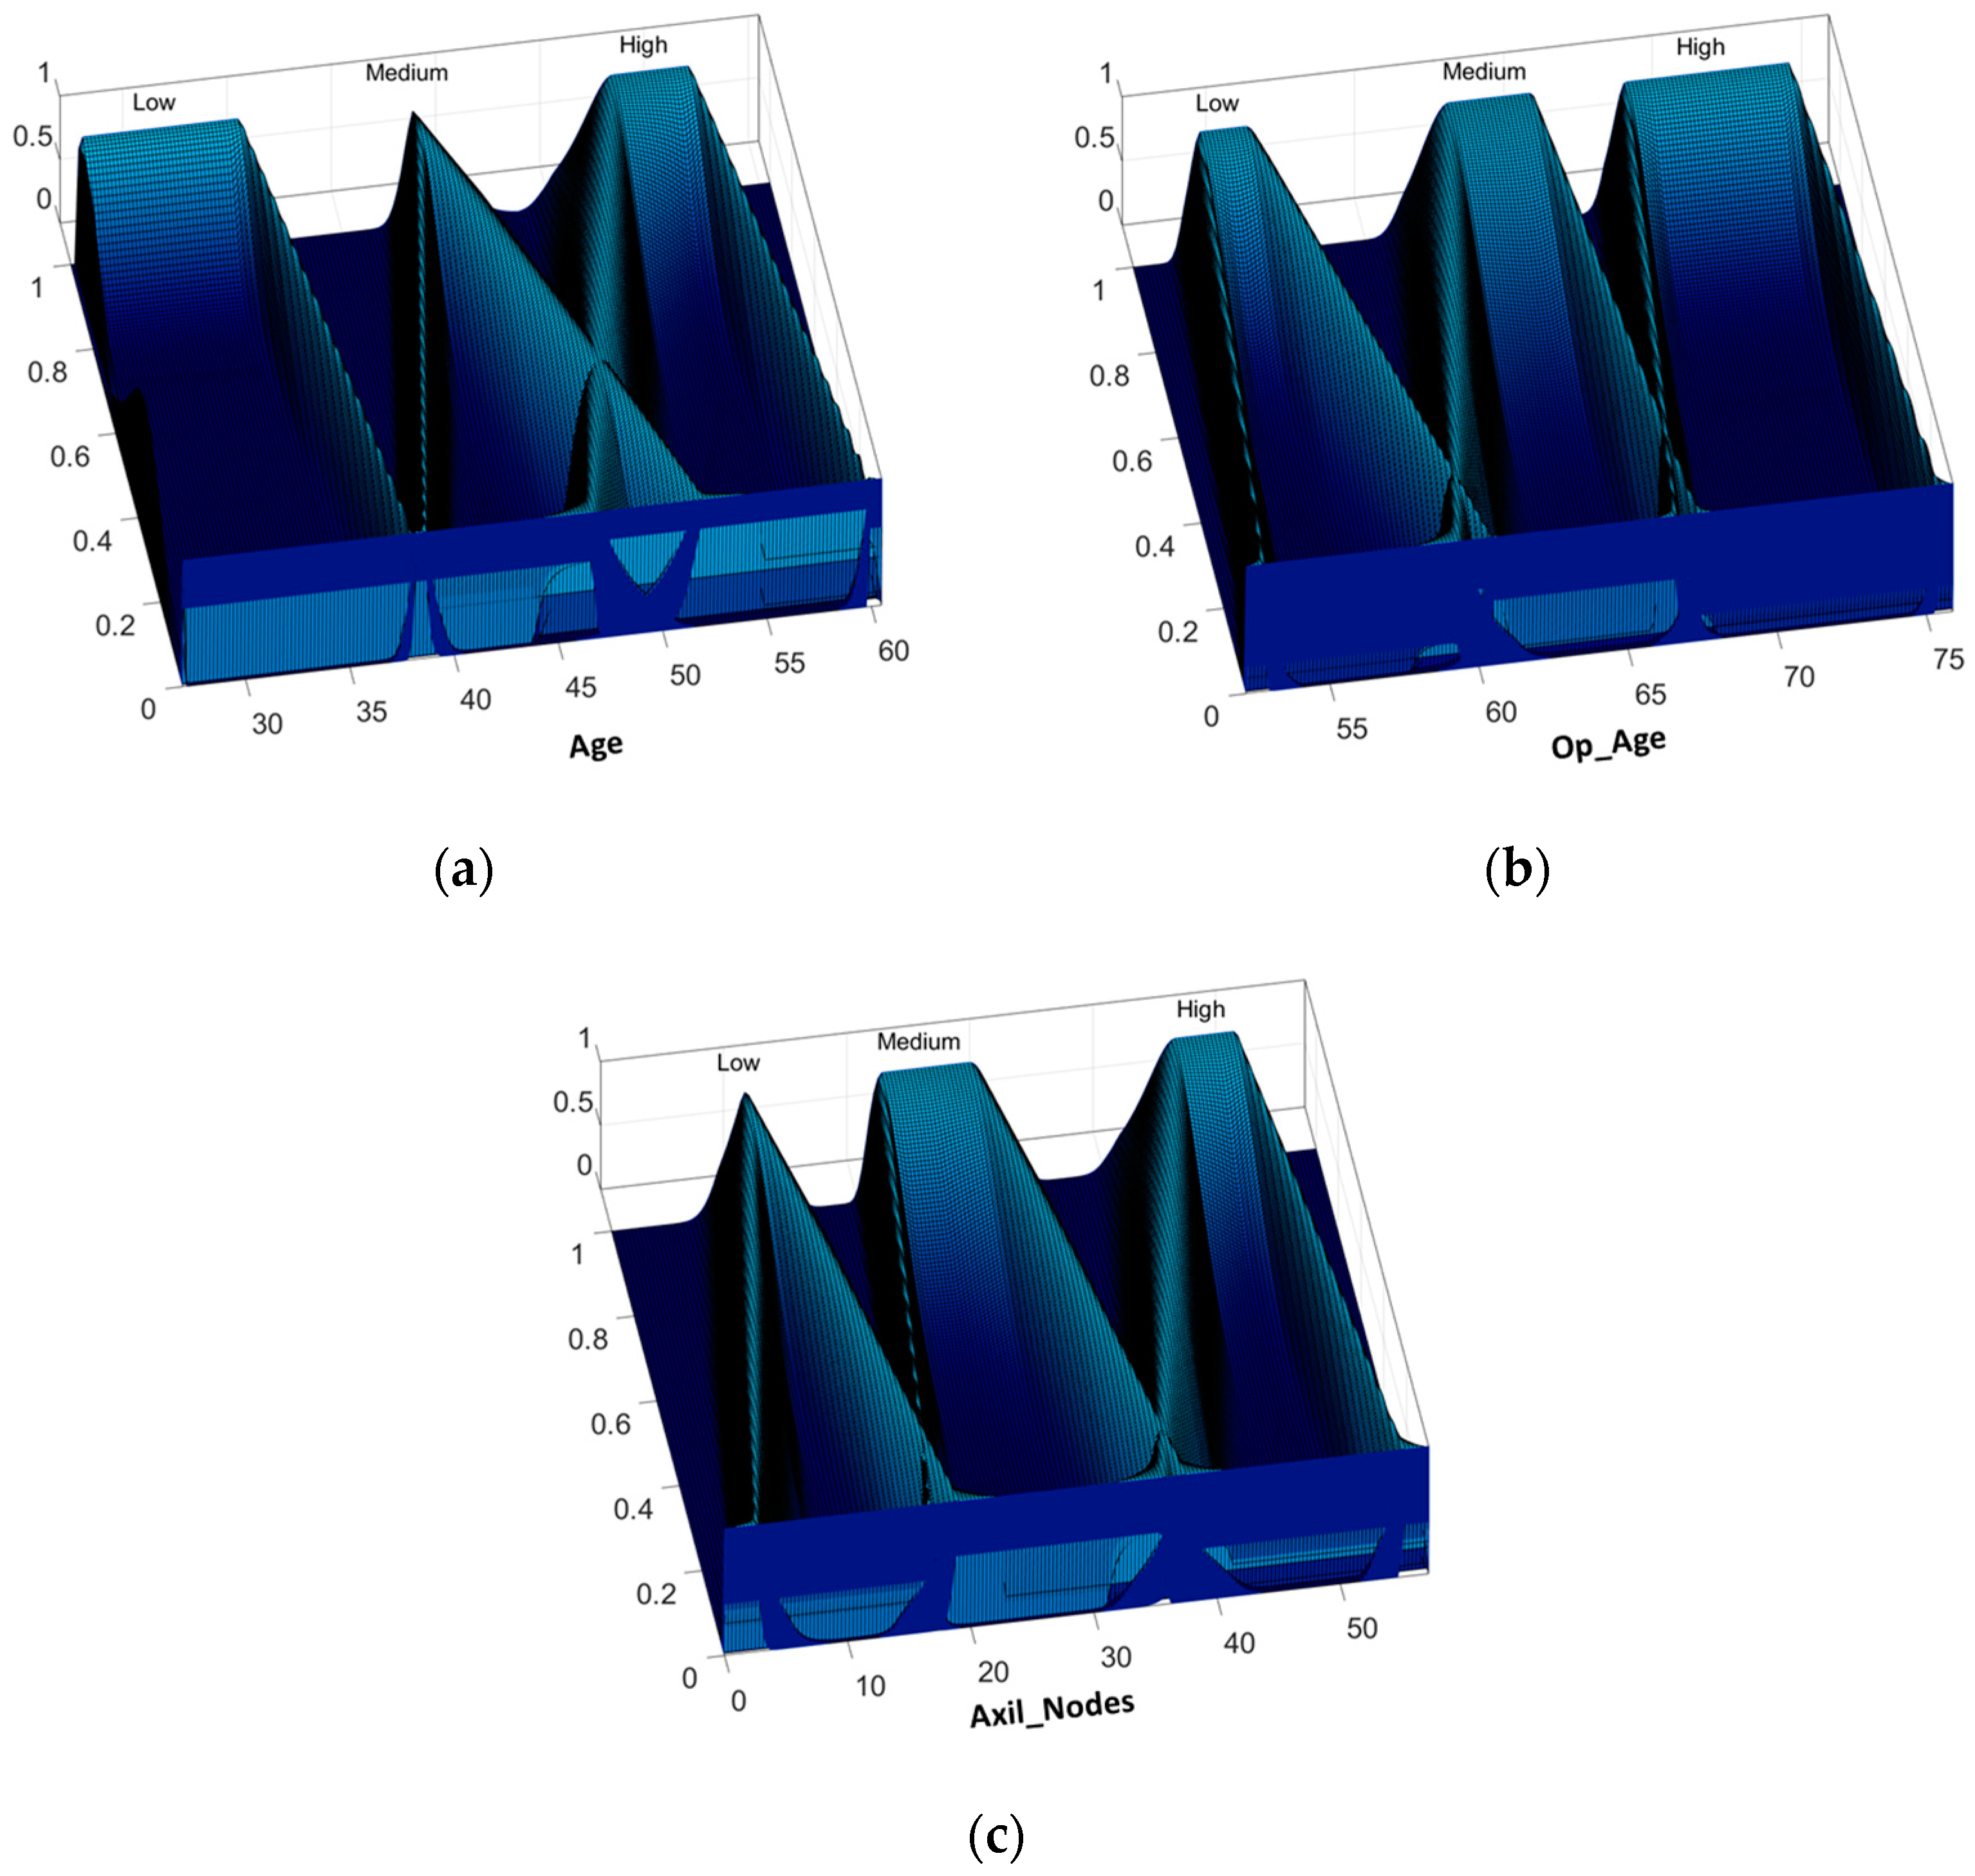
Figure 7 shows an example of the fuzzy inputs corresponding to Haberman’s Survival dataset attributes, where its ranges can be observed.
4.4. Description of the GA
A real-coded GA is proposed to determine the optimal parameters of Interval Type-3 FIS. The ranges previously calculated are applied to define the upper membership function of each Type-3 Trapezoidal MF, which in turn are utilized to establish the search space. This means that depending on the dataset, the values will chang. In Table 3, the rest of the parameters are shown.
To calculate the chromosome size, first the number of total rules must be calculated by Equation (23).
where n is the number of attributes of the dataset to perform the classification. Once the number of rules has been calculated, the size can be calculated by Equation (24).
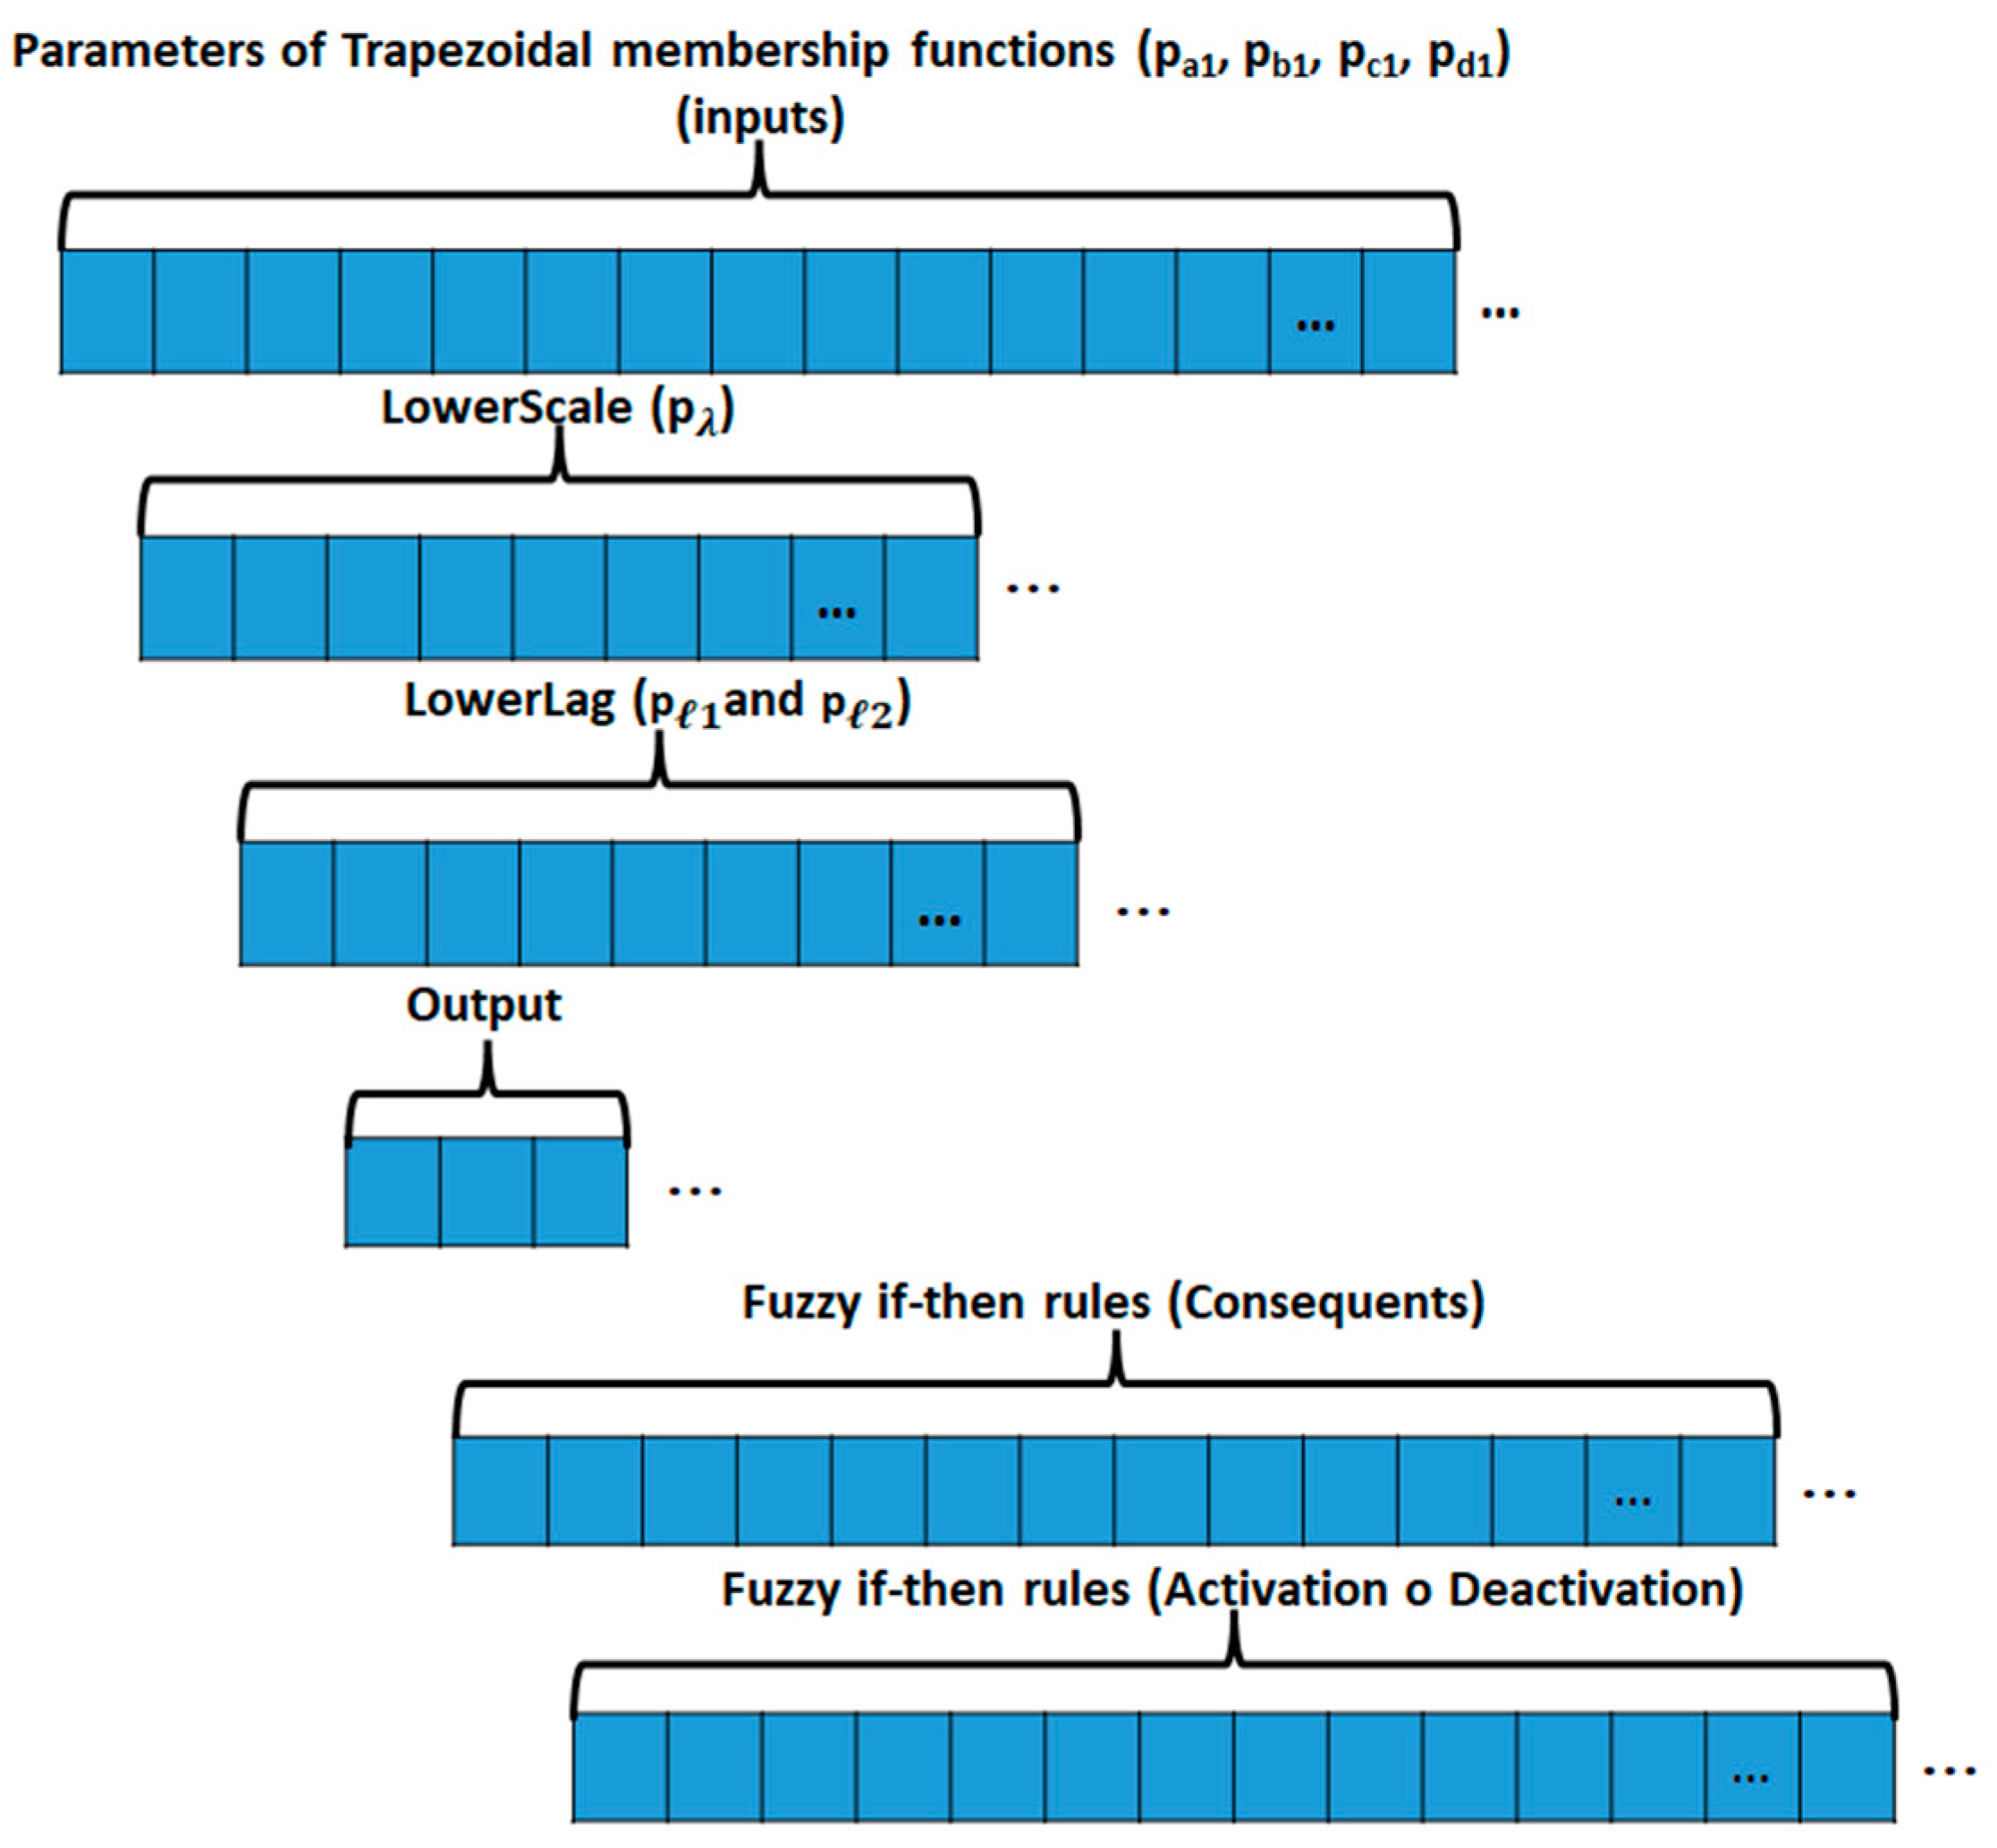
The chromosome size depends on the number of attributes (n). This number is multiplied by 21 because each Type-3 Trapezoidal MF has seven parameters (pa1, pb1, pc1, pd1, , , and ) and there are three Type-3 Trapezoidal MF in each fuzzy input. Three membership functions are used because previous works have shown that this number of membership functions allows good results for classification problems [30,31], as well as in other applications [47]. The three constants of the output are added to this multiplication, and finally, the multiplication of TR by 2 (consequents and activation status). For example, Haberman’s Survival dataset has three attributes, n = 3. Therefore, TR = 27, so the chromosome size is 119 genes. A representation of the chromosome applied for the Interval Type-3 FIS design is shown in Figure 8.
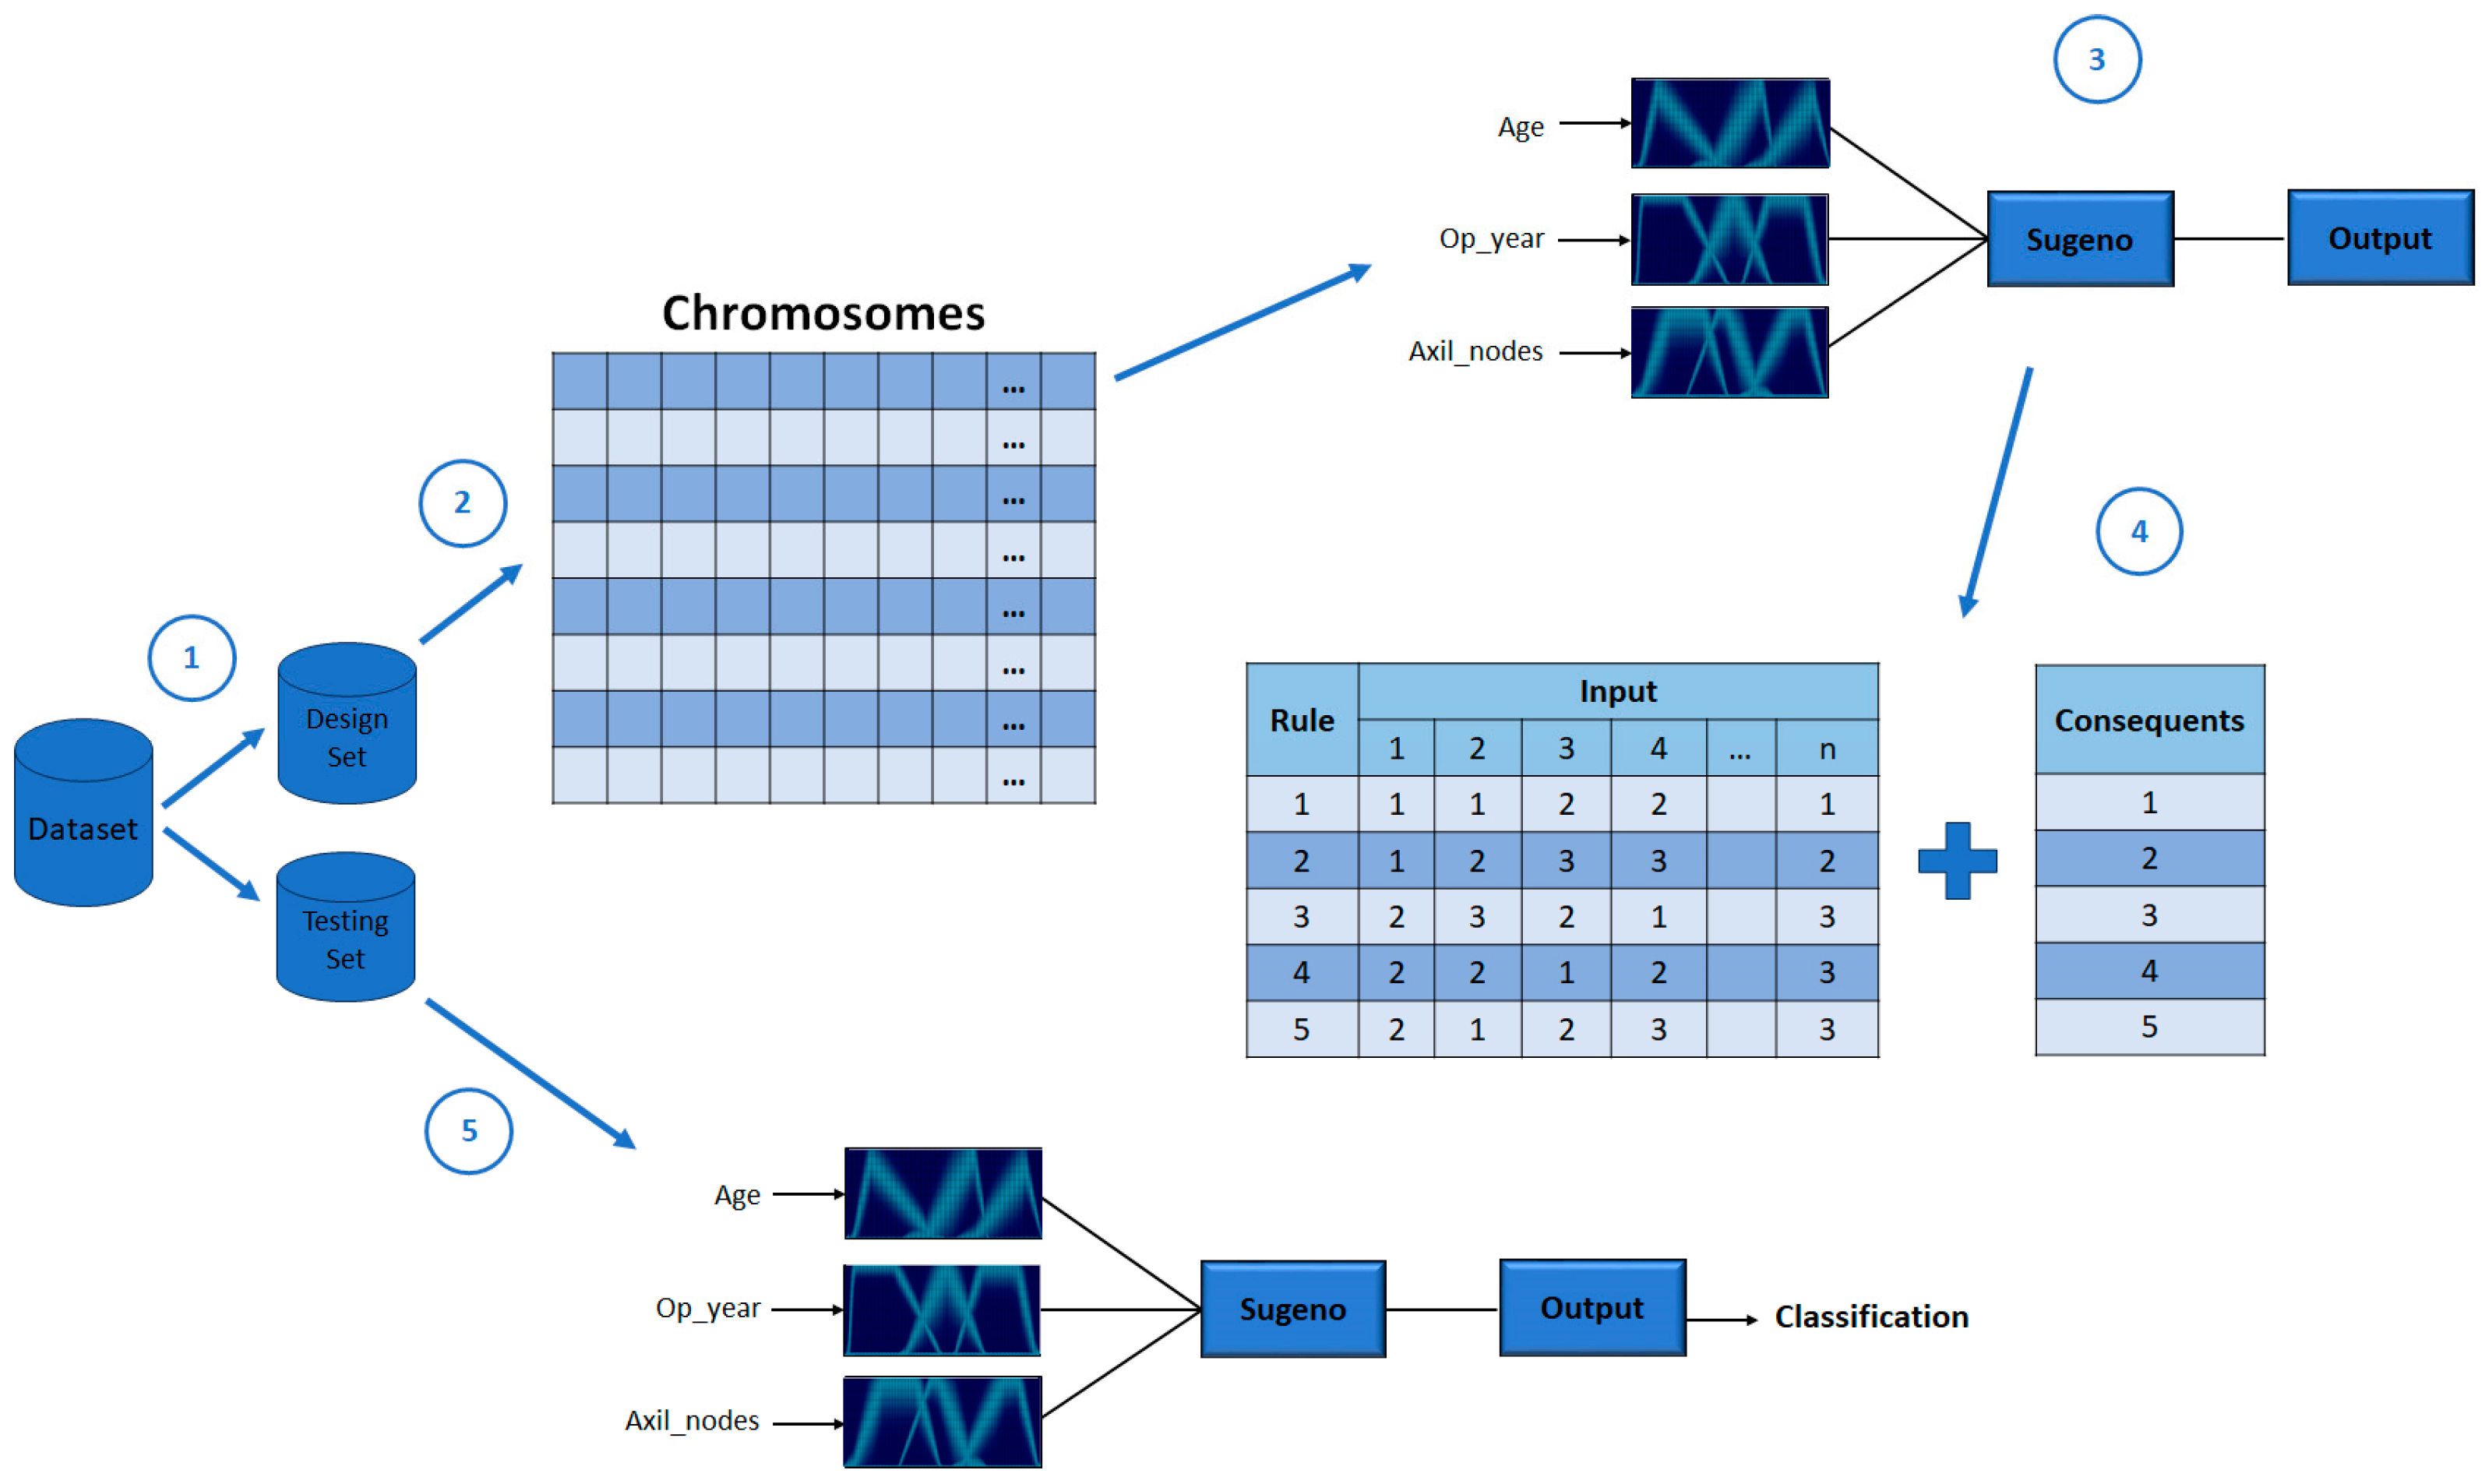
We can summarize the process in Figure 9 with 5 main steps:
- The dataset is divided into design and testing sets.
- The range of the fuzzy input and the maximum number of fuzzy rules are established based on the design test, the search space of the GA is determined, and the individuals are established with random values.
- Each individual allows the design of each fuzzy inference system. The parameters of the membership functions are established.
- The same individual is allowed to know if a fuzzy rule will be added to the fuzzy inference system using the genes assigned to this task. The values of these genes are values between 0 and 1. If the value is equal to or less than 0.5, the fuzzy rules are omitted, and if the value is greater than 0.5, the fuzzy rules are added, and a consequent is assigned.
- When the fuzzy inference system is fully designed, the testing set is used to prove the FIS, where each instance is evaluated for the fuzzy inference system, and the resulting value determines its class.
An illustration of the schematic of the GA applied to design Type-3 FIS for medical classification is shown in Figure 10.
In this work, a real-coded GA is applied to design the Interval Type-3 FIS, and its configuration is as follows: as the selection method is Tournaments, a mutation rate of 0.2 with a single point crossover. The parameters established for the genetic algorithm are based on previous works where genetic algorithms have been used to optimize fuzzy inference systems [8]. The proposed GA seeks the minimization of the classification error. In this work, Equation (25) is used to calculate the accuracy.
where False Positive, True Positive, False Negative, and True Negative are represented as FP, TP, FN, and TN, respectively. The Equation (26) provides the objective function applied by the GA:
5. Experimental Results
The results obtained with the first two datasets are shown in this section. The configuration of the number of iterations was established for comparison purposes. The summary and the results of the other datasets are presented in Section 6. In Section 6.1, comparisons with other works are shown.
5.1. Haberman’s Survival Dataset Results
For Haberman’s Survival dataset, 60% of the instances were used in the design phase, leaving the rest (40%) to prove the real behavior of the Type-3 FIS. In total, 30 experiments were performed using the proposed GA. Figure 11 shows the inputs with the best results in the testing phase. The Type-3 fuzzy inference achieves in this phase 77.05% of accuracy.
Table 4 shows the fuzzy if-then rules achieved for Haberman’s Survival dataset. Initially, for this dataset, the FIS must have 27 fuzzy if-then rules. However, the proposed method allowed obtain a better result with only 13 fuzzy if-then rules.
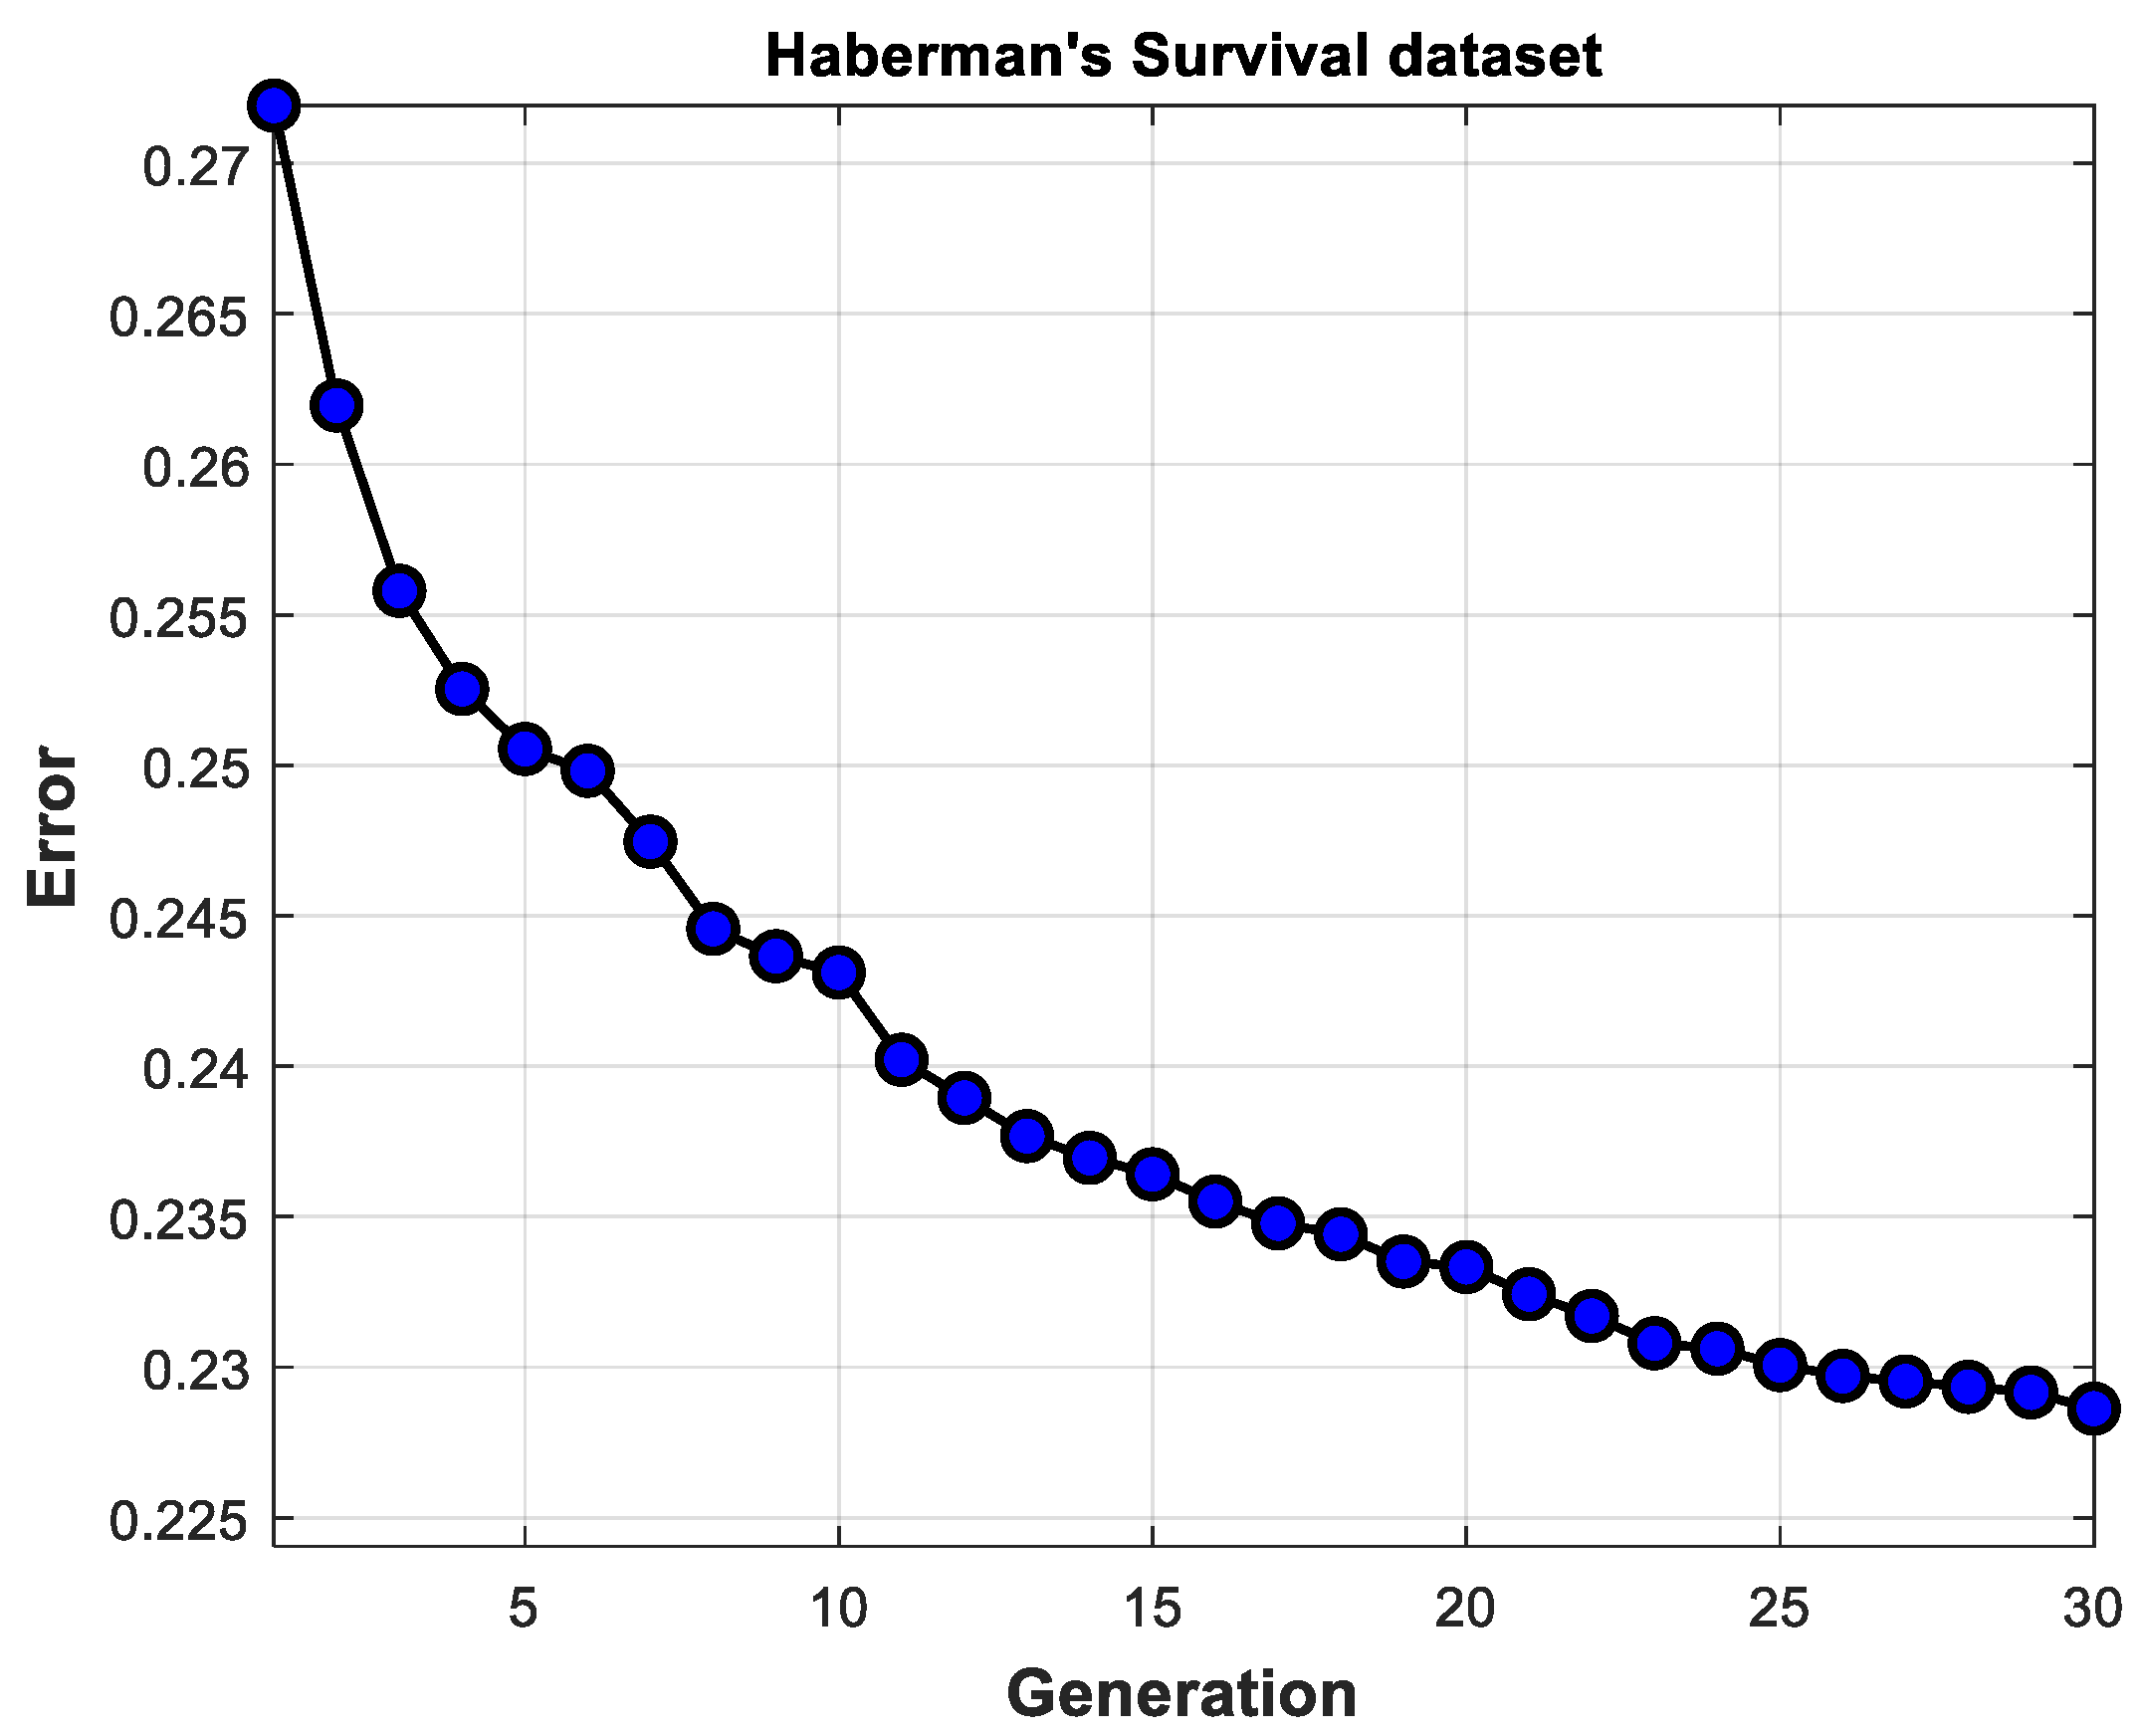
As Table 5 shows, in the design phase, better results are obtained because the proposed GA allowed designing the Type-3 FIS with a part of the instances. However, an important part is the real behavior of the Type-3 FIS, with instances not used in the design phase. The convergence average of the evolutions is shown in Figure 12. For each experiment, 30 generations were used.
5.2. PIMA Indian Diabetes Dataset Results
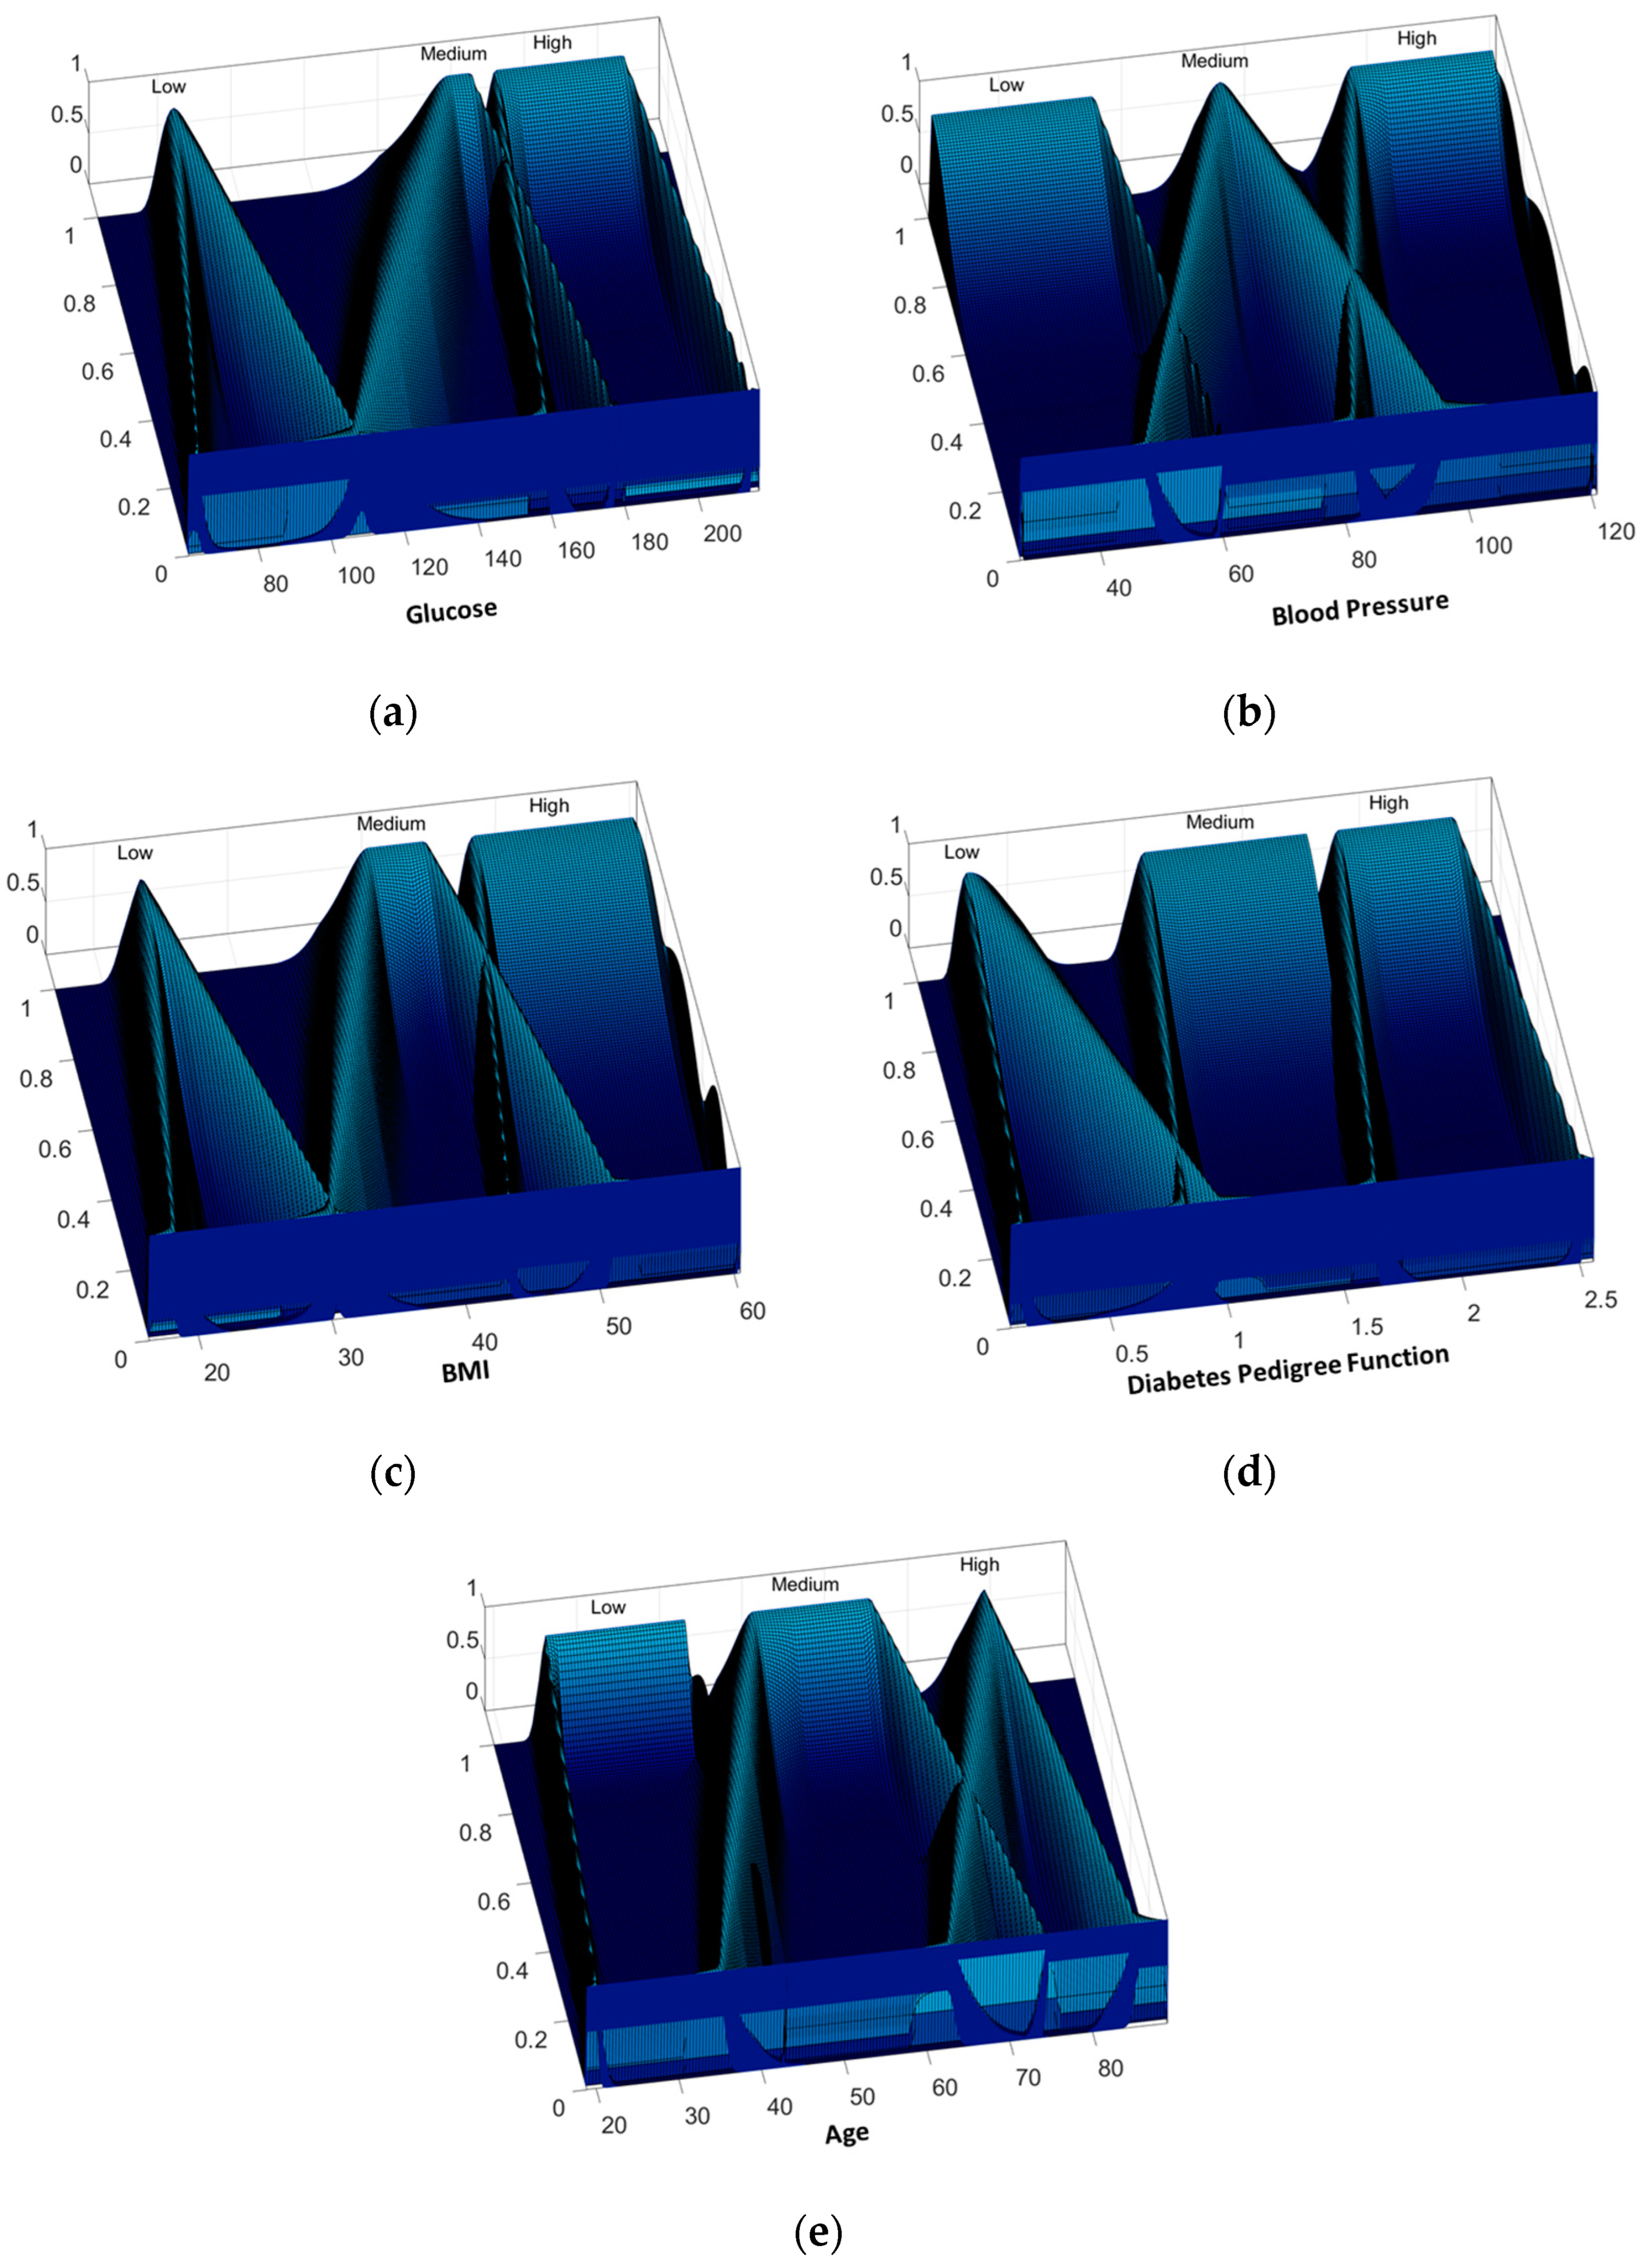
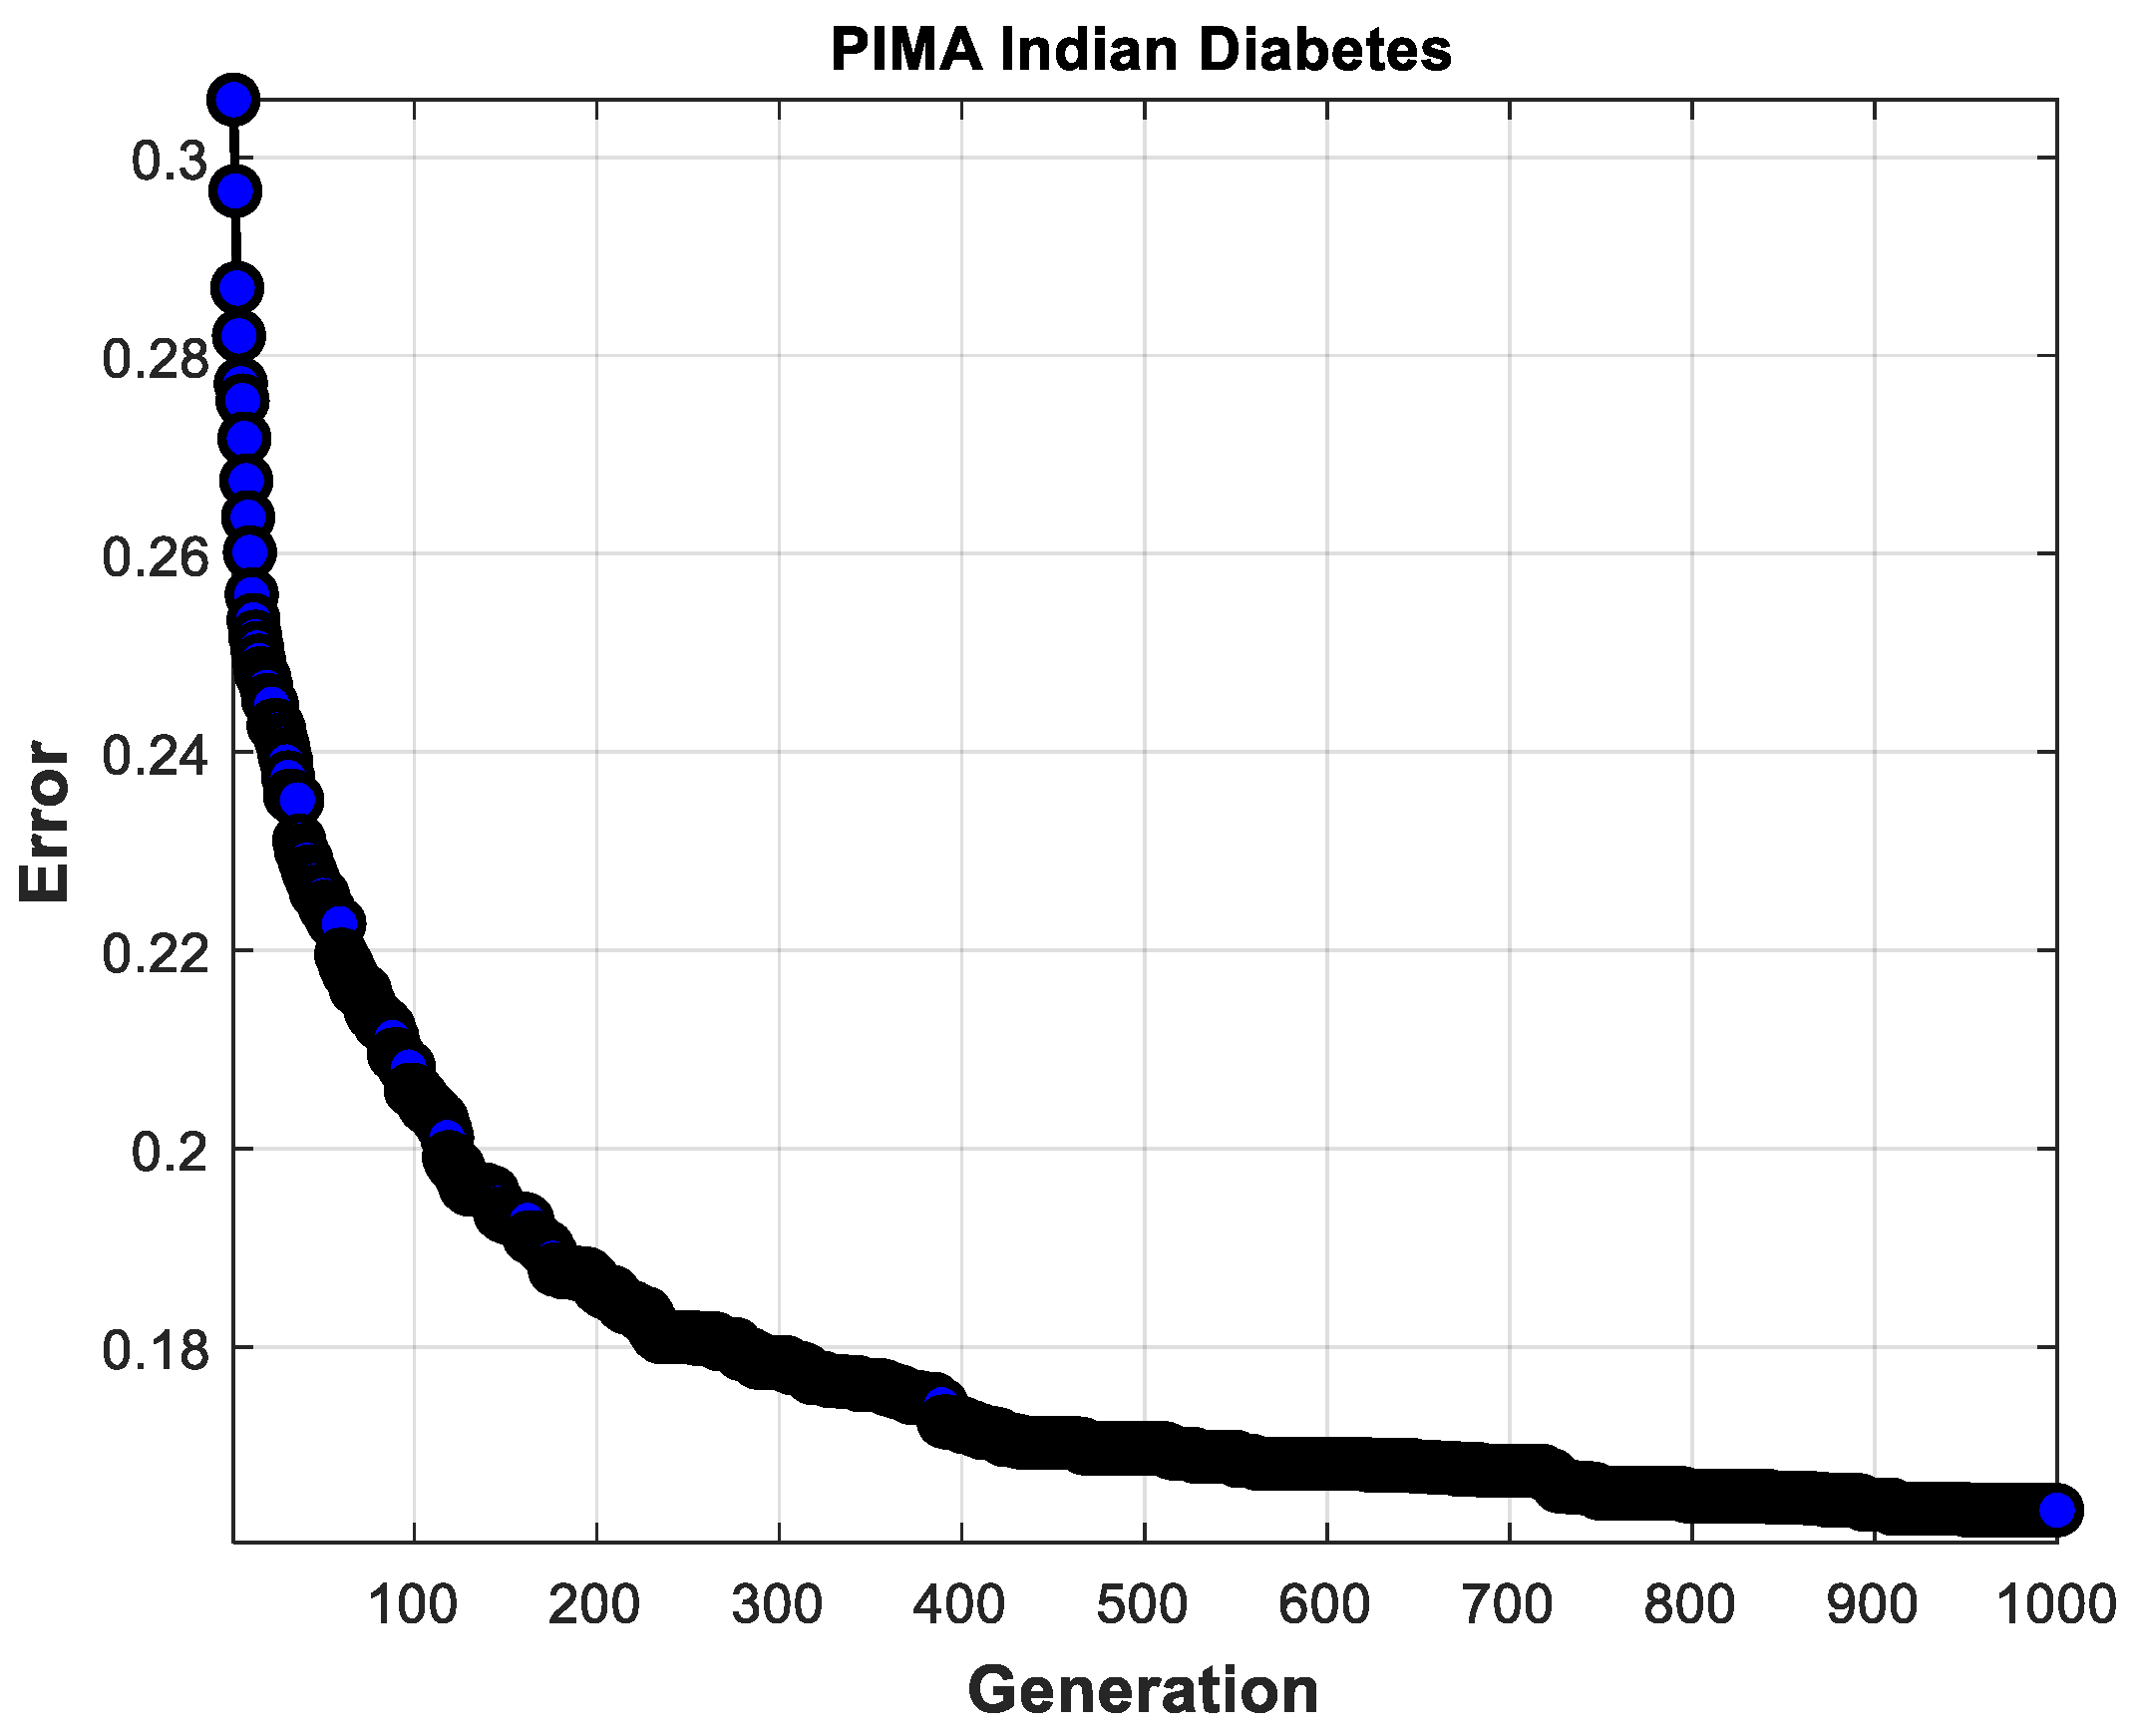
For the PIMA Indian Diabetes dataset, 70% of the instances were used in the design phase, leaving the rest (30%) to prove the real behavior of the Type-3 FIS. In total, 30 experiments were performed using the proposed GA with 1000 generations, each experiment using only 5 of 8 attributes. As Table 6 shows, in the design phase, better results are obtained because the proposed GA allowed designing the Type-3 FIS with a part of the instances. However, the Interval Type-3 FIS obtained allowed to have good results with instances not used in the design phase. Figure 13 shows the inputs with the best results in the testing phase, where 86.38% of accuracy is achieved.
6. Discussion
Experiments with and without cross-validation were carried out to evaluate the performance of the proposed method. Table 8 shows the best and average results achieved in both phases (design and testing) with corresponding standard deviations. Table 8 summarizes the results achieved with all the datasets used in this work. As Table 8 shows, for Cryotherapy, Immunotherapy, and Breast Cancer Coimbra databases, the cross-validation allowed for improving the percentage of accuracy in both phases (design and testing).
In Table 9, the comparison of the results obtained with the proposed method and the results obtained in a previous work [31] using five attributes of the PIMA Indian Diabetes is shown. These results were achieved using T1FIS and IT2FIS and its comparison with the proposed method (IT3FIS).
It can be observed that the best result obtained by the proposed method does not overcome the best results previously obtained by IT2FIS, but the average was surpassed by a large difference for both phases.
Table 10 shows the average times of the experiments performed with the genetic algorithm for each dataset with the different validations. It can be observed how the use of cross-validation increases the time. It is also important to mention that the number of generations is significant and impacts the amount of time, as in the case of the PIMA Indian dataset with five attributes, where 1000 generations were used for its execution.
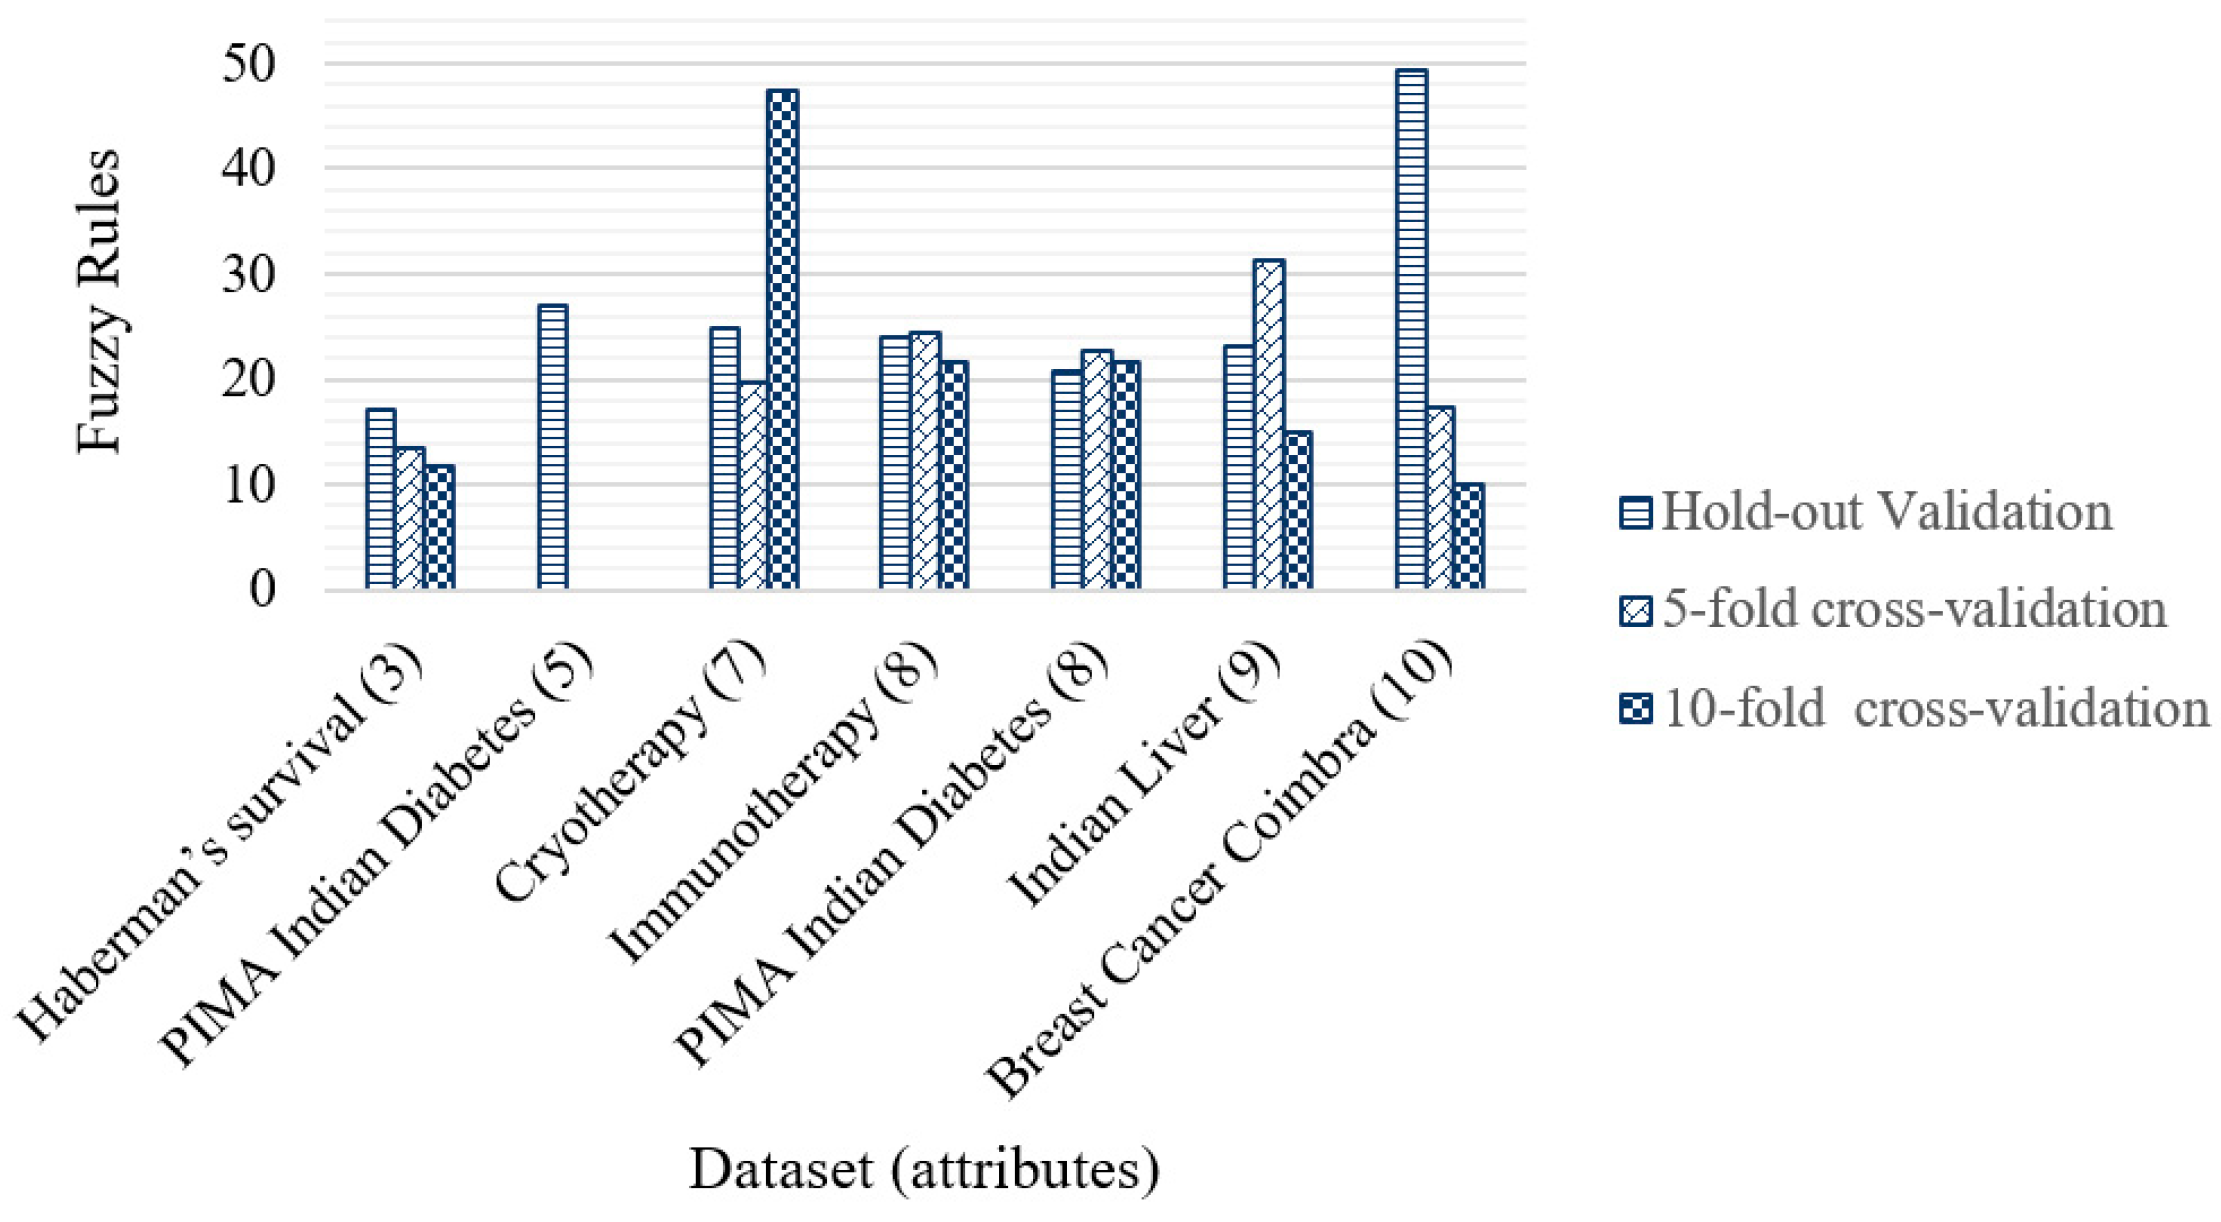
Figure 15 shows the average number of fuzzy rules generated by the genetic algorithm for each dataset with their number of attributes. It can be seen how the 5- and 10-fold cross-validation helped reduce the number of rules for Haberman’s Survival and Breast Cancer Coimbra datasets. In some other cases, only one of the cross-validations allowed a reduction in the number of fuzzy rules, as in the case of the Cryotherapy, Immunotherapy, and Indian Liver datasets. The number of fuzzy rules increased with cross-validations only for the PIMA Indian Diabetes dataset. The proposed method allows the maintenance of an appropriate number of fuzzy rules independently of the number of attributes. In general, the contribution of the optimization of fuzzy rules is essential because their design collaborates with the increase in the percentage of accuracy.
The complexity of a genetic algorithm can be established based on the number of iterations and the number of individuals. For the proposed method, the complexity of the evaluation of each individual lies in the use of Type-3 fuzzy inference systems. The complexity of a Type-3 fuzzy model was described in [47], where it was determined that complexity based on the vertical-slices theory for centroid type reduction is approximately O(NKL). Where it is assumed that a primary variable x is sampled into N points, K is the number of iterations to approximate a switch point, and L means samples for a vertical slice. The complexity is reduced from exponential to linear.
6.1. Statistical Comparison
The results previously shown are used to carry out statistical tests determining if the proposed method allows obtaining a significant advantage over other methods. Table 11 shows the parameters used to perform the statistical Z-tests and t-tests presented in this section.
In Table 12, the comparison between the proposed method (IT3FIS) and T1FIS and IT2FIS developed in a previous work [31] is shown. Where the Z-values are more than the critical value, then it is concluded that the H0 is rejected. There is enough evidence to affirm that the proposed method is better than T1FIS and IT2FIS applied to the PIMA Indian Diabetes dataset using only five attributes and 30% of the instances for the evaluation of the FIS designed.
In the results presented in Refs. [15,16], the results achieved show the effectiveness of the GT2FIS over T1FIS and IT2FIS. For this reason, the statistical comparison is performed directly between GT2FIS and IT3FIS. In Table 13, the results achieved using 40% of the instances for evaluating the FIS designed are presented, where the z-values achieved show the improvement provided by the IT3FIS in all the datasets except for Indian Liver and the Breast Cancer Coimbra, where the obtained results by the proposed method are better than GT2FIS but with not enough statistical evidence.
In Table 14, the results achieved using 20% of the instances for evaluating the FIS designed are presented with five cross-validations, where the t-values achieved show the improvement allowed by the Interval Type-3 FIS in all the datasets, proving that the proposed method is better than General Type-2 FIS with enough statistical evidence.
The results achieved using 10% of the instances for evaluating the FIS designed are presented in Table 15 with 10 cross-validations, where the t-values achieved show the improvement allowed by the Interval Type-3 FIS in all the datasets except for the Breast Cancer Coimbra, where the obtained results by the proposed method are better than General Type-2 FIS but with not enough statistical evidence.
7. Conclusions
This paper proposes the design of Interval Type-3 fuzzy inference systems using a GA applied to medical classification. The GA seeks to find the main fuzzy inference systems parameters, such as MF parameters and the fuzzy if-then rules. Type-3 Trapezoidal MFs are utilized in this work in each input of the FIS; the design of these MFs is based on their LowerScale and LowerLag. An important contribution of our method is the automatic establishment of ranges of the fuzzy variables, where the set of instances used for the design is used to establish them, which allows the proposed method to be applied to different databases with different numbers of attributes (inputs of the FIS). The results achieved in this work allowed us to improve results achieved by other methods based on fuzzy logic. The medical datasets Haberman’s Survival, Cryotherapy, Immunotherapy, PIMA Indian Diabetes, Indian Liver, and Breast Cancer Coimbra dataset achieved 75.30, 87.13, 82.04, 77.76, 71.86, and 71.06, respectively. Cross-validation tests were also carried out using 5- and 10-fold, where for Cryotherapy, Immunotherapy, and Breast Cancer Coimbra databases, the cross-validation improved the accuracy percentage on both phases (design and testing). Statistical tests were performed, and the Z-test demonstrates the effectiveness of the proposed method over General Type-2 FIS in almost all the datasets except for Indian Liver and the Breast Cancer Coimbra. T-tests were applied to validate the behavior of the proposed method with the cross-validation tests. For five cross-validation, the proposed method achieved better results; for the 10 cross-validation tests only for the Breast Cancer Coimbra, there is no statistical difference. In future works, the design of Type-3 FIS proposed in this work will be applied to other areas, such as the integration method applied to pattern recognition, images for edge detection, or control problems, to prove the ability of adaptation of the proposed method.
Author Contributions
Methodology and validation, P.M.; software, validation and writing, D.S.; conceptualization and writing—review and editing, O.C. All authors have read and agreed to the published version of the manuscript.
Funding
This research received no external funding.
Institutional Review Board Statement
Not applicable. This study does not contain any studies with human participants or animals.
Informed Consent Statement
Not applicable. This study does not contain any studies with human participants.
Data Availability Statement
Publicly available datasets were analyzed in this study. These data can be found at “https://www.kaggle.com/datasets/” (accessed on 16 August 2023).
Acknowledgments
We would like to thank TecNM and Conacyt for their support during the realization of this research.
Conflicts of Interest
The authors declare no conflicts of interest.
References
- Bharati, S.; Podder, P.; Mondal, M.; Prasath, V. CO-ResNet: Optimized ResNet model for COVID-19 diagnosis from X-ray images. Int. J. Hybrid Intell. Syst. 2021, 17, 71–85. [Google Scholar] [CrossRef]
- Elhag, A.; Aloafi, T.; Jawa, T.; Sayed-Ahmed, N.; Bayones, F. Artificial neural networks and statistical models for optimization studying COVID-19. Results Phys. 2021, 25, 104274. [Google Scholar] [CrossRef] [PubMed]
- Bashkandi, A.; Sadoughi, K.; Aflaki, F.; Alkhazaleh, H.; Mohammadi, H.; Jimenez, G. Combination of political optimizer, particle swarm optimizer, and convolutional neural network for brain tumor detection. Biomed. Signal Process. Control 2023, 81, 104434. [Google Scholar] [CrossRef]
- Gangwar, A.; Ravi, V. Diabetic retinopathy detection using transfer learning and Deep Learning. In Evolution in Computational Intelligence, 1st ed.; Bhateja, V., Peng, S.L., Satapathy, S.C., Zhang, Y.D., Eds.; Springer: London, UK, 2020; Volume 1176, pp. 679–689. [Google Scholar]
- Nassiri, S.; Tahavoor, A.; Jafari, A. Fuzzy logic classification of mature tomatoes based on physical properties fusion. Inf. Process Agric. 2021, 9, 547–555. [Google Scholar] [CrossRef]
- Hamza, M. Modified Flower Pollination Optimization Based Design of Interval Type-2 Fuzzy PID Controller for Rotary Inverted Pendulum System. Axioms 2023, 12, 586. [Google Scholar] [CrossRef]
- Melin, P.; Sánchez, D.; Castro, J.; Castillo, O. Design of Type-3 Fuzzy Systems and Ensemble Neural Networks for COVID-19 Time Series Prediction Using a Firefly Algorithm. Axioms 2022, 11, 410. [Google Scholar] [CrossRef]
- Melin, P.; Sánchez, D. Optimization of type-1, interval type-2 and general type-2 fuzzy inference systems using a hierarchical genetic algorithm for modular granular neural networks. Granul. Comput. 2018, 4, 211–236. [Google Scholar] [CrossRef]
- Tabakov, M.; Chlopowiec, A.; Chlopowiec, A.; Dlubak, A. Classification with Fuzzification Optimization Combining Fuzzy Information Systems and Type-2 Fuzzy Inference. Appl. Sci. 2021, 11, 3484. [Google Scholar] [CrossRef]
- Vlamou, E.; Papadopoulos, B. Fuzzy logic systems and medical applications. AIMS Neurosci. 2019, 6, 266–272. [Google Scholar]
- Czmil, A. Comparative Study of Fuzzy Rule-Based Classifiers for Medical Applications. Sensors 2023, 23, 992. [Google Scholar] [CrossRef]
- Aamir, K.; Sarfraz, L.; Ramzan, M.; Bilal, M.; Shafi, J.; Attique, M. A Fuzzy Rule-Based System for Classification of Diabetes. Sensors 2021, 21, 8095. [Google Scholar] [CrossRef] [PubMed]
- Filis, S.; Al-Kasasbeh, R.; Shatalova, O.; Korenevskiy, N.; Shaqadan, A.; Protasova, Z.; Ilyash, M.; Lukashov, M. Biotechnical system based on fuzzy logic prediction for surgical risk classification using analysis of current-voltage characteristics of acupuncture points. J. Integr. Med. 2022, 20, 252–264. [Google Scholar] [CrossRef] [PubMed]
- Zaitseva, E.; Levashenko, V.; Rabcan, J.; Kvassay, M. A New Fuzzy-Based Classification Method for Use in Smart/Precision Medicine. Bioengineering 2023, 10, 838. [Google Scholar] [CrossRef] [PubMed]
- Ontiveros, E.; Melin, P.; Castillo, O. Comparative study of interval Type-2 and general Type-2 fuzzy systems in medical diagnosis. Inf. Sci. 2020, 525, 37–53. [Google Scholar] [CrossRef]
- Ontiveros-Robles, E.; Castillo, O.; Melin, P. Towards asymmetric uncertainty modeling in designing General Type-2 Fuzzy classifiers for medical diagnosis. Expert Syst. Appl. 2021, 183, 115370. [Google Scholar] [CrossRef]
- Shi, J. A unified general type-2 fuzzy PID controller and its comparative with type-1 and interval type-2 fuzzy PID controller. Asian J. Control 2022, 24, 1808–1824. [Google Scholar] [CrossRef]
- Woźniak, M.; Szczotka, J.; Sikora, A.; Zielonka, A. Fuzzy logic type-2 intelligent moisture control system. Expert Syst. Appl. 2024, 238, 121581. [Google Scholar] [CrossRef]
- Woźniak, M.; Zielonka, A.; Sikora, A. Driving support by type-2 fuzzy logic control model. Expert Syst. Appl. 2022, 207, 117798. [Google Scholar] [CrossRef]
- Chowdhury, D.; Hovda, S. A hybrid fuzzy logic/genetic algorithm model based on experimental data for estimation of cuttings concentration during drilling. Geoenergy Sci. Eng. 2023, 231, 212387. [Google Scholar] [CrossRef]
- Fan, L.-p.; Chen, X.-m. Optimization of Controller for Microbial Fuel Cell: Comparison between Genetic Algorithm and Fuzzy Logic. Int. J. Electrochem. Sci. 2021, 16, 211123. [Google Scholar] [CrossRef]
- Azizan, F.; Sathasivam, S.; Majahar Ali, M.; Roslan, N.; Feng, C. Hybridised Network of Fuzzy Logic and a Genetic Algorithm in Solving 3-Satisfiability Hopfield Neural Networks. Axioms 2023, 12, 250. [Google Scholar] [CrossRef]
- Schockenhoff, F.; Zähringer, M.; Brönner, M.; Lienkamp, M. Combining a Genetic Algorithm and a Fuzzy System to Optimize User Centricity in Autonomous Vehicle Concept Development. Systems 2021, 9, 25. [Google Scholar] [CrossRef]
- Zhang, F.; Lu, J.; Yang, S.; Liu, W.; Tao, R.; Zhu, D.; Xiao, R. Performance improvement of a pump as turbine in storage mode by optimization design based on genetic algorithm and fuzzy logic. J. Energy Storage 2023, 62, 106875. [Google Scholar] [CrossRef]
- Beklaryan, G.; Akopov, A.; Khachatryan, N. Optimisation of System Dynamics Models Using a Real-Coded Genetic Algorithm with Fuzzy Control. Cybern. Inf. Technol. 2019, 19, 87–103. [Google Scholar] [CrossRef]
- Wijanarko, E.; Grandis, H. Binary Coded Genetic Algorithm (BCGA) with Multi-Point Cross-Over for Magnetotelluric (MT) 1D Data Inversion. IOP Conf. Ser. Earth Environ. Sci. 2019, 318, 012029. [Google Scholar] [CrossRef]
- Mishra, D.; Acharya, B.; Rath, D.; Gerogiannis, V.; Kanavos, A. A Novel Real Coded Genetic Algorithm for Software Mutation Testing. Symmetry 2022, 14, 1525. [Google Scholar] [CrossRef]
- Petrašinović, M.; Grbović, A.; Petrašinović, D.; Petrović, M.; Raičević, N. Real Coded Mixed Integer Genetic Algorithm for Geometry Optimization of Flight Simulator Mechanism Based on Rotary Stewart Platform. Appl. Sci. 2022, 12, 7085. [Google Scholar] [CrossRef]
- Torres-Salinas, H.; Rodríguez-Reséndiz, J.; Cruz-Miguel, E.; Ángeles-Hurtado, L. Fuzzy Logic and Genetic-Based Algorithm for a Servo Control System. Micromachines 2022, 13, 586. [Google Scholar] [CrossRef]
- Mónica, J.; Melin, P.; Sánchez, D. Optimal Design of a Fuzzy System with a Real-Coded Genetic Algorithm for Diabetes Classification. In Proceedings of the International Conference on Hybrid Intelligent Systems, Online, 14–16 December 2020. [Google Scholar]
- Melin, P.; Sánchez, D. Optimal design of type-2 fuzzy systems for diabetes classification based on genetic algorithms. Int. J. Hybrid Intell. Syst. 2021, 17, 15–32. [Google Scholar] [CrossRef]
- Zadeh, L. Fuzzy sets. Inf. Control. 1965, 8, 338–353. [Google Scholar] [CrossRef]
- Zadeh, L. Some reflections on soft computing, granular computing and their roles in the conception, design and utilization of information/intelligent systems. Soft Comput. 1998, 2, 23–25. [Google Scholar] [CrossRef]
- Zadeh, L. The concept of a linguistic variable and its application to approximate reasoning. Inf. Sci. 1975, 8, 199–249. [Google Scholar] [CrossRef]
- Al-Jamimi, H.; Saleh, T. Transparent predictive modelling of catalytic hydrodesulfurization using an interval type-2 fuzzy logic. J. Clean. Prod. 2019, 231, 1079–1088. [Google Scholar] [CrossRef]
- Melin, P.; Castillo, O. A review on type-2 fuzzy logic applications in clustering, classification and pattern recognition. Applied Soft Comput. 2014, 21, 568–577. [Google Scholar] [CrossRef]
- Rickard, J.; Aisbett, J.; Gibbon, G. Fuzzy subsethood for fuzzy sets of type-2 and generalized type-n. IEEE Trans. Fuzzy Syst. 2009, 17, 50–60. [Google Scholar] [CrossRef]
- Mohammadzadeh, A.; Sabzalian, M.; Zhang, W. An Interval Type-3 Fuzzy System and a New Online Fractional-Order Learning Algorithm: Theory and Practice. IEEE Trans. Fuzzy Syst. 2020, 28, 1940–1950. [Google Scholar] [CrossRef]
- Castillo, O.; Castro, J.; Melin, P. Interval Type-3 Fuzzy Systems: Theory and Design, 1st ed.; Springer: London, UK, 2022. [Google Scholar]
- Brabazon, A.; O’Neill, M.; McGarraghy, S. Natural Computing Algorithms, 1st ed.; Springer: London, UK, 2015. [Google Scholar]
- Eiben, A.; Smith, J. Introduction to Evolutionary Computing, 2nd ed.; Springer: London, UK, 2015. [Google Scholar]
- Gestal, M.; Rivero, D.; Pazos, A. Genetic Algorithms: Key Concepts and Examples, 1st ed.; Lambert Academic Publishing: Saarbrücken, Germany, 2010. [Google Scholar]
- Goldberg, D. Genetic Algorithms in Search Optimization and Machine Learning, 1st ed.; Addison-Wesley: Boston, MA, USA, 1989. [Google Scholar]
- Man, K.; Tang, K.; Kwong, S. Genetic Algorithms: Concepts and Designs, 1st ed.; Springer: London, UK, 1999. [Google Scholar]
- Roy, S. Introduction to Soft Computing: Neuro-Fuzzy and Genetic Algorithms, 1st ed.; Pearson: London, UK, 2017. [Google Scholar]
- Kramer, O. Genetic Algorithm Essentials, 1st ed.; Springer: London, UK, 2017. [Google Scholar]
- Amador-Angulo, L.; Castillo, O.; Castro, J.; Melin, P. A New Approach for Interval Type-3 Fuzzy Control of Nonlinear Plants. Int. J. Fuzzy Syst. 2023, 25, 1624–1642. [Google Scholar] [CrossRef]
Figure 1.
Trapezoidal Type-2 MF.

Figure 2.
Type-3 Trapezoidal MF with a vertical cut.

Figure 3.
Type-3 Trapezoidal MF.

Figure 4.
Flowchart of GA.

Figure 5.
The proposed method.

Figure 6.
Sugeno Model Type-3 FIS applied to Haberman’s Survival.

Figure 7.
Fuzzy inputs for Haberman’s Survival dataset: (a) age of patient; (b) year of operation; and (c) number of positive axillary nodes detected.
Figure 7.
Fuzzy inputs for Haberman’s Survival dataset: (a) age of patient; (b) year of operation; and (c) number of positive axillary nodes detected.

Figure 8.
Chromosome representation.

Figure 9.
Summary of the creation and evaluation process for classification.

Figure 10.
Flowchart of the proposed GA.

Figure 11.
Best Type-3 fuzzy inputs variables for Haberman’s Survival dataset: (a) age of patient; (b) year of operation; and (c) number of positive axillary nodes detected.
Figure 11.
Best Type-3 fuzzy inputs variables for Haberman’s Survival dataset: (a) age of patient; (b) year of operation; and (c) number of positive axillary nodes detected.

Figure 12.
Average convergence for Haberman’s Survival dataset.

Figure 13.
Best Type-3 fuzzy inputs variables for PIMA Indian Diabetes dataset: (a) glucose; (b) blood pressure; (c) body mass index; (d) diabetes pedigree function; and (e) age.
Figure 13.
Best Type-3 fuzzy inputs variables for PIMA Indian Diabetes dataset: (a) glucose; (b) blood pressure; (c) body mass index; (d) diabetes pedigree function; and (e) age.

Figure 14.
Average convergence for PIMA Indian Diabetes dataset.

Figure 15.
Average of fuzzy rules generated by the genetic algorithm.


Table 1.
Benchmark datasets.
| Dataset | Attributes | Instances |
|---|---|---|
| Haberman’s Survival | 3 | 306 |
| PIMA Indian Diabetes | 5 and 7 | 336 |
| Cryotherapy | 7 | 90 |
| Immunotherapy | 8 | 90 |
| PIMA Indian Diabetes | 8 | 768 |
| Indian Liver | 9 | 583 |
| Breast Cancer Coimbra | 10 | 116 |
Table 2.
Examples of ranges for the Haberman’s Survival dataset.
| Attributes | Rmin | Rmax |
|---|---|---|
| Age (attr1) | 27 | 73.70 |
| Op_Year (attr2) | 52.20 | 75.9 |
| Axil_Nodes (attr3) | 0 | 57.2 |
Table 3.
Search space of the GA.
| Parameters | Minimum | Maximum | |
|---|---|---|---|
| Trapezoidal MFs (a1, b1, c1, d1) | - | - | |
| LowerScale () | 0.1 | 0.9 | |
| LowerLag (1, 2). | 0.1 | 0.9 | |
| Output | 0 | 1 | |
| Fuzzy if-then rules | Consequents | 1 | 3 |
| (Activation or deactivation) | 0 | 1 | |
Table 4.
Fuzzy if-then rules (Haberman’s Survival dataset).
| Rule | Antecedents | Consequent | ||
|---|---|---|---|---|
| Age | Output | Axil_Nodes | Output | |
| 1 | MFLow | MFLow | MFHigh | MFHigh |
| 2 | MFLow | MFMedium | MFLow | MFLow |
| 3 | MFLow | MFMedium | MFMedium | MFMedium |
| 4 | MFLow | MFMedium | MFHigh | MFMedium |
| 5 | MFLow | MFHigh | MFLow | MFLow |
| 6 | MFMedium | MFLow | MFLow | MFMedium |
| 7 | MFMedium | MFMedium | MFLow | MFMedium |
| 8 | MFMedium | MFHigh | MFMedium | MFHigh |
| 9 | MFHigh | MFLow | MFLow | MFLow |
| 10 | MFHigh | MFMedium | MFLow | MFMedium |
| 11 | MFHigh | MFMedium | MFMedium | MFMedium |
| 12 | MFHigh | MFMedium | MFHigh | MFHigh |
| 13 | MFHigh | MFHigh | MFLow | MFMedium |
Table 5.
Haberman’s Survival dataset results.
| Design | Testing | ||
|---|---|---|---|
| (Best) | (Average) | (Best) | (Average) |
| 79.89% | 77.14% | 77.05% | 75.30% |
Table 6.
PIMA Indian Diabetes results.
| Design | Testing | ||
|---|---|---|---|
| (Best) | (Average) | (Best) | (Average) |
| 86.38% | 83.65% | 83.17% | 81.52% |
Table 7.
Fuzzy if-then rules (PIMA Indian Diabetes dataset).
| Rule | Antecedents | Consequent | ||||
|---|---|---|---|---|---|---|
| Glucose | BP | BMI | DPF | AGE | Output | |
| 1 | MFLow | MFMedium | MFLow | MFMedium | MFHigh | MFLow |
| 2 | MFLow | MFMedium | MFLow | MFHigh | MFMedium | MFLow |
| 3 | MFLow | MFMedium | MFMedium | MFMedium | MFHigh | MFHigh |
| 4 | MFLow | MFMedium | MFMedium | MFHigh | MFMedium | MFHigh |
| 5 | MFMedium | MFLow | MFMedium | MFMedium | MFMedium | MFHigh |
| 6 | MFMedium | MFMedium | MFLow | MFMedium | MFLow | MFLow |
| 7 | MFMedium | MFMedium | MFLow | MFHigh | MFLow | MFMedium |
| 8 | MFMedium | MFMedium | MFMedium | MFMedium | MFLow | MFHigh |
| 9 | MFMedium | MFMedium | MFMedium | MFMedium | MFMedium | MFMedium |
| 10 | MFMedium | MFHigh | MFMedium | MFLow | MFMedium | MFHigh |
| 11 | MFHigh | MFLow | MFLow | MFHigh | MFHigh | MFHigh |
| 12 | MFHigh | MFMedium | MFLow | MFMedium | MFMedium | MFHigh |
| 13 | MFHigh | MFMedium | MFMedium | MFLow | MFLow | MFHigh |
| 14 | MFHigh | MFMedium | MFMedium | MFMedium | MFHigh | MFHigh |
| 15 | MFHigh | MFMedium | MFHigh | MFLow | MFMedium | MFMedium |
| 16 | MFHigh | MFHigh | MFMedium | MFLow | MFLow | MFMedium |
| 17 | MFHigh | MFHigh | MFMedium | MFLow | MFLow | MFMedium |
| 18 | MFHigh | MFHigh | MFMedium | MFLow | MFLow | MFMedium |
| 19 | MFHigh | MFHigh | MFMedium | MFLow | MFLow | MFMedium |
| 20 | MFHigh | MFMedium | MFMedium | MFHigh | MFMedium | MFMedium |
| 21 | MFHigh | MFMedium | MFMedium | MFHigh | MFHigh | MFMedium |
| 22 | MFHigh | MFHigh | MFHigh | MFLow | MFHigh | MFMedium |
| 23 | MFHigh | MFMedium | MFHigh | MFHigh | MFMedium | MFHigh |
| 24 | MFHigh | MFHigh | MFHigh | MFLow | MFMedium | MFHigh |
| 25 | MFHigh | MFHigh | MFMedium | MFMedium | MFLow | MFMedium |
| 26 | MFHigh | MFHigh | MFMedium | MFMedium | MFMedium | MFMedium |
| 27 | MFHigh | MFHigh | MFHigh | MFMedium | MFMedium | MFLow |
Table 8.
Summary results.
| Dataset | k-Fold | % Design Set | % Testing Set | Design | Testing | ||
|---|---|---|---|---|---|---|---|
| Mean | Std Dev | Mean | Std Dev | ||||
| Haberman’s Survival | - | 60 | 40 | 77.14 | 1.3906 | 75.30 | 0.6361 |
| 5 | 80 | 20 | 76.78 | 1.3645 | 76.69 | 1.1509 | |
| 10 | 90 | 10 | 76.55 | 0.8739 | 77.73 | 2.0233 | |
| Cryotherapy | - | 60 | 40 | 85.12 | 4.0829 | 87.13 | 1.5446 |
| 5 | 80 | 20 | 85.42 | 3.1570 | 86.67 | 2.0286 | |
| 10 | 90 | 10 | 89.17 | 2.1510 | 89.67 | 1.6605 | |
| Immunotherapy | - | 60 | 40 | 84.26 | 2.4194 | 82.04 | 2.2759 |
| 5 | 80 | 20 | 84.86 | 1.8391 | 85.56 | 2.0951 | |
| 10 | 90 | 10 | 84.40 | 2.3520 | 83.78 | 1.8295 | |
| PIMA Indian Diabetes | - | 60 | 40 | 74.26 | 1.4760 | 77.76 | 1.1085 |
| 5 | 80 | 20 | 74.11 | 1.7514 | 77.18 | 0.3064 | |
| 10 | 90 | 10 | 74.46 | 1.8471 | 77.66 | 1.7584 | |
| Indian Liver | - | 60 | 40 | 72.45 | 0.7416 | 71.86 | 0.4014 |
| 5 | 80 | 20 | 71.85 | 0.4863 | 72.40 | 0.6870 | |
| 10 | 90 | 10 | 71.93 | 0.7086 | 72.26 | 0.9167 | |
| Breast Cancer Coimbra | - | 60 | 40 | 63.19 | 4.5129 | 71.06 | 2.1350 |
| 5 | 80 | 20 | 66.19 | 3.1440 | 72.78 | 2.2471 | |
| 10 | 90 | 10 | 75.58 | 1.2419 | 74.91 | 1.4342 | |
| PIMA Indian Diabetes (5 attributes) | - | 70 | 30 | 83.65 | 0.9194 | 81.52 | 1.1133 |
Table 9.
PIMA Indian Diabetes results (5 Attributes).
| Method | Design | Testing | ||
|---|---|---|---|---|
| (Best) | (Average) | (Best) | (Average) | |
| T1FIS | 83.44% | 81.46% | 80.20% | 76.34% |
| IT2FIS | 86.68% | 82.45% | 83.17% | 78.68% |
| IT3FIS | 86.38% | 83.65% | 83.17% | 81.52% |
Table 10.
Average time of the evolutions.
| Dataset | Hold-Out | 5-Fold | 10-Fold |
|---|---|---|---|
| Haberman’s Survival | 00:04:22 | 00:16:36 | 00:32:54 |
| Cryotherapy | 00:02:54 | 00:11:08 | 00:24:11 |
| Immunotherapy | 00:02:32 | 00:10:41 | 00:21:04 |
| PIMA Indian Diabetes | 00:24:46 | 01:43:04 | 03:50:29 |
| Indian Liver | 00:23:32 | 02:04:30 | 03:38:27 |
| Breast Cancer Coimbra | 00:05:45 | 00:23:34 | 00:45:00 |
| PIMA Indian Diabetes (5 attributes) | 05:24:34 | - | - |
Table 11.
Tests parameters.
| Parameter | Value |
|---|---|
| Significance | 0.95 |
| H0 | µ1 = µ2 |
| H1 | µ1 > µ2 |
| Critical Value (Z-test/T-test) | 1.645/1.812 |
Table 12.
Values of Z-test for PIMA Indian Diabetes with 5 attributes.
| Method | N | Mean | Std Dev | z-Value | p-Value |
|---|---|---|---|---|---|
| IT3FIS | 30 | 81.52 | 1.1133 | 9.7750 | 1.36 × 10⁻²¹ |
| T1FIS | 30 | 76.34 | 2.6814 | ||
| IT3FIS | 30 | 81.52 | 1.1133 | 6.6860 | 1.54 × 10⁻¹⁰ |
| IT2FIS | 30 | 78.68 | 2.0429 |
Table 13.
Values of Z-tests using 40% of the instances for validation of the FIS.
| Dataset | Method | N | Mean | Std Dev | z-Value | p-Value |
|---|---|---|---|---|---|---|
| Haberman’s Survival | IT3FIS | 30 | 75.30 | 0.6361 | 2.8115 | 0.0025 |
| GT2FIS | 30 | 74.01 | 2.4285 | |||
| Cryotherapy | IT3FIS | 30 | 87.13 | 1.5446 | 2.0482 | 0.0203 |
| GT2FIS | 30 | 85.52 | 4.0122 | |||
| Immunotherapy | IT3FIS | 30 | 82.04 | 2.2759 | 2.2462 | 0.0123 |
| GT2FIS | 30 | 78.79 | 7.5888 | |||
| PIMA Indian Diabetes | IT3FIS | 30 | 77.76 | 1.1085 | 2.5702 | 0.0051 |
| GT2FIS | 30 | 76.60 | 2.2156 | |||
| Indian Liver | IT3FIS | 30 | 71.86 | 0.4014 | 0.7714 | 0.2202 |
| GT2FIS | 30 | 71.48 | 2.6631 | |||
| Breast Cancer Coimbra | IT3FIS | 30 | 71.06 | 2.1350 | 0.7483 | 0.2271 |
| GT2FIS | 30 | 69.87 | 8.4725 |
Table 14.
Values of t-tests using 20% of the instances for validation of the FIS with 5 cross-validations.
Table 14.
Values of t-tests using 20% of the instances for validation of the FIS with 5 cross-validations.
| Dataset | Method | N | Mean | Std Dev | t-Value | p-Value |
|---|---|---|---|---|---|---|
| Haberman’s Survival | IT3FIS | 10 | 76.69 | 1.1509 | 6.1340 | 3.69 × 10⁻⁵ |
| GT2FIS | 10 | 74.30 | 0.4450 | |||
| Cryotherapy | IT3FIS | 10 | 86.67 | 2.0286 | 2.6674 | 0.0081 |
| GT2FIS | 10 | 83.89 | 2.594 | |||
| Immunotherapy | IT3FIS | 10 | 85.56 | 2.0951 | 18.5907 | 4.54 × 10⁻¹² |
| GT2FIS | 10 | 71.05 | 1.3027 | |||
| PIMA Indian Diabetes | IT3FIS | 10 | 77.18 | 0.3064 | 6.3802 | 4.56 × 10⁻⁶ |
| GT2FIS | 10 | 76.17 | 0.3970 | |||
| Indian Liver | IT3FIS | 10 | 72.40 | 0.6870 | 2.7279 | 0.0074 |
| GT2FIS | 10 | 71.36 | 0.9830 | |||
| Breast Cancer Coimbra | IT3FIS | 10 | 72.78 | 2.2471 | 2.5457 | 0.0117 |
| GT2FIS | 10 | 70.70 | 1.2927 |
Table 15.
Values of t-tests using 10% of the instances for validation of the FIS with 10 cross-validations.
Table 15.
Values of t-tests using 10% of the instances for validation of the FIS with 10 cross-validations.
| Dataset | Method | N | Mean | Std Dev | t-Value | p Value |
|---|---|---|---|---|---|---|
| Haberman’s Survival | IT3FIS | 10 | 77.73 | 2.0233 | 4.6205 | 4.75 × 10⁻⁴ |
| GT2FIS | 10 | 74.67 | 0.5578 | |||
| Cryotherapy | IT3FIS | 10 | 89.67 | 1.6605 | 5.4189 | 3.56 × 10⁻⁵ |
| GT2FIS | 10 | 86.22 | 1.133 | |||
| Immunotherapy | IT3FIS | 10 | 83.78 | 1.8295 | 7.0236 | 1.02 × 10⁻⁶ |
| GT2FIS | 10 | 77.78 | 1.9876 | |||
| PIMA Indian Diabetes | IT3FIS | 10 | 77.66 | 1.7584 | 2.8421 | 0.0097 |
| GT2FIS | 10 | 76.05 | 0.338 | |||
| Indian Liver | IT3FIS | 10 | 72.26 | 0.9167 | 2.1748 | 0.0252 |
| GT2FIS | 10 | 71.57 | 0.4110 | |||
| Breast Cancer Coimbra | IT3FIS | 10 | 74.91 | 1.4342 | 0.5277 | 0.3027 |
| GT2FIS | 10 | 74.45 | 2.316 |
Disclaimer/Publisher’s Note: The statements, opinions and data contained in all publications are solely those of the individual author(s) and contributor(s) and not of MDPI and/or the editor(s). MDPI and/or the editor(s) disclaim responsibility for any injury to people or property resulting from any ideas, methods, instructions or products referred to in the content. |
© 2023 by the authors. Licensee MDPI, Basel, Switzerland. This article is an open access article distributed under the terms and conditions of the Creative Commons Attribution (CC BY) license (https://creativecommons.org/licenses/by/4.0/).
Share and Cite
MDPI and ACS Style
Melin, P.; Sánchez, D.; Castillo, O. Interval Type-3 Fuzzy Inference System Design for Medical Classification Using Genetic Algorithms. Axioms 2024, 13, 5. https://0-doi-org.brum.beds.ac.uk/10.3390/axioms13010005
AMA Style
Melin P, Sánchez D, Castillo O. Interval Type-3 Fuzzy Inference System Design for Medical Classification Using Genetic Algorithms. Axioms. 2024; 13(1):5. https://0-doi-org.brum.beds.ac.uk/10.3390/axioms13010005
Chicago/Turabian StyleMelin, Patricia, Daniela Sánchez, and Oscar Castillo. 2024. "Interval Type-3 Fuzzy Inference System Design for Medical Classification Using Genetic Algorithms" Axioms 13, no. 1: 5. https://0-doi-org.brum.beds.ac.uk/10.3390/axioms13010005
Note that from the first issue of 2016, this journal uses article numbers instead of page numbers. See further details here.