Article

A Novel System for Semiautomatic Sample Processing in Chronic Myeloid Leukaemia: Increasing Throughput without Impacting on Molecular Monitoring at Time of SARS-CoV-2 Pandemic

by
Stefania Stella
1,2,*,†,
Silvia Rita Vitale
1,2,†,
Michele Massimino
1,2,
Adriana Puma
1,2,
Cristina Tomarchio
1,2,
Maria Stella Pennisi
1,2,
Elena Tirrò
2,3,
Chiara Romano
1,2,
Federica Martorana
1,2,
Fabio Stagno
4,
Francesco Di Raimondo
4,5 and
Livia Manzella
1,2
1
Department of Clinical and Experimental Medicine, University of Catania, 95123 Catania, Italy
2
Center of Experimental Oncology and Hematology, A.O.U. Policlinico “G.Rodolico—San Marco”, 95123 Catania, Italy
3
Department of Surgical, Oncological and Stomatological Sciences, University of Palermo, 90121 Palermo, Italy
4
Division of Hematology and Bone Marrow Transplant, A.O.U. Policlinico “G.Rodolico—San Marco”, 95123 Catania, Italy
5
Hematology Department of Surgery, Medical and Surgical Specialities, University of Catania, 95123 Catania, Italy
*
Author to whom correspondence should be addressed.
These authors contributed equally to this work.
Submission received: 30 June 2021 / Revised: 17 August 2021 / Accepted: 19 August 2021 / Published: 20 August 2021

Abstract

:
Molecular testing of the BCR-ABL1 transcript via real-time quantitative-polymerase-chain-reaction is the most sensitive approach for monitoring the response to tyrosine-kinase-inhibitors therapy in chronic myeloid leukaemia (CML) patients. Each stage of the molecular procedure has been standardized and optimized, including the total white blood cells (WBCs) and RNA isolation methods. Here, we compare the performance of our current manual protocol to a newly semiautomatic method based on the Biomek i-5 Automated Workstations integrated with the CytoFLEX Flow Cytometer, followed by the automatic QIAsymphony system to facilitate high-throughput processing samples and reduce the hands-on time and the risk associated with SARS-CoV-2. The recovery efficiency was investigated in blood samples from 100 adults with CML. We observe a 100% of concordance between the two methods, with similar total WBCs isolated (median 1.137 × 10⁶ for manual method vs. 1.076 × 10⁶ for semiautomatic system) and a comparable quality and quantity of RNA extracted (median 103 ng/μL with manual isolation kit vs. 99.95 ng/μL with the QIAsymphony system). Moreover, by stratifying patients according to their BCR-ABL1 transcript levels, we obtained similar BCR-ABL1/ABL1IS values and ABL1 copies, and matched samples were assigned to the same group of molecular response. We conclude that this newly semiautomatic workflow has a performance comparable to our more laborious standard manual, which can be replaced, particularly when specimens from patients with suspected or confirmed SARS-CoV-2 infection need to be processed.

1. Introduction

Chronic myeloid leukaemia (CML) is a stem cell disease characterized by a unique cytogenetic marker, the Philadelphia (Ph) chromosome, arising from the reciprocal translocation between the long arm of chromosomes 9 with the Abelson1 (ABL1) oncogene juxtaposed to the breakpoint cluster region (BCR) gene on chromosome 22 t(9;22) (q34;q11) [1,2,3,4]. At the molecular level, the Ph chromosome generates the BCR-ABL1 fusion chimeric gene, encoding an oncoprotein with constitutive tyrosine kinase activity that alters the proliferation rate, survival signalling, immunological interactions, and cytoskeletal dynamics of the hematopoietic stem cell [5,6,7,8]. The Ph chromosome is detected in 95% of CML patients, in 3–5% of paediatric and 15–20% of adult acute lymphoblastic leukaemia, respectively [9,10,11,12]. In the remaining 5% of CML cases, the fusion gene is “cryptic” and located on a normal chromosome 22 or, rarely, on chromosome 9 [9,13].
In the current clinical practice, the introduction of tyrosine kinase inhibitors (TKIs) in the treatment of CML patients has generated unprecedented rates of haematological, cytogenetic and molecular responses, increasing overall survival and improving disease outcome [14,15,16,17]. The management of CML patients is defined by the current European Leukaemia Network (ELN) recommendation [18,19]. The monitoring of molecular response should be done via quantitative polymerase chain reaction (Q-PCR), which enables to stratify patients into three groups of response: (i). “optimal responders”, who will continue the same treatment; (ii). “warning individuals”, who should be monitored more carefully; (iii). “failed patients”, who need to change the current therapy due to the risk of progression and death [18,19]. Tyrosine kinase inhibitor resistance includes biological events classified as either BCR-ABL1-dependent and BCR-ABL1-independent mechanisms [20,21,22,23,24]. The identification of resistance mechanisms is critical to define new therapeutic strategy capable of selectively killing cancer cells [25,26,27]. Patients who do not reach an optimal molecular response or develop resistance can switch to another TKI [20,28,29]. On the other hand, individuals who acquire stable deep molecular response on TKIs may be eligible for treatment free-remission (TFR) [30,31,32,33].
In the last years, qualitative and quantitative molecular techniques have been developed to evaluate and measure BCR-ABL1 transcript [4,9,34,35]. The Q-PCR has become the “gold standard” to perform serial measurements of BCR-ABL1 mRNA and monitor patient outcomes [34,36,37,38,39]. For valid Q-PCR data, each stage of the molecular procedure should be standardized and optimized, including the quantity of blood collected, the isolation method for total white blood cells (WBCs) and RNA extraction. Particularly, the quality and quantity of WBCs isolated and total RNA are mandatory for accuracy and reproducibility of Q-PCR analyses which is crucial for clinical decision-making, such as TKIs switching or discontinuation [9,35,40]. Overall, the measurement of BCR-ABL1 transcript by Q-PCR should be done every 3 months after TKIs therapy initiation, then at least every 3–6 months. However, this interval may vary according to the clinical context. Mainly, CML patients with TFR require monthly Q-PCR determination during the first six months after drug discontinuation, in order to determine that the desired level of molecular response is maintained over the time [19,41,42,43].
In our laboratory, BCR-ABL1 molecular monitoring is currently performed using a manual method for total WBCs isolation and RNA extraction. However, this manual workflow is laborious, can only process small number of samples simultaneously, increase the hands-on time and the risk associated with the use of specimens from patient with suspected or confirmed severe acute respiratory syndrome coronavirus 2 (SARS-CoV-2) infection. Hence, laboratory practices aimed to increase the number of processed human blood samples and to mitigate the SARS-CoV-2-mediated biohazard risk could be required.
In this study, we compared the performance of our standard manual workflow to a newly semiautomatic method based on the Biomek i-5 Automated Workstations integrated with the CytoFLEX Flow Cytometer, followed by the automatic QIAsymphony system, to determine whether the semiautomatic workflow can reduce hands-on time, improve high-throughput sample processes, isolate comparable total RNA and obtain accurate and reproducible Q-PCR data.

2. Materials and Methods

2.1. Patient Selection

Between January 2021 and April 2021, we carried out a research study on a total of 100 adult chronic phase CML patients (Table 1). Peripheral blood (PB) samples were collected and analysed for molecular monitoring of CML at the Center of Experimental Oncology and Hematology, A.O.U. Policlinico “G. Rodolico—San Marco” of Catania. The present study matches with the Declaration of Helsinki. All participants gave written informed consent for the data to be used in this analysis.
All patients received a TKI (imatinib brand or generic, dasatinib, nilotinib or bosutinib) as a first-line treatment. Treatment response was evaluated according to the 2020 ELN criteria [19].

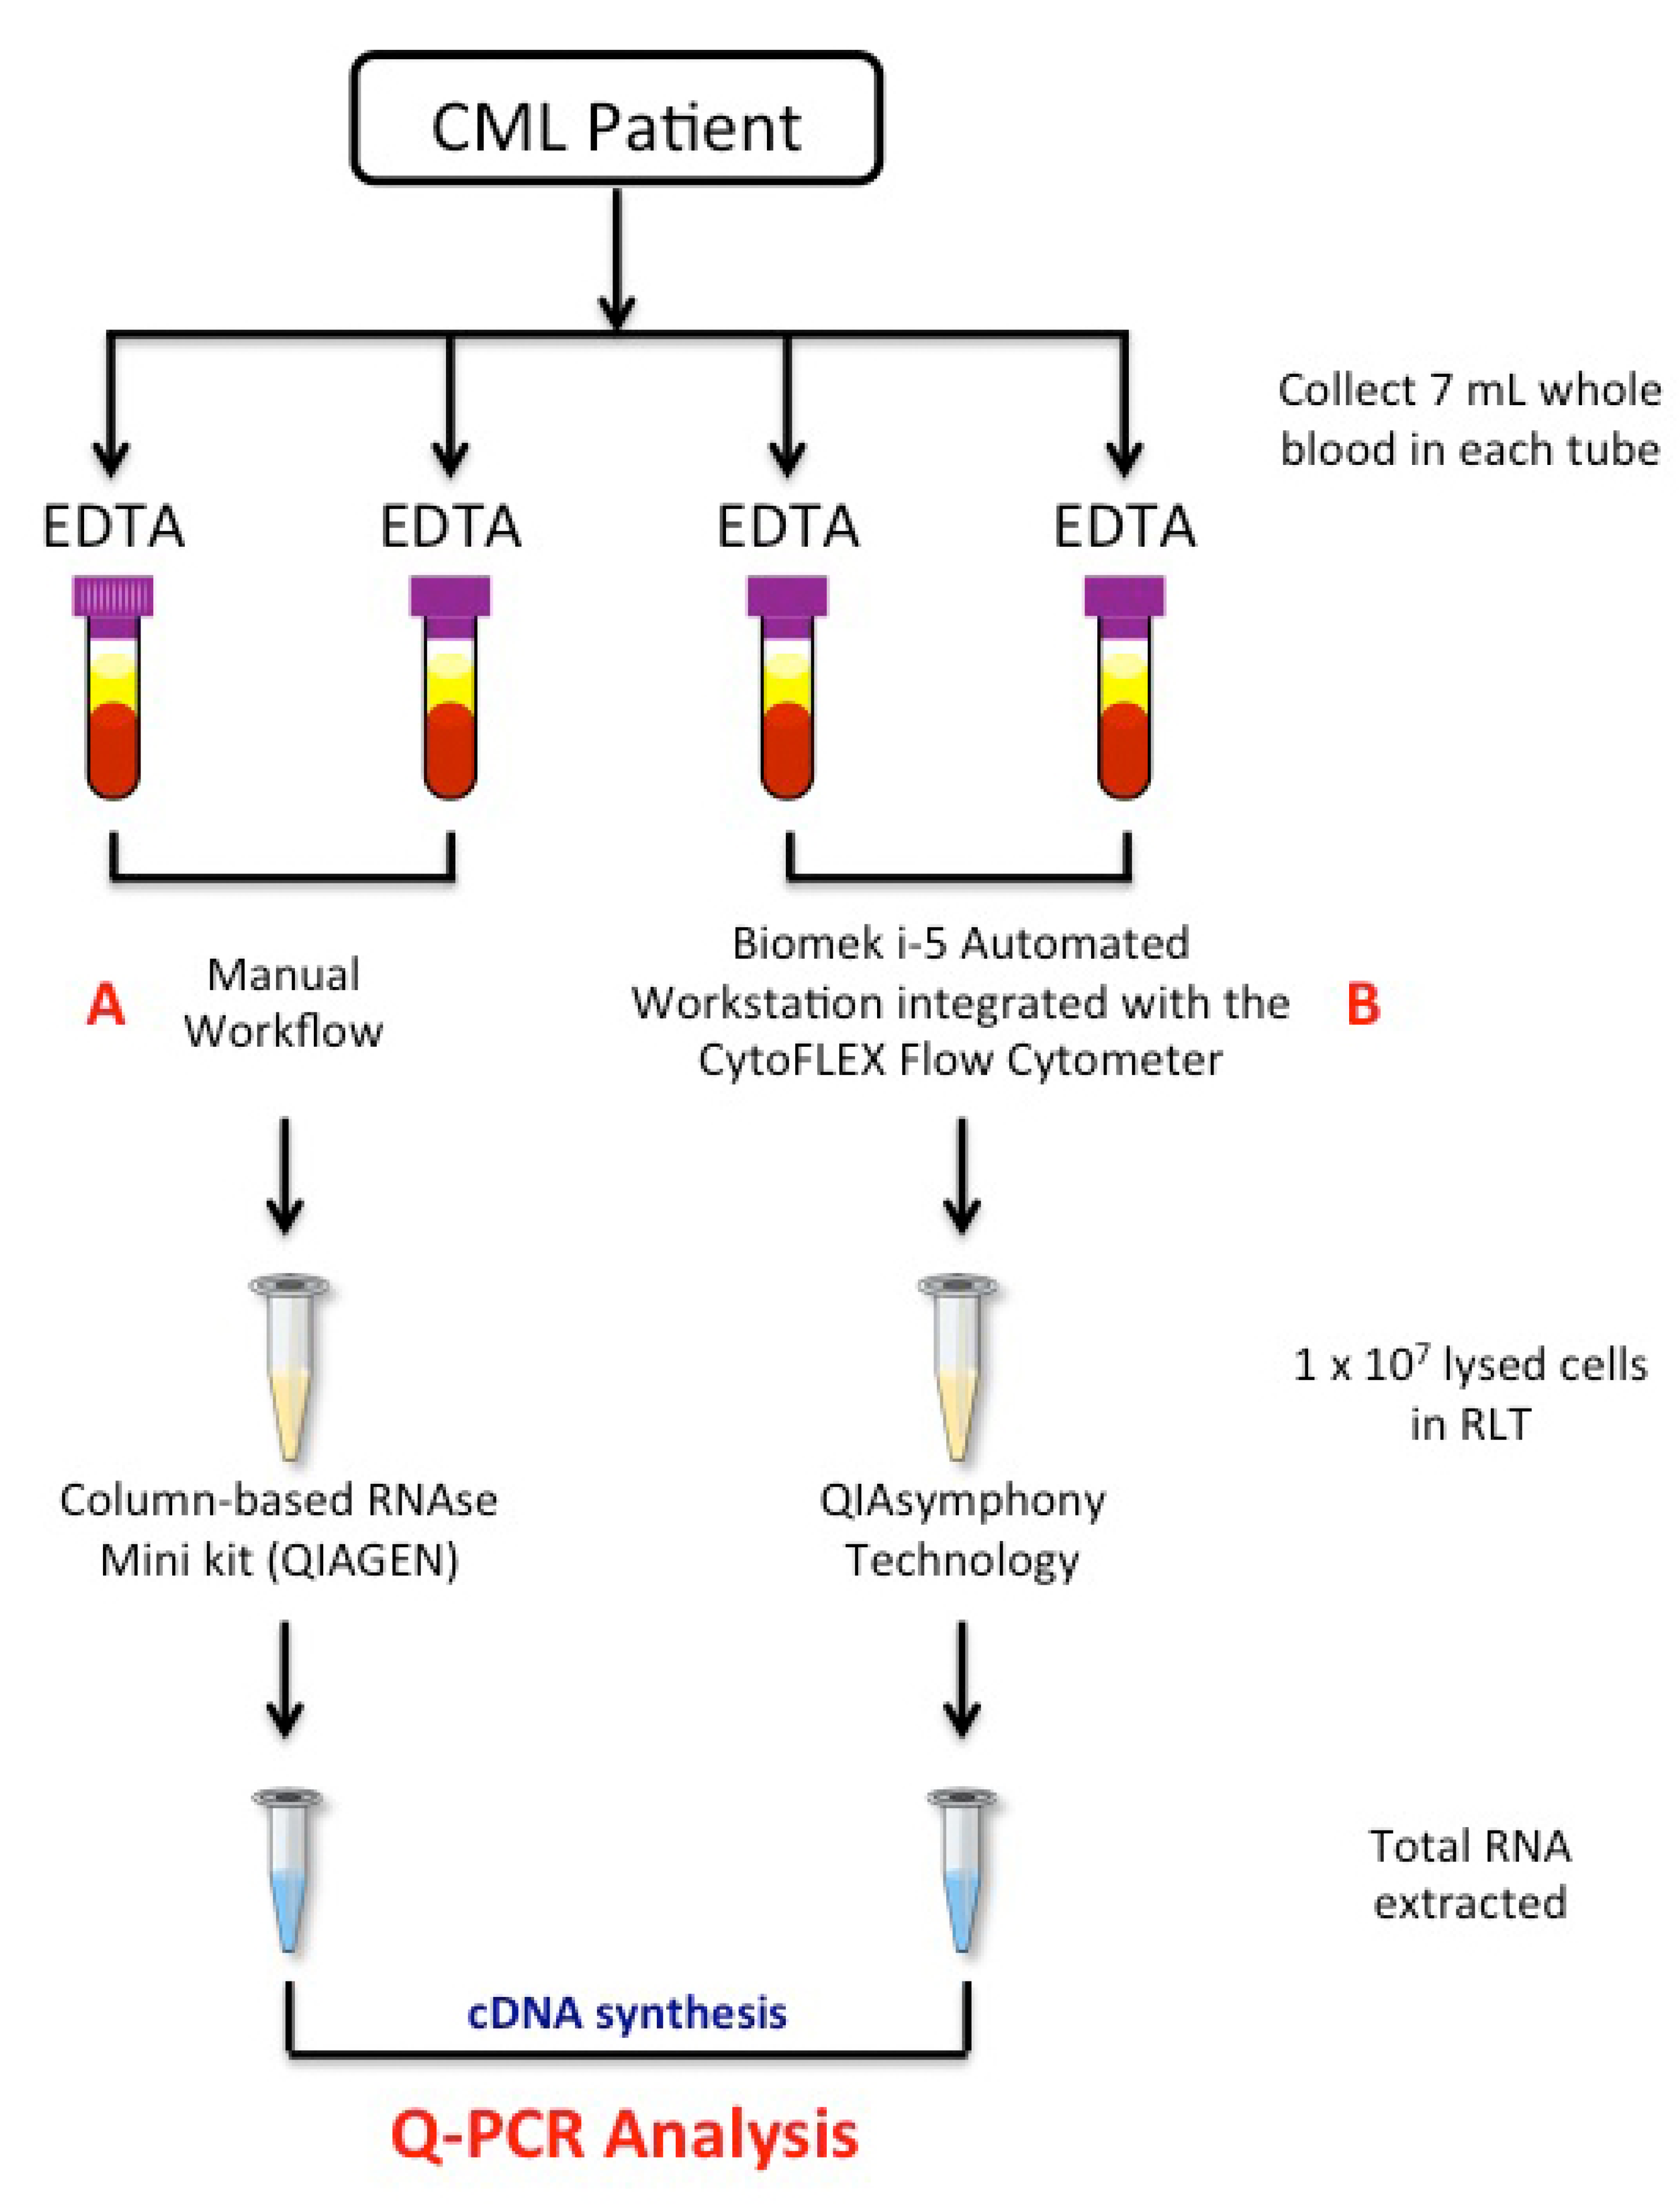
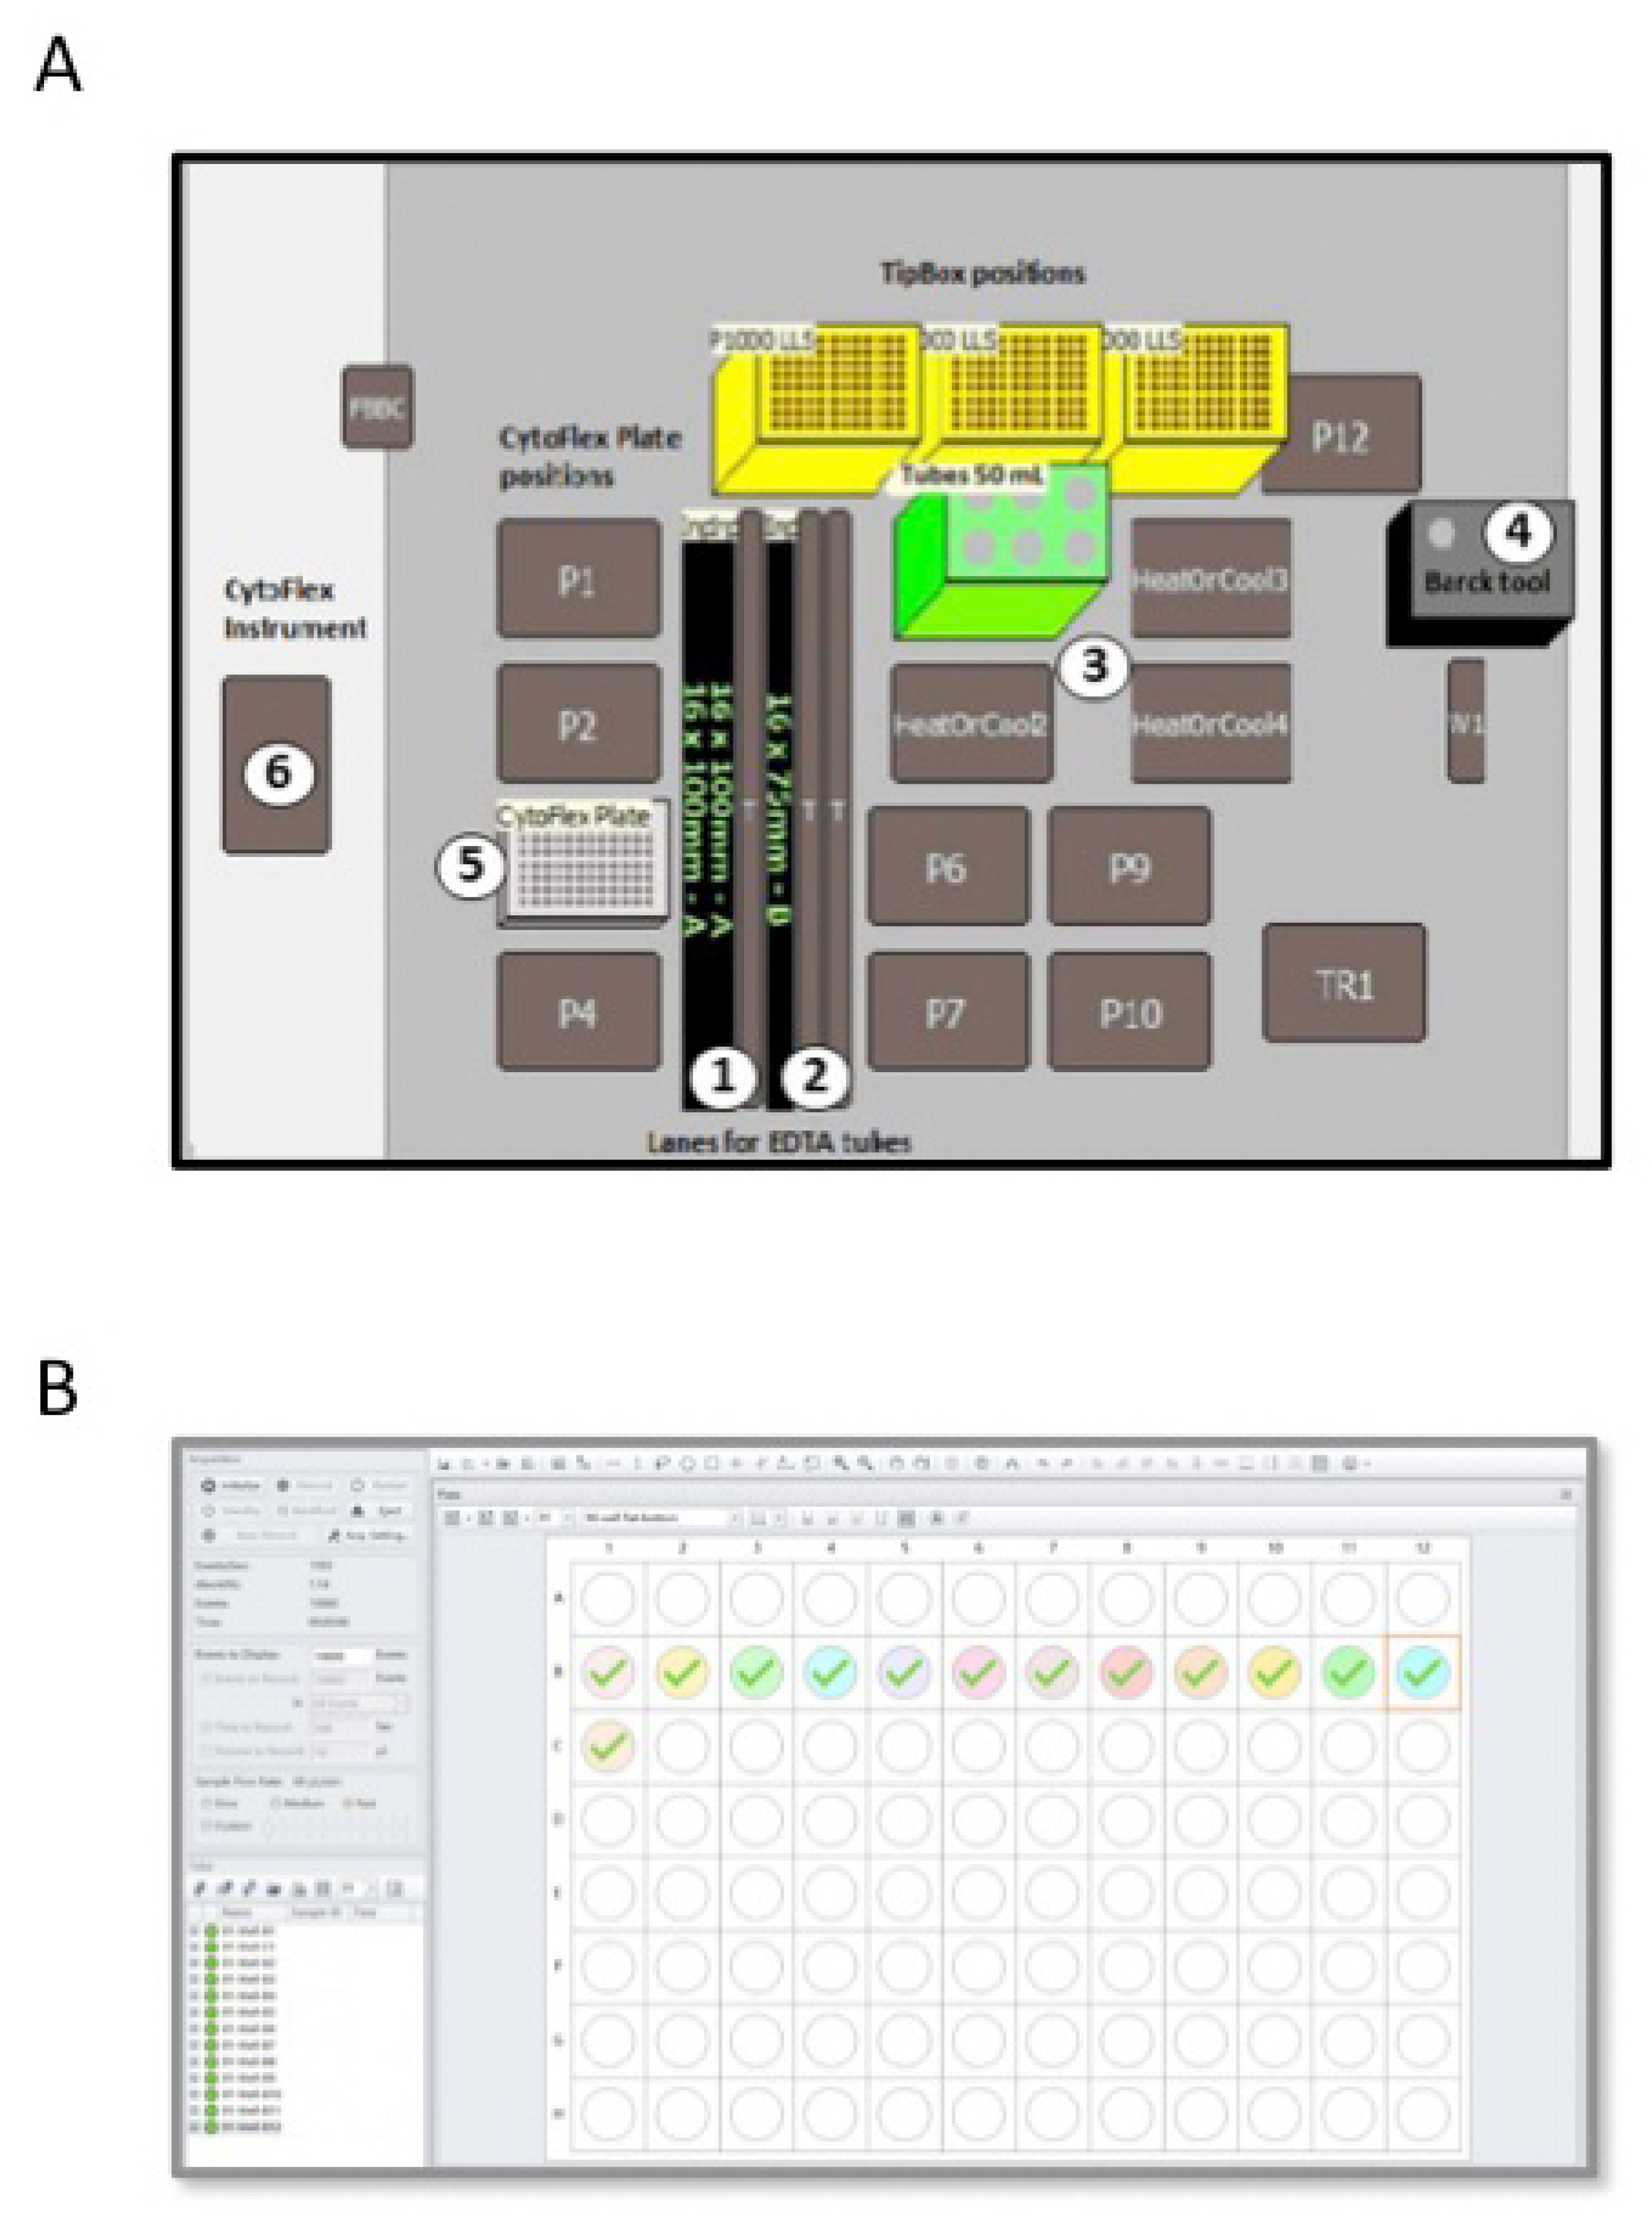
2.2. Blood Collection and White Blood Cell Isolation

One hundred CML patients provided 28 mL of PB within a single blood draw. Matched PB samples were collected in sterile 4 × 7 mL EDTA tubes (BD Vacutainer, Becton Dickinson, Franklin Lanes, NJ, USA), according to the manufacturer’s instructions. The blood samples were stored at room temperature and further processed within 24 h from blood draw. Total WBCs from matched 14 mL of PB were isolated and lysed in RLT buffer (Qiagen, Hilden, Germany). Two isolation methods were investigated (Figure 1 and Table 2), the manual (A) and the semiautomatic (B) methods.
In the manual method, red cells were removed from 14 mL of PB blood for each of 100 CML subjects by two consecutive treatments of the blood sample with red cell lysis, incubated in ice for 15 min, followed by centrifugation (7 min at 1800 rpm). Then, the entire WBCs were washed and collected in phosphate buffered saline (PBS). Cells were diluted and a count was carried out using the haemocytometer counting-chamber with a microscope. Next, 1 × 10⁷cells were lysed in RLT buffer (Qiagen, Hilden, Germany), according to the manufacturers (Figure 1). RLT lysates were stored at −80 °C until further processing.
In the semiautomatic method, we used the Biomek i-5 Automated Workstations integrated with the CytoFLEX Flow Cytometer to enables sample processing and data acquisition (Figure 1B and Table 2). Deck space of the Biomek i-5 Workstation was customized in order to isolate total WBCs from PB blood samples of CML patients (Figure 2A). EDTA tubes with identificative (ID) number of patients were first logged in a datasheet and then loaded into the Biomeck i-5 using the available samples lanes, suitable for both 3 mL and 7 mL tubes (Figure 2A, position 1 and 2). Next, blood was transferred from EDTA tubes to 50 mL tubes, located in a cooler position (Figure 2A, position 3), by an arm linked to a span-8 Pod, a system able to move in the D-Z-X axes. Cell isolations were performed according to our standard protocol, with some minor modifications. More in detail, we reduced the time of the two consecutive red cells lysis from 15 min to 10 min and introduced a third lysis step of 5 min thawing to eliminate residual red cells. Next, WBCs were harvested and collected in PBS. Both the lysis buffer and PBS were aliquoted using a gripper gifted of gripper fingers and gripper pads to grab the bark tool (Figure 2A, position 4) that is the dispenser of buffer solutions. Then, 200 µL of collected cells were dispensed in a 96-well plate (Figure 2A, position 5 and Figure 2B) and loaded into the CytoFLEX Flow Cytometer (Figure 2A, position 6) using the gripper and a plate loader, and without the need for additional robotic transport. A total of 10,000 events were counted and cells were identified using forward and side scatter. Next, the number of cells present in 1 mL of PBS was calculated by reporting the results as “cell lives events/µL (V) × 1 mL” (Figure 2B). Finally, 1 × 10⁷ cells were lysed in RLT, as above described.

2.3. RNA Extraction and cDNA Synthesis

Total RNA from matched samples was extracted from 1 × 10⁷ WBCs lysed in RLT buffer using two different methods: the manual method (Table 2(C)) by the RNAse Mini Kit (Qiagen, Hilden, Germany) and the automatic (Table 2(D)) protocol by QIAsymphoy technology (Qiagen, Hilden, Germany). Total RNA isolations were performed according to the manufacture’s protocol and RNA was eluted in Dnase/Rnase free water, as previously reported [44]. Purified total RNA was quantified by spectrophotometric analysis, measuring the absorbance at wavelengths of A230, A260 and A280 nm by the BioSpectrometer (Eppendorf, Hamburg, Germany). RNA purity was calculated by A260/280 ratio (~1.9–2.0) and A260/230 ratio (~2.0–2.2). The RNA integrity was verified by electrophoresis running samples on 1.2% denaturing agarose gels. Total RNA samples were stored at −20 °C until their use. A total of 1 µg of RNA was used to perform complementary DNA (cDNA) synthesis by using random hexamer primers (Promega, Madison, WI, USA) and moloney murine leukaemia virus reverse transcriptase (Thermo Fisher, Waltham, MA, USA), as previously reported [45].

2.4. Quantification of BCR-ABL1 and ABL1 Transcripts

The BCR-ABL1 and ABL1 transcripts were quantified using Q-PCR in the laboratory at the Centre of Experimental Oncology and Haematology, as previously reported [46], and ABL1 was used as the reference gene for the entire group of samples. The BCR-ABL1/ABL1 determinations were assessed according to the international scale (IS) as the ratio of BCR-ABL1 transcript to ABL1 transcript. The value was expressed as a percentage on the log scale and using a conversion factor calculated every year, as previously described [46]. Molecular response (MR) has been defined as previously reported [47]. In particular, MR3 was defined by BCR-ABL1/ABL1IS ≤ 0.1% (3-log reduction from the standardized baseline), MR4 was reported by BCR-ABL1/ABL1IS ≤ 0.01% (≥4-log reduction from standardized baseline), and MR4.5 was indicated by BCR-ABL1/ABL1IS ≤ 0.0032% (≥4.5-log reduction from standardized baseline) with >32,000 ABL1 transcript copies [40,48]. Quantitative PCR determinations were considered of appropriate quality only in the presence of no less than 10,000 ABL1 gene copies, as previously reported [40]. Only those subjects with BCR-ABL1/ABL1IS transcripts below 10% were included in this research study.

2.5. Software and Statistical Analyses

The Biomeck Software (version 5.1 9.0 (i5)) was used to process samples in the Biomek i-5 Automated Workstations. The CytExpert program (version 2.2.0.97—Beckman Coulter, Inc., Brea, California, USA) performed a count of the white blood cells in the CytoFLEX Flow Cytometer.
Differences between cells counts, BCR-ABL1/ABL1IS and ABL1 transcript level in matched samples were calculated using Prism software v. 8.4. Statistical significance was evaluated using the Wilcoxon signed-rank test. A p value below 0.5 was considered statistically significant.
To evaluate the bias between the mean differences of the two methods and to estimate an agreement interval within 95% interval, a Bland–Altman plots was used.

3. Results

3.1. Patient Characteristics

Patients characteristic are summarized in Table 1. The median follow-up of the accrued population was 63 months (range 3–172). Of total patients, 57% were male and 43% were female. The median leukocyte count was 7.59 × 10⁹/L (range 3.04–21.8) and the median of haemoglobin was 12.8 g/dL (range 10.8–14.7). Thirty-eight patients showed an e13a2 (b2a2) BCR-ABL1 rearrangement, 54 individuals presented an e14a2 (b3a2) BCR-ABL1 fusion transcript and 8 exhibited both e13a2 and e14a2 isoforms. According to BCR-ABL1IS transcript levels, we selected the patients with a stable molecular response which were distributed in 4 groups of 25 subjects each: Group A (10% > BCR-ABL1/ABL1IS > 0.1%), Group B (0.1% > BCR-AB1L/ABL1IS > 0.01%), Group C (0.01% > BCR-ABL1/ABL1IS > 0.0032%) and Group D (BCR-ABL1/ABL1IS < 0.0032%).

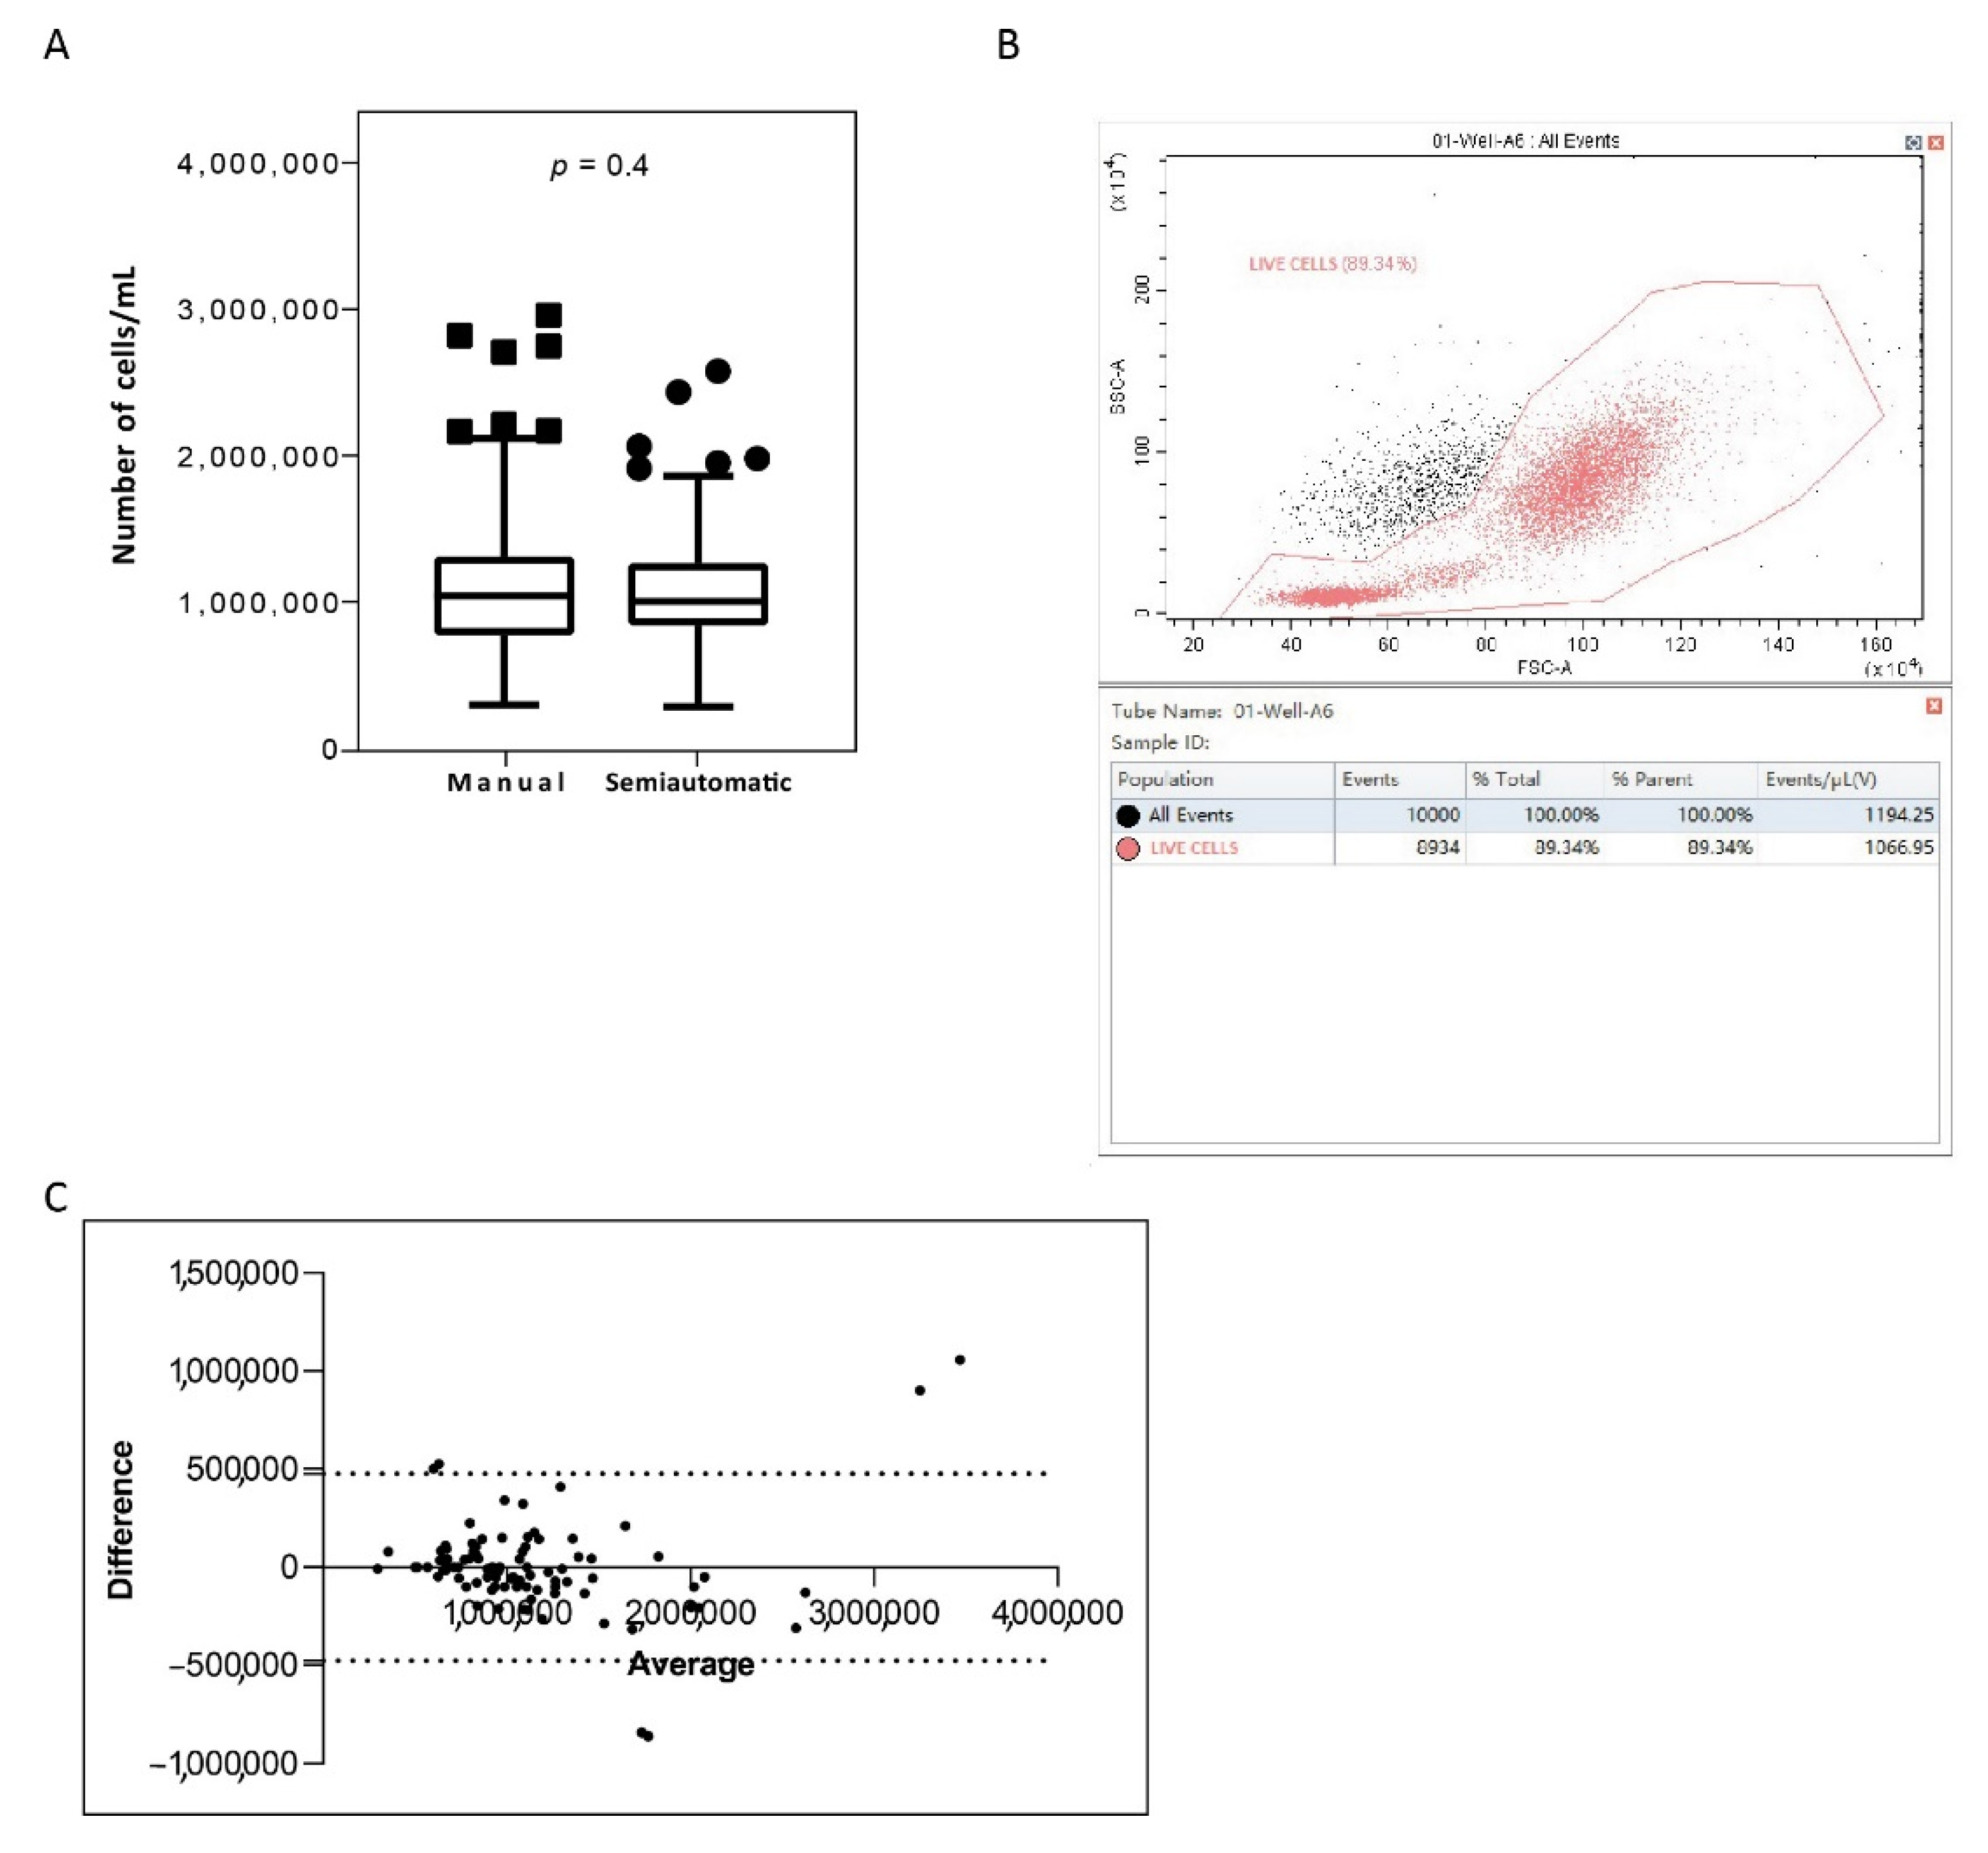
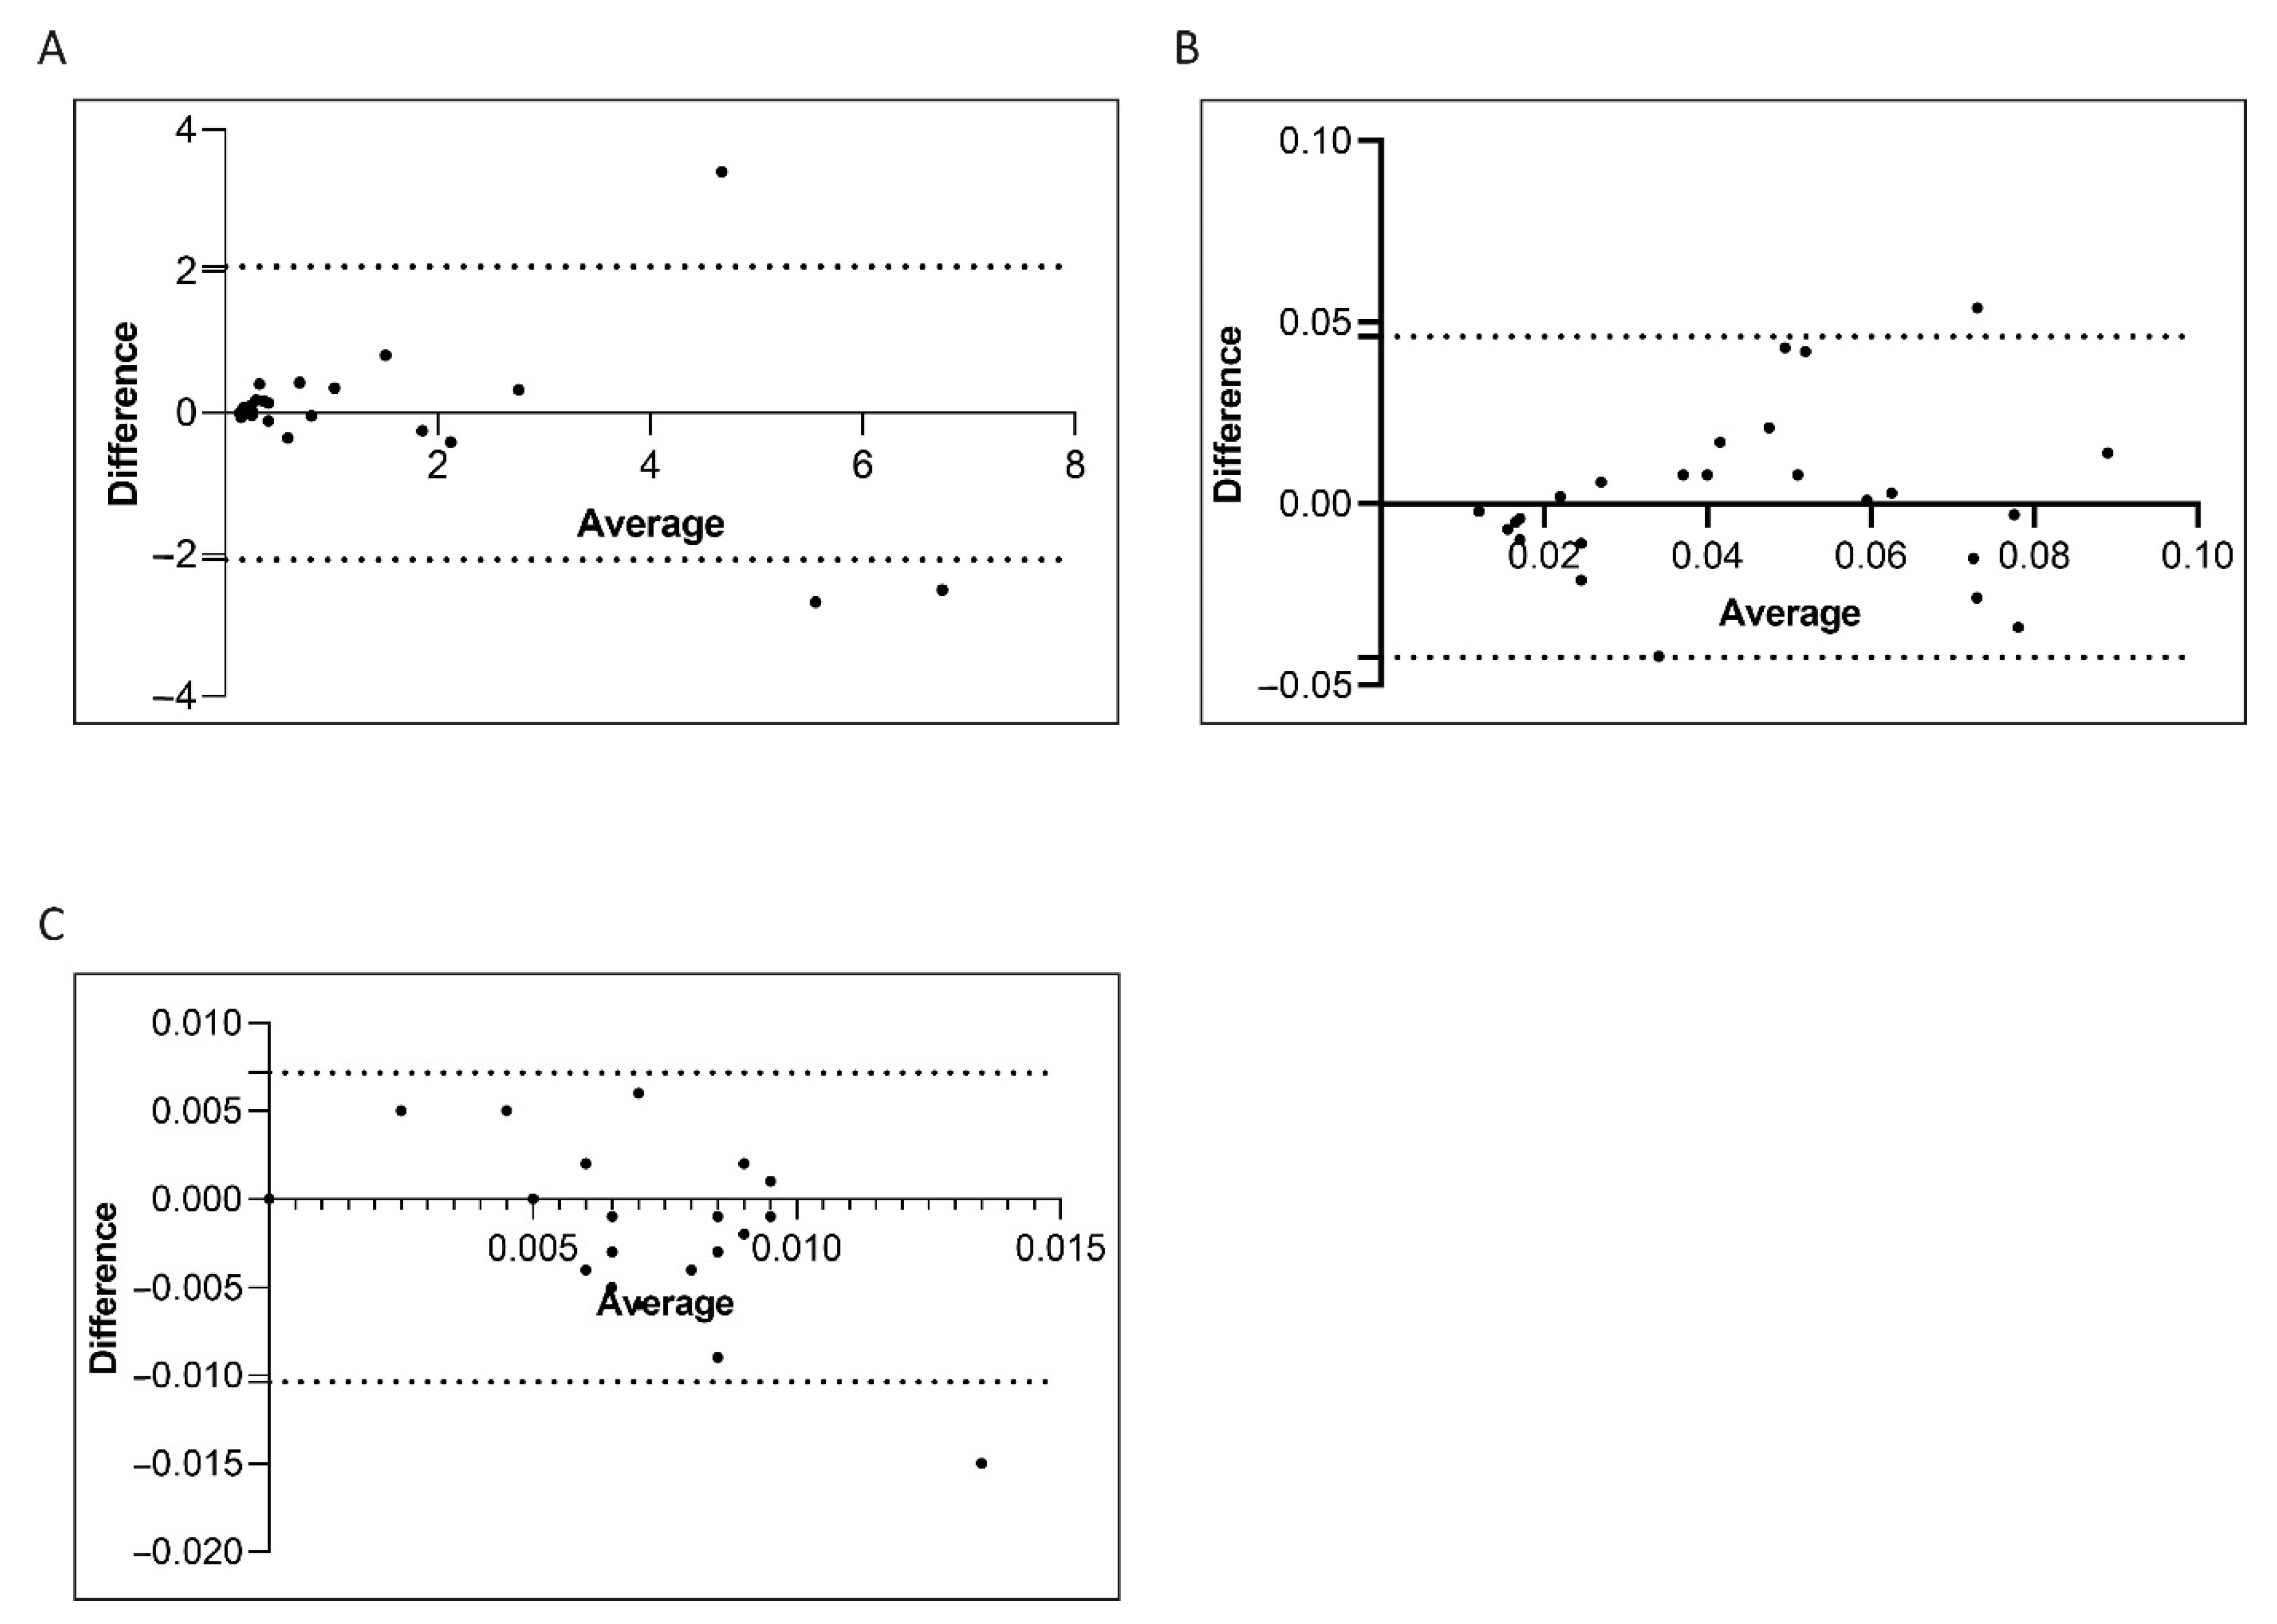
3.2. Concordance in White Blood Cell Isolation Efficiency between the Manual and the Semi-Automatic Platform

In order to compare the WBC isolation efficiency of the newly semiautomatic system, we measured the count of white cells isolated from matched PB samples via manual and semiautomatic platforms (Table 2). We observed similar isolation efficiency between the methods, with the count results reported as cells/mL. The median cell count obtained was 1.137 × 10⁶ (range 3.23 × 10⁵–3.07 × 10⁶) with the manual method and 1.076 × 10⁶ (range 3.00 × 10⁵–2.78 × 10⁶) with the semiautomatic platform (Table 3). Interestingly, the isolation efficiencies of the two methods were not statistically different (Figure 3A). Moreover, we confirmed that counting cells on the cytoflex system provided information on samples quality compared to their matched manual-count samples. In fact, more accurate counts in the cytoflex platform were obtained observing the scatter distribution of the cell population and modifying the counting-gate (Figure 3B). Overall, we found a 100% of concordance in all patients. The Bland–Altman plot showed no consistent bias between the manual and semiautomatic methods (Figure 3C)

3.3. Comparison of the Performance of Manual and Automatic Extraction Methods on RNA Quality and Quantity

Next, we evaluated whether the RNA isolation method could impact on the downstream analysis for the molecular monitoring of CML patients. Therefore, we compared the quantity and quality of the RNA obtained by the column-based RNA isolation kit to the automated silica-based QIAsymphony technology. We observed that the RNA concentration measured by BioSpectrometer was comparable for both the methods in all the 100 CML patients. In detail, the median RNA concentration was 103 ng/μL (range 75–273.5) using the manual isolation kit and 99.95 ng/μL (range 75–359.4) by the QIAsymphony instrument (Table 3). No statistically significant differences were observed between the two isolation platforms. Additionally, both the RNA extraction kits isolated samples with good quality as measured by RNA spectrophotometric quantification at wavelengths of A260/280 (median value: 1.9 manual vs. 1.9 automatic) and A260/230 (median value: 2.1 manual vs. 2.1 automatic).

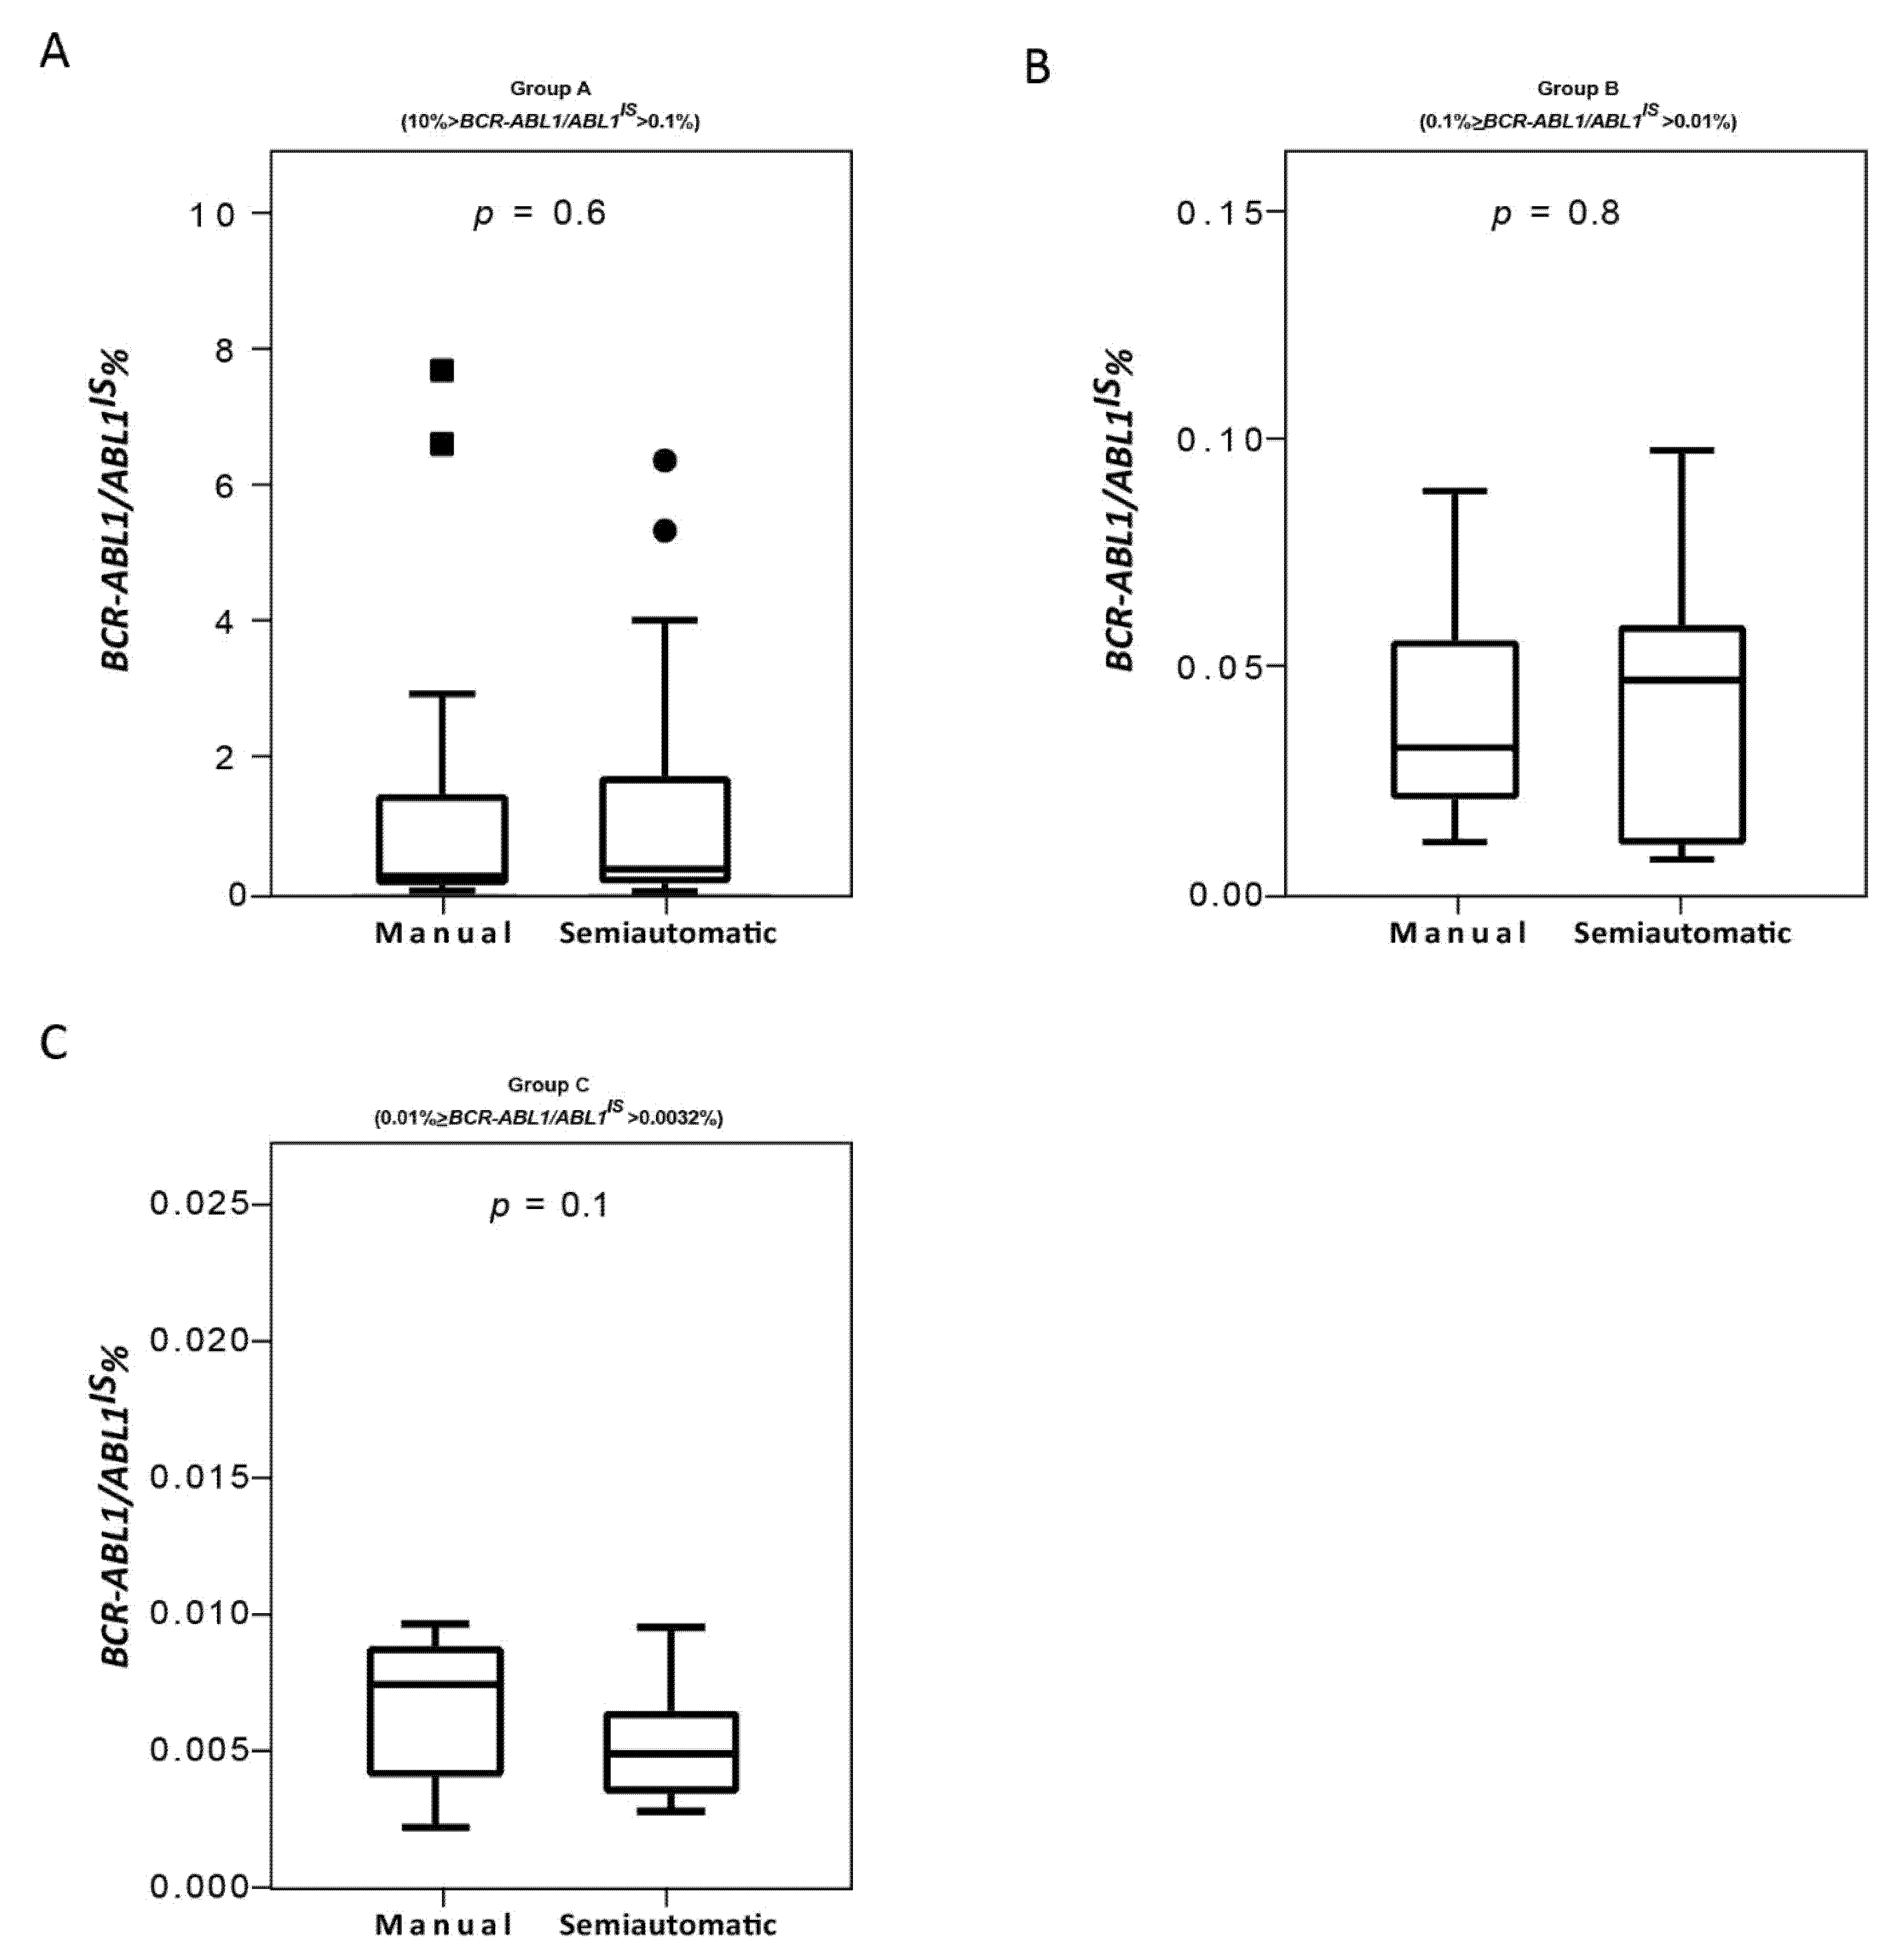
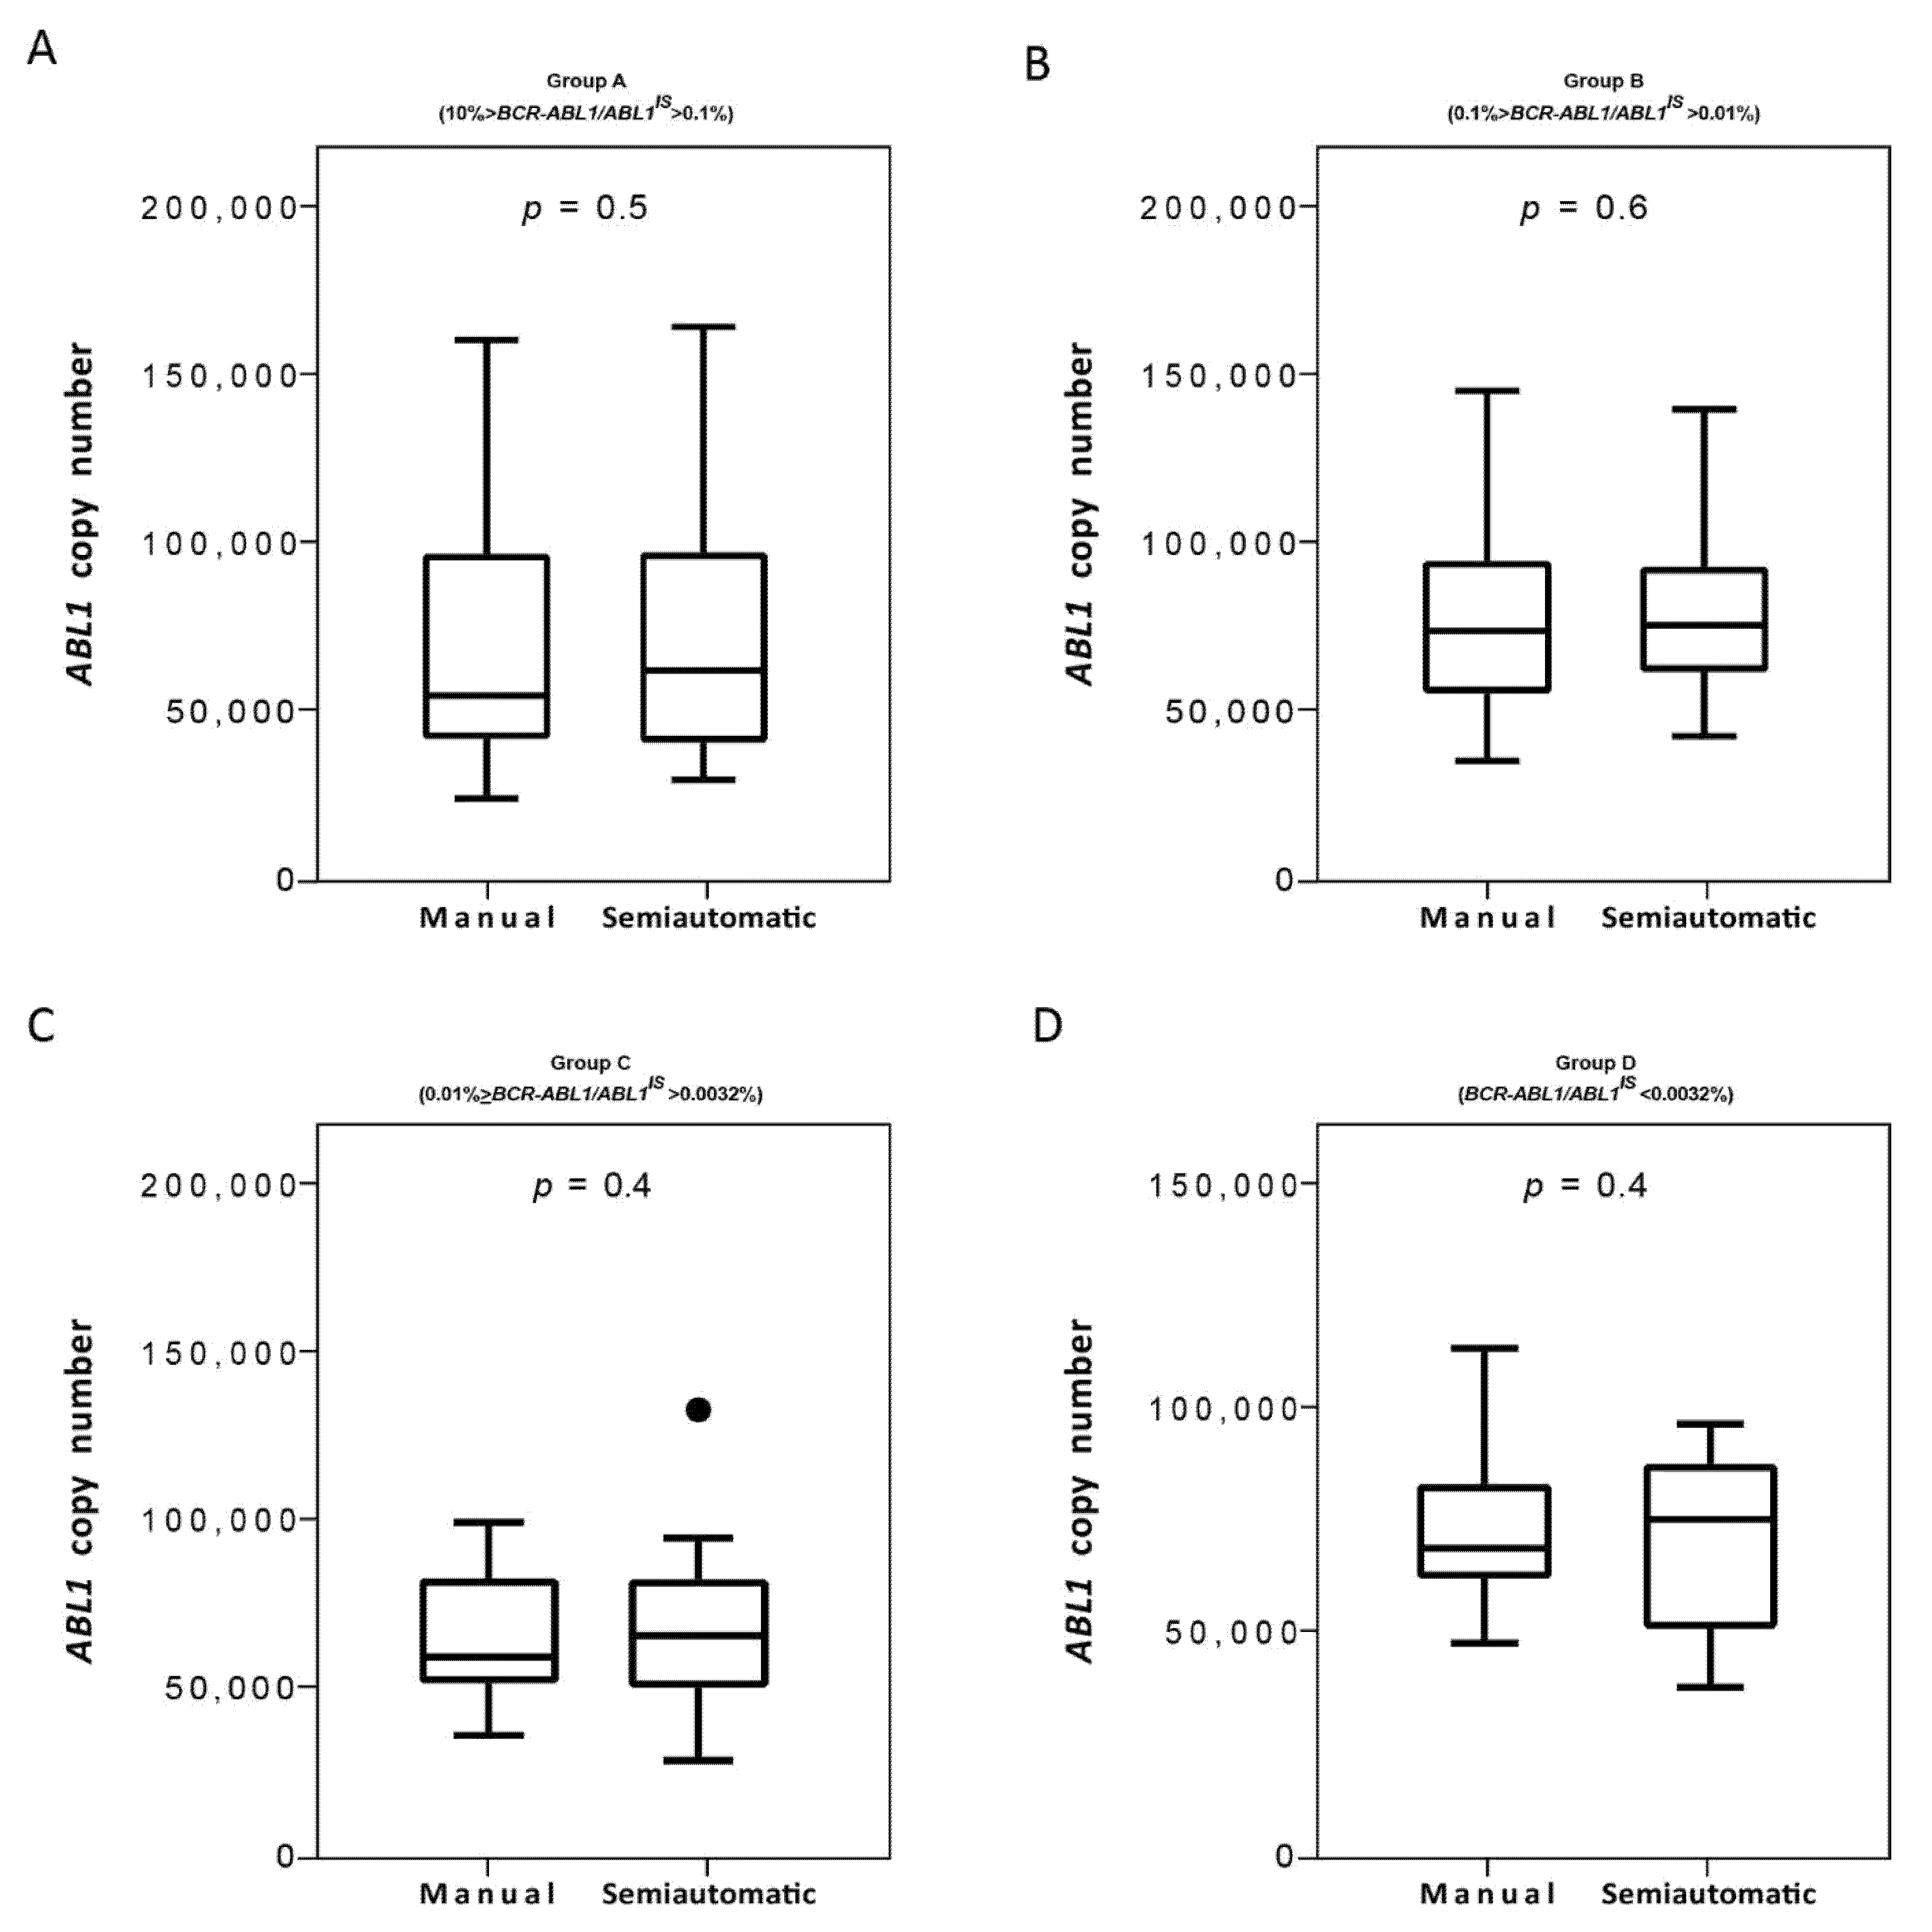
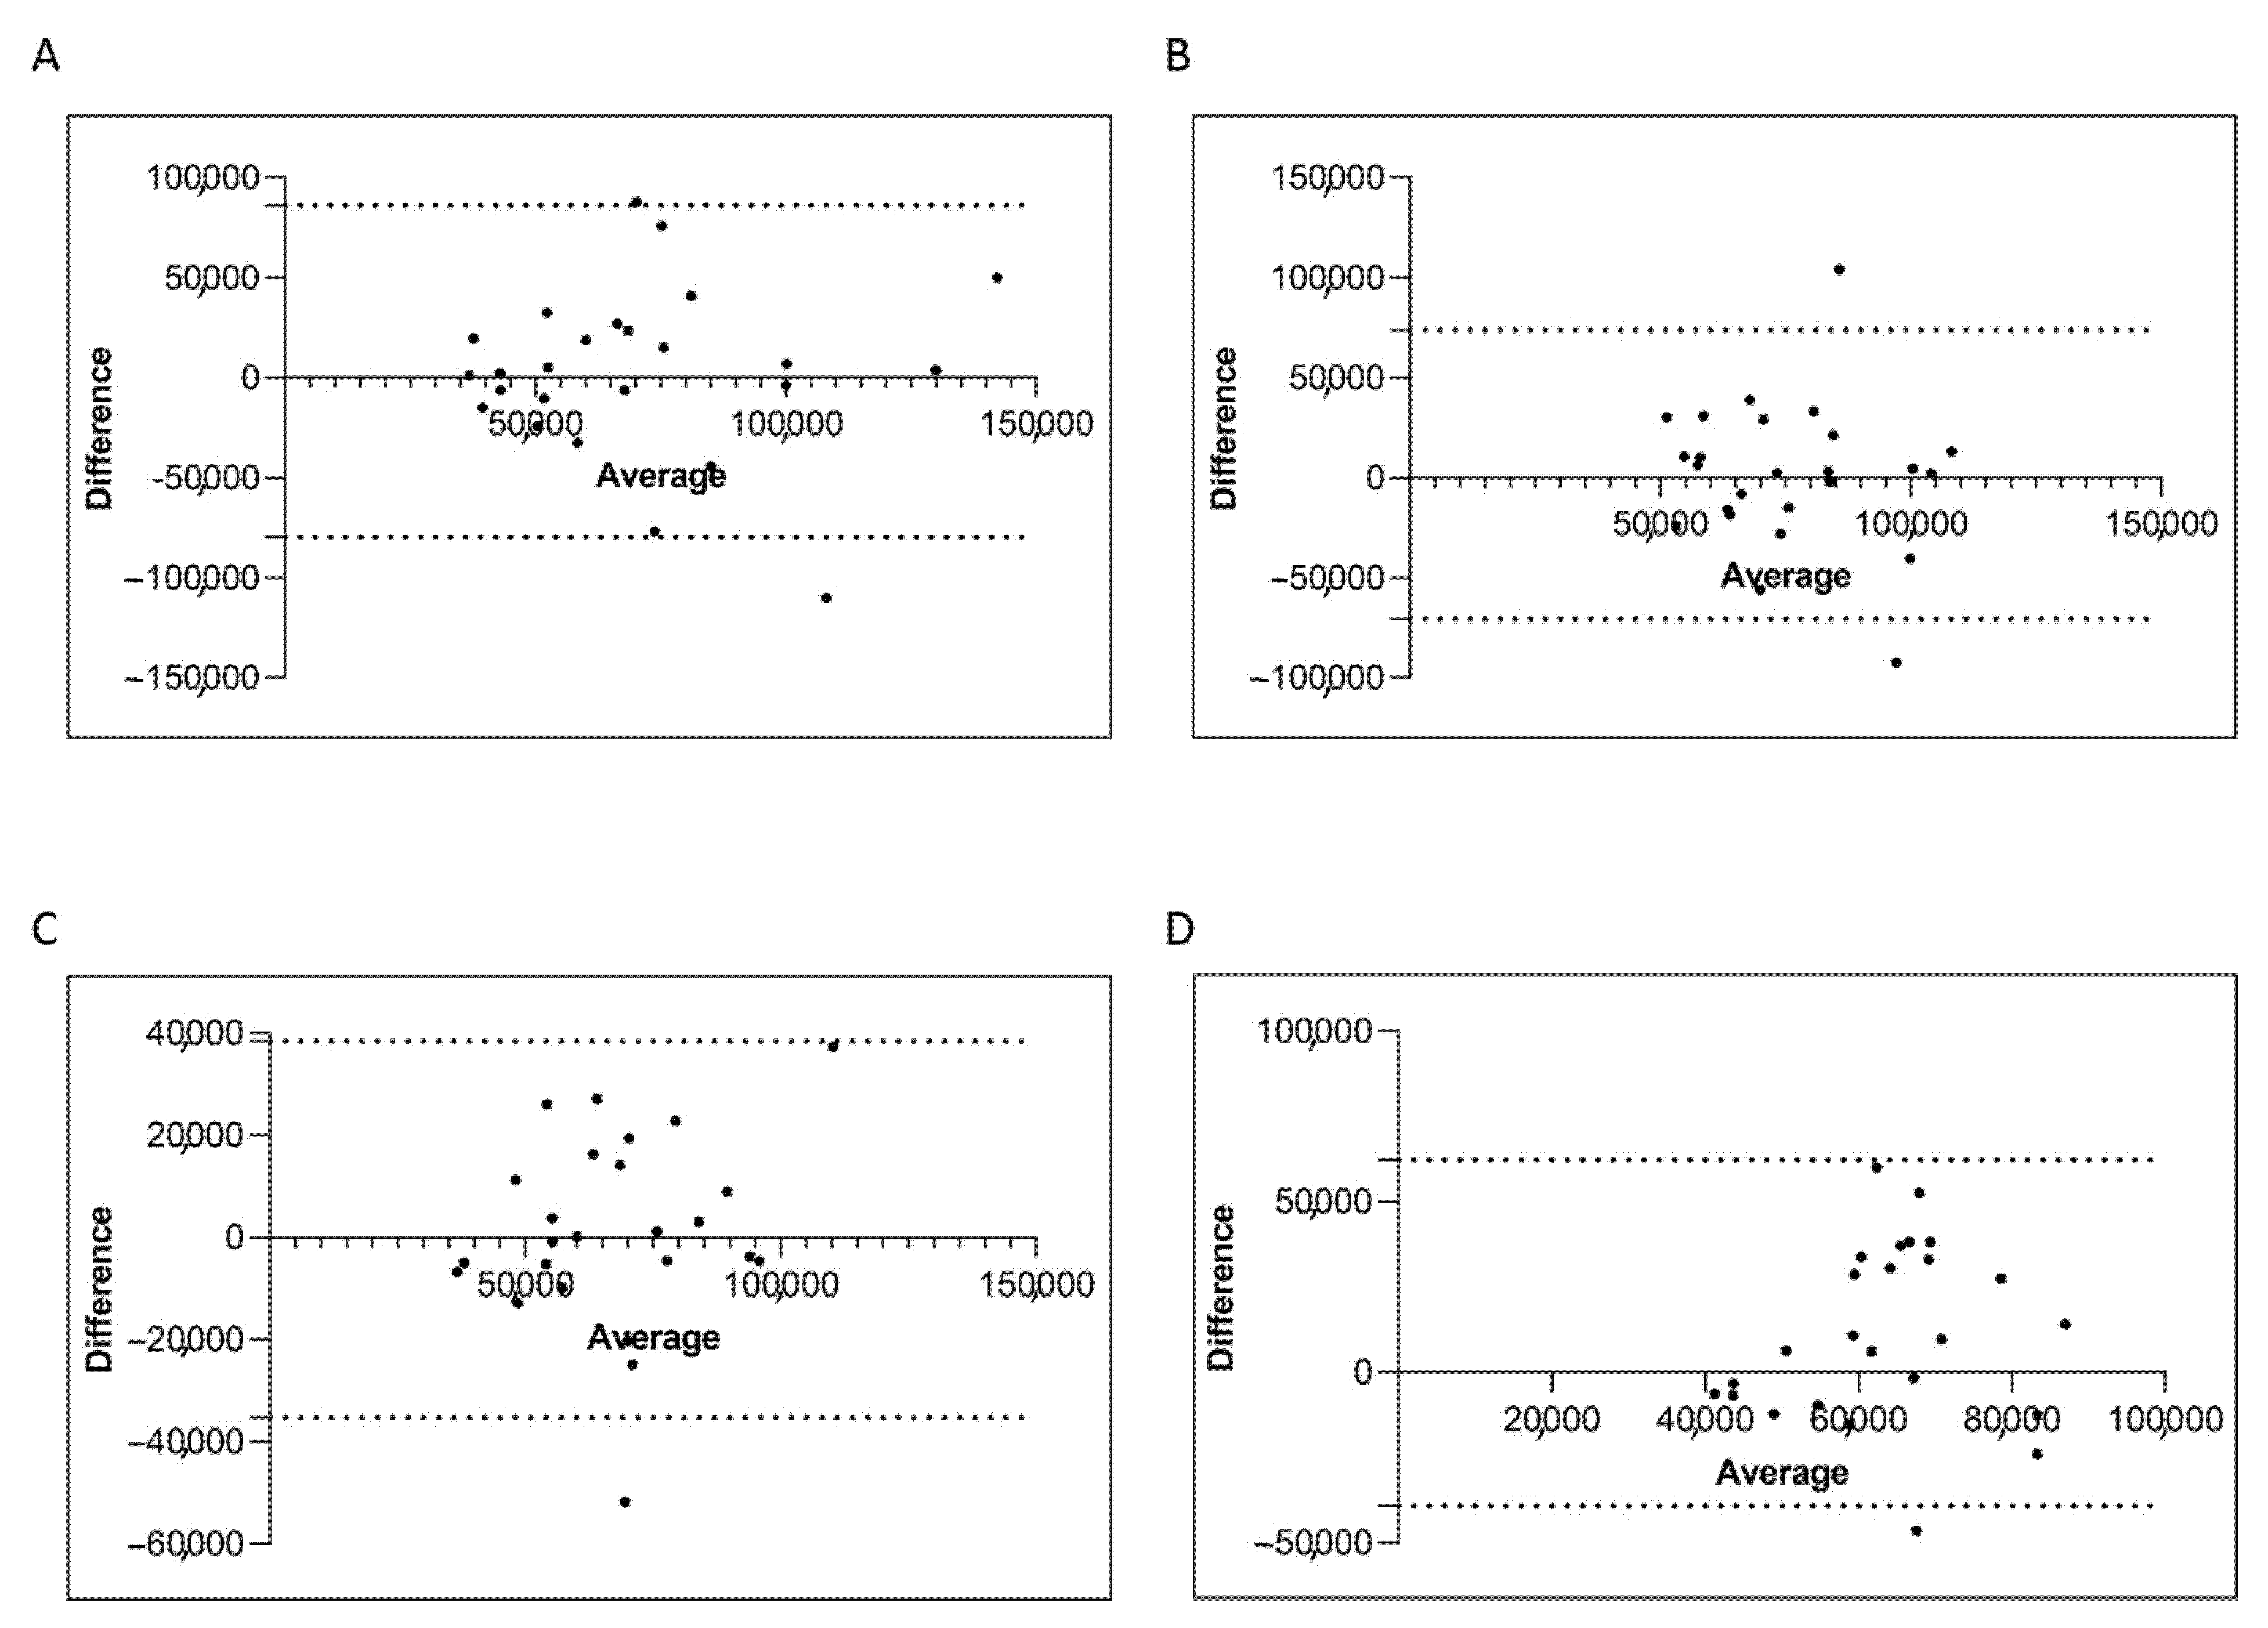
3.4. Concordance of Quantitative PCR Performance According to the Manual and the Semiautomatic Platform

Consolidated data has established that the correct interpretation of serial BCR-ABL1/ABL1IS values depends on the accuracy of the used method [9,35]. Variables of different procedure may affect the reliability of individual assays, interfere with the measurement of BCR-ABL1/ABL1IS transcript and produce different values for scoring molecular response. Therefore, we compared the Q-PCR data obtained by the manual and the semiautomated platforms to investigate whether similar BCR-ABL1/ABL1IS values can be reliably measured. To this purpose, we first stratified the CML patients according to their BCR-ABL1/ABL1IS transcript value into four groups (Group A, B, C and D) and then we compared Q-PCR measurements obtained from matched samples. Overall, measured BCR-ABL1/ABL1IS transcript levels, BCR-ABL1 transcript copy numbers (data not shown) and ABL1 control gene copies revealed a good concordance between the two platforms. By considering the BCR-ABL1/ABL1IS, we observed that matched samples obtained a similar “IS” score and the patients were assigned to the same group of molecular response. Specifically, we observed that in Group A the BCR-ABL1/ABL1IS medians were 0.32180% (range 0.1088–7.655), for the samples performed with the manual methods and 0.42102% (range 0.1022–6.3447) for the semiautomatic platform (Figure 4A; p = 0.6). In Group B, the BCR-ABL1/ABL1IS medians were 0.0338% (range 0.012–0.090) using the manual technologies and 0.04588% (range 0.011–0.099) by the semiautomatic instrument (Figure 4B; p = 0.8). Patients recruited in Group C showed a median BCR-ABL1/ABL1IS of 0.008% (range 0.0037–0.009) when processed with the manual platform and median of 0.005% (range 0.0038–0.009) with the Biomeck i-5 system (Figure 4C; p = 0.1). Both methods gave a BCR-ABL1/ABL1IS undetectable for individuals in Group D (data non shown). The Bland–Altman plot showed no consistent bias between the manual and semiautomatic methods (Figure 5A–C).
Next, we evaluated the ABL1 reference gene copies and we found that both isolation methods performed optimally with the ABL1 gene copies measured >10,000 in all the four groups (Figure 6A–D). Moreover, we do not observe statistically significant differences in the ABL1 gene copies of patients stratified for both the two platforms. Overall, we found a 100% of concordance. The Bland–Altman plot showed no consistent bias between the manual and semiautomatic methods (Figure 7A–D).

4. Discussion and Conclusions

The molecular detection of BCR-ABL1 fusion transcript plays an essential role in the diagnosis, management and risk classification of CML patients, pervasively influencing of clinical decisions. Therefore, molecular monitoring has become of pivotal importance to document treatment responses and predict relapse [30,34,37]. To date, Q-PCR represents the “gold standard” to measure BCR-ABL1 oncogene transcript levels and to monitor the kinetics of disease burden reduction. Upon TKI therapy initiation, Q-PCR should be repeated every 3 months until MR3 is achieved, and then continued every 3–6 months [49,50,51]. Moreover, a group of CML patients with persistent deep molecular response after TKIs discontinuation (a condition defined as TFR) should be monitored more strictly to ensure a timely recognition of relapse [31,41,52].
Translating this dense Q-PCR follow-up in the practice determines a considerable burden of work for molecular laboratories. Currently, manual separation method of total white cells from blood of CML patients is widely used. This method is often laborious and time-consuming and is hence unsuitable for high-throughput isolations. Here, we present a comparison between our standard workflow for isolation and characterization of total white blood cells from blood samples of CML patients and a new semiautomatic system, based on the Biomek i-5 Automated Workstation integrated with the CytoFLEX Flow Cytometer for cell isolation, followed by the automatic RNA QIAsymphony extractor. Although the total time to perform WBCs isolation by the semiautomatic platform is higher compared to the manual method (240 min vs. 210 min, respectively), the total time for RNA isolation is roughly similar (60 min vs. 90 min, respectively). Moreover, the semiautomatic method determined a hands-on time reduction from 210 to 30 min. for WBCs isolation, and from 90 to 15 min for RNA extraction while processing a larger number of samples (Table 2). Of interest, the numbers of samples that can be processed per run may differ according to the type of EDTA tubes used. When comparing the cost required for the different platforms, the semiautomatic method is expensive because it require extra consumables to perform WBCs and RNA isolation than manual method. However, the semiautomatic method is cost-effective, which is relevant, particularly when introducing the methodology to routine diagnostic of patients with suspected infection disease.
The Biomeck i-5 instrument is equipped with a closed cabin, which ensure that laboratory procedures remain safe for the technical staff, especially in case of specimens from patient with suspected or confirmed SARS-CoV-2 infection. Additionally, avoiding manual procedures such as samples handling on an open bench, blood transfer, solutions dispensation and white cell count, further reduce the risks deriving from the analysis of suspected viral specimens. This finding is valid not only SARS-CoV-2, but also for other virus, such as hepatitis C virus or human immunodeficiency virus which can spread by contact with infected blood.
Furthermore, the integration of the automatic Cytometer also allowed for the reduction of manual laboratory work and the facilitation of the high-throughput counting of numerous samples, even in the case of infected specimens, without interfering with the downstream analyses. Indeed, data obtained with the semiautomatic isolation methods did not differed from those retrieved with the standard manual method, both in term of quality and quantity of white blood cells. Moreover, the chance to manipulate the live cell gate on the Cytoflex software enabled a more reliable count.
Different studies have recommended the selection of an RNA extraction method able to accurately and reproducibly isolate high quality of nucleic acid minimizing the risk of degradation [9,35,36]. In our study, we also compared the RNA isolated by the column-based manual extraction kit to the magnetic-beads-based automatic QIAsymphony platform. The competing automated system enabled to increase the number of samples that can be simultaneously processed (up to 96), reduce hand-on times (from 90 to 15 min.) and preserve the quality of RNA for downstream analyses (Table 2). Of note, RNA quality and quantity were similar on the two platforms for all analysed patients.
The monitoring milestones of BCR-ABL1 transcripts levels by Q-PCR during TKIs treatment determine whether therapy should be continued or changed [30,53]. Hence, laboratory workflow should be standardized in order to increase the sensitivity and reproducibility of BCR-ABL1/ABL1 detection. In this contest, it is recommended that a sample have at least 10,000 ABL1 gene copies to pass minimum quality standards. Moreover, the transcript level of the control gene is critical important to determine the kinetics of disease burden reduction and define the sensitivity of the assay independently of the oncogene BCR-ABL1 detection. Therefore, we compared the Q-PCR data obtained from matched samples isolated with both the manual a semiautomatic platform and observed similar qualitative and quantitative results, including BCR-ABL1/ABL1 and ABL1 recovery efficiency. Likewise, matched samples obtained comparable “IS” score and were classified into the same group of molecular response.
Nowadays, several studies have showed that the automatic procedure is often superior to the manual method, particularly for liquid biopsy [54,55].
In conclusion, semiautomatic method satisfied all our predefined aims and displayed a similar performance compared to our standard manual method. In this regard, the semiautomatic method tested is able to reduce hands-on time, increase the number of samples processed per run, isolate high quality and quantity of RNA and obtain optimal reliability and sensitivity levels by Q-PCR. Therefore, this system can replace the more laborious manual workflow, particularly when specimens from patient with suspected or confirmed viral infection have to be processed, not only SARS-CoV-2, but also for other virus, such as hepatitis C virus or human immunodeficiency virus which can spread by contact with infected blood.

Author Contributions

S.S. and S.R.V. designed the research, interpreted the results, analysed the data and wrote original manuscript; S.S. supervised the study; M.M. analysed the data and critically reviewed the paper; A.P., C.T. and S.R.V. performed the experiment; M.S.P., E.T., C.R. and F.M. critically reviewed the paper; F.S. recruited and followed the patients and critically reviewed the paper; F.D.R. and L.M. supervised the study and critically reviewed the paper. All authors have read the manuscript and agreed this published version.

Funding

This research received no external funding.

Institutional Review Board Statement

The research study was conducted according to the guidelines of the Declaration of Helsinki and blood samples were collected for research aim.

Informed Consent Statement

Informed consent was obtained from all subjects involved in the study.

Conflicts of Interest

The authors declare no conflict of interest.

References

  1. Apperley, J.F. Chronic myeloid leukaemia. Lancet 2015, 385, 1447–1459. [Google Scholar] [CrossRef]
  2. Quintás-Cardama, A.; Cortes, J. Molecular biology of bcr-abl1–positive chronic myeloid leukemia. Blood 2009, 113, 1619–1630. [Google Scholar] [CrossRef] [Green Version]
  3. Massimino, M.; Consoli, M.L.; Mesuraca, M.; Stagno, F.; Tirrò, E.; Stella, S.; Pennisi, M.S.; Romano, C.; Buffa, P.; Bond, H.M.; et al. IRF5 is a target of BCR-ABL kinase activity and reduces CML cell proliferation. Carcinogenesis 2014, 35, 1132–1143. [Google Scholar] [CrossRef] [PubMed] [Green Version]
  4. Soverini, S.; Bavaro, L.; De Benedittis, C.; Martelli, M.; Iurlo, A.; Orofino, N.; Sica, S.; Sorà, F.; Lunghi, F.; Ciceri, F.; et al. Prospective assessment of NGS-detectable mutations in CML patients with nonoptimal response: The NEXT-in-CML study. Blood 2020, 135, 534–541. [Google Scholar] [CrossRef] [PubMed]
  5. Ren, R. Mechanisms of BCR–ABL in the pathogenesis of chronic myelogenous leukaemia. Nat. Rev. Cancer 2005, 5, 172–183. [Google Scholar] [CrossRef]
  6. Preyer, M.; Vigneri, P.; Wang, J.Y.J. Interplay between Kinase Domain Autophosphorylation and F-Actin Binding Domain in Regulating Imatinib Sensitivity and Nuclear Import of BCR-ABL. PLoS ONE 2011, 6, e17020. [Google Scholar] [CrossRef] [PubMed]
  7. Tirrò, E.; Massimino, M.; Romano, C.; Pennisi, M.S.; Stella, S.; Vitale, S.R.; Fidilio, A.; Manzella, L.; Parrinello, N.L.; Stagno, F.; et al. Chk1 Inhibition Restores Inotuzumab Ozogamicin Citotoxicity in CD22-Positive Cells Expressing Mutant p53. Front. Oncol. 2019, 9, 57. [Google Scholar] [CrossRef]
  8. Manzella, L.; Tirrò, E.; Pennisi, M.S.; Massimino, M.; Stella, S.; Romano, C.; Vitale, S.R.; Vigneri, P. Roles of Interferon Regulatory Factors in Chronic Myeloid Leukemia. Curr. Cancer Drug Targets 2016, 16, 594–605. [Google Scholar] [CrossRef]
  9. Foroni, L.; Wilson, G.; Gerrard, G.; Mason, J.; Grimwade, D.; White, H.E.; De Castro, D.G.; Austin, S.; Awan, A.; Burt, E.; et al. Guidelines for the measurement of BCR-ABL1 transcripts in chronic myeloid leukaemia. Br. J. Haematol. 2011, 153, 179–190. [Google Scholar] [CrossRef]
  10. Fujimaki, K.; Hattori, Y.; Nakajima, H. 10-year complete remission in a Philadelphia chromosome-positive acute lym-phoblastic leukemia patient using imatinib without high-intensity chemotherapy or allogeneic stem cell transplantation. Int. J. Hematol. 2018, 107, 709–711. [Google Scholar] [CrossRef]
  11. Pirosa, M.C.; Leotta, S.; Cupri, A.; Stella, S.; Martino, E.A.; Scalise, L.; Sapienza, G.; Calafiore, V.; Mauro, E.; Spadaro, A.; et al. Long-Term Molecular Remission Achieved by Antibody Anti-CD22 and Ponatinib in a Patient Affected by Ph’+ Acute Lymphoblastic Leukemia Relapsed after Second Allogeneic Hematopoietic Stem Cell Transplantation: A Case Report. Chemotherapy 2018, 63, 220–224. [Google Scholar] [CrossRef]
  12. Chiaretti, S.; Foà, R. Management of adult Ph-positive acute lymphoblastic leukemia. Hematol. Am. Soc. Hematol. Educ. Program 2015, 2015, 406–413. [Google Scholar] [CrossRef] [PubMed] [Green Version]
  13. Luatti, S.; Baldazzi, C.; Marzocchi, G.; Ameli, G.; Bochicchio, M.T.; Soverini, S.; Castagnetti, F.; Tiribelli, M.; Gugliotta, G.; Martinelli, G.; et al. Cryptic BCR-ABL fusion gene as variant rearrangement in chronic myeloid leukemia: Molecular cytogenetic characterization and influence on TKIs therapy. Oncotarget 2017, 8, 29906–29913. [Google Scholar] [CrossRef]
  14. Druker, B.J.; Guilhot, F.; O’Brien, S.G.; Gathmann, I.; Kantarjian, H.; Gattermann, N.; Deininger, M.W.; Silver, R.T.; Goldman, J.M.; Stone, R.M.; et al. Five-year fol-low-up of patients receiving imatinib for chronic myeloid leukemia. N. Engl. J. Med. 2006, 355, 2408–2417. [Google Scholar] [CrossRef] [PubMed]
  15. Hochhaus, A.; Larson, R.A.; Guilhot, F.; Radich, J.P.; Branford, S.; Hughes, T.; Baccarani, M.; Deininger, M.W.; Cervantes, F.; Fujihara, S.; et al. Long-Term Outcomes of Imatinib Treatment for Chronic Myeloid Leukemia. N. Engl. J. Med. 2017, 376, 917–927. [Google Scholar] [CrossRef]
  16. Castagnetti, F.; Di Raimondo, F.; De Vivo, A.; Spitaleri, A.; Gugliotta, G.; Fabbiano, F.; Capodanno, I.; Mannina, D.; Salvucci, M.; Antolino, A.; et al. A population-based study of chronic myeloid leukemia patients treated with imatinib in first line. Am. J. Hematol. 2017, 92, 82–87. [Google Scholar] [CrossRef] [PubMed]
  17. Hughes, T.P.; Hochhaus, A.; Branford, S.; Müller, M.C.; Kaeda, J.S.; Foroni, L.; Druker, B.; Guilhot, F.; Larson, R.; O’Brien, S.G.; et al. Long-term prognostic significance of early molecular response to imatinib in newly diagnosed chronic myeloid leukemia: An analysis from the International Randomized Study of Interferon and STI571 (IRIS). Blood 2010, 116, 3758–3765. [Google Scholar] [CrossRef] [Green Version]
  18. Baccarani, M.; Deininger, M.W.; Rosti, G.; Hochhaus, A.; Soverini, S.; Apperley, J.F.; Cervantes, F.; Clark, R.E.; Cortes, J.E.; Guilhot, F.; et al. European LeukemiaNet recom-mendations for the management of chronic myeloid leukemia: 2013. Blood 2013, 122, 872–884. [Google Scholar] [CrossRef]
  19. Hochhaus, A.; Baccarani, M.; Silver, R.T.; Schiffer, C.; Apperley, J.F.; Cervantes, F.; Clark, R.E.; Cortes, J.E.; Deininger, M.W.; Guilhot, F.; et al. European LeukemiaNet 2020 recommendations for treating chronic myeloid leukemia. Leukemia 2020, 34, 966–984. [Google Scholar] [CrossRef] [Green Version]
  20. Rosti, G.; Castagnetti, F.; Gugliotta, G.; Baccarani, M. Tyrosine kinase inhibitors in chronic myeloid leukaemia: Which, when, for whom? Nat. Rev. Clin. Oncol. 2017, 14, 141–154. [Google Scholar] [CrossRef]
  21. Stagno, F.; Vigneri, P.; Consoli, M.L.; Cupri, A.; Stella, S.; Tambè, L.; Massimino, M.; Manzella, L.; Di Raimondo, F. Hyperdiploidy Associated with a High BCR-ABL Transcript Level May Identify Patients at Risk of Progression in Chronic Myeloid Leukemia. Acta Haematol. 2012, 127, 7–9. [Google Scholar] [CrossRef] [PubMed]
  22. Ishii, Y.; Nhiayi, M.K.; Tse, E.; Cheng, J.; Massimino, M.; Durden, D.L.; Vigneri, P.; Wang, J.Y. Knockout Serum Re-placement Promotes Cell Survival by Preventing BIM from Inducing Mitochondrial Cytochrome C Release. PLoS ONE 2015, 10, e0140585. [Google Scholar] [CrossRef] [PubMed] [Green Version]
  23. Massimino, M.; Stella, S.; Tirrò, E.; Pennisi, M.S.; Vitale, S.R.; Puma, A.; Romano, C.; Di Gregorio, S.; Tomarchio, C.; Di Raimondo, F.; et al. ABL1-Directed Inhibitors for CML: Efficacy, Resistance and Future Perspectives. Anticancer Res. 2020, 40, 2457–2465. [Google Scholar] [CrossRef] [PubMed]
  24. Massimino, M.; Stella, S.; Tirrò, E.; Romano, C.; Pennisi, M.S.; Puma, A.; Manzella, L.; Zanghì, A.; Stagno, F.; Di Raimondo, F.; et al. Non ABL-directed inhibitors as alternative treatment strategies for chronic myeloid leukemia. Mol. Cancer 2018, 17, 56. [Google Scholar] [CrossRef] [Green Version]
  25. Zhou, H.-M.; Zhang, J.-G.; Zhang, X.; Li, Q. Targeting cancer stem cells for reversing therapy resistance: Mechanism, signaling, and prospective agents. Signal Transduct. Target. Ther. 2021, 6, 62. [Google Scholar] [CrossRef]
  26. Bavaro, L.; Martelli, M.; Cavo, M.; Soverini, S. Mechanisms of Disease Progression and Resistance to Tyrosine Kinase Inhibitor Therapy in Chronic Myeloid Leukemia: An Update. Int. J. Mol. Sci. 2019, 20, 6141. [Google Scholar] [CrossRef] [PubMed] [Green Version]
  27. Massimino, M.; Tirrò, E.; Stella, S.; Frasca, F.; Vella, V.; Sciacca, L.; Pennisi, M.S.; Vitale, S.R.; Puma, A.; Romano, C.; et al. Effect of Combined Epigenetic Treatments and Ectopic NIS Expression on Undifferentiated Thyroid Cancer Cells. Anticancer Res. 2018, 38, 6653–6662. [Google Scholar] [CrossRef] [PubMed]
  28. Massimino, M.; Stella, S.; Tirrò, E.; Consoli, M.L.; Pennisi, M.S.; Puma, A.; Vitale, S.R.; Romano, C.; Zammit, V.; Stagno, F.; et al. Efficacy of Dasatinib in a Very Elderly CML Patient Expressing a Rare E13a3 Bcr-Abl1 Fusion Transcript: A Case Report. Anticancer Res. 2019, 39, 3949–3954. [Google Scholar] [CrossRef]
  29. Soverini, S.; Abruzzese, E.; Bocchia, M.; Bonifacio, M.; Galimberti, S.; Gozzini, A.; Iurlo, A.; Luciano, L.; Pregno, P.; Rosti, G.; et al. Next-generation sequencing for BCR-ABL1 kinase domain mutation testing in patients with chronic myeloid leukemia: A position paper. J. Hematol. Oncol. 2019, 12, 131. [Google Scholar] [CrossRef] [Green Version]
  30. Deininger, M.W. Molecular monitoring in CML and the prospects for treatment-free remissions. Hematol. Am. Soc. Hematol. Educ. Program 2015, 2015, 257–263. [Google Scholar] [CrossRef] [Green Version]
  31. Saußele, S.; Richter, J.; Hochhaus, A.; Mahon, F.-X. The concept of treatment-free remission in chronic myeloid leukemia. Leukemia 2016, 30, 1638–1647. [Google Scholar] [CrossRef]
  32. Mahon, F.X. Discontinuation of TKI therapy and ‘functional’ cure for CML. Best Pract. Res. Clin. Haematol. 2016, 29, 308–313. [Google Scholar] [CrossRef]
  33. Hughes, T.; Lipton, J.H.; Spector, N.; Cervantes, F.; Pasquini, R.; Clementino, N.C.D.; Llacer, P.E.D.; Schwarer, A.P.; Mahon, F.-X.; Rea, D.; et al. Deep molecular responses achieved in patients with CML-CP who are switched to nilotinib after long-term imatinib. Blood 2014, 124, 729–736. [Google Scholar] [CrossRef] [PubMed]
  34. Izzo, B.; Gottardi, E.M.; Errichiello, S.; Daraio, F.; Baratè, C.; Galimberti, S. Monitoring Chronic Myeloid Leukemia: How Molecular Tools May Drive Therapeutic Approaches. Front. Oncol. 2019, 9, 833. [Google Scholar] [CrossRef] [PubMed] [Green Version]
  35. Hughes, T.; Deininger, M.; Hochhaus, A.; Branford, S.; Radich, J.; Kaeda, J.; Baccarani, M.; Cortes, J.; Cross, N.C.P.; Druker, B.J.; et al. Monitoring CML patients responding to treatment with tyrosine kinase inhibitors: Review and recommendations for harmonizing current methodology for detecting BCR-ABL transcripts and kinase domain mutations and for expressing results. Blood 2006, 108, 28–37. [Google Scholar] [CrossRef] [PubMed] [Green Version]
  36. Müller, M.C.; LeukemiaNet, O.B.O.T.E.; Erben, P.; Saglio, G.; Gottardi, E.; Nyvold, C.G.; Schenk, T.; Ernst, T.; Lauber, S.; Kruth, J.; et al. Harmonization of BCR-ABL mRNA quantification using a uniform multifunctional control plasmid in 37 international laboratories. Leukemia 2008, 22, 96–102. [Google Scholar] [CrossRef] [Green Version]
  37. Hughes, T.P.; Saglio, G.; Kantarjian, H.M.; Guilhot, F.; Niederwieser, D.; Rosti, G.; Nakaseko, C.; De Souza, C.A.; Kalaycio, M.E.; Meier, S.; et al. Early molecular response predicts out-comes in patients with chronic myeloid leukemia in chronic phase treated with frontline nilotinib or imatinib. Blood 2014, 123, 1353–1360. [Google Scholar] [CrossRef]
  38. Cross, N.C.; Hochhaus, A.; Muller, M.C. Molecular monitoring of chronic myeloid leukemia: Principles and interla-boratory standardization. Ann. Hematol. 2015, 94 (Suppl. S2), S219–S225. [Google Scholar] [CrossRef]
  39. Stella, S.; Gottardi, E.M.; Favout, V.; Barragan Gonzalez, E.; Errichiello, S.; Vitale, S.R.; Fava, C.; Luciano, L.; Stagno, F.; Grimaldi, F.; et al. The Q-LAMP Method Represents a Valid and Rapid Alternative for the Detection of the BCR-ABL1 Rearrangement in Philadelphia-Positive Leukemias. Int. J. Mol. Sci. 2019, 20, 6106. [Google Scholar] [CrossRef] [Green Version]
  40. Cross, N.C.P.; White, H.E.; Colomer, D.; Ehrencrona, H.; Foroni, L.; Gottardi, E.; Lange, T.; Lion, T.; Poláková, K.M.; Dulucq, S.; et al. Laboratory recommendations for scoring deep molecular responses following treatment for chronic myeloid leukemia. Leukemia 2015, 29, 999–1003. [Google Scholar] [CrossRef] [Green Version]
  41. Yilmaz, U.; Eskazan, A.E. Moving on from 2013 to 2020 European LeukemiaNet recommendations for treating chronic myeloid leukemia: What has changed over the 7 years? Expert Rev. Hematol. 2020, 13, 1035–1038. [Google Scholar] [CrossRef]
  42. Molica, M.; Naqvi, K.; Cortes, J.E.; Paul, S.; Kadia, T.M.; Breccia, M.; Kantarjian, H.; Jabbour, E.J. Treatment-free re-mission in chronic myeloid leukemia. Clin. Adv. Hematol. Oncol. 2019, 17, 686–696. [Google Scholar]
  43. Baccarani, M.; Abruzzese, E.; Accurso, V.; Albano, F.; Annunziata, M.; Barulli, S.; Beltrami, G.; Bergamaschi, M.; Binotto, G.; Bocchia, M.; et al. Managing chronic myeloid leukemia for treatment-free remission: A proposal from the GIMEMA CML WP. Blood Adv. 2019, 3, 4280–4290. [Google Scholar] [CrossRef] [Green Version]
  44. Stella, S.; Massimino, M.; Tirrò, E.; Vitale, S.R.; Scalise, L.; Leotta, S.; Pennisi, M.S.; Puma, A.; Romano, C.; Stagno, F.; et al. B-ALL Relapses after Autologous Stem Cell Transplantation Associated with a Shift from e1a2 to e14a2 BCR-ABL Transcripts: A Case Report. Anticancer Res. 2019, 39, 431–435. [Google Scholar] [CrossRef]
  45. Tirrò, E.; Massimino, M.; Stella, S.; Zammit, V.; Consoli, M.L.; Pennisi, M.S.; Vitale, S.R.; Romano, C.; Pirosa, M.C.; Martino, E.; et al. Efficacy of Nilotinib in a CML Patient Expressing the Three-way Complex Variant Translocation t(2;9;22). Anticancer Res. 2019, 39, 3893–3899. [Google Scholar] [CrossRef]
  46. Vigneri, P.; Stagno, F.; Stella, S.; Cupri, A.; Forte, S.; Massimino, M.; Antolino, A.; Siragusa, S.; Mannina, D.; Impera, S.S.; et al. High BCR-ABL/GUS(IS) Levels at Diagnosis of Chronic Phase CML Are Associated with Unfavorable Responses to Standard-Dose Imatinib. Clin. Cancer Res. 2017, 23, 7189–7198. [Google Scholar] [CrossRef] [PubMed] [Green Version]
  47. Mrklić, I.; Pogorelić, Z.; Ćapkun, V.; Tomić, S. Expression of androgen receptors in triple negative breast carcinomas. Acta Histochem. 2013, 115, 344–348. [Google Scholar] [CrossRef] [PubMed]
  48. Cross, N.; White, H.E.; Müller, M.C.; Saglio, G.; Hochhaus, A. Standardized definitions of molecular response in chronic myeloid leukemia. Leukemia 2012, 26, 2172–2175. [Google Scholar] [CrossRef] [PubMed] [Green Version]
  49. Marin, D.; Ibrahim, A.R.; Lucas, C.; Gerrard, G.; Wang, L.; Szydlo, R.M.; Clark, R.E.; Apperley, J.F.; Milojkovic, D.; Bua, M.; et al. Assessment of BCR-ABL1 transcript levels at 3 months is the only requirement for predicting outcome for patients with chronic myeloid leukemia treated with ty-rosine kinase inhibitors. J. Clin. Oncol. 2012, 30, 232–238. [Google Scholar] [CrossRef]
  50. Neelakantan, P.; Gerrard, G.; Lucas, C.; Milojkovic, D.; May, P.; Wang, L.; Paliompeis, C.; Bua, M.; Reid, A.; Rezvani, K.; et al. Combining BCR-ABL1 transcript levels at 3 and 6 months in chronic myeloid leukemia: Implications for early intervention strategies. Blood 2013, 121, 2739–2742. [Google Scholar] [CrossRef]
  51. Stella, S.; Zammit, V.; Vitale, S.R.; Pennisi, M.S.; Massimino, M.; Tirrò, E.; Forte, S.; Spitaleri, A.; Antolino, A.; Siracusa, S.; et al. Clinical Implications of Discordant Early Molecular Responses in CML Patients Treated with Imatinib. Int. J. Mol. Sci. 2019, 20, 2226. [Google Scholar] [CrossRef] [PubMed] [Green Version]
  52. Baccarani, M. Treatment-free remission in chronic myeloid leukemia: Floating between expectation and evidence. Leukemia 2017, 31, 1015–1016. [Google Scholar] [CrossRef] [PubMed]
  53. Cortes, J.E.; Kim, D.-W.; Pinilla-Ibarz, J.; Le Coutre, P.D.; Paquette, R.; Chuah, C.; Nicolini, F.E.; Apperley, J.F.; Khoury, H.J.; Talpaz, M.; et al. Ponatinib efficacy and safety in Philadelphia chromosome–positive leukemia: Final 5-year results of the phase 2 PACE trial. Blood 2018, 132, 393–404. [Google Scholar] [CrossRef] [PubMed]
  54. Nakashima, C.; Sato, A.; Abe, T.; Kato, J.; Hirai, M.; Nakamura, T.; Komiya, K.; Sueoka, E.; Kimura, S.; Sueoka-Aragane, N. Automated DNA extraction using cellulose magnetic beads can improve EGFR point mutation detection with liquid biopsy by efficiently recovering short and long DNA fragments. Oncotarget 2018, 9, 25181–25192. [Google Scholar] [CrossRef] [Green Version]
  55. Van Dessel, L.F.; Vitale, S.R.; Helmijr, J.C.A.; Wilting, S.M.; Vlugt-Daane, M.; Hoop, E.O.-D.; Sleijfer, S.; Martens, J.W.M.; Jansen, M.P.H.M.; Lolkema, M.P.; et al. High-throughput isolation of circulating tumor DNA: A comparison of automated platforms. Mol. Oncol. 2019, 13, 392–402. [Google Scholar] [CrossRef] [PubMed]
Figure 1. Workflow of the study. A total of 4 × 7 mL of peripheral blood was collected by venepuncture in EDTA tubes, with 2 × 7 mL treated by the manual (A) method and 2 × 7 mL processed by a newly semiautomatic (B) method based on the Biomek i-5 Automated Workstations integrated with the CytoFLEX Flow Cytometer. Red cells were removed from matched samples by consecutive treatments of the blood samples with red cell lysis, and 1 × 10⁷ of the collected WBCs cells were lysed in RLT buffer. Total RNA was extracted by the manual column-based RNAse Mini Kit or the automatic QIAsymphony extractor system. Quantitative polymerase chain reaction was used to measure BCR-ABL1, ABL1 and BCR-ABL1/ABL1IS gene transcripts levels. EDTA tube: EthylenDiaminoTetracetyc Acid tube; RNA: RiboNucleic Acid; Q-PCR: quantitative polymerase chain reaction; cDNA: complementary DeossiNucleic Acid.
Diagnostics 11 01502 g001
Figure 2. Scheme of the Biomek i-5 Automated Workstations (A) integrated with the CytoFLEX Flow Cytometer (B). (A) The figure shows the deck space of the Biomek i-5 Workstation customized in order to isolate total WBCs from PB of CML patients. EDTA tubes (3 mL or 7 mL) are loaded in samples lanes (positions 1 and 2) and blood is transferred to 50 mL tubes placed in the 50 mL tube position (position 3) by an arm inked to a span-8 Pod and using P1000 tips. The dispenser bark tool (position 4) aliquots the lysis buffer and PBS solution. Collected white blood cells are dispensed in a 96-well plate located at the Cytoflex plate position (position 5). (B) The figure depicts a plate Settings window of the CytoFLEX Flow Cytometer employed in the software for cell count analysis. The software allowed selection of the desired acquisition settings and the channels to set compensation and select element to record, including time and volume. Sample names are labelled in the software representing a 96-well plate. The well position on the plate matches the well position selected in the software. A total of 10,000 events are counted and cells are identified using forward and side scatter.
Diagnostics 11 01502 g002
Figure 3. White blood cell isolation efficiency on blood samples processed with the manual and semiautomatic protocols. (A) White blood cells were isolated from 14 mL matched peripheral blood samples of CML patients (N = 100) with a manual method or a newly semiautomatic method based on the Biomek i-5 Automated Workstations integrated with the CytoFLEX Flow Cytometer. Cell counts, expressed as number of cells/mL, were analysed to determine cell recovery efficiency. The number of cells was determined for each method and depicted as boxplots delimited by the 25th (lower) and 75th (upper) percentile. Horizontal lines above and below each boxplot indicate the 5th and 95th percentile, respectively. Thick lines in each boxplot represent number cell median/mL in each method. The Wilcoxon signed-rank test was used to test the difference between the platforms. The symbols ■ and ● indicate the manual and the semiautomatic method, respectively. p value below 0.5 was considered statistical significant. (B) The figure shows the acquisition screen on the CytoFLEX Platform. The CytExpert software includes gates to visualize the distribution of total white cells isolated from blood of CML patient. Cell lives are indicated by the gate and depicted in rose. SSC-A: Side scatter-area; FSC-A: forward scatter-area. (C) The graph is plotted on the XY axis where X represents the difference of the two measurements, and the Y-axis shows the mean of the two measurements. Horizontal lines are drawn at the mean difference between the two methods and the upper and lower limits of agreement. The 95% confidence intervals are shown for the mean and the upper and lower limits of agreement.
Diagnostics 11 01502 g003
Figure 4. Quantitative PCR performance on samples processed with the manual and semiautomatic protocols. Molecular measurement of BCR-ABL1 transcripts levels by Q-PCR of matched blood samples processed with a manual or a newly semiautomatic method. BCR-ABL1/ABL1IS had assessed in patients stratified in four groups, each consisting of 25 subjects: Group A (10% > BCR-ABL1/ABL1IS > 0.1%) (A), Group B (0.1% > BCR-ABL1/ABL1IS > 0.01%) (B), Group C (0.01% > BCR-ABL1/ABL1IS > 0.0032%) (C). BCR-ABL1/ABL1IS levels were determined for each method and depicted as boxplots delimited by the 25th (lower) and 75th (upper) percentile. Horizontal lines above and below each boxplot indicate the 5th and 95th percentile, respectively. Thick lines in each boxplot represent median BCR-ABL1/ABL1IS in each patient group. The Wilcoxon signed-rank test was used to test thedifference between the platforms. The symbols ■ and ● indicate the manual and the semiautomatic method, respectively. A p value below 0.5 was considered statistical significant.
Diagnostics 11 01502 g004
Figure 5. Bland–Altman showing the concordance of the BCR-ABL1/ABL1IS transcript level measured by manual and semiautomatic methods. Paired measurements of BCR-ABL1/ABL1IS were combined for patients stratified in four groups, each consisting of 25 subjects: Group A (10% > BCR-ABL1/ABL1IS > 0.1%) (A), Group B (0.1% > BCR-ABL1/ABL1IS > 0.01%) (B), Group C (0.01% > BCR-ABL1/ABL1IS > 0.0032%) (C). The graph is plotted on the XY axis where X represents the difference of the two measurements, and the Y-axis shows the mean of the two measurements. Horizontal lines are drawn at the mean difference between the two methods and the upper and lower limits of agreement. The 95% confidence intervals are shown for the mean and the upper and lower limits of agreement.
Diagnostics 11 01502 g005
Figure 6. Measurement of ABL1 control gene on samples processed with the manual and semiautomatic protocols. Molecular measurement of ABL1 transcripts levels by Q-PCR of matched blood samples processed with a manual or a newly semiautomatic method. ABL1 reference gene copies were measured the four groups of patients stratified, each consisting of 25 subjects: Group A (10% > BCR-ABL1/ABL1IS > 0.1%) (A), Group B (0.1% > BCR-ABL1/ABL1IS > 0.01%) (B), Group C (0.01% > BCR-ABL1/ABL1IS > 0.0032%) (C) and Group D (BCR-ABL1/ABL1IS < 0.0032%) (D). ABL1 levels were determined for each method and depicted as boxplots delimited by the 25th (lower) and 75th (upper) percentile. Horizontal lines above and below each boxplot indicate the 5th and 95th percentile, respectively. Thick lines in each boxplot represent median ABL1 in each patient group. The Wilcoxon signed-rank test was used to test the difference between the platforms. The symbol ● indicate the manual and the semiautomatic method, respectively. p value below 0.5 was considered statistical significant.
Diagnostics 11 01502 g006
Figure 7. Bland–Altman showing the concordance of the ABL1 level measured by manual and semiautomatic methods. Paired measurements of ABL1 were combined for patients stratified in four groups, each consisting of 25 subjects: Group A (10% > BCR-ABL1/ABL1IS > 0.1%) (A), Group B (0.1% > BCR-ABL1/ABL1IS > 0.01%) (B), Group C (0.01% > BCR-ABL1/ABL1IS > 0.0032%) (C) and Group D (BCR-ABL1/ABL1IS < 0.0032%) (D). The graph is plotted on the XY axis where X represents the difference of the two measurements, and the Y-axis shows the mean of the two measurements. Horizontal lines are drawn at the mean difference between the two methods and the upper and lower limits of agreement. The 95% confidence intervals are shown for the mean and the upper and lower limits of agreement.
Diagnostics 11 01502 g007
Table 1. Patient Characteristics (N = 100).
CharacteristicsN.
Follow up
Median (mo.)63
Range3–172
Sex (pts n.)
Male57
Female43
Leukocyte (×109/L)
Median7.59
Range3.04–21.8
Platelet count (×109/L)
Median319
Range82–740
Haemoglobin (g/dL)
Median12.8
Range10.8–14.7
Transcript Type
e13a2 (b2a2)38
e14a2 (b3a2)54
e13a2 and e14a28
Molecular response
GROUP A (10% > BCR-ABL1/ABL1IS > 0.1%)25
GROUP B (0.1% ≥ BCR-ABL1/ABL1IS > 0.01%)25
GROUP C (0.01% ≥ BCR-ABL1/ABL1IS > 0.0032%)25
GROUP D (BCR-ABL1/ABL1IS ≤ 0.0032%)25
Table 2. Description of manual and semiautomatic protocols.
ProtocolInstrument or Manual KitSampleInput (mL)Number of Samples per RunHandling-Time
per Run (min)
Cost (€)
per Sample
WBCs
isolation
(A) Manual-Blood141221010
(B) Semi-automaticBiomeck i5 & Cytoflex1448 **3020
RNA
isolation
(C) ManualRNeasy Mini kit (QIAGEN)WBCs *0.612908
(D) AutomaticQIAsymphony (QS)0.624 **1517
* WBCs are resuspended in RLT Buffer; ** upon request, the number of samples per run can be increase up to 96. WBCs: white blood cells, RNA: RiboNucleic Acid; min = minutes.
Table 3. Specification of white blood cell sand RNA isolation methods.
Cells IsolationRNA Isolation
ProtocolCells/mL
Median
Range
Total Cells
Median
Range
ng/µL
Median
Range
260/280
Median
Range
260/230
Median
Range
Manual1.137 × 106
(3.23 × 10⁵–3.075 × 10⁶)
5.60 × 10⁷
(1.6 × 10⁷–1.53 × 10⁸)
103.00
(75–273.5)
1.9
(1.9–2.0)
2.1
(2.0–2.2)
Semiautomatic1.076 × 106
(3.00 × 10⁵–2.78 × 10⁶)
5.3 × 10⁷
(1.5 × 10⁷–1.4 × 10⁸)
99.95
(75–359.4)
1.9
(1.90–2.0)
2.1
(2.0–2.2)
Publisher’s Note: MDPI stays neutral with regard to jurisdictional claims in published maps and institutional affiliations.

