1. Introduction
Joint deformity as seen in the presence of hip dysplasia is a common cause of hip pain in young skeletally mature patients and may lead to osteoarthritis (OA) [
1]. Traditionally, first line modality when diagnosing dysplasia of the hip is radiographs, where measurements taken from a standardized anterior-posterior (AP) pelvic radiograph are used to evaluate the anatomical configuration of the pelvis. The lateral center edge angle of Wiberg (LCEA) describes femoral head coverage by the acetabulum and the acetabular index angle (AIA) quantifies the inclination of the acetabular roof [
2].
An accurate and early diagnosis may postpone, reduce or even prevent the onset of OA and ultimately hip arthroplasty at a young age [
3]. It was previously reported, though, that patients with non-specific hip pain may be left with symptoms for years before the correct diagnosis of hip dysplasia is made, perhaps because the anatomical deformities indicative of hip dysplasia are not routinely reported in all departments of radiology. They found that the correct diagnosis of hip dysplasia was delayed with up to several years (range: 0–204 months) and more than three confrontations (range: 0–11) with the healthcare system [
4,
5]. The anatomical deformities associated with hip dysplasia may be diagnosed earlier by using artificial intelligence models and algorithms, possibly as a screening tool, which may also have the potential to improve reader variability and workflow.
The process of developing and testing an algorithm for measuring LCEA and AIA has recently been published and results indicated that an automatic measurement model is feasible [
6]. Moreover, Fraiwan and colleagues showed the potential of deep transfer learning for detecting developmental dysplasia of the hip in pelvic radiographs of infants [
7]. It has also been suggested that AI is useful for detection and classification of hip dysplasia using ultrasound images [
8]. Clinical tests of algorithms for measuring hip parameters such as LCEA and AIA in skeletally mature patients are to the best of the authors’ knowledge limited.
The overall purpose of this study was, in a clinical setting, to assess the performance of an algorithm designed to read pelvic AP radiographs of skeletally mature patients. We aimed to assess reliability of the algorithm and agreement between the algorithm and, respectively, orthopedic surgeons, radiologists and a reporting radiographer for measuring LCEA and AIA.
2. Materials and Methods
2.1. Study Design
In this retrospective study, we used an algorithm trained to identify several specific segments related to hip dysplasia. The algorithm was applied to 78 pelvic radiographs that were consecutively collected from one center. Moreover, two orthopedic surgeons, two radiologists and one reporting radiographer evaluated all images in regard to LCEA, AIA, and the width of both obturator foramen. The study was approved by the Danish National Committee on Health Research Ethics (Project-ID: 2103745) and registered with the regional health authorities (project-ID: 21/22036). The analyses were carried out in concordance with current Guidelines for Reporting Reliability and Agreement Studies [
9,
10].
2.2. Study Population
Anterior-posterior pelvic radiographs of adults referred to diagnostic workup in relation to non-traumatic hip pain at Odense University Hospital were retrospectively identified and collected in a consecutive manner until the desired sample of 78 was achieved (
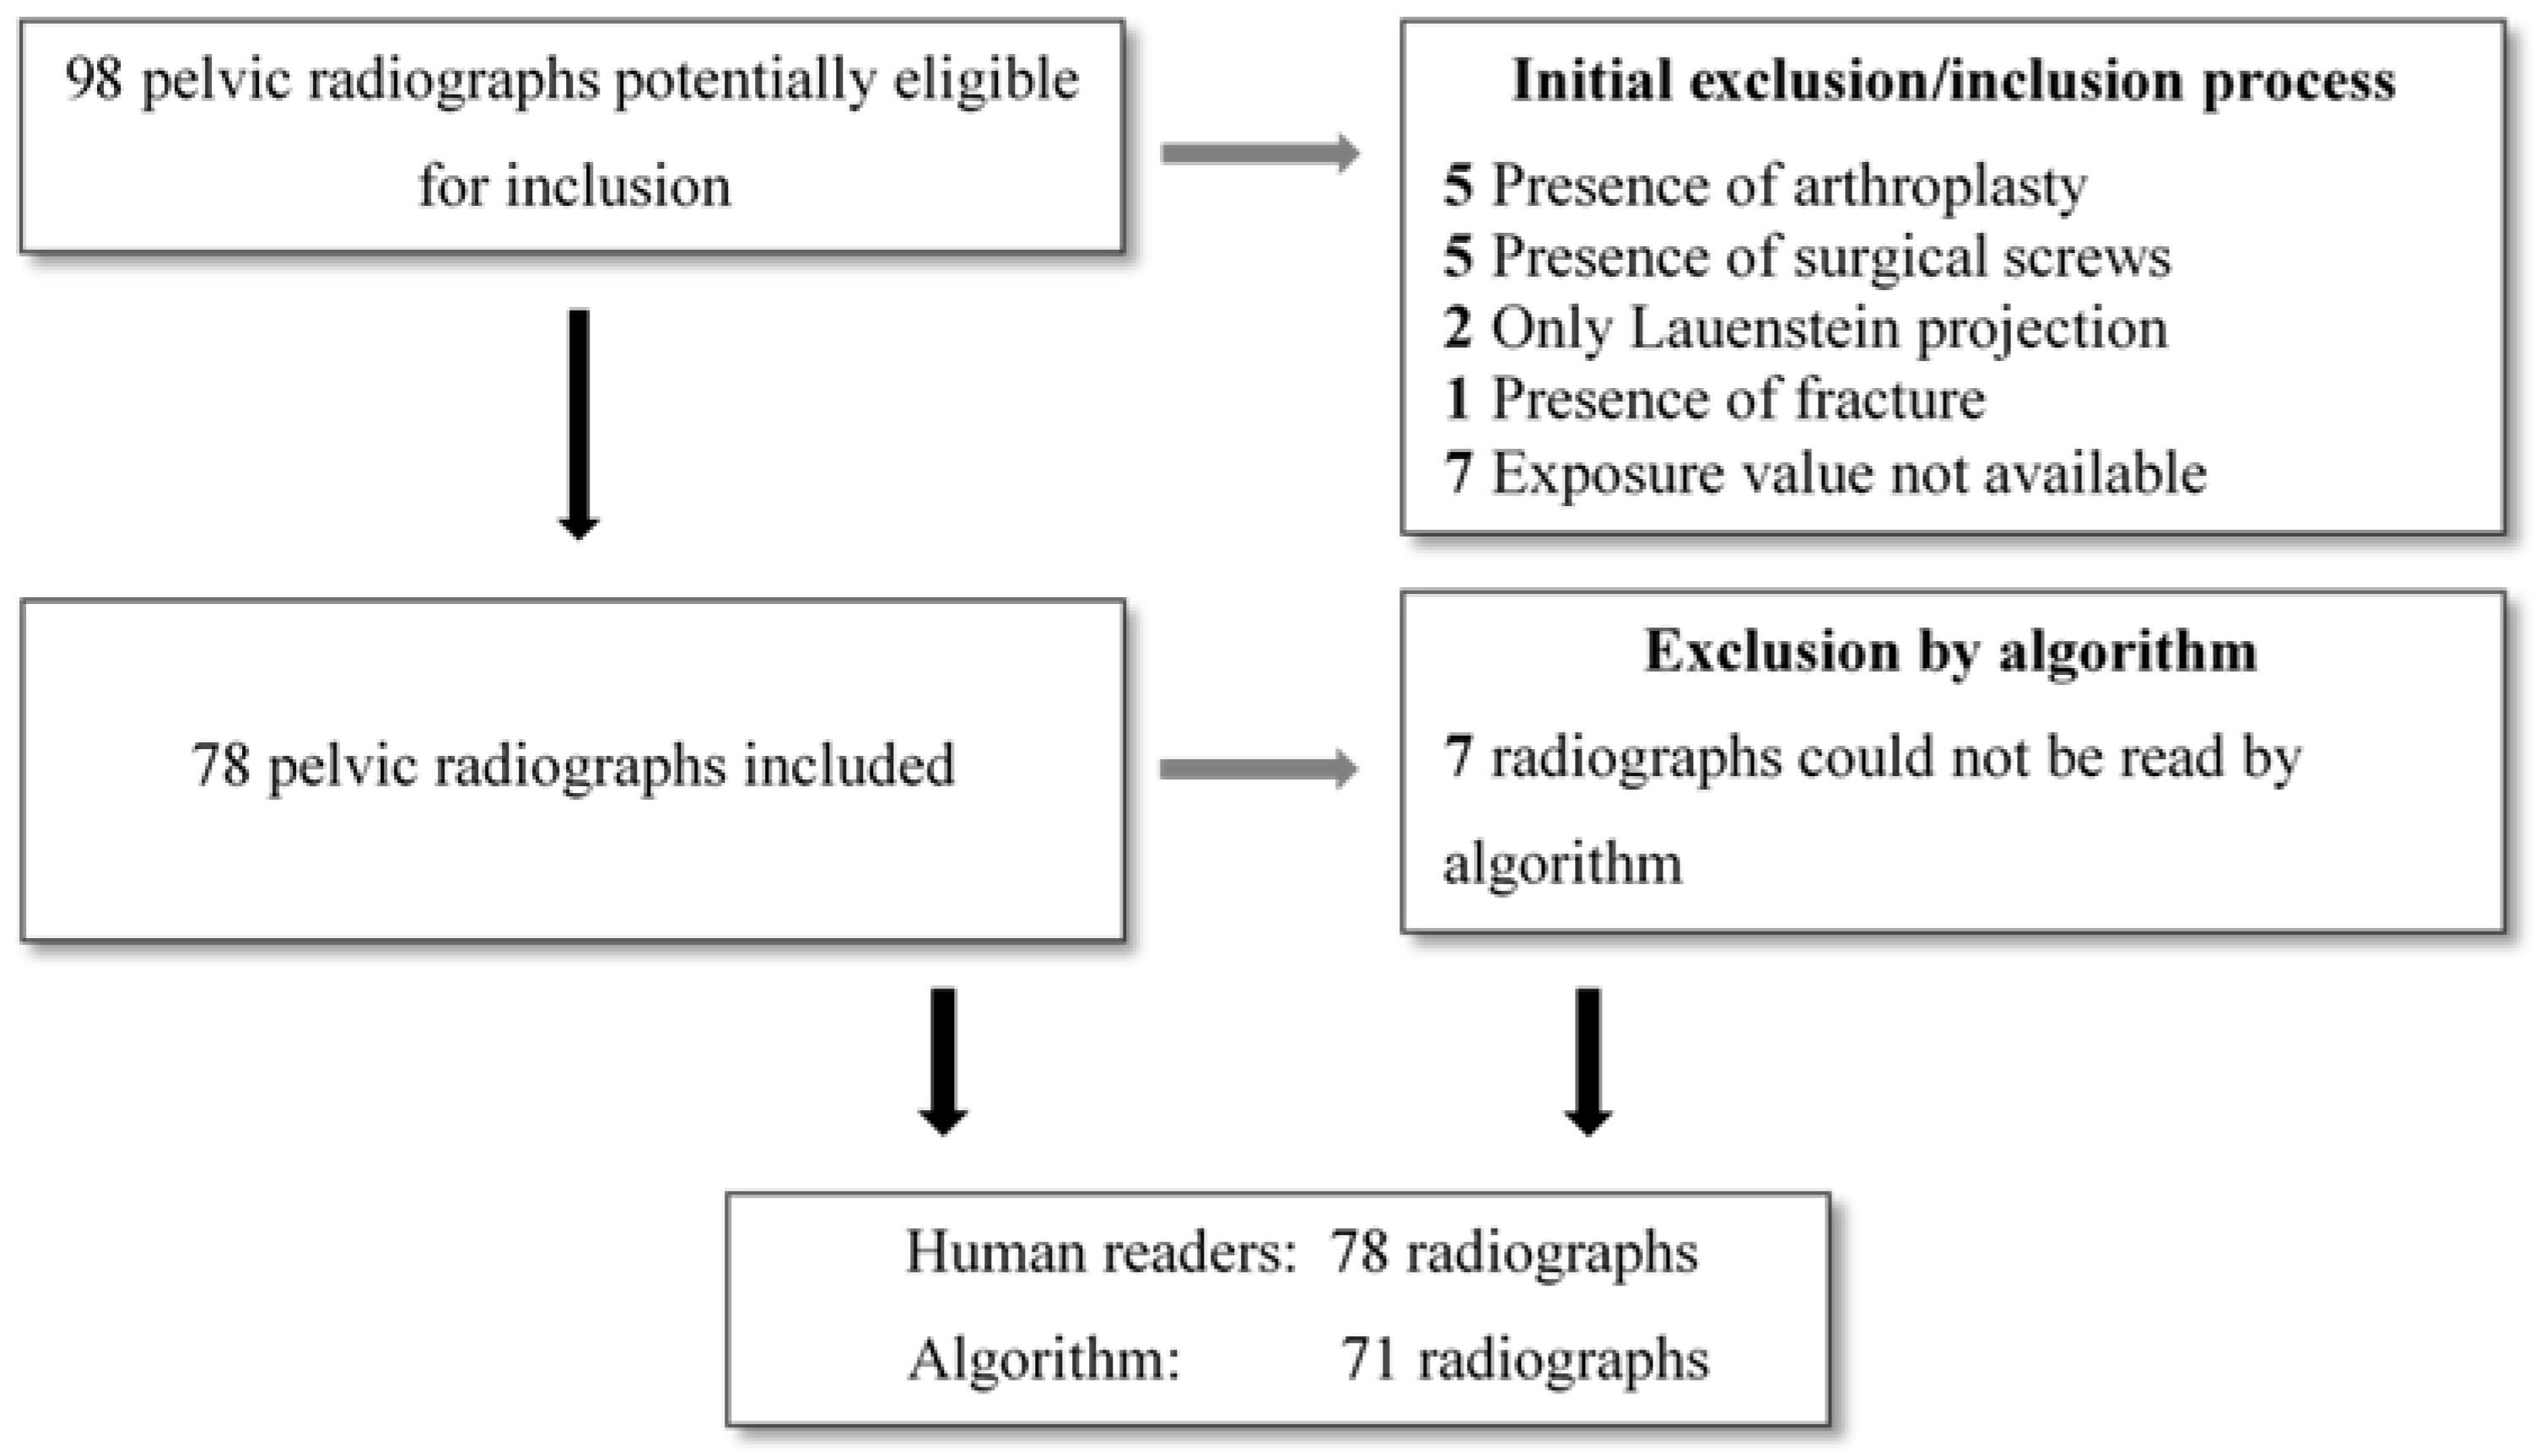
Section 2.6. Statistical analyses). Inclusion criteria were weight-bearing pelvic radiographs of adults (≥18 years). All weight-bearing pelvic radiographs are taken with the legs internally rotated 15°. Exclusion criteria were the presence of arthroplasty or other types of surgical hardware, signs of congenital abnormalities, surgical or fracture sequela. Radiographs that did not include the entirety of the bony pelvis and the proximal femurs were excluded, as were radiographs that did not show the exposure value. Stratified enrolment by sex and age was applied, such that a similar number of males and females above and below the age of 50 years was present in the sample. Ninety-eight pelvic radiographs were screened consecutively, and inclusion were made according to inclusion and exclusion criteria until the desired sample of 78 pelvic radiographs were obtained (
Figure 1). The 78 pelvic radiographs were analyzed by the algorithm and read by all human readers.
2.3. Anatomic Definitions
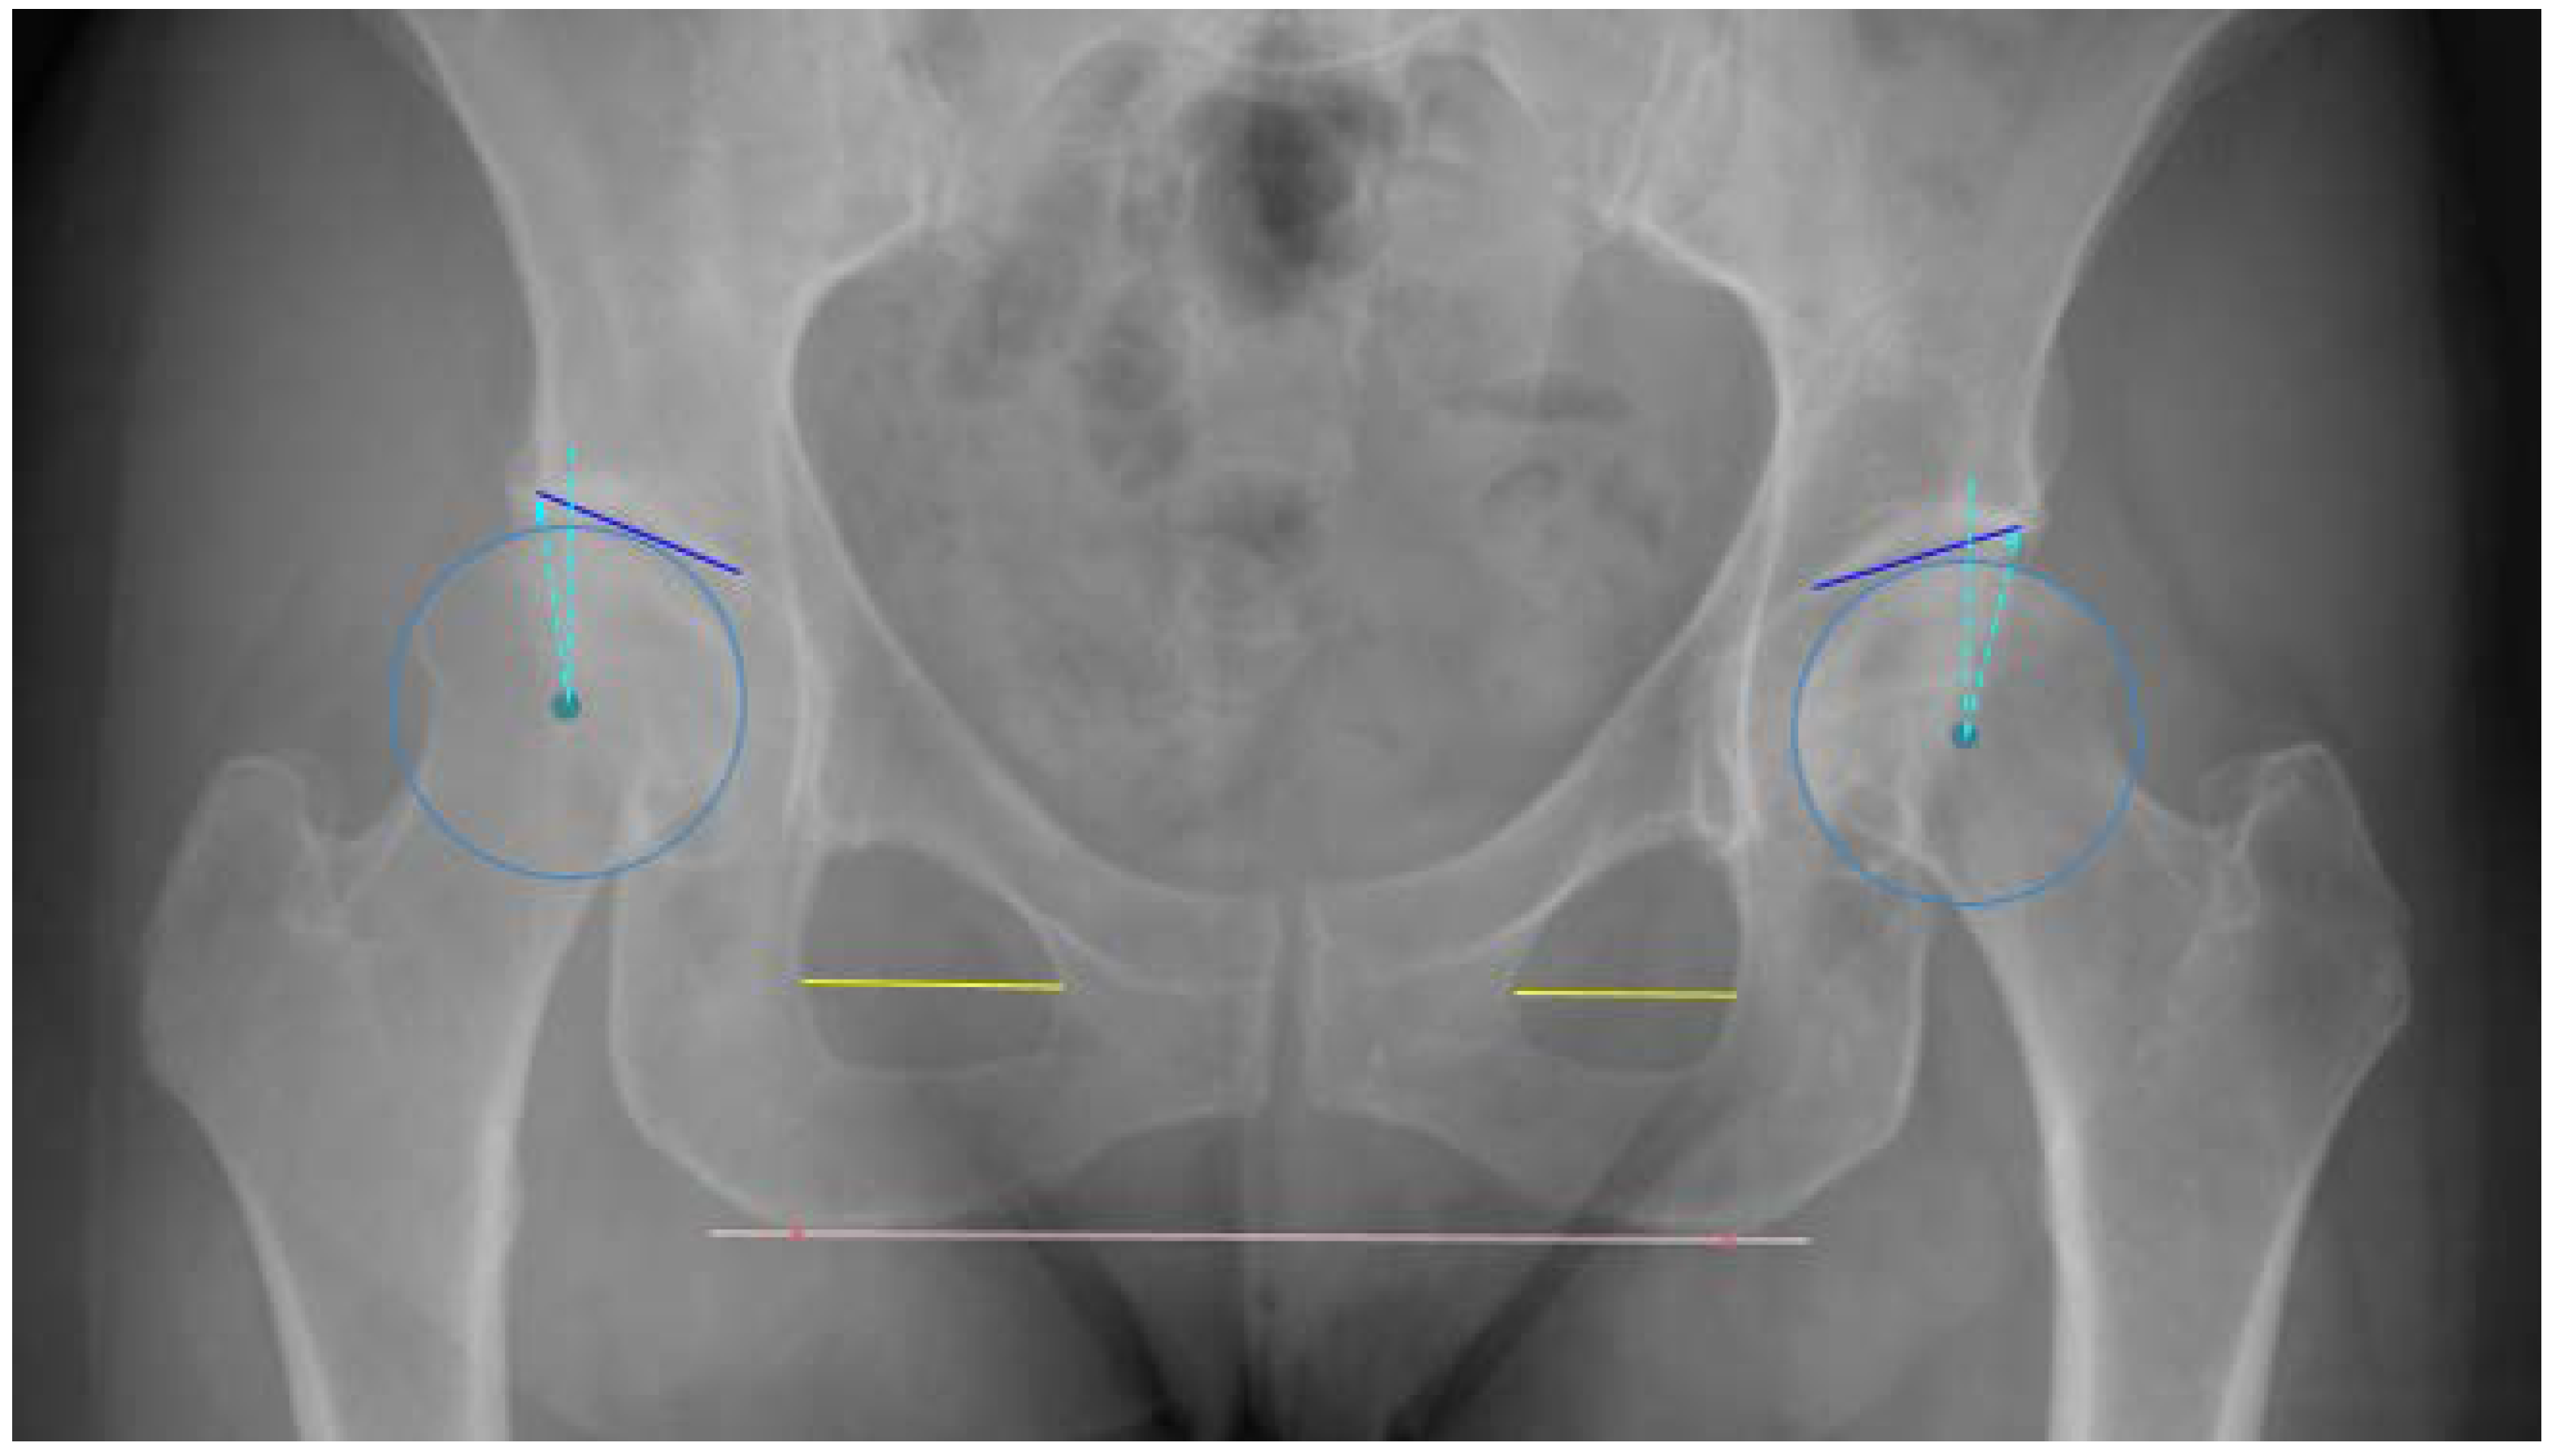
All measurements were made in relation to a horizontal reference line adjoining the most inferior points of the ischial tuberosities. The LCEA was defined as the angle between two lines both drawn from the center of the femoral head (CFH), a line perpendicular to the reference line and a line from the CFH to the lateral sourcil of the acetabulum, respectively. The AIA was defined as the angle between a horizontal line from the medial sourcil (medial aspect of the sclerotic acetabular roof) parallel to the reference line and a line connecting the medial and lateral sourcils [
11]. Moreover, the foramen obturator index (FOI), an indicator of pelvis rotation, was calculated as the ratio between the widths of the two foramina. The widths of the foramina was measured at the widest point of the foramina, parallel to the reference line (
Figure 2) [
12].
2.4. Algorithm Development and Training
Automatic measurements were extracted from the pelvic radiographs using a newly developed algorithm (RBhip™, Radiobotics, Copenhagen, Denmark). The algorithm was developed using deep-learning and computer vision and trained on more than 2900 pelvic radiographs. The pelvis, including the acetabulum, and the femoral head and neck were independently segmented using a segmentation model with a modified U-Net architecture trained using augmentation with ResNet34 as a backbone [
13].
The horizontal reference was established as a line through the most inferior points on the ischial tuberosities. For the LCEA, the circle best encompassing the femoral head was found through a parameterization of a circle fitted to points along the femoral head contour using least squares. The sourcils in both hips were independently segmented to provide the landmarks of the lateral and medial extent of the weight-bearing area. The sourcil segmentation model was trained primarily using annotations from an orthopedic surgeon and optimized to find the lateral extent of the acetabular roof. This point does not necessarily coincide with the lateral acetabular rim [
14,
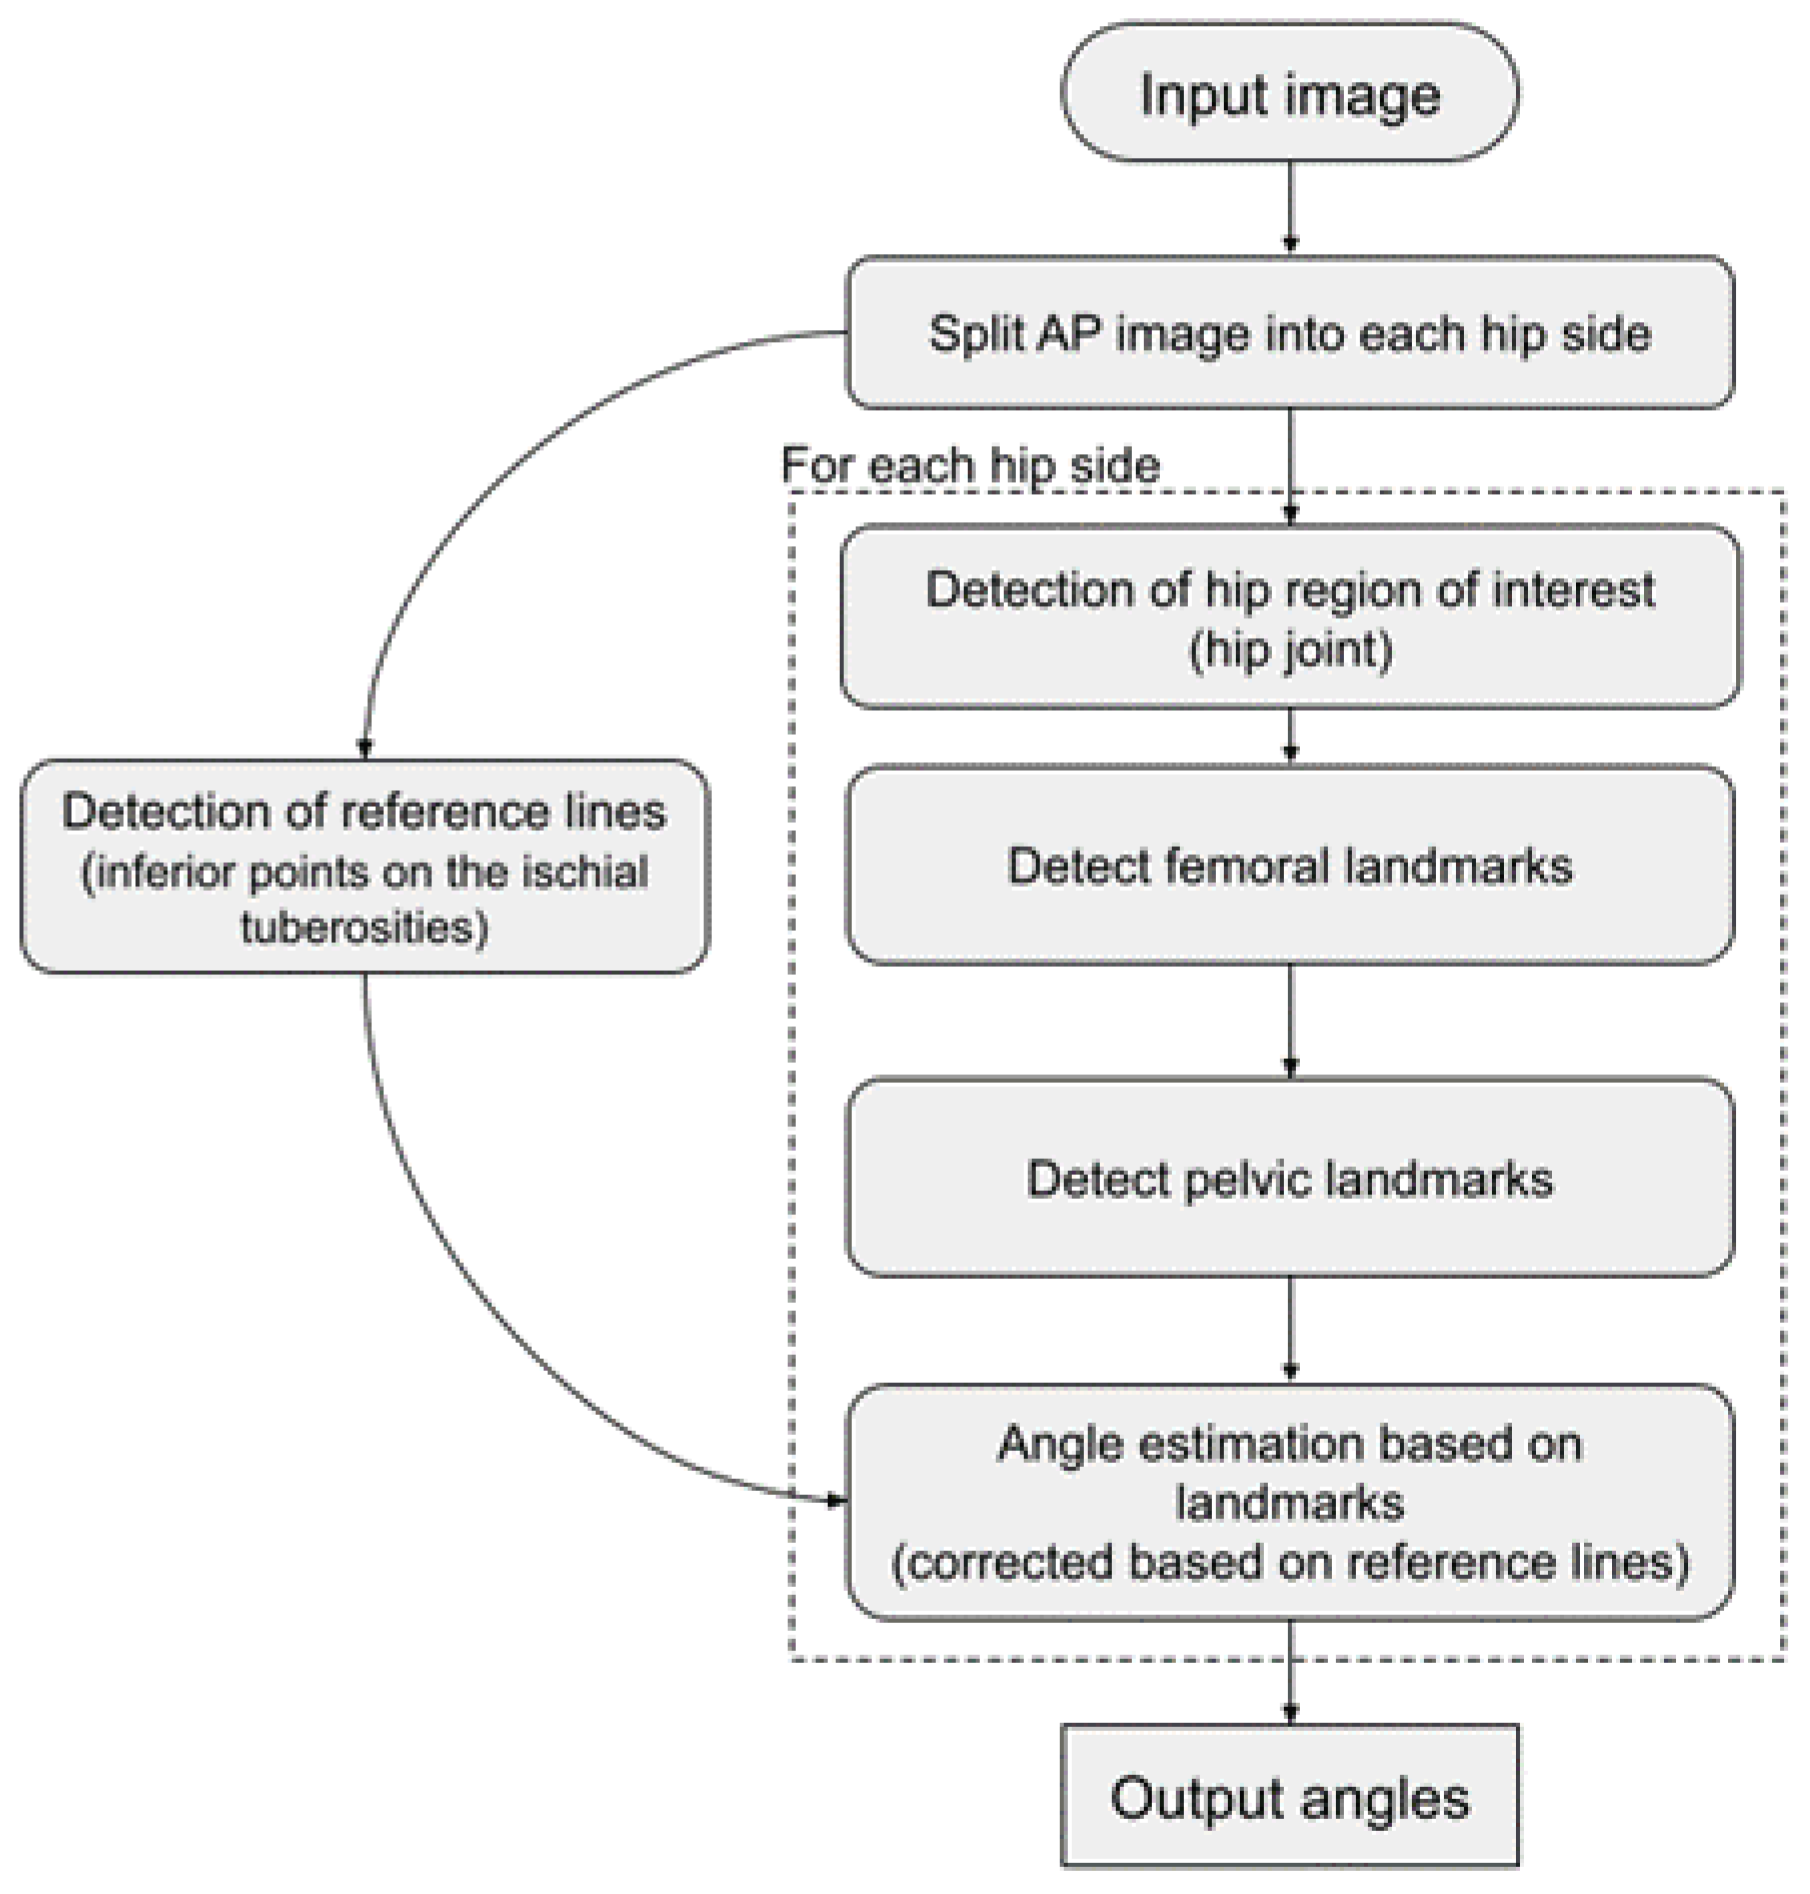
15]. For the FOI, the width of each foramina was calculated at 13 equidistant lines parallel to the horizontal reference line. The FOI was established as the maximum width for the right foramina relative to the maximum width of the left foramina. The algorithm flowchart is depicted in
Figure 3.
2.5. Data Collection
2.5.1. Human Readers
Five readers, two senior and three junior readers, all accustomed to reading and measuring angles and distances related to hip deformities made all the measurements blinded to each other’s results. No clinical information was available to the readers. The senior readers were a musculoskeletal (MSK) radiologist (LB) and a consultant hip surgeon (CV), with 21 and 8 years of experience, respectively. Moreover, a junior MSK radiologist (JR), a junior hip surgeon (MHH) and a reporting radiographer (LBO) (respectively, 3, 5 and 12 years of experience) made all the measurements. To minimize systematic bias, a protocol with definitions of measurements was distributed to each participant prior to the measurement session (
Figure 2). In keeping with daily clinical practice, the readers made all measurements digitally in a picture archiving and communication system (GE Healthcare, IL, USA) and recorded the measurements in a database, REDCap (Research Electronic Data Capture). Five of the radiographs were reported three times by all human readers. Additionally, the exposure index was collected as indirect indication of digital image quality, i.e., noise [
16].
2.5.2. Algorithm
The algorithm was running as a Software as a service within the hospital firewall. Images were processed by forwarding the AP radiographs directly from the Picture Archiving and Communication System to a secure Digital Imaging and Communications in Medicine destination. The results were returned as a JavaScript Object Notation file and uploaded electronically to the REDCap database. To assess consistency of the algorithm, all radiographs were read twice approximately two weeks apart.
2.6. Statistical Analyses
Mean, standard deviation (SD), and range were calculated for all measurements with scatterplots visualizing bivariate associations. Differences between first and second read by the algorithm were presented descriptively by mean, SD, min, max, first (Q1), and third quartile (Q3). Agreement between the algorithm and individual human readers were estimated and illustrated by Bland-Altman (BA) plots with limits of agreement (LoA), bias, and respective 95% confidence intervals (CI). Assuming normality of data, the LoA are estimates of the range within which 95% of all differences between algorithm and human readers will fall. The bias is the mean measured difference between algorithm and human reader [
17,
18].
Linear mixed effect models were used to assess factors influencing variance in human data by estimating the repeatability coefficient (RC). The RC is a limit below which an estimated 95% of differences between two measurements is expected to fall. Age, sex, FOI, and noise were treated as fixed factors. Patient, reader, and repeated measurements were considered random effects. We derived RCs for (a) Repeatability; the closeness of repeated measurements of the same patient made under similar conditions by the same reader (intrarater variability analysis), and (b) Reproducibility; the closeness of measurements of the same patient made by readers of varying experience in the same measurement setup (interrater variability analysis). The RCs were calculated as 2.77 times the estimated within-subject SD as derived from the mixed effect model [
19].
Sample size was calculated based on the procedure proposed by Lu et al. (2016) for sample size assessment of the Bland-Altman method [
17,
20]. Assuming an SD of 2.1° and a clinical acceptable agreement limit of 5° (LCEA), a sample size of 176 was required to show a similar agreement between algorithm and human readers, with a power of 80% at a significance level of 5%. Since measurements were carried out on both hips and repeated three times on five patients (2 × 5 additional measurements), the required number of patients was 78.
p-values < 0.05 were considered statistically significant. The Stata version 16 (StataCorp. 2019, College Station, TX, USA) was used for all statistical analyses.
3. Results
The algorithm was not able to read seven of the 78 included images. Therefore, 71 radiographs were read by the algorithm, resulting in a sample with an average age of 50.1 years [range; 18 to 91] consisting of 36 females and 35 males for agreement analyses. All 78 radiographs were reported by the human readers and included in repeatability and reproducibility estimates.
The algorithm proved highly consistent when double reading all measurements, displaying variances between first and second read that were identical or within the range of machine precision (
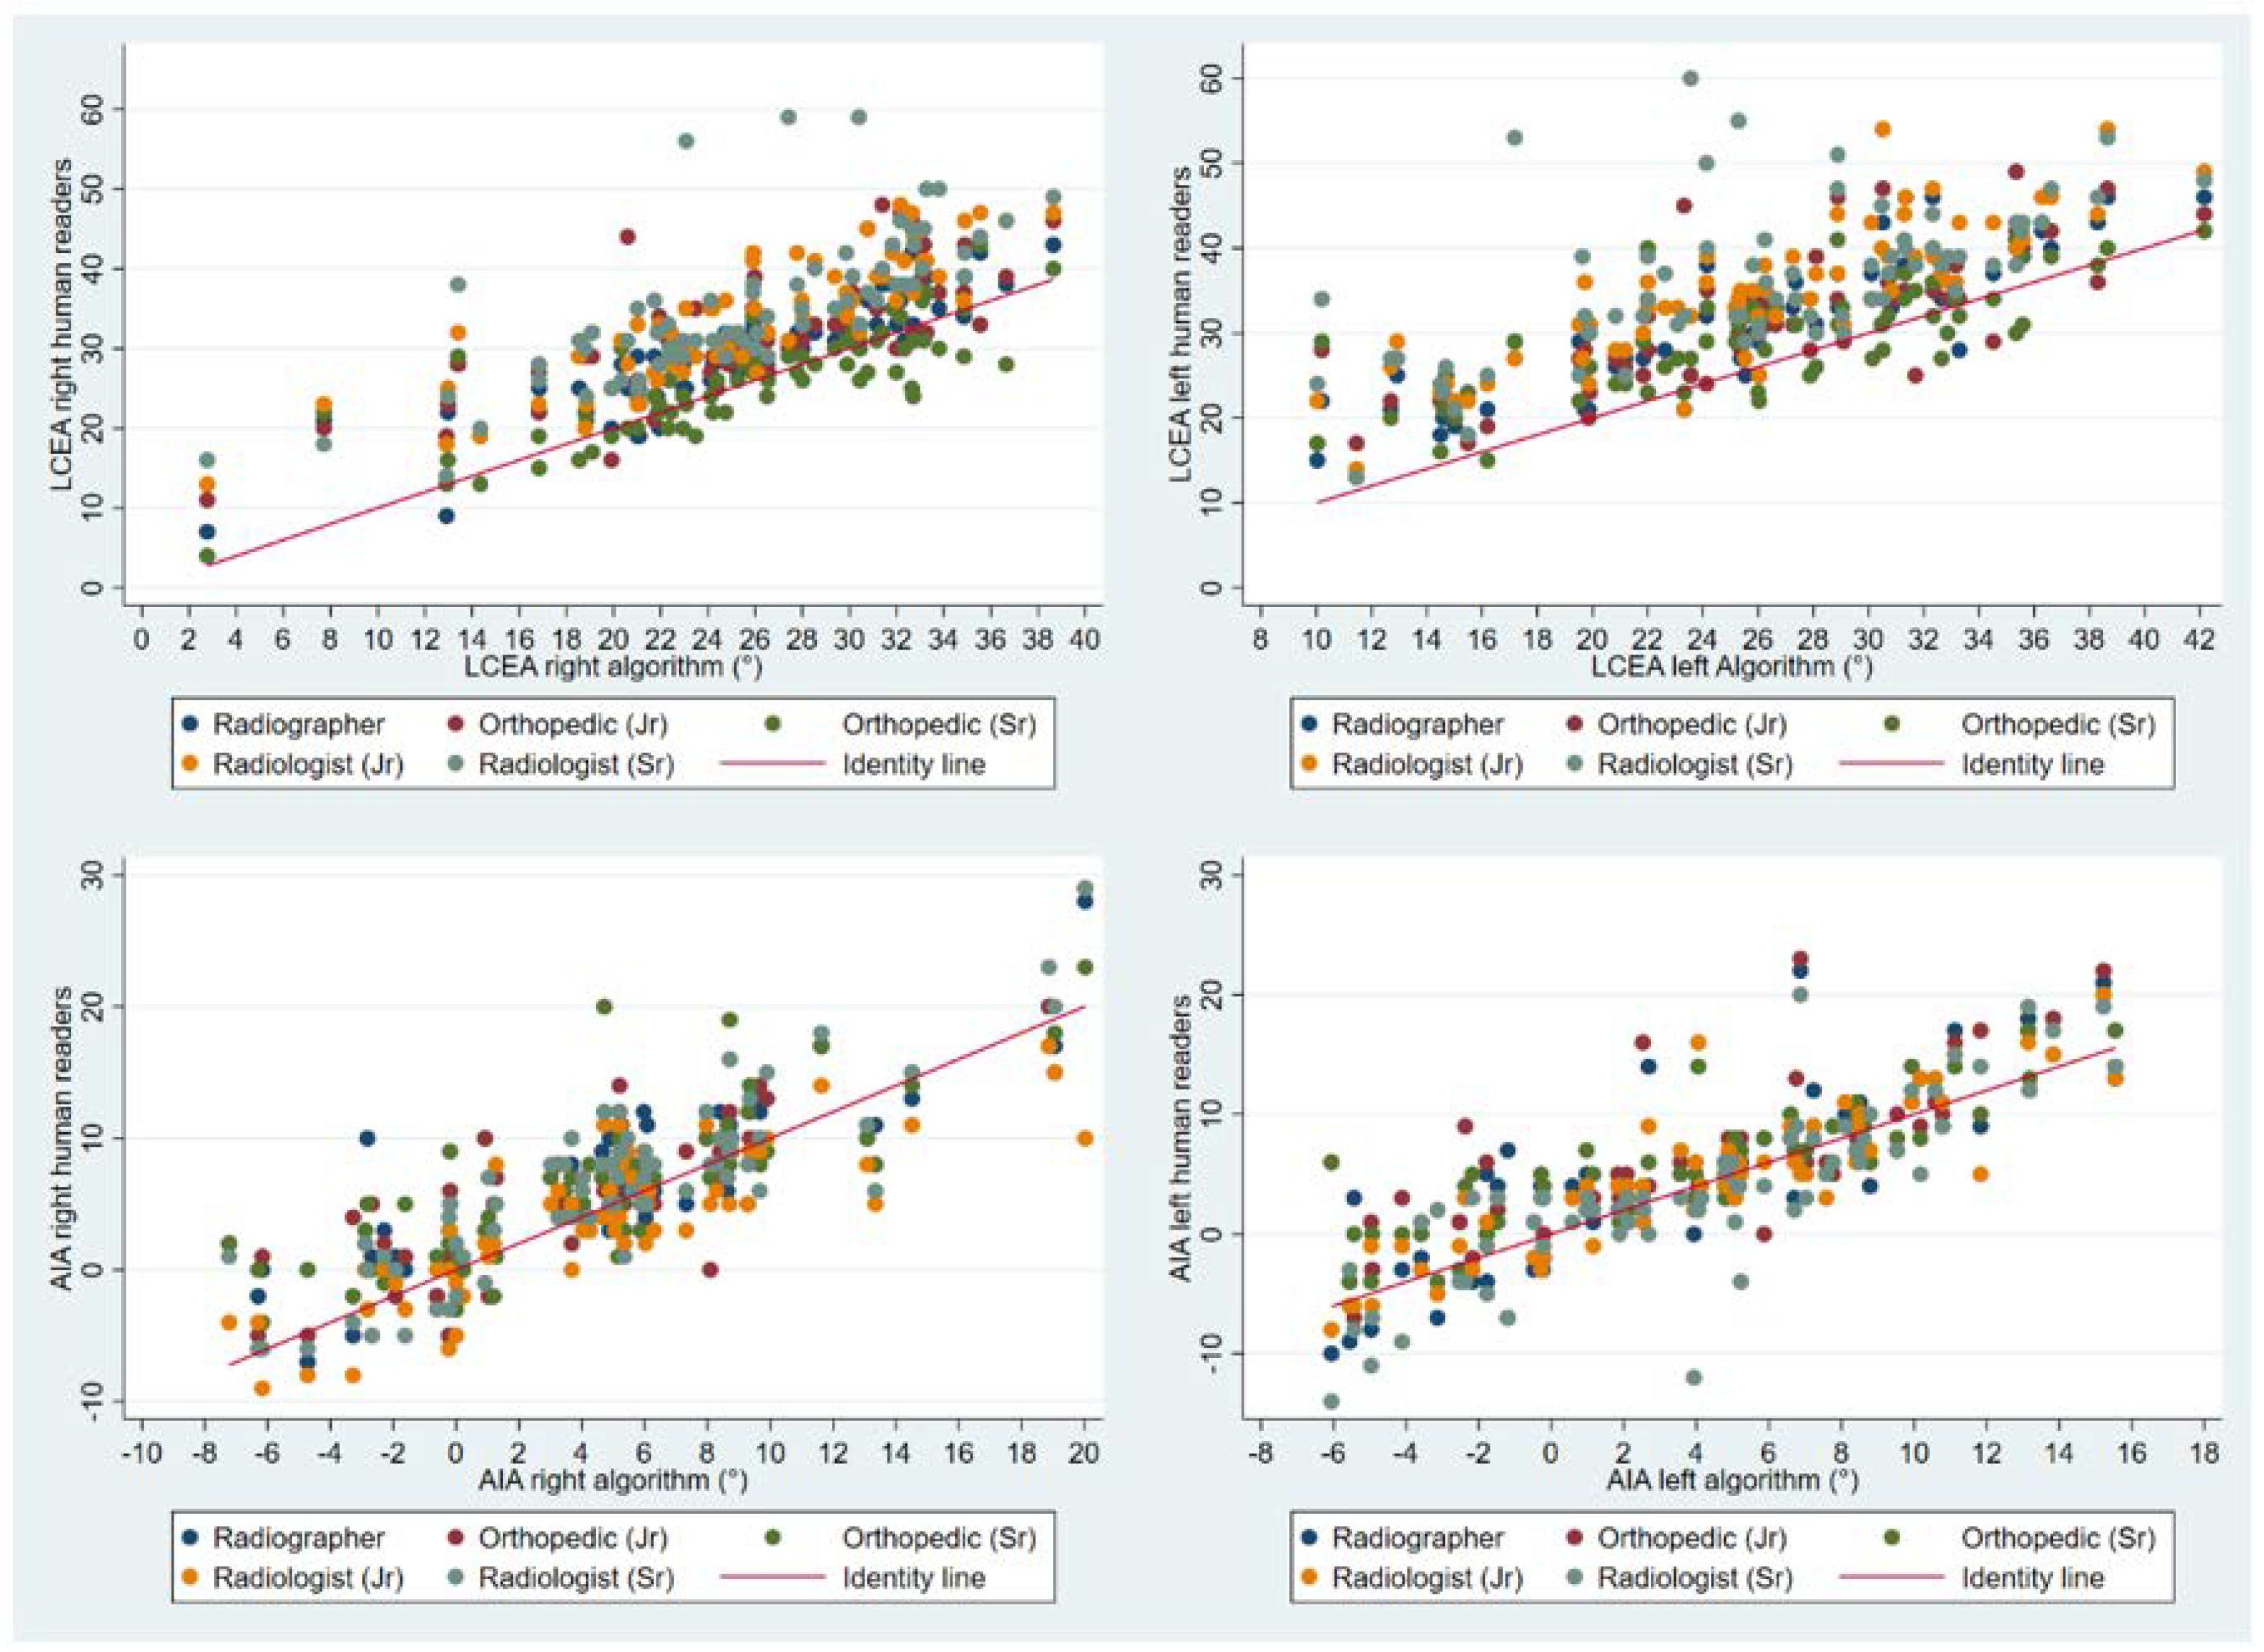
Table 1). Values for all parameters showed a tendency to be higher when measured by humans, particularly the LCEA measurements. The LCEA (right hip) for humans ranged from 25.8 to 35.0° versus 25.4° when measured by the algorithm. Corresponding values for AIA (right hip) ranged from 4.1 to 6.7° for humans versus 4.7° when measured by the algorithm (
Table 2). Scatterplots visually depict human measurements over algorithm measurements (
Figure 4).
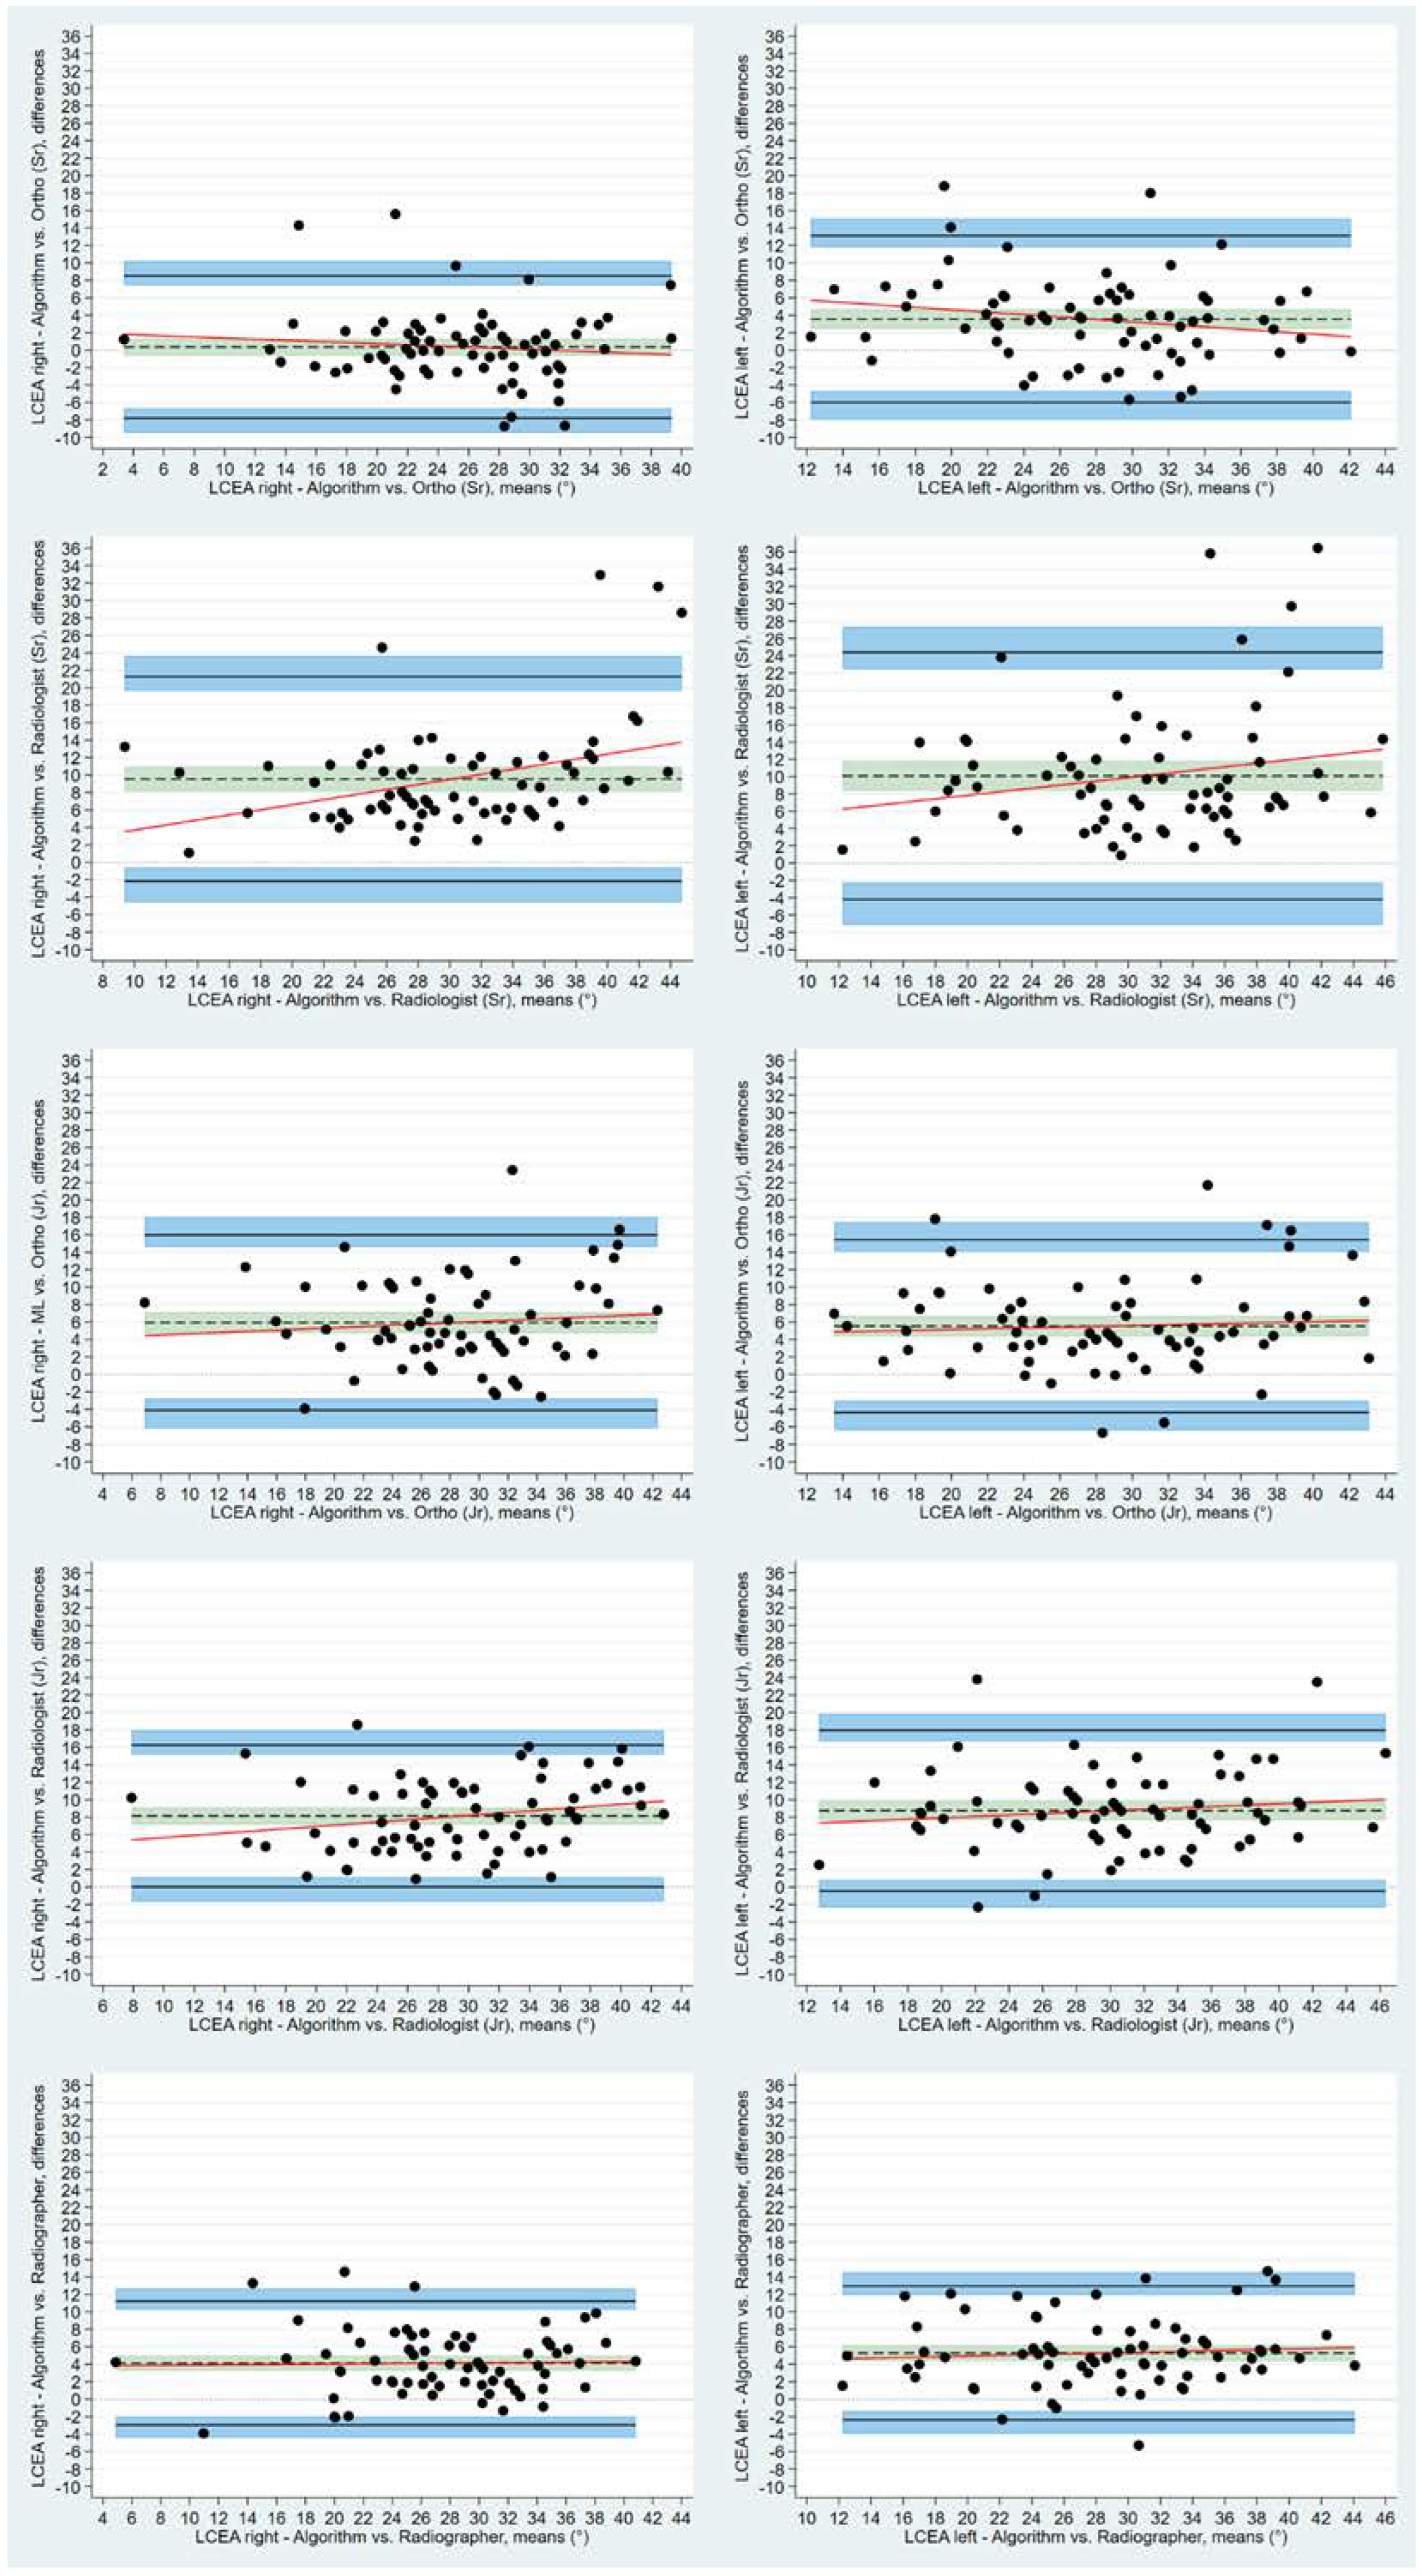
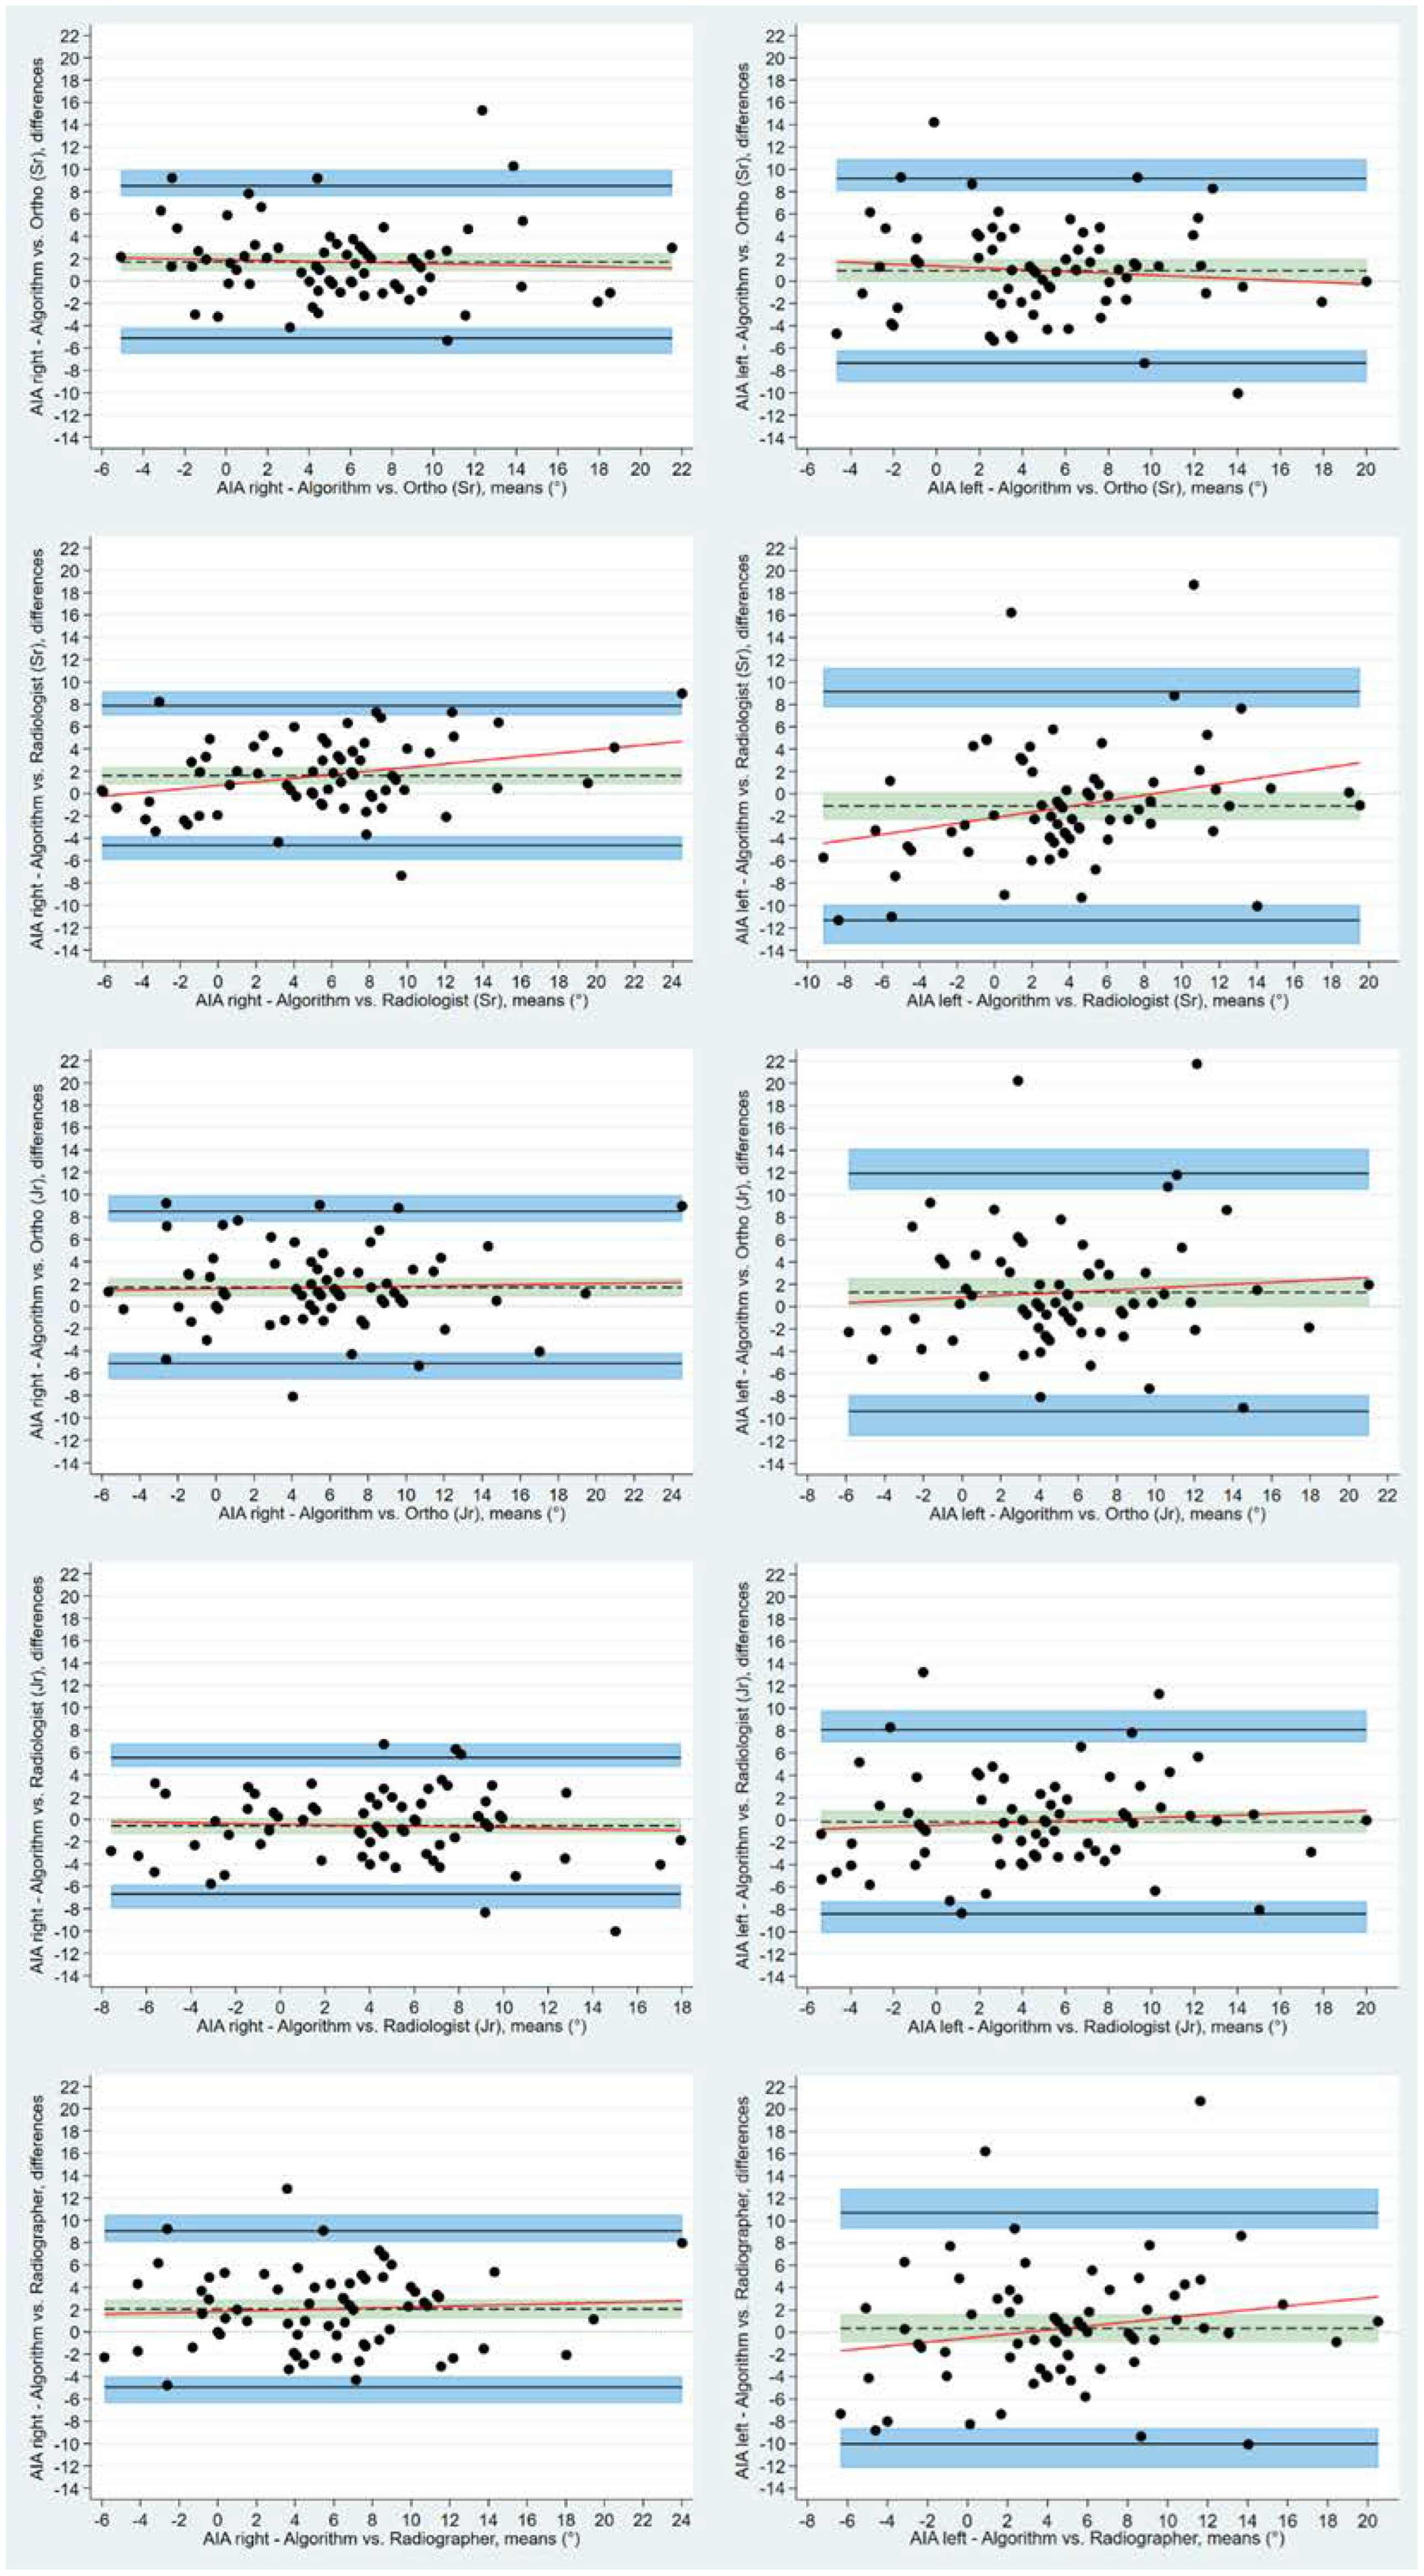
Using the BA LoA analyses, the bias estimate between human readers and algorithm for bilateral LCEA was statistically different from 0, apart from the right LCEA measurements made by the experienced orthopedic surgeon. Mean measured difference between human readers and the algorithm for the right LCEA ranged from 0.37° (95% CI: −0.61 to 1.36) to 9.56° (95% CI: 8.14 to 10.97), for the experienced orthopedic surgeon and the experienced radiologist, respectively. The corresponding values for left LCEA were 3.56° (95% CI: 2.41 to 4.74) and 10.01° (95% CI: 8.37 to 11.82). Bias for AIA measurements displayed a tendency to center around the zero line for all readers ranging from −0.17° (left) to 2.06° (right) as measured by the junior radiologist and the reporting radiographer, respectively (
Figure 5 and
Figure 6). Bland-Altman inter-observer agreement between the algorithm and individual human readers, including the LoA and 95% CI, are presented for LCEA and AIA in
Table 3 and
Table 4.
For the mixed effects model, measurements from all 78 cases and the five human readers were included. For LCEA right, the mixed effect model revealed that patient, reader, and repeated measurement variance were 39.46, 11.88, and 7.44, respectively, indicating the between-patient variance to be the prevailing contributor to variance in data. The RC for a repeated measurement of the same patient by the same human reader was 11.69 (2.77 times √17.80), where the RC increased to 15.09 (2.77 times √ (17.80 + 11.88)) when the same measurement was made on the same patient but by a different human reader. As expected, the between-patient variance was dominant across all measurements. The RCs (same patient, same reader) for AIA was 8.28 and 8.22° for right and left hip, respectively. Corresponding RCs for same patient, different reader increased slightly to 8.85 and 8.52°. In
Table 5, the estimated variances derived from the mixed effect model including 95% CI are shown. In
Table 6, the estimated RCs for between and within reader measurements are presented.
4. Discussion
To the best of our knowledge, this is the first study presenting an algorithm that assesses hip dysplasia in adults in a clinical setting. Radiographic evaluation of the pelvis is commonly the first-line approach in patients suspicious of hip dysplasia, where a set of measurements are used to describe anatomy of the pelvis. Several of those measurements are, however, associated with reader variability [
11].
We evaluated an algorithm that provided highly consistent measurements of LCEA and AIA. Agreements between algorithm and human readers were associated with subjective variability. Our data showed that particularly for LCEA measurements, the human readers appeared to obtain higher values than the algorithm. If this holds true, the algorithm will identify more people with potential dysplasia based on the LCEA than the human readers. This finding correlates with previous studies reporting that hip dysplasia may be underdiagnosed radiologically and that an accurate diagnosis of hip dysplasia can be delayed, at times, for several years and following more contacts to the healthcare system [
4,
5,
21]. Perhaps reader variance combined with a systematic overestimation of particularly the LCEA may, in part, explain why hip dysplasia is under-diagnosed. As a technical note, the algorithm, including identification of the extent of the lateral sourcil, was trained based on annotations made primarily by an orthopedic surgeon, which could explain the higher correlation between the senior surgeon and the algorithm found in the current study. This, however, seems to be a suitable fit considering it is the surgeon that ultimately decides whether an operation is required.
An inherent limitation in the current study is the lack of a ground truth against which the algorithm and human measurements can be compared. Establishing a ground truth is, however, a common challenge in radiographic measurements. The proposed algorithm in the current study was consistent but accuracy remains to be proven. However, the bias between the algorithm and the five human readers were noted to be similar to the between-reader variability estimated by the mixed effects model. High measurement variability between human readers has previously been reported in regard to radiographic measurements used to assess hip dysplasia. Although the human readers in the current study were presented with a protocol defining the measurements, the repeatability coefficient was high from a clinical perspective, i.e., ranging from 12 to 15° for LCEA measurements. Perhaps a consensus meeting with all human readers, prior to the measuring sessions, could have clarified definition of landmarks further; particularly, the extent of the lateral sourcil may have affected inter-observer variance. Moreover, the human readers electronically drew and manually positioned a best-fit circle for the femoral head in the PACS which is also an inherent limitation that may have contributed to inconsistency in LCEA measurements. Although the BA LoA for the right LCEA was narrow for reader 3, no other systematic differences in measurement variability were uncovered. Hence, educational background or experience cannot explain the variation in data.
In conclusion, the newly developed algorithm based on deep learning offered consistent measurement outputs for LCEA and AIA when reading pelvic radiographs. Manual identification of the same landmarks made by five human readers were subject to variance, and the level of agreement between the algorithm and human readers was consequently poor, although a tendency was revealed that the senior orthopedic surgeon agreed the most with the algorithm, particularly for LCEA right measurements.
Clinical Implication
We predict this algorithm as a promising tool in the future with the potential to improve measurement consistency. Potentially, with further development, this algorithm can act as a screening tool within departments of radiology and orthopedic surgery, minimizing delayed diagnosis by identifying abnormal findings on pelvic radiographs suspicious of dysplasia. Considering the vast rising bundle of medical imaging, tools to assist radiologist, physicians and reporting radiographers are needed and integrating locally validated algorithms into clinical practice is essential.
Author Contributions
Conceptualization, J.J., O.G. (Ole Graumann), S.O., M.L. and B.S.B.R.; methodology, J.J., O.G. (Ole Graumann), S.O., M.L. and B.S.B.R.; software, M.L.; formal analysis, J.J., O.G. (Oke Gerke); investigation, J.J. and B.S.B.R.; resources, J.J. and B.S.B.R.; data curation, J.J., M.H.H., C.V., L.B., J.R., L.B.O.; writing—original draft preparation, J.J.; writing—review and editing, J.J., O.G. (Ole Graumann), S.O., O.G. (Oke Gerke), M.L., M.H.H., C.V., L.B., J.R., L.B.O., B.S.B.R.; supervision, B.S.B.R., S.O.; project administration, J.J.; funding acquisition, B.S.B.R. All authors have read and agreed to the published version of the manuscript.
Funding
This research was funded by the EIT Health Digital Sandbox Programme 2020, grant number DS20-12449.
Institutional Review Board Statement
The study was approved by the Danish National Committee on Health Research Ethics (Project-ID: 2103745, 26 March 2021) and registered with the regional health authorities (project-ID: 21/22036, 14 April 2021).
Informed Consent Statement
Patient consent was waived due to the retrospective nature of the study in accordance with the ethical approval from Danish National Committee on Health Research Ethics.
Data Availability Statement
Data from this study were not provided in any public places. The reader and algorithm measurements were stored in the secure RedCap database.
Acknowledgments
The authors acknowledge Henrik Johansen for assistance with installing the algorithm as a Software as a service within the hospital firewall and setting up secure destination for algorithm data.
Conflicts of Interest
M.L. is the Director of Clinical Operations Radiobotics, Copenhagen, Denmark. M.L. contributed to the study design and final approval of the manuscript. M.L. had no access to study data and did not take part in data analysis. The other authors declare no conflict of interest. The funders had no role in the design of the study; in the collection, analyses, or interpretation of data; in the writing of the manuscript; or in the decision to publish the results.
References
- Murphy, N.J.; Eyles, J.P.; Hunter, D.J. Hip Osteoarthritis: Etiopathogenesis and Implications for Management. Adv. Ther. 2016, 33, 1921–1946. [Google Scholar] [CrossRef] [PubMed] [Green Version]
- Pun, S.; Kumar, D.; Lane, N.E. Femoroacetabular impingement. Arthritis Rheumatol. 2015, 67, 17–27. [Google Scholar] [CrossRef] [PubMed] [Green Version]
- Bicanic, G.; Barbaric, K.; Bohacek, I.; Aljinovic, A.; Delimar, D. Current concept in dysplastic hip arthroplasty: Techniques for acetabular and femoral reconstruction. World J. Orthop. 2014, 5, 412–424. [Google Scholar] [CrossRef] [PubMed] [Green Version]
- Nunley, R.M.; Prather, H.; Hunt, D.; Schoenecker, P.L.; Clohisy, J.C. Clinical presentation of symptomatic acetabular dysplasia in skeletally mature patients. J. Bone Jt. Surg. 2011, 93 (Suppl. S2), 17–21. [Google Scholar] [CrossRef] [PubMed] [Green Version]
- Leide, R.; Bohman, A.; Wenger, D.; Overgaard, S.; Tiderius, C.J.; Rogmark, C. Hip dysplasia is not uncommon but frequently overlooked: A cross-sectional study based on radiographic examination of 1870 adults. Acta Orthop. 2021, 92, 575–580. [Google Scholar] [CrossRef]
- Park, H.S.; Jeon, K.; Cho, Y.J.; Kim, S.W.; Lee, S.B.; Choi, G.; Lee, S.; Choi, Y.H.; Cheon, J.E.; Kim, W.S.; et al. Diagnostic Performance of a New Convolutional Neural Network Algorithm for Detecting Developmental Dysplasia of the Hip on Anteroposterior Radiographs. Korean J. Radiol. 2021, 22, 612–623. [Google Scholar] [CrossRef] [PubMed]
- Fraiwan, M.; Al-Kofahi, N.; Ibnian, A.; Hanatleh, O. Detection of developmental dysplasia of the hip in X-ray images using deep transfer learning. BMC Med. Inform. Decis. Mak. 2022, 22, 216. [Google Scholar] [CrossRef]
- Ghasseminia, S.; Seyed Bolouri, S.E.; Dulai, S.; Kernick, S.; Brockley, C.; Rakkunedeth Hareendranathan, A.; Zonoobi, D.; Rao, P.; Jaremko, J.L. Automated diagnosis of hip dysplasia from 3D ultrasound using artificial intelligence: A two-center multi-year study. Inform. Med. Unlocked 2022, 33, 101082. [Google Scholar] [CrossRef]
- Bossuyt, P.M.; Reitsma, J.B.; Bruns, D.E.; Gatsonis, C.A.; Glasziou, P.P.; Irwig, L.; Lijmer, J.G.; Moher, D.; Rennie, D.; de Vet, H.C.; et al. STARD 2015: An Updated List of Essential Items for Reporting Diagnostic Accuracy Studies. Clin. Chem. 2015, 61, 1446–1452. [Google Scholar] [CrossRef] [Green Version]
- Kottner, J.; Audigé, L.; Brorson, S.; Donner, A.; Gajewski, B.J.; Hróbjartsson, A.; Roberts, C.; Shoukri, M.; Streiner, D.L. Guidelines for Reporting Reliability and Agreement Studies (GRRAS) were proposed. J. Clin. Epidemiol. 2011, 64, 96–106. [Google Scholar] [CrossRef]
- Carlisle, J.C.; Zebala, L.P.; Shia, D.S.; Hunt, D.; Morgan, P.M.; Prather, H.; Wright, R.W.; Steger-May, K.; Clohisy, J.C. Reliability of various observers in determining common radiographic parameters of adult hip structural anatomy. Iowa Orthop. J. 2011, 31, 52–58. [Google Scholar] [PubMed]
- Jacobsen, S.; Sonne-Holm, S.; Lund, B.; Søballe, K.; Kiaer, T.; Rovsing, H.; Monrad, H. Pelvic orientation and assessment of hip dysplasia in adults. Acta Orthop. Scand. 2004, 75, 721–729. [Google Scholar] [CrossRef] [PubMed]
- He, K.; Zhang, X.; Ren, S.; Sun, J. Deep Residual Learning for Image Recognition. arXiv 2015, arXiv:1512.03385. [Google Scholar] [CrossRef]
- Mascarenhas, V.V.; Castro, M.O.; Rego, P.A.; Sutter, R.; Sconfienza, L.M.; Kassarjian, A.; Schmaranzer, F.; Ayeni, O.R.; Dietrich, T.J.; Robinson, P.; et al. The Lisbon Agreement on Femoroacetabular Impingement Imaging-part 1: Overview. Eur. Radiol. 2020, 30, 5281–5297. [Google Scholar] [CrossRef] [PubMed]
- Hanson, J.A.; Kapron, A.L.; Swenson, K.M.; Maak, T.G.; Peters, C.L.; Aoki, S.K. Discrepancies in measuring acetabular coverage: Revisiting the anterior and lateral center edge angles. J. Hip Preserv. Surg. 2015, 2, 280–286. [Google Scholar] [CrossRef] [Green Version]
- Erenstein, H.G.; Browne, D.; Curtin, S.; Dwyer, R.S.; Higgins, R.N.; Hommel, S.F.; Menzinga, J.; Pires Jorge, J.A.; Sauty, M.; de Vries, G.; et al. The validity and reliability of the exposure index as a metric for estimating the radiation dose to the patient. Radiography 2020, 26 (Suppl. S2), S94–S99. [Google Scholar] [CrossRef]
- Bland, J.M.; Altman, D.G. Measuring agreement in method comparison studies. Stat. Methods Med. Res. 1999, 8, 135–160. [Google Scholar] [CrossRef]
- Carkeet, A. Exact parametric confidence intervals for Bland-Altman limits of agreement. Optom. Vis. Sci. 2015, 92, e71–e80. [Google Scholar] [CrossRef] [Green Version]
- Gerke, O.; Vilstrup, M.H.; Segtnan, E.A.; Halekoh, U.; Høilund-Carlsen, P.F. How to assess intra- and inter-observer agreement with quantitative PET using variance component analysis: A proposal for standardisation. BMC Med. Imaging 2016, 16, 54. [Google Scholar] [CrossRef] [Green Version]
- Lu, M.J.; Zhong, W.H.; Liu, Y.X.; Miao, H.Z.; Li, Y.C.; Ji, M.H. Sample Size for Assessing Agreement between Two Methods of Measurement by Bland-Altman Method. Int. J. Biostat. 2016, 12. [Google Scholar] [CrossRef]
- Ellsworth, B.K.; Sink, E.L.; Doyle, S.M. Adolescent hip dysplasia: What are the symptoms and how to diagnose it. Curr. Opin. Pediatr. 2021, 33, 65–73. [Google Scholar] [CrossRef] [PubMed]
Figure 1.
Flow-chart describing the screening process according to inclusion/exclusion criteria. In total, 98 pelvic radiographs were screened until the desired sample of 78 radiographs was achieved.
Figure 1.
Flow-chart describing the screening process according to inclusion/exclusion criteria. In total, 98 pelvic radiographs were screened until the desired sample of 78 radiographs was achieved.
Figure 2.
Pelvic radiograph depicting the horizontal reference line (pink line) through the most inferior points on the ischial tuberosities (red dots) and blue circles encompassing both femoral heads. The lateral center edge angel is the angle between two lines from the center of the femoral head (stabled blue lines), respectively, a vertical line perpendicular to the reference line and a line connecting the center of the femoral head to the lateral sourcil of the acetabulum. The acetabular index angle is the angle between the horizontal reference line and a line (solid blue line) connecting the medial and lateral sourcils of the acetabulum. The foramen width is the length of a line across the widest part of the obturator foramen (Yellow lines) parallel to the horizontal reference line.
Figure 3.
Algorithm flowchart.
Figure 3.
Algorithm flowchart.
Figure 4.
Scatter plots with human measurements of LCEA and AIA over algorithm measurements. LCEA; Lateral center edge angle, AIA; Acetabular index angle. Scatter plots in the top row line (LCEA) depict a tendency that human readers measure the LCEA at a higher value than the algorithm, although the senior orthopedic surgeon agree the most with the algorithm (green dots seen in close proximity to the red identity line).
Figure 5.
Bland-Altman plots with Limits of Agreement and respective 95% CI demonstrating agreement between individual human readers and algorithm for lateral center edge angles. Differences between measurements are plotted against the mean of the measurements. Solid black lines depict upper and lower limits of agreement. Shaded blue areas depict the 95% confidence intervals. Dotted black lines are the mean measured differences with the shaded green areas illustrating the 95% confidence intervals.
Figure 6.
Bland-Altman plots with Limits of Agreement and respective 95% CI depicting agreement between human readers and algorithm for acetabular index angle. Differences between measurements are plotted against the mean of the measurements. Solid black lines depict upper and lower limits of agreement. Shaded blue areas depict the 95% confidence intervals. Dotted black lines are the mean measured differences with the shaded green areas illustrating the 95% confidence intervals.
Table 1.
First read by algorithm (mean, SD, range, 1st and 3rd percentiles) and differences (Diff) between 1st and 2nd algorithm read. (n = 71).
Table 1.
First read by algorithm (mean, SD, range, 1st and 3rd percentiles) and differences (Diff) between 1st and 2nd algorithm read. (n = 71).
| | Mean
(SD) | Mean
(SD) Diff | Range [min; ma×] | Range Diff [min; ma×] | Q1 | Q1Diff | Q3 | Q3Diff |
|---|
| LCEARight | 25.43 (6.96) | 3.97 × 10⁻¹⁴ (4.9 × 10⁻¹⁴) | [2.77; 38.65] | [0; 0] | 21.10 | 0 | 31.16 | 9.95 × 10⁻¹⁴ |
| LCEALeft | 25.91 (7.51) | 4.78 × 10⁻¹⁴ (5.03 × 10⁻¹⁴) | [10.03; 42.16] | [0; 1.03 × 10⁻¹²] | 20.84 | 0 | 31.33 | 9.95 × 10⁻¹⁴ |
| AIARight | 4.69 (5.67) | 4.8 × 10⁻¹⁵ (1.72 × 10⁻¹⁴) | [−7.22; 20.03] | [−1.02 × 10⁻¹⁴; 9.95 × 10⁻¹⁴] | 0.23 | 0 | 8.29 | 9.77 × 10⁻¹⁵ |
| AIALeft | 4.03 (5.40) | 8.14 × 10⁻¹⁵ (2.58 × 10⁻¹⁴) | [−6.06; 15.55] | [−1.02 × 10⁻¹⁴; −9.95 × 10⁻¹⁴] | −0.23 | 0 | 8.11 | 8.88 × 10⁻¹⁴ |
Table 2.
Mean measurements of LCEA and AIA including SD and range for all readers and Algorithm (A) (n = 71).
Table 2.
Mean measurements of LCEA and AIA including SD and range for all readers and Algorithm (A) (n = 71).
| | LCEA (SD) [Range] | AIA (SD) [Range] |
|---|
| Right | Left | Right | Left |
|---|
| O1 | 29.5 (7.0) [7 to 43] | 31.2 (7.8) [11 to 48] | 6.7 (5.9) [−7 to 28] | 5.0 (6.6) [−10 to 22] |
| O2 | 31.4 (7.4) [11 to 48] | 31.4 (7.8) [17 to 49] | 6.4 (5.8) [−5 to 29] | 6.0 (6.1) [−7 to 23] |
| O3 | 25.8 (6.6) [4 to 43] | 29.5 (6.6) [13 to 43] | 6.4 (5.5) [−4 to 23] | 5.6 (5.3) [−7 to 20] |
| O4 | 33.6 (7.8) [13 to 48] | 34.7 (8.1) [14 to 54] | 4.1 (5.5) [−9 to 17] | 4.5 (6.0) [−8 to 20] |
| O5 | 35.0 (9.0) [14 to 59] | 36.0 (8.9) [13 to 60] | 6.3 (6.6) [−6 to 29] | 3.6 (7.0) [−14 to 20] |
| A | 25.4 (7.0) [3 to 39] | 25.9 (7.5) [10 to 42] | 4.7 (5.7) [−7 to 20] | 4.0 (5.4) [−6 to 16] |
Table 3.
Lateral center edge angle. Bland Altman limits of agreement and bias (mean and SD). Agreement between algorithm and individual human readers. (n = 71).
Table 3.
Lateral center edge angle. Bland Altman limits of agreement and bias (mean and SD). Agreement between algorithm and individual human readers. (n = 71).
| | | Bias
Mean (SD) | Bias
95% CI | Limits of Agreement | Lower Limit of Agreement
95% CI | Upper Limit of Agreement
95% CI |
|---|
| LCEAright | O1 | 4.13 (3.62) | 3.28 to 4.99 | −2.95 to 11.22 | −4.43 to −1.99 | 10.25 to 12.69 |
| | O2 | 5.93 (5.12) | 4.72 to 7.15 | −4.10 to 15.97 | −6.19 to −2.73 | 14.60 to 18.05 |
| | O3 | 0.37 (4.16) | −0.61 to 1.36 | −7.79 to 8.53 | −9.48 to −6.67 | 7.42 to 10.23 |
| | O4 | 8.15 (4.14) | 7.17 to 9.13 | 0.02 to 16.27 | −1.66 to 1.13 | 15.16 to 17.96 |
| | O5 | 9.56 (5.98) | 8.14 to 10.97 | −2.16 to 21.27 | −4.59 to −0.56 | 19.67 to 23.70 |
| LCEAleft | O1 | 5.29 (3.91) | 4.37 to 6.22 | −2.37 to 12.95 | −3.96 to −1.32 | 11.90 to 14.54 |
| | O2 | 5.53 (5.04) | 4.34 to 6.73 | −4.36 to 15.42 | −6.41 to −3.01 | 14.07 to 17.47 |
| | O3 | 3.56 (4.87) | 2.41 to 4.74 | −5.99 to 13.10 | −7.97 to −4.68 | 11.80 to 15.09 |
| | O4 | 8.76 (4.70) | 7.65 to 9.87 | −0.45 to 17.96 | −2.36 to 0.81 | 16.70 to 19.87 |
| | O5 | 10.01 (7.29) | 8.37 to 11.82 | −4.19 to 24.38 | −7.16 to −2.24 | 22.43 to 27.35 |
Table 4.
Acetabular index angle. Bland Altman limits of agreement and bias (mean and SD). Agreement between algorithm and individual human readers. (n = 71).
Table 4.
Acetabular index angle. Bland Altman limits of agreement and bias (mean and SD). Agreement between algorithm and individual human readers. (n = 71).
| | | Bias
Mean (SD) | Bias
95% CI | Limits of Agreement | Lower Limit of Agreement
95% CI | Upper Limit of Agreement
95% CI |
|---|
| AIAright | O1 | 2.06 (3.57) | 1.21 to 2.90 | −4.94 to 9.05 | −6.39 to −3.98 | 8.10 to 10.50 |
| | O2 | 1.69 (3.48) | 0.87 to 2.51 | −5.13 to 8.51 | −6.55 to −4.20 | 7.58 to 9.93 |
| | O3 | 1.70 (3.48) | 0.88 to 2.53 | −5.11 to 8.53 | −6.54 to −4.19 | 7.59 to 9.94 |
| | O4 | −0.58 (3.12) | −1.32 to 0.16 | −6.69 to 5.5 | −7.96 to −5.86 | 4.70 to 6.80 |
| | O5 | 1.62 (3.19) | 0.86 to 2.37 | −4.63 to 7.87 | −5.93 to −3.78 | 7.02 to 9.17 |
| AIAleft | O1 | 0.35 (5.29) | −0.90 to 1.60 | −10.01 to 10.72 | −12.17 to −8.60 | 9.30 to 12.87 |
| | O2 | 1.28 (5.44) | −0.01 to 2.57 | −9.37 to 11.93 | −11.58 to −7.92 | 10.48 to 14.15 |
| | O3 | 0.93 (4.22) | −0.07 to 1.93 | −7.34 to 9.19 | −9.05 to −6.21 | 8.06 to 10.91 |
| | O4 | −0.17 (4.21) | −1.17 to 0.83 | −8.42 to 8.08 | −10.13 to −7.29 | 6.95 to 9.79 |
| | O5 | −1.09 (5.22) | −2.32 to 0.15 | −11.32 to 9.15 | −13.45 to −9.92 | 7.75 to 11.28 |
Table 5.
Estimated variances derived from the linear effects model. Five human readers, LCEA and AIA. (n = 78).
Table 5.
Estimated variances derived from the linear effects model. Five human readers, LCEA and AIA. (n = 78).
| | Component | Estimate | 95 % CI | p-Value |
|---|
| LCEARight | | | | |
| | Constant | 26.03 | 19.25 to 32.82 | <0.0001 |
| | Patient variance | 39.46 | 27.80 to 56.01 | |
| | Reader variance | 11.88 | 2.9 to 48.62 | |
| | Repeated measure variance | 7.44 | 0.87 to 63.49 | |
| | Residual variance | 17.80 | 15.36 to 20.62 | |
| LCEALeft | | | | |
| | Constant | 28.55 | 21.70 to 35.39 | <0.0001 |
| | Patient variance | 46.32 | 32.77 to 65.49 | |
| | Reader variance | 7.73 | 1.86 to 32.14 | |
| | Repeated measure variance | 7.16 | 0.82 to 62.39 | |
| | Residual variance | 19.08 | 16.47 to 22.10 | |
| AIARight | | | | |
| | Constant | 4.84 | 0.66 to 9.02 | 0.023 |
| | Patient variance | 25.36 | 17.97 to 35.79 | |
| | Reader variance | 1.27 | 0.29 to 5.70 | |
| | Repeated measure variance | 1.25 | N/A | |
| | Residual variance | 8.93 | 7.71 to 10.34 | |
| AIALeft | | | | |
| | Constant | 3.27 | −1.40 to 7.93 | 0.170 |
| | Patient variance | 33.39 | 23.82 to 46.82 | |
| | Reader variance | 0.65 | 0.13 to 3.23 | |
| | Repeated measure variance | 4.89 | N/A | |
| | Residual variance | 8.80 | 7.60 to 10.20 | |
| | Residual variance | 111.37 | 96.18 to 128.97 | |
Table 6.
Estimated repeatability coefficients for between and within reader measurements based on the linear effects model. Five human readers, LCEA and AIA. (n = 78).
Table 6.
Estimated repeatability coefficients for between and within reader measurements based on the linear effects model. Five human readers, LCEA and AIA. (n = 78).
| | Repeatability Coefficient |
|---|
| | Same Patient, Same Reader | Same Patient, Different Reader |
|---|
| LCEARight | 11.69 | 15.09 |
| LCEALeft | 12.10 | 14.34 |
| AIARight | 8.28 | 8.85 |
| AIALeft | 8.22 | 8.52 |
| Publisher’s Note: MDPI stays neutral with regard to jurisdictional claims in published maps and institutional affiliations. |
© 2022 by the authors. Licensee MDPI, Basel, Switzerland. This article is an open access article distributed under the terms and conditions of the Creative Commons Attribution (CC BY) license (https://creativecommons.org/licenses/by/4.0/).


 ,
, 


