Article

Prediction of Surface Roughness Using Machine Learning Approach in MQL Turning of AISI 304 Steel by Varying Nanoparticle Size in the Cutting Fluid

by
Vineet Dubey
1,*,
Anuj Kumar Sharma
1 and
Danil Yurievich Pimenov
2
1
Center for Advanced Studies, Dr. A.P.J. Abdul Kalam Technical University, Lucknow 226031, India
2
Department of Automated Mechanical Engineering, South Ural State University, Lenin Prosp, 76, 454080 Chelyabinsk, Russia
*
Author to whom correspondence should be addressed.
Submission received: 29 March 2022 / Revised: 22 April 2022 / Accepted: 28 April 2022 / Published: 2 May 2022

Abstract

:
Surface roughness is considered as an important measuring parameter in the machining industry that aids in ensuring the quality of the finished product. In turning operations, the tool and workpiece contact develop friction and cause heat generation, which in turn affects the machined surface. The use of cutting fluid in the machining zone helps to minimize the heat generation. In this paper, minimum quantity lubrication is used in turning of AISI 304 steel for determining the surface roughness. The cutting fluid is enriched with alumina nanoparticles of two different average particle sizes of 30 and 40 nm. Among the input parameters chosen for investigation are cutting speed, depth of cut, feed rate, and nanoparticle concentration. The response surface approach is used in the design of the experiment (RSM). For the purpose of estimating the surface roughness and comparing the experimental value to the predicted values, three machine learning-based models, including linear regression (LR), random forest (RF), and support vector machine (SVM), are utilized in addition. For the purpose of evaluating the accuracy of the predicted values, the coefficient of determination (R2), mean absolute percentage error (MAPE), and mean square error (MSE) were all used. Random forest outperformed the other two models in both the particle sizes of 30 and 40 nm, with R-squared of 0.8176 and 0.7231, respectively. Thus, this study provides a novel approach in predicting the surface roughness by varying the particle size in the cutting fluid using machine learning, which can save time and wastage of material and energy.

1. Introduction

In turning operations, surface roughness plays a vital role in the product creation, and has a significant effect on machining cost as it is measured as an index of quality [1]. The surface finish of any product is primarily affected by tool geometry, cutting speed, material of the workpiece, depth of cut, feed rate and other factors such as machine dynamics, cutting temperature and tool wear. The small deviation in the above mentioned factors may cause a considerable effect on the machined surface. Therefore, it becomes necessary to select the optimal settings for ensuring a desired surface finish. In machining industry, the operators generally employ the ‘hit and trial’ method for setting up of machining settings to achieve favourable surface finish of the product. This approach of using ‘hit and trial’ is not so efficient and is time consuming along with producing wastage of material in getting the intended result [2]. The advent of machine learning models poses a solution to address this issue, by altering the machining settings before the actual operation is performed. The use of cutting fluid ensures minimization of cutting temperature and assists in proper lubrication, resulting in improved surface finish.
Elangovan et al. [3] attempted to predict surface roughness by acquiring the vibration signals in turning. Their study revealed that feature reduction by applying principle component analysis in a machine learning approach resulted in low computational effort and higher predictability. Raza et al. [4] performed analysis on a 30NiCrMoV14 alloy for surface evolution in turning operation. Feed rate proved to be the significant parameter and surface quality of 0.137 µm was achieved at 0.19 mm/rev feed. Dubey et al. [5] performed turning on steel using nanofluid-enriched cutting fluid and studied its effect on surface roughness and cutting temperature. When compared to mono nanofluid, hybrid nanofluid resulted in a reduction of 31% in surface roughness. Sharma et al. [6] reviewed the use of different conventional and nanofluid-based cutting fluids using minimum quantity lubrication. The effect of incorporating nanofluid in cutting fluid was explored in terms of reduction of cutting force, surface finish and tool wear. Abbas et al. [7] investigated the sustainability assessment of AISI 1045 stainless steel associated with power consumption and surface finish. The turning was performed in dry, flood and minimum quantity lubrication environments, among which MQL turning showed better characteristics with weighted sustainability index of 0.7, providing lower power consumption and surface finish. Mia et al. [8] used the Pugh matrix, an environmental technique for establishing sustainability model for turning of hardened steel. The comparative study between compressed air enriched with solid lubricant and MQL suggested that MQL assisted in cleaner production and proved to be environmentally friendly. Sampaio et al. [9] analyzed the wear of PCBN tool, chip morphology and surface roughness in hard turning of 1045 steel. The cooling effect produced by MQL resulted in reduction of crater wear and cutting forces. Gupta et al. [10] investigated 2205 duplex steel and performed turning with dry and MQL environments and studied the influence on machining tribological characteristics by varying the nozzle angle. The application of dual-jet MQL resulted in lower power consumption along with tool wear. Bonfa et al. [11] experimented on AISI D6 steel and analyzed the surface roughness by applying biodegradable cutting fluid in three directions. The results revealed that at the feed rate of 0.05 mm/rev, the lowest surface roughness was achieved when MQL was applied at the tool flank face. Khanna et al. [12] adopted eight different cutting fluid methodologies in turning of precipitated hardened stainless steel to analyze the energy consumption. In the analysis, nine different combinations of input parameters were used. In the comparative study, the lowest energy consumption was encountered in hybrid nanoparticles immersed in electrostatic minimum quantity lubrication, which can be attributed to the effectiveness of penetration of the oil mist at the cutting zone. Dubey et al. [13] reviewed various cooling methodologies for machining. The application of MQL for reduction in cutting force, surface roughness and tool wear was suggested to be better in comparison to other techniques. Sizemore et al. [14] applied machine learning techniques for predicting surface roughness in diamond turning. The predictive capability of artificial neural network (ANN) and four different machine learning (ML) models, namely decision trees, random forest, AdaBoost and support vector machines (SVM) was assessed during diamond turning of both copper and germanium. The ANN model gave better prediction in comparison to ML models with minimum errors. Reddy et al. [15] performed turning on aluminium alloy using a carbide tool. In order to judge the efficiency of the model for predicting surface roughness, percentage deviation was used. The results revealed that the artificial neural network predicted with higher accuracy compared to a multiple regression model.
Eser et al. [16] experimented on aluminium alloy in dry condition. The predicted models using RSM and ANN were developed and compared in terms of R2, MEP and RMSE. The estimated data from the developed models were close to the data obtained through experimental results. The R2 obtained through RSM was of higher value than that of ANN, which proved the stability of the RSM model over ANN.
Manjunath et al. [17] reviewed the prediction and monitoring of surface roughness in the case of ultraprecision machining. The different sensors which are used for collecting the data were discussed, such as accelerometer, strain gauge sensor, piezoelectric transducer and acoustic emission. The pros and cons of different machine learning models were demonstrated. Ross et al. [18] used MQL and cryogenic cooling and compared the result with hybrid cryo-MQL cooling in milling of Nimonic 80A alloy for analysing the surface roughness. The application of a hybrid lubrication approach on the workpiece resulted in decrease of the grain size due to lowering of the friction at the cutting zone and hence producing a chilling effect. Alajmi and Almeshal [19] utilized the ANFIS-QPSO method in prediction of surface roughness of AISI 304 stainless steel. A comparison between dry turning and cryogenic turning was performed. The accuracy of prediction was judged by indicators such as R2, RMSE and MAPE. In the case of dry turning, the MAPE between the predicted and experimented value was recorded as 4.95%, while in the case of cryogenic turning 5.15% was reported. Pimenov et al. [20] reviewed the use of artificial intelligence in tool condition monitoring. ANN was suggested as the widely used prediction technique for wear evaluation owing to the non-linear behaviour of the tool’s wear. Pandey et al. [21] studied the tribological behaviour of cutting fluid enriched with nanofluid. The characterization and validation of the wear characteristic of cutting tool was discussed using pin on disk tribometer. The use of nanofluid in machining led to decrease in surface roughness and tool wear. Abbas et al. [22] used three different modes of lubrication i.e., dry, flood and MQL, for turning of 1045 steel. In order to optimize the cutting parameters, three multi objective optimization models were incorporated. Among the three, MQL provided better result and the optimal parameters achieved were 147 m/min cutting speed, 0.28 mm depth of cut and feed rate of 0.06 mm/rev. Khanna et al. [23] performed a comparative study on machining performance and life cycle assessment in turning of Ti-6Al-4V ELI. In the case of cutting force, cryogenic machining outperformed the MQL and flood machining, while in the case of tool life, MQL gave enhanced results. MQL machining led to lower impact on ecology in respect to flood lubrication. Dubey et al. [24] experimented on AISI 304 steel using a tungsten carbide tool and applied machine learning models to predict the cutting forces. Linear regression and random forest gave better prediction of cutting force than support vector machines in case of predicting the cutting forces. Sap et al. [25] carried out experiments on milling in dry, MQL and cryogenic cooling environments on a copper-based composite. The study revealed that cryogenic machining resulted in improvement of tribological properties by reducing cutting temperature and MQL resulted in enhanced surface characteristics. Pereira et al. [26] used CO2 as internal tool coolant for cryogenic cooling in the case of milling operation. The study is in line with the effective utilization of CO2 for minimizing its effect on ecology. CFD modelling was done to simulate the process using CO2 as internal and external coolant and the results were compared with experimental studies. The application with internal tool coolant resulted in decrease of cutting temperature by 40% in comparison to external coolant. Magalhaes et al. [27] examined the flank wear and surface integrity in turning of 1045 steel for uncoated cermets. As per the finite element analysis, the temperature of 860 °C was attained at highest feed and cutting speed. Abrasive wear contributed significantly in the case of tool wear. The use of uncoated cermet in dry turning of AISI 1045 proved to be viable while taking into consideration surface quality, tool life and microstructure. Abrao et al. [28] evaluated the performance of adding graphene nano platelets in the cutting fluid and applying it on SAE 52100 hardened steel using MQL in grinding operation. The use of graphene multilayers yielded smaller value of surface roughness and micro hardness when compared with MQL with solid particles in the cutting fluid. Baldin et al. [29] investigated tool life and wear mechanism on a titanium-coated carbide tool in end milling of AISI 1045 steel by applying vegetable oil, mineral oil and a cutting fluid enriched with graphene nanoplatelets. The removal of coating cutting insert was observed in all cutting conditions due to the action of temperature and predominance of adhesive wear. The addition of graphene sheets aided in enhancing the lubrication properties. Pereira et al. [30] analyzed the technical and economic viability of different lubricants in turning of AISI 304 steel. The combination of cryogenic and MQL is proposed as best among the other different techniques, as Cryo-MQL CO2 resulted in exceeding the tool life by 30%. In another study, Pereira et al. [31] performed rheological as well as tribological tests for characterizing four biodegradable oils: castor oil, sunflower oil, high oleic sunflower oil and ECO-350 oil were analyzed and compared to commercial available canola oil. As per the characterization and life cycle assessment analysis, high oleic sunflower oil is feasible for eco-friendly machining when compared with other oils. Camli et al. [32] experimented on ER7 steel used in train wheel applications using dry, MQL and nanofluid-assisted MQL environments. The optimal parameters for performing experiments were cutting speed of 300 m/min and feed rate of 0.15 mm/rev. The application of MQL and nano-MQL cooling resulted in lowering of surface roughness by 24% and 34%, respectively. Korkmaz et al. [33] investigated on Nimonic 80A by varying the nozzle orientation under dry, flood and MQL environments. The improvement in tool wear was 60% in comparison to dry turning and major mechanisms responsible for the wear were abrasion and adhesion. Danish et al. [34] incorporated a hybrid approach of using cryogenic lubrication and minimum quantity lubrication in turning of Inconel 718 and analyzed tool wear, surface roughness and chip morphology. The improvement in surface topology and reduced surface finish was obtained at medium setting of cutting speed. The lubrication at machining zone using MQL and cryogenic technique was employed. The surface roughness achieved in the case of MQL was lower, as MQL developed a protective film over the machined workpiece. Tasdemir et al. [35] investigated the effect of tool geometry on the surface roughness in dry turning of AISI 1040 steel. The experimented results were compared with ANN with the statistical t test having no significant difference. Cica et al. [36] used three machine learning algorithms, namely polynomial regression (PR), SVR and Gaussian process regression (GPR) for predicting cutting force and cutting power in turning of AISI 1045 under minimum quantity lubrication and high pressure coolant cutting environments. The optimal process parameters in both the lubrication environments were 210 m/min cutting speed, 1.5 for depth of cut and 0.224 mm/rev feed rate. Lin et al. [37] used a deep learning approach for determining the surface roughness by recording the signals of vibrations. Three predictive models, namely FFT-DNN, 1-D CNN, FFT-LSTM, were utilized for training and predicting he performance. The combination of vibration signals along with the 1D CNN and FFT-LSTM model is recommended in order to predict surface roughness. Dubey et al. [38] discussed different temperature measuring techniques at the machining zone in different cutting environments. The use of both direct and indirect methods of temperature measurement were reviewed. Among the different techniques, use of thermocouple in determining the temperature gave efficient results. Aggogeri et al. [39] reviewed the various advancements in application of machine learning in different machining processes. It was revealed that usage of smart equipment, various sensors that aid in connecting the machines, acting as boosters, drives machine learning applications. Gupta et al. [40] performed finite element modelling and compared results with experimental findings, for calculating cutting force and cutting temperature in turning of AA2024-T351 alloy in a dry environment and using liquid nitrogen and CO2 lubrication. The predicted results are in close agreement with those of experimental results. The cryogenic cooling led to reduced cutting forces as built up edges were minimized. Chen et al. [41] proposed a back propagation neural network (BPNN) for the prediction of surface roughness in end milling of aluminium. The smaller feed rate along with smaller depth of cut with higher spindle speed yielded a better surface finish. A comparative study between BPNN and linear regression was performed, in which the accuracies achieved for prediction were 99.17% and 97.88%, respectively. As per the accuracy, BPNN model predicted surface roughness effectively. Chen et al. [42] investigated the effect of cutting force and tool vibration on surface roughness and attempted to predict it using a nested artificial neural network. The dry turning was performed on a CNC lathe using an uncoated carbide tool on titanium alloy. Feed rate proved to be the important parameter affecting surface roughness. The prediction accuracy of ANN was better than that of RSM and linear regression.
From the literature, it can be inferred that prediction of cutting force, cutting power, surface roughness and tool wear has been attempted by different researchers on different materials in dry turning or cryogenic turning using different machine learning algorithms. The prediction of surface roughness in a nanoparticle-enriched cutting fluid environment is very limited. The MQL approach has been undertaken by various researchers using nanofluid, but the variation in particle size in the cutting fluid and its prediction using machine learning is a newer approach. In this paper, alumina nanoparticles of two different average particle size i.e., 30 and 40 nm, are used and turning is performed with two different cutting fluids of individual particle sizes. The aim of the study is to analyze the effect of varying the particle size in the cutting fluid and assessing its effect on surface finish of AISI 304 steel. Furthermore, the prediction of surface finish is carried out and compared with that of the experimental values using three different machine learning algorithm, namely linear regression, random forest and support vector machines. In order to develop the models, the tool used in this paper is jupyter notebook bundled with Anaconda software package version 1.7.2 and the programming language used is Python 3.0.

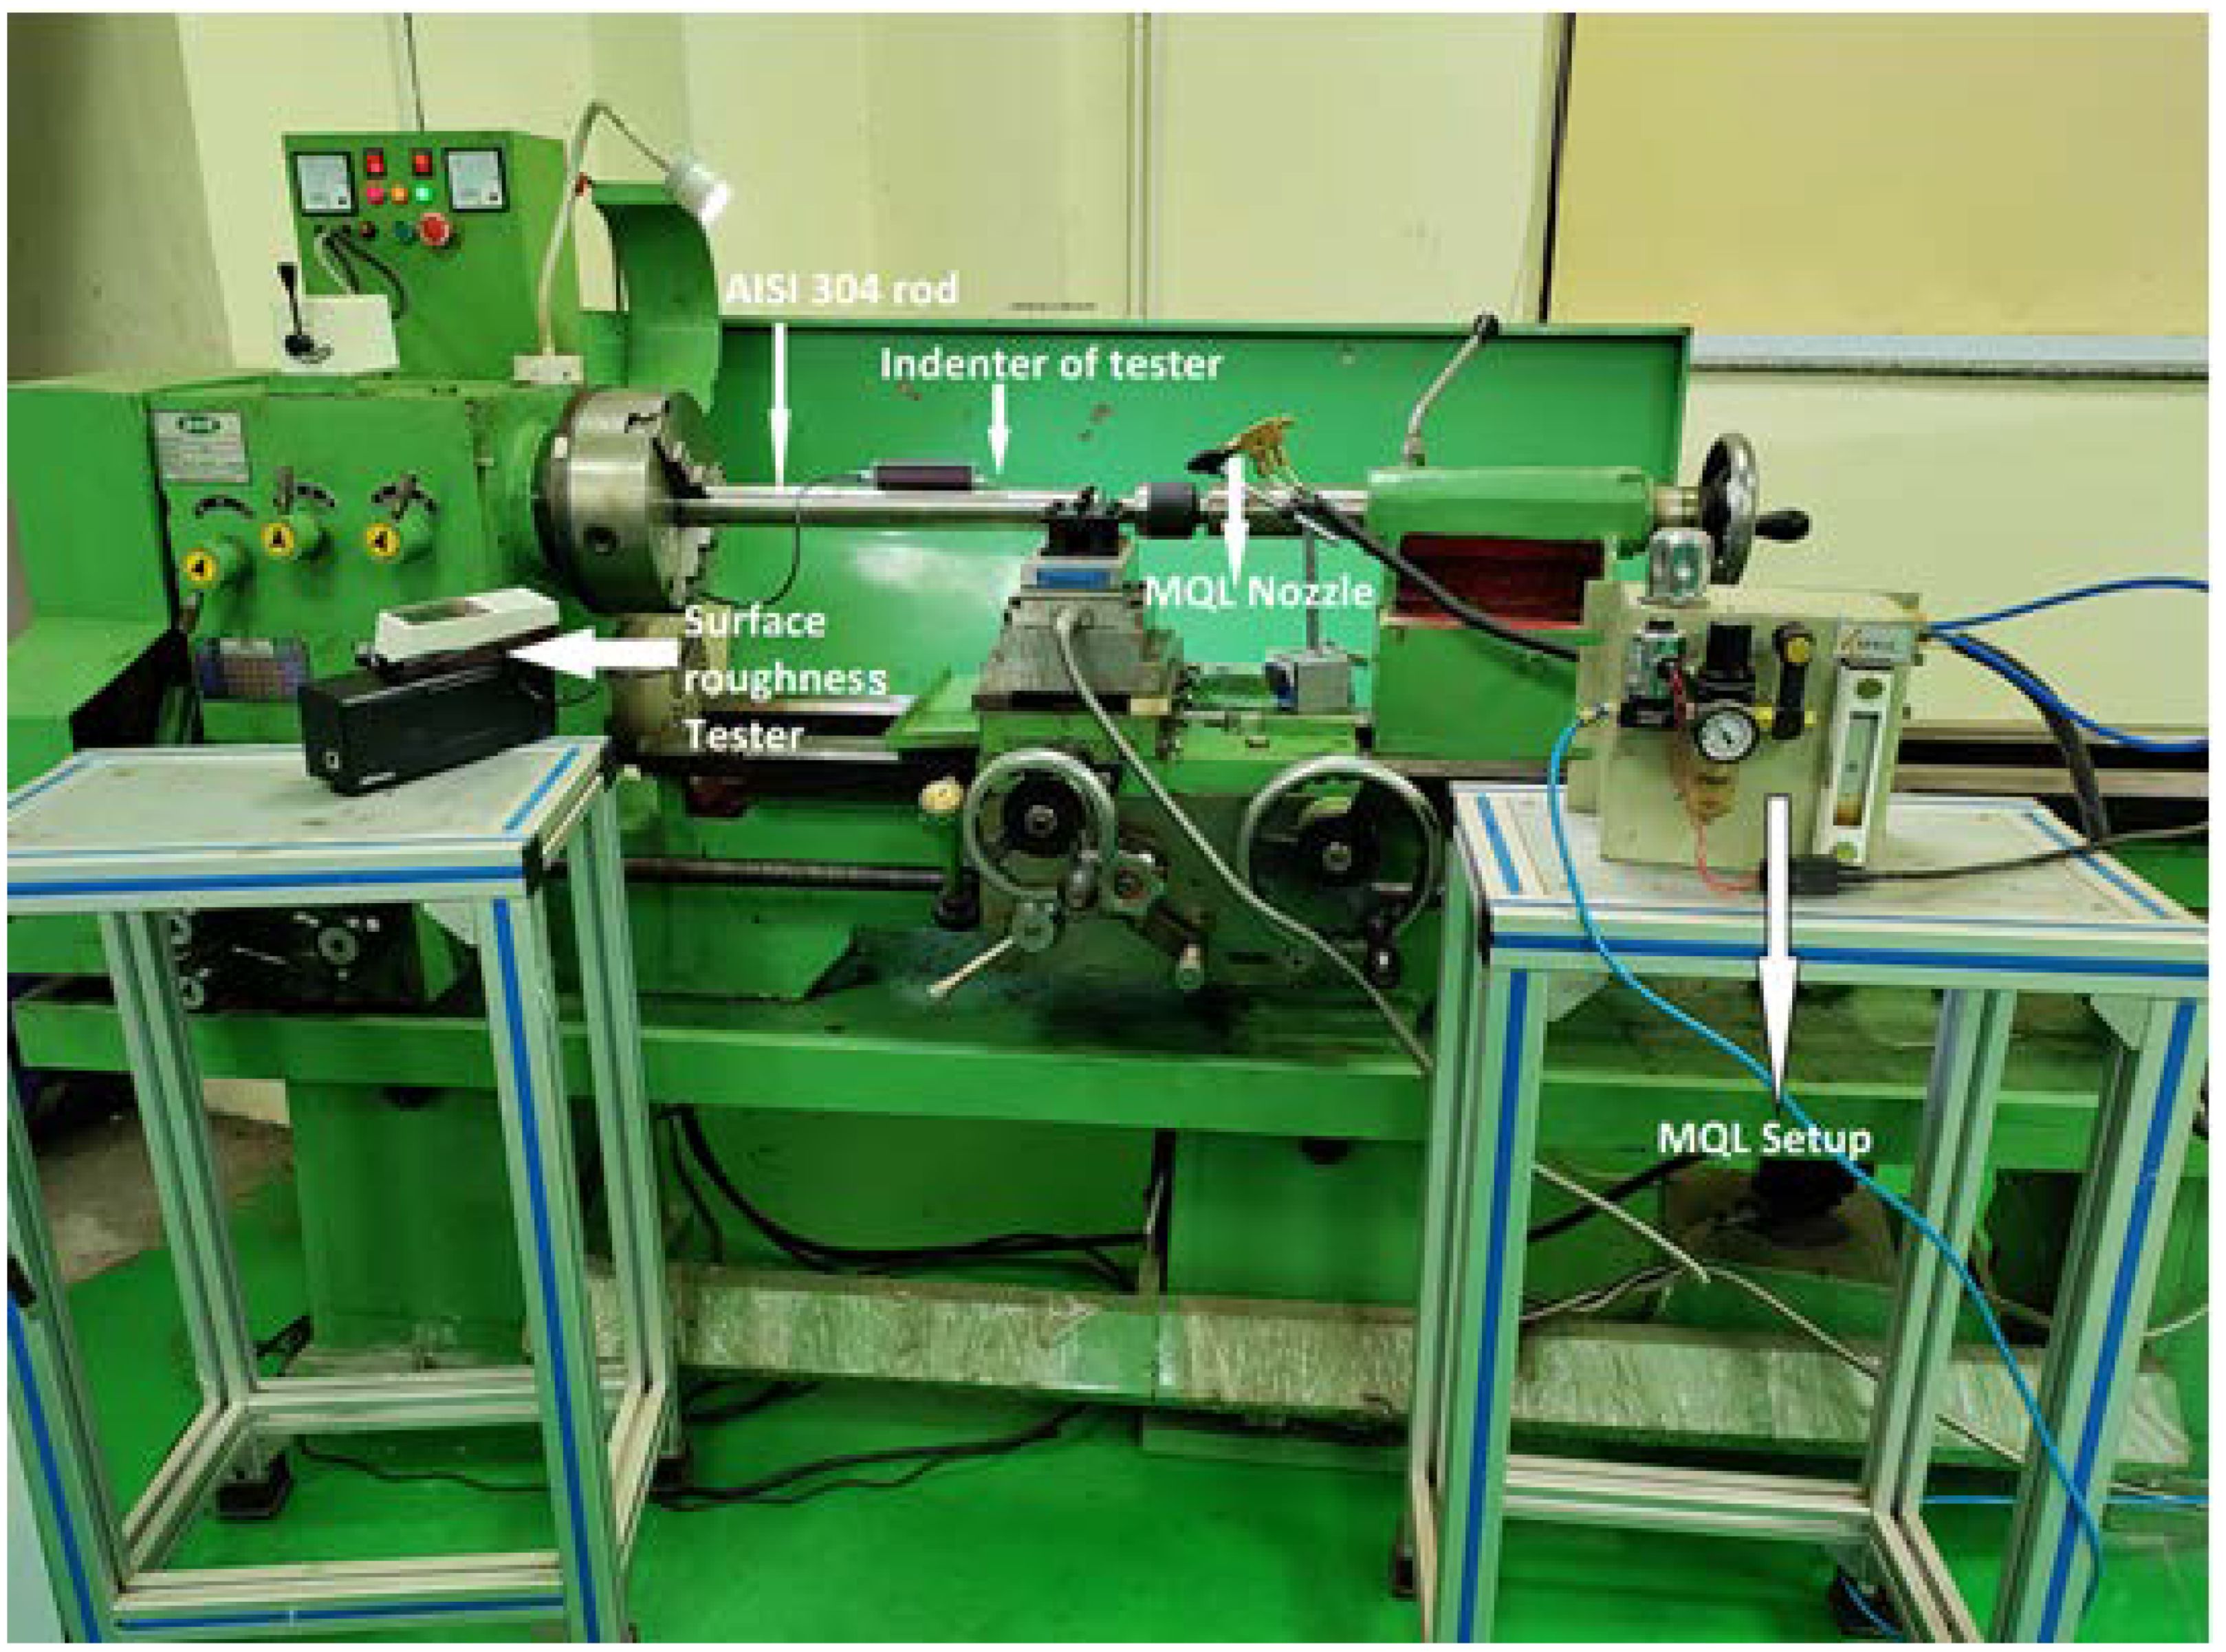
2. Materials and Methods

The turning operation was carried out on a conventional lathe machine (DUO Machine Corps, Rajkot, India). The workpiece for machining is AISI 304 steel which has wide applications in aerospace components, such as valves, special screws, aircraft fittings, in the fertilizer industry, in equipment in the food processing industry, in households (kitchenware) and in components utilized in harsh chemical environments. The chemical constituents of AISI 304 steel are mentioned in Table 1. The cutting insert of tungsten carbide (Widia’s CNMG120408) of TN 2000 grade having corner radius of 0.8 is used clamped on Widia’s tool holder. The input parameters for machining are cutting speed, depth of cut, feed rate and nanoparticle concentration whereas the response parameter is surface roughness. The input parameters and their levels are depicted in Table 2. In order to measure the average surface measurement (Ra), a surface roughness tester (Mitutoyo SFJ 210) is used. The roughness tester’s probe comprises of a diamond tip having radius of 2 µm, which traverses on the surface of workpiece. The probe has the retraction speed of 1 mm/s and measuring speed of 0.25 mm/s and 0.08 mm as its cut off length. The surface roughness tester has a measuring range of 360 µm (−200 µm to 160 µm). For recording the value of surface roughness, at the circumference of the workpiece, at six different locations the indenter of the tester is used at those locations for measuring the average value of surface roughness.
The coolant used for cutting is a biodegradable-based cutting fluid enriched with water-based alumina nanofluids of average particle size of 30 and 40 nm. The alumina nanoparticle offers higher conductivity in the cutting fluid and each particle size enriched cutting fluid is individually used. The colloidal suspension of alumina nanoparticles in water having average particle size of 30 nm and 40 nm is incorporated in vegetable oil for preparation of the cutting fluid. The nanofluid samples are prepared in three varying volumetric concentrations of 0.5%, 1% and 1.5%. The prepared nanofluids are discharged onto the machining zone using minimum quantity lubrication setup, which delivers the cutting fluid in atomized form. Each experiment is repeated thrice and the average value of surface roughness is taken for enhanced accuracy. The machining setup is shown in Figure 1, comprising of roughness tester, MQL setup and AISI 304 steel workpiece and pneumatic supply.

2.1. Machine Learning Models for Predicting Surface Roughness

2.1.1. Linear Regression

This is one of the simplest methods of solving any predictive problem and is the one of the popular machine learning algorithms. It aids in predicting real or numeric variables. It exhibits a linear relationship within a dependent variable and one or greater than one independent variables, thus it is termed linear regression.
The equation of linear regression is represented in Equation (1):
Y = ao + a1X + ε
Y = dependent variable
X = independent variable
ao = intercept of the line
a1 = linear regression coefficient
ε = random error
Linear regression can be categorized as simple linear regression involving a single independent variable to predict the numerical dependent variable value and multiple linear regressions which involve more than one independent variable to predict the numerical dependent variable value.

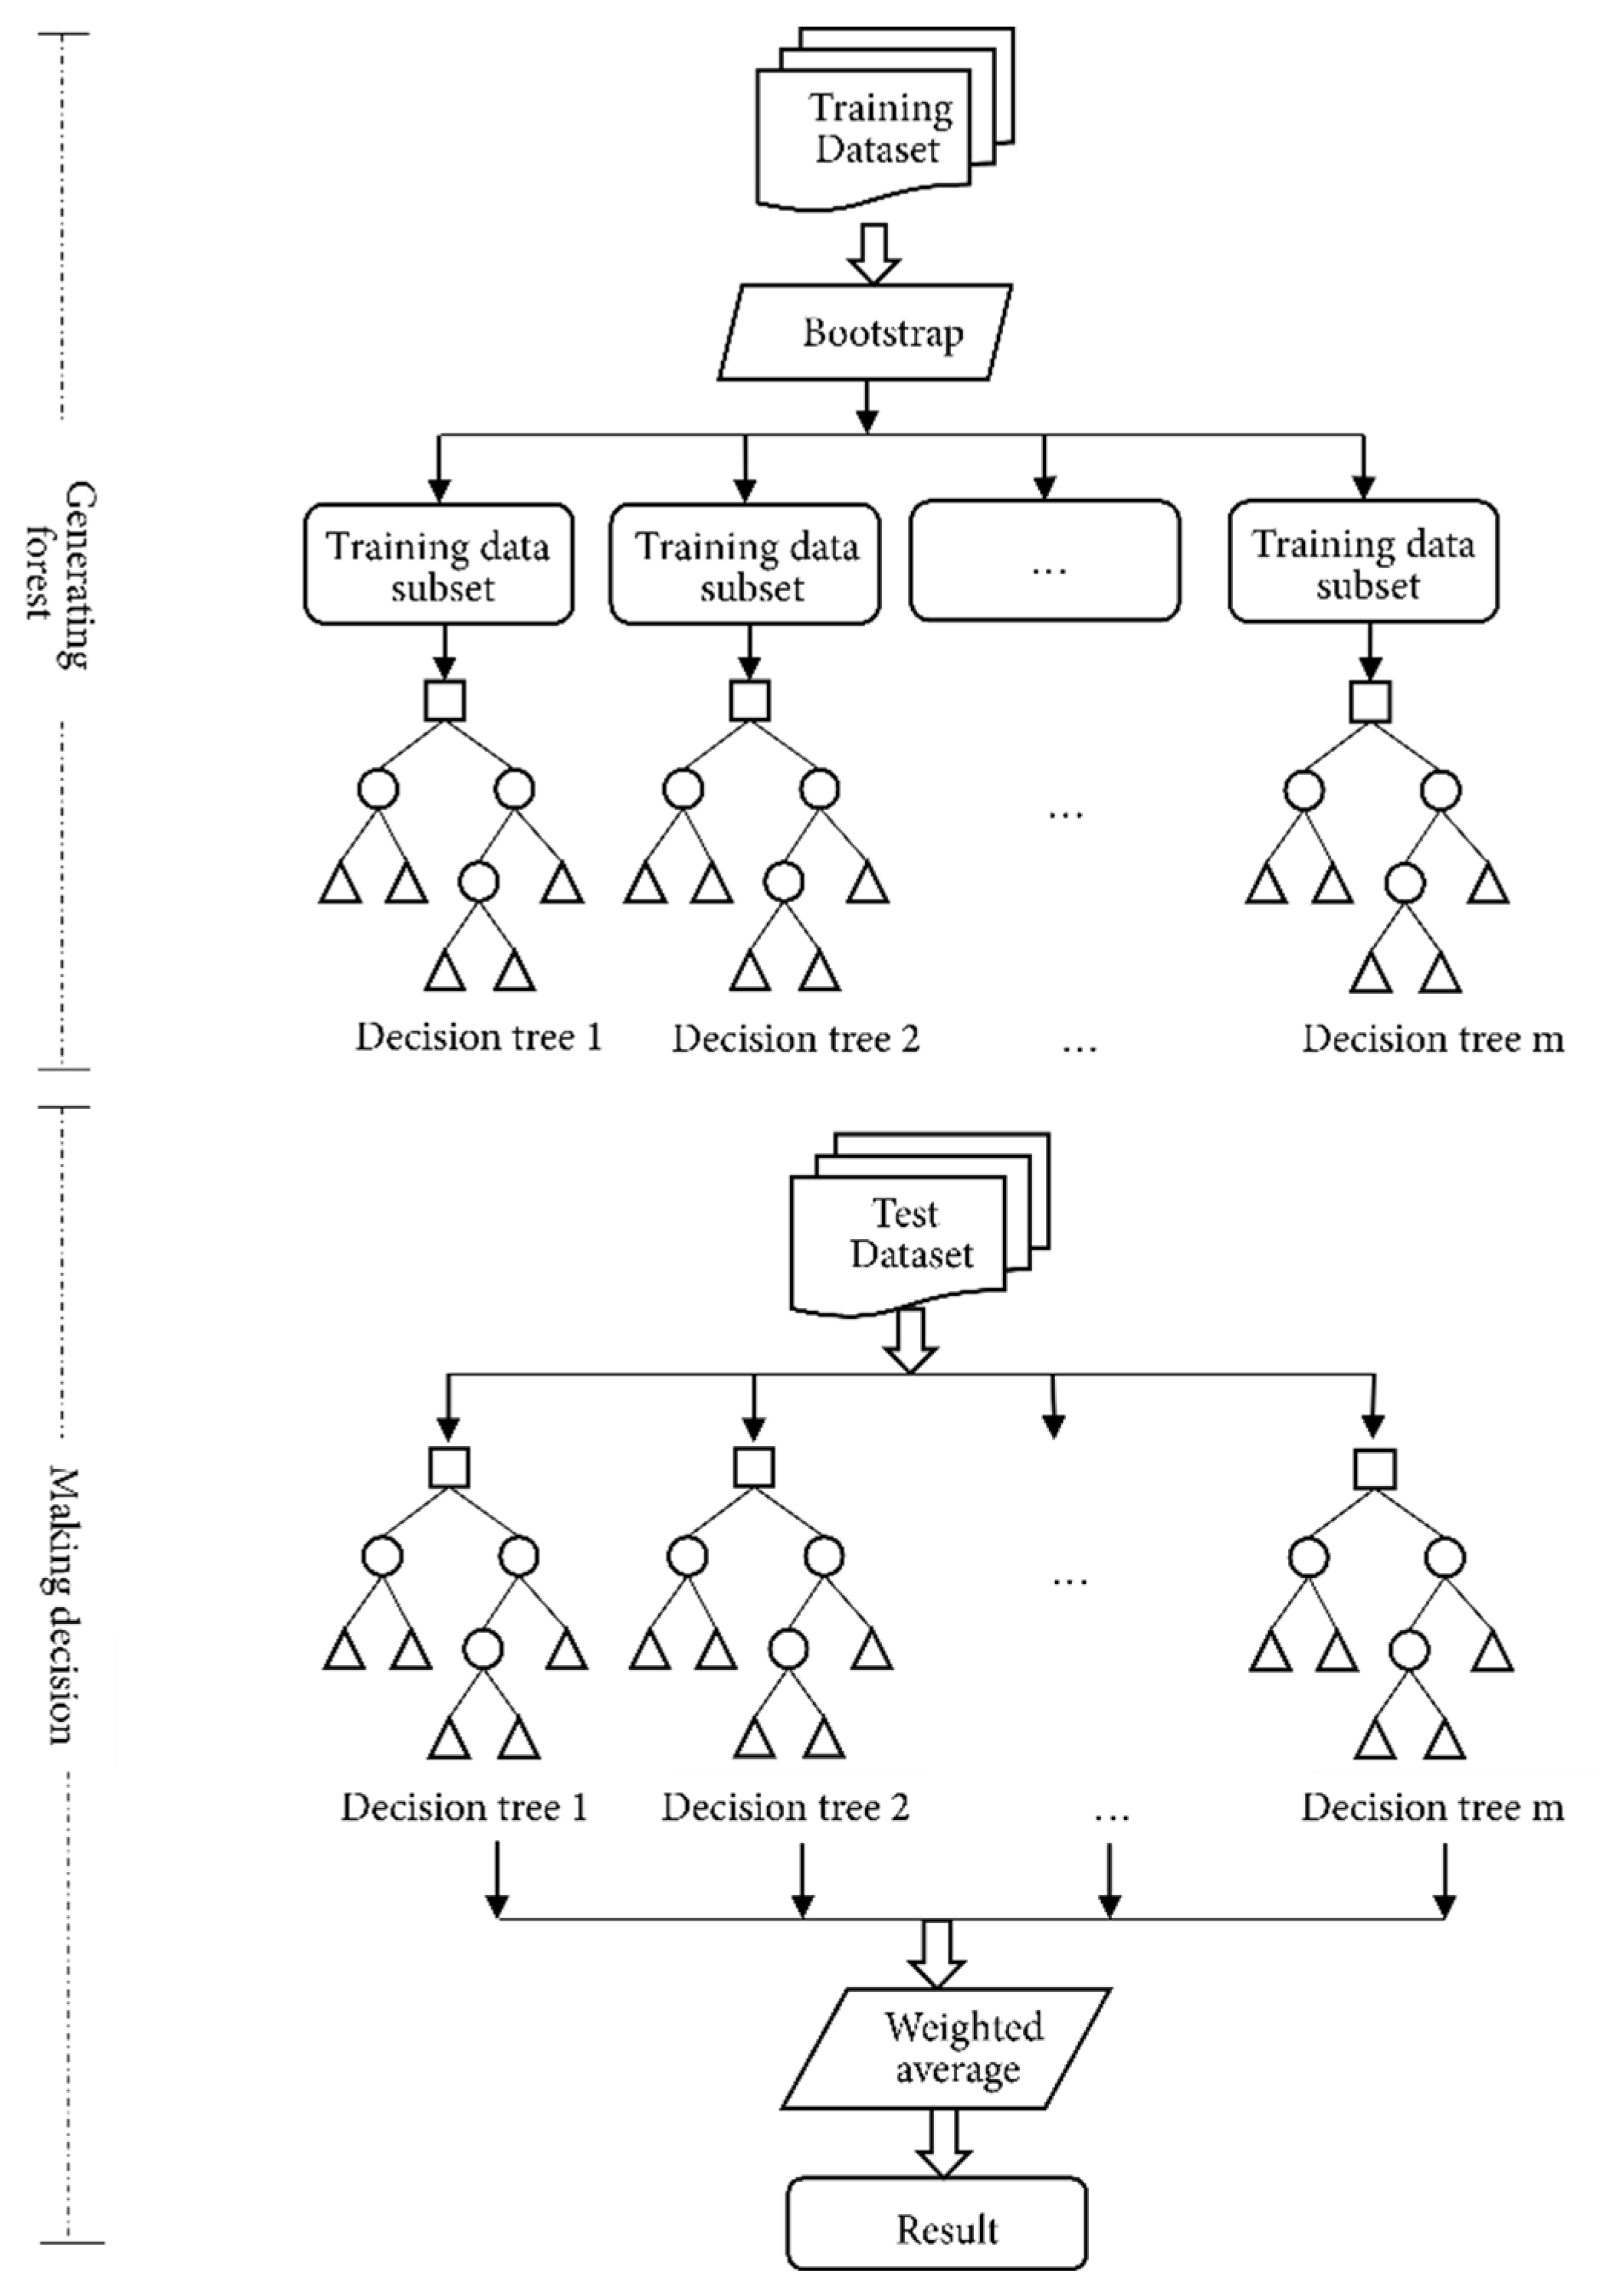
2.1.2. Random Forest

Random forest is a machine learning algorithm based on ensemble learning which combines multiple classifiers for solving the problem and enhances the performance of the model [43]. This group learning approach utilizes bootstrap samples from a training dataset for creating forest of decision trees [44]. The decision nodes and leaves explain the decision tree, where leaves represent the final outcome and decision nodes are the points where the data are split. This model is widely used owing to its simplicity and diversity and is used for both regression and classification. The construction of random forest model is depicted in Figure 2.

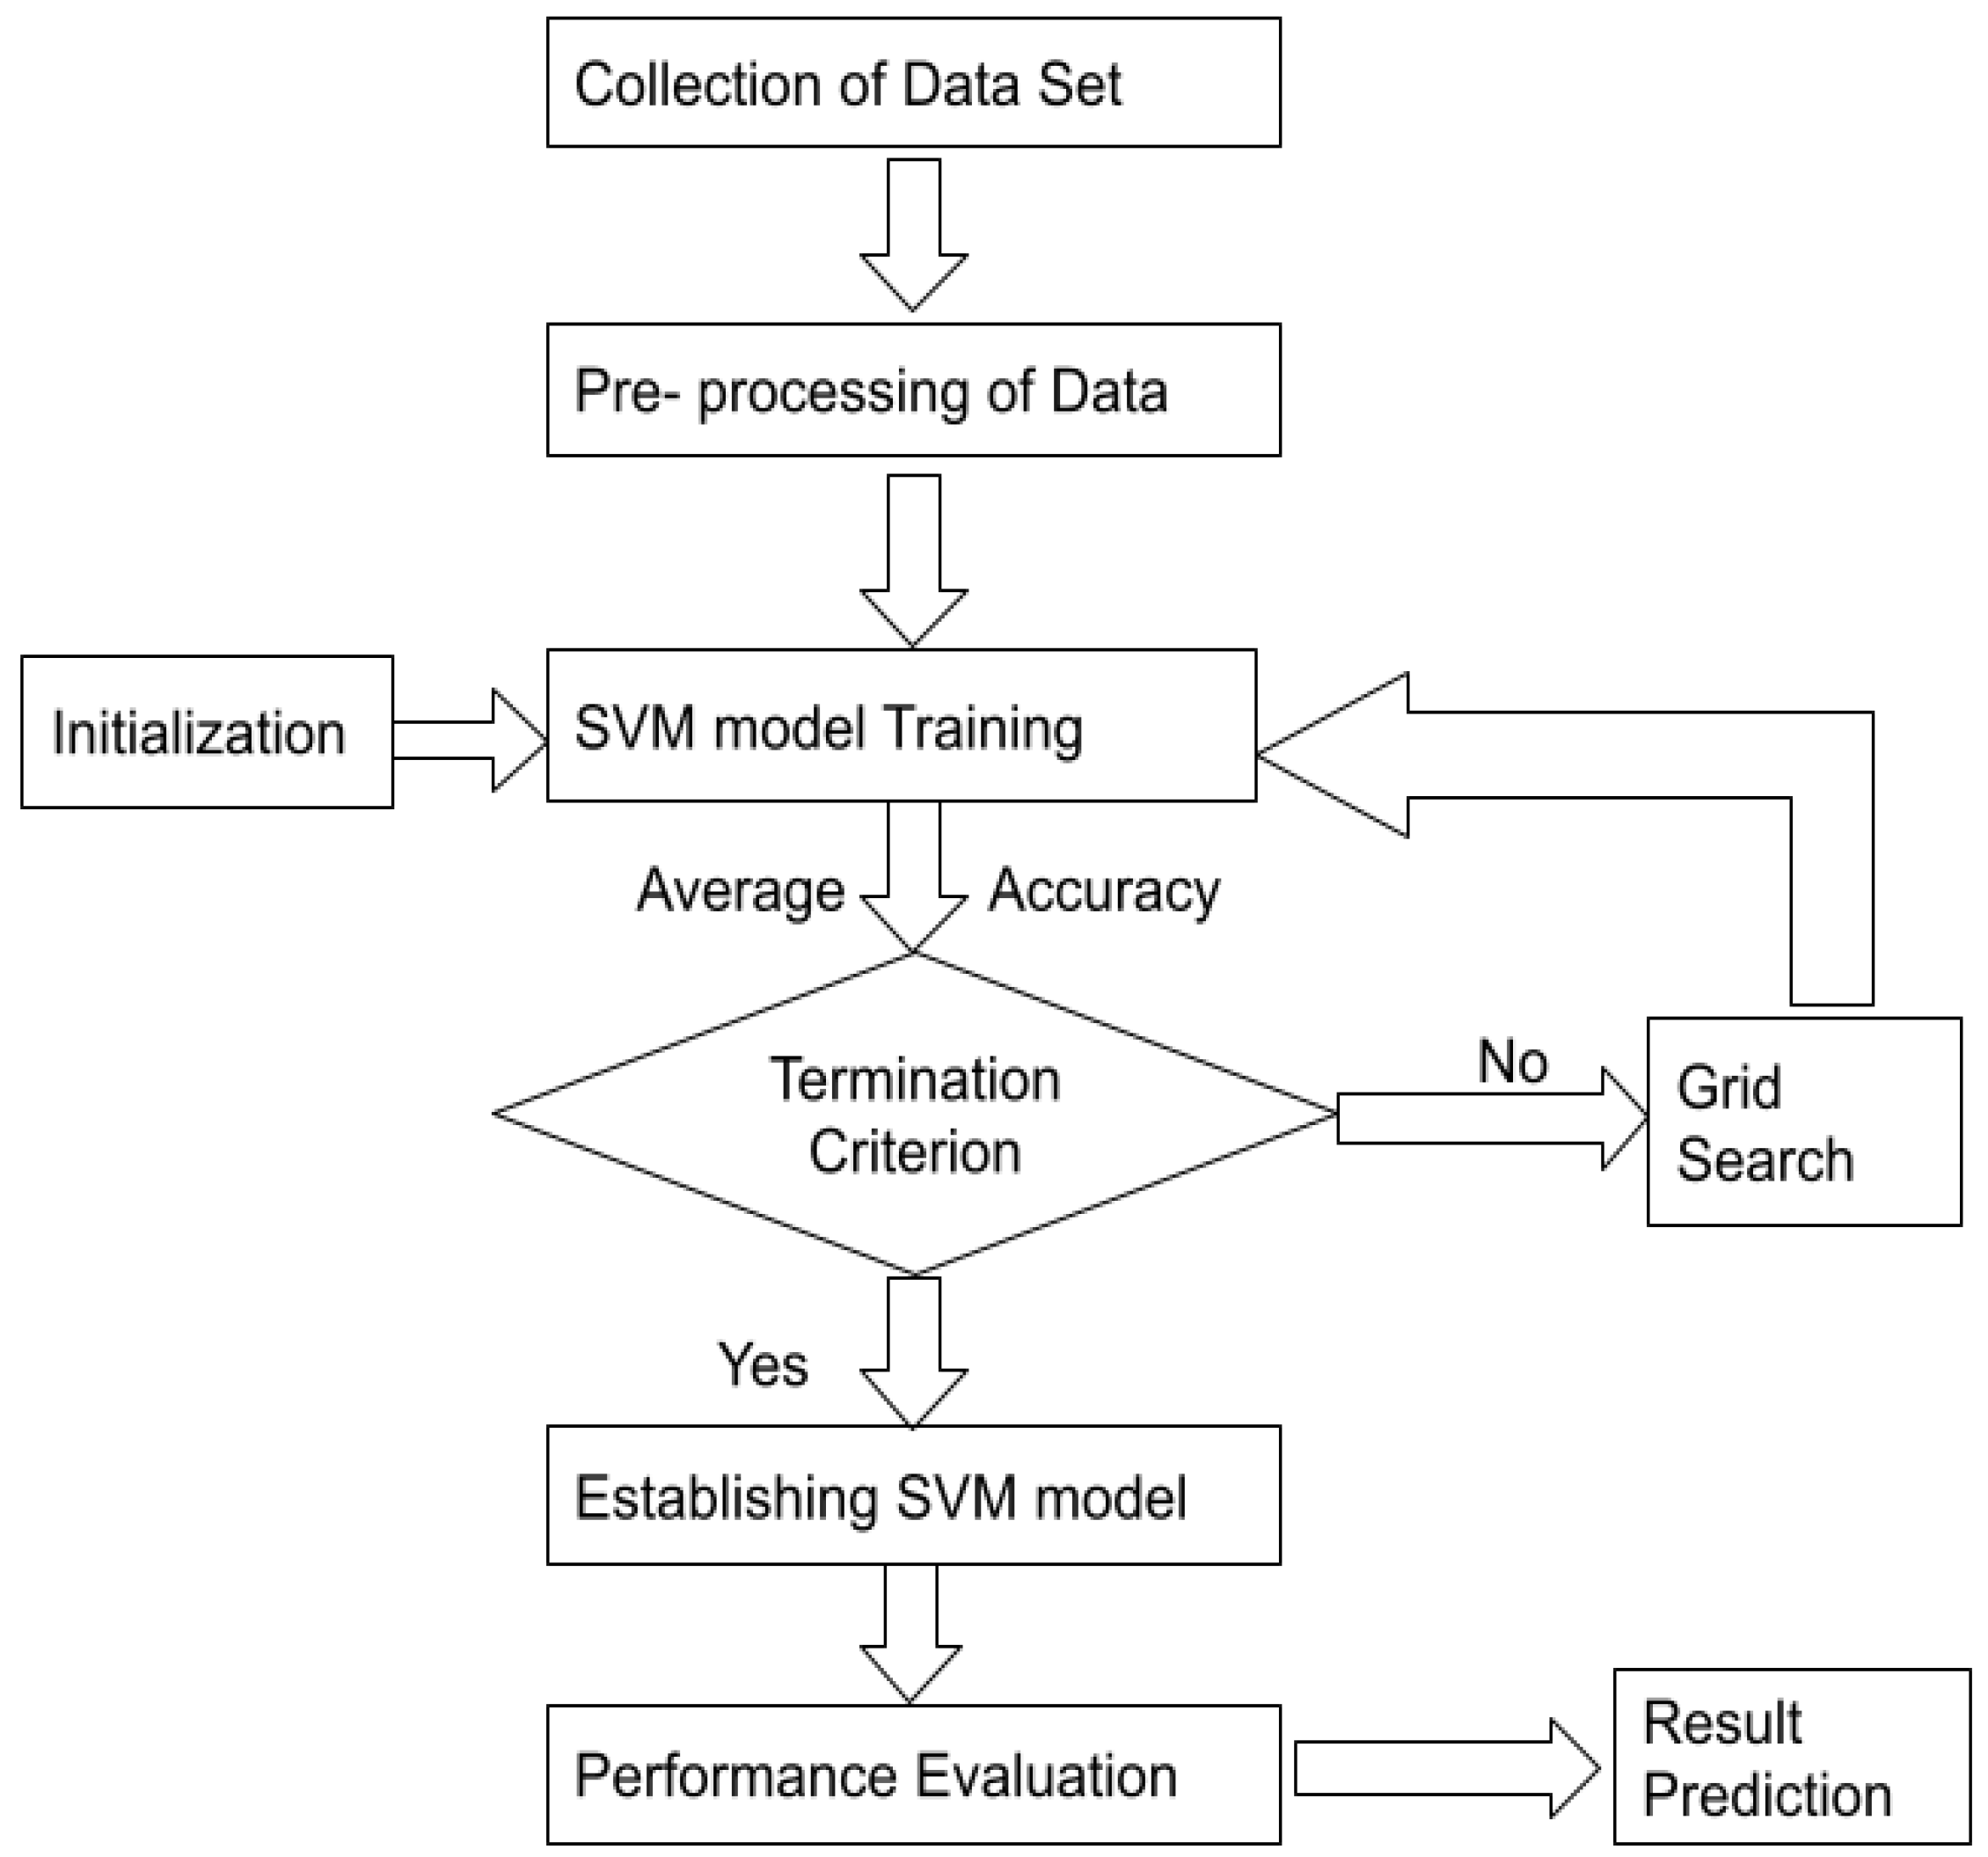
2.1.3. Support Vector Machines

This machine learning model was proposed by Vapnik [46]. Support vector machine is used for prediction of discrete values and is a type of supervised learning algorithm. Support vector regression is a technique lying under the domain of support vector machine. The main aim of this technique is to get the line of best fit which is a hyperplane having maximum number of points as shown in Figure 3. In order to frame the hyperplane, SVR selects extreme points/vectors and these extreme points are termed as support vectors, which thus justifies the nomenclature of the technique. Support vector regression aims to fit the best line in the range of threshold value, which is the distance between the boundary line and the hyperplane. The flow chart explaining the process of building support vector machines is shown in Figure 4.

2.2. Performance Indicators

Three different performance indicators are selected for judging the accuracy of the models in predicting the surface roughness values, which are coefficient of determination (R2), mean absolute percentage error (MAPE) and mean square error (MSE) as given in Equations (2)–(4), respectively.
R 2 = 1 i = 1 n ( Y i Ŷ ) 2 i = 1 n ( Y i Ȳ ) 2
MAPE = 1 n i = 1 n | Y i Ŷ i | Yi × 100  
MSE = 1 n i = 1 n ( Yi Ŷ ) 2  
where n is number of data points, Yi represents observed values, Ŷ represents predicted values and Ȳ signifies the mean value of Y.

2.3. Data Pre-Processing

The surface roughness values at 30 and 40 nm particle size of alumina obtained from the experiments are imported in our jupyter notebook using python inbuilt library known as pandas which is mostly used for data modification. Standard scalar technique is employed to remove the scale indifference, which usually occurs due to difference in units of different features such as feed rate, cutting speed, depth of cut and nanoparticle concentration.

3. Results and Discussions

The design of experiments using four factors (cutting speed, feed rate, depth of cut and nanoparticle concentration) and three levels (low, medium and high) is made and a total of 27 experiments are planned using the box-behenken approach with design expert software. In this paper, the response parameter is mainly surface roughness, which comes under non-beneficial category and, therefore, it should be the minimum. To minimize it, proper lubrication and cooling is required at the machining interface. Therefore, in the present paper, alumina nanofluid of two different average particle sizes mixed with biodegradable cutting fluid with MQL is used for cooling and lubrication purpose. The response table is shown in Table 3.

3.1. Prediction of Response (Surface Roughness) by Different Machine Learning Models

The surface roughness obtained from turning operation was predicted using three different regression-based machine learning models. The total number of data points are 27, which were used for model creation and evaluation. Two-thirds (2/3) of the input data were picked at random for model construction (training). The model was validated using the remaining 1/3 of the input data (testing). In predicting surface roughness by different models, four different input variables are used, namely feed, depth of cut, cutting speed and nanoparticle concentration. In order to minimize the errors that may arise due to the unit differences of the input parameters, scaling was performed of both training and testing data using standard scalar. For ensuring best parameter for our model, cross validation was performed using GridSearch CV and to check the underfitting or overfitting of the model; both training and test errors are used.

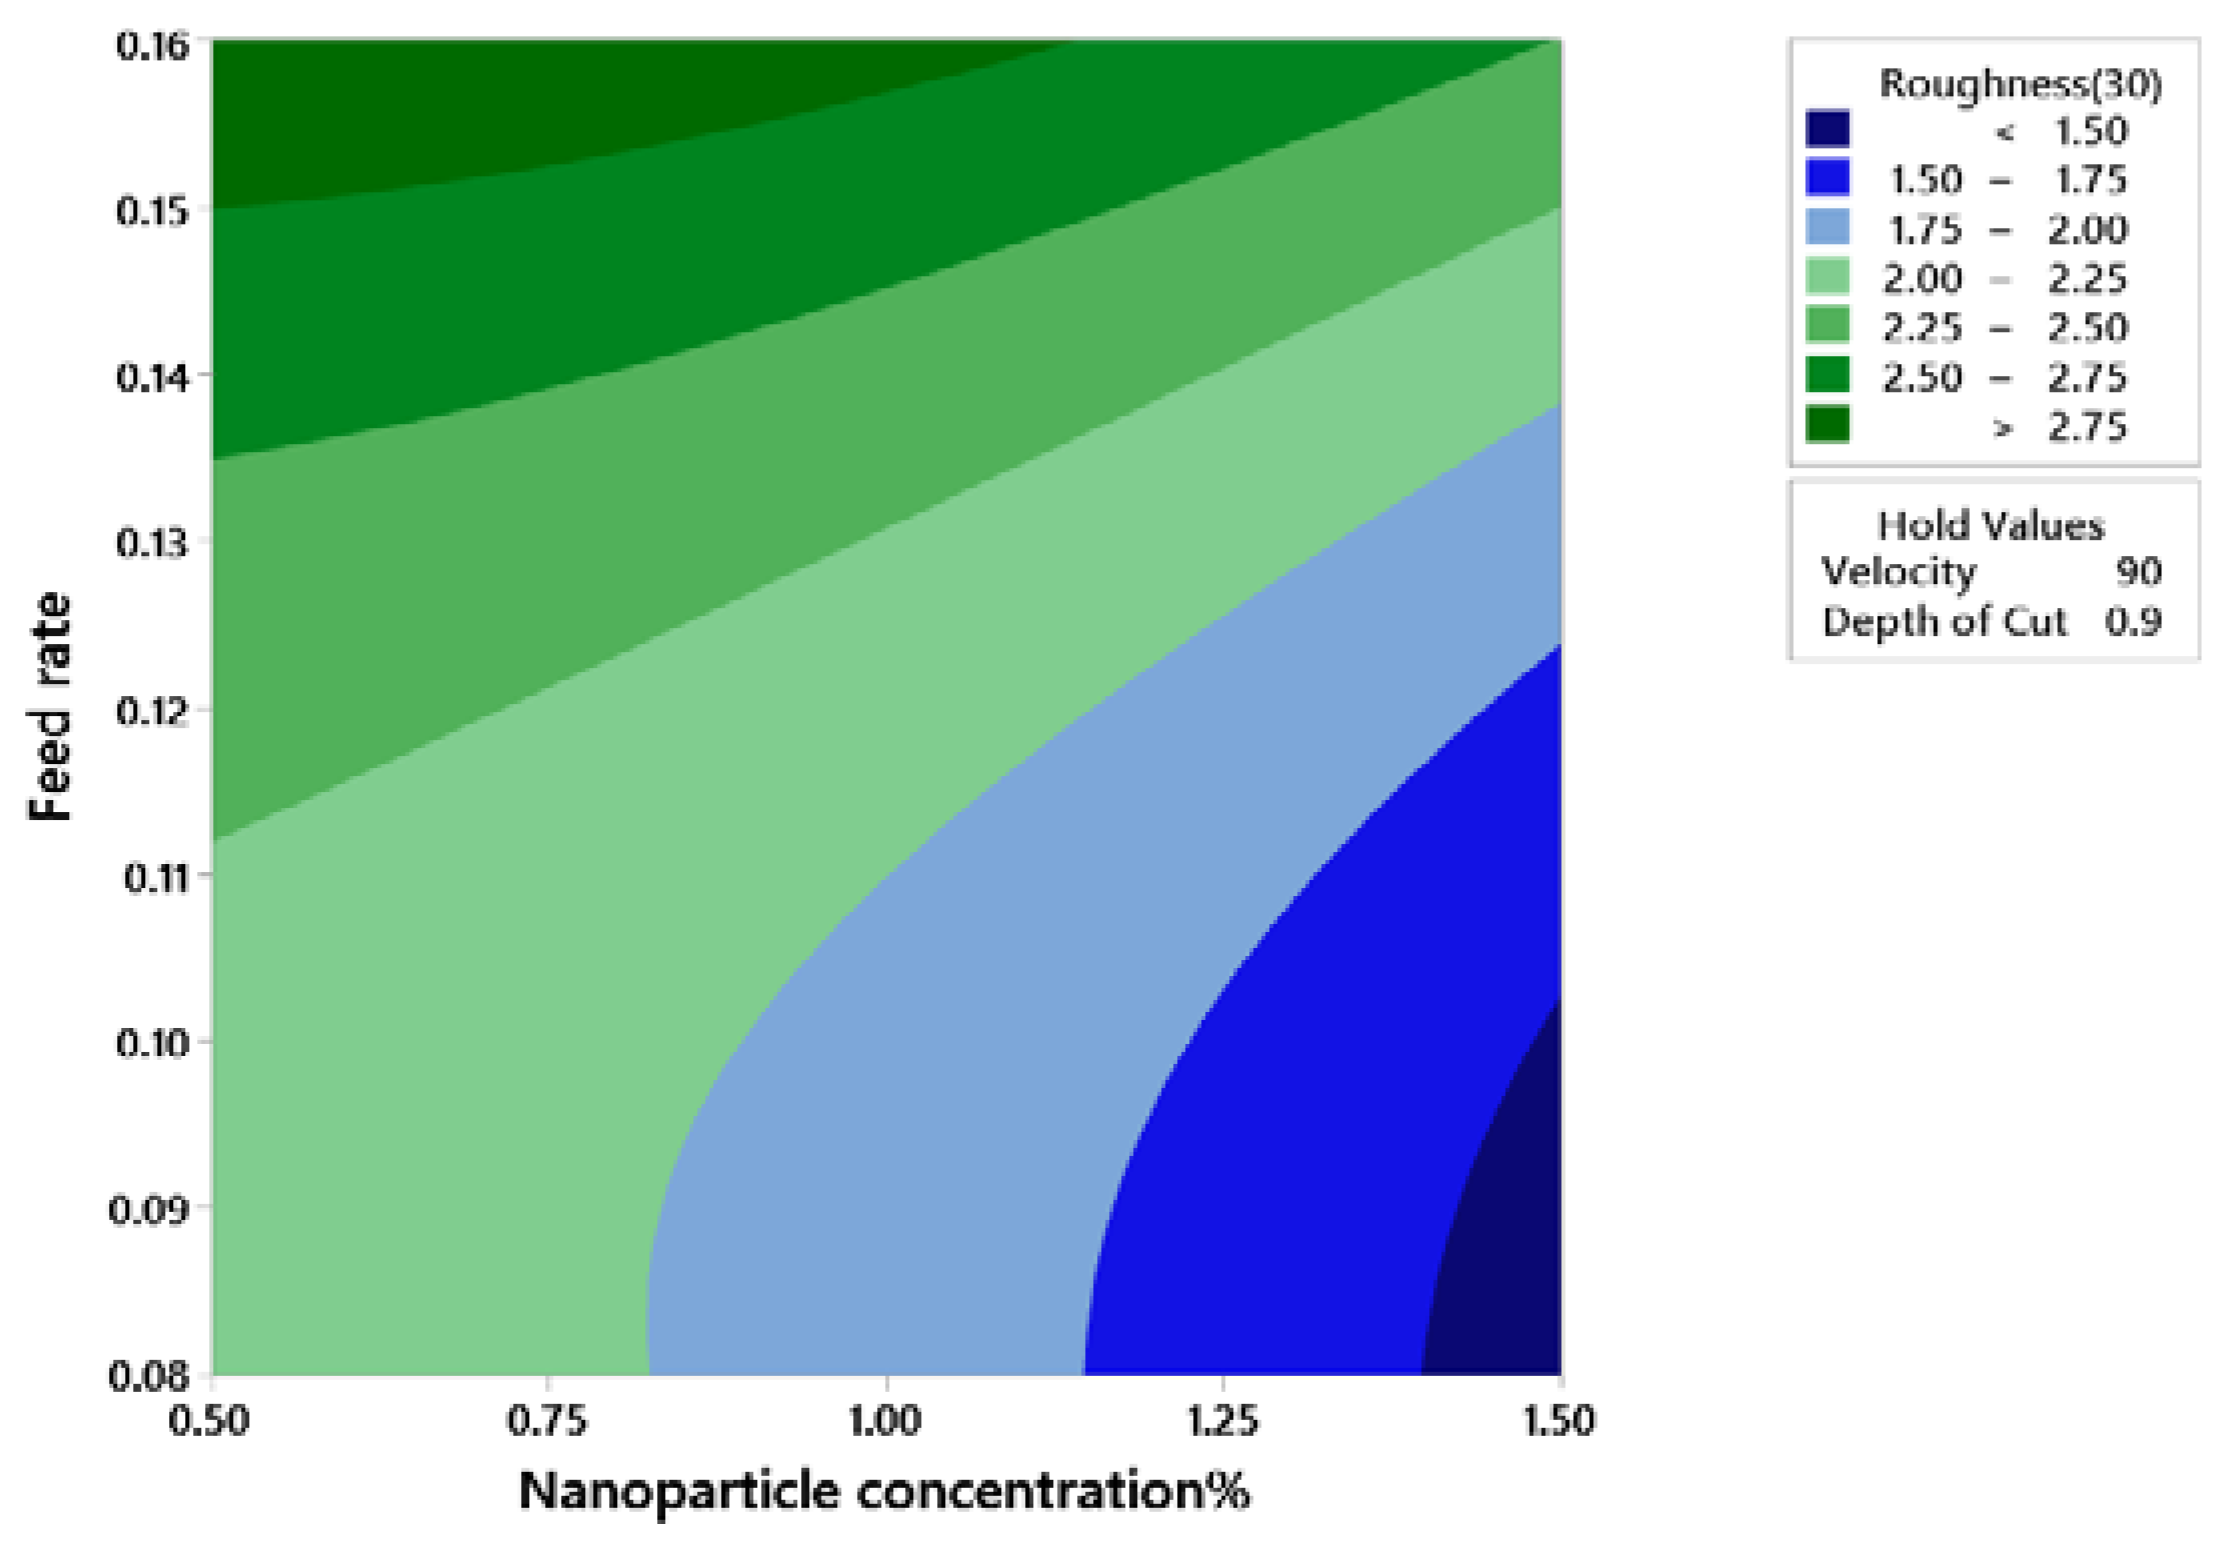
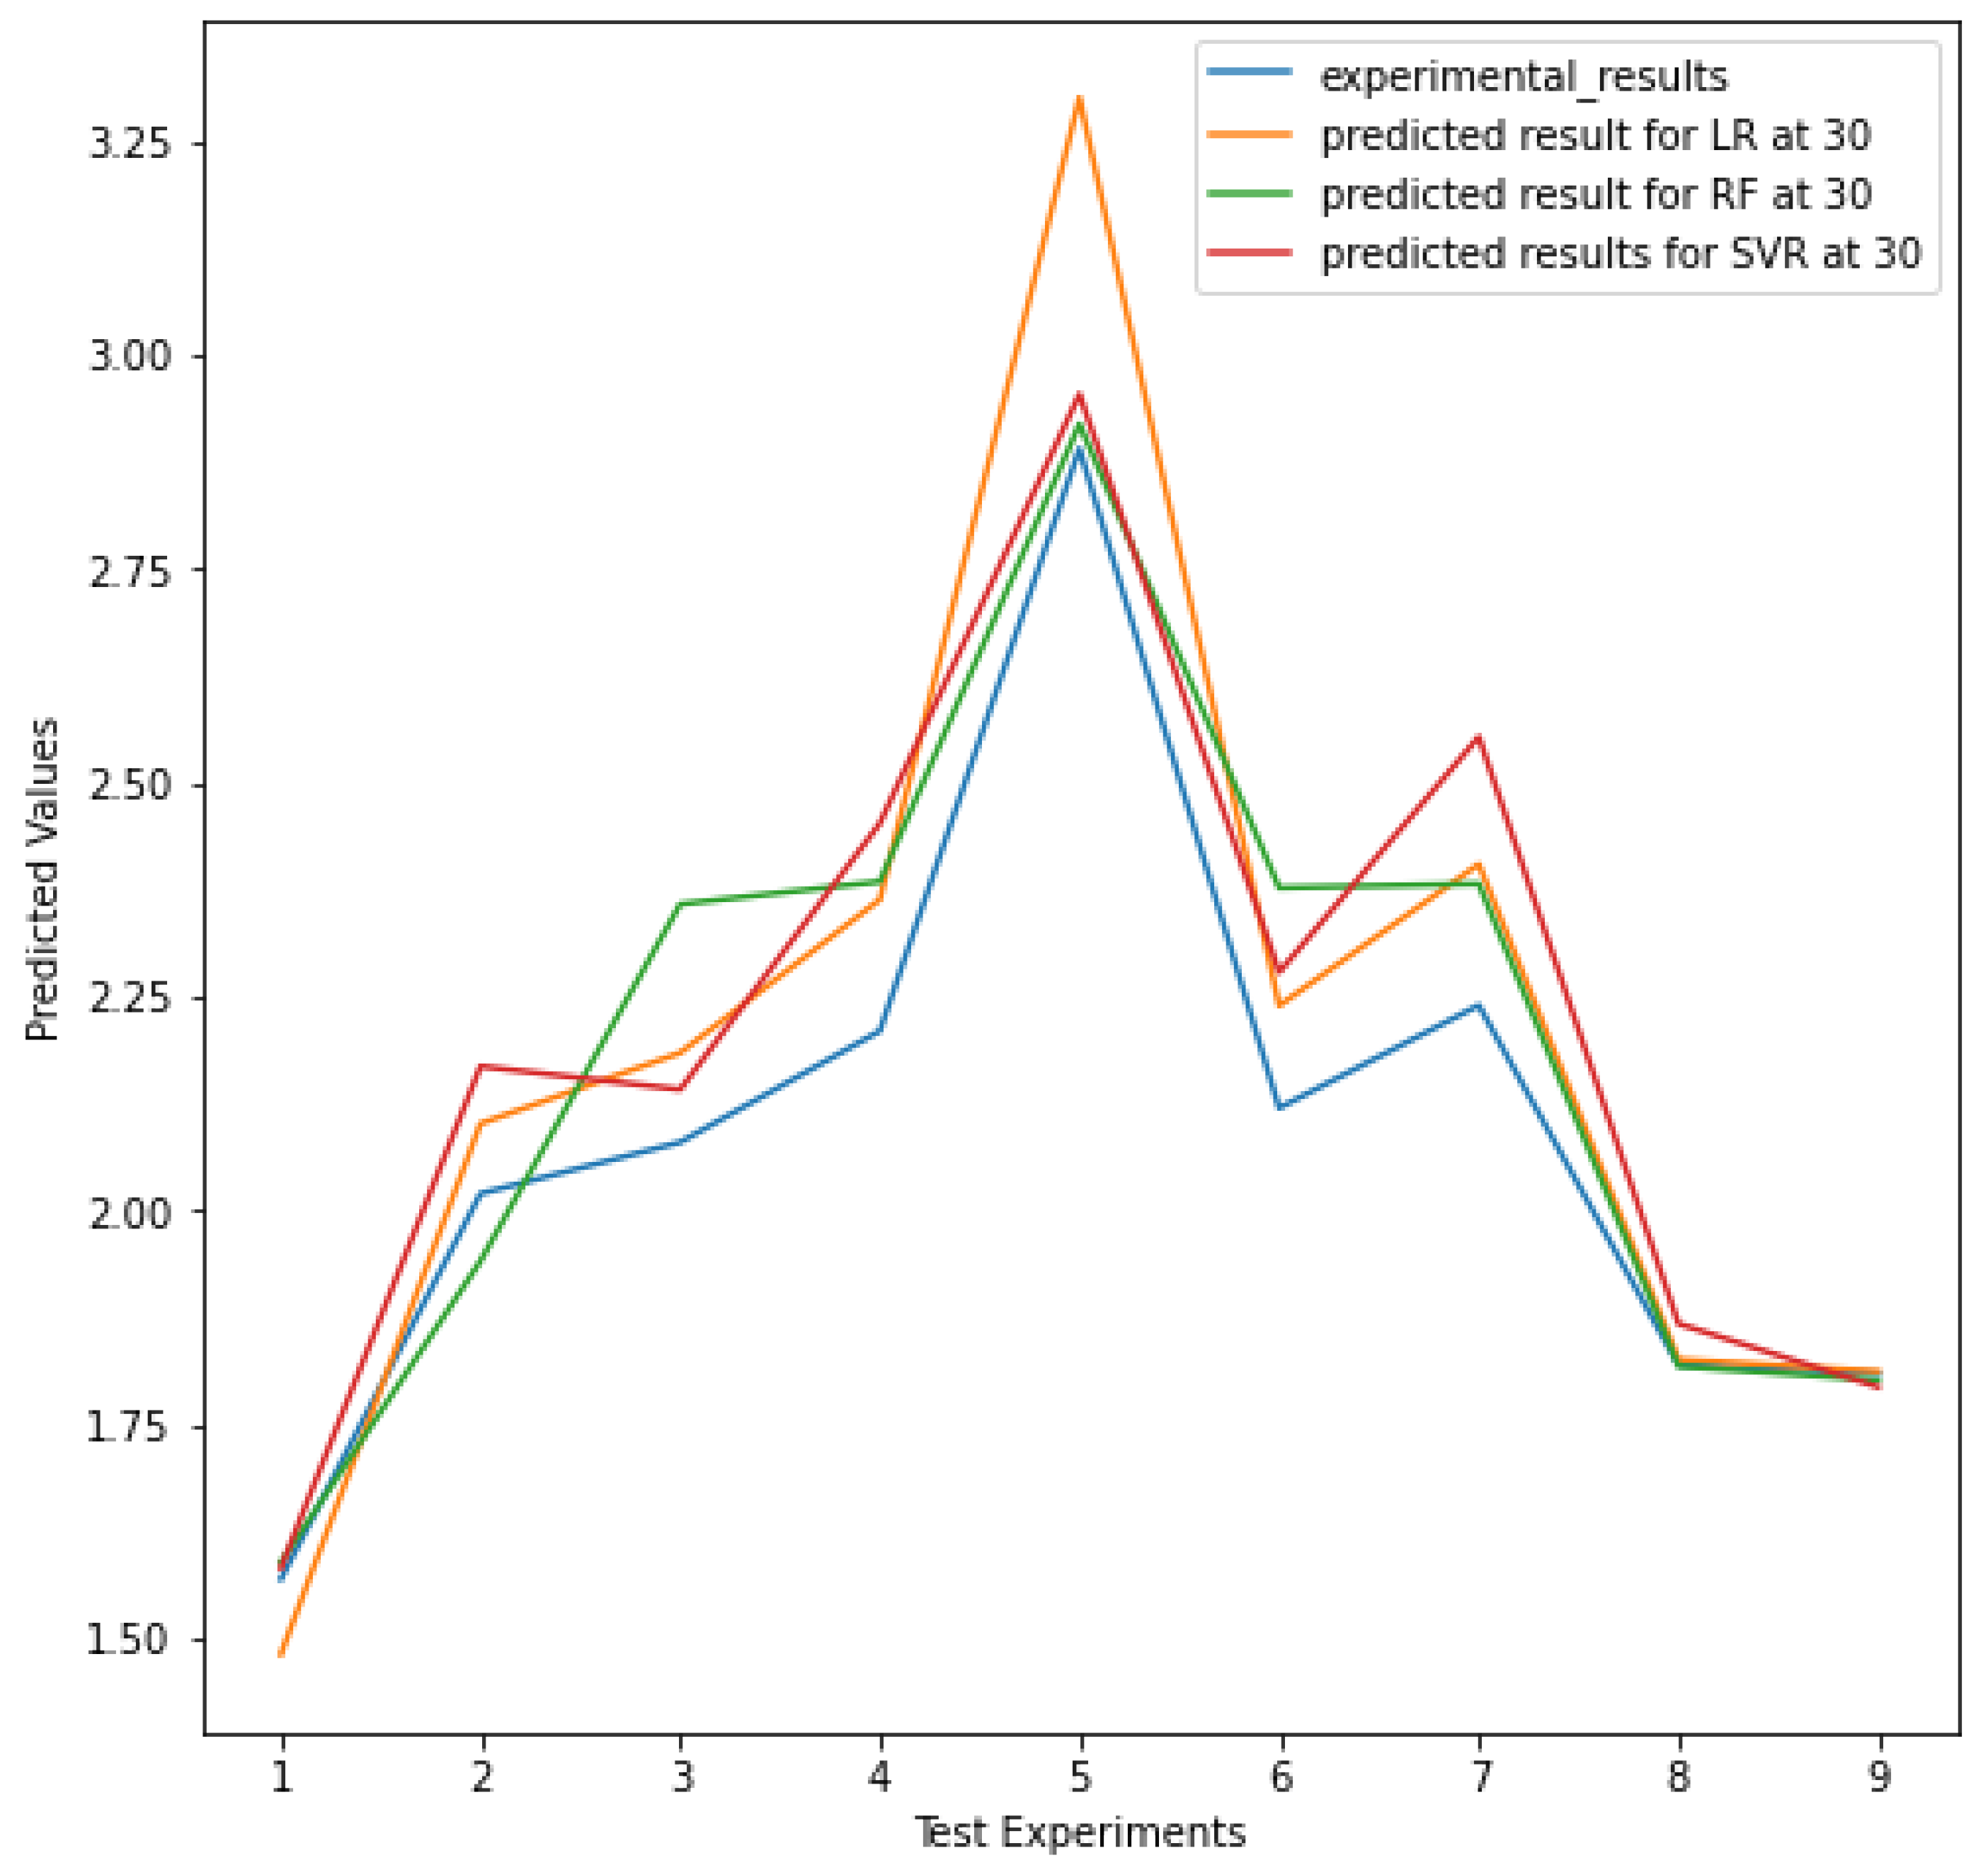
3.2. Analysis of Surface Roughness at Particle Size of 30 nm

The surface roughness values obtained from 27 experiments are used for testing and training purposes. The different values predicted by three models are presented in Table 4. To judge the accuracy of the predicted models, three performance indicators are used. The testing and training errors are shown in Table 5. The significance of feed rate is encountered in case of surface roughness as helicoid generation takes place and becomes broader and deeper when feed rate is increased. The similar trend can be observed in investigations performed by Bouacha et al. [48] in their study. The heat dissipation property is improved by the use of alumina nanoparticles as it enhances lubrication as well as wetting characteristics on the rake face of cutting tool. As per the error metrics used, random forest gave better prediction followed by linear regression and SVR. The illustrations in Figure 5 show the contour plot of surface roughness with the variation of feed and nanoparticle concentration at fixed velocity rate 90 m/min and at fixed depth of cut 0.9 mm. As mentioned, in Figure 5 the dark blue region holds the minimum value of surface roughness (i.e., less than 1.50). It is also the optimum region for surface roughness with particle size 30 nm. The prediction of surface roughness by different algorithms is plotted by different colors and is compared with that of the experimental values in Figure 6. The comparative graph between predictive and experimental values is made using matplotlib library. Predicted values from random forest are closer to the experimental values, thus reducing the error in case of RF and making it a better performing model out of the three.

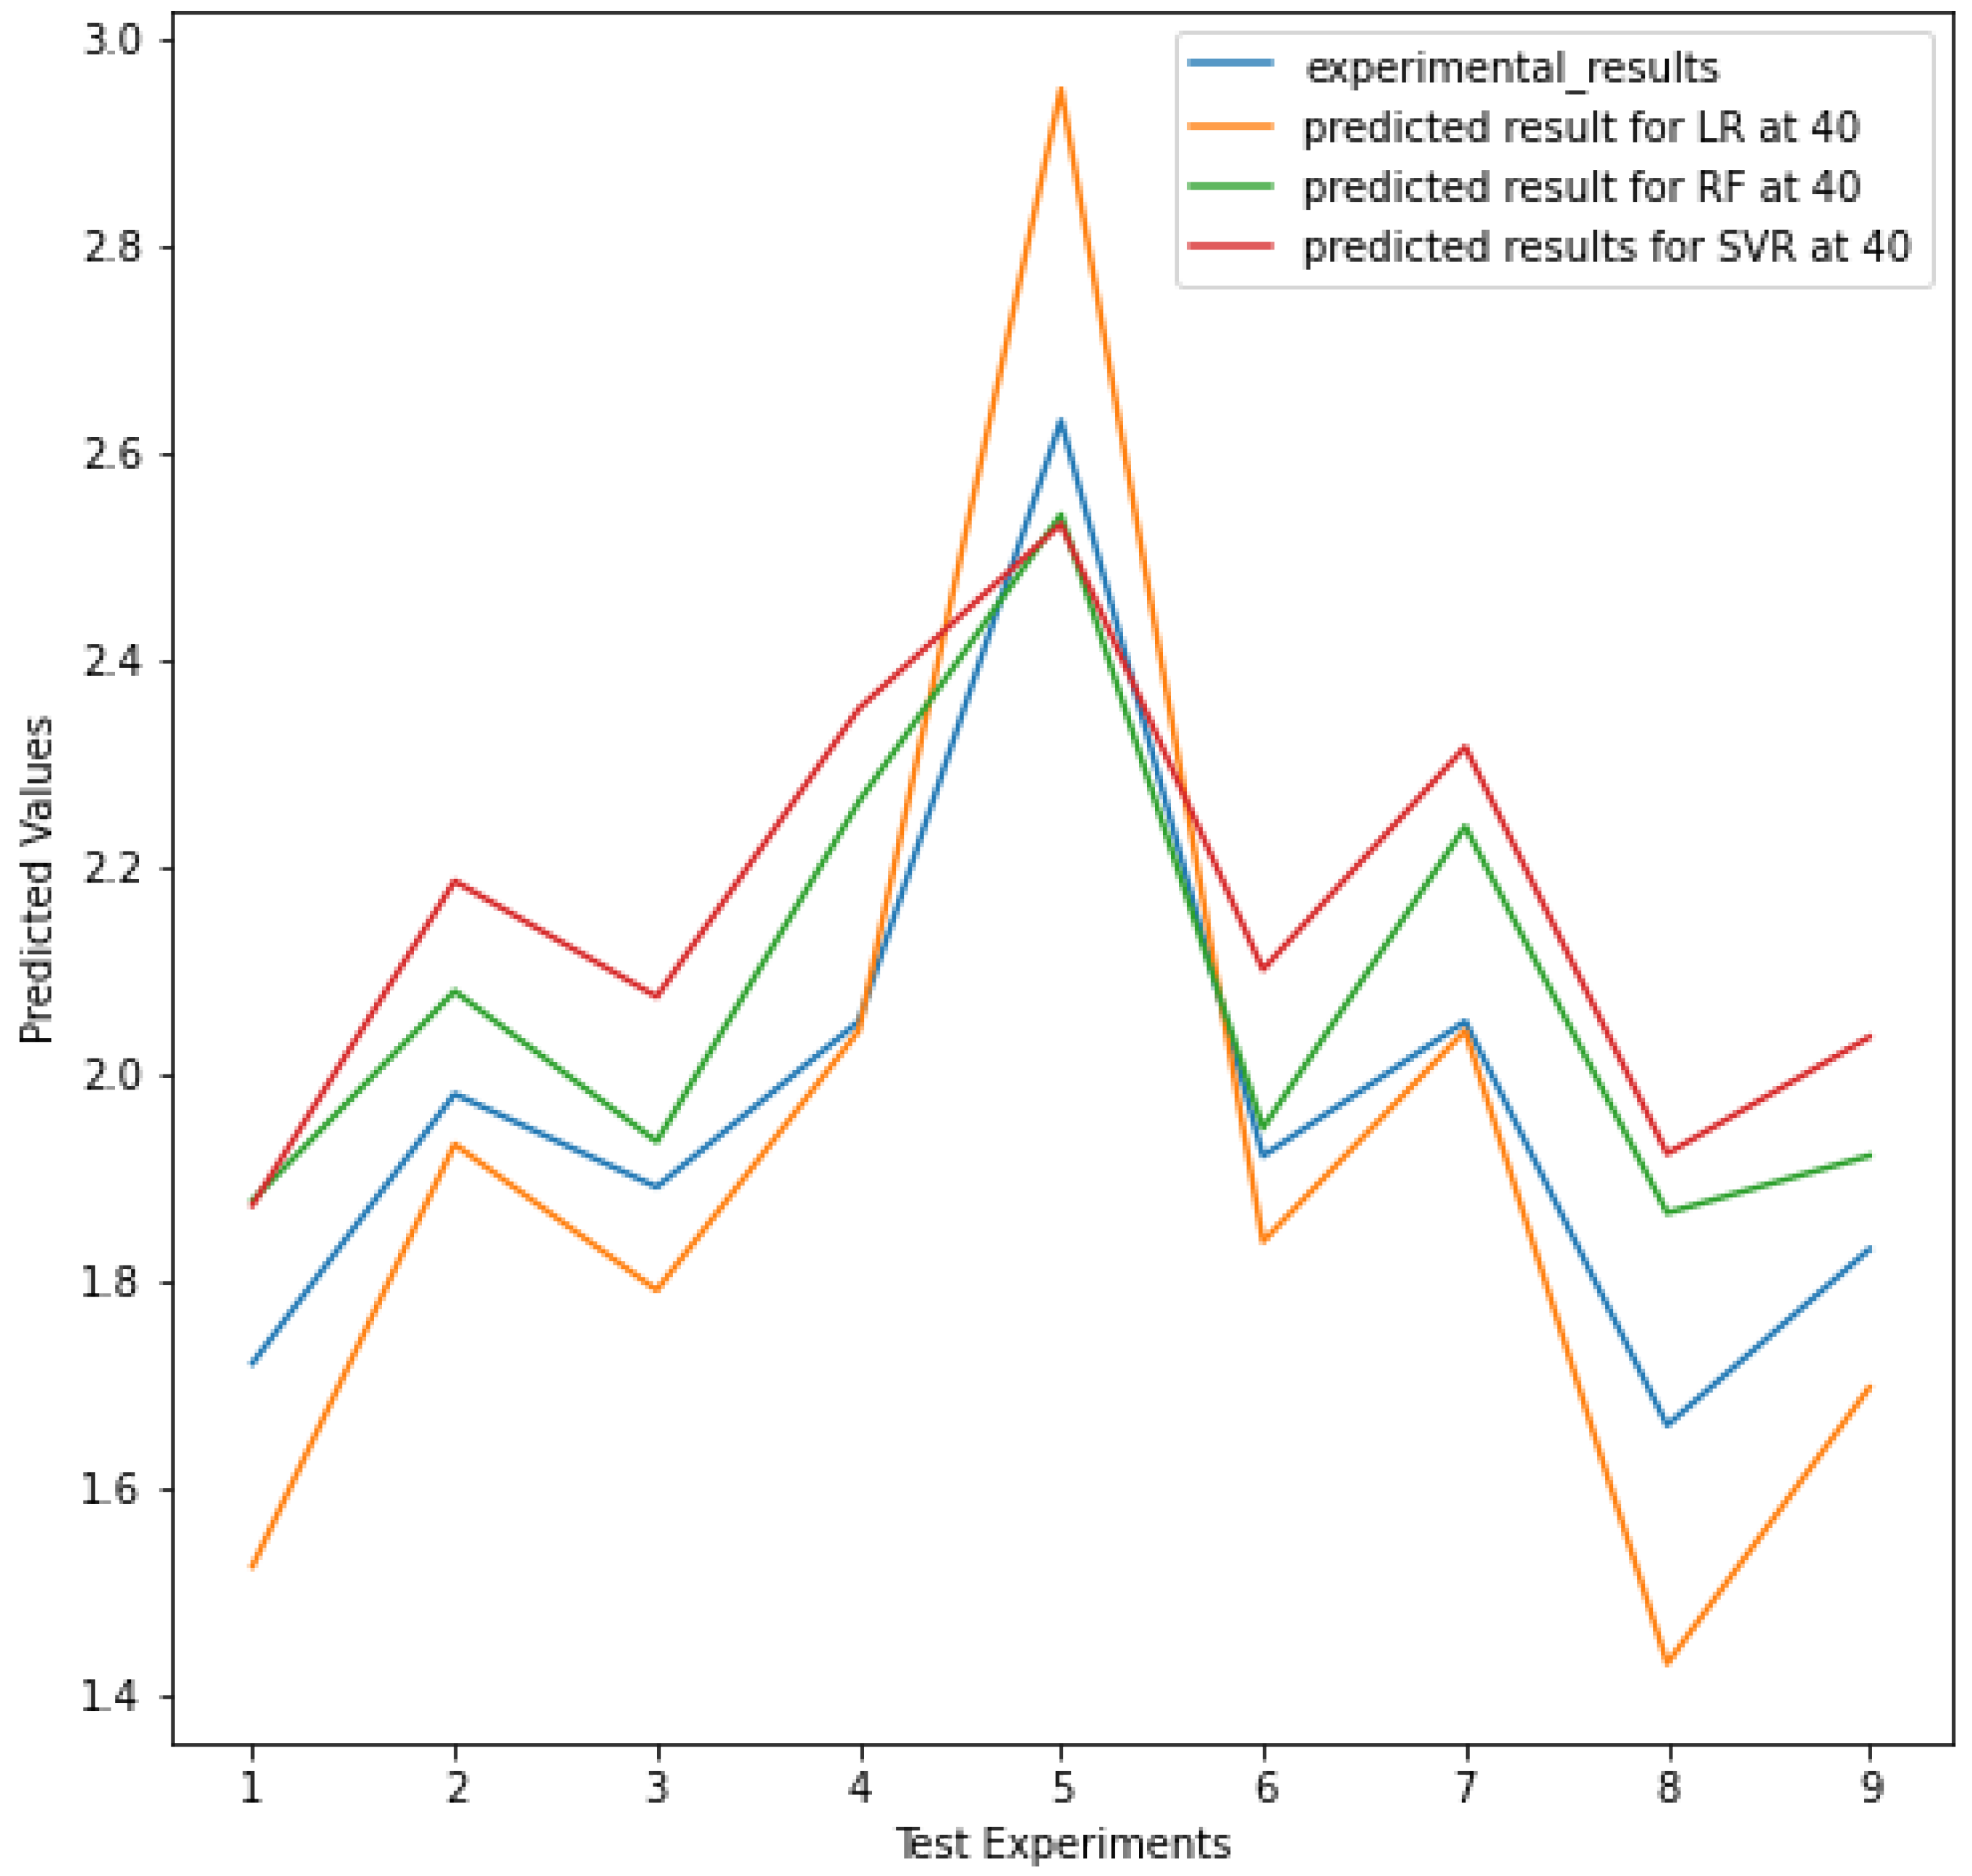
3.3. Analysis of Surface Roughness at Particle Size of 40 nm

The surface roughness prediction for particle size 40 nm from different machine learning algorithms is shown in Table 6. The average particle size of alumina is increased in this case. In case of 40 nm particle size, based on the error metrics as mentioned in Table 7, it can be inferred that random forest is a better performing and well fitted model in comparison to other two models. The fitness of the model is dependent upon the closeness between the testing and train errors. The contour plot shown in Figure 7 for surface roughness with particle size 40 nm depicts the variation in surface roughness along with feed rate and nanoparticle concentration. Here also the dark blue region shows the optimum or minimum value of surface roughness at fixed velocity 90 m/min and depth of cut at 0.9. The comparison between the predictive and experimental values is depicted in Figure 8.

4. Conclusions

The machining of AISI 304 steel was conducted in a mist lubrication environment of varying sizes of nanoparticles in the cutting fluid, and surface roughness was measured in both the conditions. The surface roughness was predicted using different machine learning algorithms for both the particle sizes, which is the novelty of the study performed. The application of machine learning is suitable in today’s environment in minimizing errors along with time and resources. The following conclusions can be drawn from the study:
  • The experimental value of surface roughness obtained from 40 nm particle size of alumina is lower in comparison to 30 nm particle size.
  • Among the three machine learning models used in this study, random forest outperformed the other two models as the errors obtained from the performance metrics in both the cases of average particle size were lower for random forest in comparison to errors obtained from the other two models.
  • The R-squared value of the training errors in case of random forest for 30 and 40 nm size is 0.9710 and 0.7968, respectively.
  • As per the application of the three machine learning models with both the particle sizes, it can be seen that models performed better with 30 nm particle size in comparison to 40 nm.
  • The particle sizes of alumina used in this investigation can be used in further studies for hybridization purpose with other nanofluids to enhance the properties of the cutting fluid.
  • It can be seen that there is a difference between train and test errors, which can be minimized if the data points are increased, as they were limited to 27 in this case.
Furthermore, the prediction of more response parameters such as cutting force, tool tip temperature and cutting power, incorporating various cooling strategies such as cryogenic cooling and high pressure cooling, and optimization of MQL parameters can be explored using machine learning techniques. In order to achieve better accuracy, higher numbers of data points need to be collected i.e., by increasing the number of experiments.

Author Contributions

Conceptualization, V.D. and A.K.S.; methodology, V.D.; software, V.D.; validation, V.D., A.K.S.; formal analysis, V.D. and D.Y.P.; investigation, V.D.; resources, V.D., A.K.S. and D.Y.P.; data curation, V.D.; writing—original draft preparation, V.D.; writing—review and editing, V.D., A.K.S. and D.Y.P.; visualization, V.D.; supervision, A.K.S.; project administration, A.K.S. and. V.D.; All authors have read and agreed to the published version of the manuscript.

Funding

This research received no external funding.

Conflicts of Interest

The authors declare no conflict of interest.

Nomenclature

LRLinear Regression
SVRSupport Vector Regression
RFRandom Forest
MSEMean Square Error
MAPEMean Absolute Percentage Error
ANNArtificial Neural Network
DNNDeep Neural Network
BPNNBack Propagation Neural Network
Ydependent variable
Xindependent variable
aointercept of the line
a1linear regression coefficient
εrandom error
Yiobserved values
Ŷpredicted values

References

  1. Tsourveloudis, N.C. Predictive modeling of the Ti6Al4V alloy surface roughness. J. Intell. Robot. Syst. Theory Appl. 2010, 60, 513–530. [Google Scholar] [CrossRef]
  2. Varun, A.; Kumar, M.S.; Murumulla, K.; Sathvik, T. Surface roughness prediction using machine learning algorithms while turning under different lubrication conditions. J. Phys. Conf. Ser. 2021, 2070, 012243. [Google Scholar] [CrossRef]
  3. Elangovan, M.; Sakthivel, N.R.; Saravanamurugan, S.; Nair, B.B.; Sugumaran, V. Machine learning approach to the prediction of surface roughness using statistical features of vibration signal acquired in turning. Procedia Comput. Sci. 2015, 50, 282–288. [Google Scholar] [CrossRef] [Green Version]
  4. Raza, S.M.; Khan, A.M.; Farooq, M.U.; Iqbal, A.; Pimenov, D.Y.; Giasin, K.; Leksycki, K. Modelling and analysis of surface evolution on turning of hard-to-cut CLARM 30NiCrMoV14 steel alloy. Metals 2021, 11, 1751. [Google Scholar] [CrossRef]
  5. Dubey, V.; Sharma, A.K.; Vats, P.; Pimenov, D.Y.; Giasin, K.; Chuchala, D. Study of a multicriterion decision-making approach to the Mql turning of Aisi 304 steel using hybrid nanocutting fluid. Materials 2021, 14, 7207. [Google Scholar] [CrossRef]
  6. Sharma, A.K.; Tiwari, A.K.; Dixit, A.R. Effects of Minimum Quantity Lubrication (MQL) in machining processes using conventional and nanofluid based cutting fluids: A comprehensive review. J. Clean. Prod. 2016, 127, 1–18. [Google Scholar] [CrossRef]
  7. Abbas, A.T.; Gupta, M.K.; Soliman, M.S.; Mia, M.; Hegab, H.; Luqman, M.; Pimenov, D.Y. Sustainability assessment associated with surface roughness and power consumption characteristics in nanofluid MQL-assisted turning of AISI 1045 steel. Int. J. Adv. Manuf. Technol. 2019, 105, 1311–1327. [Google Scholar] [CrossRef]
  8. Mia, M.; Gupta, M.K.; Singh, G.; Królczyk, G.; Pimenov, D.Y. An approach to cleaner production for machining hardened steel using different cooling-lubrication conditions. J. Clean. Prod. 2018, 187, 1069–1081. [Google Scholar] [CrossRef]
  9. Sampaio, M.A.; Machado, Á.R.; Laurindo, C.A.H.; Torres, R.D.; Amorim, F.L. Influence of Minimum Quantity of Lubrication (MQL) when turning hardened SAE 1045 steel: A comparison with dry machining. Int. J. Adv. Manuf. Technol. 2018, 98, 959–968. [Google Scholar] [CrossRef]
  10. Gupta, M.K.; Boy, M.; Erdi Korkmaz, M.; Yaşar, N.; Günay, M.; Krolczyk, G.M. Measurement and analysis of machining induced tribological characteristics in dual jet minimum quantity lubrication assisted turning of duplex stainless steel. Meas. J. Int. Meas. Confed. 2022, 187, 110353. [Google Scholar] [CrossRef]
  11. Bonfá, M.M.; Costa, É.S.; Sales, W.F.; Amorim, F.L.; Maia, L.H.A.; Machado, Á.R. Evaluation of tool life and workpiece surface roughness in turning of AISI D6 hardened steel using PCBN tools and Minimum Quantity of Lubricant (MQL) applied at different directions. Int. J. Adv. Manuf. Technol. 2019, 103, 971–984. [Google Scholar] [CrossRef]
  12. Khanna, N.; Shah, P.; Sarikaya, M.; Pusavec, F. Energy consumption and ecological analysis of sustainable and conventional cutting fluid strategies in machining 15–5 PHSS. Sustain. Mater. Technol. 2022, 32, e00416. [Google Scholar] [CrossRef]
  13. Dubey, V.; Kumar Sharma, A.; Kumar Singh, R. Study of various cooling methodology used in machining processes. Mater. Today Proc. 2020, 21, 1572–1576. [Google Scholar] [CrossRef]
  14. Sizemore, N.E.; Nogueira, M.L.; Greis, N.P.; Davies, M.A. Application of machine learning to the prediction of surface roughness in diamond machining. Procedia Manuf. 2020, 48, 1029–1040. [Google Scholar] [CrossRef]
  15. Reddy, B.S.; Padmanabha, G.; Reddy, K.V.K. Surface roughness prediction techniques for CNC Turning. Asian J. Sci. Res. 2008, 1, 256–264. [Google Scholar] [CrossRef] [Green Version]
  16. Eser, A.; Aşkar Ayyildiz, E.; Ayyildiz, M.; Kara, F. Artificial intelligence-based surface roughness estimation modelling for milling of AA6061 alloy. Adv. Mater. Sci. Eng. 2021, 2021. [Google Scholar] [CrossRef]
  17. Manjunath, K.; Tewary, S.; Khatri, N.; Cheng, K. Monitoring and predicting the surface generation and surface roughness in ultraprecision machining: A critical review. Machines 2021, 9, 369. [Google Scholar] [CrossRef]
  18. Ross, N.S.; Gopinath, C.; Nagarajan, S.; Gupta, M.K.; Shanmugam, R.; Kumar, M.S.; Boy, M.; Korkmaz, M.E. Impact of hybrid cooling approach on milling and surface morphological characteristics of Nimonic 80A alloy. J. Manuf. Process. 2022, 73, 428–439. [Google Scholar] [CrossRef]
  19. Alajmi, M.S.; Almeshal, A.M. Prediction and optimization of surface roughness in a turning process using the ANFIS-QPSO method. Materials 2020, 13, 2986. [Google Scholar] [CrossRef]
  20. Pimenov, D.Y.; Bustillo, A.; Wojciechowski, S.; Sharma, V.S.; Gupta, M.K.; Kuntoğlu, M. Artificial intelligence systems for tool condition monitoring in machining: Analysis and critical review. J. Intell. Manuf. 2022, 1–43. [Google Scholar] [CrossRef]
  21. Pandey, K.; Dubey, V.; Sharma, A.K.; Mital, A. State of art on tribological behaviour of nanoparticle enriched cutting fluid. Mater. Today Proc. 2019, 26, 2586–2589. [Google Scholar] [CrossRef]
  22. Abbas, A.T.; Benyahia, F.; El Rayes, M.M.; Pruncu, C.; Taha, M.A.; Hegab, H. Towards optimization of machining performance and sustainability aspects when turning AISI 1045 steel under different cooling and lubrication strategies. Materials 2019, 12, 3023. [Google Scholar] [CrossRef] [PubMed] [Green Version]
  23. Khanna, N.; Shah, P.; de Lacalle, L.N.L.; Rodríguez, A.; Pereira, O. In pursuit of sustainable cutting fluid strategy for machining Ti-6Al-4V using life cycle analysis. Sustain. Mater. Technol. 2021, 29, e00301. [Google Scholar] [CrossRef]
  24. Dubey, V.; Sharma, A.K.; Kumar, H.; Arora, P.K. Prediction of cutting forces in MQL turning of AISI 304 steel using machine learning algorithm. J. Eng. Res. 2022, 1–13. [Google Scholar] [CrossRef]
  25. Şap, S.; Usca, Ü.A.; Uzun, M.; Kuntoğlu, M.; Salur, E.; Pimenov, D.Y. Investigation of the effects of cooling and lubricating strategies on tribological characteristics in machining of hybrid composites. Lubricants 2022, 10, 63. [Google Scholar] [CrossRef]
  26. Pereira, O.; Rodríguez, A.; Calleja-Ochoa, A.; Celaya, A.; de Lacalle, L.N.L.; Fernández-Valdivielso, A.; González, H. Simulation of cryo-cooling to improve super alloys cutting tools. Int. J. Precis. Eng. Manuf. Green Technol. 2022, 9, 73–82. [Google Scholar] [CrossRef]
  27. Magalhães, L.C.; Carlesso, G.C.; de Lacalle, L.N.L.; Souza, M.T.; de Palheta, F.O.; Binder, C. Tool wear effect on surface integrity in AISI 1045 steel dry turning. Materials 2022, 15, 2031. [Google Scholar] [CrossRef]
  28. Abrão, B.S.; Pereira, M.F.; da Silva, L.R.R.; Machado, Á.R.; Gelamo, R.V.; de Freitas, F.M.C.; Mia, M.; da Silva, R.B. Improvements of the Mql cooling-lubrication condition by the addition of multilayer graphene platelets in peripheral grinding of Sae 52100 steel. Lubricants 2021, 9, 79. [Google Scholar] [CrossRef]
  29. Baldin, V.; da Silva, L.R.R.; Houck, C.F.; Gelamo, R.V.; Machado, Á.R. Effect of graphene addition in cutting fluids applied by Mql in end milling of Aisi 1045 steel. Lubricants 2021, 9, 70. [Google Scholar] [CrossRef]
  30. Pereira, O.; Rodríguez, A.; Fernández-Abia, A.I.; Barreiro, J.; López de Lacalle, L.N. Cryogenic and minimum quantity lubrication for an eco-efficiency turning of AISI 304. J. Clean. Prod. 2016, 139, 440–449. [Google Scholar] [CrossRef]
  31. Pereira, O.; Martín-Alfonso, J.E.; Rodríguez, A.; Calleja, A.; Fernández-Valdivielso, A.; López de Lacalle, L.N. Sustainability analysis of lubricant oils for minimum quantity lubrication based on their tribo-rheological performance. J. Clean. Prod. 2017, 164, 1419–1429. [Google Scholar] [CrossRef]
  32. Çamlı, K.Y.; Demirsöz, R.; Boy, M.; Korkmaz, M.E.; Yaşar, N.; Giasin, K.; Pimenov, D.Y. Performance of MQL and Nano-MQL lubrication in machining ER7 steel for train wheel applications. Lubricants 2022, 10, 48. [Google Scholar] [CrossRef]
  33. Korkmaz, M.E.; Gupta, M.K.; Boy, M.; Yaşar, N.; Krolczyk, G.M.; Günay, M. Influence of duplex jets MQL and Nano-MQL cooling system on machining performance of Nimonic 80A. J. Manuf. Process. 2021, 69, 112–124. [Google Scholar] [CrossRef]
  34. Danish, M.; Gupta, M.K.; Rubaiee, S.; Ahmed, A.; Korkmaz, M.E. Influence of hybrid cryo-MQL Lubri-cooling strategy on the machining and tribological characteristics of inconel 718. Tribol. Int. 2021, 163, 107178. [Google Scholar] [CrossRef]
  35. Tasdelen, B.; Thordenberg, H.; Olofsson, D. An Experimental investigation on contact length during Minimum Quantity Lubrication (MQL) machining. J. Mater. Process. Technol. 2008, 203, 221–231. [Google Scholar] [CrossRef]
  36. Cica, D.; Sredanovic, B.; Tesic, S.; Kramar, D. Predictive modeling of turning operations under different cooling/lubricating conditions for sustainable manufacturing with machine learning techniques. Appl. Comput. Inform. 2020. [CrossRef]
  37. Lin, W.J.; Lo, S.H.; Young, H.T.; Hung, C.L. Evaluation of deep learning neural networks for surface roughness prediction using vibration signal analysis. Appl. Sci. 2019, 9, 1462. [Google Scholar] [CrossRef] [Green Version]
  38. Dubey, V.; Sharma, A.K.; Singh, R.K. A technological review on temperature measurement techniques in various machining processes. In Lecture Notes in Mechanical Engineering; Springer: Singapore, 2021. [Google Scholar] [CrossRef]
  39. Aggogeri, F.; Pellegrini, N.; Tagliani, F.L. Recent advances on machine learning applications in machining processes. Appl. Sci. 2021, 11, 8764. [Google Scholar] [CrossRef]
  40. Gupta, M.K.; Korkmaz, M.E.; Sarıkaya, M.; Krolczyk, G.M.; Günay, M.; Wojciechowski, S. Cutting forces and temperature measurements in cryogenic assisted turning of AA2024-T351 alloy: An experimentally validated simulation approach. Meas. J. Int. Meas. Confed. 2022, 188, 110594. [Google Scholar] [CrossRef]
  41. Chen, C.H.; Jeng, S.Y.; Lin, C.J. Prediction and analysis of the surface roughness in CNC end milling using neural networks. Appl. Sci. 2022, 12, 393. [Google Scholar] [CrossRef]
  42. Chen, Y.; Sun, R.; Gao, Y.; Leopold, J. A nested-ANN prediction model for surface roughness considering the effects of cutting forces and tool vibrations. Meas. J. Int. Meas. Confed. 2017, 98, 25–34. [Google Scholar] [CrossRef]
  43. Bustillo, A.; Reis, R.; Machado, A.R.; Pimenov, D.Y. Improving the accuracy of machine-learning models with data from machine test repetitions. J. Intell. Manuf. 2022, 33, 203–221. [Google Scholar] [CrossRef]
  44. Azure, J.W.A.; Ayawah, P.E.A.; Kaba, A.G.A.; Kadingdi, F.A.; Frimpong, S. Hydraulic shovel digging phase simulation and force prediction using machine learning techniques. Mining Metall. Explor. 2021, 38, 2393–2404. [Google Scholar] [CrossRef]
  45. Cheng, J.; Li, G.; Chen, X. Developing a travel time estimation method of freeway based on floating car using random forests. J. Adv. Transp. 2019, 2019, 1–13. [Google Scholar] [CrossRef]
  46. Jurkovic, Z.; Cukor, G.; Brezocnik, M.; Brajkovic, T. A comparison of machine learning methods for cutting parameters prediction in high speed turning process. J. Intell. Manuf. 2018, 29, 1683–1693. [Google Scholar] [CrossRef]
  47. Cervantes, J.; Garcia-Lamont, F.; Rodríguez-Mazahua, L.; Lopez, A. A comprehensive survey on support vector machine classification: Applications, challenges and trends. Neurocomputing 2020, 408, 189–215. [Google Scholar] [CrossRef]
  48. Bouacha, K.; Yallese, M.A.; Mabrouki, T.; Rigal, J.F. Statistical analysis of surface roughness and cutting forces using response surface methodology in hard turning of AISI 52100 bearing steel with CBN tool. Int. J. Refract. Met. Hard Mater. 2010, 28, 349–361. [Google Scholar] [CrossRef]
Figure 1. Experimental setup for turning of AISI 304 steel.
Lubricants 10 00081 g001
Figure 2. Pictorial representation of random forest construction [45].
Lubricants 10 00081 g002
Figure 3. Graphical representation of support vector machine [47].
Lubricants 10 00081 g003
Figure 4. Flow chart for support vector machine implementation.
Lubricants 10 00081 g004
Figure 5. Contour plot of surface roughness at 30 nm particle size.
Lubricants 10 00081 g005
Figure 6. Predicted value from three machine learning models at particle size 30 nm.
Lubricants 10 00081 g006
Figure 7. Contour plot of surface roughness at 40 nm.
Lubricants 10 00081 g007
Figure 8. Predicted values from three machine learning models at particle size 40 nm.
Lubricants 10 00081 g008
Table 1. Chemical constituents of AISI 304 steel.
ElementsSPCMoCuSiMnNiCrFe
Weight%0.020.0270.0650.130.140.31.788.118.271.2
Table 2. Input parameters used in the current study.
Levels/Factors−101
Depth of cut (mm)0.60.91.2
Feed rate (mm/rev)0.080.120.16
Cutting speed (m/min)6090120
Nanofluid concentration (wt.%)0.51.01.5
Table 3. Experimental design for MQL turning.
S.No.Cutting Speed
(m/min)
Feed Rate
(mm/rev)
Depth of Cut
(mm)
Nanoparticle Concentration
(%)
Surface Roughness at 30 nmSurface Roughness
at 40 nm
1900.161.212.892.63
2600.121.212.322.30
31200.120.91.51.401.43
4600.120.612.372.16
5900.120.912.302.05
6600.120.90.52.502.36
71200.121.211.641.77
81200.080.911.791.63
9900.081.211.571.72
10600.080.912.081.89
11900.120.911.992.02
121200.120.90.52.121.92
13900.121.21.51.811.83
14900.120.912.021.98
15600.160.913.012.95
161200.120.612.031.91
17900.120.60.52.242.05
18900.080.611.821.66
19900.080.90.52.312.21
20900.080.91.51.411.57
21600.120.91.51.812.05
22900.121.20.52.212.05
23900.120.61.51.781.97
24900.160.612.932.76
25900.160.91.52.392.53
26900.160.90.52.962.67
271200.160.912.492.55
Table 4. Predicted values from different machine learning algorithms at particle size 30 nm.
Experiment NumberExperimented ValuePredicted SVRPredicted RFPredicted LR
91.571.581.581.48
142.022.161.942.10
102.082.142.352.18
222.212.452.382.36
12.892.952.913.29
122.122.272.372.23
172.242.552.382.40
181.821.861.811.82
131.811.791.801.81
Table 5. Performance metrics at particle size 30 nm.
Test ErrorsTrain Errors
Models/Performance MetricsR-SquaredMSEMAPER-SquaredMSEMAPE
SVR0.80530.02380.05470.97530.00570.0336
RF0.81760.02230.05150.97100.00670.0322
LR0.76600.02870.054714.6838 × 10−313.0185 × 10⁻¹⁶
Table 6. Predicted values from different machine learning algorithm at particle size 40 nm.
Experiment NumberExperimented ValuePredicted SVRPredicted RFPredicted LR
91.721.871.871.52
141.982.182.071.93
101.892.071.931.79
222.052.352.262.04
12.632.532.532.95
121.922.101.941.83
172.052.312.232.04
181.661.921.861.43
131.832.031.921.69
Table 7. Performance metrics at particle size 40 nm.
Test ErrorsTrain Errors
Models/Performance MetricsR-SquaredMSEMAPER-SquaredMSEMAPE
SVR0.34890.04590.10750.84970.02540.0642
RF0.72310.01950.06450.79680.03440.0695
LR0.63680.02560.064011.616 × 10−311.5186 × 10⁻¹⁶
Publisher’s Note: MDPI stays neutral with regard to jurisdictional claims in published maps and institutional affiliations.

