Wear Behavior of Bronze vs. 100Cr6 Friction Pairs under Different Lubrication Conditions for Bearing Applications


Department of Mechanical Engineering, Karabük University, Karabük 78050, Turkey
Lubricants 2022, 10(9), 212; https://0-doi-org.brum.beds.ac.uk/10.3390/lubricants10090212
Submission received: 29 July 2022
/
Revised: 18 August 2022
/
Accepted: 30 August 2022
/
Published: 2 September 2022
(This article belongs to the Special Issue Cooling/Lubrication Methods in Surface Engineering and Machining Applications of Different Materials)
Abstract
:Damage due to a shortage or excess of or the pollution of lubricating oil is often cited as one of the most significant issues confronted by the rolling mill sectors. Lubrication can be provided by either central lubrication systems or individual lubrication systems. In this study, the wear characteristics of the mono-block rolling plain bearing material that is utilized in wire rod rolling mills were evaluated under conditions where the lubricating oil medium included either 2.5% of scale, 5% of scale, or no scale at all. In this experimental study, a unique ball-on-flat experimental setup similar to the one used in the ASTM G133-05 standards was used. Bronze was used as the bearing material and 100Cr6 roller-bearing steel was used as a steel ball of 6 mm in diameter. The experiments were carried out at room temperature, at three different sliding speeds of 5 mm/s, 10 mm/s, and 15 mm/s, and with three different loads of 10 N, 20 N, and 30 N. The wear mechanisms were analyzed visually and elementally using Scanning Electron Microscope (SEM) and Energy-Dispersive X-ray Spectroscopy (EDX) methods. An Analysis of Variance (ANOVA) and the Response Surface Method (RSM) were used to analyze the test results, such as volumetric material loss, the coefficient of friction, and the surface profile. In this study, which was carried out in a lubricant environment containing solid particles, the most effective parameter was the environmental parameter. The increase in the number of solid particles caused an increase in volume loss and friction coefficient.
1. Introduction
One of the most important problems encountered in mechanical manufacturing is the damage caused by the lack, excess, or contamination of lubricating oil [1]. Lubrication is an indispensable requirement for almost all mechanical equipment [2]. It is important to provide the requisite amount of oil in the appropriate conditions, regularly, and in sufficient quantity to lubricate the rolling and sliding bearings used in rotating equipment [3,4]. From time to time, contamination problems related to lubricating oils may be encountered, for various reasons. The rolling process includes many elements carrying loads and rotating at high speeds. The monoblock rolling mill is one of the vitally important components of this equipment. Rolling scale, which is a processed product, can mix with the lubrication system during the rolling process. Due to this contamination, three-body abrasive wear is encountered between the plain bearings and the shafts [5,6].
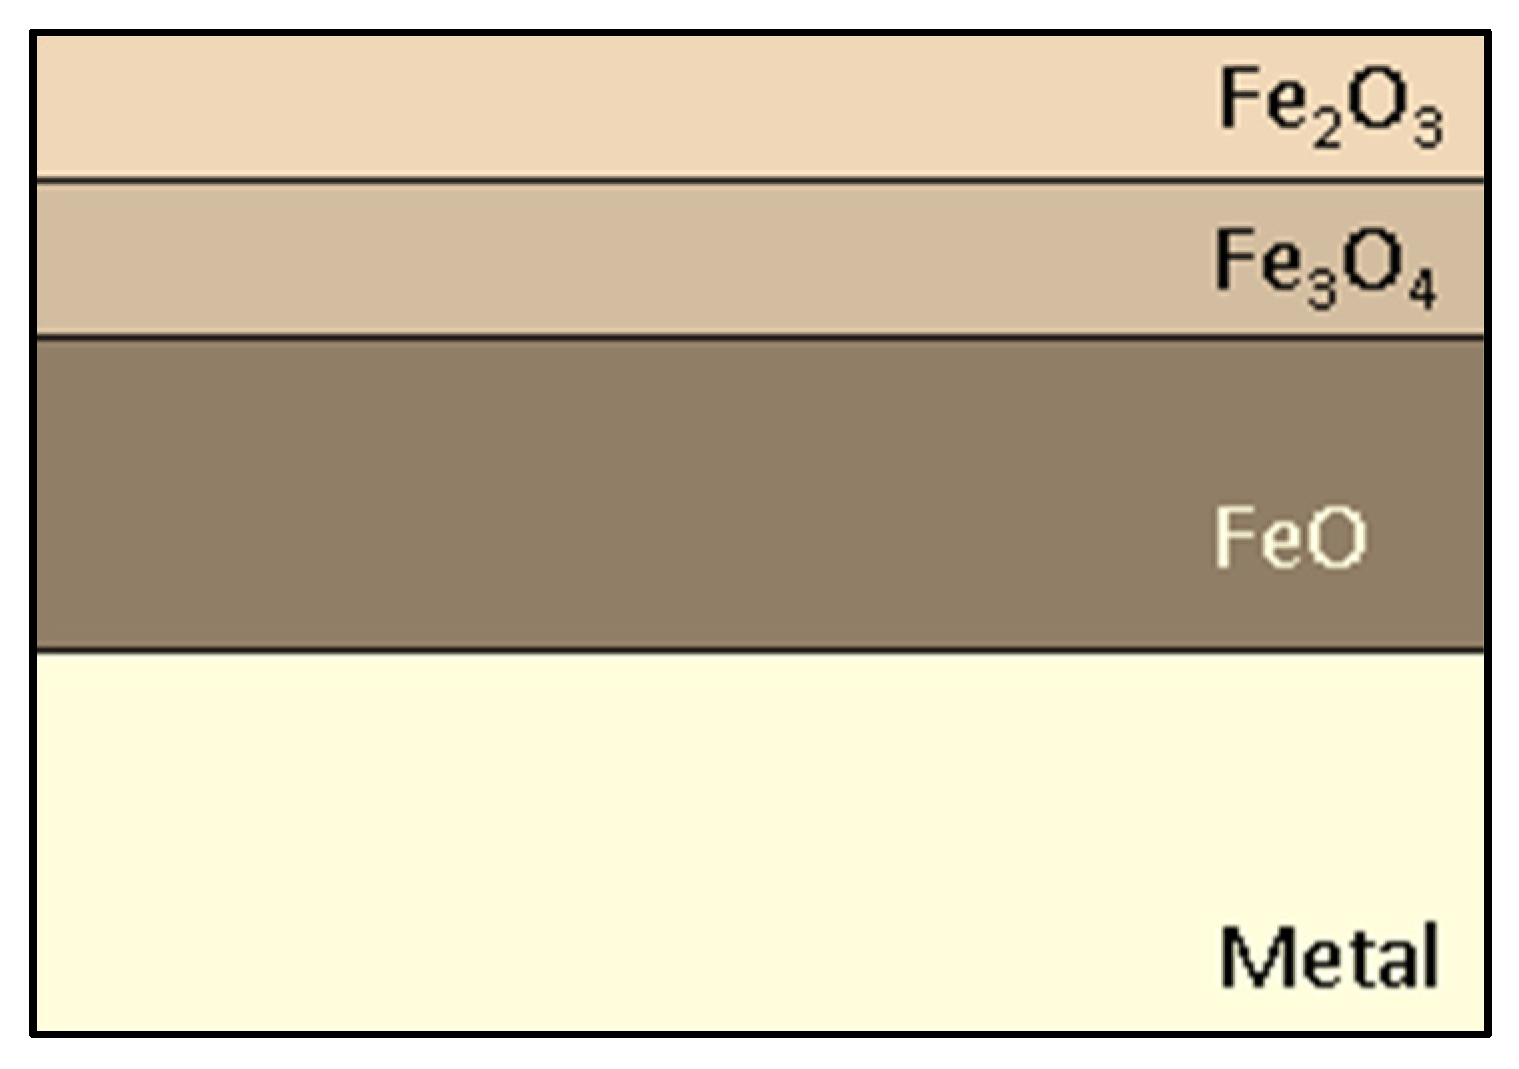
The scale thickness occurring on the surface is located outward from the center as a layered structure of 3 different iron oxide phases, wüstite (FeO), magnetite (Fe3O4), and α-hematite (Fe2O3). The scale structure used in this study is shown in Figure 1. Even if it is probable that the oxide scale will not be destroyed at a quick cooling rate, it is thermodynamically degraded into a mixture of iron and magnetite through a eutectoid process. The eutectoid point of the Fe-O system is 570 °C, and wüstite is unstable below this temperature [7]. The decomposition of the oxide scale occurs at a certain cooling rate [8].
Wear consists of 5 different systems; the losses occur in the material because of the wearing down of the main material, abrasive material, load, intermediate material, movement, and abrasion. These losses commonly cause a progressive deterioration in the material [9]. For this reason, the shape and condition of the material deteriorate over time and performance loss occurs [10,11]. Abrasive wear, which is the most widely known type of wear, is a very important type of wear that may also be called scratching or tearing wear, which can cause rapid and substantial damage to pairs of materials that work together [12,13]. This type of wear can be defined as the removal of hard particles from the material surfaces By the interaction of the material surfaces with particles that are harder than themselves under pressure [14]. An example of this type of wear is the wear caused by dust particles entering the bearing material due to unsuitable operating conditions. If the wearing event is caused by the difference in hardness between the material pair, it is known as two-body wear [15]; on the other hand, if additional abrasive particles also affect the wear, this type of wear is defined as three-body wear [16].
In an example from nature, it was discovered that the water-repellent properties of a lotus leaf were caused by a specific two-size range of roughness on the surface of the leaf. In nature, a lotus leaf’s superhydrophobic characteristics cause it to push back dirt and mud, and it was found that this roughness was responsible for the leaf’s water-repellent properties [17]. Several potential applications for this process in the industry have been proposed for superhydrophobic surfaces, including self-cleaning exteriors [18], transparent windows [19], windshield glass, transparent coatings for panels in the solar energy industry, stain- and water-resistant clothing in the textile industry, surveillance cameras, lenses, and telescopes in the optical industry, ice-phobic coatings in the aerospace and wind turbine industries [20], and corrosion protection and anti-biological coatings in the metal and pipeline industries [21].
Some related studies about this subject are summarized below. As reported by Jin et al. [22], a graphite-plugged bronze sliding plate that had been used in a field experiment was subjected to various topographic and computational evaluations to determine its wear characteristics and contact stress. The results showed that abrasive and adhesive wear, as well as localized fatigue and erosion, were predominant on the graphite-plugged bronze plate’s contacting surface. Elsewhere, Boromei et al. studied the movable parts of a pressing apparatus [15]. The tribo-system, for instance, consists of an AISI A2 steel pin tool and a UNS C95500 aluminum bronze guide plate. A counterformal line contact binds the two parts together. The coefficient of friction of the bronze/steel pair was influenced more by the applied load and sliding speed than by the conditions of the bronze’s heat treatment, according to tribological laboratory tests. Work hardening and the formation of a protective layer of copper oxide on the surface are the major elements in bronze’s excellent wear resistance. Corrosion resistance is another well-known property of bronze [15]. The nickel-aluminum bronze and aluminum alloy, 2014-T6, was subjected to an alternating magnetic field treatment at room temperature by Akram and colleagues [23] in order to improve the material’s wear resistance. Using an AISI52100 steel ball bearing as the counterface material, pin-on-disc wear tests conducted under lubricated conditions showed a decrease in the breadth and depth of wear scars and lower values of the coefficient of friction after the treatment. Despite the fact that the bearings were subjected to significant levels of friction, these results were still achieved. In terms of the worn surface, Lin et al. [24] studied the effects of abrasive grain size, applied stress, and sliding speed on polytetrafluoroethylene/bronze composite particle dispersion density. A range of sandpapers was subjected to a battery of wear tests that included varying loads and sliding speeds. There are three distinct forms of surface density when grain size decreases: a surface density less than, near to, and above the particle’s initial volume fraction value of 15%. A surface density lower than, near to, or higher than its volume fraction is referred to as a “subsurface density.” The shift in wear mechanisms can be used as a rationale for this discovery. Micro-plowing is the primary process responsible for abrasive wear. When the grain size is big enough to permit the flaking-off of bronze particles, the micro-plowing process occurs. A “rolling effect” occurs only when the grain size of the debris is extremely small. Using a unique thrust bearing test equipment setup, Oksanen et al. [25] investigated the potential application of a novel bismuth bronze bi-metal material for the possible substitution of lead–tin bronze. The primary thrust bearing used in mineral crushers is mimicked by this mechanism. The oil-lubricated test bearings featured a flat-on-flat contact type with oil grooves, and the counter plate was made of case-hardened steel. As a result, the bearings were constantly oscillating. The test continued until a sudden rise in friction occurred, which indicated that the bearings had failed and that seizure was imminent. Compared to the reference material, CuSn10Pb10, which was cast continuously, the load capacity of bismuth bronze was found to be equivalent. It was determined by electron microscopy that the dry-lubricating bismuth precipitations had a tiny particle size and an equal distribution. Because of these characteristics, they were able to bear a great deal of weight. Bismuth bronze was found to be an acceptable alternative to lead–tin bronzes under the operational conditions studied [25].
The results of research into the wear behavior of a wide variety of engineering materials show that just a few or no studies on the wear behavior of bronze are available. The novelty of this study is that an evaluation of the tribological wear behavior of bronze against 100Cr6 alloy at various scale ratios in lubrication oil (0, 2.5%, and 5%) is the primary focus of the assay. Using volume loss, wear depth as a two-dimensional (2D) profile, and the coefficient of friction (bronze vs. 100Cr6) as variables, a comprehensive investigation of the wear characteristics has been carried out. With the use of Scanning Electron Microscope (SEM) and Energy-Dispersive X-Ray Spectroscopy (EDX) research, the effect of scale ratios in the lubricating oil on the wear tracks was ultimately determined. The next sections of this paper will give the entire range of information on this tribological investigation.
2. Materials and Methods
2.1. Specimen and Steel Ball
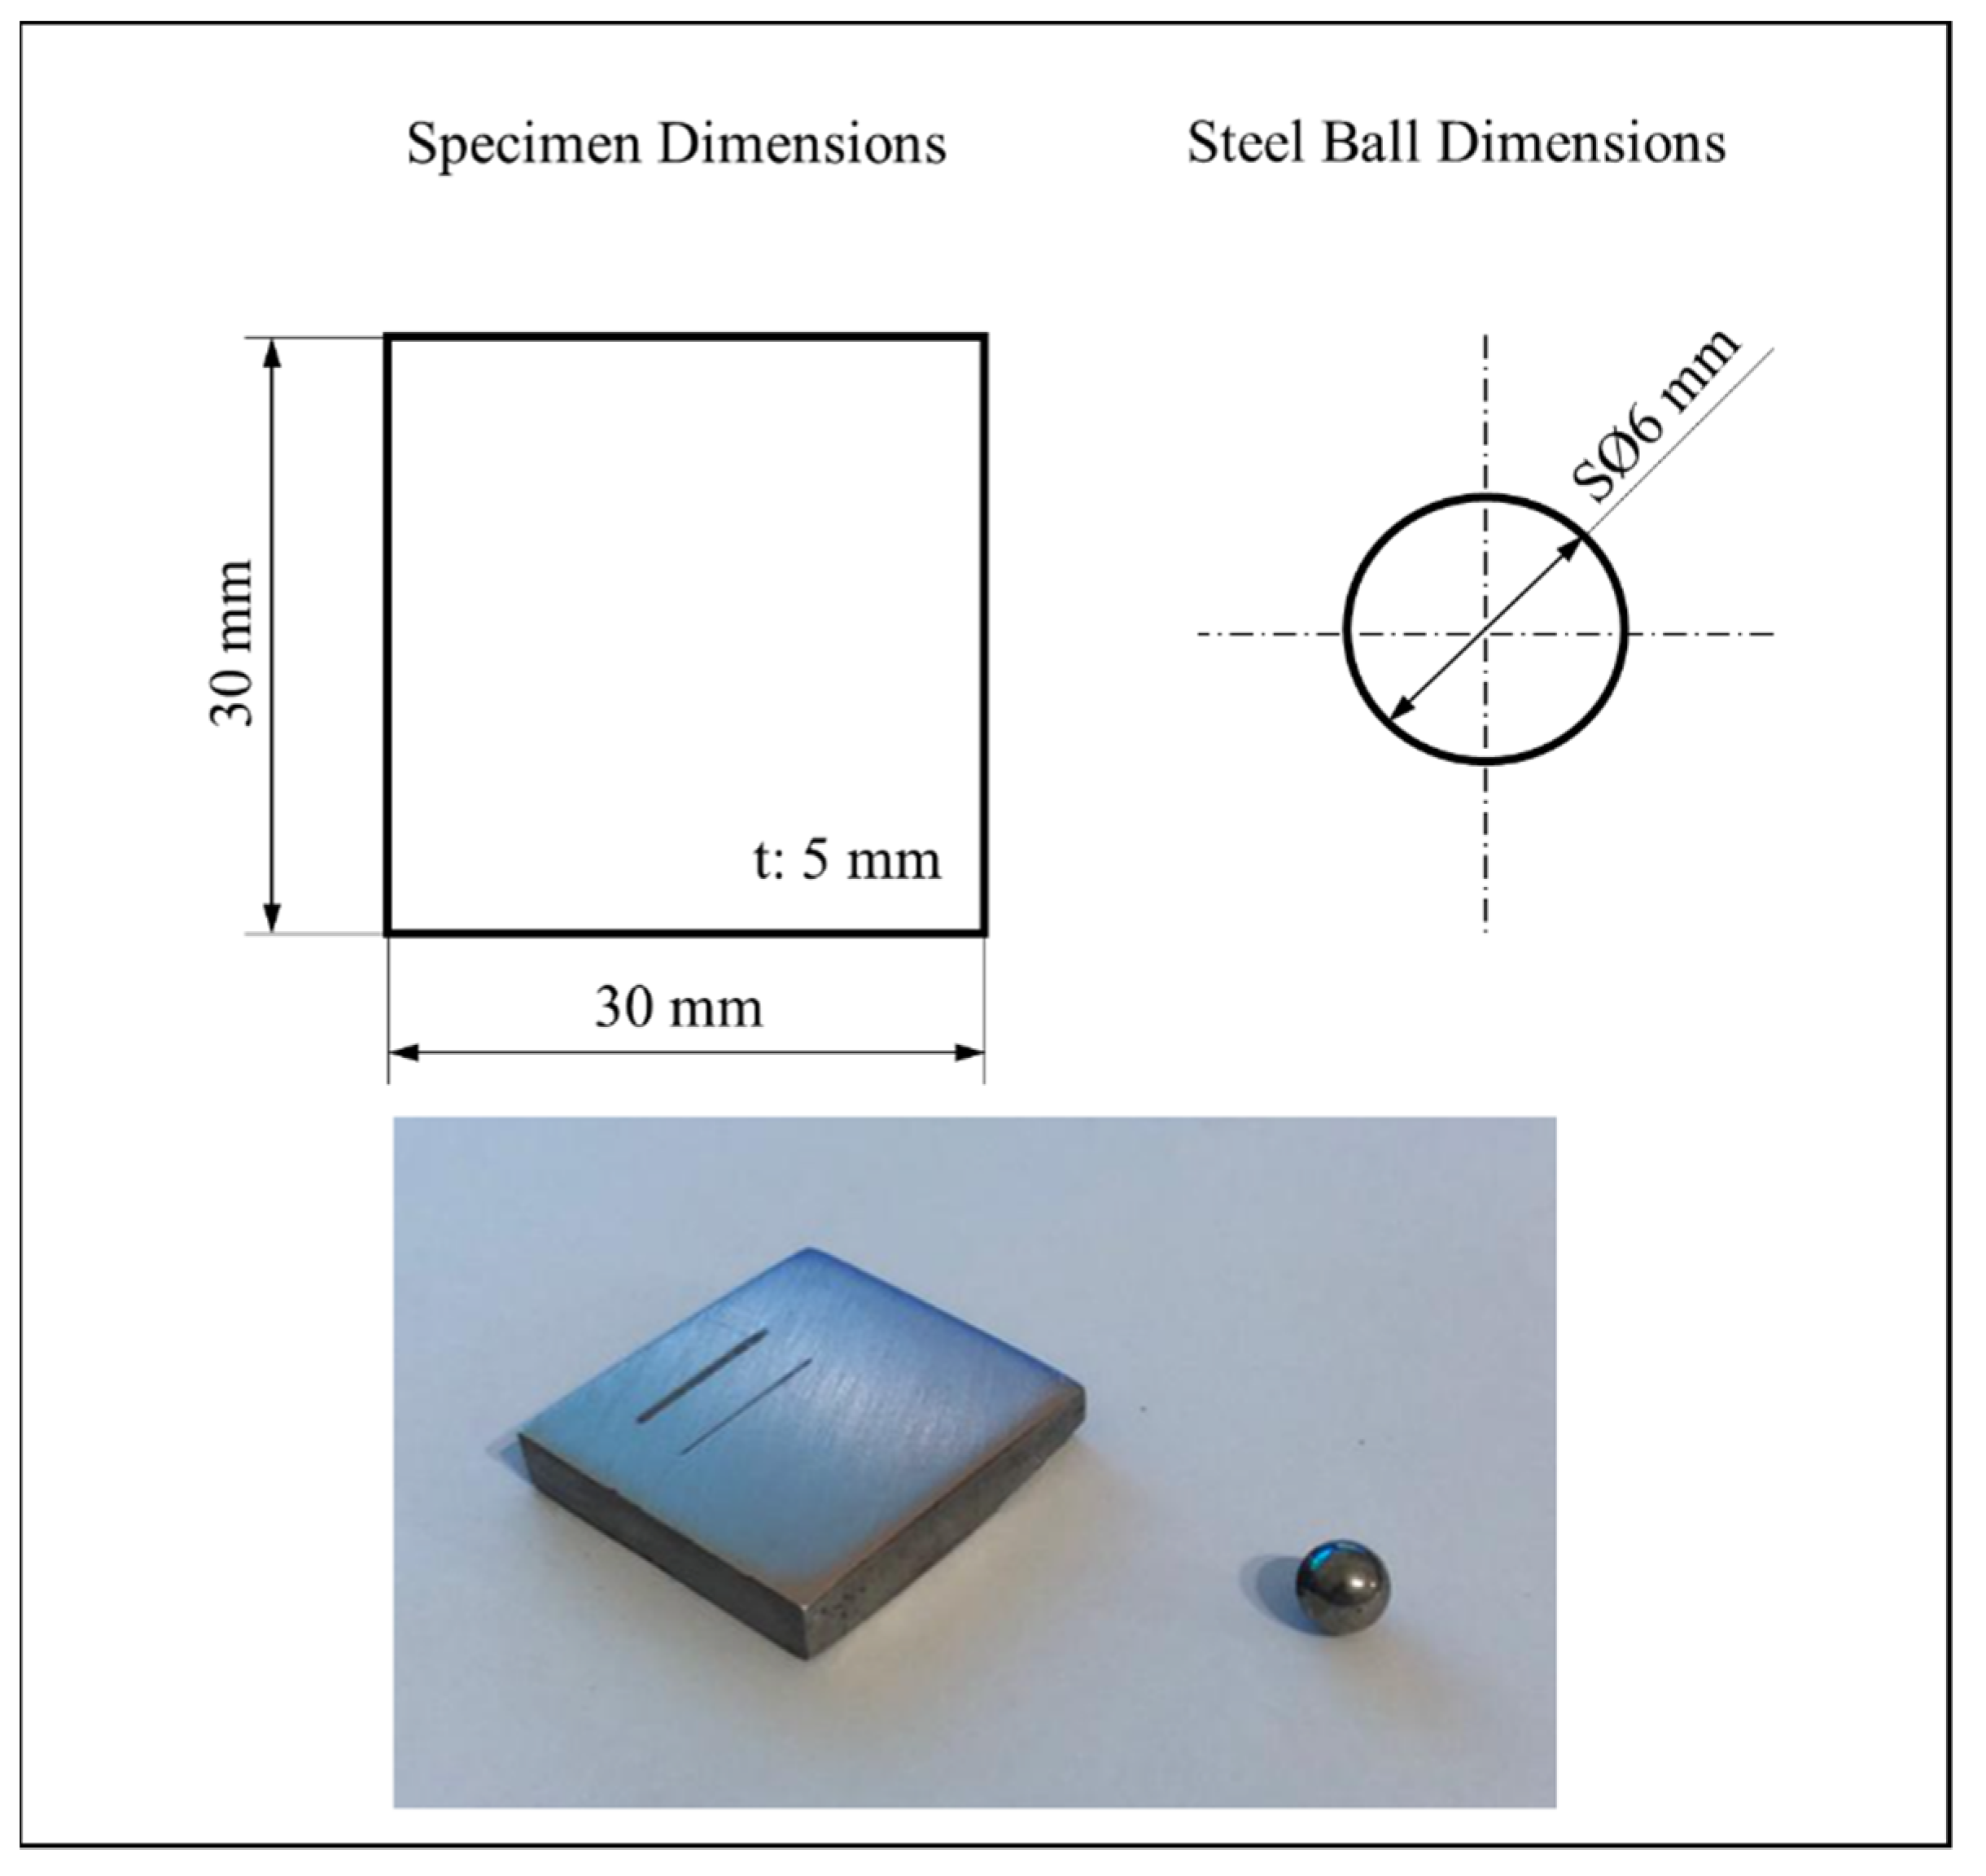
For experiments, 5-millimeter-thick bronze specimens were used, the chemical composition of which is given in Table 1 and ascertained using EDX measurement. Measurements were taken with the Carl Zeiss Ultra Plus Gemini FESEM device located in the Iron and Steel Institute at Karabük University. The dimensions and geometry of the specimens used are given in Figure 2. The specimens were sanded and polished using P400-P800-P1200-grit SiC sandpaper, respectively. The Vickers microhardness value, measured from the specimen surface with the Qness Q10A/A+ device, was recorded as 62 ± 0.41 HV (0.608).
Since the wear of the bearing specimen was the variable examined in the tests, this is why the steel ball was selected from a harder material. For this reason, 100Cr6 (AISI 52100) bearing material with spherical geometry, having a diameter of 6 mm and a hardness of ~64 HRC, was used as an abrasive [26,27,28,29]. The sphere is fixed at the point of attachment and is firmly attached so that it cannot rotate around its axis. In addition, the ball holder is sufficiently rigid that the axis does not change during periodic back-and-forth movements in the sliding direction. After each experiment, the ball was replaced, and each new experiment was started with a new ball. The chemical composition of the ball is given in Table 2.
2.2. Environment Preparation
The oil used in the environment is a multi-application oil that has good anti-wear properties for use with important gears and bearings. In addition, it can be separated from water quickly and has high resistance to oxidation and thermal degradation. The technical information about the oil is given in Table 3.
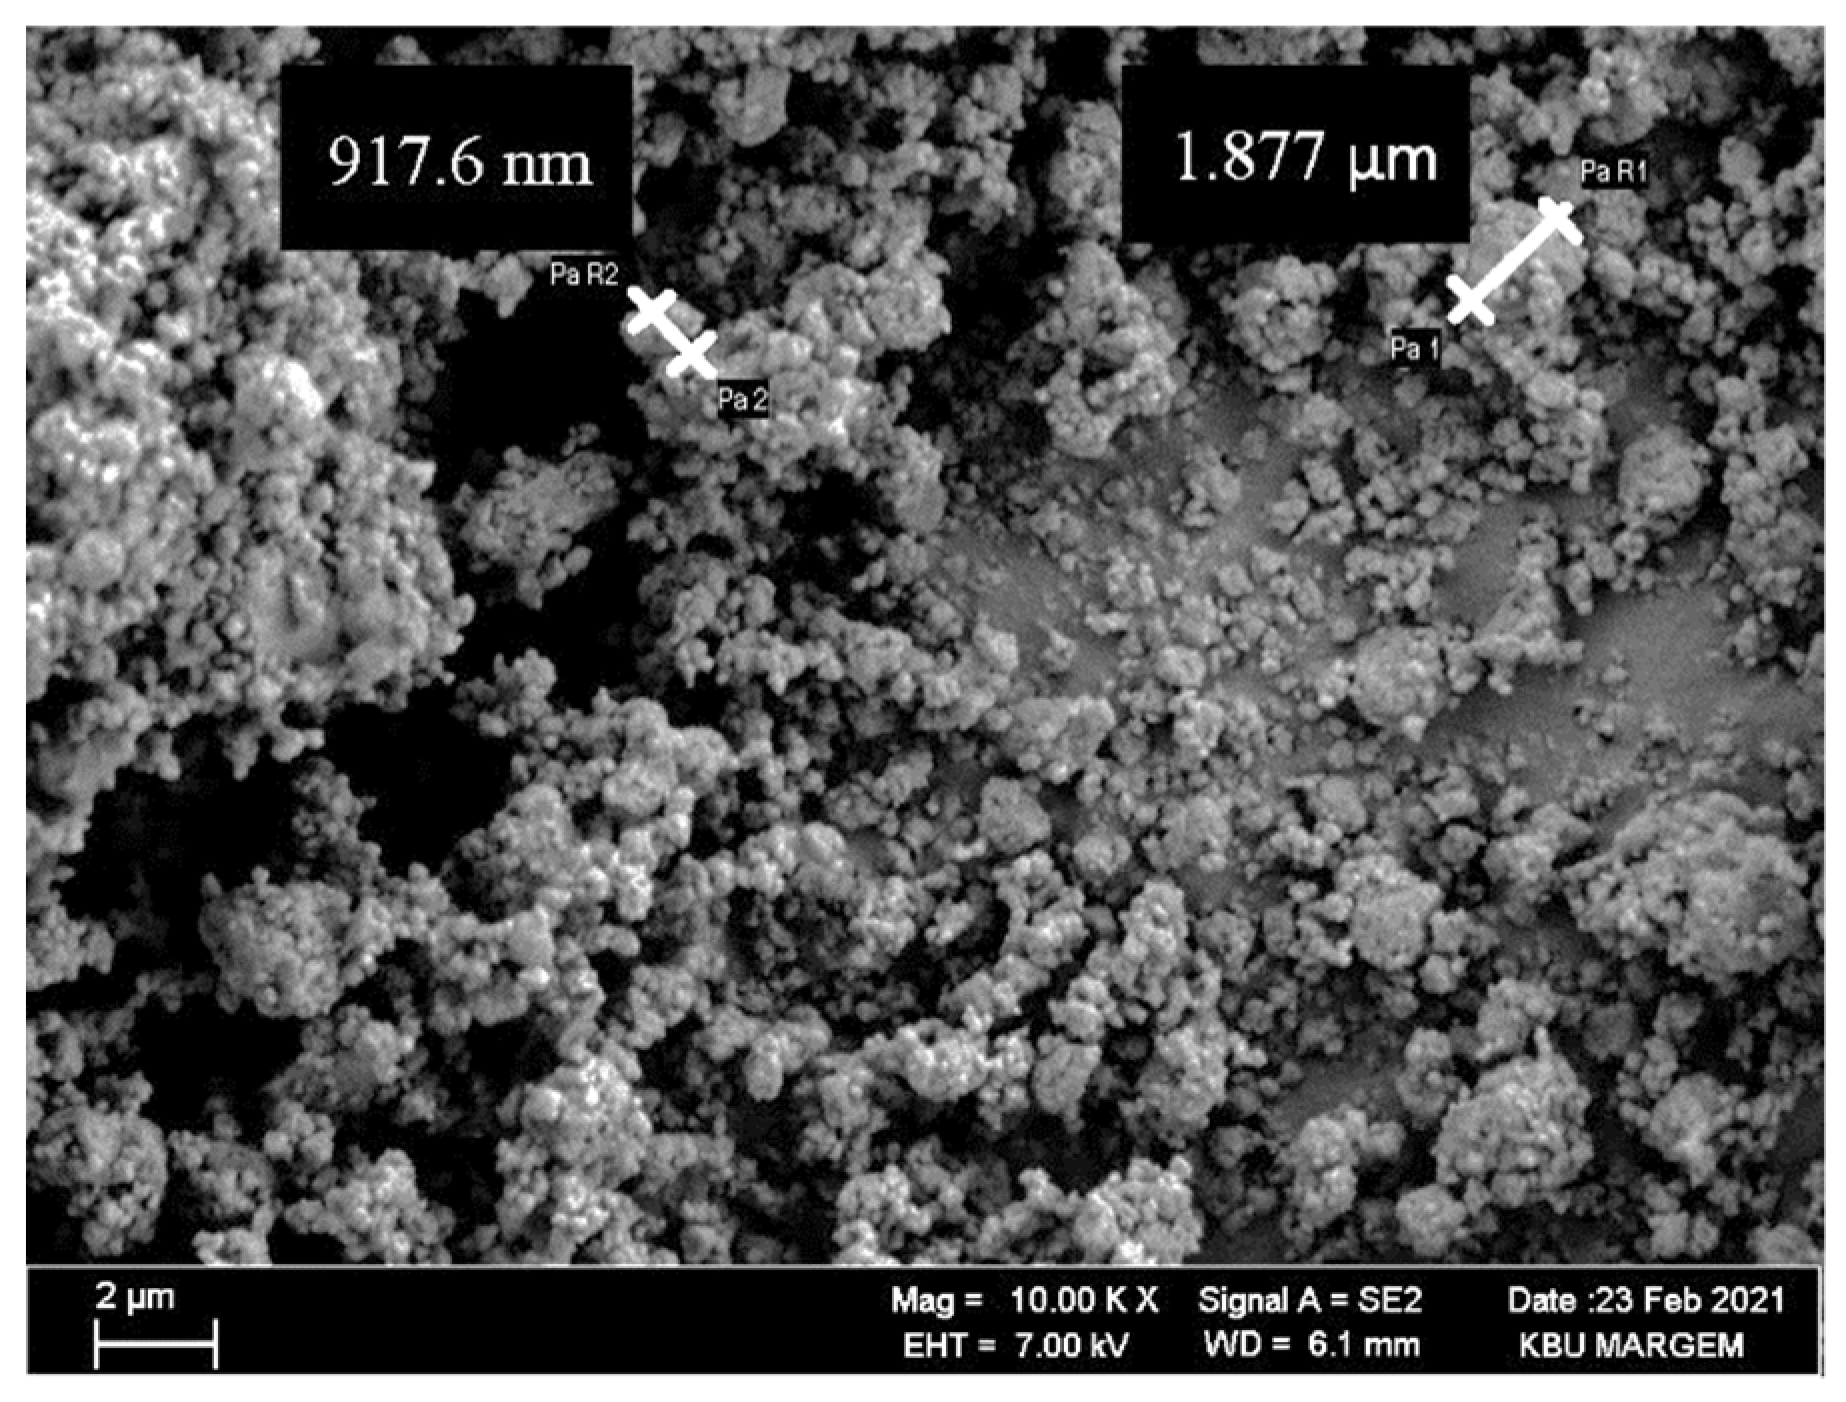
Abrasive particles were obtained by sieving the sample taken from the mill scale through a 25 µm sieve. The reason for choosing the 25 µm sieve size is that the sieves used in the real lubrication system are of this size. An SEM image of the scale sample is shown in Figure 3. It can be seen from the measurements that the grains are quite small in the image. In the EDX analysis of the scale sample, it was determined that the average scale (wt %) consisted of 33.27 O, 66.23% Fe and 0.50% of other elements.
Different environments were created by mixing the mill scale in the oil at the rates of 2.5 wt % and 5 wt %. Lubricant and rolling scale amount adjustments were made using a scale with 0.1 mg sensitivity. As in ASTM G133-05, the lubricant level was adjusted to be slightly above the specimen’s surface level. The medium was prepared by adding 2.5 g of scale to 97.5 g of oil and 5 g of mill scale to 95 g of oil. To determine the sedimentation state of the scale in the obtained mixture, a sedimentation state determination study was carried out before starting the experiments. First, 95 g of oil and 5 g of mill scale were added to a glass container and shaken for 5 min. The mixture was left to rest in a 150-cc glass container. It was observed that the first precipitation took place at the 20th hour, and the full precipitation took place 8 days later. This indicates that the scale’s suspension in the oil would last for approximately 5.5 h in the experimental studies to be carried out and that there would be no precipitation, even in the longest experiment of the study. It should be taken into account that the precipitation tests are carried out in a stationary environment and that the reservoir containing the lubricant is constantly changing direction and is in motion during the tests.
2.3. Abrasive Wear Tests
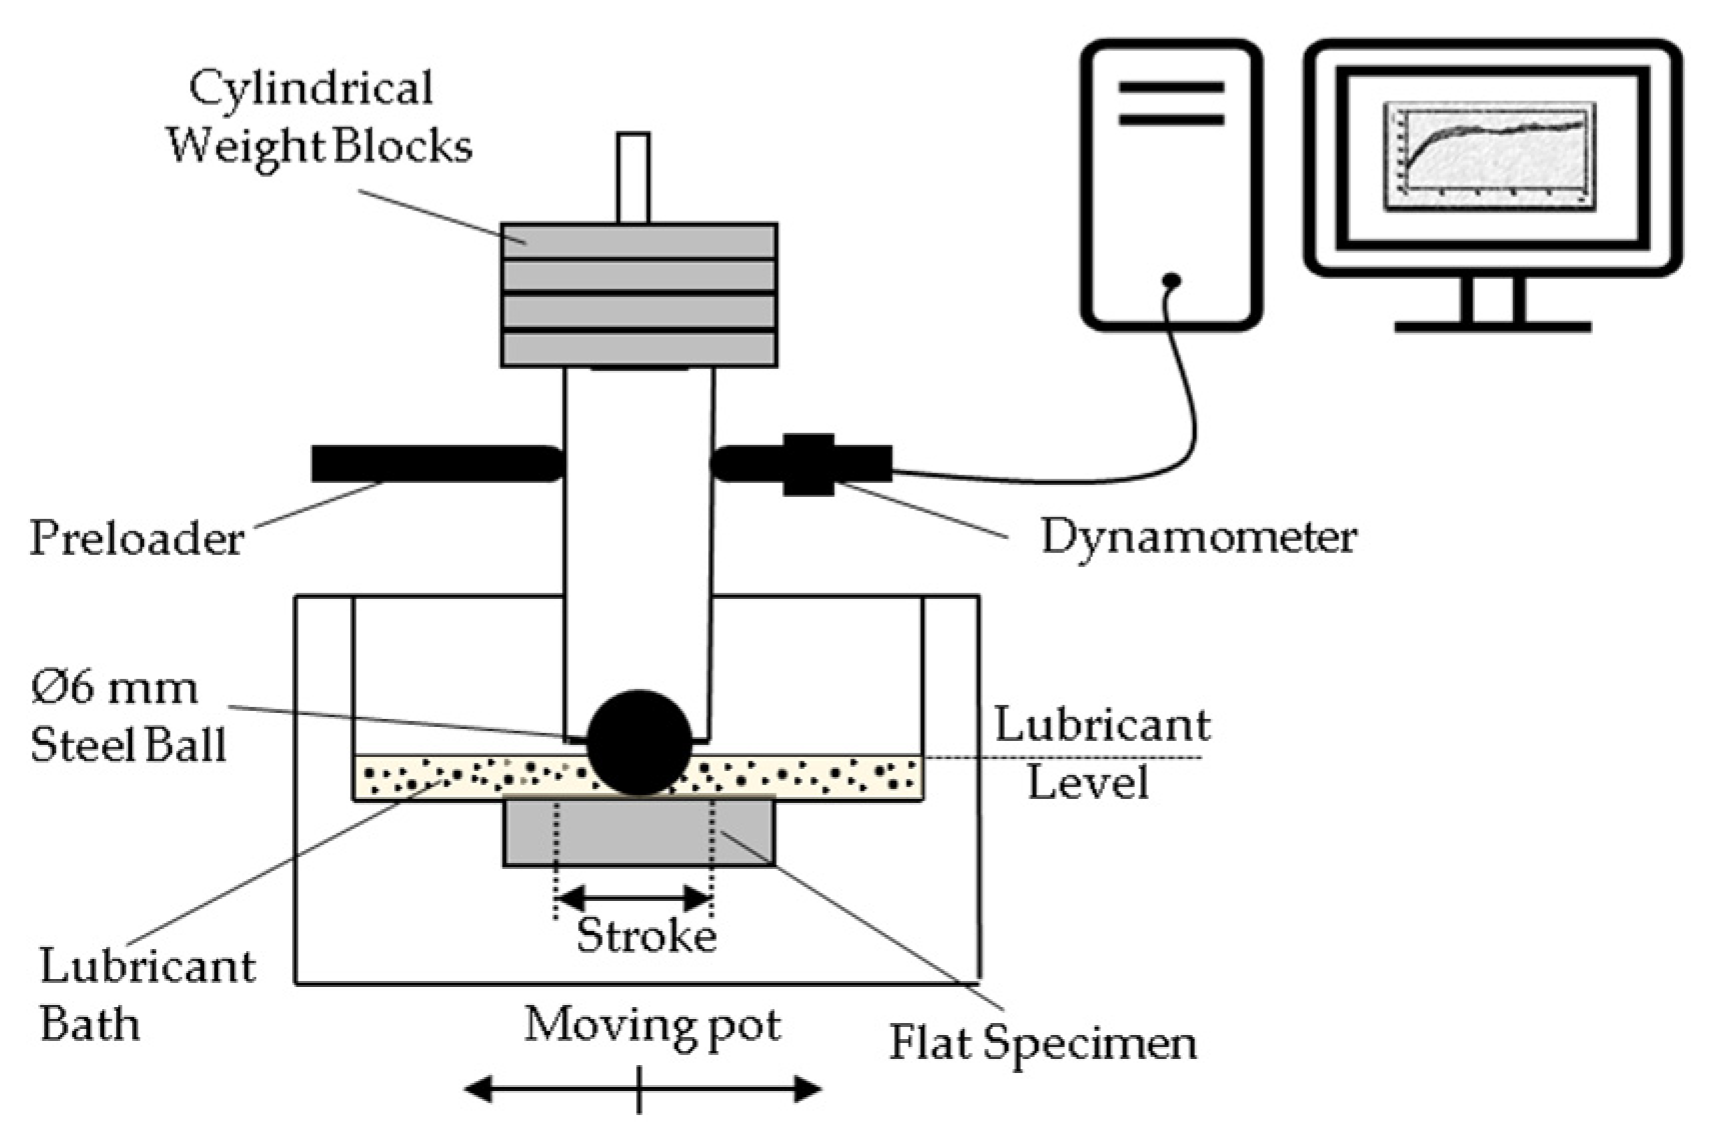
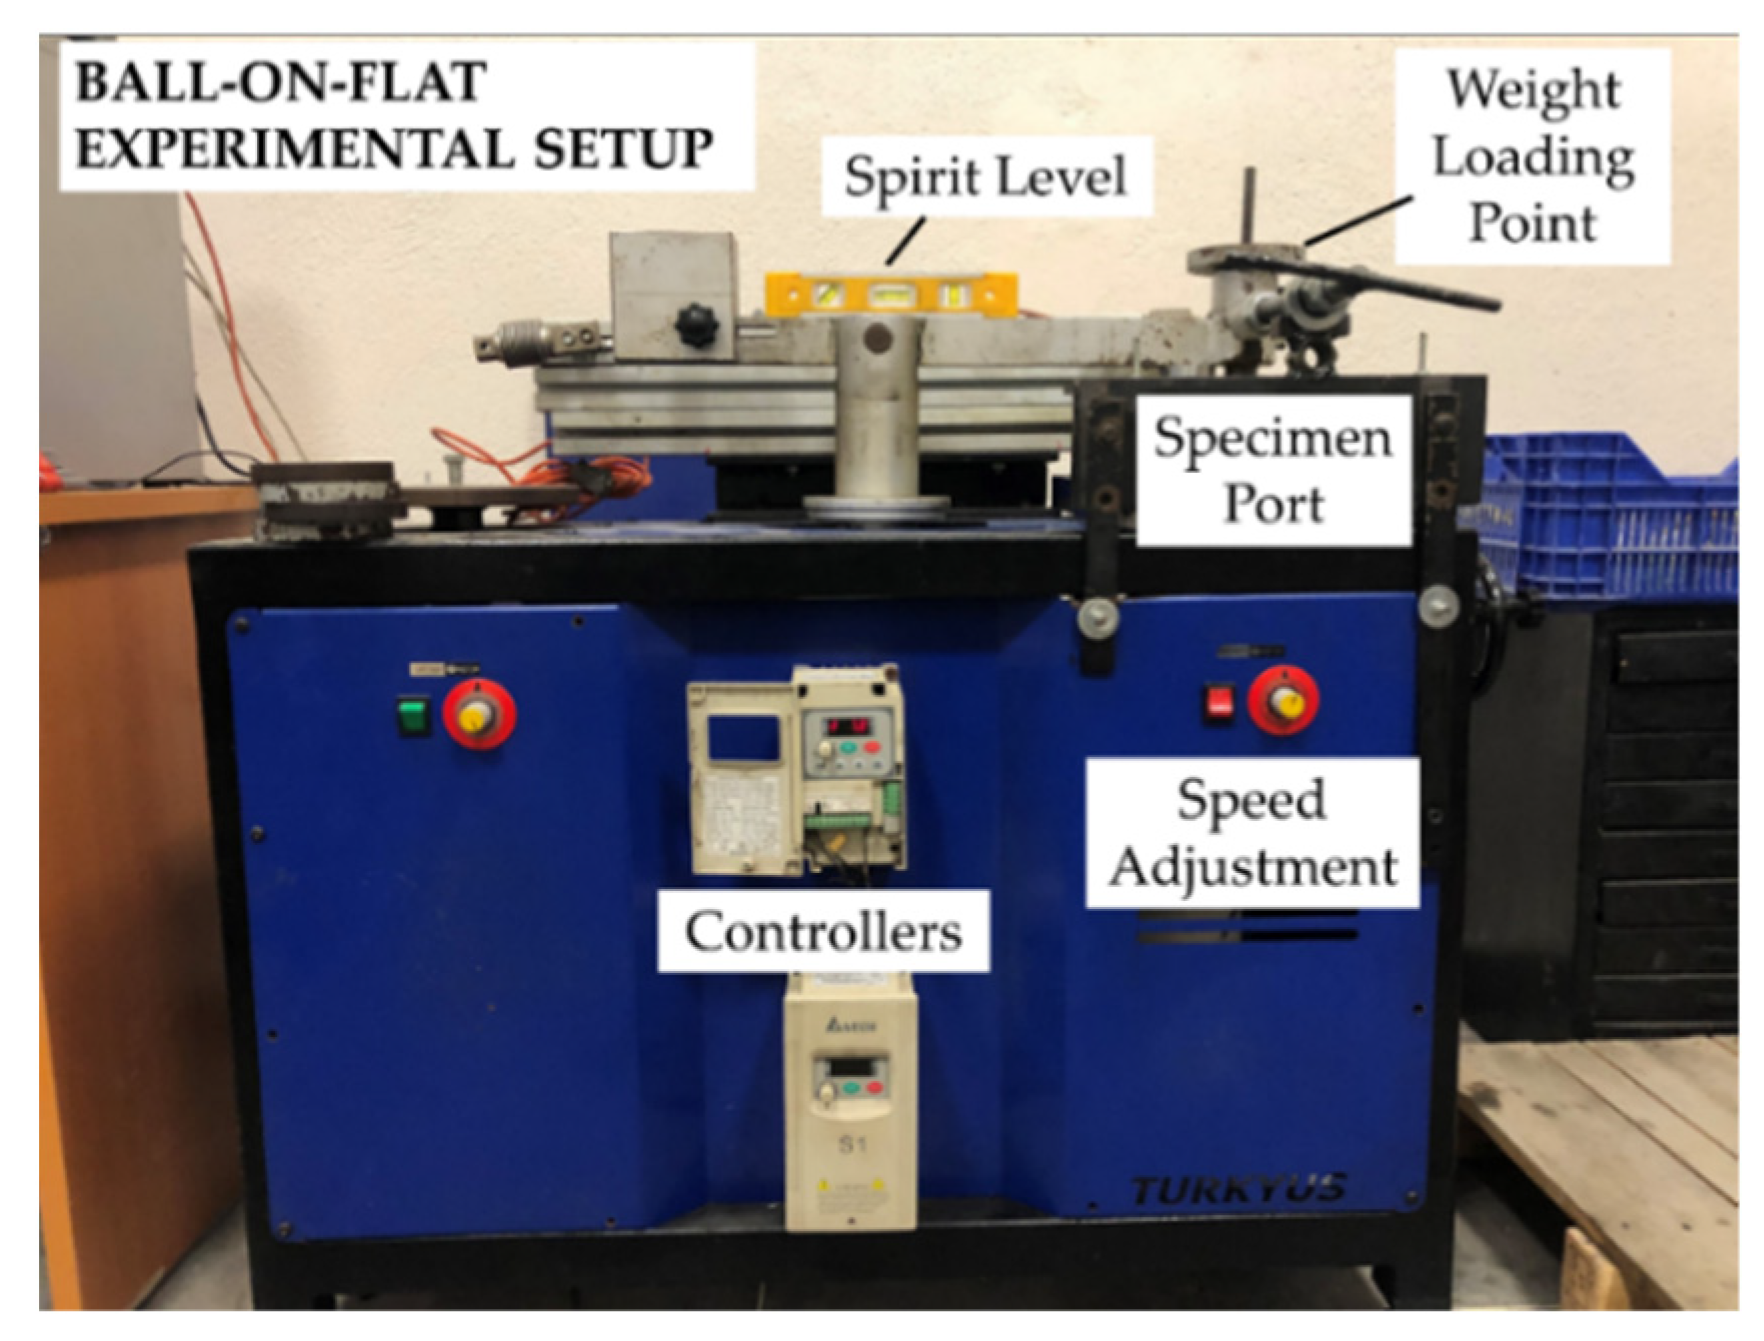
A schematic representation of the experimental setup is given in Figure 4; the stroke length is 13 mm. This ball-on-flat experiment for the wear tests was set up in the Metallurgical and Materials Engineering Laboratory of Karabük University in Turkey; a photograph of the setup is shown in Figure 5. The experiments were carried out at 23 °C room temperature and 55% relative humidity. A planar specimen was exposed to abrasion in the experiments, and the ball was used only as an abrasive. When the data obtained from the preliminary experiments were examined, the amount of wear on the ball was neglected as the level of wear was quite low compared to the specimen. The coefficient of friction was recorded continuously during the experiments. Although it is the same for all conditions, the average of the graph data was taken to determine the coefficients of friction in a steady state. In the measurements of the coefficients of friction, a dynamometer that was capable of measuring load values of up to 500 ± 0.1 N in one axis was used.
Three different load values of 10 N, 20 N, and 30 N, with three different sliding speed values of 5 mm/s, 10 mm/s, and 15 mm/s, were used as suggested by studies in the literature about the rolling process [30]. Experiments were carried out according to the full factorial experimental design and three replications were made for each experiment. After the experiments, the specimens were washed with tap water and cleaned with compressed air, using a compressor set at 7 bar, to remove the wear residues without affecting the weighing results. The specimens were dried for 3 min with a hairdryer to remove any possible moisture coming from the compressor. After drying, the specimens were cleaned with acetone and dried with a hairdryer after cleaning. After all these processes, the DENSI brand HZY 320A model was weighed using a precision balance with a weighing sensitivity of 0.1 mg.
Moreover, using the experimental parameters and results, the effects of the parameters on the results were analyzed with an analysis of variance (ANOVA), using the Minitab software program [31].
2.4. Worn Surface Analysis
In this study, wear mechanisms on surfaces were investigated with a Carl Zeiss Gemini FESEM scanning electron microscope at 5 kV. EDX analyses were performed to determine the wear mechanisms on the surface. Morphological structures seen in the wear track images (SEM) were analyzed in accordance with the literature [32,33]. A Mitutoyo Surf Test 301 profilometer (λs = 2.5 μm) was used to reveal the 2D wear-track profiles of the surface. The average roughness value, Ra, was used for the analyses.
3. Results and Discussions
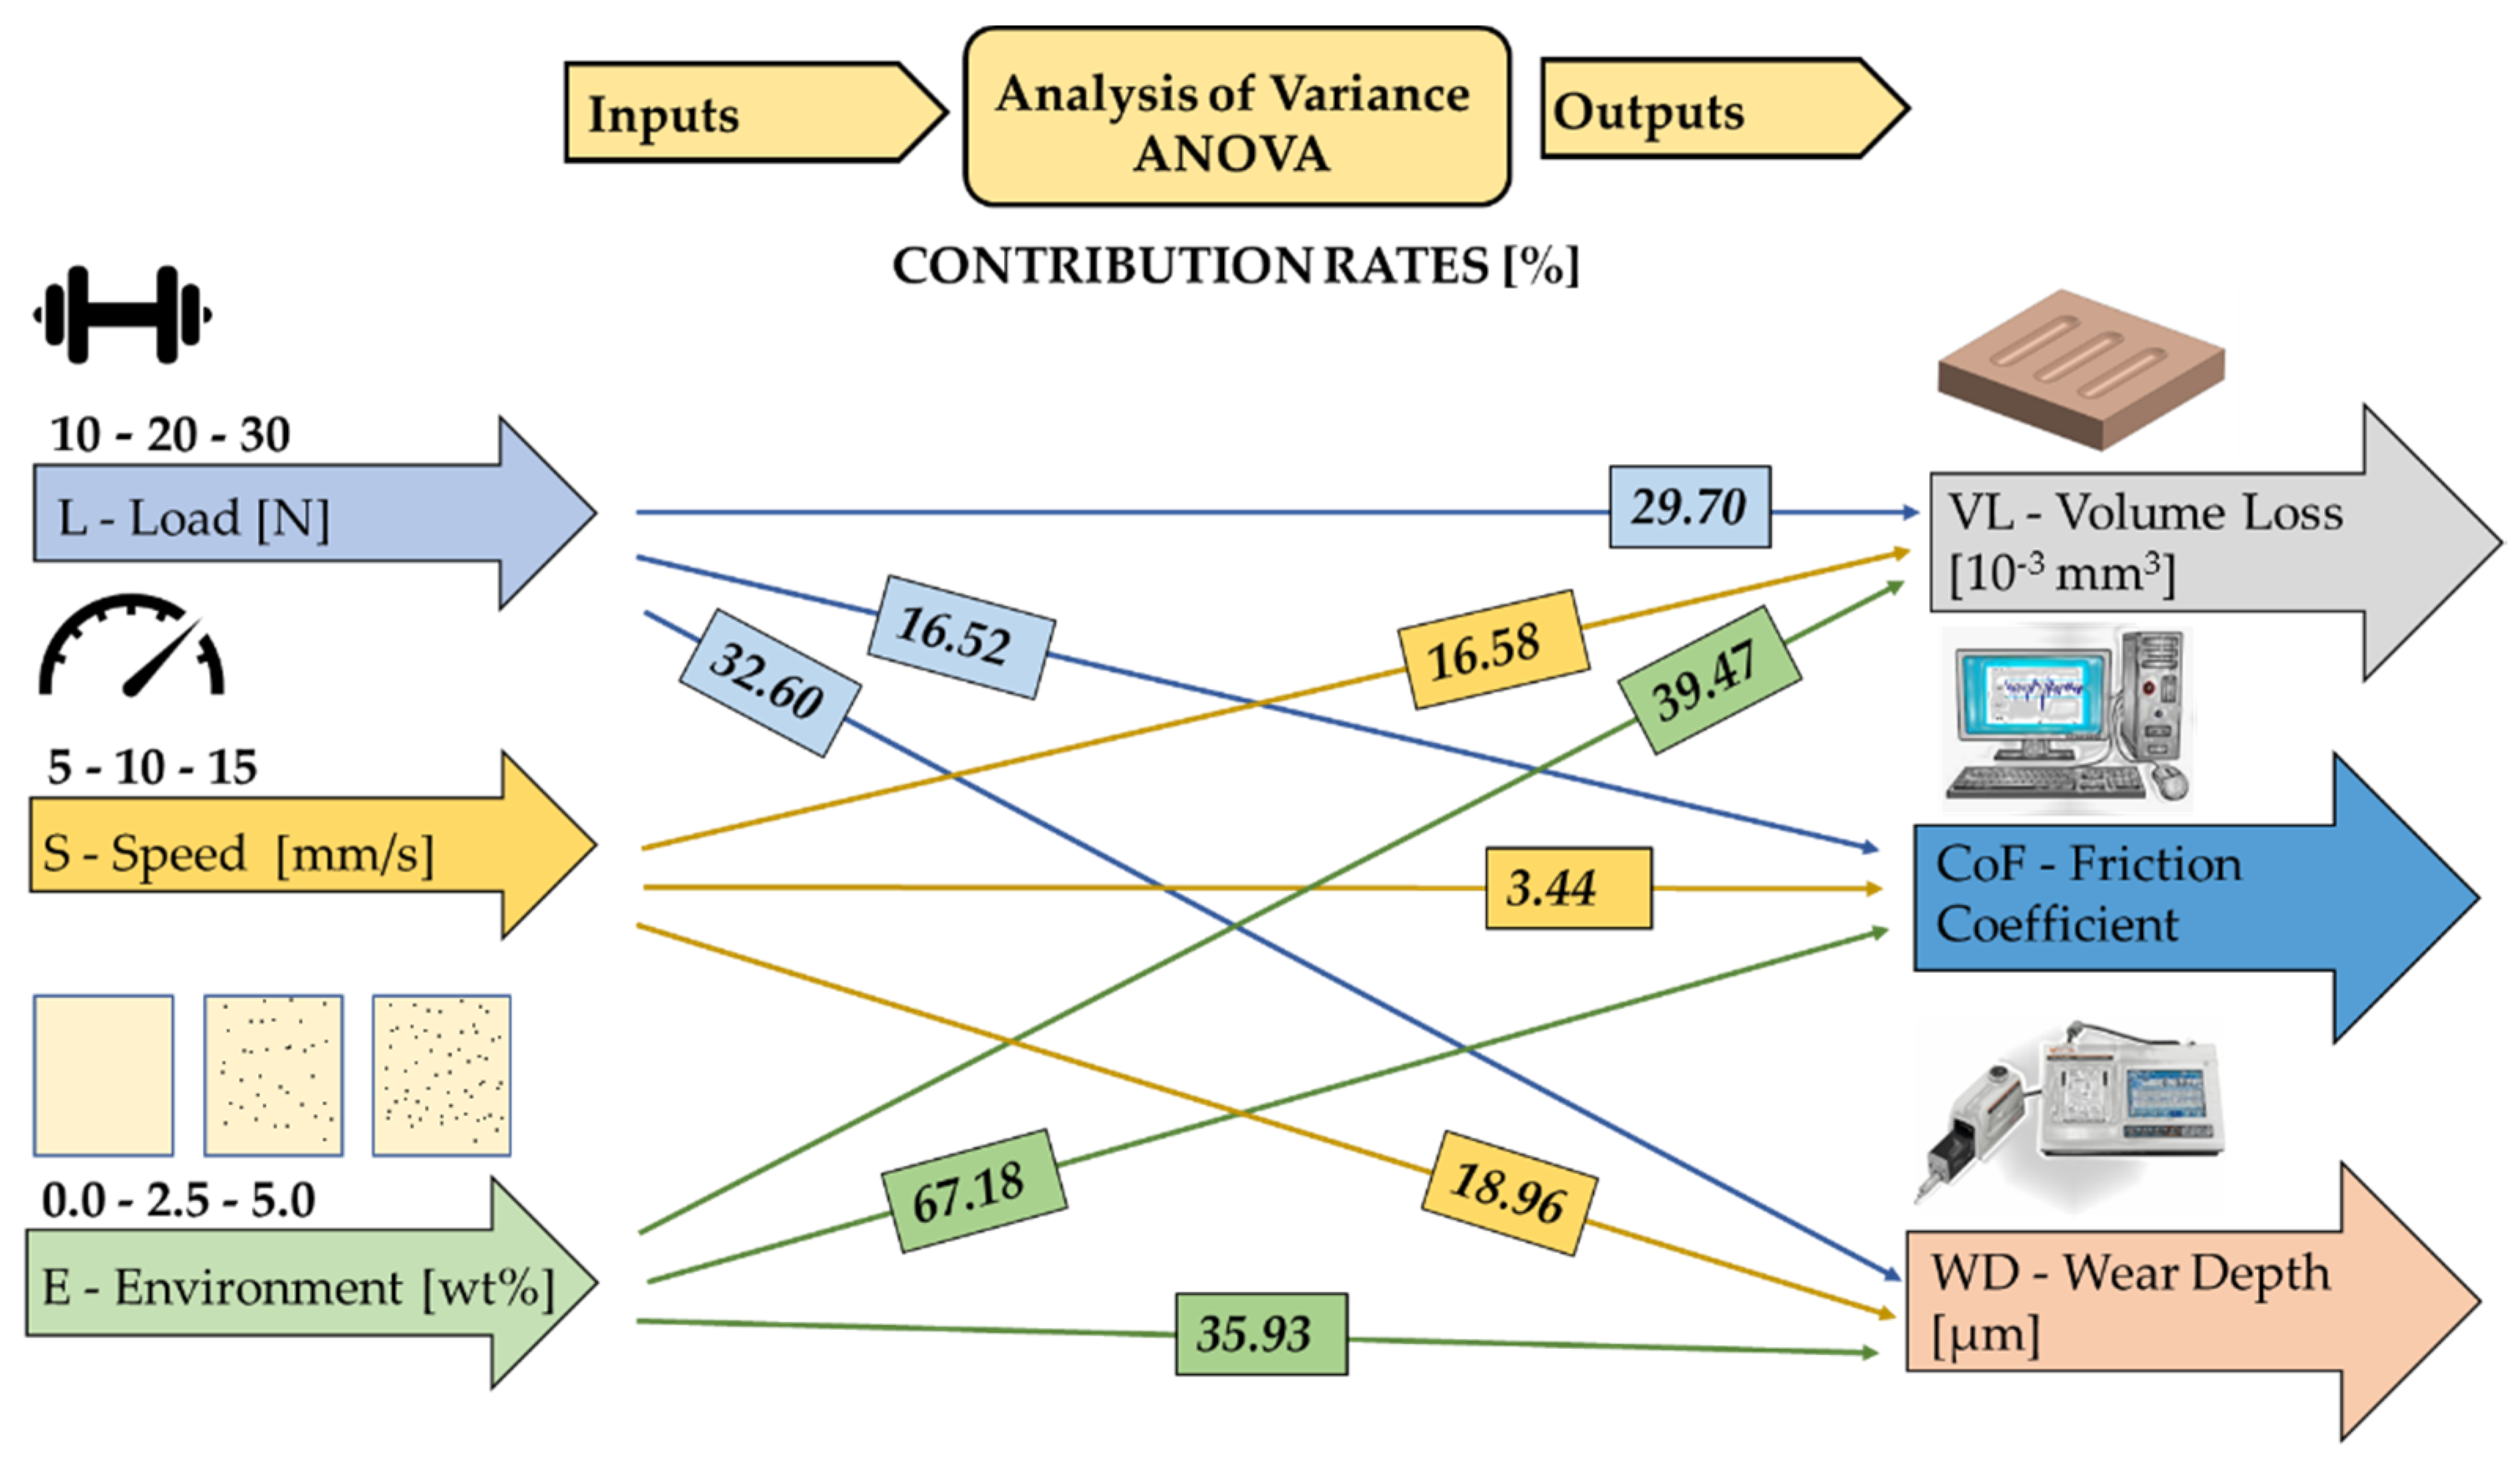
The experimental data obtained as a result of the experiments and the prediction values obtained by the Response Surface Method are given in Table 4. In Figure 6, a schematic figure containing the effective rates of the experimental parameters on the outputs is given.
3.1. Volume Loss (VL)
It is expected that there will be a loss of volume on the surfaces of the materials in the event of wear. According to Archard’s theory of wear, the volume lost in wear varies according to sliding speed, load, and surface hardness value [34]. The experimental correction coefficient (K), material hardness value (H), sliding speed (v), and load value (P) are calculated using Equation (1) for the volume loss formula [35]:
As can be seen from the equation, the increase in the load value and the sliding speed value causes an increase in the volumetric loss of the material. In the ASTM G133-05 standard, it is stated that the wear volume is obtained by multiplying the cross-section of the wear track by the stroke length regarding the wear of the flat specimen. Here, the wear track cross-section value is calculated as the average. In the measurement of the wear track from three different points during the stroke, it is stated that if there is a more than 25% difference between these measurements, it is necessary to measure from six different points to calculate the average cross-section value. In measuring the wear volume of the flat specimen, small geometric errors at the deflection points can be neglected. Here (A) is the average cross-sectional area of the wear track in mm2, (L) is the stroke length in mm, and (Vf) is the wear volume in mm3, and the wear volume value is calculated with Equation (2).
The wear mark values were measured in Ra and the wear volume was reported in the literature by Turan et al. The work value has been calculated by taking references [36]. The volume loss (VL) value in mm3, as (a) wear width in mm, (b) wear depth in mm, and (c) stroke length in mm, was calculated using Equation (3) [35]. Volume loss values are given in Table 4.
When Table 4 is examined, it can be seen that the lowest volume loss value is realized with a 10 N load, 5 mm/s sliding speed, and lubricating medium without scale, and the value is 15.3 × 10⁻³ mm3. When the literature was examined, it was seen that the lowest volume loss value was realized at the values where the load and sliding speed were the lowest. It was observed that the highest volume loss value was the lubricating medium containing a 5 wt % scale, the medium with the highest load and sliding speed values, 30 N load and 15 mm/s sliding speed. Again, in this case, the results are in agreement with the literature.
ANOVA results for the volume loss value are given in Table 5. When the ANOVA results were examined, the most effective parameter on volume loss was the environment parameter, with a value of 39.47%. When the study by Korkmaz and Çetin is examined, it can be seen that the environment parameter has at least as much effect on the mass loss as the load parameter. In this study, the ambient parameter is more effective than the load parameter for volume loss [31]. The effect value of the load parameter was 29.70% and it was below the effect value of the environment parameter. The sliding speed parameter, on the other hand, became the third most effective parameter, with a value of 16.58, after the environment and load parameters. This result is similar to those reported by Korkmaz and Çetin. As the load value, shear rate value, and amount of abrasive in the environment increase, the volume loss also increases. The Adj-RSqr value of the volume loss values in the ANOVA table was calculated to be 94.85%. The result was obtained at a sufficient level in terms of statistical reliability (95%). According to the results, the parameters showed statistically and physically significant effects on the volume loss since the p-value was less than 0.05 for the load, sliding speed, and environmental parameters. The error value, obtained as 3.33%, can be explained as microstructural defects arising from material production that were not taken into account in the experimental design, thermal forces that may arise due to vibrations from the experimental setup or the ground, temperature, and measurement errors [35,37].
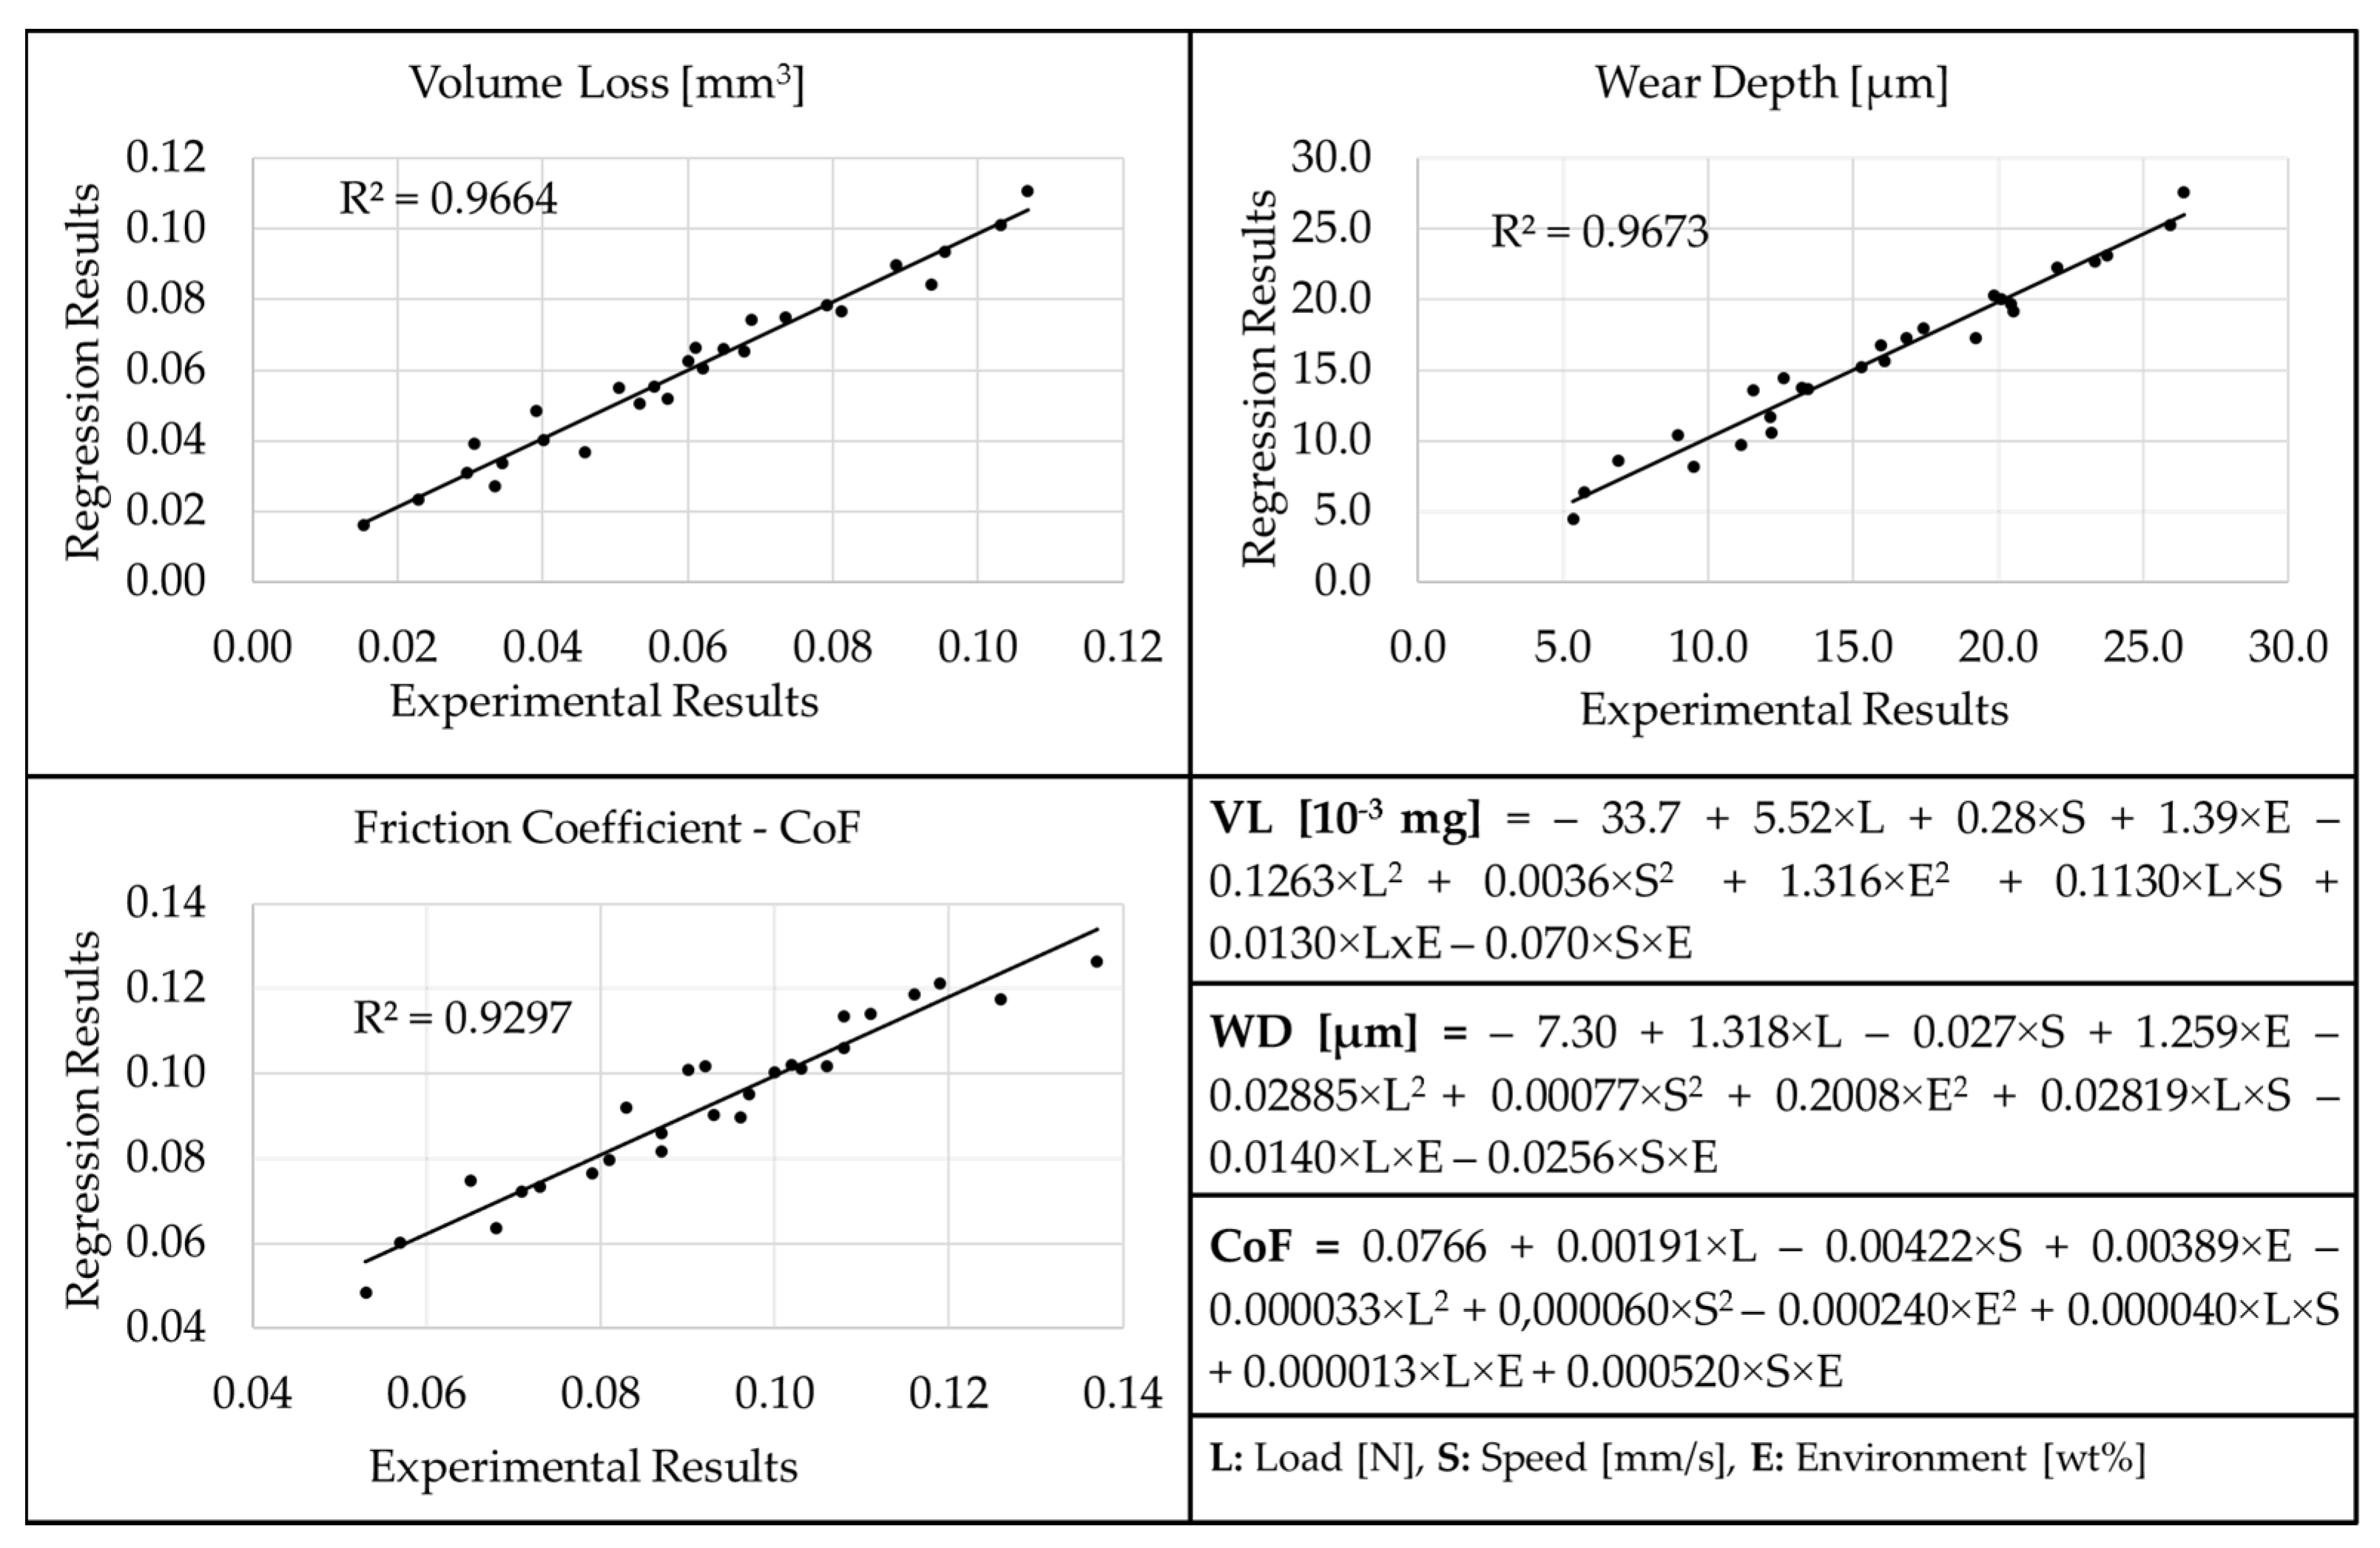
The equations obtained using the response surface method are given in Figure 7. The predicted values obtained with these equations are given in Table 4. The agreement between the experimental and predicted results was 96.64%. Again, the relationship between the experimental and predicted results is given graphically in Figure 7. When the graph is examined, it is clear that the experimental and predicted results are compatible with each other.
3.2. Wear Depth (WD)
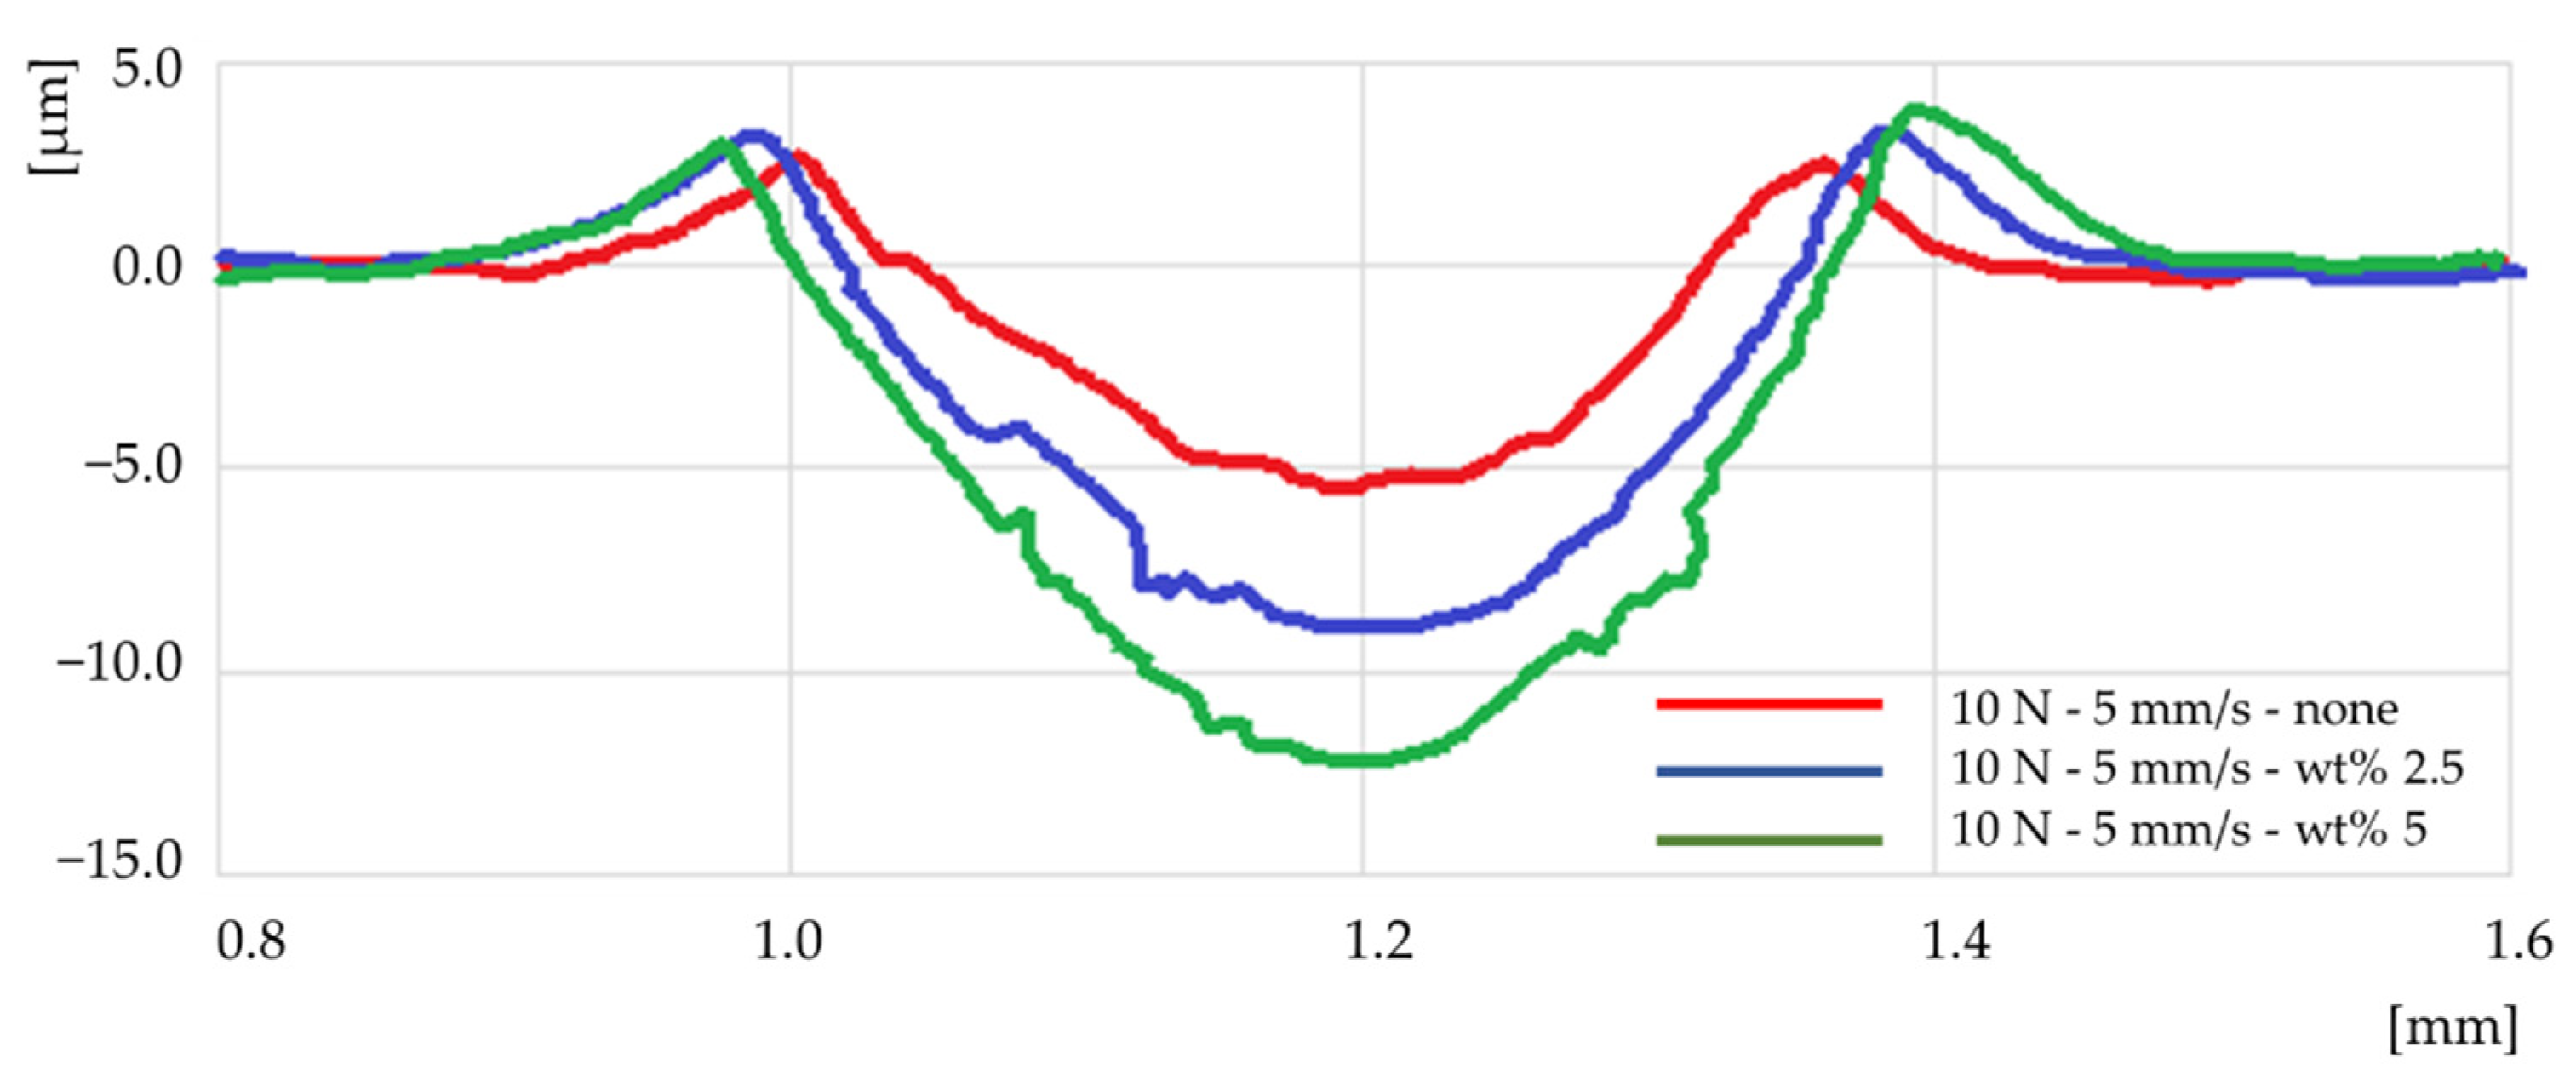
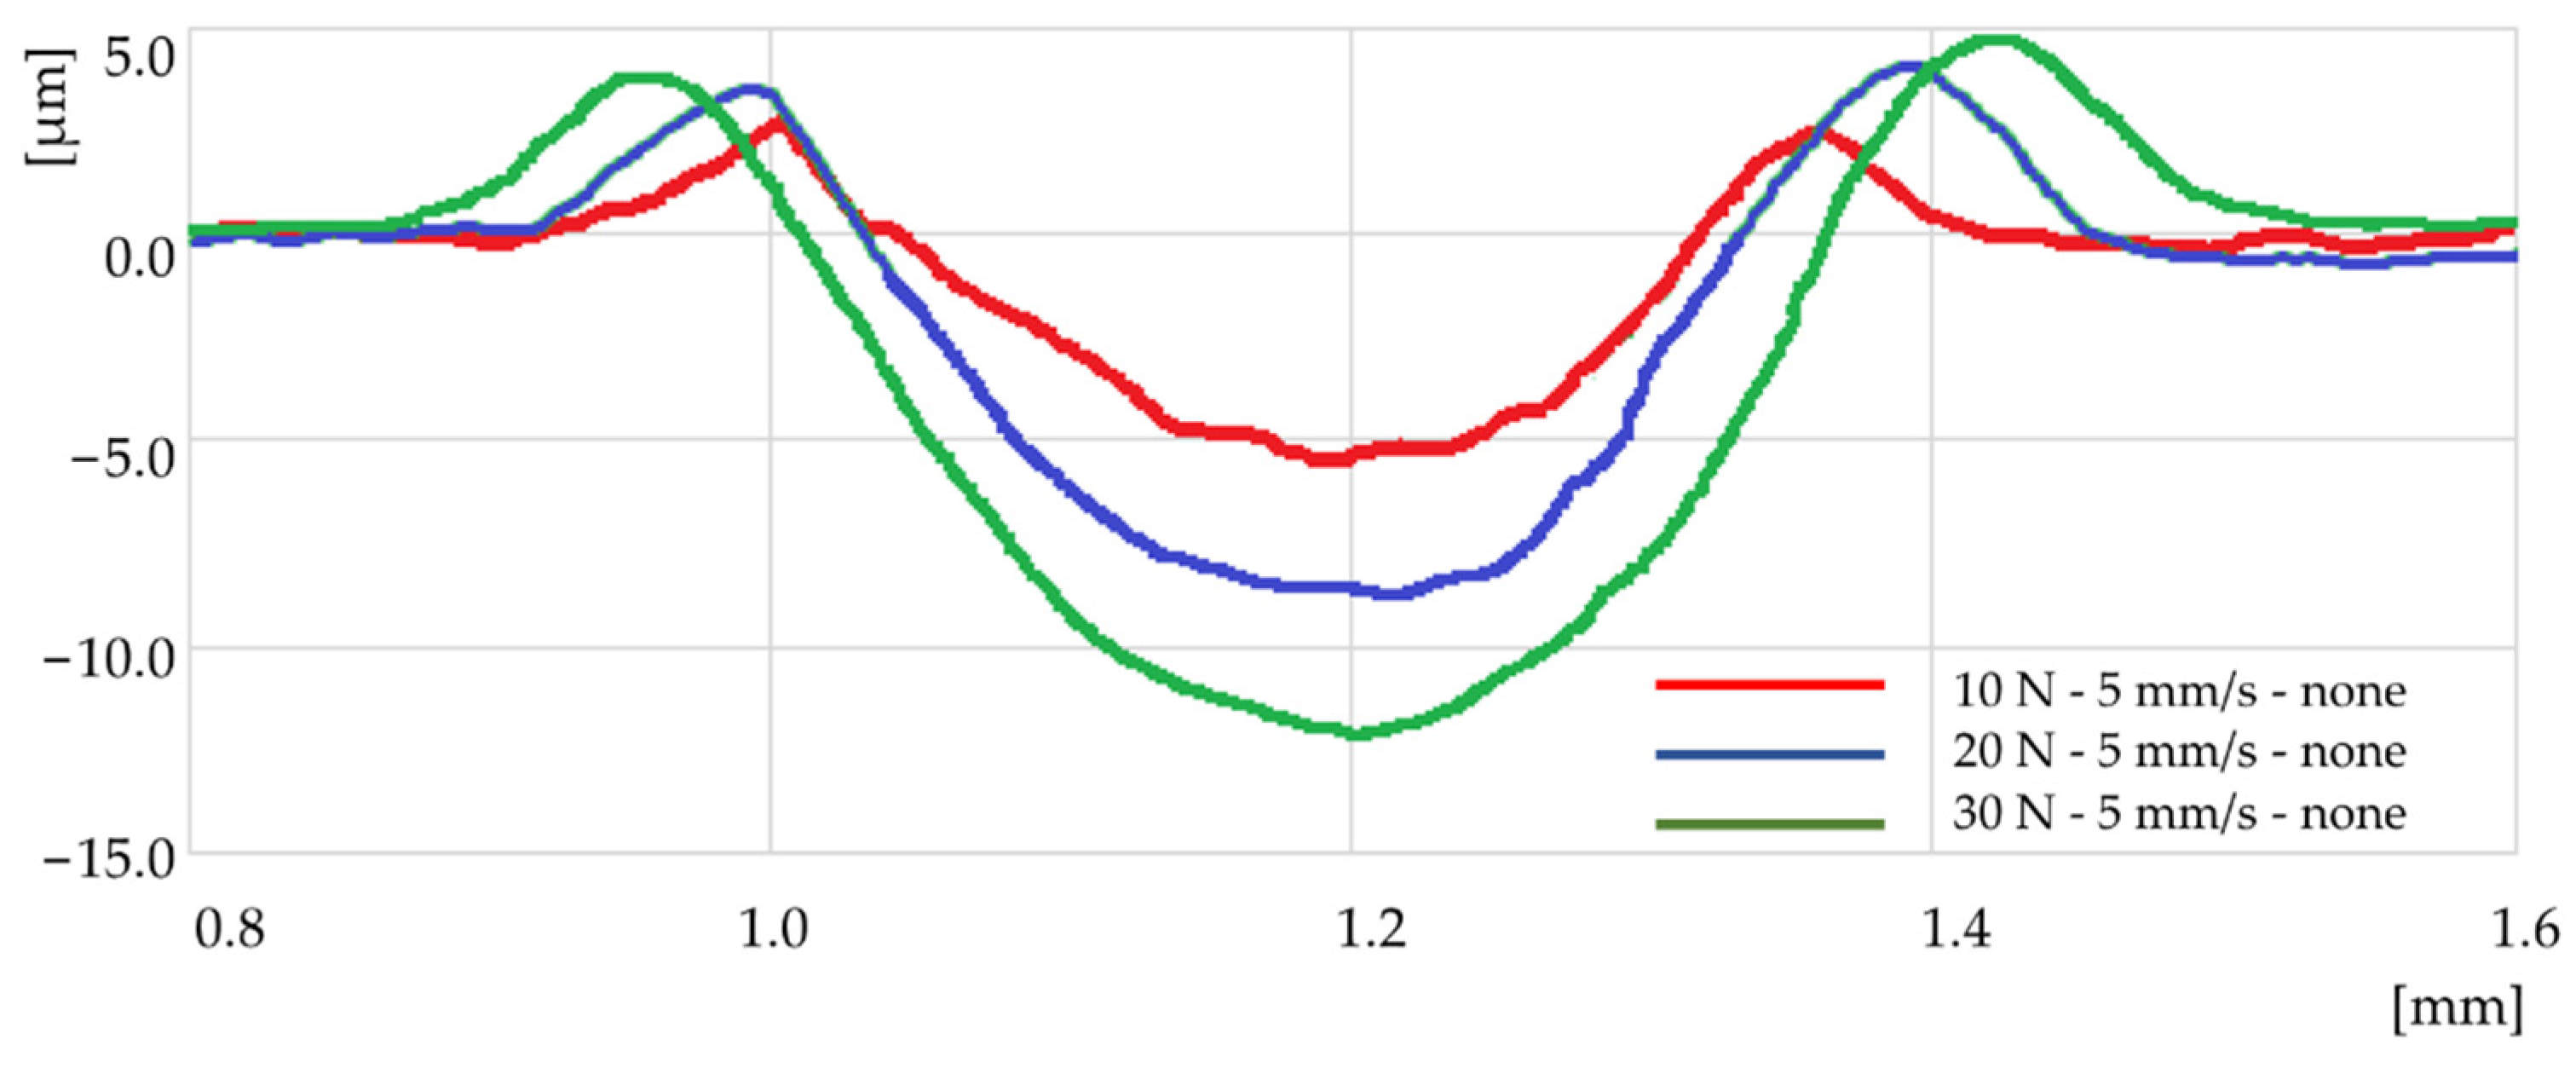
When the wear tracks that had formed on the specimen surfaces after the wear tests were examined, the deepest trace was measured as 26.40 μm under the test conditions, with a load of 30 N, a sliding speed of 15 mm/s, and an environment containing a 5 wt % abrasive. Wear depth and wear width values are the main measurement values for the calculation of volumetric loss. Considering the spherical nature of the ball abrasive, the wear width should be proportional to the wear depth, except in exceptional cases, such as the wearing down of the ball. Since the value of the wear depth and the wear width will give the cross-sectional area of the wear track and the stroke length is constant in all cases, it is expected that the test conditions with the highest volume loss will also give the greatest trace depth value. Similarly, it is expected that the lowest volume loss value will be in those experimental conditions with the smallest trace depth value. The lowest wear depth value, on the other hand, was obtained under those test conditions with the lowest volume loss value of 10 N load, 5 mm/s sliding speed, and no abrasive, which was measured as 5.35 μm. In Figure 8, the wear profiles for 10 N load and 5 mm/s sliding speed values that were obtained from experiments performed in three different environments are given. In Figure 9, the wear profiles that were obtained from the experiments performed at three different load values for a non-abrasive environment and 5 mm/s sliding speed values are given. The lubricating oil that does not include scales has the potential to produce a film sheet on the surface of the specimen. The oily acid that is present in the lubricant has the potential to work together with the surface of wear to produce a metallic mono-film [38]. They have the potential to reduce wear and friction, and, as a result, they can diminish the wear depth [39].
The ANOVA results for wear depth are given in Table 6. When the table is examined, it can be seen that the effective parameters are environment, load, and sliding speed, respectively, for which the effect values are 35.93%, 32.60%, and 18.96%, respectively. According to the ANOVA results, since the p-value is less than 0.05 for the load, speed, and environment parameters, it can be said that the parameters have physical effects on the wear depth, and they are statistically significant. The error value of 3.27% reveals that various effects were not considered in the experimental design. It can be interpreted that these effects are caused by experimental design, environmental effects, and measurement errors.
Prediction equation outputs obtained with the response surface method using the wear depth values are given in Figure 7. The predicted wear depth values calculated using this equation are given in Table 4. When the graph shown in Figure 7 is examined, it is clear that the relationship between the values measured on the wear profiles obtained as a result of the experiments and the values calculated using the prediction equation is quite consistent. The R2 value, which expresses compatibility, was found to be 96.73%.
3.3. Coefficient of Friction (CoF)
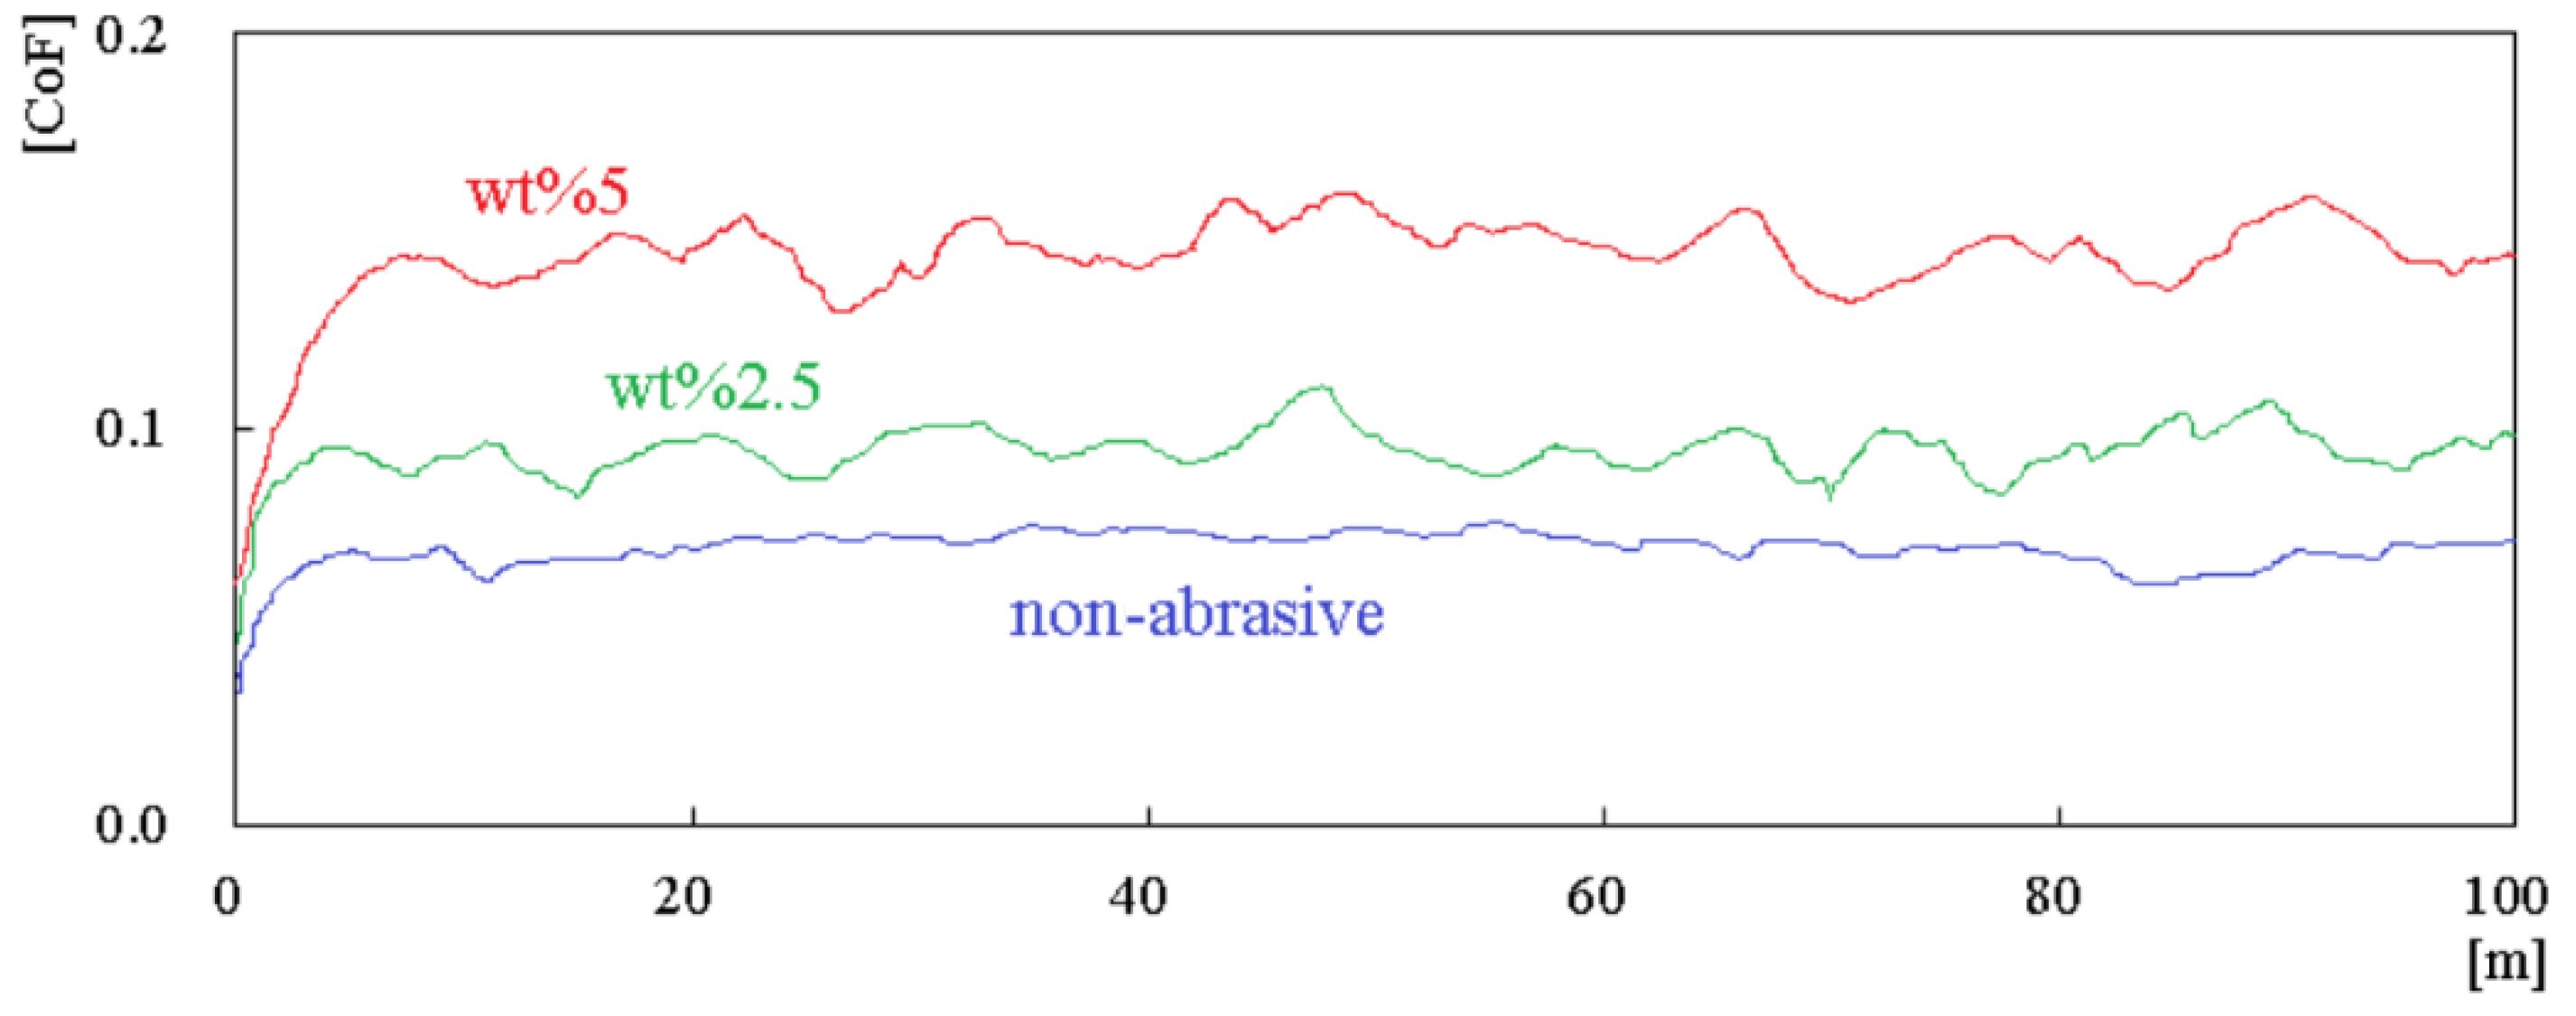
The data on the coefficient of friction were recorded continuously during the experiments. Graphs of the CoF values obtained for 30 N load, 15 mm/s sliding speed, and three different environment parameters (non-abrasive, 2.5 wt %, and 5 wt %) are shown in Figure 10. To determine the coefficient of friction, the averages of the graphic values were taken from the point at which the measurement values became stable [35]. The same method was followed in calculating the other coefficient of friction. The lowest CoF value was obtained with the lowest load value of 10 N and the highest speed value of 15 mm/s in a non-abrasive lubricating environment. The highest CoF value was gained with the highest load value of 30 N, a sliding speed of 15 mm/s, and a lubricating environment containing 5 wt % of abrasive particles. The CoF holds an important position in the debris removal procedures carried out during the wear test, which is performed when the lubrication environment is analyzed with no scale present [40]. The lubricant having no-abrasive help lower friction in addition to energy expenditure, as well as lubricating the wear region, which immediately impacts the effectiveness of debris elimination procedures to avoid three-body abrasive behavior. This is because they have the ability to lubricate [41].
The ANOVA results are given in Table 7. A quadratic model and 95% confidence interval were chosen for the analyses. When the table is examined, the most effective parameter on the CoF value was the environment variable, with a value of 67.18%. At a load of 30 N and a sliding speed of 5 mm/s, there was a 16.13% increase in the coefficient of friction when changing from an abrasive-free medium to a medium containing 2.5% abrasive in the lubricant. There was an increase of 24.73% when changing from a non-abrasive environment to a 5% abrasive environment, and a 7.41% increase when changing from a 2.5% abrasive environment to a 5% abrasive environment. If the sliding speed is increased to 10 mm/s, an increase of 25.93% occurs in the coefficient of friction when changing from a non-abrasive environment to an abrasive-containing environment of 2.5%. At a sliding speed of 15 mm/s, this value was 26.76%. When the amount of abrasive in the environment increased to 5%, the increase was 92.96% compared to the non-abrasive environment. It can thus be said that the abrasive particles in the lubricant cause three-body wear; therefore, the CoF value increases. The SEM images confirm this finding. The issue of the contamination of lubricating oils encountered in industrial applications and the shortening of equipment life because of the three-body wear event in metal plain bearings as a result of this contamination is important for the originality of this study. In addition, it can be said that the result is significant because the p-value, which expresses statistical and physical significance, is smaller than 0.05. The second effective parameter for CoF was the load parameter, with a value of 16.52%. The sliding speed parameter, on the other hand, emerged as the parameter with the lowest effect, with a value of 3.44%. It is observed that the squares of the parameters and the effects of their interactions are statistically and physically low. The R2 value, which shows the agreement between the experimental results and the regression results obtained with the prediction equations, was determined as 92.97%.
3.4. Worn Surfaces
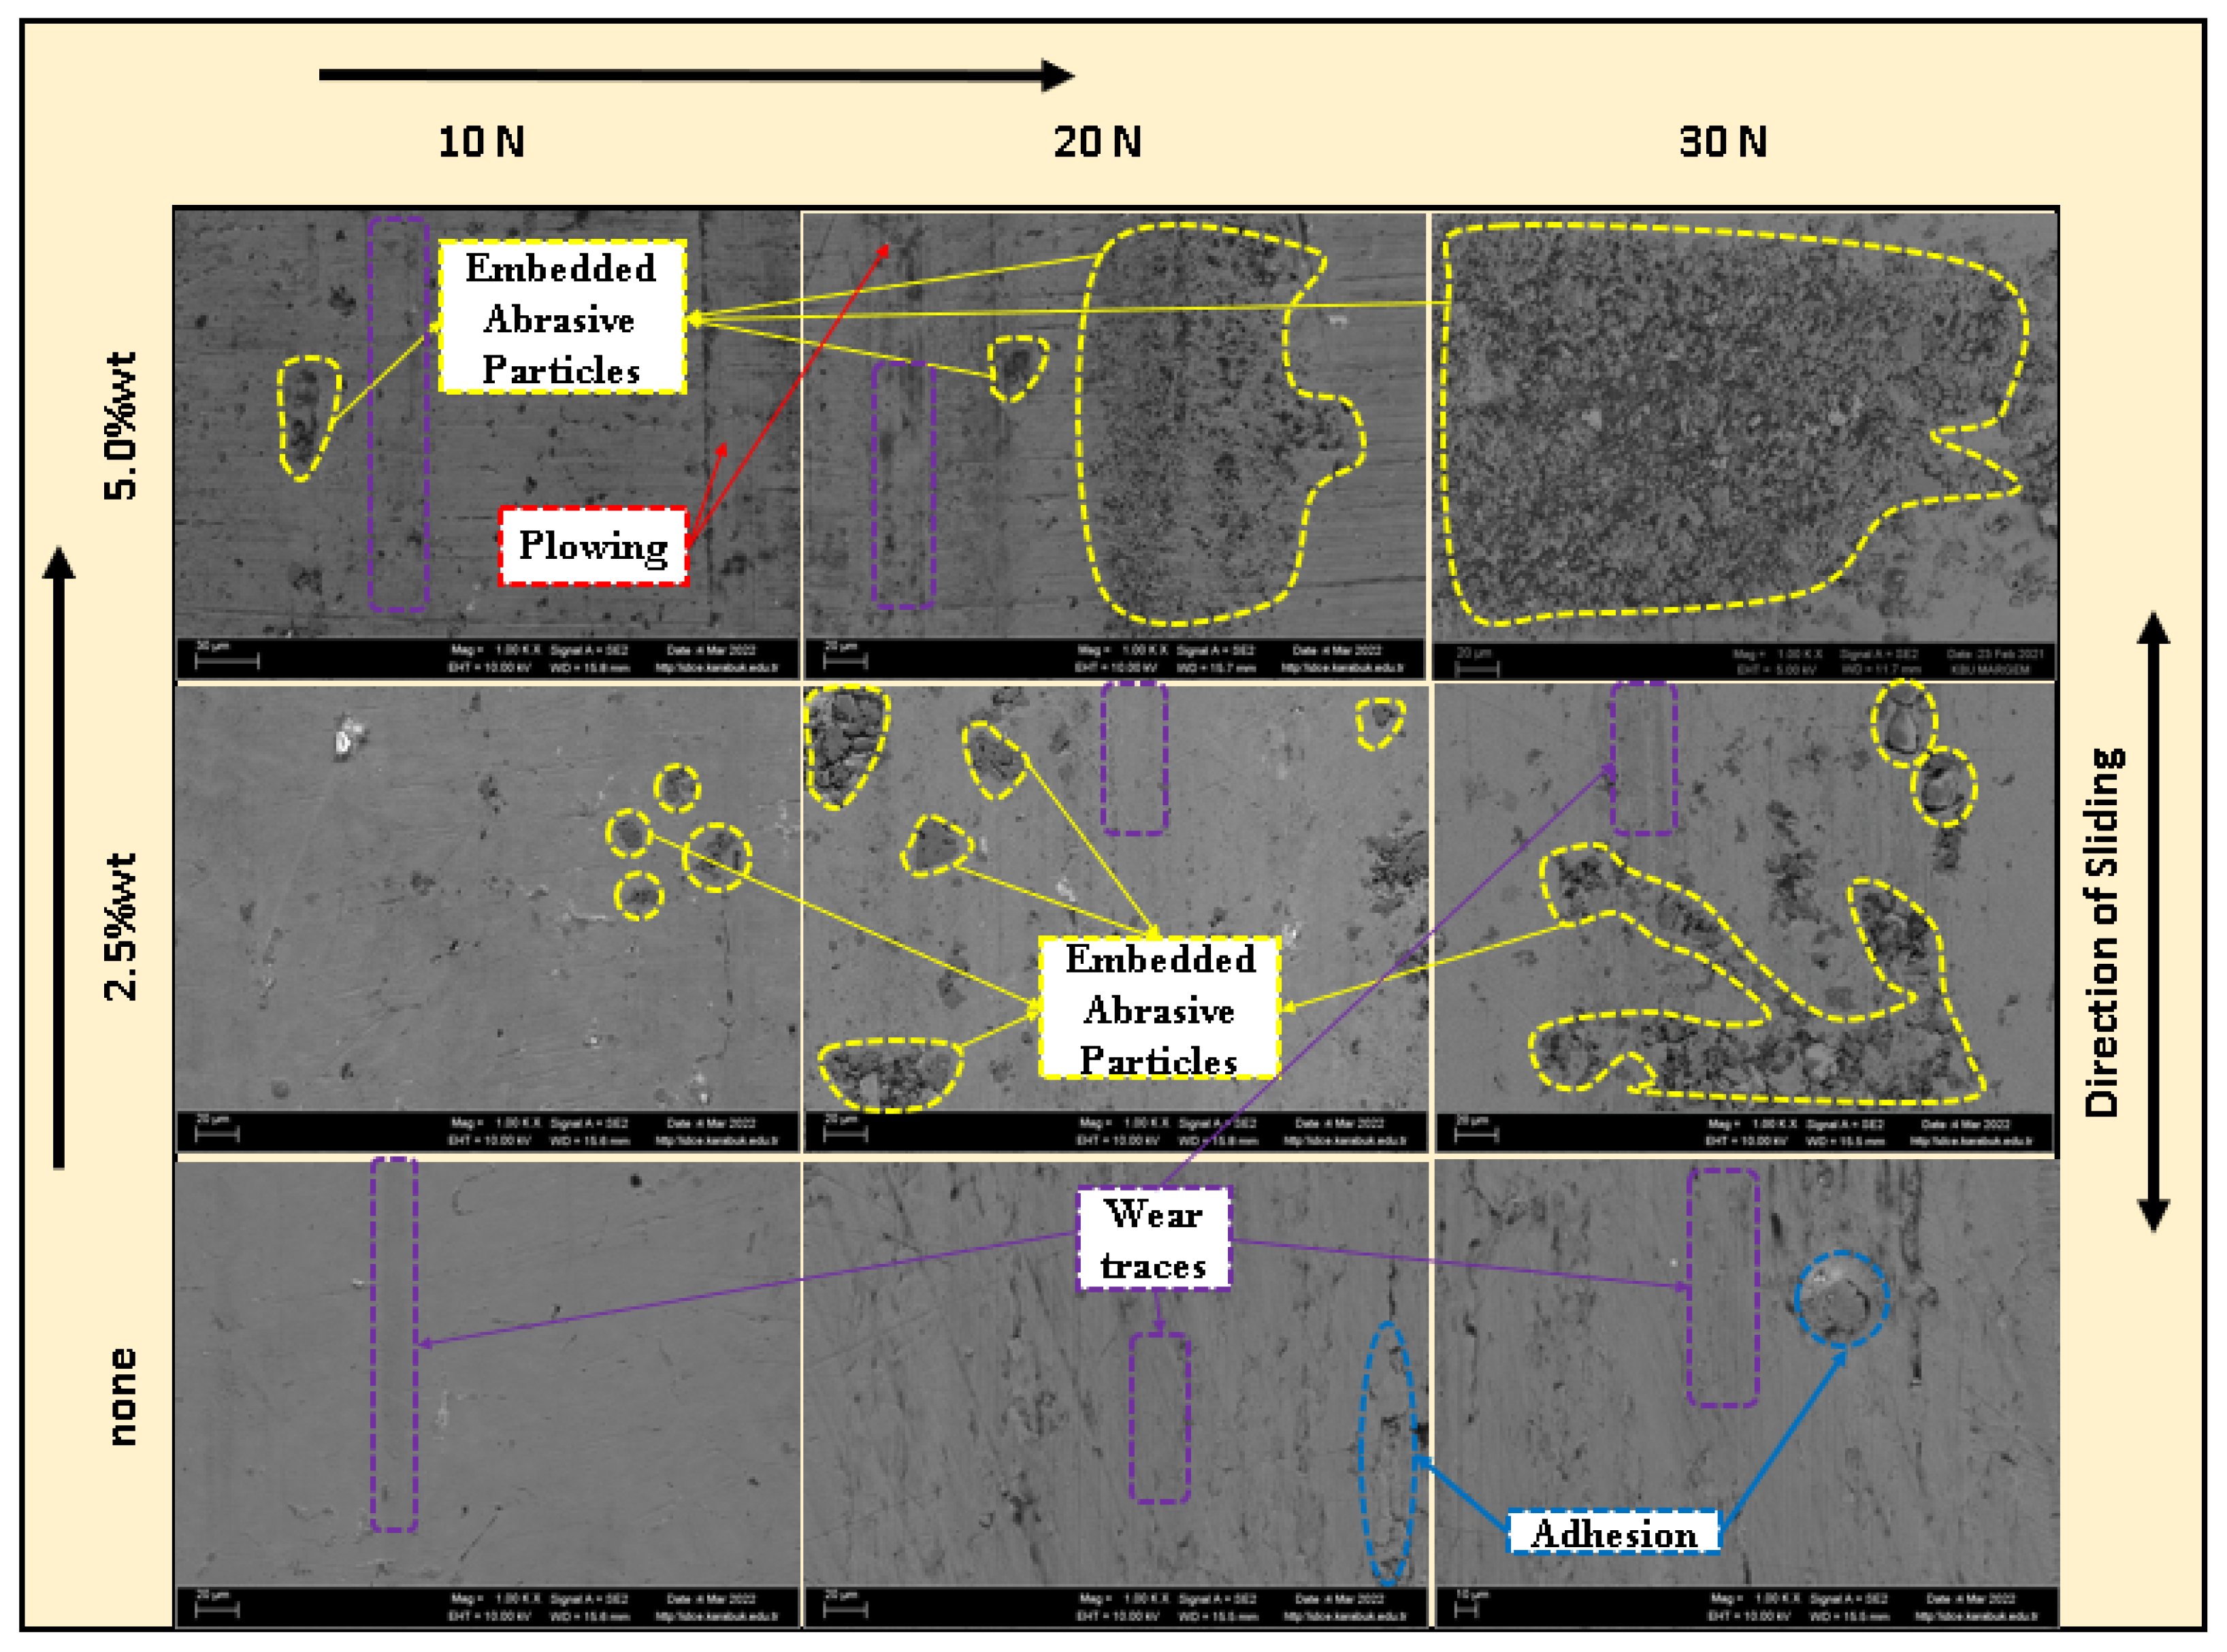
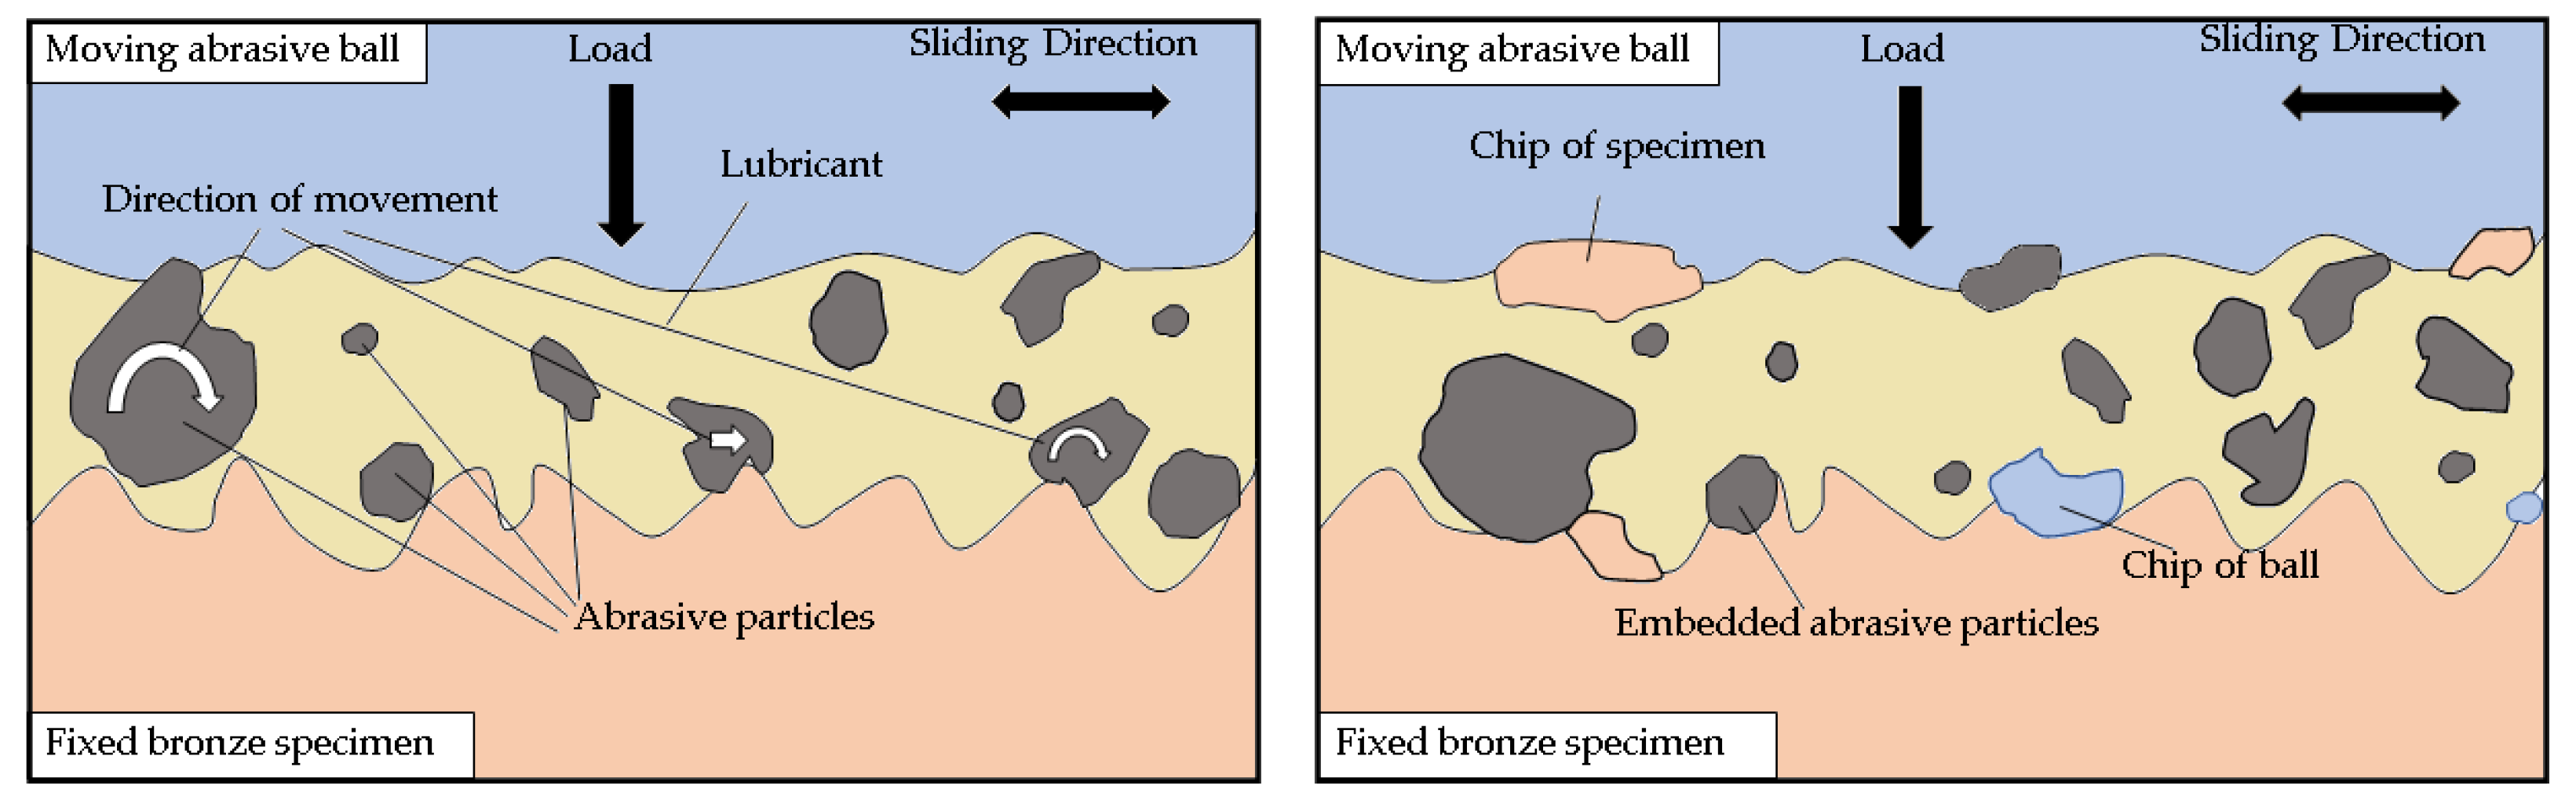
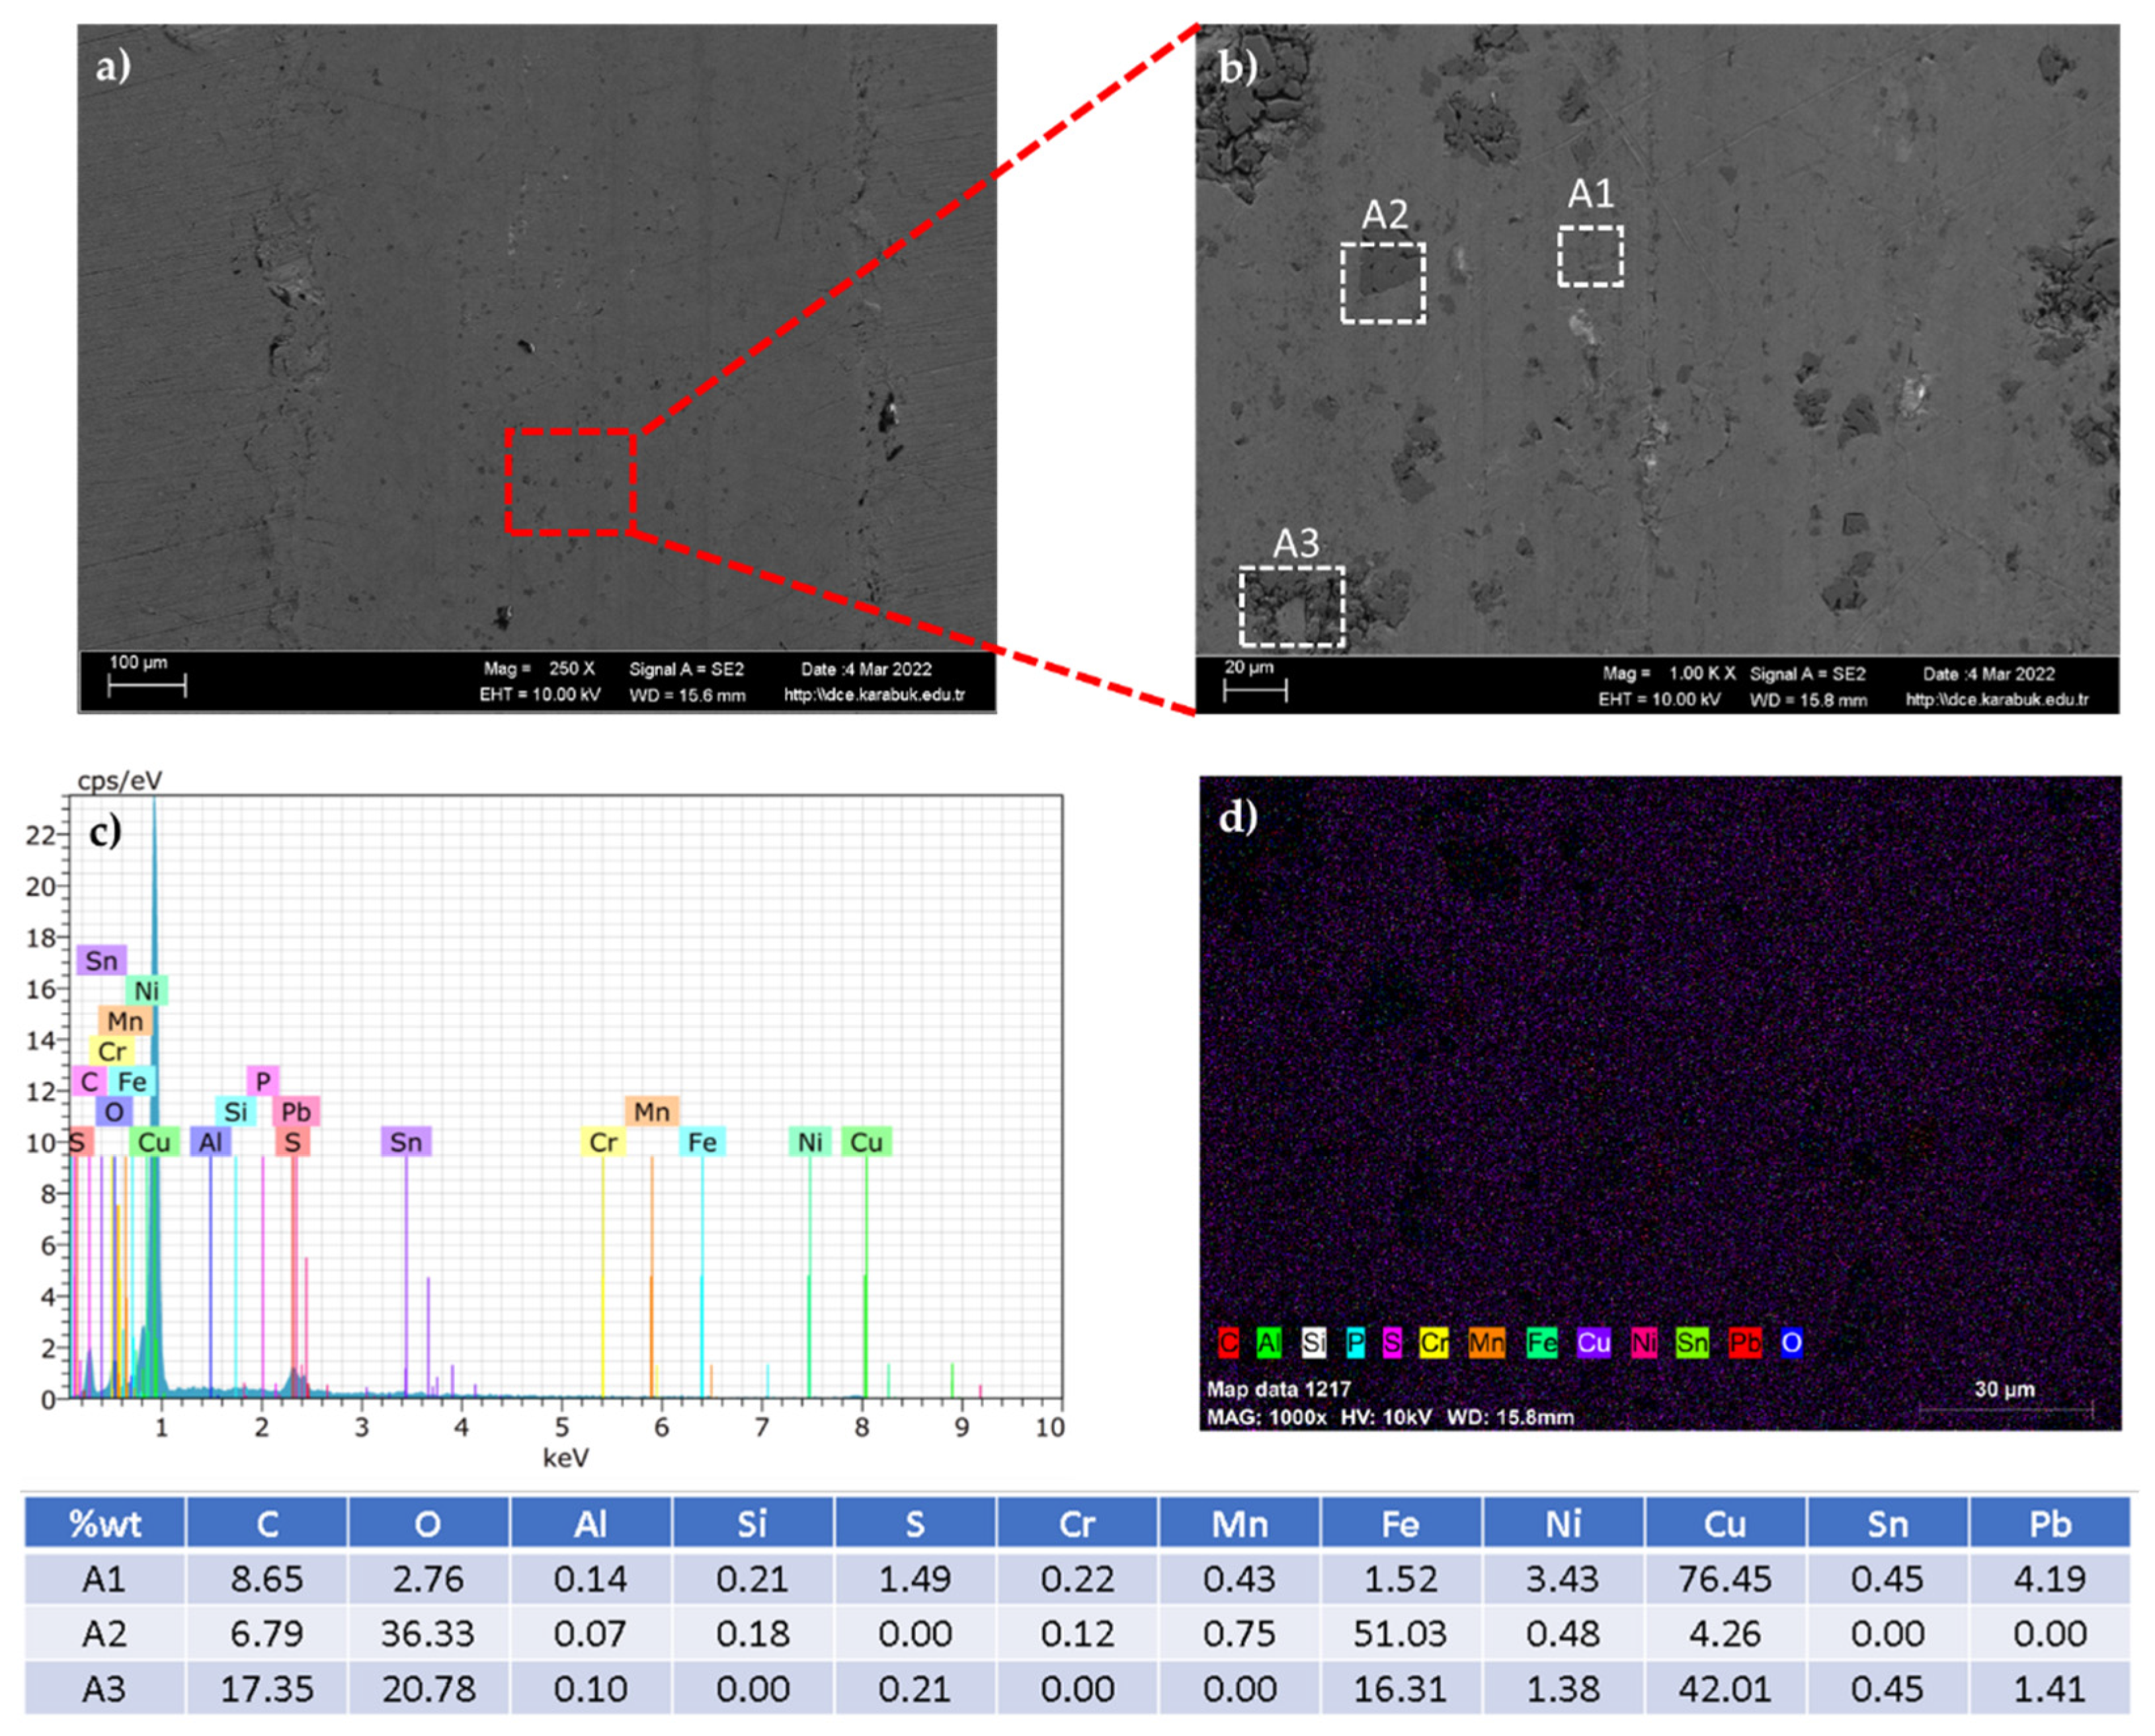
When the worn surfaces are examined, it can be seen that the surface roughness value and surface fluctuations increase with the increase in the number of particles in the oil medium. The increase in these fluctuations can be explained by the fact that the particles cause plowing mechanisms on the surface [42]. The changes and wear mechanisms on the specimen for the 15 mm/s sliding speed value are given in Figure 11. When the surface SEM images, magnified by 1000, are examined according to the environment and sliding speed values, it can be seen that the scale particles adhere to the surface in environments containing abrasives. As a result of the EDX analyses performed in the SEM imaging process, scale particles and particles belonging to the steel ball were detected on the specimen’s surface. The wear behavior thought to occur during the process is visualized in Figure 12. In Figure 13, the chemical compositions of three different regions are given, with the SEM image of the surface examination of the experiment conducted at a 15 mm/s sliding speed, 10 N load, and 2.5 wt % conditions. When the images given in Figure 11 are examined, it can be seen that the surface has undergone plastic deformation due to plowing wear. The coefficient of friction increases with the bond energy resistance that occurs during deformation. Abrasive particles reduce the lubricating effect of the lubricant, causing both the specimen and the ball to be affected. It is hypothesized that this increase in friction forces is what causes the plastic distortion ability of the substance to change with the increase in temperature and load, as well as the formation of phases or abrasives on the surface causing of the rise in heat [43]. Both of these events are thought to have been brought about by the rise in temperature. It is not hard to see why the friction force graph for the specimen in conditions where there is no scale in the lubrication oil is significantly higher than the graph for the specimen in conditions of 2.5% and 5% scale being added to the lubricant.
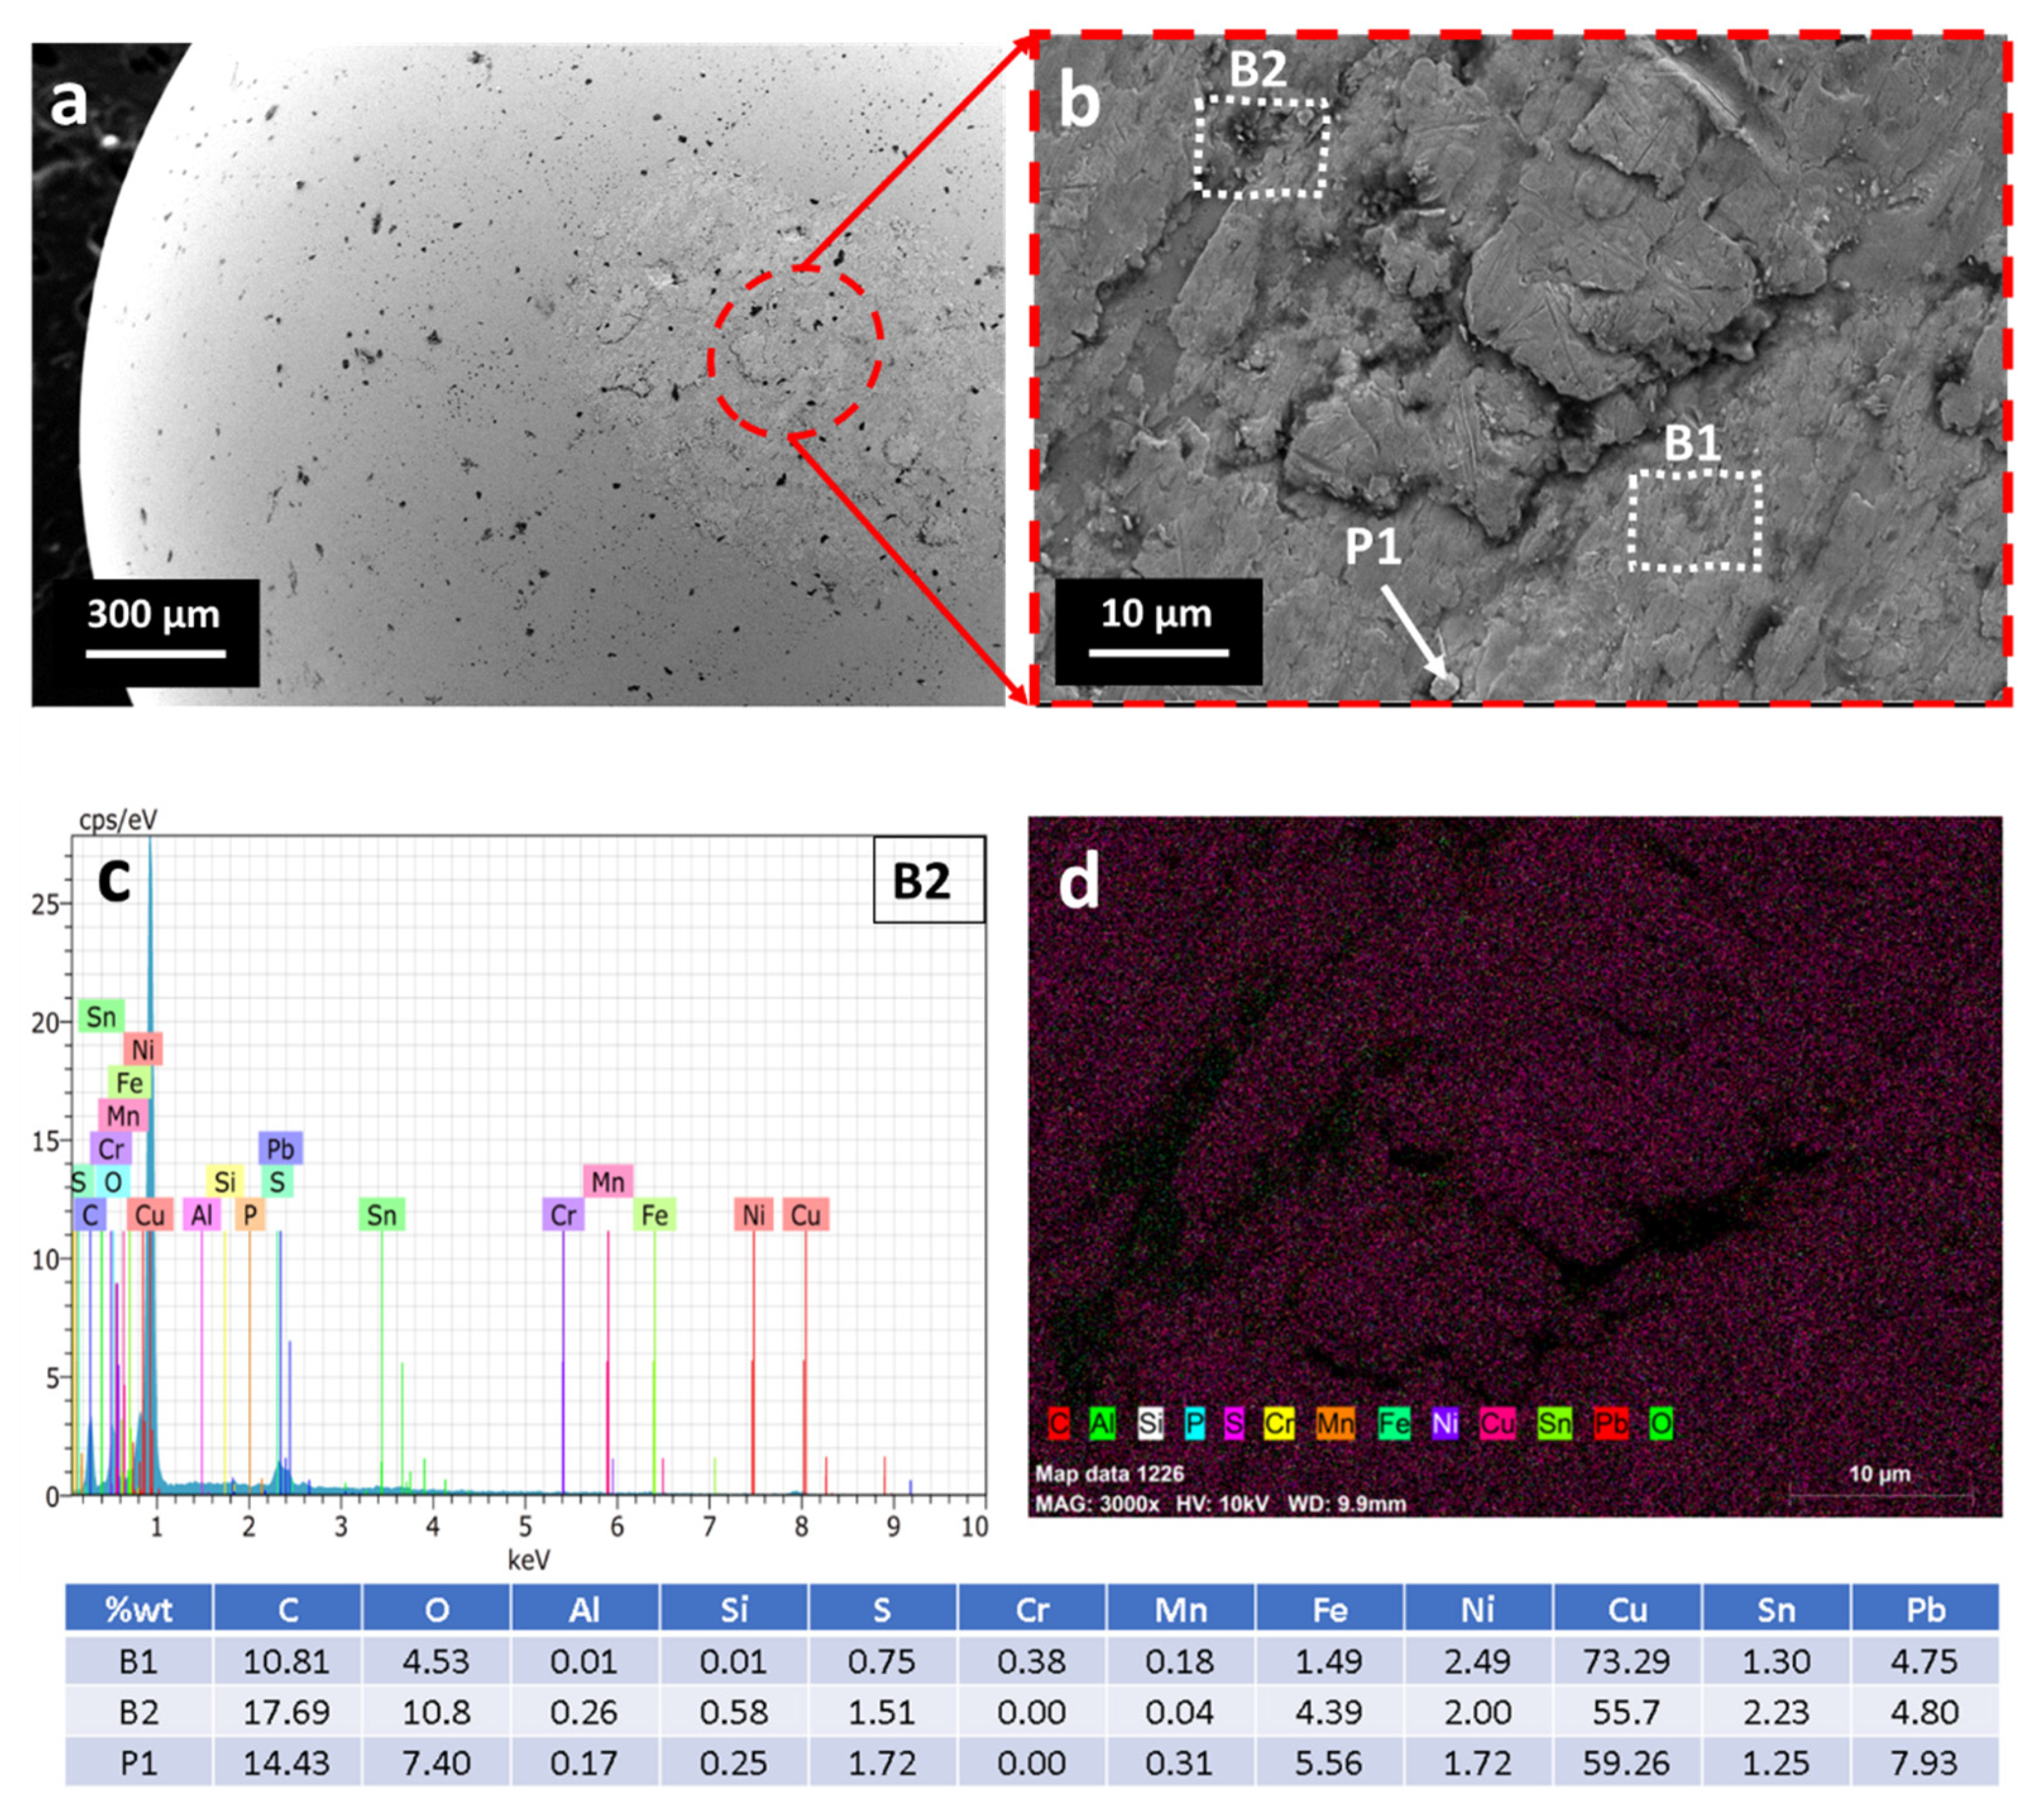
As a result of the experiments, the presence of Cr and Fe elements was found when the SEM images shown in Figure 13, which were taken from the specimen surface, were examined to determine the condition of the specimen surface. This is a clear indication of material transfer from the steel ball to the specimen surface. In the same way, the elements Fe, O, and Cu were found during the examination of the steel ball (Figure 14). In this case, it is understood that there is a material transfer from the specimen to the ball during wear and that the scale penetrates the material’s surface.
4. Conclusions
In this study, three-body wear conditions in the bronze material under environments containing a certain amount of abrasive mill scale were investigated. The following conclusions were drawn:
- The highest volume loss value was obtained from those experiments with a 30 N load, 15 mm/s sliding speed, and 5 wt % concentration value, and was calculated as 106.9 mm3. Conversely, the value obtained from the prediction equations is 110.8 mm3. There is a difference of 3.65% between the predicted value and the experimental result value, and the predicted value is higher.
- According to the quadratic ANOVA result, the most effective parameter for volume loss was the environment parameter; the effect value was found to be 39.47%. While this was followed by the load parameter at 29.70%, the effective rate of the sliding speed parameter was found to be 16.58 percent. According to the RSM result, there is a 96.64% agreement between the experimental results and the prediction results.
- The largest wear depth value was comparable with the volume loss value, and the relevant conditions were a 30 N load, 15 mm/s sliding speed, and 5 wt % abrasive-containing environment. Wear depth was measured as 26.40 µm from the experimental results. This value was calculated to be 27.59 µm using the prediction equations. There is a 4.5% difference between the two values, and the predictive value is higher.
- According to the ANOVA result, the most effective parameter for wear depth is the environment parameter, with an impact rate of 35.93%. It is followed by the load at 32.60%, and the sliding speed parameters at 18.96%. According to the RSM result, there is a 96.73% agreement between the experimental results and the prediction results.
- The experimental conditions in which the coefficient of friction value was highest was 0.137, seen with a load of 30 N, a sliding speed of 15 mm/s, and an environment containing 5 wt % of abrasive particles. Under these conditions, the CoF value was determined as 0.137. According to the prediction equations, the highest CoF value was 0.128 at 30 N, 5 mm/s, and 5 wt % abrasive particle-containing media. The difference between these two values is 6.57%, and the experimental CoF value is higher.
- According to the ANOVA results, the most effective parameter for CoF is the environment parameter at 67.18%, followed by the load at 16.52 percent and the sliding speed parameter at 3.44%, respectively. According to the RSM results, there is a 92.97% agreement between the experimental results and the predicted values.
- When the surface images are examined, there is scale penetration to both the specimen and the steel ball. In addition, the results showed material transfer from the ball to the specimen, as well as material transfer from the specimen to the ball.
Funding
This research received no external funding.
Institutional Review Board Statement
Not applicable.
Informed Consent Statement
Not applicable.
Data Availability Statement
The data presented in this study are available on request from the author.
Acknowledgments
This study was supported by the Karabük University Coordinatorship of Research Projects, with the project number KBU BAP-21-ABP-062. The author gratefully thanks KARDÖKMAK INC. for their valuable support for this study.
Conflicts of Interest
The author declares no conflict of interest.
References
- Bloch, H.P.; Geitner, F.K. Machinery Component Failure Analysis. In Machinery Failure Analysis and Troubleshooting; Bloch, H.P., Geitner, F.K., Eds.; Gulf Professional Publishing: Houston, TA, USA, 1999; Volume 2, pp. 79–256. ISBN 1874-6942. [Google Scholar]
- Çakır Şencan, A.; Çelik, M.; Selayet Saraç, E.N. The Effect of Nanofluids Used in the MQL Technique Applied in Turning Process on Machining Performance: A Review on Eco-Friendly Machining. Manuf. Technol. Appl. 2021, 2, 47–66. [Google Scholar] [CrossRef]
- Denkena, B.; Abele, E.; Brecher, C.; Dittrich, M.-A.; Kara, S.; Mori, M. Energy efficient machine tools. CIRP Ann. 2020, 69, 646–667. [Google Scholar] [CrossRef]
- Wegener, K.; Mayr, J.; Merklein, M.; Behrens, B.-A.; Aoyama, T.; Sulitka, M.; Fleischer, J.; Groche, P.; Kaftanoglu, B.; Jochum, N.; et al. Fluid elements in machine tools. CIRP Ann. 2017, 66, 611–634. [Google Scholar] [CrossRef]
- Zhao, B.; Zhang, Y.; Fan, Y.; Yu, X.; Zhang, Z.; Zhang, B. The three-body abrasive tribological characteristics of the Graphene/h-BN heterostructure film considering defects. Tribol. Int. 2022, 171, 107525. [Google Scholar] [CrossRef]
- Asif, A.; Zheng, Y.; Rahman, S.; Amiri, A.; Jun, H.J.; Polycarpou, A.A. Three-body abrasive wear in the presence of inorganic fullerene-like tungsten disulfide and ionic liquid containing alkanolamines and phosphates. Wear 2021, 486–487, 204073. [Google Scholar] [CrossRef]
- Hayashi, S.; Yoneda, S.; Kondo, Y.; Tanei, H. Phase Transformation of Thermally Grown FeO Formed on High-Purity Fe at Low Oxygen Potential. Oxid. Met. 2020, 94, 81–93. [Google Scholar] [CrossRef]
- Yu, X.L.; Jiang, Z.Y.; Yang, D.J.; Wei, D.B.; Yang, Q. Precipitation Behavior of Magnetite in Oxide Scale during Cooling of Microalloyed Low Carbon Steel. Adv. Mater. Res. 2012, 572, 249–254. [Google Scholar] [CrossRef]
- Çakıroğlu, R. Machinability Analysis of Inconel 718 Superalloy with AlTiN-Coated Carbide Tool Under Different Cutting Environments. Arab. J. Sci. Eng. 2021, 46, 8055–8073. [Google Scholar] [CrossRef]
- Danish, M.; Gupta, M.K.; Rubaiee, S.; Ahmed, A.; Korkmaz, M.E. Influence of hybrid Cryo-MQL lubri-cooling strategy on the machining and tribological characteristics of Inconel 718. Tribol. Int. 2021, 163, 107178. [Google Scholar] [CrossRef]
- Erdogan, A.; Yener, T.; Doleker, K.M.; Korkmaz, M.E.; Gök, M.S. Low-temperature aluminizing influence on degradation of nimonic 80A surface: Microstructure, wear and high temperature oxidation behaviors. Surf. Interfaces 2021, 25, 101240. [Google Scholar] [CrossRef]
- Ghazali, M.F.; Abdullah, M.M.; Abd Rahim, S.Z.; Gondro, J.; Pietrusiewicz, P.; Garus, S.; Stachowiak, T.; Sandu, A.V.; Mohd Tahir, M.F.; Korkmaz, M.E.; et al. Tool Wear and Surface Evaluation in Drilling Fly Ash Geopolymer Using HSS, HSS-Co, and HSS-TiN Cutting Tools. Materials 2021, 14, 1628. [Google Scholar] [CrossRef] [PubMed]
- Günen, A.; Döleker, K.M.; Korkmaz, M.E.; Gök, M.S.; Erdogan, A. Characteristics, high temperature wear and oxidation behavior of boride layer grown on nimonic 80A Ni-based superalloy. Surf. Coat. Technol. 2021, 409, 126906. [Google Scholar] [CrossRef]
- Demirsöz, R.; Korkmaz, M.E.; Gupta, M.K.; Collado, A.G.; Krolczyk, G.M. Erosion characteristics on surface texture of additively manufactured AlSi10Mg alloy in SiO quartz added slurry environment. Rapid Prototyp. J. 2021; ahead of print. [Google Scholar] [CrossRef]
- Boromei, I.; Ceschini, L.; Martini, C.; Sola, R. Aluminium bronze-steel sliding contact in packaging applications: Failure analysis and lab-scale tribological tests. Eng. Fail. Anal. 2020, 112, 104528. [Google Scholar] [CrossRef]
- Cenna, A.A.; Dastoor, P.; Beehag, A.; Page, N.W. Effects of graphite particle addition upon the abrasive wear of polymer surfaces. J. Mater. Sci. 2001, 36, 891–900. [Google Scholar] [CrossRef]
- Latthe, S.; Terashima, C.; Nakata, K.; Fujishima, A. Superhydrophobic Surfaces Developed by Mimicking Hierarchical Surface Morphology of Lotus Leaf. Molecules 2014, 19, 4256–4283. [Google Scholar] [CrossRef]
- Wang, K.; Yu, S.; Li, W.; Song, Y.; Gong, P.; Zhang, M.; Li, H.; Sun, D.; Yang, X.; Wang, X. Superhydrophobic and photocatalytic synergistic Self-Cleaning ZnS coating. Appl. Surf. Sci. 2022, 595, 153565. [Google Scholar] [CrossRef]
- Li, M.; Luo, W.; Sun, H.; Zhang, M.; Ng, K.W.; Wang, F.; Cheng, X. Low-cost preparation of durable, transparent, superhydrophobic coatings with excellent environmental stability and self-cleaning function. Surf. Coat. Technol. 2022, 438, 128367. [Google Scholar] [CrossRef]
- Ma, W.; Li, Y.; Chao, C.Y.H.; Tso, C.Y.; Huang, B.; Li, W.; Yao, S. Solar-assisted icephobicity down to −60°C with superhydrophobic selective surfaces. Cell Rep. Phys. Sci. 2021, 2, 100384. [Google Scholar] [CrossRef]
- Ijaola, A.O.; Farayibi, P.K.; Asmatulu, E. Superhydrophobic coatings for steel pipeline protection in oil and gas industries: A comprehensive review. J. Nat. Gas Sci. Eng. 2020, 83, 103544. [Google Scholar] [CrossRef]
- Jiang, J.; Wan, S.; Yi, G.; Wang, J.; Chang, J.; Jin, W.; Lei, J.; Lu, B.; Qu, F. A case study on the wear mechanism and stress evolution of graphite plugged bronze wear plate from the field trial. Eng. Fail. Anal. 2021, 131, 105836. [Google Scholar] [CrossRef]
- Akram, S.; Babutskyi, A.; Chrysanthou, A.; Montalvão, D.; Whiting, M.J.; Pizurova, N. Improvement of the wear resistance of nickel-aluminium bronze and 2014-T6 aluminium alloy by application of alternating magnetic field treatment. Wear 2021, 480–481, 203940. [Google Scholar] [CrossRef]
- Velásquez, D.; Pérez, S.; Mejía-Gutiérrez, R.; Velásquez-López, A. Crack detection method in transport of hygroscopic particulate compressed material. Int. J. Mech. Mechatron. Eng. 2020, 20, 26–33. [Google Scholar]
- Oksanen, V.T.; Lehtovaara, A.J.; Kallio, M.H. Load capacity of lubricated bismuth bronze bimetal bearing under elliptical sliding motion. Wear 2017, 388–389, 72–80. [Google Scholar] [CrossRef]
- Ghaednia, H.; Hossain, M.S.; Jackson, R.L. Tribological Performance of Silver Nanoparticle–Enhanced Polyethylene Glycol Lubricants. Tribol. Trans. 2016, 59, 585–592. [Google Scholar] [CrossRef]
- Gara, L.; Zou, Q. Friction and wear characteristics of oil-based ZnO nanofluids. Tribol. Trans. 2013, 56, 236–244. [Google Scholar] [CrossRef]
- Wu, Y.Y.; Tsui, W.C.; Liu, T.C. Experimental analysis of tribological properties of lubricating oils with nanoparticle additives. Wear 2007, 262, 819–825. [Google Scholar] [CrossRef]
- Xie, H.; Jiang, B.; He, J.; Xia, X.; Pan, F. Lubrication performance of MoS2 and SiO2 nanoparticles as lubricant additives in magnesium alloy-steel contacts. Tribol. Int. 2016, 93, 63–70. [Google Scholar] [CrossRef]
- Fu, J.; Xu, J.; Zhang, J.; Xu, G.; Li, Y.; Wang, Z. Effect of low cast-rolling speeds on the microstructure and mechanical properties of twin-roll casting high Mg AA5059 alloy sheets. J. Mater. Res. Technol. 2022, 19, 1059–1072. [Google Scholar] [CrossRef]
- Cetin, M.H.; Ozcelik, B.; Kuram, E.; Demirbas, E. Evaluation of vegetable based cutting fluids with extreme pressure and cutting parameters in turning of AISI 304L by Taguchi method. J. Clean. Prod. 2011, 19, 2049–2056. [Google Scholar] [CrossRef]
- Krelling, A.P.; da Costa, C.E.; Milan, J.C.G.; Almeida, E.A.S. Micro-abrasive wear mechanisms of borided AISI 1020 steel. Tribol. Int. 2017, 111, 234–242. [Google Scholar] [CrossRef]
- Yi, Y.; Xing, J.; Ren, X.; Fu, H.; Li, Q.; Yi, D. Investigation on abrasive wear behavior of FeB alloys containing various molybdenum contents. Tribol. Int. 2019, 135, 237–245. [Google Scholar] [CrossRef]
- Gök, M.S.; Küçük, Y.; Erdoğan, A.; Öge, M.; Kanca, E.; Günen, A. Dry sliding wear behavior of borided hot-work tool steel at elevated temperatures. Surf. Coat. Technol. 2017, 328, 54–62. [Google Scholar] [CrossRef]
- Kondul, B.; Cetin, M.H. Increasing the wear resistance of railway switches with boron coating and analysis of tribological performance by ANOVA method. Wear 2022, 488–489, 204132. [Google Scholar] [CrossRef]
- Turan, M.E.; Sun, Y.; Akgul, Y. Improved wear properties of magnesium matrix composite with the addition of fullerene using semi powder metallurgy. Fuller. Nanotub. Carbon Nanostruct. 2018, 26, 130–136. [Google Scholar] [CrossRef]
- Cetin, M.H.; Korkmaz, S. Investigation of the concentration rate and aggregation behaviour of nano-silver added colloidal suspensions on wear behaviour of metallic materials by using ANOVA method. Tribol. Int. 2020, 147, 106273. [Google Scholar] [CrossRef]
- Korkmaz, M.E.; Gupta, M.K.; Demirsöz, R.; Boy, M.; Yaşar, N.; Günay, M.; Ross, N.S. On tribological characteristics of TiC rollers machined under hybrid lubrication/cooling conditions. Tribol. Int. 2022, 174, 107745. [Google Scholar] [CrossRef]
- Chen, X.; Zhang, Y.; Li, C.; Huang, L.; Wang, Y.; Gao, T.; Zhang, Z.; Liu, W. Wear Properties of C-MoS2-PTFE Composite Coating Prepared on 4032 Aluminum Alloy. Lubricants 2022, 10, 181. [Google Scholar] [CrossRef]
- Demirsöz, R.; Korkmaz, M.E.; Gupta, M.K. A novel use of hybrid Cryo-MQL system in improving the tribological characteristics of additively manufactured 316 stainless steel against 100 Cr6 alloy. Tribol. Int. 2022, 173, 107613. [Google Scholar] [CrossRef]
- Zhang, T.; Zhen, H.; Liu, T.; Hou, X.; Zhang, Z. Microstructure and Tribological Properties of Lubricating-Reinforcing Laser Cladding Composite Coating with the Ti2SC-Ti2Ni Mosaic Structure Phase. Coatings 2022, 12, 876. [Google Scholar] [CrossRef]
- García-León, R.A.; Martínez-Trinidad, J.; Zepeda-Bautista, R.; Campos-Silva, I.; Guevara-Morales, A.; Martínez-Londoño, J.; Barbosa-Saldaña, J. Dry sliding wear test on borided AISI 316L stainless steel under ball-on-flat configuration: A statistical analysis. Tribol. Int. 2021, 157, 106885. [Google Scholar] [CrossRef]
- Korkmaz, M.E.; Gupta, M.K.; Demirsöz, R. Understanding the lubrication regime phenomenon and its influence on tribological characteristics of additively manufactured 316 Steel under novel lubrication environment. Tribol. Int. 2022, 173, 107686. [Google Scholar] [CrossRef]
Figure 1.
The scale layer and its structure.

Figure 2.
Specimen and steel ball sizes.

Figure 3.
SEM image of the mill scale.

Figure 4.
Schematic presentation of the experimental setup.

Figure 5.
Experimental setup of the ball-on-flat wear test.

Figure 6.
Parameter contribution rates.

Figure 7.
Response surface method outputs.

Figure 8.
Wear tracks for 10 N load and 5 mm/s sliding speed under different environmental conditions.
Figure 8.
Wear tracks for 10 N load and 5 mm/s sliding speed under different environmental conditions.

Figure 9.
Wear tracks occurring at different load values for 5 mm/s sliding speed and non-abrasive environment.
Figure 9.
Wear tracks occurring at different load values for 5 mm/s sliding speed and non-abrasive environment.

Figure 10.
CoF graphs of three different environments for 30 N load and 15 mm/s sliding speed.

Figure 11.
Specimen surface SEM images of experiments performed at a shear rate of 15 mm/s.

Figure 12.
Schematic images of the wear mechanism.

Figure 13.
Images of the worn specimen surface: (a) 250× SEM image, (b) 1000× SEM image, (c) 1000×, 10.00 kV DX graph, (d) 1000× mapping image.
Figure 13.
Images of the worn specimen surface: (a) 250× SEM image, (b) 1000× SEM image, (c) 1000×, 10.00 kV DX graph, (d) 1000× mapping image.

Figure 14.
Images of the steel ball: (a) 82× SEM image, (b) 3000× SEM image, (c) 3000×, 10.00 kV EDX graph, (d) 3000× mapping image.
Figure 14.
Images of the steel ball: (a) 82× SEM image, (b) 3000× SEM image, (c) 3000×, 10.00 kV EDX graph, (d) 3000× mapping image.


Table 1.
Chemical composition of specimen material.
| Element | Cu | Sn | Ni | Pb | Al | Mn | Fe | Balance |
|---|---|---|---|---|---|---|---|---|
| wt % | 86.88 | 1.45 | 3.63 | 3.68 | 0.22 | 0.41 | 0.44 | 3.29 |
Table 2.
Chemical composition of specimen material.
| Element | C | Mn | P | S | Si | Ni | Cr | Cu |
|---|---|---|---|---|---|---|---|---|
| wt % | 0.95 | 0.35 | 0.025 | 0.015 | 0.25 | 0.30 | 1.55 | 0.3 |
Table 3.
Technical specifications of the lubricating oil.
| Property | |
|---|---|
| Grade | ISO 100 |
| Copper Strip Corrosion, 3 h, 100 C, Rating, ASTM D130 | 1 A |
| Demulsibility, Total Free Water, Non-EP Oils, mL, ASTM D2711 | 39 |
| Density @ 15 C, kg/L, ASTM D1298 | 0.88 |
| Emulsion, Time to 37 mL Water, 54 C, min, ASTM D1401 | 15 |
| FZG Scuffing, Fail Load Stage, A/8.3/90, ISO 14635-1 | 12 |
| Flash Point, Cleveland Open Cup, °C, ASTM D92 | 264 |
| Foam, Sequence I, Tendency, mL, ASTM D892 | 10 |
| Kinematic Viscosity @ 100 C, mm2/s, ASTM D445 | 10.7 |
| Kinematic Viscosity @ 40 C, mm2/s, ASTM D445 | 89 |
| Pour Point, °C, ASTM D97 | −24 |
| Viscosity Index, ASTM D2270 | 99 |
Table 4.
Experimental and predicted results.
| Exp. No | Load (N) | Sliding Speed (mm/s) | Conc. (%) | Coefficient of Friction (CoF) | Predicted CoF | Volume Loss (VL) 10−3 (mm3) | Predicted VL 10−3 (mm3) | Wear Depth (WD) (µm) | Predicted WD (µm) |
|---|---|---|---|---|---|---|---|---|---|
| 1 | 10 | 5 | 0 | 0.065 ± 0.014 | 0.067 | 15.3 ± 0.62 | 16.1 | 5.35 ± 0.31 | 4.47 |
| 2 | 10 | 5 | 2.5 | 0.096 ± 0.013 | 0.087 | 33.4 ± 0.56 | 27.2 | 9.51 ± 0.49 | 8.20 |
| 3 | 10 | 5 | 5 | 0.106± 0.026 | 0.108 | 50.6 ± 0.53 | 54.8 | 12.59 ± 0.70 | 14.44 |
| 4 | 20 | 5 | 0 | 0.087 ± 0.011 | 0.077 | 30.5 ± 1.33 | 39.1 | 8.94 ± 0.91 | 10.40 |
| 5 | 20 | 5 | 2.5 | 0.103 ± 0.023 | 0.098 | 53.5 ± 0.44 | 50.6 | 13.25 ± 0.42 | 13.78 |
| 6 | 20 | 5 | 5 | 0.108 ± 0.015 | 0.118 | 79.2 ± 1.31 | 78.5 | 20.42 ± 0.72 | 19.68 |
| 7 | 30 | 5 | 0 | 0.093 ± 0.050 | 0.087 | 45.8 ± 1.71 | 36.8 | 12.17 ± 0.93 | 10.57 |
| 8 | 30 | 5 | 2.5 | 0.108 ± 0.025 | 0.108 | 39.1 ± 1.82 | 48.6 | 11.57 ± 0.75 | 13.60 |
| 9 | 30 | 5 | 5 | 0.116 ± 0.029 | 0.128 | 81.1 ± 1.15 | 76.9 | 20.51 ± 1.79 | 19.14 |
| 10 | 10 | 10 | 0 | 0.057 ± 0.016 | 0.062 | 22.9 ± 1.85 | 23.4 | 5.73 ± 0.47 | 6.32 |
| 11 | 10 | 10 | 2.5 | 0.087 ± 0.011 | 0.083 | 34.4 ± 1.04 | 33.7 | 11.12 ± 1.53 | 9.73 |
| 12 | 10 | 10 | 5 | 0.100 ± 0.010 | 0.103 | 62.0 ± 0.88 | 60.4 | 16.10 ± 0.65 | 15.65 |
| 13 | 20 | 10 | 0 | 0.073 ± 0.070 | 0.073 | 57.3 ± 0.61 | 52.0 | 13.43 ± 0.56 | 13.67 |
| 14 | 20 | 10 | 2.5 | 0.097 ± 0.019 | 0.093 | 60.1 ± 0.85 | 62.6 | 15.95 ± 0.52 | 16.73 |
| 15 | 20 | 10 | 5 | 0.111 ± 0.022 | 0.113 | 88.8 ± 1.31 | 89.7 | 22.02 ± 1.15 | 22.30 |
| 16 | 30 | 10 | 0 | 0.081 ± 0.014 | 0.083 | 55.4 ± 1.64 | 55.4 | 15.29 ± 0.84 | 15.24 |
| 17 | 30 | 10 | 2.5 | 0.102 ± 0.018 | 0.103 | 61.1 ± 1.01 | 66.4 | 17.40 ± 0.53 | 17.95 |
| 18 | 30 | 10 | 5 | 0.119 ± 0.009 | 0.123 | 95.5 ± 0.87 | 93.7 | 23.75 ± 0.25 | 23.17 |
| 19 | 10 | 15 | 0 | 0.053 ± 0.023 | 0.058 | 29.6 ± 0.69 | 30.9 | 6.89 ± 0.20 | 8.56 |
| 20 | 10 | 15 | 2.5 | 0.079 ± 0.016 | 0.078 | 40.1 ± 0.85 | 40.3 | 12.15 ± 0.15 | 11.65 |
| 21 | 10 | 15 | 5 | 0.092 ± 0.070 | 0.099 | 64.9 ± 0.17 | 66.2 | 16.85 ± 0.30 | 17.25 |
| 22 | 20 | 15 | 0 | 0.068 ± 0.010 | 0.068 | 67.8 ± 0.26 | 65.2 | 19.22 ± 0.78 | 17.31 |
| 23 | 20 | 15 | 2.5 | 0.083 ± 0.014 | 0.088 | 73.5 ± 1.80 | 74.9 | 20.12 ± 0.83 | 20.05 |
| 24 | 20 | 15 | 5 | 0.126 ± 0.027 | 0.109 | 103.1 ± 1.15 | 101.1 | 25.91 ± 0.27 | 25.30 |
| 25 | 30 | 15 | 0 | 0.071 ± 0.006 | 0.078 | 68.7 ± 1.57 | 74.3 | 19.85 ± 0.36 | 20.30 |
| 26 | 30 | 15 | 2.5 | 0.090 ± 0.009 | 0.098 | 93.5 ± 1.64 | 84.3 | 23.34 ± 0.75 | 22.69 |
| 27 | 30 | 15 | 5 | 0.137 ± 0.046 | 0.119 | 106.9 ± 0.85 | 110.8 | 26.40 ± 0.72 | 27.59 |
Table 5.
The ANOVA results of volume loss.
| Source | DF | Adj SS | Adj MS | F-Value | p-Value | Contribution Rate % |
|---|---|---|---|---|---|---|
| L—Load (N) | 1 | 4798.7 | 4798.73 | 149.88 | 0.0000 | 29.70 |
| S—Speed (mm/s) | 1 | 2679.1 | 2679.12 | 83.68 | 0.0000 | 16.58 |
| E—Environment (wt %) | 1 | 6377 | 6376.97 | 199.17 | 0.0000 | 39.47 |
| L × L | 1 | 956.8 | 956.76 | 29.88 | 0.0000 | 5.92 |
| S × S | 1 | 0 | 0.05 | 0 | 0.9698 | 0.00 |
| E × E | 1 | 405.6 | 405.63 | 12.67 | 0.0024 | 2.51 |
| L × S | 1 | 383.1 | 383.07 | 11.96 | 0.0030 | 2.37 |
| L × E | 1 | 1.3 | 1.27 | 0.04 | 0.8446 | 0.01 |
| S × E | 1 | 9.2 | 9.19 | 0.29 | 0.5991 | 0.06 |
| Error | 17 | 544.3 | 32.02 | 3.37 | ||
| Total | 26 | 16,155.1 | 100.00 | |||
| R2 = 0.9664, R2 (adj) = 0.9485 | ||||||
Table 6.
The ANOVA results in terms of wear depth.
| Source | DF | Adj SS | Adj MS | F-Value | p-Value | Contribution Rate % |
|---|---|---|---|---|---|---|
| L—Load (N) | 1 | 304.099 | 304.099 | 169.25 | 0.0000 | 32.60 |
| S—Speed (mm/s) | 1 | 176.845 | 176.845 | 98.42 | 0.0000 | 18.96 |
| E—Environment (wt %) | 1 | 335.189 | 335.189 | 186.55 | 0.0000 | 35.93 |
| L × L | 1 | 49.949 | 49.949 | 27.80 | 0.0001 | 5.35 |
| S × S | 1 | 0.222 | 0.222 | 0.12 | 0.7297 | 0.00002 |
| E × E | 1 | 9.446 | 9.446 | 5.26 | 0.0349 | 1.01 |
| L × S | 1 | 23.843 | 23.843 | 13.27 | 0.0020 | 2.56 |
| L × E | 1 | 1.474 | 1.474 | 0.82 | 0.3778 | 0.16 |
| S × E | 1 | 1.232 | 1.232 | 0.69 | 0.4191 | 0.13 |
| Error | 17 | 30.545 | 1.797 | 3.27 | ||
| Total | 26 | 932.844 | 100.00 | |||
| R2 = 0.9673, R2 (adj) = 0.9499 | ||||||
Table 7.
ANOVA results of the coefficient of friction.
| Source | DF | Adj SS | Adj MS | F-Value | p-Value | Contribution Rate % |
|---|---|---|---|---|---|---|
| L—Load (N) | 1 | 0.001840 | 0.00184 | 39.95 | 0.0000 | 16.52 |
| S—Speed (mm/s) | 1 | 0.000383 | 0.000383 | 8.31 | 0.0103 | 3.44 |
| E—Environment (wt %) | 1 | 0.007483 | 0.007483 | 162.46 | 0.0000 | 67.18 |
| L × L | 1 | 0.000067 | 0.000067 | 1.45 | 0.2454 | 0.60 |
| S × S | 1 | 0.000013 | 0.000013 | 0.29 | 0.5953 | 0.12 |
| E × E | 1 | 0.000013 | 0.000013 | 0.29 | 0.5953 | 0.12 |
| L × S | 1 | 0.000048 | 0.000048 | 1.04 | 0.3216 | 0.43 |
| L × E | 1 | 0.000001 | 0.000001 | 0.03 | 0.8669 | 0.01 |
| S × E | 1 | 0.000507 | 0.000507 | 11.01 | 0.0041 | 4.55 |
| Error | 17 | 0.000783 | 0.000046 | 7.03 | ||
| Total | 26 | 0.011139 | 100.00 | |||
| R2 = 0.9297, R2 (adj) = 0.8925 | ||||||
Publisher’s Note: MDPI stays neutral with regard to jurisdictional claims in published maps and institutional affiliations. |
© 2022 by the author. Licensee MDPI, Basel, Switzerland. This article is an open access article distributed under the terms and conditions of the Creative Commons Attribution (CC BY) license (https://creativecommons.org/licenses/by/4.0/).
Share and Cite
MDPI and ACS Style
Demirsöz, R. Wear Behavior of Bronze vs. 100Cr6 Friction Pairs under Different Lubrication Conditions for Bearing Applications. Lubricants 2022, 10, 212. https://0-doi-org.brum.beds.ac.uk/10.3390/lubricants10090212
AMA Style
Demirsöz R. Wear Behavior of Bronze vs. 100Cr6 Friction Pairs under Different Lubrication Conditions for Bearing Applications. Lubricants. 2022; 10(9):212. https://0-doi-org.brum.beds.ac.uk/10.3390/lubricants10090212
Chicago/Turabian StyleDemirsöz, Recep. 2022. "Wear Behavior of Bronze vs. 100Cr6 Friction Pairs under Different Lubrication Conditions for Bearing Applications" Lubricants 10, no. 9: 212. https://0-doi-org.brum.beds.ac.uk/10.3390/lubricants10090212
Note that from the first issue of 2016, this journal uses article numbers instead of page numbers. See further details here.