
Optimizing the High-Performance Milling of Thin Aluminum Alloy Plates Using the Taguchi Method


Department of Mold and Die Engineering, National Kaohsiung University of Science and Technology, Kaohsiung 807, Taiwan
*
Author to whom correspondence should be addressed.
Metals 2021, 11(10), 1526; https://0-doi-org.brum.beds.ac.uk/10.3390/met11101526
Submission received: 26 July 2021
/
Revised: 17 September 2021
/
Accepted: 24 September 2021
/
Published: 26 September 2021
(This article belongs to the Special Issue Optimization and Analysis of Metal Cutting Processes)
Abstract
:Most aerospace parts are thin walled and made of aluminum or titanium alloy that is machined to the required shape and dimensions. Deformation is a common issue. Although the reduced cutting forces used in high-speed milling generate low residual stress, the problem of deformation cannot be completely resolved. In this work, we emphasized that choosing the correct cutting parameters and machining techniques could increase the cutting performance and surface quality and reduce the deformation of thin plates. In this study, a part made of a thin 6061 aluminum alloy plate was machined by high-speed milling (HSM), and a Taguchi L16 orthogonal array was used to optimize the following parameters: linear velocity, feed per tooth, cutting depth, cutting width, and toolpath. The impact of cutting parameters on the degree of deformation, surface roughness, as well as the cutting force on the thin plate were all investigated. The results showed that the experimental parameters for the optimal degree of deformation were A1 (linear velocity 450 mm/min), B1 (feed per tooth 0.06 mm/tooth), C1 (cutting depth 0.3 mm), D4 (cutting width 70%), and E4 (rough zigzag). Feed per tooth was the most significant control factor, with a contribution as high as 63.5%. It should also be mentioned that, according to the factor response of deformation, there was a lower value of feed per tooth and less deformation. Furthermore, the feed per tooth and the cutting depth decreased and the surface roughness increased. The cutting force rose or fell with an increase or decrease of cutting depth.
1. Introduction
Aerospace parts are no longer as thick and heavy as they were in the early days. These parts can now be much lighter as a result of geometric improvements made through finite element analysis simulation and topology optimization. This also results in much greater strength. The 6000 series of aluminum alloys is the most extensively used primary material in aerospace. It is used for fuselage framework as well as outer frame structures. In manufacture, as much as 90% of the material has to be removed by machining, and this can result in severe deformation of these lightweight parts [1,2,3]. There are several ways to reduce the degree of deformation [4], and one involves the reduction of residual stress. When processing thin components such as plates, residual stress is a major cause of inaccurate dimensions and deformation and is the most difficult factor to control. The degree of deformation can be lowered by effective reduction of residual stress. This can often be achieved by smaller cutting depth, lower cutting force, changes in process strategy, flexible design, and prompt removal of heat [5,6,7,8]. A flexible design can include a frame of material around the thin part, which is removed after the processing has been completed [9,10]. Control of machining speed in a machine with two cutters, simultaneously milling both sides of a flat component, can generate a phase difference that cancels the occurrence of flutter and lowers the degree of deformation [11]. A smart fixing system with a jig that allows the clamping force to be adjusted according to the cutting position and cutting force, or which allows the clamping force to be evenly distributed over the workpiece by means of vacuum, can effectively lower the degree of deformation [12,13].
Recent development has led to machine tools that run at high speed and have great precision, and high-speed machining has now become a mature technology. In the past, most conventional cutting was done at low speed, with deep cuts and fast feeds. Modern machines run very fast and take small cuts at a high feed rate. This reduction of cutting depth and width and high cutting speed reduces the cutting force and also increases the production speed. More importantly, it can also lower the degree of deformation and residual stress for parts with poor rigidity. This makes it very suitable for machining thin-walled parts [14]. Furthermore, because the cutting chips are removed quickly from the surface of the workpiece during high-speed cutting, the tool and workpiece do not get so hot and are less prone to thermal distortion [15].
The selection of cutting parameters is also one of the factors that affects the deformation, surface roughness, and cutting force encountered in thin plate machining, such as linear velocity, feed per tooth, cutting depth, cutting width, and toolpath, etc. In the path strategies field, Ali, R. A. et al. aimed to investigate the influence of different path strategies of the tool in face milling. The cutting speed, feed rate, and depth of cut were considered as quantitative factors, and the toolpath strategy was the qualitative factor. Three strategies of the toolpath were zig, zigzag, and contour [16]. Magdalena, Z.M. et al. aimed to examine the impact of selected machining techniques, including high-performance cutting, high-speed cutting, conventional cutting, and combinations of these techniques. The results show that applying a correctly selected machining technique minimizes the deformation of thin-walled elements [17]. Dejan, l. et al. aimed to use the Taguchi method for the experimental plan and comparative analysis of multi-criteria decision-making (MCDM) methods. The input machining parameters were wall thickness, cutting parameters, and toolpath strategies. The three toolpath strategies were climb milling, conventional milling, and mixed milling [18]. Wirawan, S. et al. aimed to optimize the computer numerical control (CNC) milling machining time from the machine parameters and toolpath strategy. The machine parameters were speed, feed rate, and width of cut. The toolpath strategy was zigzag in pocket roughing [19]. Zaleski, K. et al. aimed to compare the conventional strategy to the machining strategy regarding chip shape, surface roughness, cutting torque, passive force, and process efficiency [20]. As mentioned above, the cutting speed, feed rate, and depth of cut were the effect factors of the deformation of the thin plate, besides the toolpath strategies, which are also important factors for the deformation. Furthermore, the correctly chosen machining techniques could minimize the deformation of the thin plate.
In the surface roughness field, Abbas, A.T. et al. aimed to optimize the cutting parameter in CNC face-milling operations on high-strength grade-H steel using artificial neural network (ANN) with the Edgeworth–Pareto method. The results show that a positive effect of spindle speed and feed rate and a negative effect of depth of cut on surface roughness were emphasized [21]. Azim, S. et al. aimed to investigate sustainable manufacturing and conduct a parametric analysis of mild steel grade 60 using five-axis CNC milling and the Taguchi method. The spindle speed, the depth of cut, and the feed rate were considered as input variables for process optimization. The ANOVA results show that the spindle speed was the main factor that affects the surface roughness of mild steel molds, and the feed rate was insignificant [22]. Markopoulos, A.P. et al. aimed to investigate the sustainability assessment and the modelling of feed peer tooth, cutting speed, cutting of depth on surface roughness, cutting force, cutting power, machining cost, and carbon dioxide during the slot milling process of AISI O1-hardened steel. The results show that the lower depth of cut and feed per tooth resulted in higher surface roughness. In addition, the cutting force increased with increasing feed per tooth and depth of cut and decreased with increasing cutting speed [23]. Chuchala, D. et al. aimed to verify the strategy of removing the outer material layers of EN AW-6082-T6 aluminum alloy sheets, and how this affects the surface roughness, taking into account the rolling direction after the face-milling process. The results show that the best values of the surface roughness were measured in the up-milling direction, but in the area of the smooth execution of the process [24]. As mentioned above, the spindle speed, feed rate, and depth of cut were the factors of the surface roughness. Although the spindle speed was the main positive factor of the surface roughness, the lower feed rate and depth of cut also could obtain a higher surface roughness.
In the cutting force field, Jarosz K. et al. aimed to optimize of face-milling operations of an Al-6061-T6 aluminum flange with commercial software. The results show that the effect of variable radial depth of cut on cutting force values in milling processes and the cutting force were related to workpiece geometry and toolpath type [25]. Wojciechowski, S. et al. aimed to achieve a reduction of forces and the improvement of efficiency during finish ball end milling of hardened 55NiCrMoV6 steel. The results show that the surface inclination angle has a significant influence on all the forces. In addition, the cutting speed only had a significant influence on the thrust force [26].
The review of the literature above has shown that milling process optimization procedures focus mainly on milling strategies, surface quality, deformation, and cutting force. However, the process efficiency of the milling thin plate was less considered. It should be emphasized that choosing the correct cutting parameters and machining techniques could increase the cutting performance and surface quality and reduce the deformation of thin plate. However, there may be hundreds of matching possibilities for the cutting parameters and the use of the optimization method allows for the required results to be obtained quickly and with the fewest number of experiments. Traditional trial and error methods waste inordinate amounts of time. The basic Taguchi concept is the design of a manufacturing process that will result in a robust product and at the same time resist uncontrollable and noisy interference by the regulation of source quality [27].
In this study, 6061 aluminum alloy was used as the test substrate in machining experiments using a high-speed machining center. The cutting parameters taken into consideration were linear velocity, feed per tooth, cutting depth, cutting width, and toolpath. The Taguchi method was used to determine suitable cutting parameters for the experiments. The impact of the cutting parameters on the degree of deformation, surface roughness, as well as the cutting force on the thin plate were all investigated.
2. Materials and Methods
2.1. Cutting Tool and Workpiece
The workpiece used was a flat plate of 6061-T651 aluminum alloy, and the chemical composition is given in Table 1 [28]. The size was selected to give a predetermined thickness to length ratio of 18.5 [4,29]. The original dimensions of the plate were 185 mm × 130 mm × 10 mm. The final thickness of the workpiece after machining was 1.4 mm, giving a thickness to length ratio of 128. The cutter used for machining was 10 mm in diameter, the length of the cutter was 75 mm, and the end mill had a 3-flute solid carbide cutter for aluminum alloy, as shown in Table 2 (Shuan Yu Co., Ltd, Taichung, Taiwan).
2.2. Equipment and Setup of the Experiment
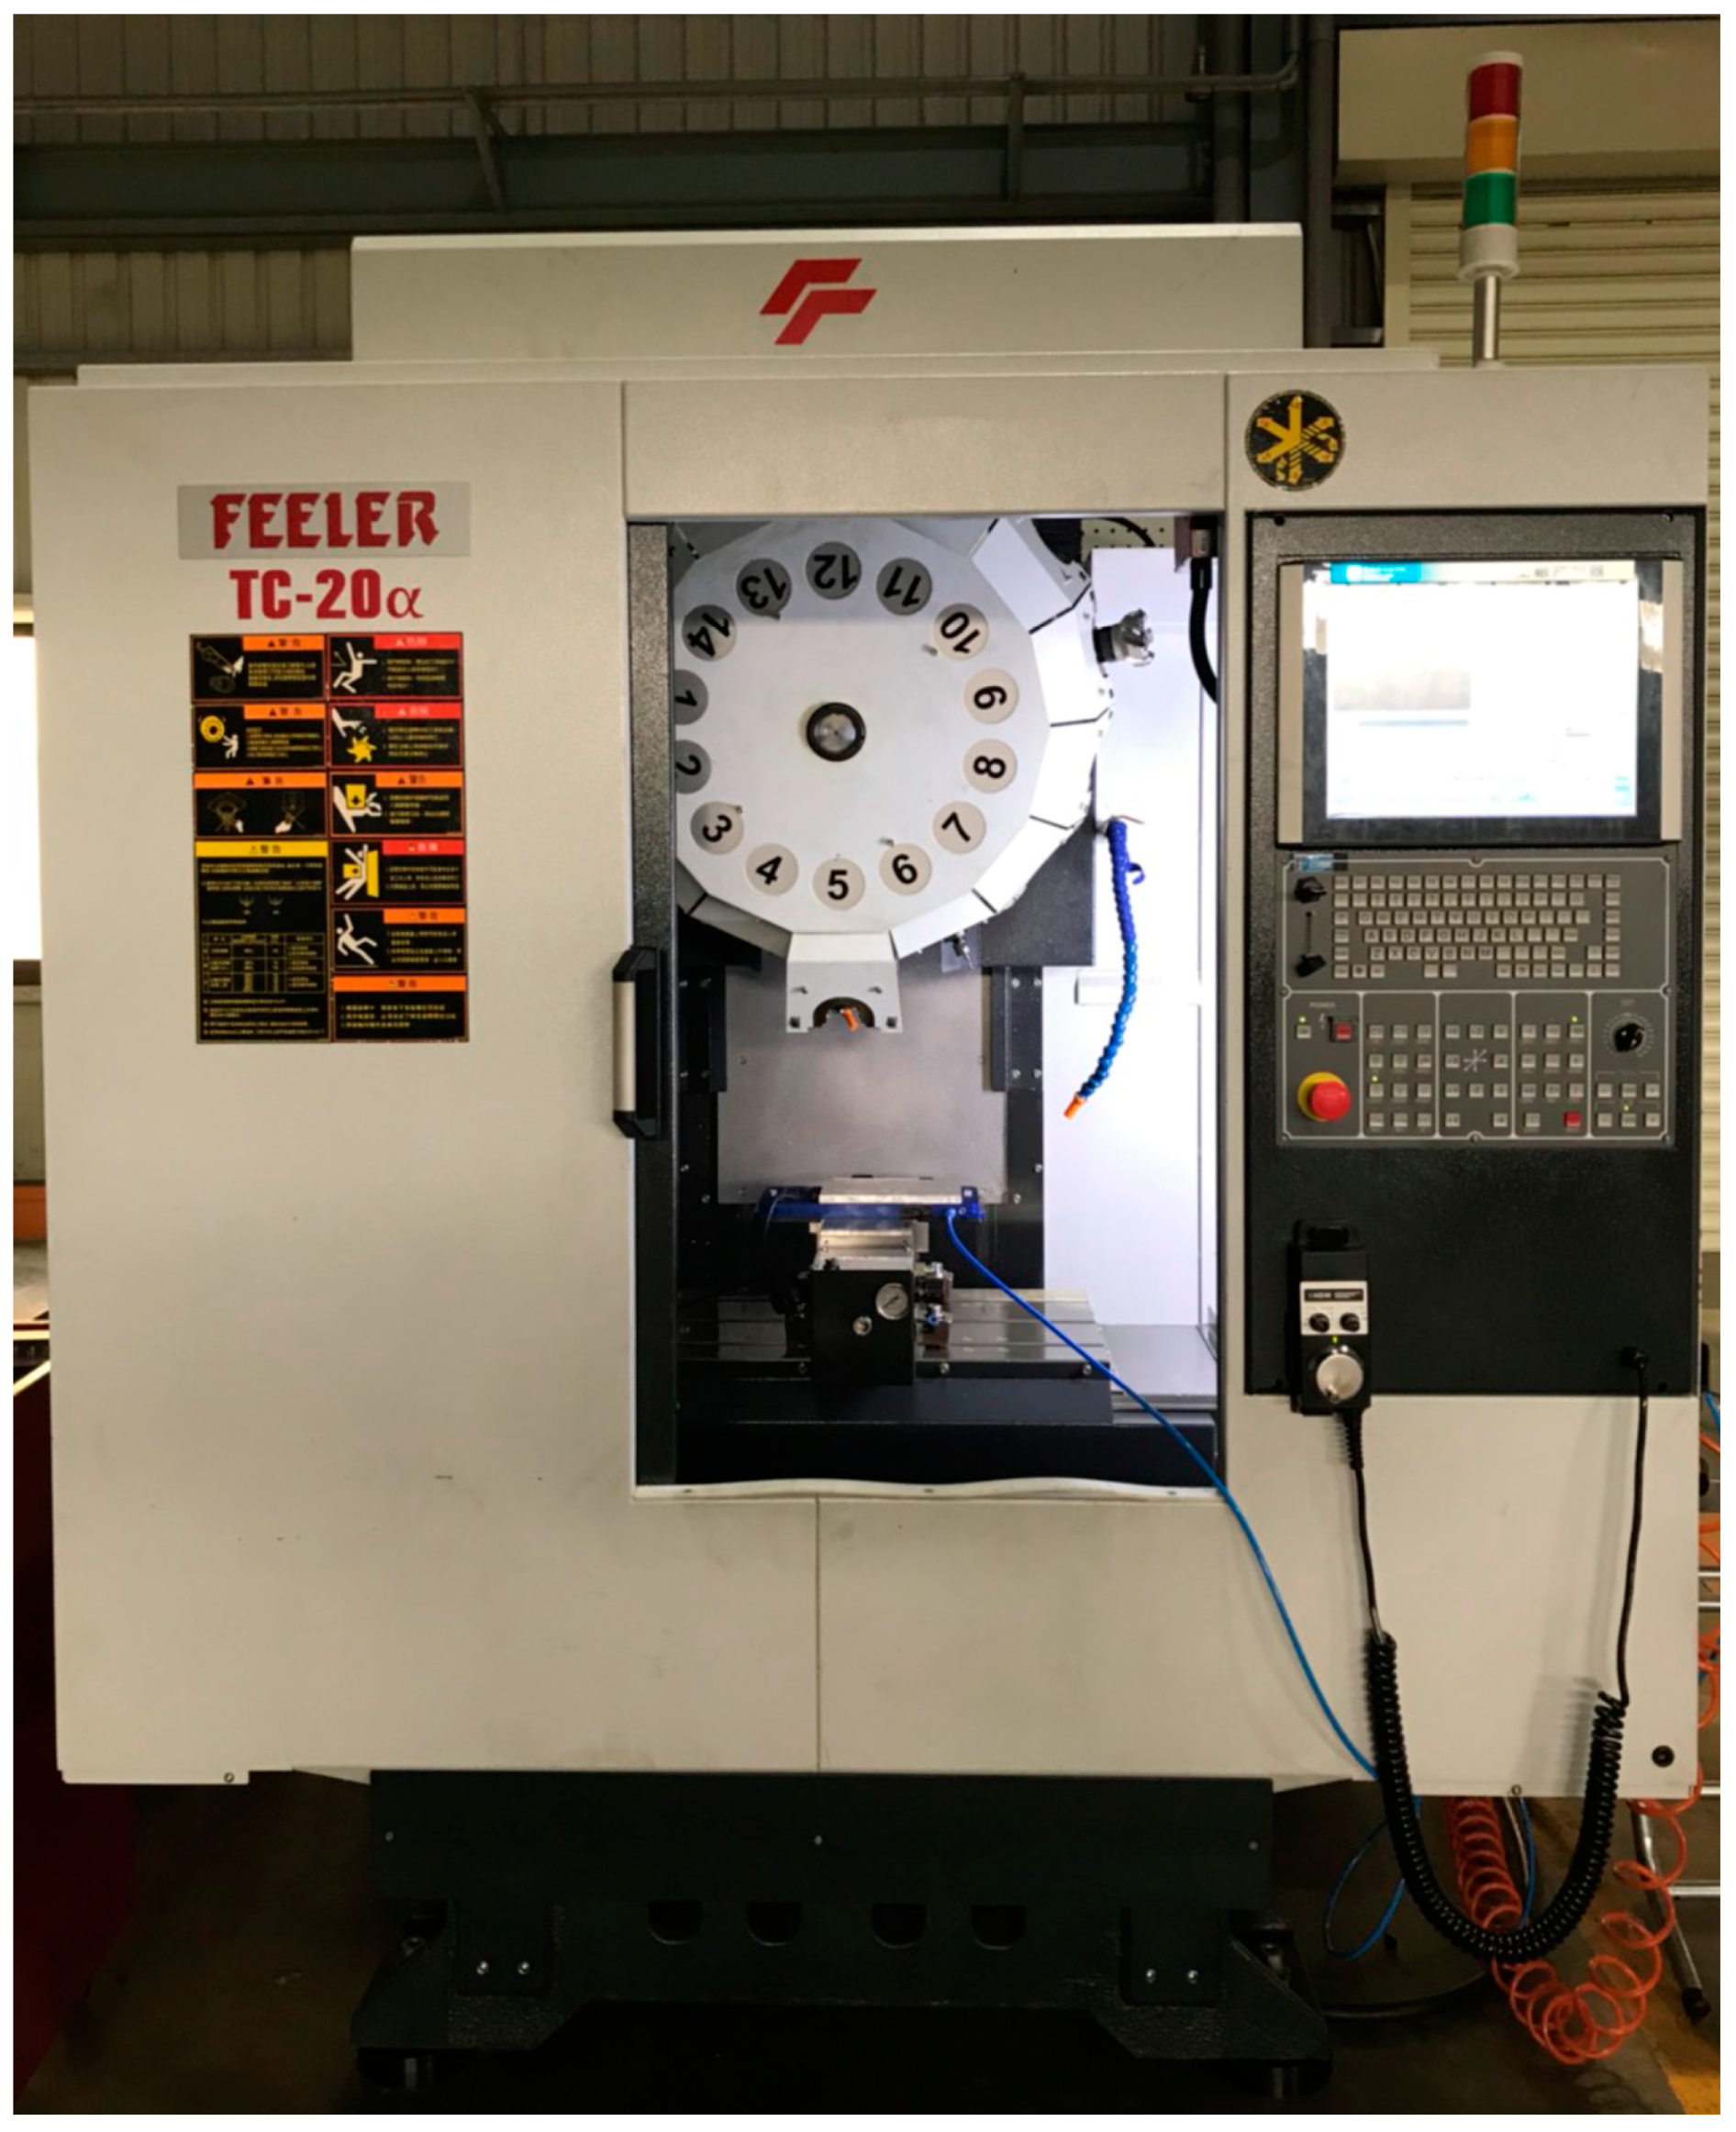
The equipment used included a model TC-20α Feeler machining center (FEELER, Taichung, Taiwan), a clamping arrangement for holding the workpiece to the bed of the machine, and instruments for measuring tool cutting force, workpiece deformation, and surface roughness.
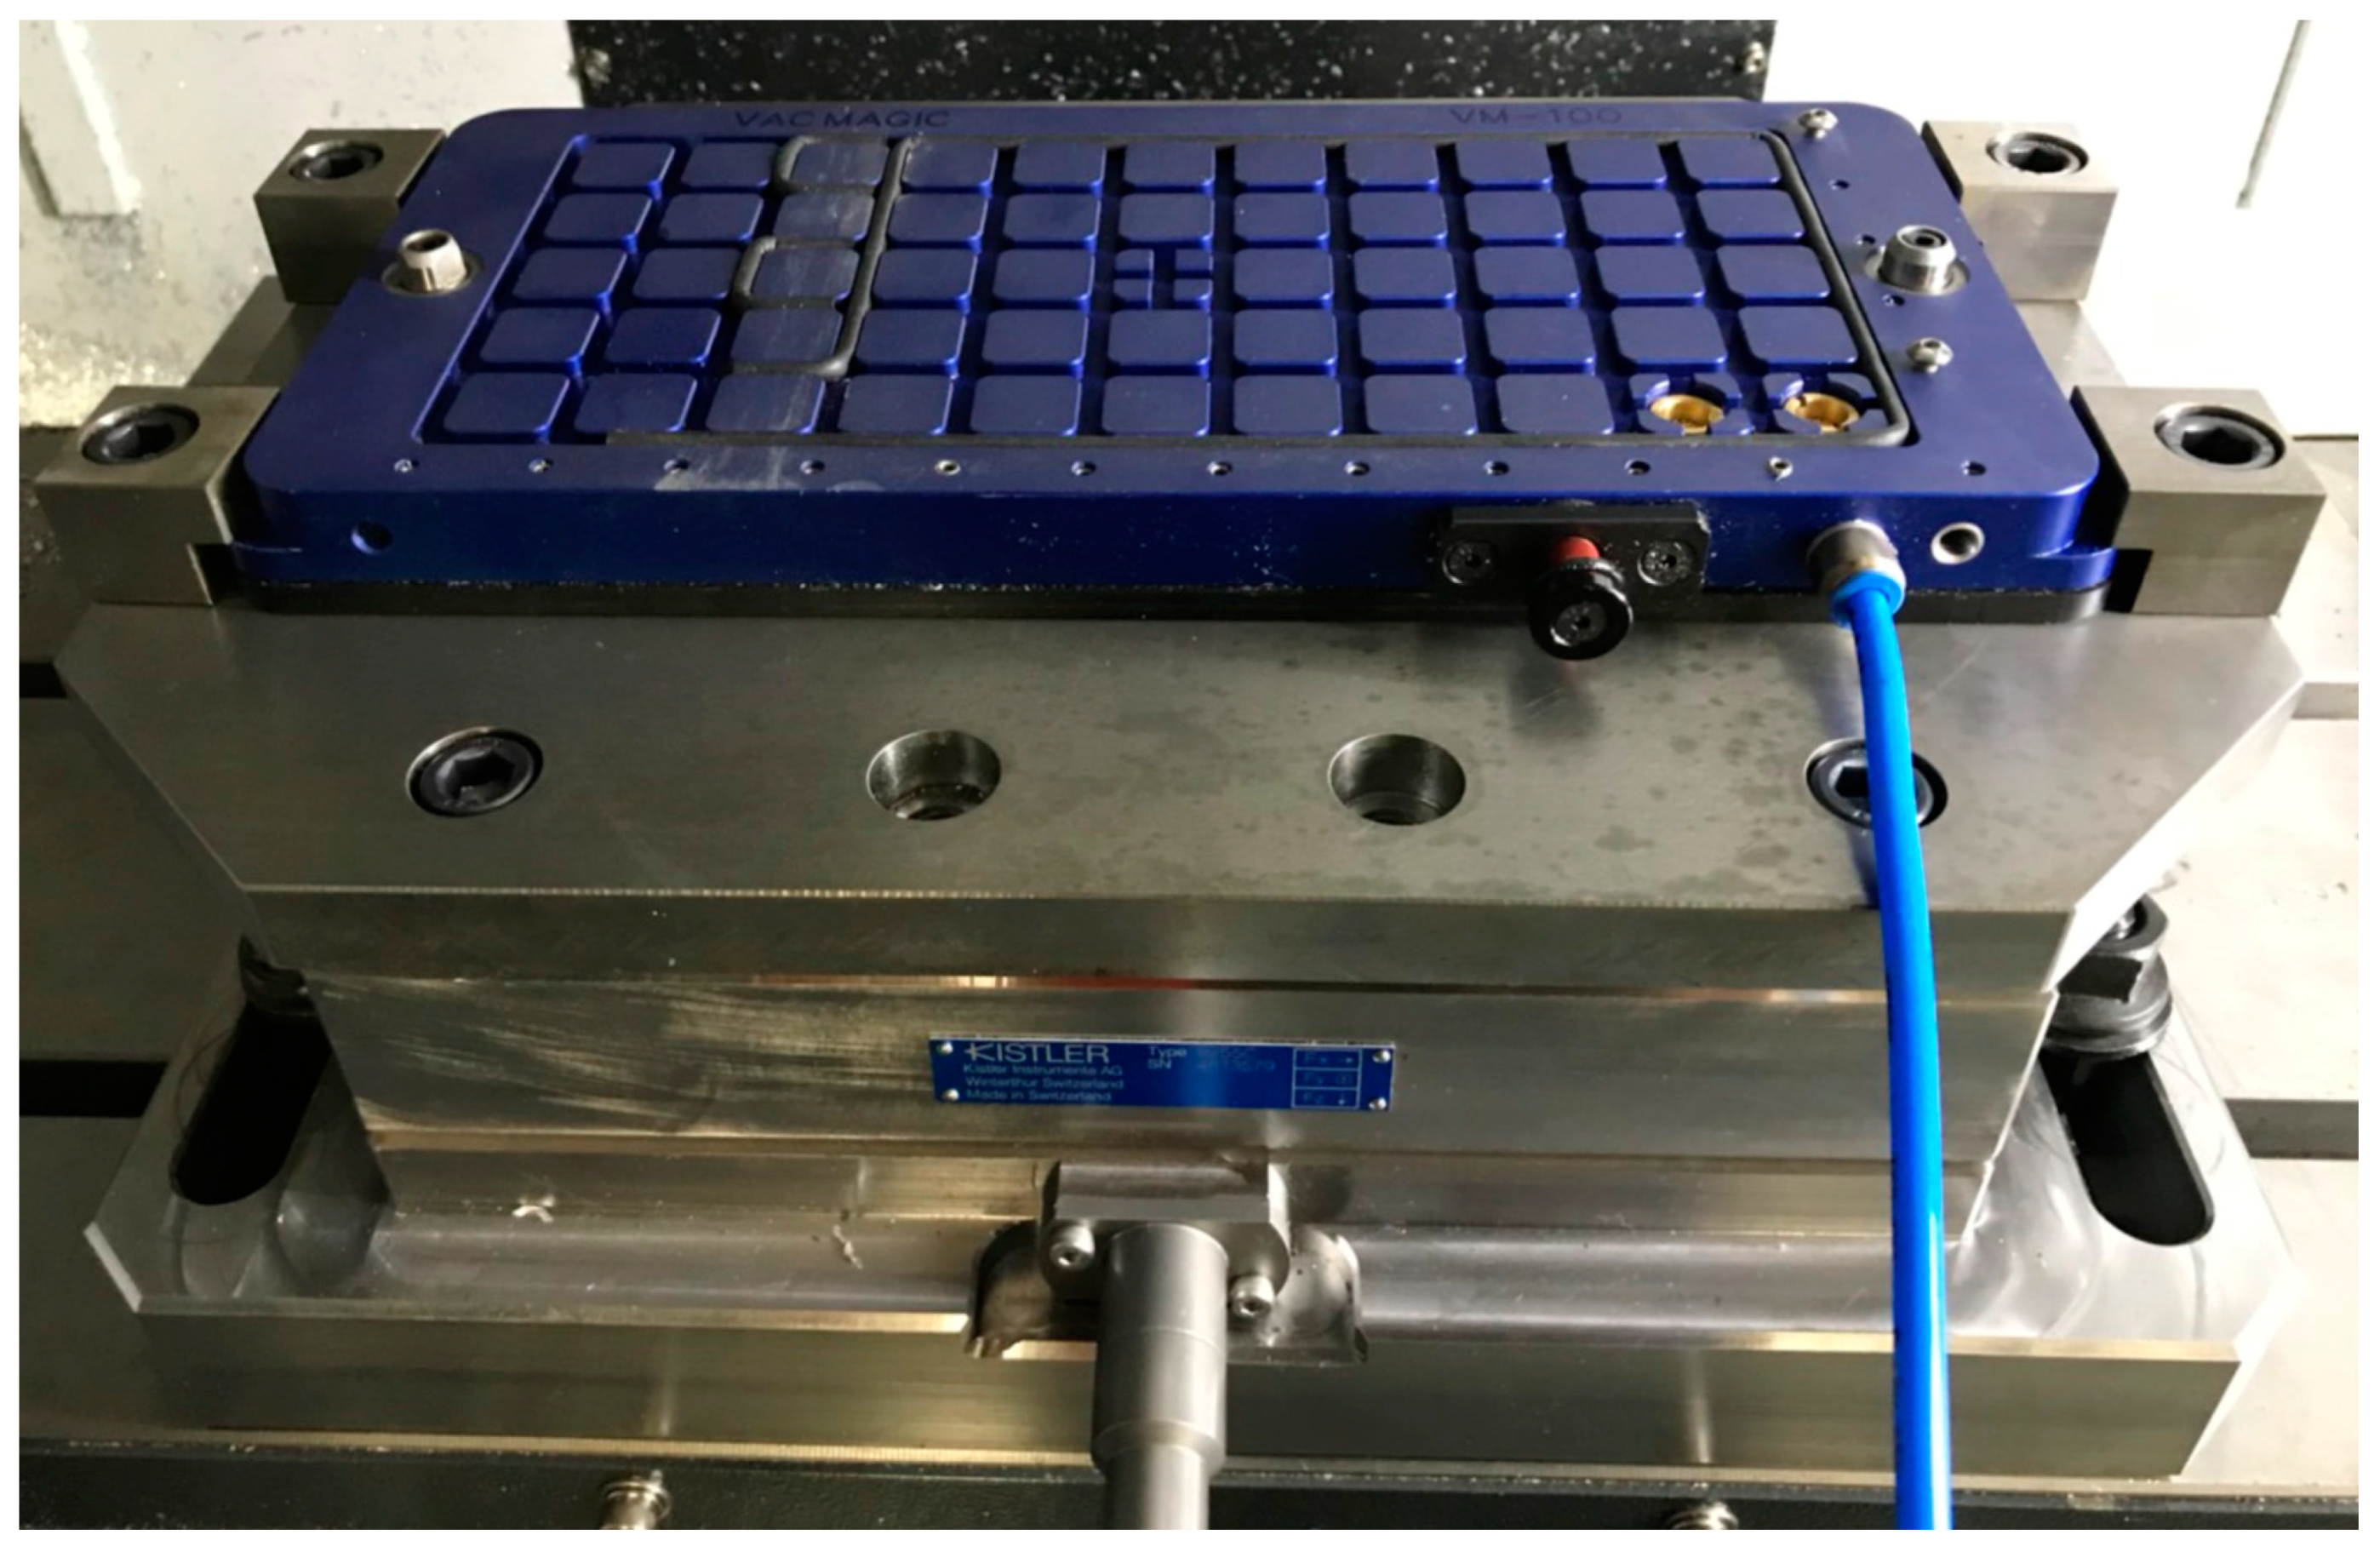
The TC-20α was controlled by an M100 Touch system (ITRI, Taichung, Taiwan) developed by the Industrial Technology Research Institute. The spindle was driven by a 4.9 Hp motor and could reach speeds of more than 20,000 rpm, and the hydraulic tool holder was BT30, as seen in Figure 1. The workpiece was held by a vacuum clamping system. These systems are designed mainly for non-magnetic materials that cannot be easily clamped mechanically, and they are effective in reducing workpiece deformation. A Mitee-Bite Vacmagic VM-100 (Mitee-Bite Products, Carroll, USA), which has a large holding surface, was used in these experiments and the size of the base unit was 315 mm × 140 mm × 25 mm. The dimensions of the workpiece used were 185 mm × 130 mm and the holding air pressure applicable to this area was 1 bar, which provided a holding force of 227 kgf.
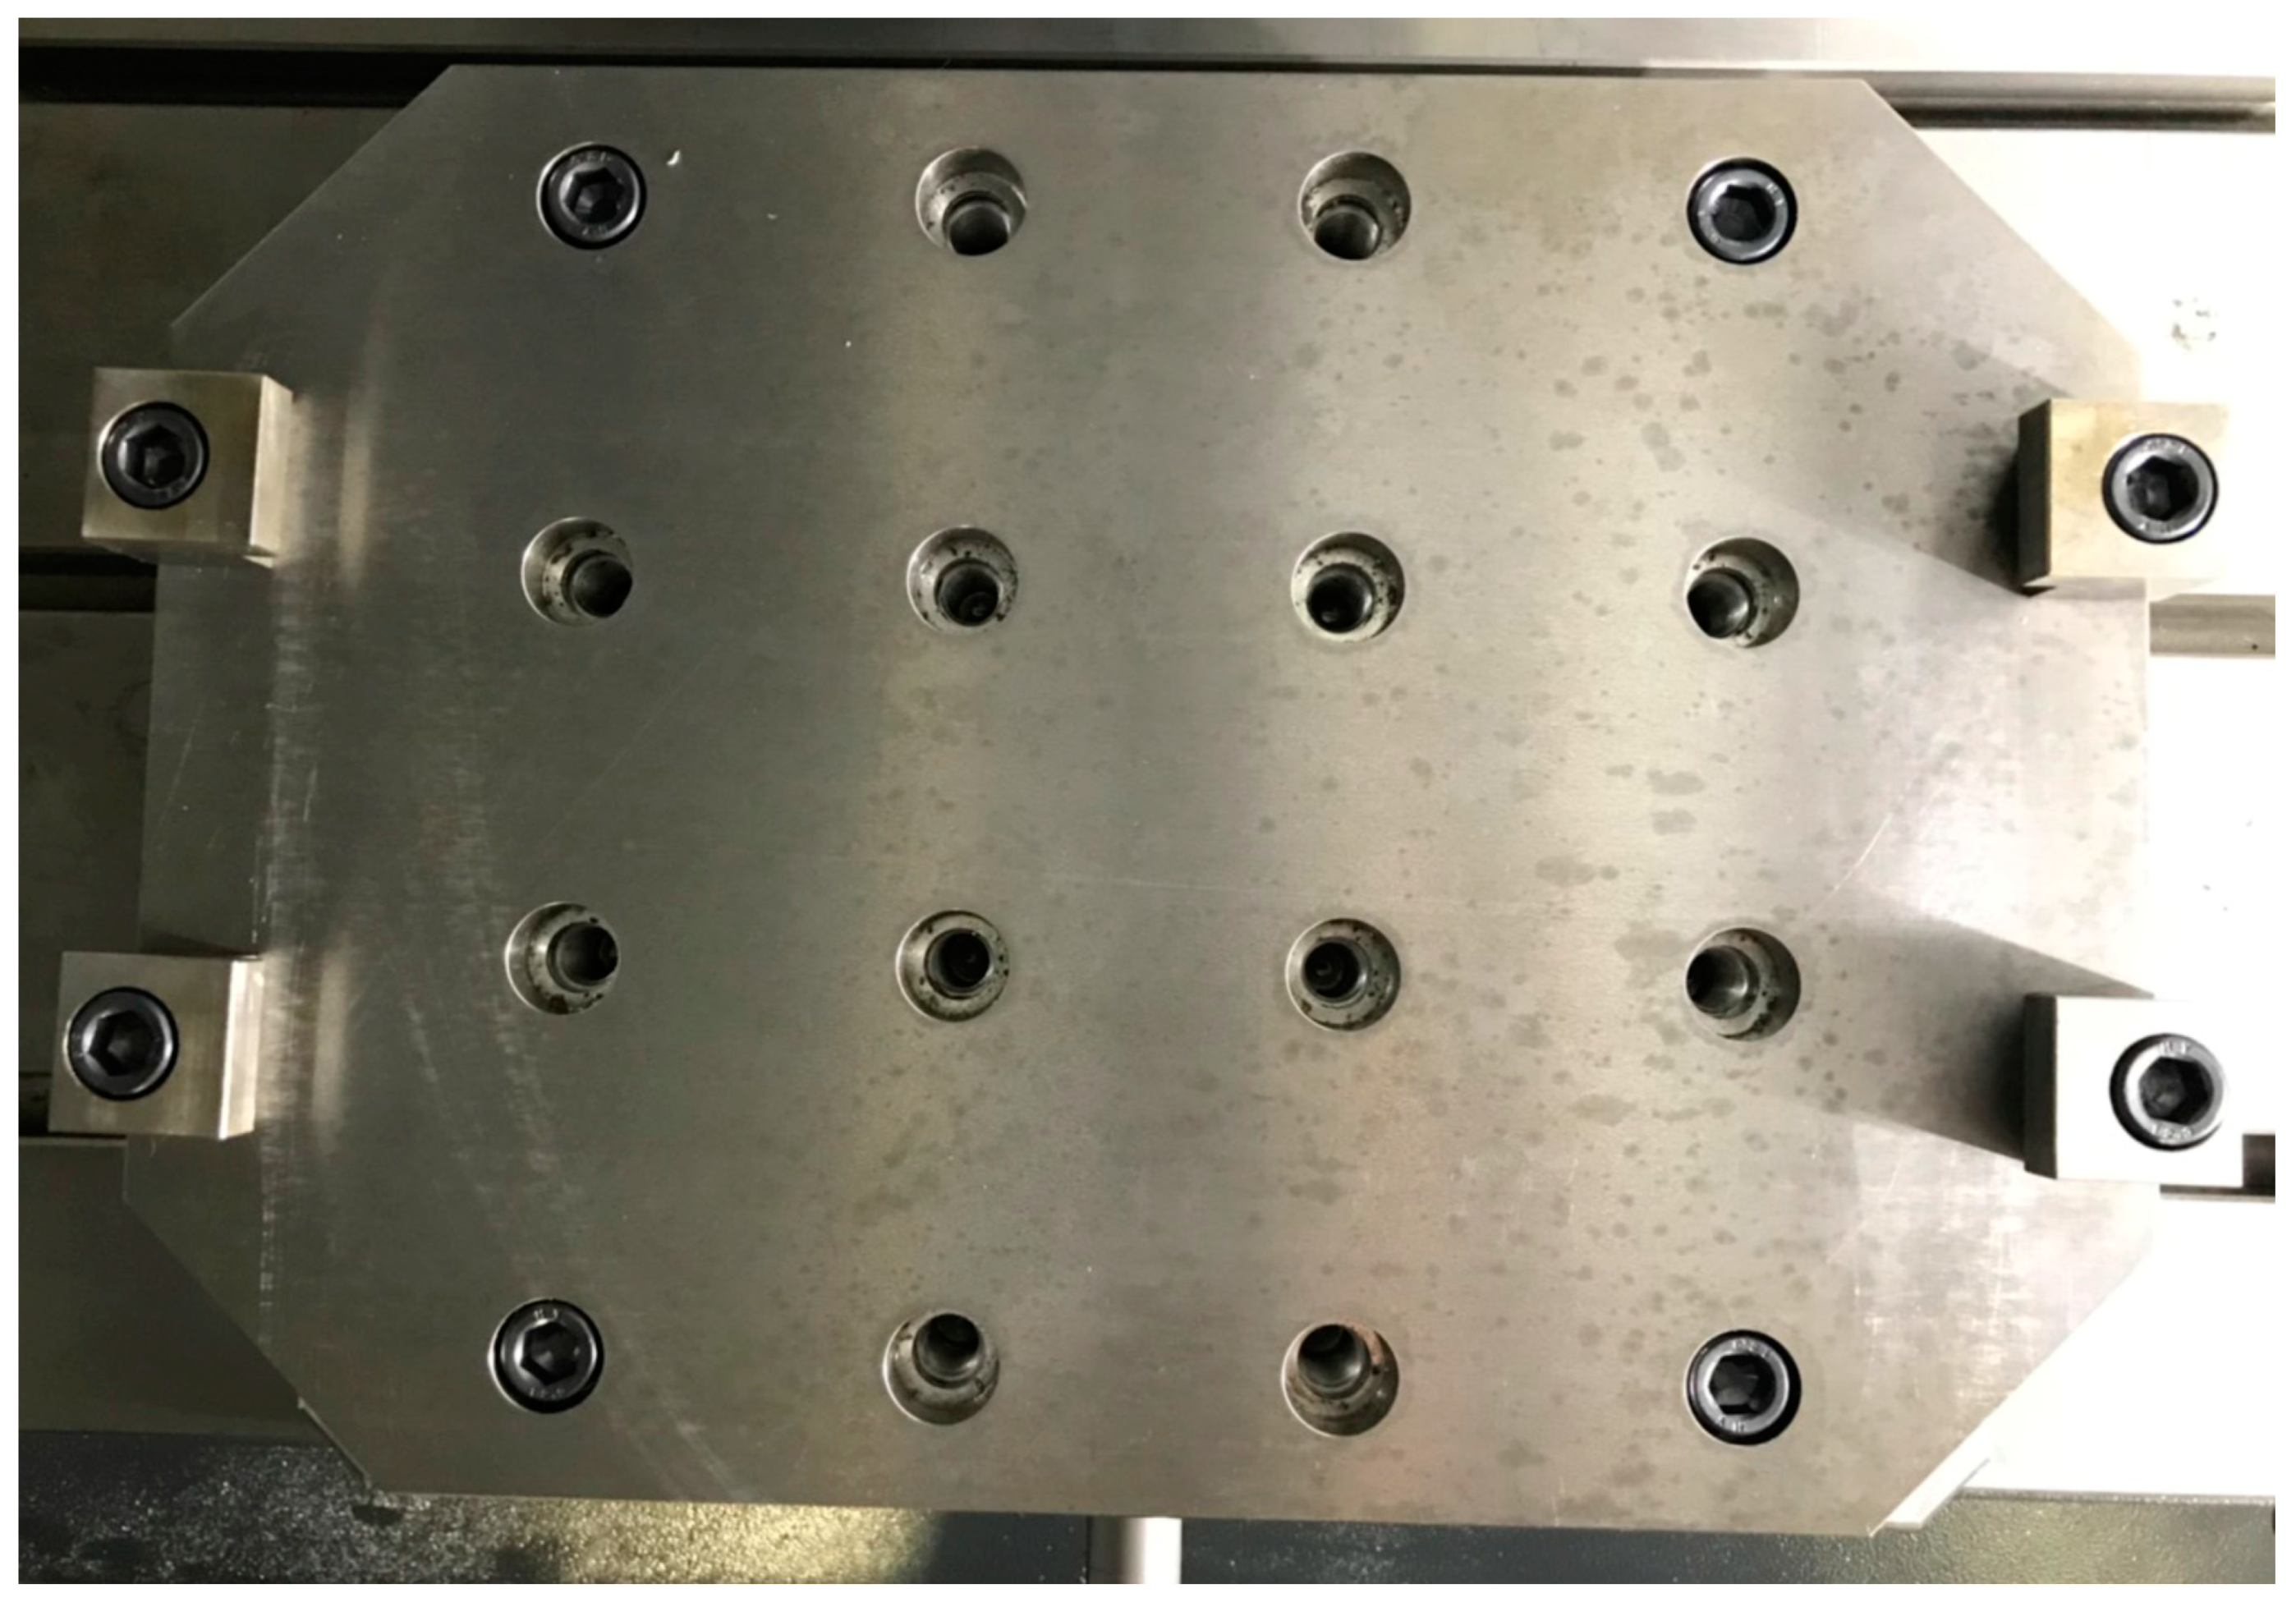
A Kistler 9255C (Kistler Holding AG, Winterthur, Switzerland) triaxial cutting force dynamometer and amplifier was used to measure the cutting force and to analyze the generated voltage. The values of cutting force in the X-axis, Y-axis, and Z-axis were obtained by signal conversion, and the data were captured using an NI 9162 single-module junction box and an NI 9162 data capture card (National Instruments, Austin, TX, USA). The force components were defined in the machine tool’s coordinate system as X—horizontal force (Fx), Y—vertical force (Fy), and Z—axial force (Fz). The built-in MAL DAQ module in Cutpro (Manufacturing Automation Laboratories, Vancouver, Canada) was used for the drawing. As it was necessary to attach the dynamometer to the VM-100, an adapter was devised to do this, as seen in Figure 2 and Figure 3.
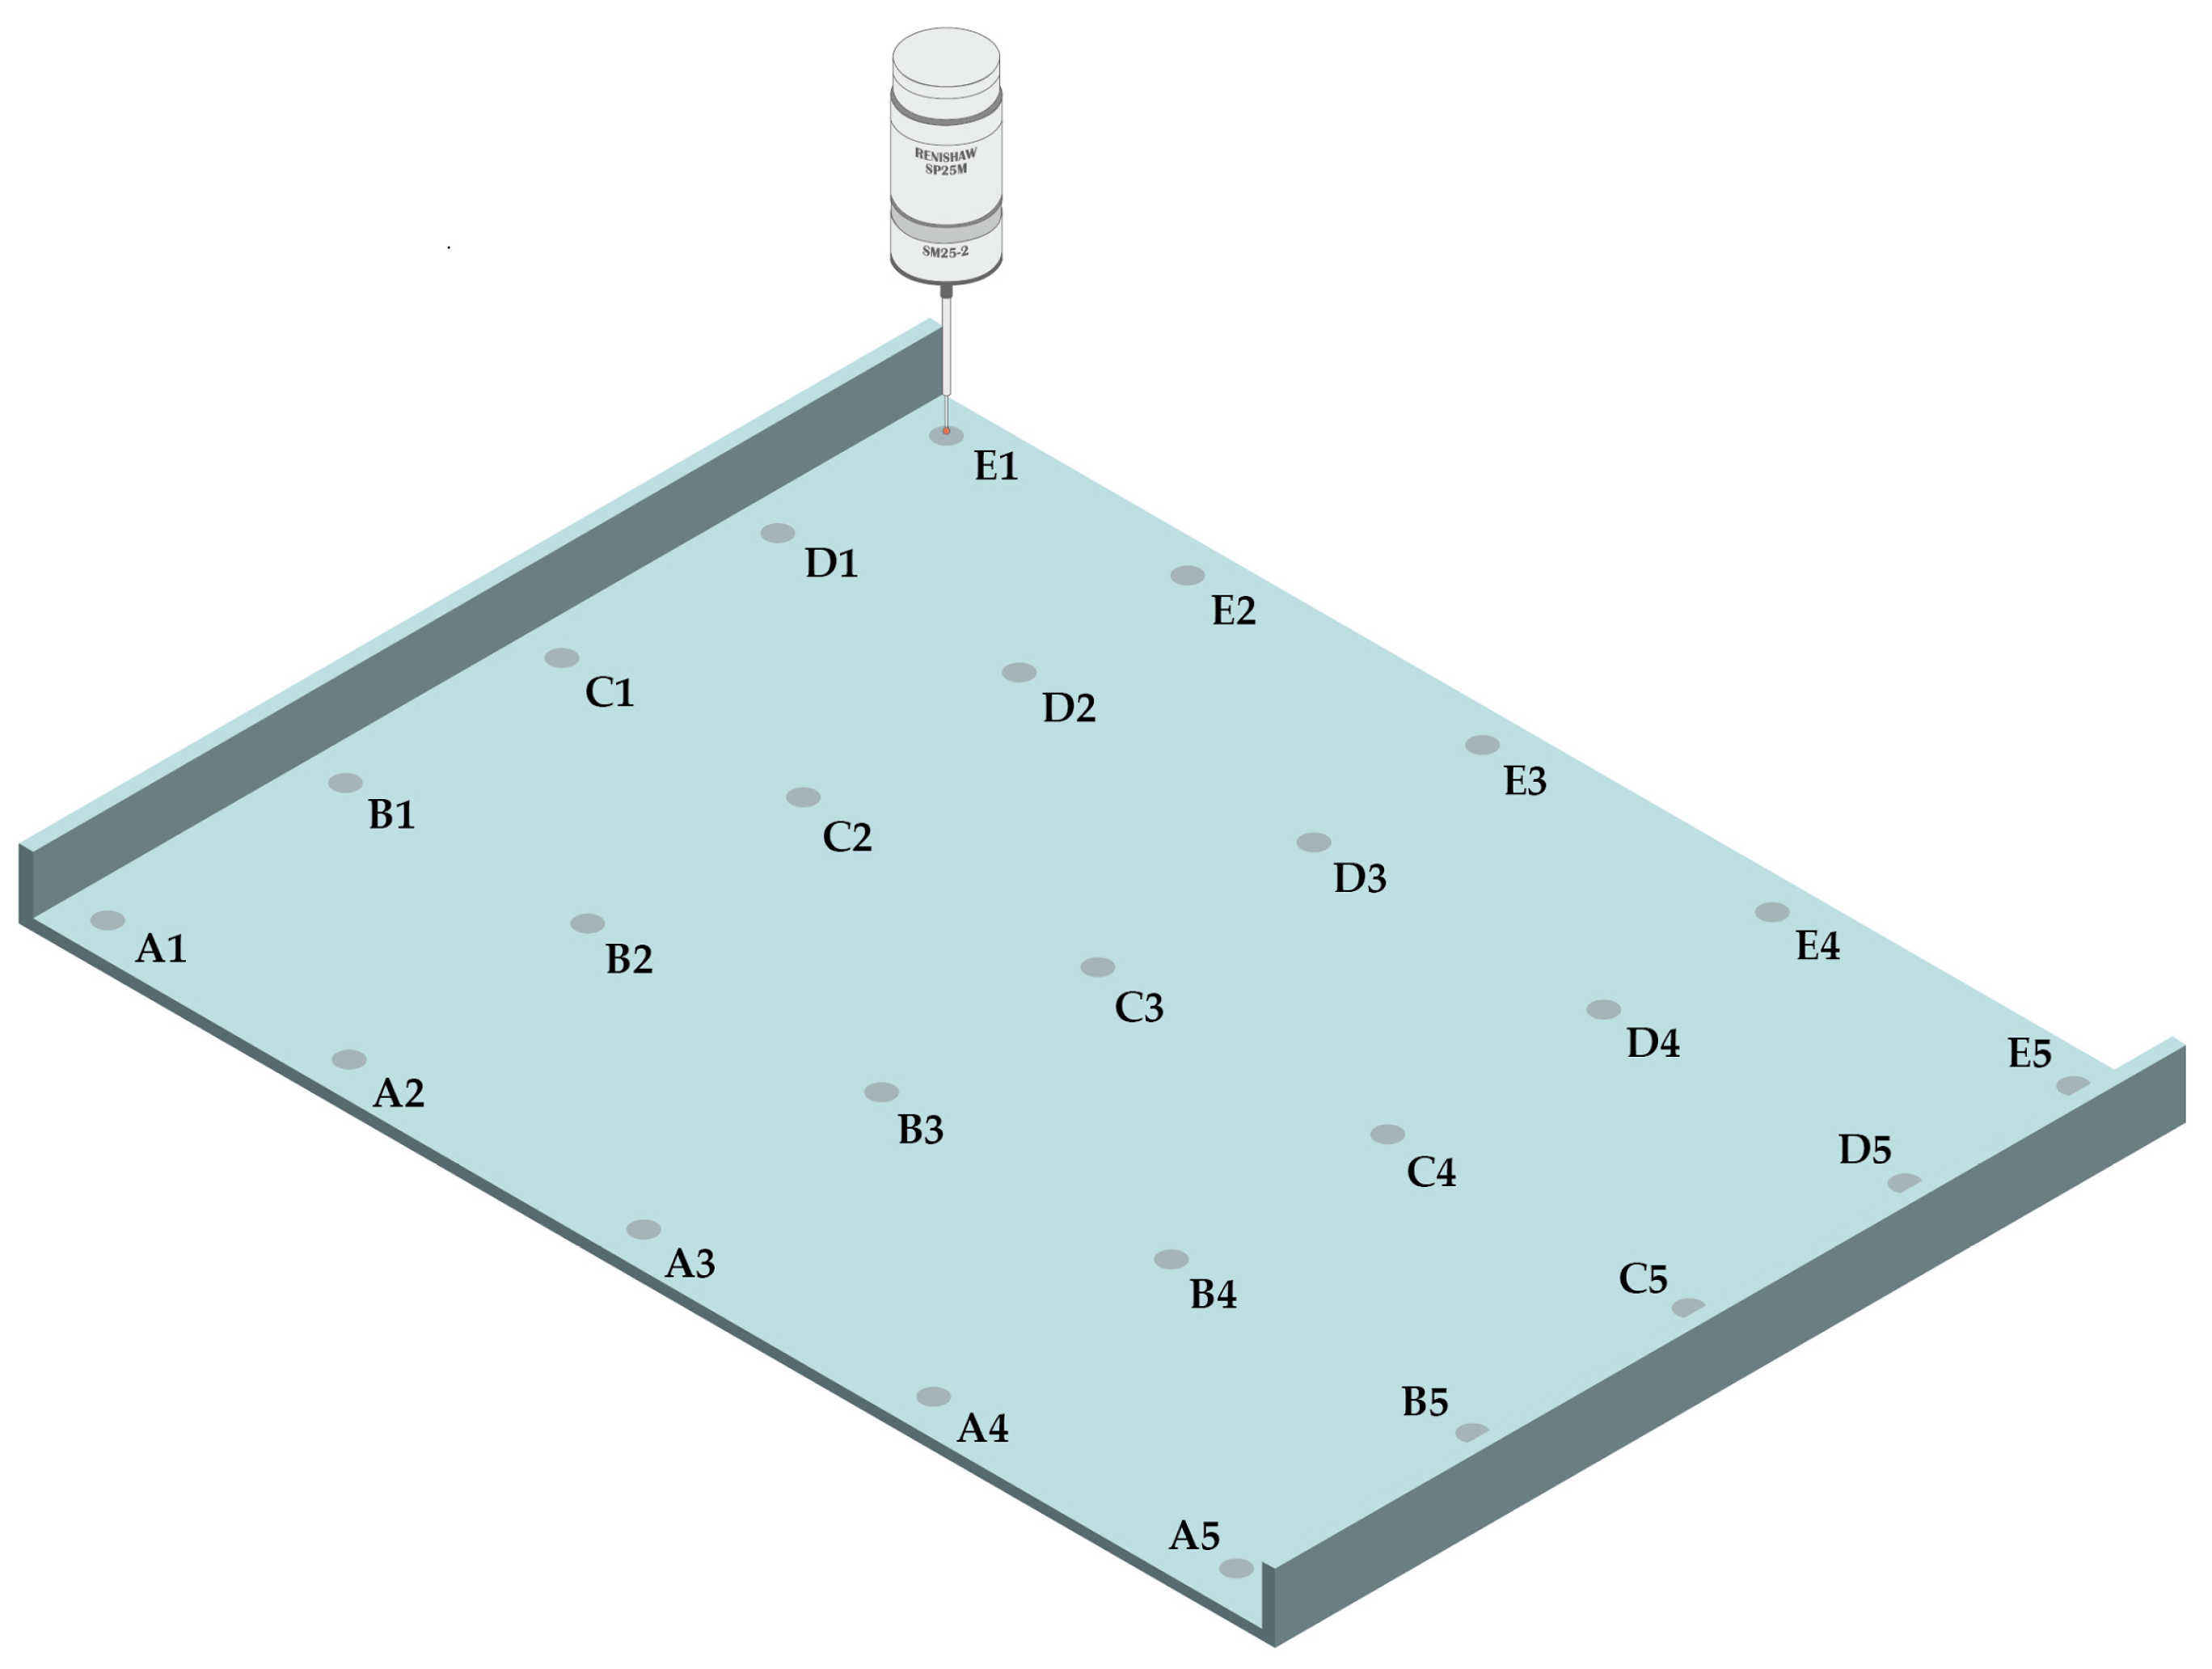
A Mitutoyo Crysta-Apex C122010 three-dimensional measuring instrument (Mitutoyo Corporation, Kanagawa, Japan) was used with a SP25M measuring probe, and a SM25-2 adapter lever was also used with a Renishaw ruby probe (Renishaw plc, England, UK). The measurements were made at 25 different points, as shown in Figure 4, and from A1–A5 to E1–E5. A tendency chart of deformation of the thin plate was created, and colors were used to indicate the degree of deformation. A Mitutoyo SJ400 Surftest roughness tester (Mitutoyo Corporation, Kanagawa, Japan) was used to measure the surface of the workpiece after machining. Before starting the measurement, the tester was calibrated using the reference specimen. In this study, 16 values of Ra were measured twice from workpiece and the parameter of measurement as the length of measurement was 4.8 mm, the speed of the measurement was 1.0 mm/s, and the total measurement points were 9600 points.
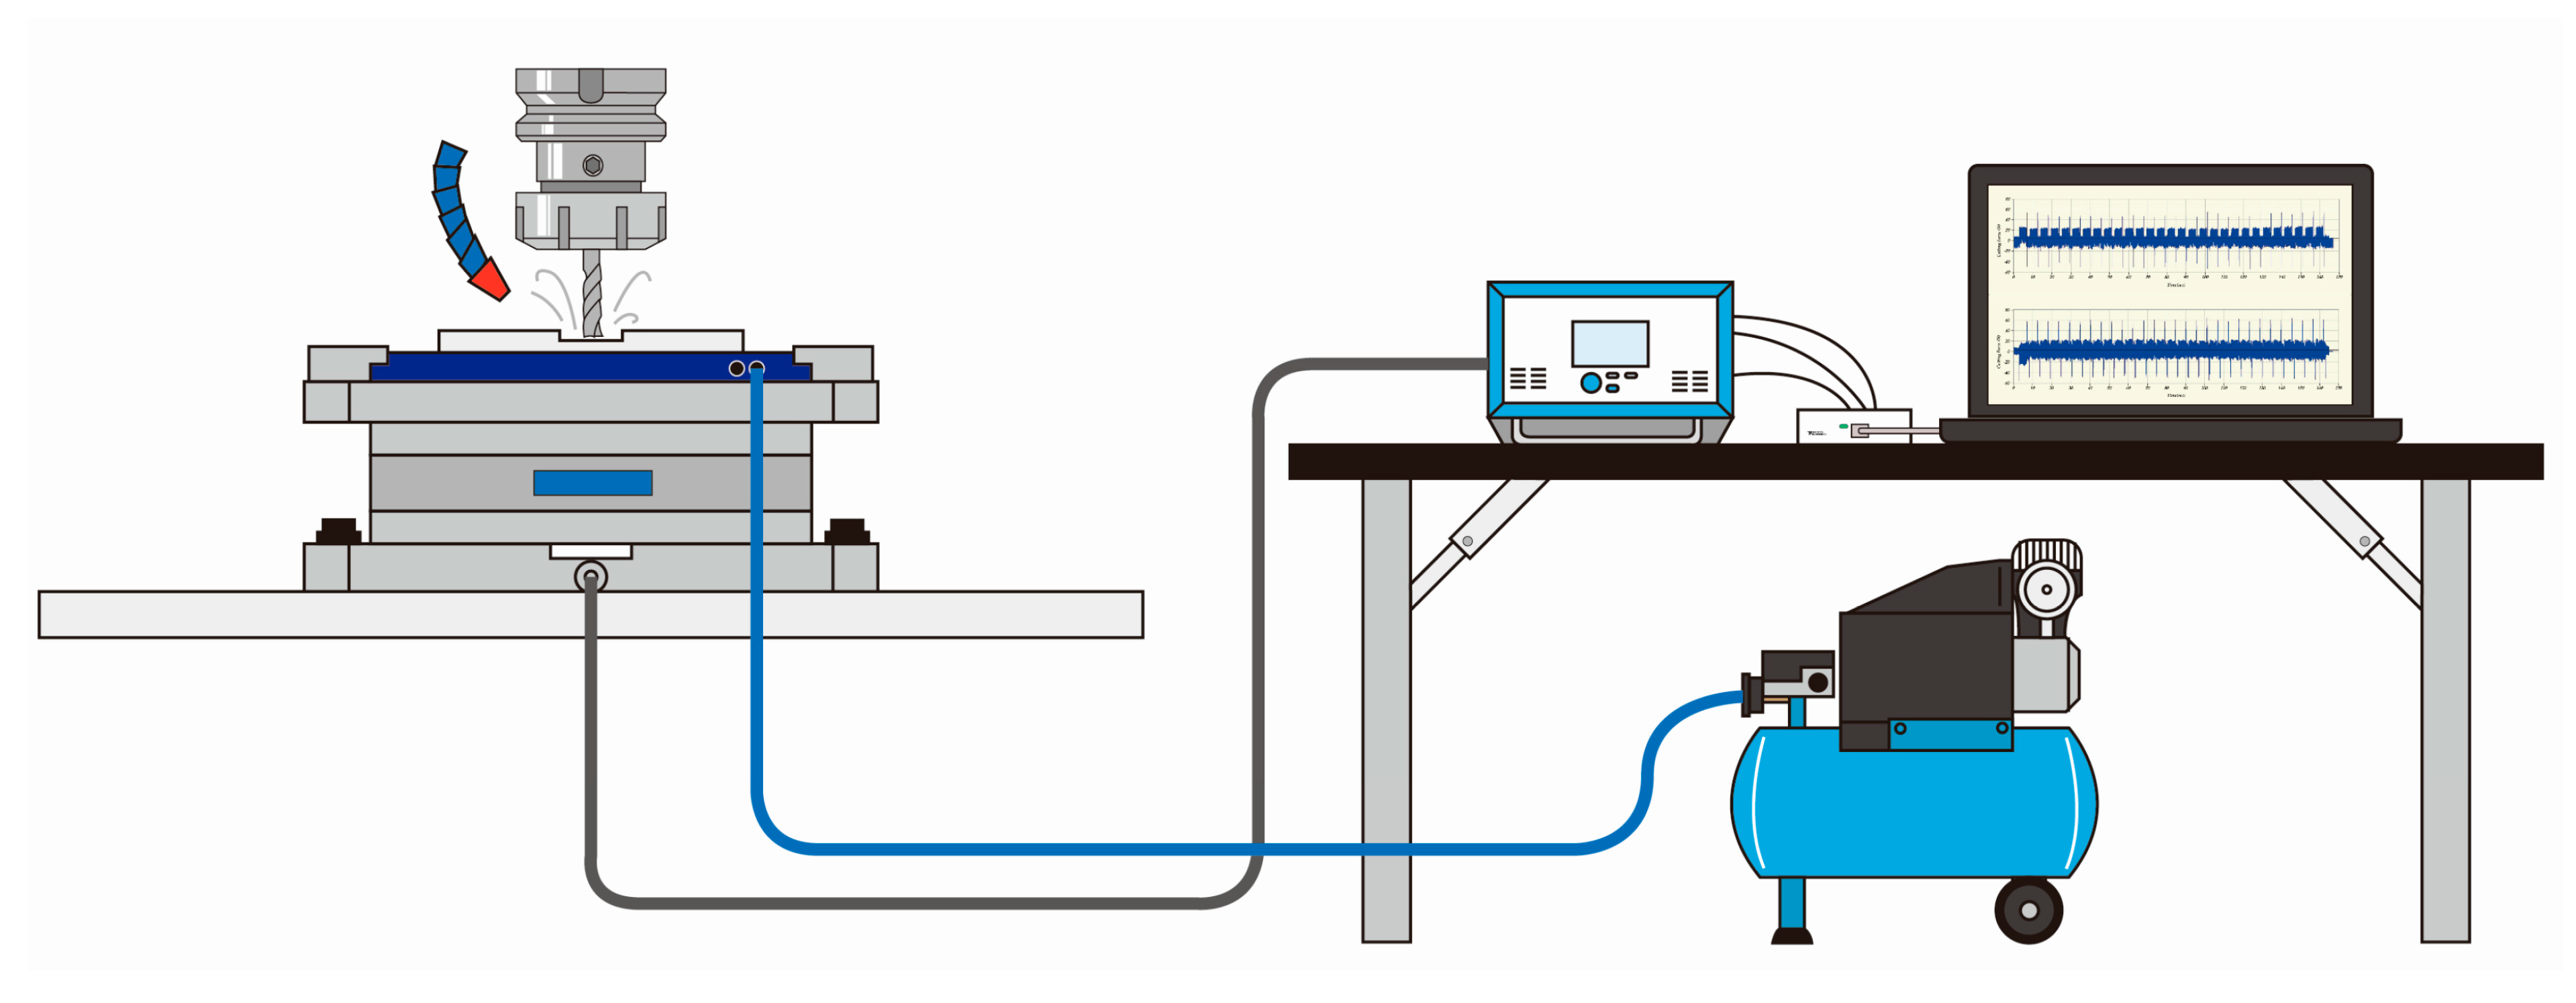
The overall setup of the experiment is shown in Figure 5. The 6061-T651 aluminum alloy workpiece was held by vacuum to the top surface of the VM-100. During the cutting experiments, the holding force was regulated by high-pressure air flow through a control valve. The output of the dynamometer, held by the adapter between the VM-100 and the machine bed, was sent to the computer. At the same time, the workpiece was cooled by high-pressure air for dry machining. The degree of workpiece deformation was measured as well as the surface roughness of the workpiece after processing.
2.3. Optimization of the Cutting Parameters
The adjustable milling process parameters included linear velocity, cutting amount per tooth, cutting width, cutting depth, and toolpath. The uncontrollable factors were the source of noise such as differences between individual milling cutters, ambient temperature, material properties, the vibrations of fixtures and tools, etc. The Taguchi method used in the experiment had five four-level factors, L16(45). The selected parameters for the factors were linear velocity V (m/min), feed per tooth Fz (mm/tooth), cutting depth Ap (mm), cutting width Ae (mm), and toolpath, as shown in Table 3. The linear velocity V was considered by maximum spindle speed of the machine, so the level 4 was 600 m/min (19,099 rpm). The value of Fz was considered by References [16,17]. The value of Ap was considered by maximum hold force of VM-100. If the value of Ap exceeds 1.2 mm, the workpiece displaces during machining. The value of Ae was considered in conventional way, so the level 2 was 50% of the tool diameter.
The smaller the better (STB) technique was used as a quality characteristic, simply put, the smaller the degree of workpiece deformation, the better. In addition to workpiece deformation, the impact of these five factors on workpiece surface roughness was also taken into consideration.
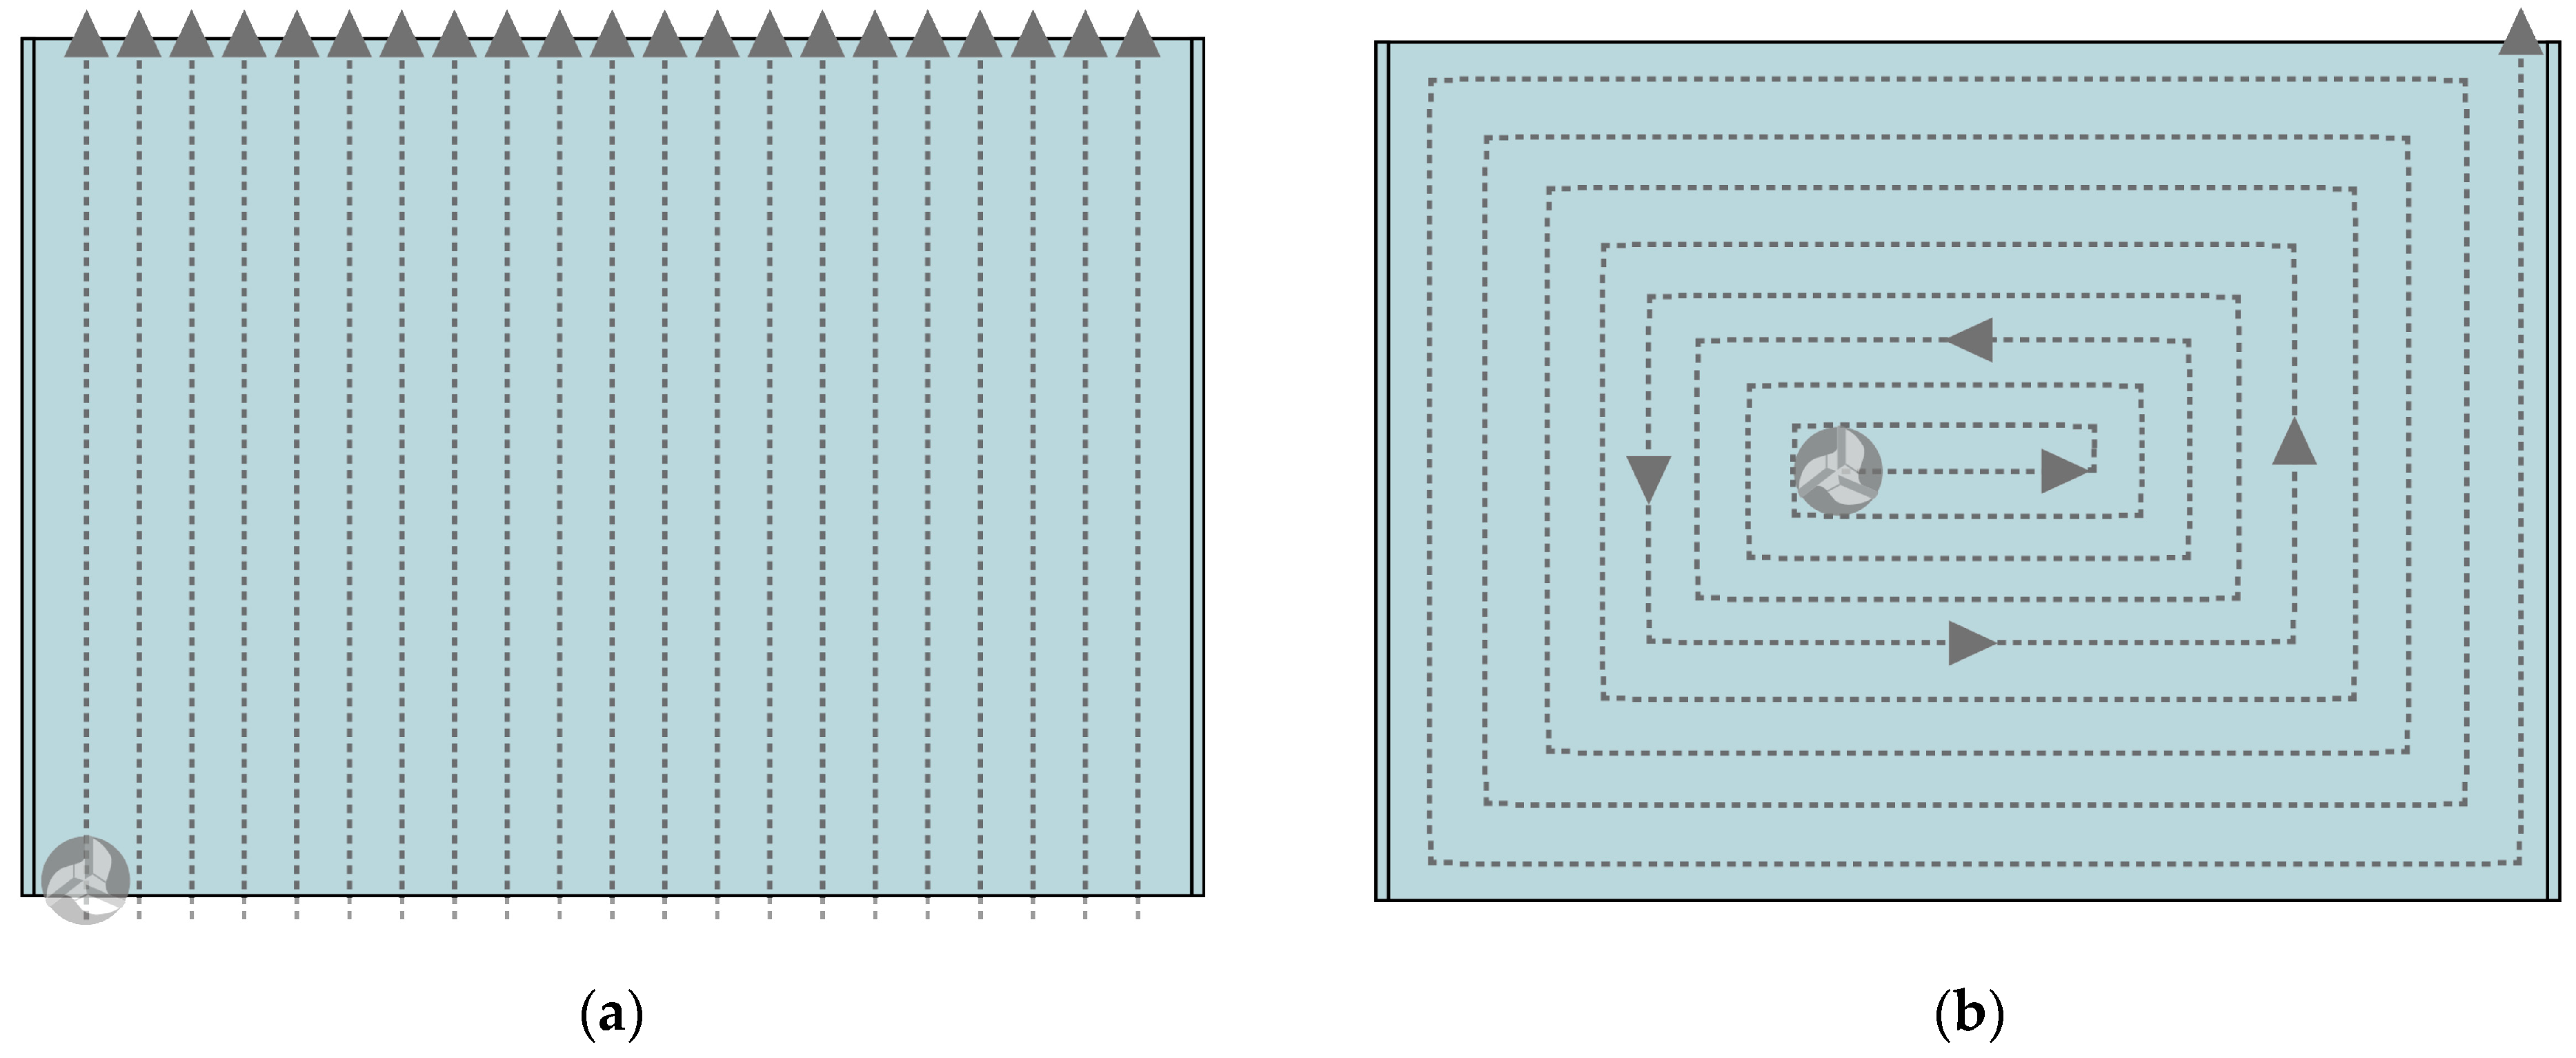
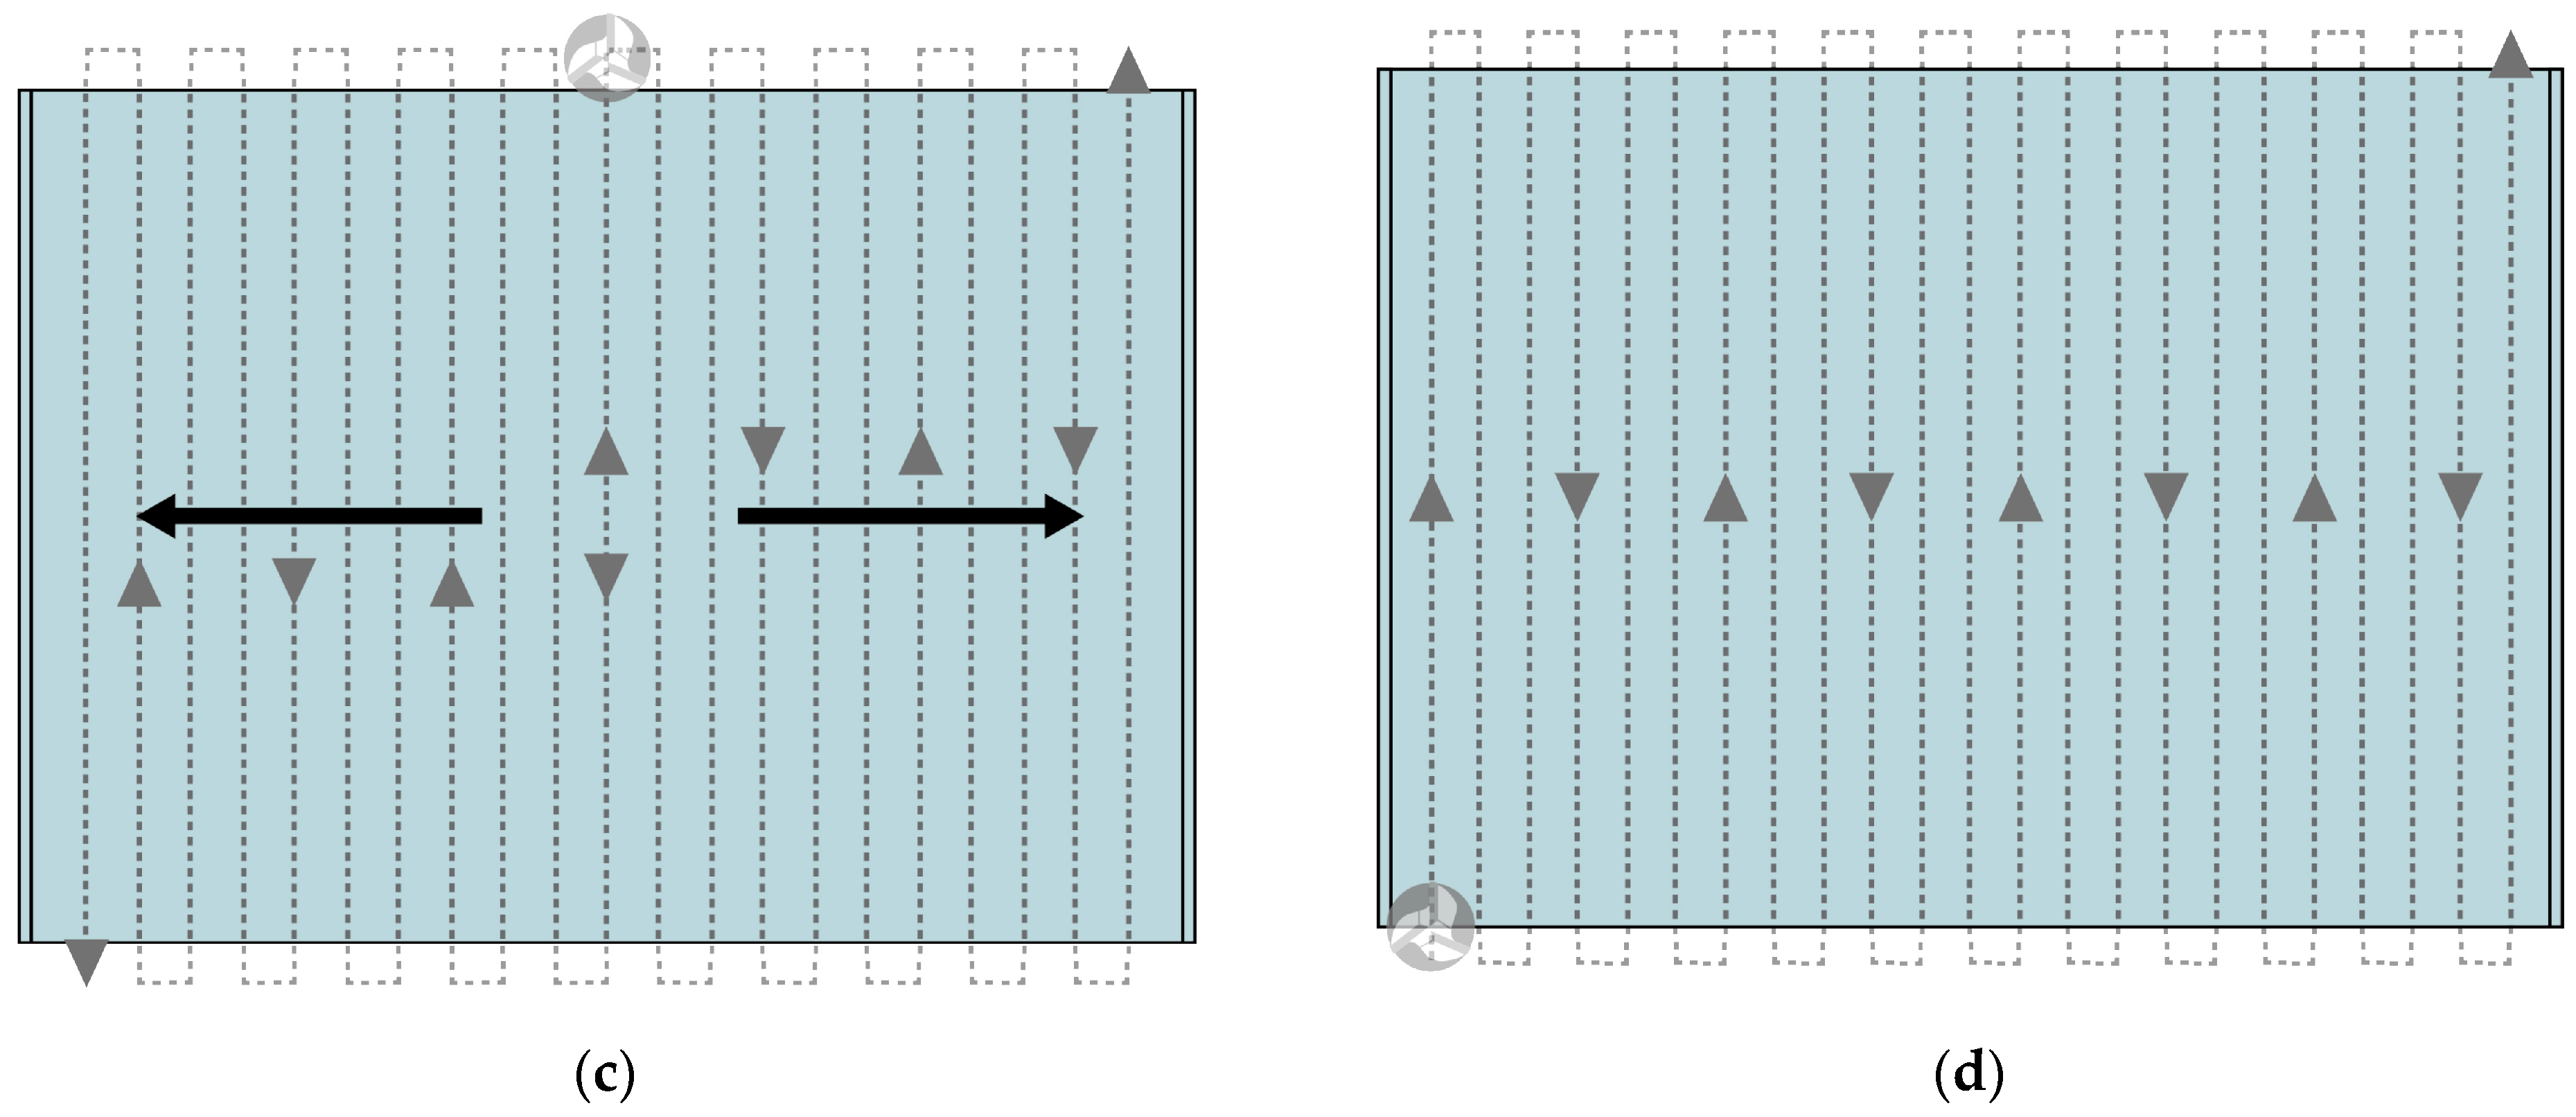
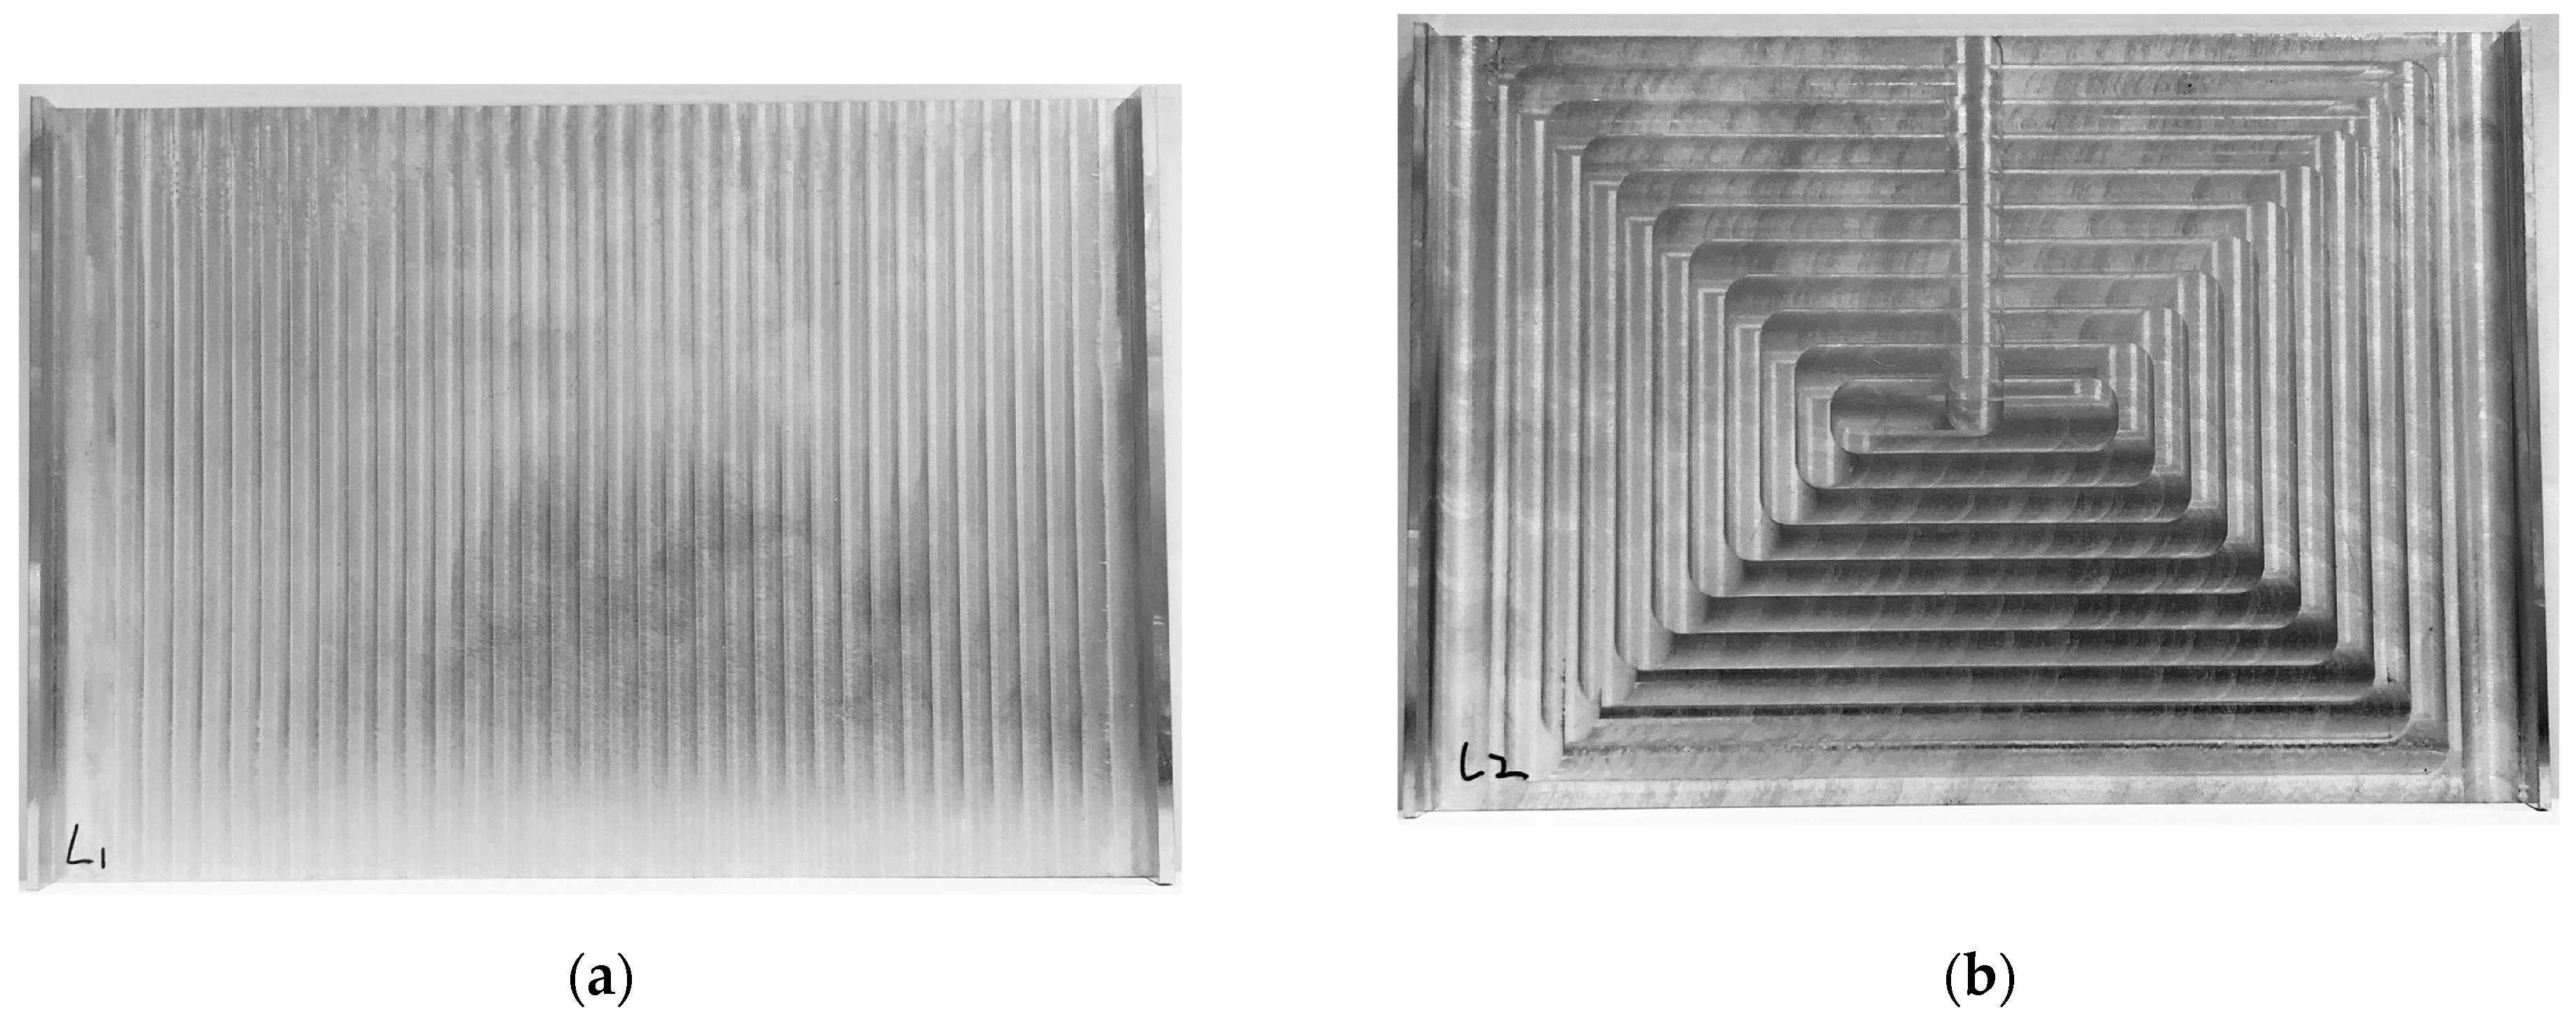
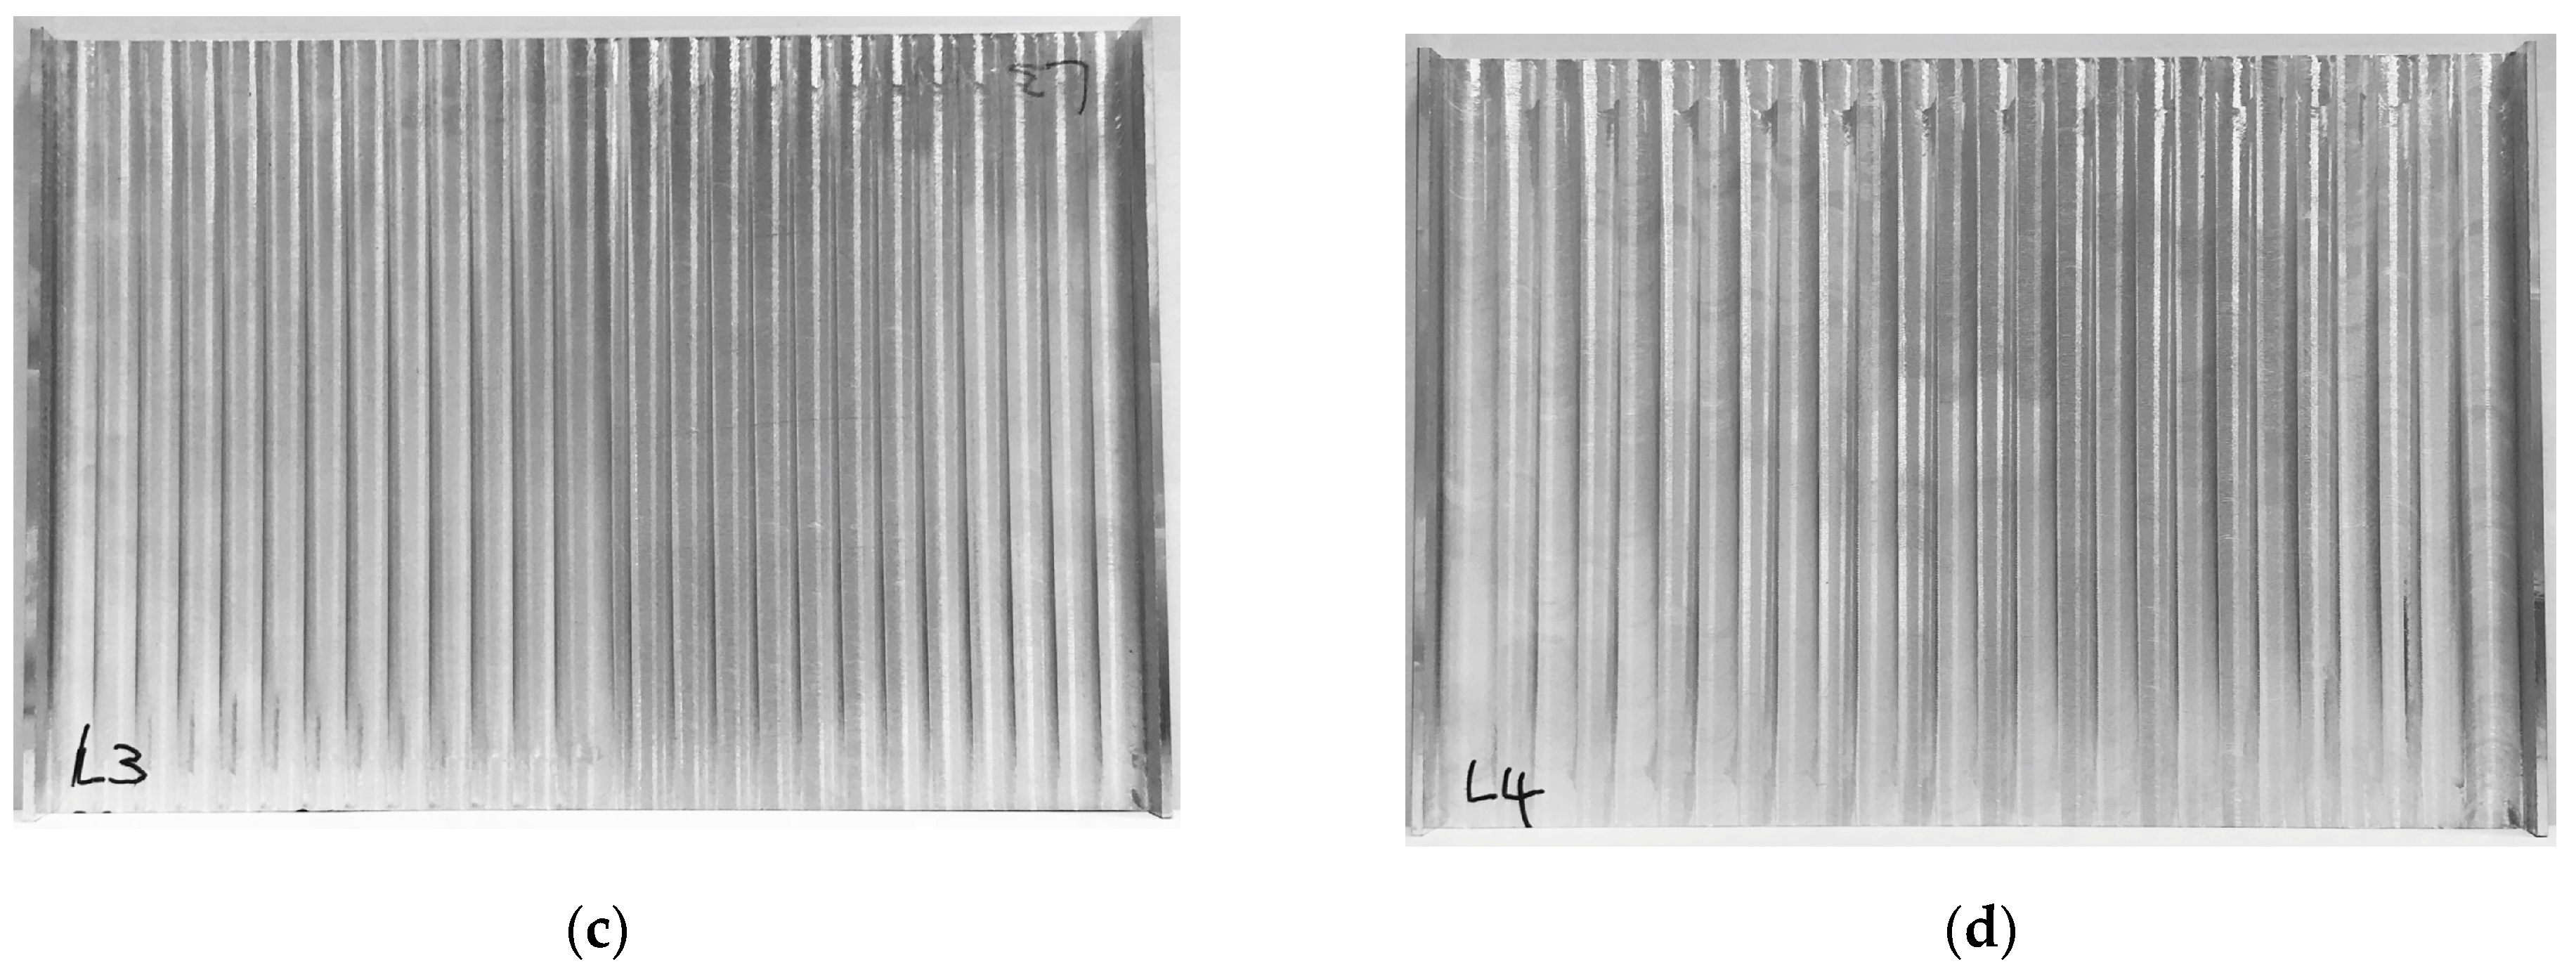
Siemens NX computer-aided design and computer-aided manufacturing (CAD/CAM) software was used, and the four selected toolpaths for Taguchi parameter configuration were used as shown in Figure 6. These were as follows: one-way contour milling from left to right (Figure 6a); Z-level follow cavity milling, which traces the shape of the part from the center to the outside (Figure 6b); Z-level follow core milling based on the shape of the workpiece that follows a path from the middle to the left and then from the middle to the right (Figure 6c); and a rough zigzag path, which runs back and forth from the left (Figure 6d).
3. Results and Discussion
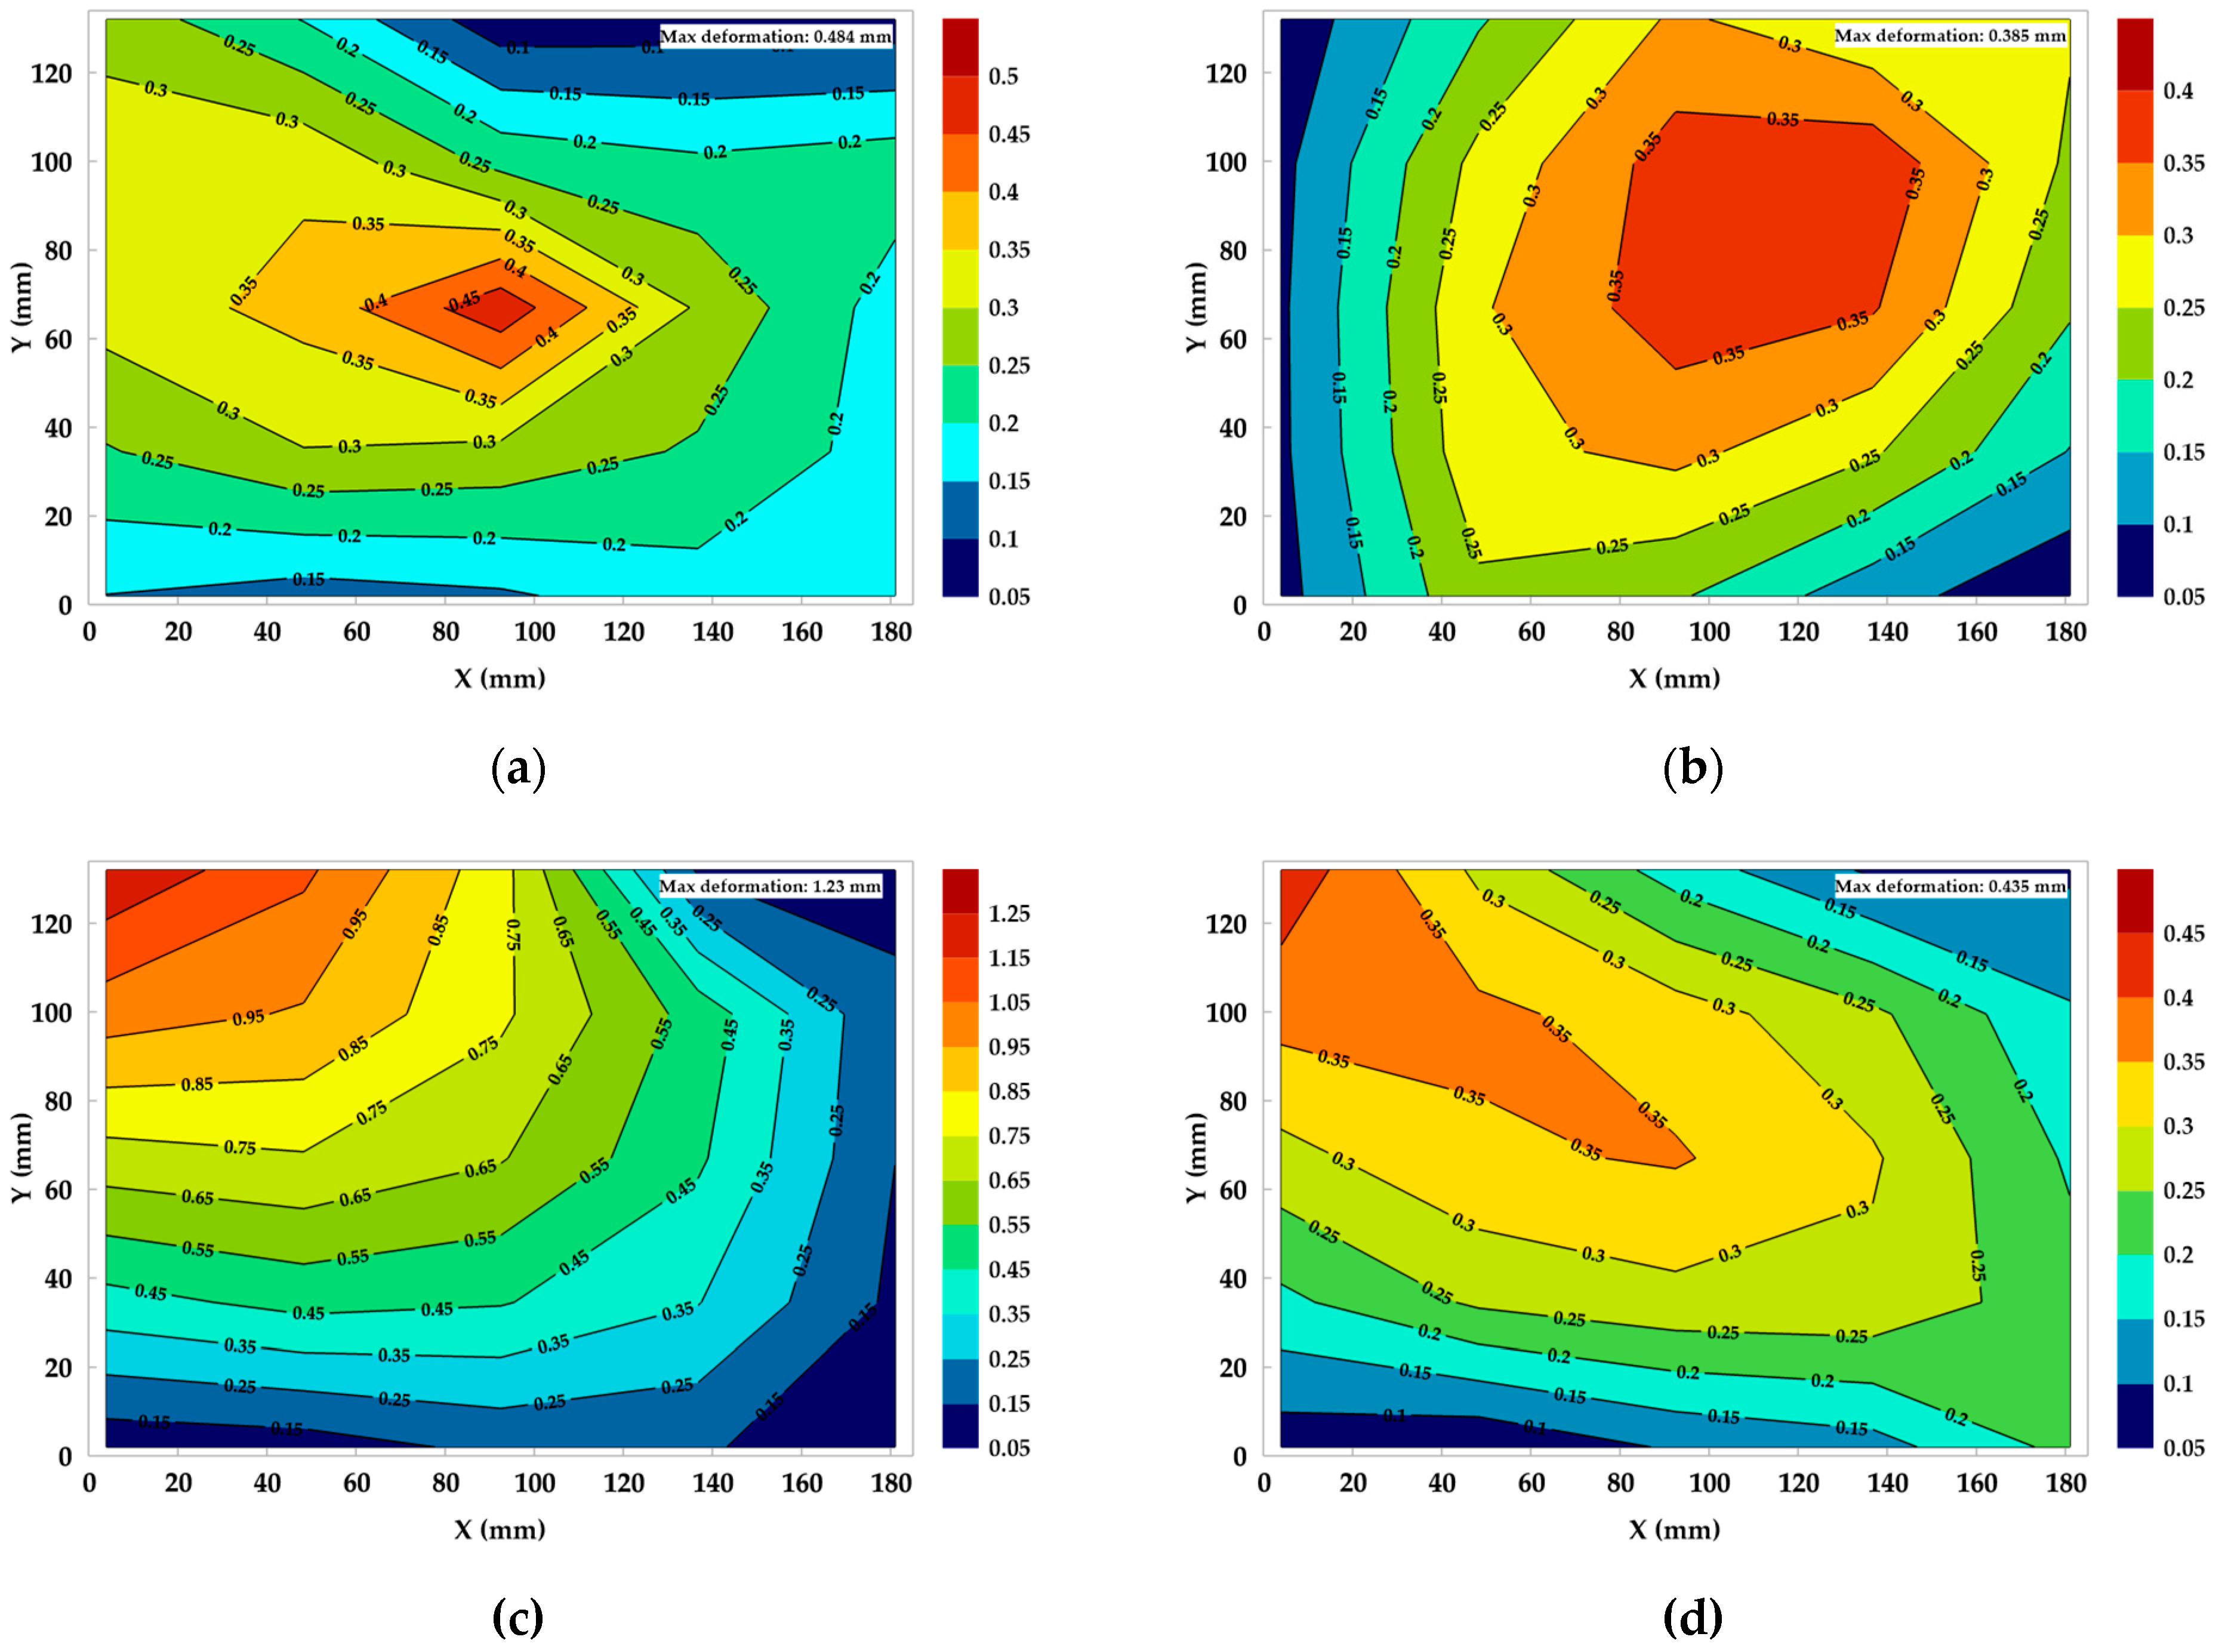
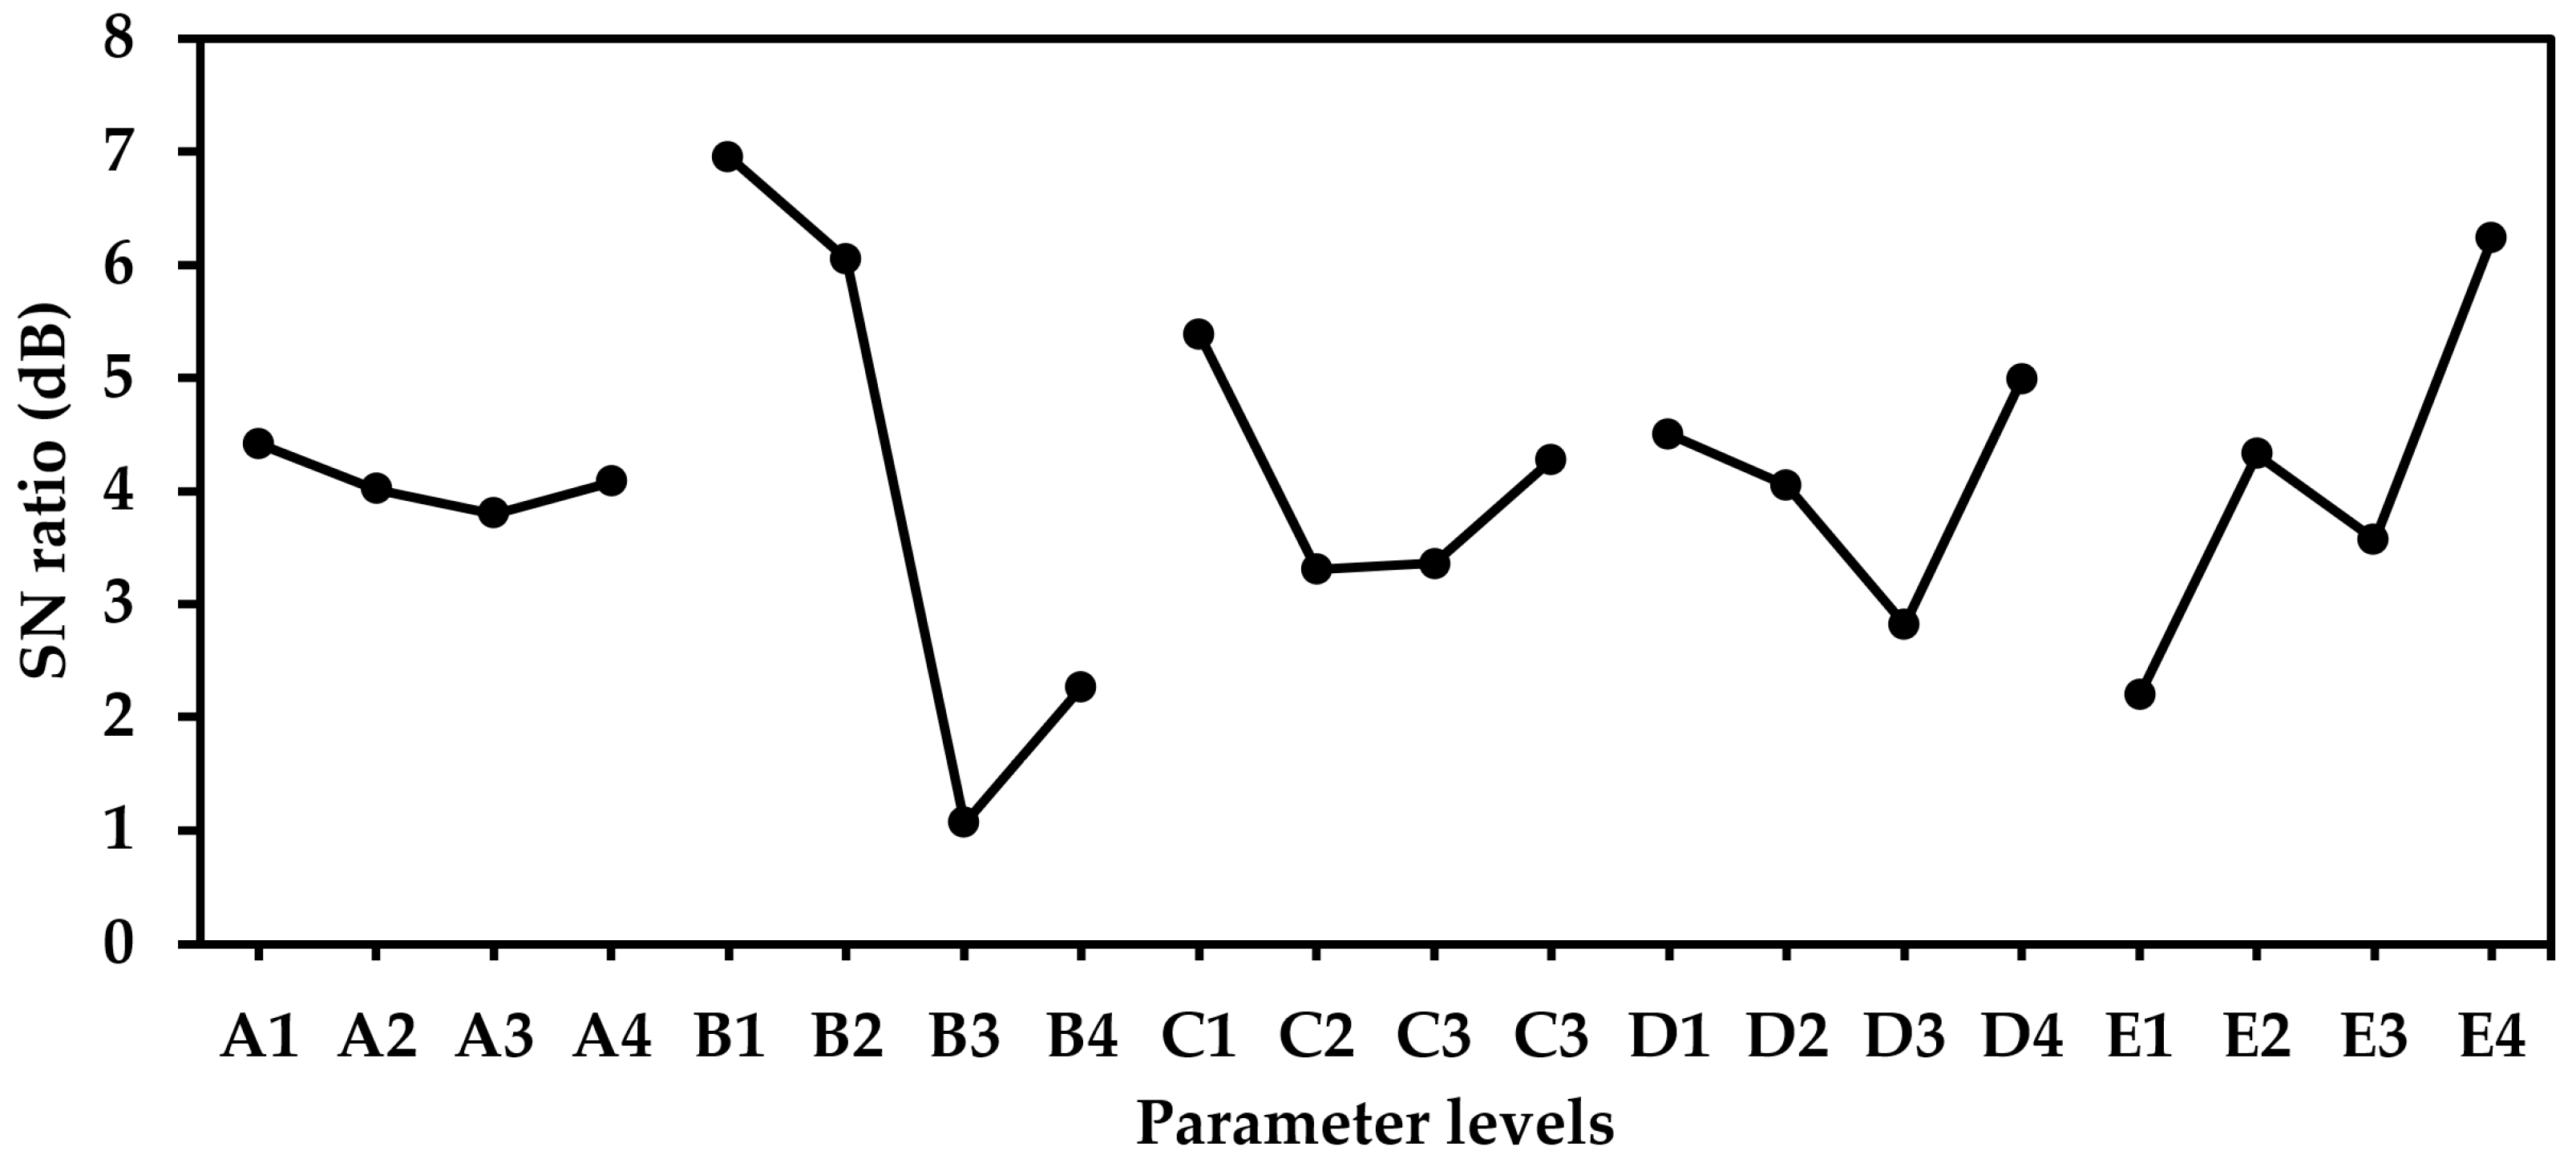
Height measurements were made at 25 different sites on each workpiece, after which machining and tendency charts that show the extent of deformation of the thin plates were created. The maximum amount of deformation of each group was used as the value for the orthogonal array. Figure 7 shows the deformation tendency chart for the first trial workpiece from the experimental parameters of groups 1 to 4. The distribution of deformation (N1) based on the experimental parameters A1B1C1D1E1 (Figure 7a) showed maximum deformation to be in the middle of the plate with a value of 0.484 mm. With experimental factor A1B2C2D2E2 (Figure 7b), the maximum deformation was also in the middle of the plate with a value of 0.385 mm. With experimental factors A1B3C3D3E3 and A1B4C4D4E4 (Figure 7c,d), the maximum deformation was on the upper left of the plates with values of 0.385 mm and 0.435 mm, respectively. The main factor of the deformation was residual stress, and Figure 8 shows that as the Fz, Ap, and Ae increase, the deformation the thin plate did not change much. Besides, as the toolpath changed, the position of the maximum deformation was also in a different place, such as the one-way contour and Z-level follow cavity, which were in the middle of the thin plate. Likewise, the Z-level follow core and the rough zigzag were in the upper left of the thin plate. Different toolpath strategies affect the residual stress and then change the position of maximum deformation of the thin plate [8]. The 16 sets of maximum deformation measurements were compiled as data for the Taguchi analysis.
The surface roughness of the first trial workpiece with the experimental parameters A1B1C1D1E1 was Ra = 0.2 μm (see Figure 8a). The toolpath can be clearly seen. For experimental factor A1B2C2D2E2 (Figure 8b), it was Ra = 0.906 μm; for A1B3C3D3E3 (Figure 8c), it was Ra = 1.869 μm; for A1B4C4D4E4 (Figure 8d), it was Ra = 1.518 μm. Although the spindle speed was the positive effect of the surface roughness, the lower depth of cut and feed per tooth also resulted in better surface roughness. From Figure 8a–d, it can be seen that, as the Fz and the Ap decreased, the Ra increased [23]. The 16 sets of roughness measurements were compiled as data for the Taguchi analysis.
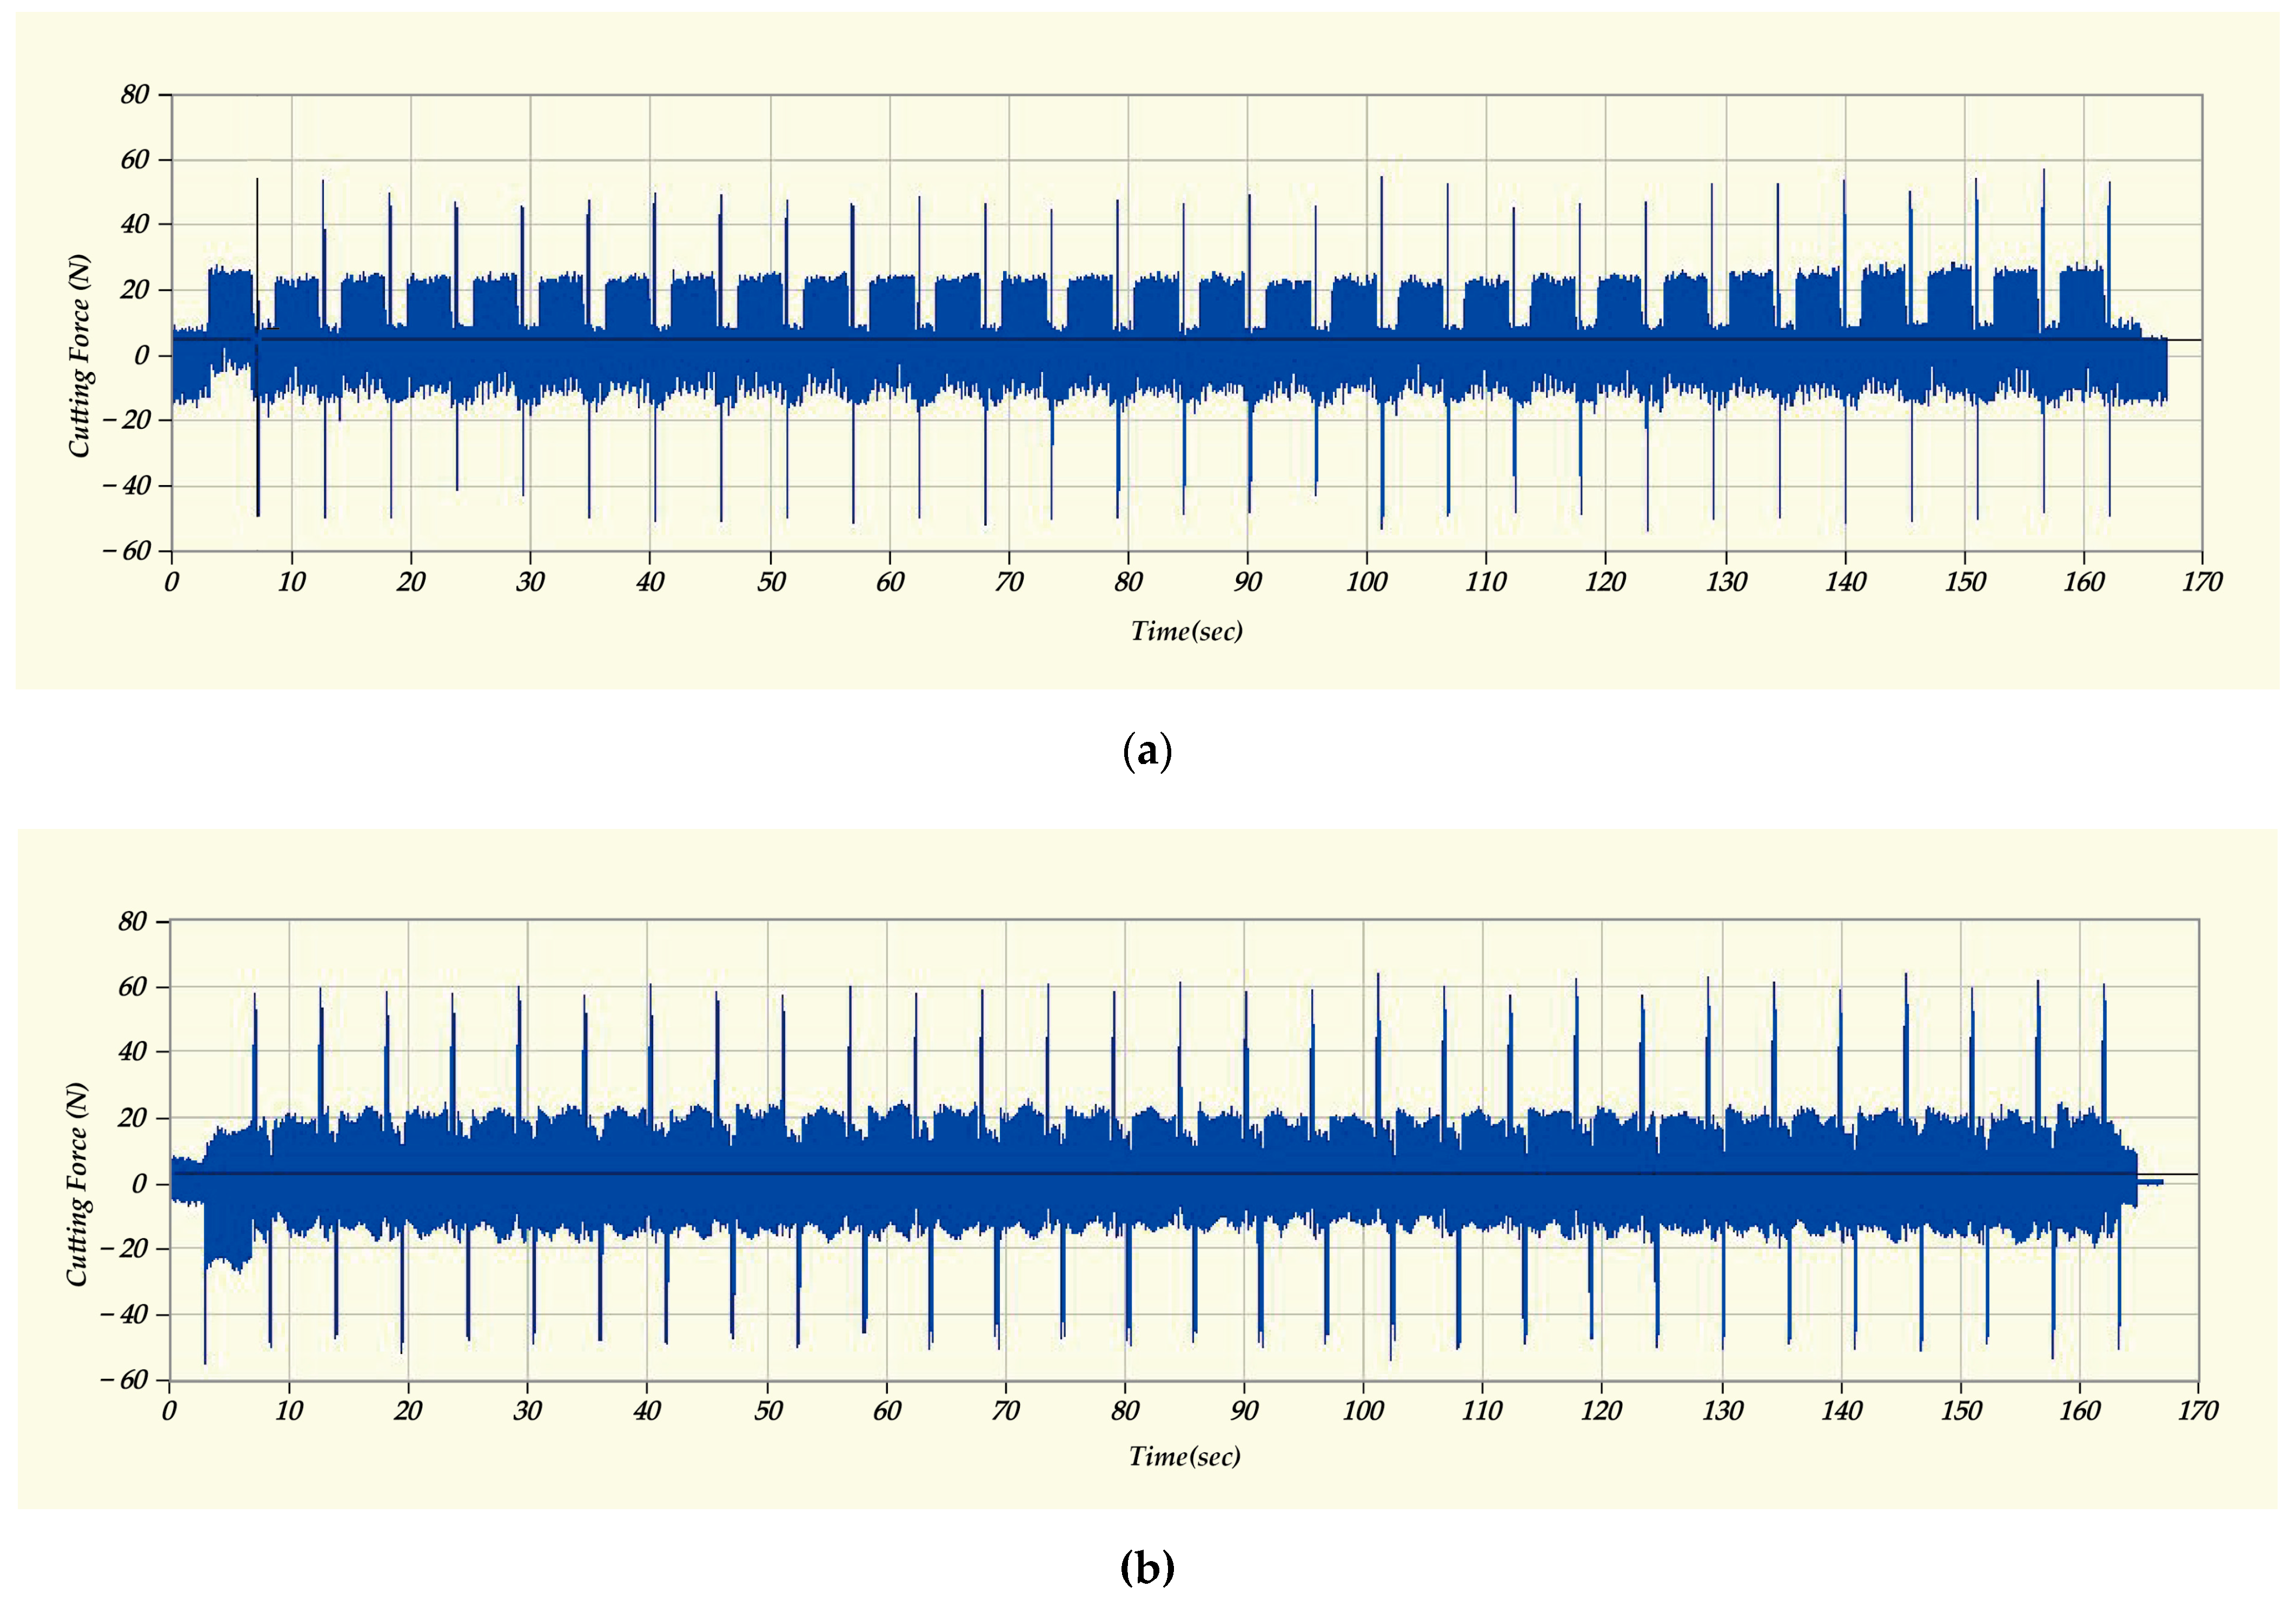
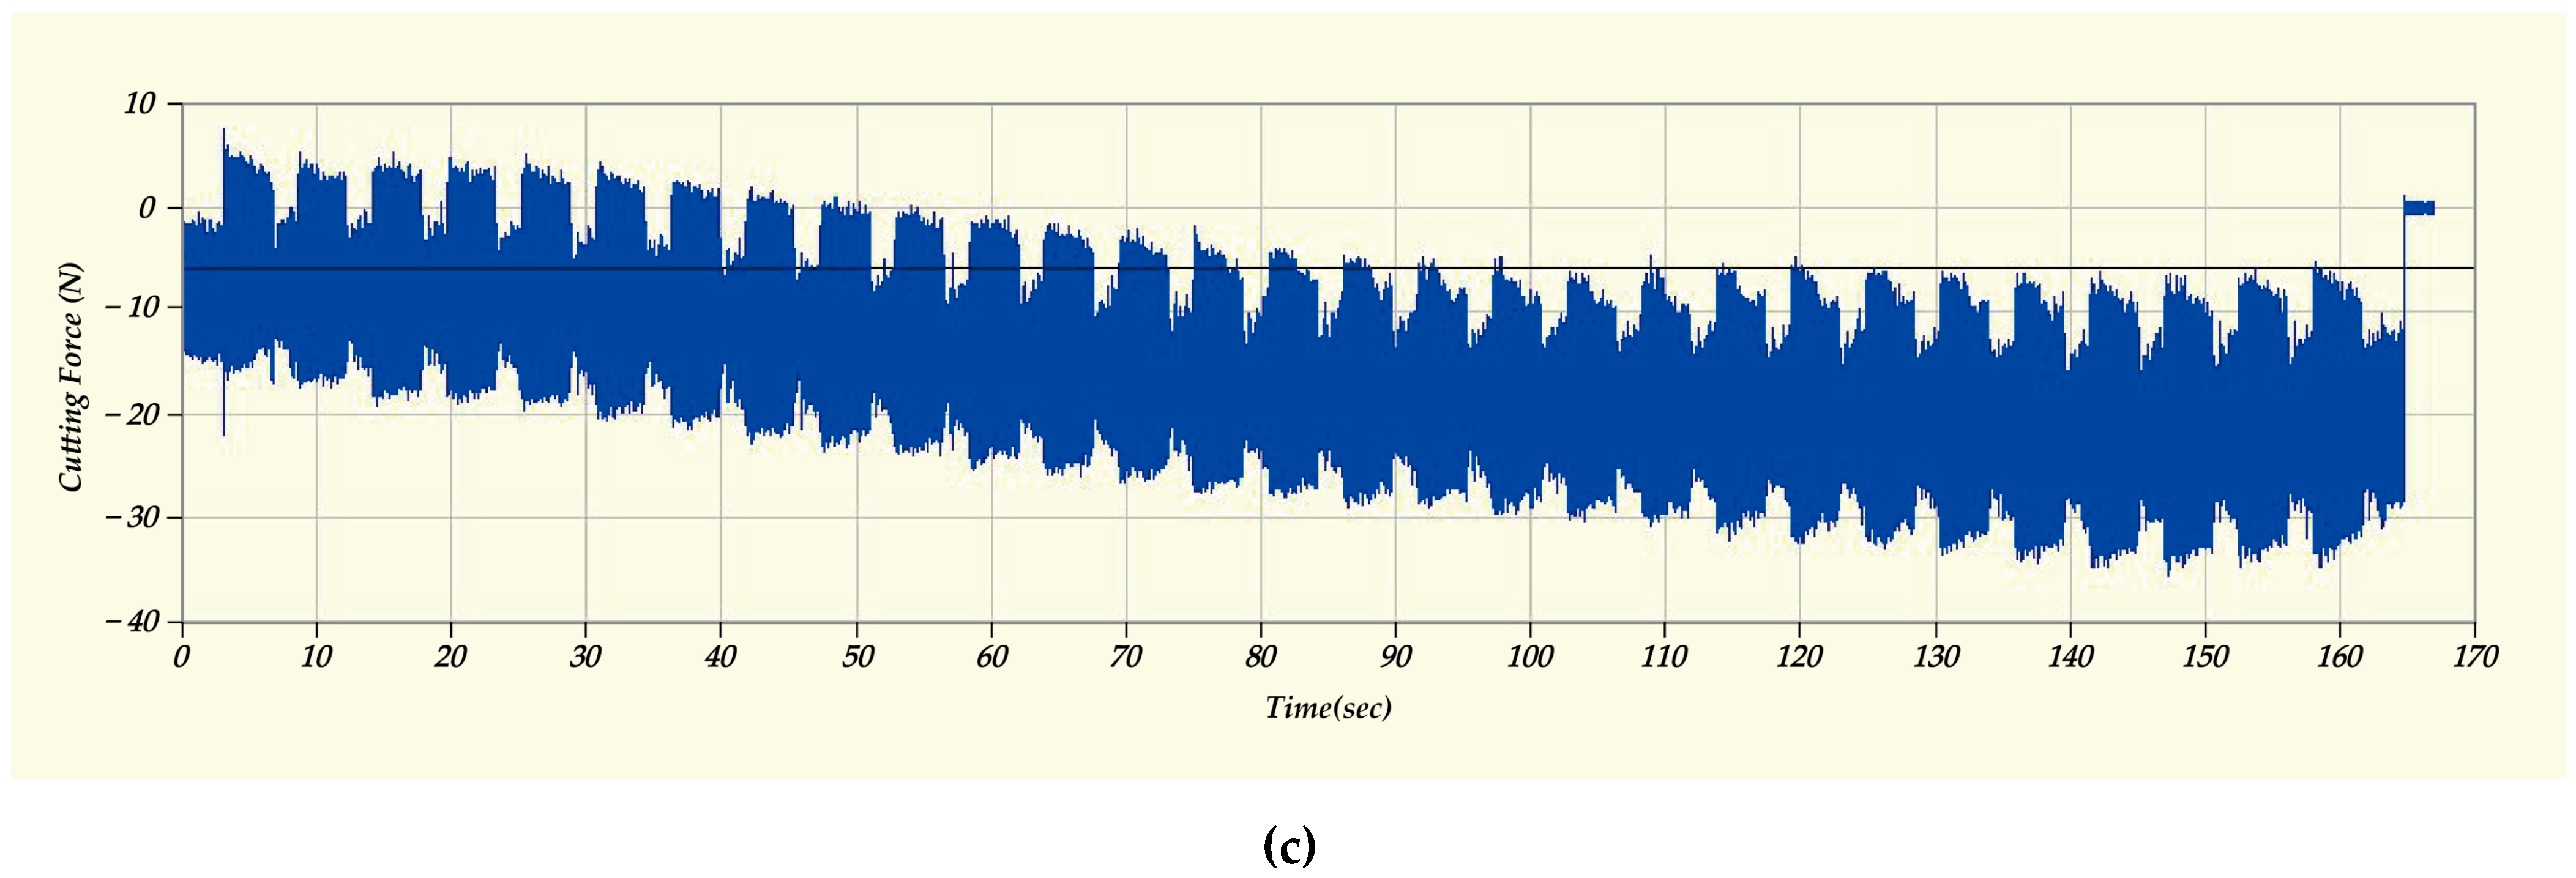
Measurement of cutting forces Fx, Fy, and Fz were made (see Figure 9) with experimental factor A1B1C1D1E1 (N1) and the forces, in the three dimensions, were added to a force value, as shown in Equation (1) [30]. Figure 9c shows that, as the thickness of the workpiece was removed, the Fz decreased. In this study, we used the vacuum chuck to clamp the workpiece; thus, as the thickness of the workpiece becomes thin, the stiffness the workpiece also decreases.
The measured amount of deformation, surface roughness, and cutting force from the 16 sets of experiments are shown in Table 4.
3.1. Orthogonal Array Experiment and ANOVA
The maximum value of deformation from the 16 groups is used for the data of orthogonal array and the Taguchi analysis was used to make this value “the smaller the better”. The deformation data from the 16 groups are shown in Table 4. The SNR with the smaller the better formula in the Taguchi analysis is shown in Equation (2).
A high S/N ratio indicates a smaller loss of quality and higher stability, which is an optimal combination of influence factors. Table 5 and Figure 10 show the deformation factor response chart from which the optimal factor A1B1C1D4E4 can be obtained. In the analysis of variance, the F value allows for the determination of the importance priority, order of the error variance factor. The percent contribution can be used to find the error index level from the factor. Based on the analysis shown in Table 6, the F value of factor A was 255.75, that of factor B was 26,733.68, that of factor C was 2953.97, that of factor D was 2818.09, and that of factor E was 9278.3, all of which are greater than F0.95;1,16 = 4.49. The significance of the five factors in the experiments was clear: the linear velocity, feed per tooth, cutting depth, cutting width, and toolpath were all involved in the occurrence and the degree of deformation. The level of contribution from these five factors were 0.6% for factor A, 63.5% for factor B, 7% for factor C, 6.7% for factor D, and 22% for factor E, respectively. The quality contribution of feed per tooth against deformation was the highest, followed by toolpath; the significance level of cutting depth and width were almost the same, and linear velocity had the lowest level of influence.
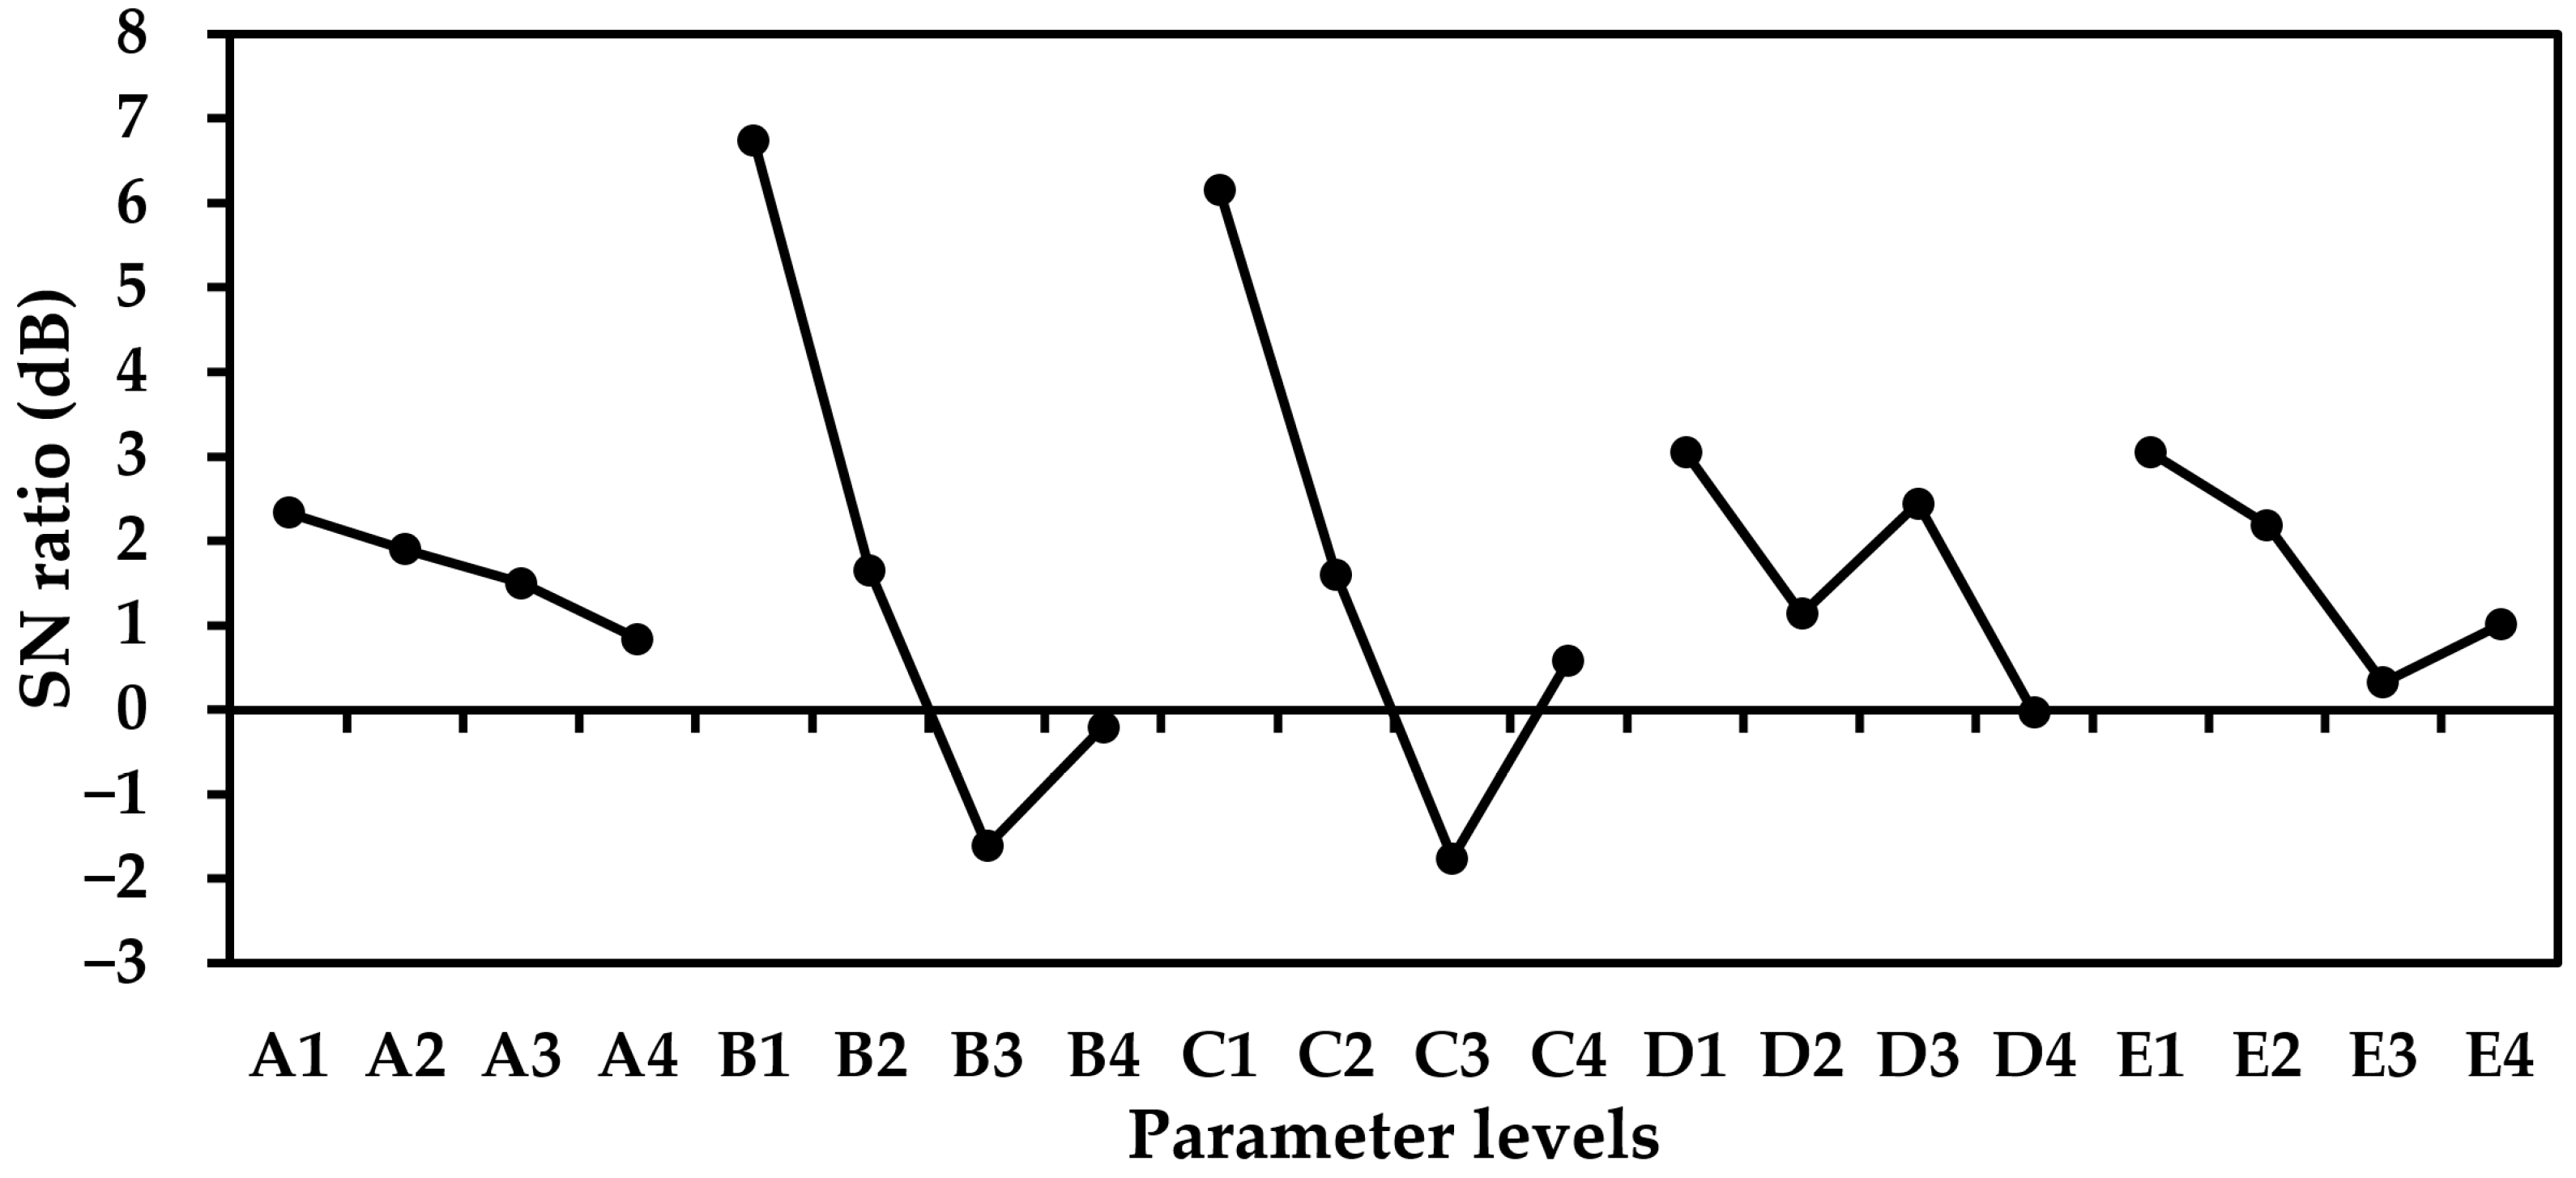
In addition to the degree of deformation, the surface roughness of the workpiece also must be considered. The data are shown in Table 4 and the smaller the better value was calculated using Equation (1). The higher the S/N ratio indicates less quality loss and higher stability of quality, which is the optimal combination of the influence factors, as shown in Table 7 and Figure 11, and the optimal respective factor A1B1C1D1E1 can be obtained. Based on the analysis in Table 8, the F value of factor A was 1360.136m, the F value of factor B was 43,041.61, the F value of factor C was 35,270.49, the F value of factor D was 6007.252, and the F value of factor E was 5001.849, and all were greater than F0.95;1,16 = 4.49. The significant effects of these five factors shown in the experiments indicate that factors such as linear velocity, feed per tooth, cutting depth, cutting width, and toolpath all need consideration if a good surface finish is to be achieved.
The level of contribution from these five factors was 1.5% for factor A, 47.4% for factor B, 38.8% for factor C, 6.6% for factor D, and 5.5% for factor E, respectively, in which the quality contribution of feed per tooth on the surface roughness was the highest, followed by the cutting depth; the significant level of cutting width was very close to that of the toolpath, and the linear velocity had the least level of influence.
The optimal factor for the degree of deformation was A1B1C1D4E4, the optimal factor for surface roughness was A1B1C1D1E1, and the common factor between the two was A1B1C1. The degree of deformation is critical to workpiece dimensional accuracy and the level of factors for D and E were dependent on the degree of deformation, making the optimal combination A1B1C1D4E4.
The optimal combination A1B1C1D4E4 was not in the L16 array, so it was necessary to carry out experimental verification. This combination was compared with actual experimental and quality assessment, the calculation method for which is as shown in Equations (3) and (4). The experimental quality of 11.697 dB can be obtained from Table 9, and it was within the range of the confidence interval calculated by the formula (the selected confidence interval was 95%).
where Fa;1,v2 = F value of level α with significant effect; α = significance level, with the confidence level 1-α; V2 = level of freedom of pooled error variance; Ve = pooled error variance; neff = valid observation number; neff = total number of experiments/1 + [sum of level of freedom of factors for the average estimation]; and r = number of samples for experimental verification.
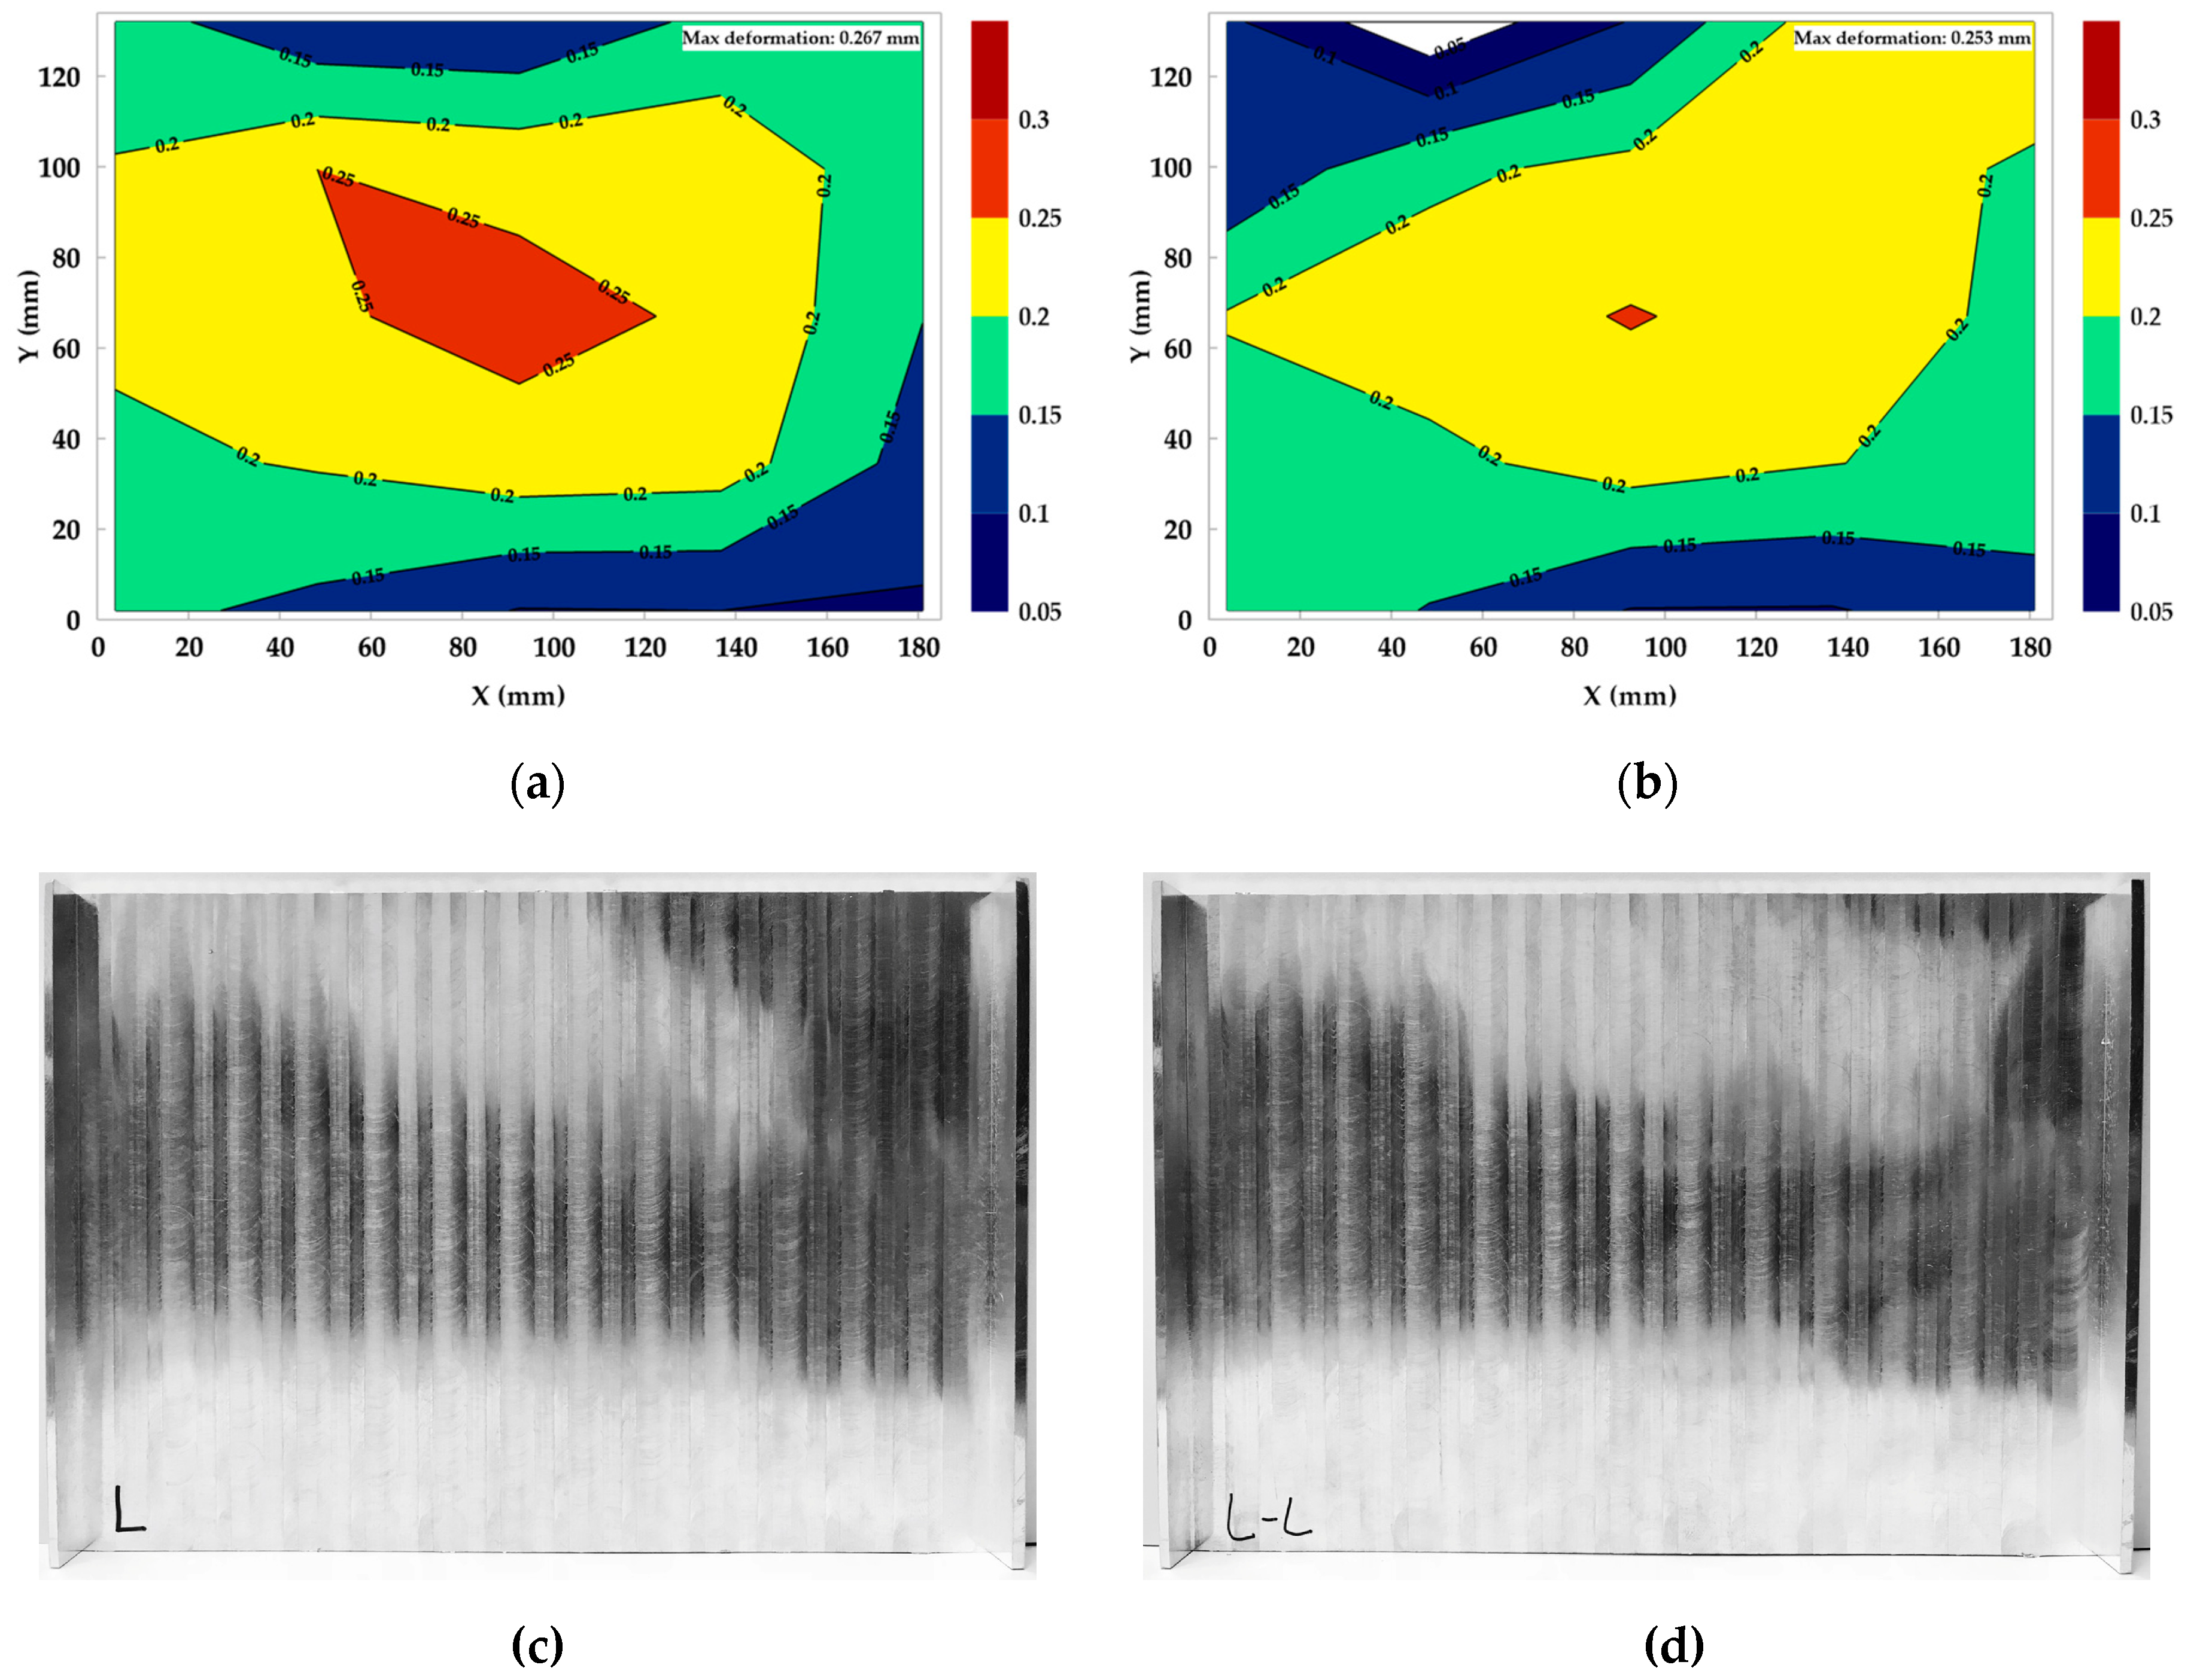
Figure 12 shows that processing with the optimized parameter A1B1C1D4E4 gave the least workpiece deformation and surface roughness. The first set of experiments (N1), showed the degree of deformation of the thin plate was the largest at C3 with a value of 0.267 mm, and the smallest at E5 with a value of 0.094 mm, as shown in Figure 12. In the second set of experiments (N2), the degree of deformation was largest at C3 with a value of 0.253 mm, and smallest at A2 with a value of 0.08 mm, as shown in Figure 12b. The distribution of deformation from these two sets of experiments was consistent, being high in the middle and low in the surroundings. Figure 12c,d shows the surface appearance of the first group (N1) and the second group (N2) after processing: a roughness of Ra = 0.261 μm for group (N1), and Ra = 0.291 μm for the second group (N2).
3.2. The Impact of Cutting Parameters on the Cutting Force
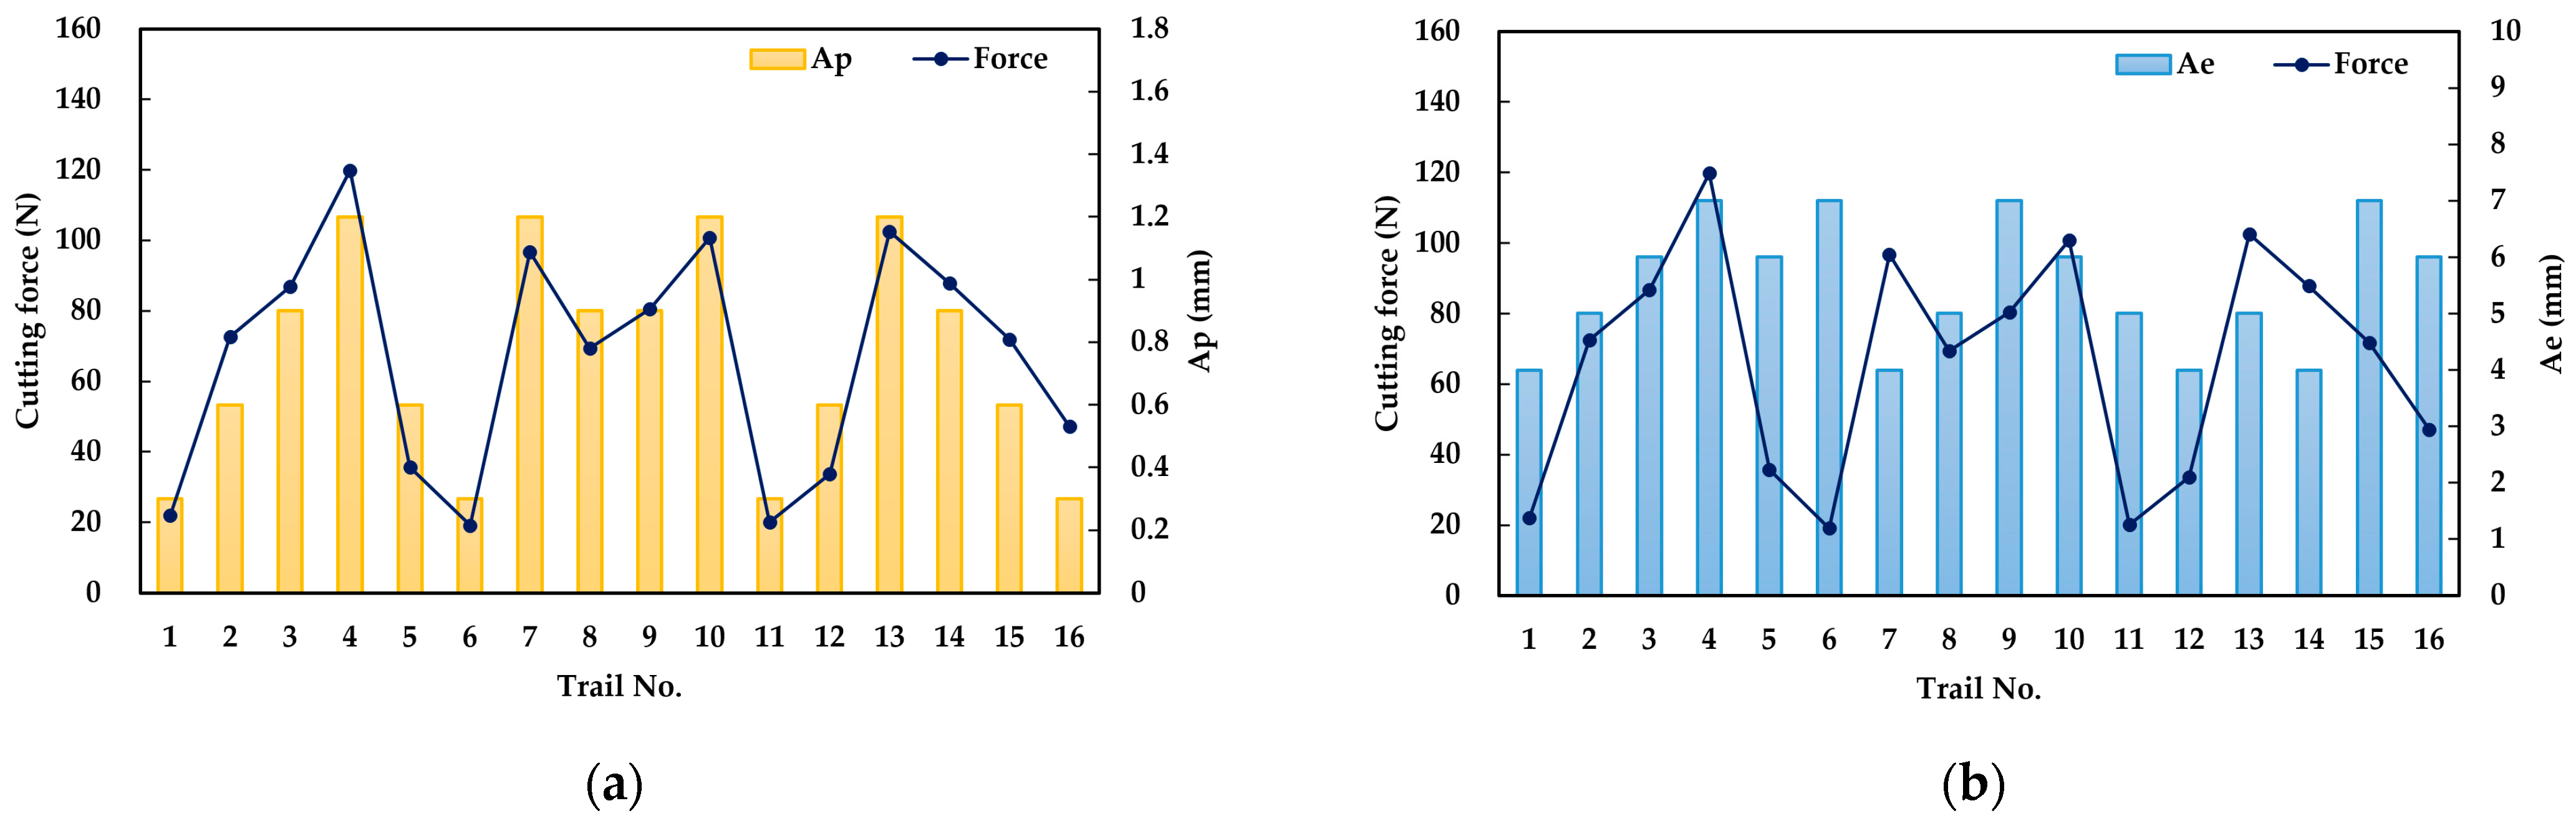
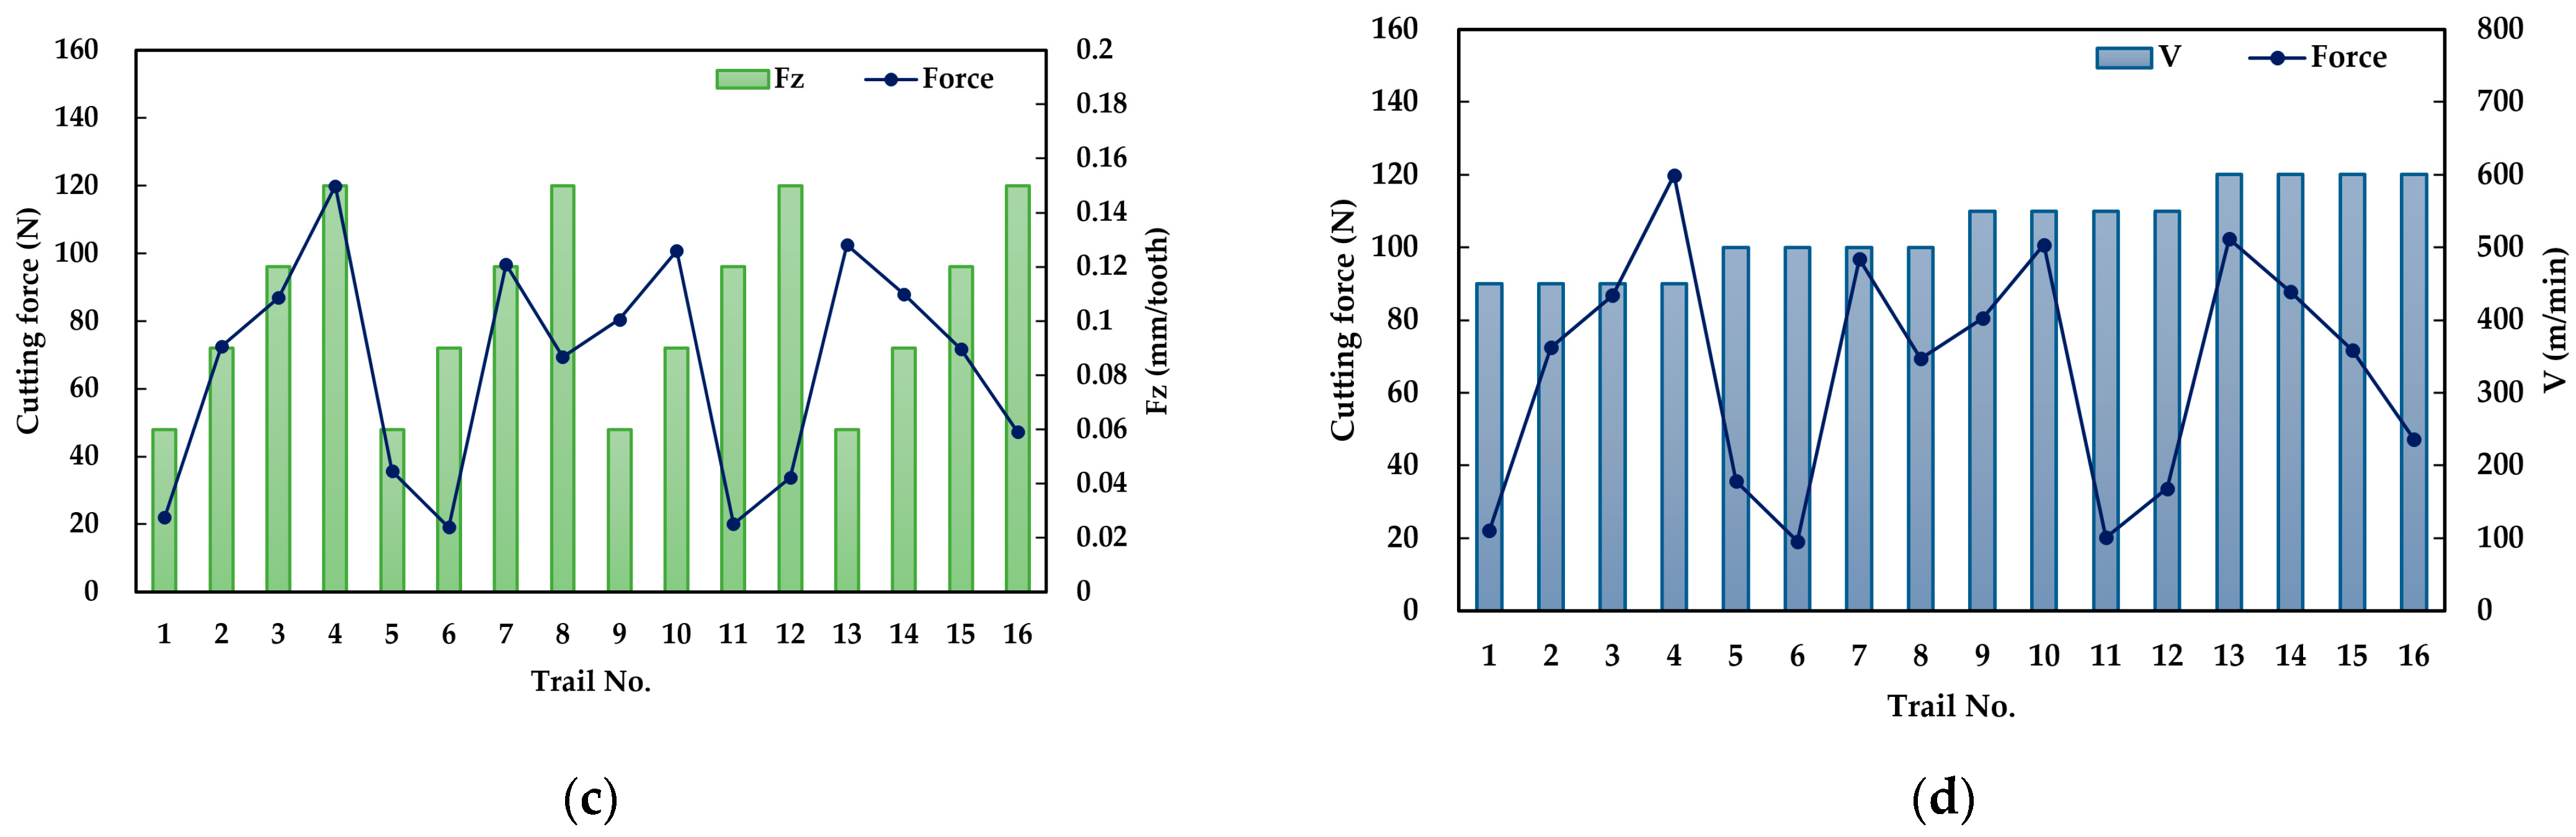
The 16 cutting force sets are shown in Table 4. In rough zigzagging, the cutting forces in parentheses indicate the cutting force during up milling. It can be seen from the figure that during down milling, the forces are lower. Figure 13 demonstrates the relationship between the four parameters—linear velocity, feed per tooth, cutting depth, and cutting width—and the forces during down milling. An examination of Figure 13a also shows that the cutting force increases when the cutting depth increases because more cutting force is necessary for deeper cuts [25,26,31].
4. Conclusions
This study presented a 6061 aluminum alloy that was used as the test substrate in machining experiments using a high-speed machining center. In this work, we emphasized that choosing the correct cutting parameters and machining techniques could increase the cutting performance and surface quality and reduce the deformation of the thin plate. The cutting parameters taken into consideration were linear velocity, feed per tooth, cutting depth, cutting width, and toolpath. The Taguchi method was used to determine suitable cutting parameters for the experiments. The Taguchi method employed in these experiments used a L16(45) orthogonal array and the five factors were as follows: linear velocity V (m/min), feed per tooth Fz (mm/tooth), cutting depth Ap (mm), cutting width Ae (mm), and toolpath. We used the Taguchi method to decrease the number of experiments from 256 to 16, which reduced the time-consuming process. The characteristics of the smaller the better concept were used, and the smaller the degree of workpiece deformation, the better the results. ANOVA was used in the analysis of significant impact of the design parameters and their factors and levels on the deformation and surface quality of the thin plate. The following conclusions can be inferred from this work.
From the deformation factor of ANOVA analysis, the feed per tooth was found to be the most significant control factor with a contribution rate as high as 63.5%. Following the feed per tooth, the toolpath exerted a 22% contribution, and then cutting depth exhibited a 7% influence, the cutting width exhibited a 6.7% influence, and lastly, the linear velocity had a 0.6% influence. The optimized parameters of deformation obtained in the Taguchi experiments were A1 = 450 mm/min, B1 = 0.06 mm/tooth, C1 = 0.3 mm, D4 = 7 mm, and E4 = rough zigzag. The degrees of deformation of the thin plate using the optimized parameters were 0.267 mm (N1) and 0.253 mm (N2), and are better than the results obtained with the original 16 sets of parameters. The degrees of surface roughness of the thin plate using the optimized parameters were 0.261 μm (N1) and 0.291 μm (N2, which were similar to those obtained with the A1B1C1D1E1. The contribution of this study can be considered as a guideline in the high-performance end milling process, especially when less deformation and good surface quality are required. It is also worth mentioning that, according to the factor response of deformation, the lower the value of factor B, the less deformation.
From the surface roughness of the ANOVA analysis, the feed per tooth was found to be the most significant control factor with a contribution rate as high as 47.4%. Following the feed per tooth, the cutting depth exerted a 38.8% contribution, the cutting width exhibited a 6.6% contribution, the toolpath exhibited a 6.7% contribution, and lastly, the linear velocity had a 1.5% influence. The optimized parameters of surface roughness obtained in the Taguchi experiments were A1 = 450 mm/min, B1 = 0.06 mm/tooth, C1 = 0.3 mm, D1 = 4 mm, and E1 = one-way contour. The degrees of surface roughness of the thin plate using the A1B1C1D1E1 were 0.2 μm (N1) and 0.162 μm (N2), and they are better than the results obtained with the original 16 sets of parameters. Furthermore, the Fz and the Ap decreased and the Ra increased.
In the future, the purposed work strategy will be applied for difficult to cut materials, such as titanium alloy or Inconel alloy.
Author Contributions
Conceptualization, C.-H.K.; methodology, C.-H.K.; software, Z.-Y.L.; validation, Z.-Y.L.; investigation, C.-H.K.; resources, C.-H.K.; writing—original draft preparation, C.-H.K.; writing—review and editing, C.-H.K.; supervision, C.-H.K. All authors have read and agreed to the published version of the manuscript.
Funding
This research received no external funding.
Data Availability Statement
Data is contained within the article.
Conflicts of Interest
The authors declare no conflict of interest.
References
- Sridhar, G.; Babu, P.R. Understanding the challenges in machining thin-walled thin floored Avionics components. Int. J. Appl. Sci. Eng. Res. 2013, 2, 93–100. [Google Scholar]
- Izamshah, R.; Mo, J.P.T.; Ding, S. Hybrid deflection prediction on machining thin-wall monolithic aerospace components. Proc. Inst. Mech. Eng. B. J. Eng. Manuf. 2011, 226, 592–605. [Google Scholar] [CrossRef]
- Wang, Z.J.; Chen, W.Y.; Zhang, Y.D.; Chen, Z.T.; Qiang, L. Study on the machining distortion of thin-walled part caused by redistribution of residual stress, Chinese J. Aeronaut. 2005, 18, 175–179. [Google Scholar] [CrossRef] [Green Version]
- Del Sol, I.; Rivero, A.; López de Lacalle, L.N.; Gamez, A.J. Thin-Wall Machining of Light Alloys: A Review of Models and Industrial Approaches. Materials 2019, 12, 2012. [Google Scholar] [CrossRef] [PubMed] [Green Version]
- Jiang, X.H.; Wang, Y.F.; Ding, Z.S.; Li, H.L. An approach to predict the distortion of thin-walled parts affected by residual stress during the milling process. Int. J. Adv. Manuf. Technol. 2017, 93, 4203–4216. [Google Scholar] [CrossRef]
- Li, B.Z.; Jiang, X.H.; Yang, J.G.; Liang, S.Y. Effects of depth of cut on the redistribution of residual stress and distortion during the milling of thin-walled part. J. Mater. Process. Technol. 2015, 216, 223–233. [Google Scholar] [CrossRef]
- Masoudi, S.; Amini, S.; Saeidi, E.; Eslami-Chalander, H. Effect of machining-induced residual stress on the distortion of thin-walled parts. Int. J. Adv. Manuf. Technol. 2014, 76, 597–608. [Google Scholar] [CrossRef]
- Wu, Q.; Li, D.P.; Zhang, Y.D. Detecting Milling Deformation in 7075 aluminum Alloy Aeronautical Monolithic Components Using the Quasi-Symmetric Machining Method. Metals 2016, 6, 80. [Google Scholar] [CrossRef]
- Takeuchi, Y. Dexterous machining aiming at high value-added products. Int. J. Precis. Eng. Manuf.-Green Tech. 2014, 1, 177–181. [Google Scholar] [CrossRef] [Green Version]
- Kida, Y.; Toyoda, K.; Beaucamp, A.; Takeuchi, Y. Dexterous machining of unstable thin plate. Procedia CIRP 2017, 63, 324–329. [Google Scholar]
- Shamoto, E.; Mori, T.; Nishimura, K.; Hiramatsu, T.; Kurata, Y. Suppression of regenerative chatter vibration in simultaneous double-sided milling of flexible plates by speed difference. CIRP Ann. 2010, 59, 387–390. [Google Scholar] [CrossRef]
- Župerl, U.; Čuš, F.; Vukelić, D. Variable clamping force control for an intelligent fixturing. J. Prod. Eng. 2000, 14, 19–22. [Google Scholar]
- Jin, L.; Lin, B.; Yan, S.; Fei, J. Application of mirror-milling machining system to suppress vibration in thin plate work-piece. In Proceedings of the International Conference on Mechatronic and Embedded Systems and Applications, Auckland, New Zealand, 29–31 August 2016. [Google Scholar]
- Jain, A.; Bajpai, V. Introduction to high-speed machining (HSM). In High-Speed Machining, 1st ed.; Kapil, G., Paulo, D., Eds.; Academic Press: Cambridge, MA, USA, 2020; pp. 1–25. [Google Scholar]
- Neugebauer, R.; Bouzakis, K.D.; Denkena, B.; Klocke, F.; Sterzing, A.; Tekkaya, A.E.; Wertheim, R. Velocity effects in metal forming and machining processes. CIRP Annals 2011, 60, 627–650. [Google Scholar] [CrossRef]
- Ali, R.A.; Mia, M.; Khan, A.M.; Chen, W.; Gupta, M.K.; Pruncu, C.I. Multi-Response Optimization of Face Milling Performance Considering Tool Path Strategies in Machining of Al-2024. Materials 2019, 12, 1013. [Google Scholar] [CrossRef] [PubMed] [Green Version]
- Zawada-Michałowska, M.; Kuczmaszewski, J.; Legutko, S.; Pieśko, P. Techniques for Thin-Walled Element Milling with Respect to Minimising Post-Machining Deformations. Materials 2020, 13, 4723. [Google Scholar] [CrossRef]
- Lukic, D.; Cep, R.; Vukman, J.; Antic, A.; Djurdjev, M.; Milosevic, M. Multi-Criteria Selection of the Optimal Parameters for High-Speed Machining of Aluminum Alloy Al7075 Thin-Walled Parts. Metals 2020, 10, 1570. [Google Scholar] [CrossRef]
- Sumbodo, W.; Kriswanto, M.; Suwanda, I.; Allam, T. Optimization of CNC Milling Machining Time through Variation of Machine Parameters and Toolpath Strategy in Various Cross-sectional Shape on Tool Steels and Die Steels Materials. In Proceedings of the 7th Engineering International Conference on Education, Concept and Application on Green Technology, Semarang, Indonesia, 18 October 2018. [Google Scholar]
- Zaleski, K.; Matuszak, J.; Zyśko, A. Highly Efficient Milling on the Example of Selected Machining Strategies. ASTRJ 2020, 14, 167–177. [Google Scholar]
- Abbas, A.T.; Pimenov, D.Y.; Erdakov, I.N.; Mikolajczyk, T.; Soliman, M.S.; Rayes, M.M.E. Optimization of cutting conditions using artificial neural networks and the Edgeworth-Pareto method for CNC face-milling operations on high-strength grade-H steel. Int. J. Adv. Manuf. Technol. 2019, 105, 2151–2165. [Google Scholar] [CrossRef] [Green Version]
- Azim, S.; Noor, S.; Khalid, Q.S.; Khan, A.M.; Pimenov, D.Y.; Ahmad, I.; Babar, A.R.; Pruncu, C.I. Sustainable Manufacturing and Parametric Analysis of Mild Steel Grade 60 by Deploying CNC Milling Machine and Taguchi Method. Metals 2020, 10, 1303. [Google Scholar] [CrossRef]
- Markopoulos, A.P.; Karkalos, N.E.; Mia, M.; Pimenov, D.Y.; Gupta, M.K.; Hegab, H.; Khanna, N.; Aizebeoje Balogun, V.; Sharma, S. Sustainability Assessment, Investigations, and Modelling of Slot Milling Characteristics in Eco-Benign Machining of Hardened Steel. Metals 2020, 10, 1650. [Google Scholar] [CrossRef]
- Chuchala, D.; Dobrzynski, M.; Pimenov, D.Y.; Orlowski, K.A.; Krolczyk, G.; Giasin, K. Surface Roughness Evaluation in Thin EN AW-6086-T6 Alloy Plates after Face Milling Process with Different Strategies. Materials 2021, 14, 3036. [Google Scholar] [CrossRef] [PubMed]
- Wojciechowski, S.; Maruda, R.W.; Barrans, S.; Nieslony, P.; Krolczyk, G.M. Optimisation of machining parameters during ball end milling of hardened steel with various surface inclinations. Measurement 2017, 111, 18–28. [Google Scholar] [CrossRef] [Green Version]
- Jarosz, K.; Löschner, P.; Niesłony, P.; Królczyk, G. Optimization of CNC face milling process of Al-6061-T6 aluminum alloy. J. Mach. Eng. 2017, 17, 57–68. [Google Scholar]
- Gologlu, C.; Sakarya, N. The effects of cutter path strategies on surface roughness of pocket milling of 1. 2738 steel based on Taguchi method. J. Mater. Process. Technol. 2008, 206, 7–15. [Google Scholar]
- Leo, P.; D’Ostuni, S.; Nobile, R.; Mele, C.; Tarantino, A.; Casalino, G. Analysis of the Process Parameters, Post-Weld Heat Treatment and Peening Effects on Microstructure and Mechanical Performance of Ti–Al Dissimilar Laser Weldings. Metals 2021, 11, 1257. [Google Scholar] [CrossRef]
- Ventsel, E.; Krauthammer, T. Thin Plates and Shells: Theory, Analysis, and Applications, 1st ed.; CRC Press: New York, NY, USA, 2001. [Google Scholar]
- Altintas, Y.; Ber, A.A. Manufacturing Automation: Metal Cutting Mechanics, Machine Tool Vibrations, and CNC Design, 2nd ed.; Cambridge University Press: Cambridge, UK, 2012. [Google Scholar]
- Subramanian, M.; Sakthivel, M.; Sooryaprakash, K.; Sudhakaran, R. Optimization of cutting parameters for cutting force in shoulder milling of Al7075-T6 using response surface methodology and genetic algorithm. Procedia Eng. 2013, 64, 690–700. [Google Scholar] [CrossRef] [Green Version]
Figure 1.
The FFG model TC-20α machining center.

Figure 2.
The adapter tray fixture.

Figure 3.
The overall setup of the adapter tray fixture.

Figure 4.
The measuring points.

Figure 5.
Schematic diagram of the experimental machining setup.

Figure 6.
The four toolpaths: (a) one-way contour, (b) Z-level follow cavity, (c) Z-level follow core, and (d) rough zigzag.
Figure 6.
The four toolpaths: (a) one-way contour, (b) Z-level follow cavity, (c) Z-level follow core, and (d) rough zigzag.


Figure 7.
The deformation distribution of experimental groups 1 to 4 (N1). (a) A1B1C1D1E1, Max = 0.484 mm. (b) A1B2C2D2E2, Max = 0.385 mm. (c) A1B3C3D3E3, Max = 1.23 mm. (d) A1B4C4D4E4, Max = 0.435 mm.
Figure 7.
The deformation distribution of experimental groups 1 to 4 (N1). (a) A1B1C1D1E1, Max = 0.484 mm. (b) A1B2C2D2E2, Max = 0.385 mm. (c) A1B3C3D3E3, Max = 1.23 mm. (d) A1B4C4D4E4, Max = 0.435 mm.

Figure 8.
The surface roughness of experimental groups 1 to 4 (N1). (a) A1B1C1D1E1, Ra = 0.2 μm. (b) A1B2C2D2E2, Ra = 0.906 μm. (c) A1B3C3D3E3, Ra = 1.869 μm. (d) A1B4C4D4E4, Ra = 1.518 μm.
Figure 8.
The surface roughness of experimental groups 1 to 4 (N1). (a) A1B1C1D1E1, Ra = 0.2 μm. (b) A1B2C2D2E2, Ra = 0.906 μm. (c) A1B3C3D3E3, Ra = 1.869 μm. (d) A1B4C4D4E4, Ra = 1.518 μm.


Figure 9.
Cutting force diagram of (a) Fx, (b) Fy, and (c) Fz using the experimental factor A1B1C1D1E1(N1).
Figure 9.
Cutting force diagram of (a) Fx, (b) Fy, and (c) Fz using the experimental factor A1B1C1D1E1(N1).


Figure 10.
The deformation factor response diagram.

Figure 11.
Surface roughness factor response diagram.

Figure 12.
Deformation and surface roughness with the optimized experimental factor A1B1C1D4E4. (a) Max = 0.267 mm. (b) Max = 0.254 mm. (c) Ra = 0.261 μm. (d) Ra = 0.291 μm.
Figure 12.
Deformation and surface roughness with the optimized experimental factor A1B1C1D4E4. (a) Max = 0.267 mm. (b) Max = 0.254 mm. (c) Ra = 0.261 μm. (d) Ra = 0.291 μm.

Figure 13.
The impact of cutting parameters on the cutting force: (a) Ap (mm), (b) Ae (mm), (c) fz (feed/tooth), and (d) V (m/min).
Figure 13.
The impact of cutting parameters on the cutting force: (a) Ap (mm), (b) Ae (mm), (c) fz (feed/tooth), and (d) V (m/min).


Table 1.
Chemical composition of the workpiece material reproduced from [28].
Table 1.
Chemical composition of the workpiece material reproduced from [28].
| Si | Fe | Cu | Mn | Mg | Cr | Zn | Ti | Al |
|---|---|---|---|---|---|---|---|---|
| 0.40 | 0.40 | 0.10 | 0.50 | 2.6–3.6 | 0.30 | 0.20 | <0.15 | bal. |
Table 2.
Basic dimensions of the cutting tool.
| Name of Dimension | Value | Unit |
|---|---|---|
| Diameter | 10 | mm |
| Length of cutter | 75 | mm |
| Number of teeth | 3 | - |
| Rake angle | 15 | degree |
| Helix angle | 50 | degree |
| 1st relief angle | 10 | degree |
| 2nd relief angle | 25 | degree |
| 3rd relief angle | 32 | degree |
Table 3.
Configuration of the Taguchi cutting parameters.
| Factor | Process Parameter | Level 1 | Level 2 | Level 3 | Level 4 |
|---|---|---|---|---|---|
| A | V (m/min) | 450 | 500 | 550 | 600 |
| B | Fz (mm/tooth) | 0.06 | 0.09 | 0.12 | 0.15 |
| C | Ap (mm) | 0.3 | 0.6 | 0.9 | 1.2 |
| D | Ae (mm) | 4 | 5 | 6 | 7 |
| E | Toolpath | One-way contour | Z-level follow cavity | Z-level follow core | Rough zigzag |
Table 4.
Results of L16 orthogonal array for deformation, surface roughness, and cutting force.
| Exp. | Control Factor | Deformation (mm) | Surface Roughness (μm) | Cutting Force (N) | |||||||||
|---|---|---|---|---|---|---|---|---|---|---|---|---|---|
| A | B | C | D | E | N1 | N2 | SNR (dB) | N1 | N2 | SNR (dB) | N1 | N2 | |
| 1 | 1 | 1 | 1 | 1 | 1 | 0.484 | 0.386 | 7.19 | 0.2 | 0.162 | 14.80 | 22.68 | 21.43 |
| 2 | 1 | 2 | 2 | 2 | 2 | 0.385 | 0.596 | 5.99 | 0.906 | 0.532 | 2.58 | 73.37 | 71.71 |
| 3 | 1 | 3 | 3 | 3 | 3 | 1.23 | 1.02 | −1.06 | 1.869 | 1.613 | −4.84 | 85.51 | 88.12 |
| 4 | 1 | 4 | 4 | 4 | 4 | 0.435 | 0.567 | 5.93 | 1.518 | 1.237 | −2.83 | 120.9 (169.09) | 118.78 (165.86) |
| 5 | 2 | 1 | 2 | 3 | 4 | 0.506 | 0.365 | 7.11 | 0.41 | 0.468 | 7.13 | 34.98 (49.21) | 36.45 (50.96) |
| 6 | 2 | 2 | 1 | 4 | 3 | 0.459 | 0.353 | 7.76 | 0.685 | 0.667 | 3.40 | 18.55 | 19.69 |
| 7 | 2 | 3 | 4 | 1 | 2 | 0.892 | 0.704 | 1.90 | 1.142 | 0.952 | −0.43 | 95.34 | 98.1 |
| 8 | 2 | 4 | 3 | 2 | 1 | 1.03 | 1.08 | −0.47 | 1.302 | 1.352 | −2.46 | 70.66 | 68.11 |
| 9 | 3 | 1 | 3 | 4 | 2 | 0.49 | 0.379 | 7.17 | 0.632 | 0.897 | 2.20 | 81.76 | 79.15 |
| 10 | 3 | 2 | 4 | 3 | 1 | 0.728 | 0.716 | 2.83 | 0.567 | 0.851 | 2.82 | 98.34 | 103.1 |
| 11 | 3 | 3 | 1 | 2 | 4 | 0.655 | 0.578 | 4.18 | 0.827 | 0.832 | 1.62 | 19.75 (24.32) | 20.46 (26.7) |
| 12 | 3 | 4 | 2 | 1 | 3 | 0.829 | 0.925 | 1.13 | 1.036 | 1.036 | −0.31 | 31.73 | 35.64 |
| 13 | 4 | 1 | 4 | 2 | 3 | 0.526 | 0.395 | 6.65 | 0.732 | 0.671 | 3.07 | 105.4 | 99.48 |
| 14 | 4 | 2 | 3 | 1 | 4 | 0.454 | 0.333 | 8.00 | 1.245 | 1.219 | −1.81 | 89.46 (141.56) | 86.12 (134.7) |
| 15 | 4 | 3 | 2 | 4 | 1 | 0.97 | 1.175 | −0.65 | 1.364 | 1.379 | −2.74 | 72.86 | 70.66 |
| 16 | 4 | 4 | 1 | 3 | 2 | 0.7 | 0.786 | 2.57 | 0.65 | 0.463 | 4.97 | 49.2 | 45.12 |
Table 5.
SN ratio values for deformation.
| Factor | Process Parameter | Level 1 | Level 2 | Level 3 | Level 4 |
|---|---|---|---|---|---|
| A | V (m/min) | 4.51 | 4.07 | 3.83 | 4.14 |
| B | Fz (mm/tooth) | 7.03 | 6.14 | 1.09 | 2.29 |
| C | Ap (mm) | 5.42 | 3.39 | 3.41 | 4.33 |
| D | Ae (mm) | 4.55 | 4.09 | 2.86 | 5.05 |
| E | Toolpath | 2.23 | 4.41 | 3.62 | 6.31 |
Table 6.
Analysis of deformation variance.
| Factor | SS | DOF | F-Test | Percent Contribution | Significant |
|---|---|---|---|---|---|
| A | 0.95 | 3 | 255.75 | 0.6% | Yes |
| B | 100.25 | 3 | 26,733.68 | 63.5% | Yes |
| C | 11.07 | 3 | 2953.97 | 7% | Yes |
| D | 10.56 | 3 | 2818.09 | 6.7% | Yes |
| E | 34.79 | 3 | 9278.3 | 22% | Yes |
| Error | 0.02 | 16 | - | 0.2% | - |
| Total | 157.64 | 31 | - | 100% | - |
Table 7.
SN ratio values for surface roughness.
| Factor | Process Parameter | Level 1 | Level 2 | Level 3 | Level 4 |
|---|---|---|---|---|---|
| A | V (m/min) | 2.43 | 1.91 | 1.58 | 0.87 |
| B | Fz (mm/tooth) | 6.8 | 1.75 | −1.60 | −0.16 |
| C | Ap (mm) | 6.2 | 1.67 | −1.73 | 0.66 |
| D | Ae (mm) | 3.06 | 1.2 | 2.52 | 0.01 |
| E | Toolpath | 3.1 | 2.33 | 0.33 | 1.03 |
Table 8.
Analysis of variance in surface roughness.
| Factor | SS | DOF | F-test | Percent Contribution | Significant |
|---|---|---|---|---|---|
| A | 5.1 | 3 | 1360.136 | 1.5% | Yes |
| B | 161.406 | 3 | 43,041.61 | 47.4% | Yes |
| C | 132.264 | 3 | 35,270.49 | 38.8% | Yes |
| D | 22.527 | 3 | 6007.252 | 6.6% | Yes |
| E | 18.756 | 3 | 5001.849 | 5.5% | Yes |
| Error | 0.02 | 16 | - | 0.2% | - |
| Total | 340.054 | 31 | - | 100% | - |
Table 9.
A comparison of the experimental verification of deformation and the predicted value.
| Exp. | N1 | N2 | S | S/N | ||
|---|---|---|---|---|---|---|
| Experiment | Predicted | |||||
| Optimal | 0.267 | 0.254 | 0.261 | 0.007 | 11.697 | 11.765 ± 0.074 |
Publisher’s Note: MDPI stays neutral with regard to jurisdictional claims in published maps and institutional affiliations. |
© 2021 by the authors. Licensee MDPI, Basel, Switzerland. This article is an open access article distributed under the terms and conditions of the Creative Commons Attribution (CC BY) license (https://creativecommons.org/licenses/by/4.0/).
Share and Cite
MDPI and ACS Style
Kuo, C.-H.; Lin, Z.-Y. Optimizing the High-Performance Milling of Thin Aluminum Alloy Plates Using the Taguchi Method. Metals 2021, 11, 1526. https://0-doi-org.brum.beds.ac.uk/10.3390/met11101526
AMA Style
Kuo C-H, Lin Z-Y. Optimizing the High-Performance Milling of Thin Aluminum Alloy Plates Using the Taguchi Method. Metals. 2021; 11(10):1526. https://0-doi-org.brum.beds.ac.uk/10.3390/met11101526
Chicago/Turabian StyleKuo, Cheng-Hsien, and Zi-Yi Lin. 2021. "Optimizing the High-Performance Milling of Thin Aluminum Alloy Plates Using the Taguchi Method" Metals 11, no. 10: 1526. https://0-doi-org.brum.beds.ac.uk/10.3390/met11101526
Note that from the first issue of 2016, this journal uses article numbers instead of page numbers. See further details here.