
Study on the Influence of the Gurson–Tvergaard–Needleman Damage Model on the Fatigue Crack Growth Rate


Centre for Mechanical Engineering, Materials and Processes (CEMMPRE), Department of Mechanical Engineering, University of Coimbra, Pinhal de Marrocos, 3030-788 Coimbra, Portugal
*
Author to whom correspondence should be addressed.
Metals 2021, 11(8), 1183; https://0-doi-org.brum.beds.ac.uk/10.3390/met11081183
Submission received: 11 June 2021
/
Revised: 15 July 2021
/
Accepted: 16 July 2021
/
Published: 25 July 2021
(This article belongs to the Special Issue Fatigue Crack Propagation Micromechanisms of Metallic Materials)
Abstract
:The fatigue crack growth (FCG) process is usually accessed through the stress intensity factor range, ΔK, which has some limitations. The cumulative plastic strain at the crack tip has provided results in good agreement with the experimental observations. Also, it allows understanding the crack tip phenomena leading to FCG. Plastic deformation inevitably leads to micro-porosity occurrence and damage accumulation, which can be evaluated with a damage model, such as Gurson–Tvergaard–Needleman (GTN). This study aims to access the influence of the GTN parameters, related to growth and nucleation of micro-voids, on the predicted crack growth rate. The results show the connection between the porosity values and the crack closure level. Although the effect of the porosity on the plastic strain, the predicted effect of the initial porosity on the predicted crack growth rate is small. The sensitivity analysis identified the nucleation amplitude and Tvergaard’s loss of strength parameter as the main factors, whose variation leads to larger changes in the crack growth rate.
1. Introduction
The fatigue crack growth (FCG) process is widely evaluated using the stress intensity factor range (ΔK) [1,2]. This concept is interesting because it is related to the stress and strain fields occurring near the crack tip. Despite the importance of this parameter, it is not able to explain phenomena such as the influence of the stress ratio or variable amplitude loading [3]. The introduction of the crack closure concept allowed to explain the results obtained when considering overloads [4], short cracks [5], and mean stress [6]. However, the crack closure is related to non-linear concepts [7] while ΔK is fundamentally elastic [8]. The study of the nonlinear crack tip phenomena emerged as an alternative to the study based on ΔK. Different non-linear parameters have been used, namely the range of cyclic plastic strain [9], the size of the reverse plastic zone [10] and the total plastic dissipation per cycle [11]. The plastic crack tip opening displacement (CTODp) has also been used to predict FCG [12,13,14,15]. In this way, the plastic deformation at the crack tip can be understood as the main driving force behind FCG [16]. In this line of work, models regarding the cumulative plastic strain prove to provide results in good agreement with the experimental trends [3,17,18].
Under the presence of high levels of plastic strain, ductile fracture tends to be of high importance [19,20]. This process occurs at a microscale level involving three fundamental stages: growth, nucleation, and coalescence of micro-voids [21,22]. Voids are defects innate to the materials, which under specific conditions will subsequently grow. The void growth process is highly affected by the stress state [23]. Indeed, the deviatoric stress component is primarily responsible for void nucleation while the hydrostatic stress rules the void growth and coalescence steps [24]. Thus, the stress triaxiality dictates which are the active mechanisms behind void growth. Under low stress triaxiality, voids suffer changes in shape without affecting the void volume fraction. In this way, fracture is mainly due to shape changing void growth [25]. Alternatively, on the presence of high stress triaxiality, as it occurs at a fatigue crack tip [26], voids dilatate without changing their shape [27]. In addition to growing, the number of voids can also increase. For high levels of plastic deformation, void initiation arises by fracture of non-metallic inclusions and by the decohesion of the inclusion–matrix interface [28,29]. At some point, voids become so large that the interactions between them become inevitable. Coalescence occurs, leading to ductile fracture.
Even if coalescence is not achieved, the mechanisms involving micro-voids deteriorate the strength of the materials. This process is usually referred as damage accumulation [30]. The assessment of the damage accumulation is done with the so-called damage models. GTN is one of them and encompasses the category of the micromechanical based coupled models. These models consider that the properties of the materials are a function of damage. They predict the damage accumulation through the consideration of individual micro-defects in the material [31]. The GTN damage model is therefore used to predict the damage build-up, which results in a strength loss of the material affecting the accumulation of plastic strain at the crack tip, and consequentially the FCG rate.
This study aims to evaluate the influence of the GTN parameters on the crack growth rate predicted by a node release numerical model. The values assigned to these parameters define the growth and nucleation of micro-voids. Thus, the GTN model accounts for the material loss of mechanical resistance, while the plastic strain is considered the fatigue crack growth driving force.
The paper is organized as follows: in the next section the numerical model is presented including the node release method, the material yield criterion, isotropic and hardening laws, geometry, mesh and applied loading. Then, the GTN model formulation is presented and discussed. In the third section there is the presentation and discussion of the results obtained by analyzing each one of the GTN parameters. Finally, there is a sensitivity analysis, carried out to access the influence of the studied parameters.
2. Numerical Model
All numerical simulations were performed with the in-house finite element code DD3IMP, originally developed to simulate deep-drawing processes [32,33]. The mechanical model follows an updated lagrangian scheme to describe the evolution of the deformation process, which considers large elastoplastic strains and rotations. The fatigue crack propagation is simulated with a node release numerical model [3,34,35]. This section presents only the main features of the models currently implemented in the finite element code.
2.1. Elasto-Plastic Material Behaviour
All the simulations were performed on the 2024-T351 aluminium alloy. This aluminium alloy is currently used in several engineering applications, namely in the aeronautical industry due to the high strength to weight ratio. The calibration of the material parameters, involved in the definition of the plastic behaviour of this alloy, was carried in a previous study [36]. The isotropic elastic behaviour was described by the generalized Hooke’s law. The shape of the yield surface was defined by the von Mises yield criterion. The hardening behaviour, i.e., the evolution of the equivalent yield stress, , was described by Swift law, given by Equation (1), combined with Armstrong-Frederick law, expressed by Equation (2), to account the kinematic hardening.
for the Swift law: , K and n are the material parameters and is the equivalent cumulative plastic strain. In the case of Armstrong-Frederick: is the back stress tensor, and are material parameters, is the deviatoric component of the Cauchy stress tensor, is the equivalent stress, and is the equivalent plastic strain rate. The isotropic and kinematic hardening parameters were simultaneously calibrated using the stress–strain curves obtained in smooth specimens of the experimental low cycle fatigue tests, which are presented in Table 1.
2.2. Boundary Conditions, Geometry, and Specimen Descritization
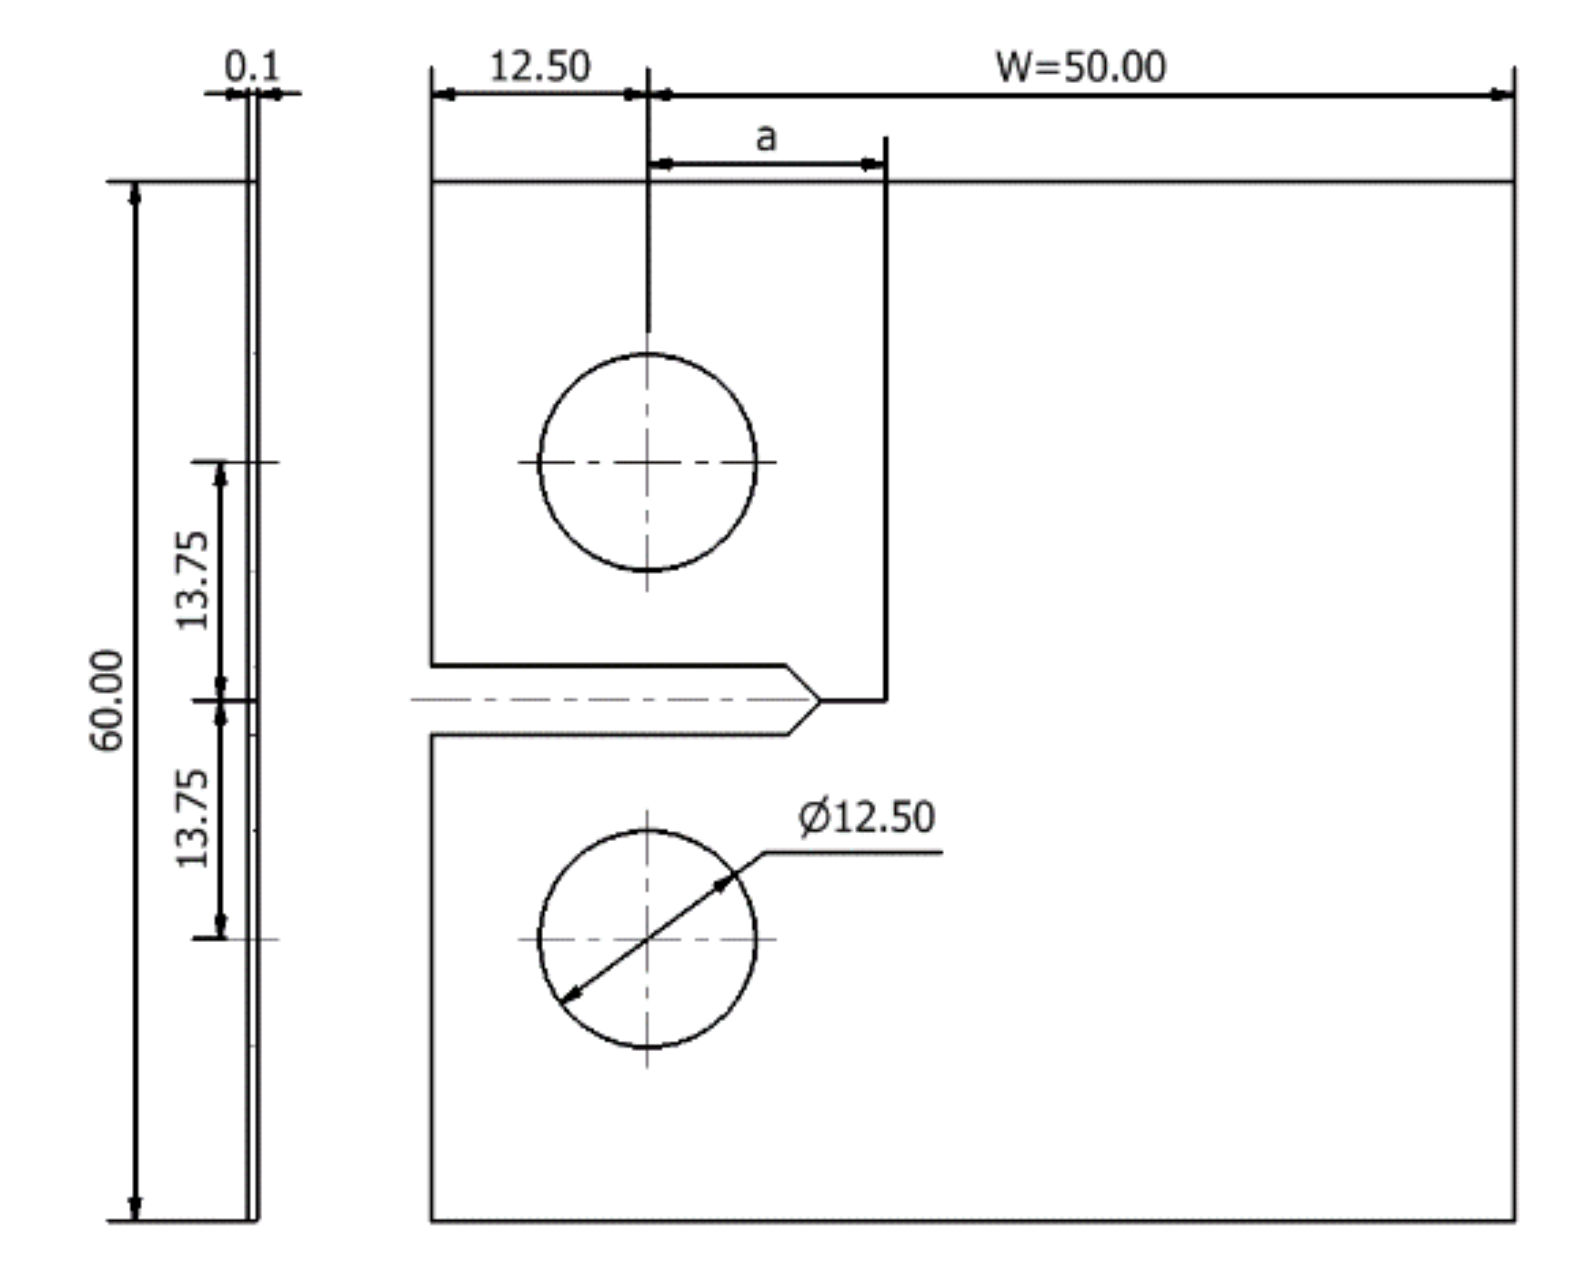
The study was performed in compact tension (CT) specimens, whose geometry and main dimensions are shown in Figure 1. A thickness of 0.1 mm was considered in the numerical model. Plane strain conditions were imposed, in all simulations of the study, by constraining out of plane displacements on a both faces of the component. Thus, the obtained results are independent of the specimen thickness.
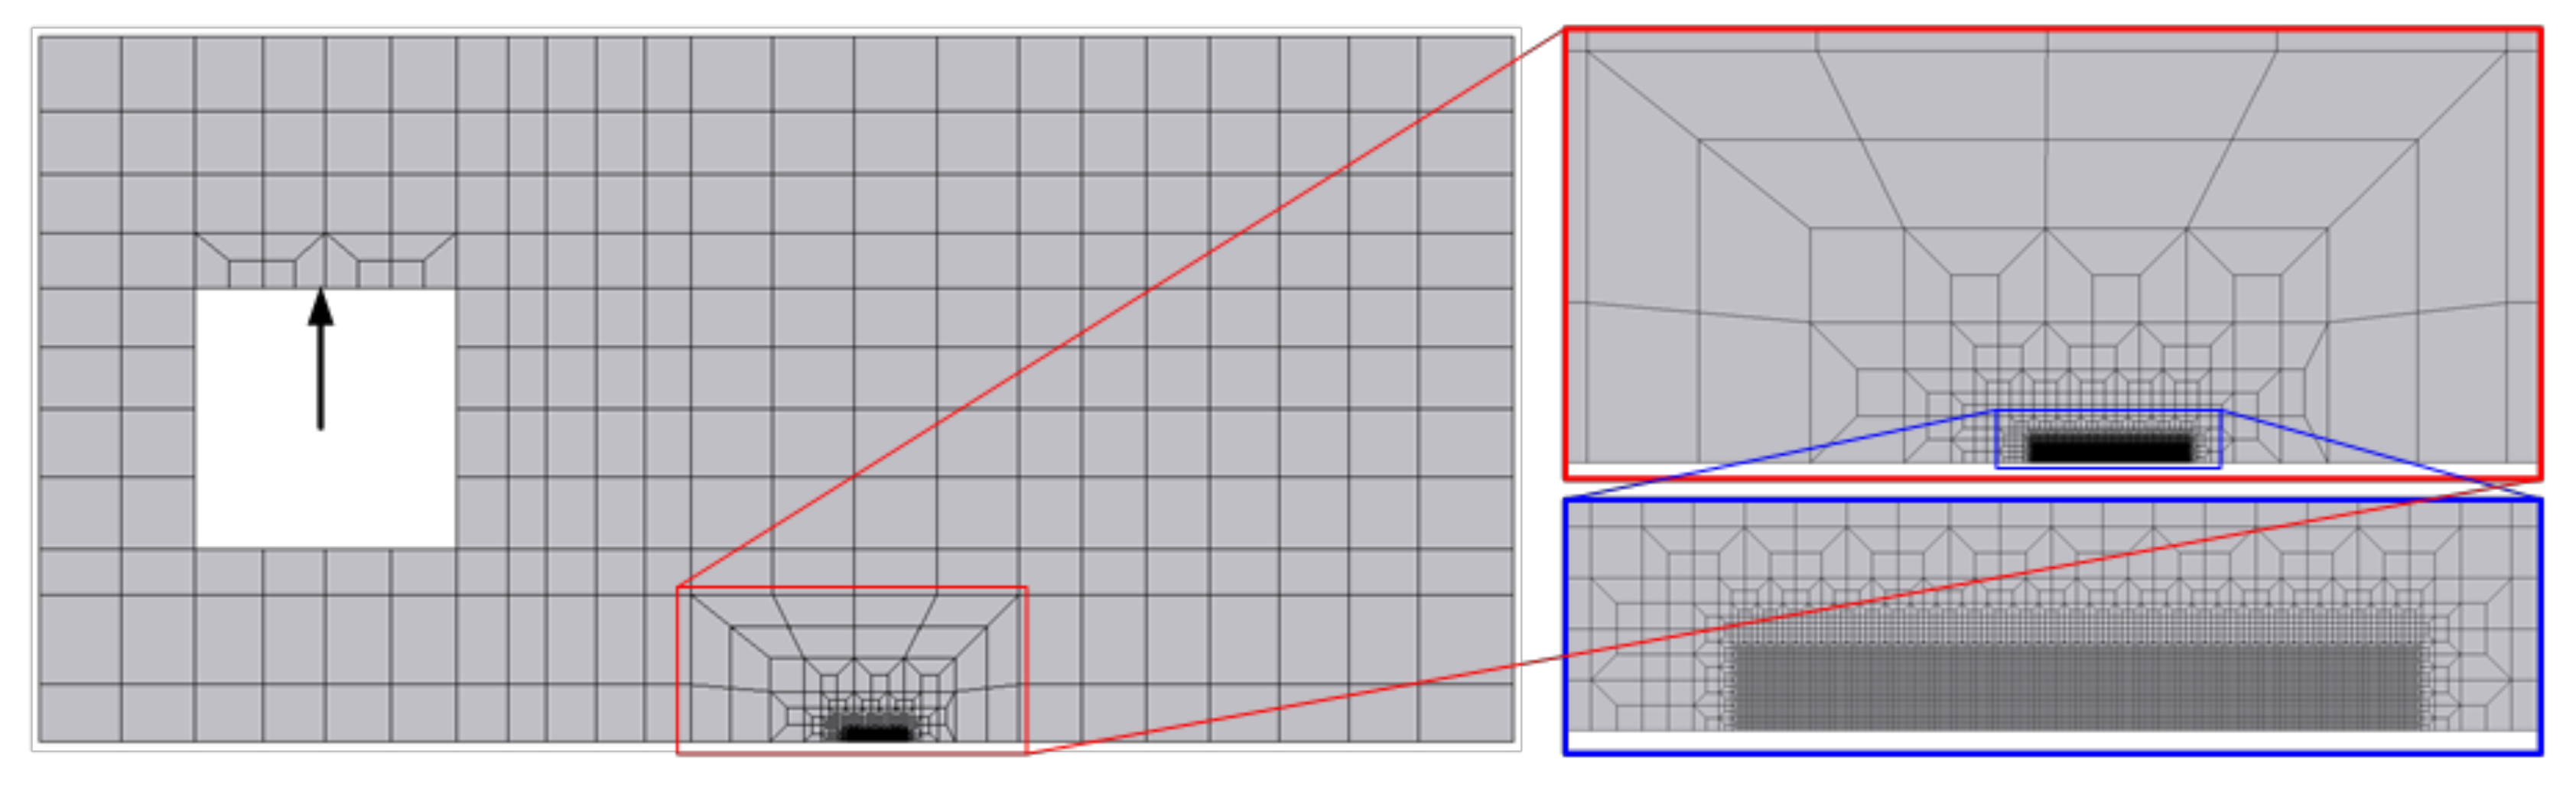
The finite element mesh of the specimen (Figure 2) is composed by three distinct zones: a very refined area near the crack tip, a transition zone, and a coarser mesh in the far side of the crack zone. The more refined zone considers a rectangular box with elements of 8 × 8, allowing an accurate prediction of the stress and strain fields at the crack tip zone [37]. On the other hand, the coarser zone allows to reduce the computational cost. In the end 7287 linear hexahedral finite elements and 14,918 nodes were used.
2.3. Loading Case and Propagation Criterion
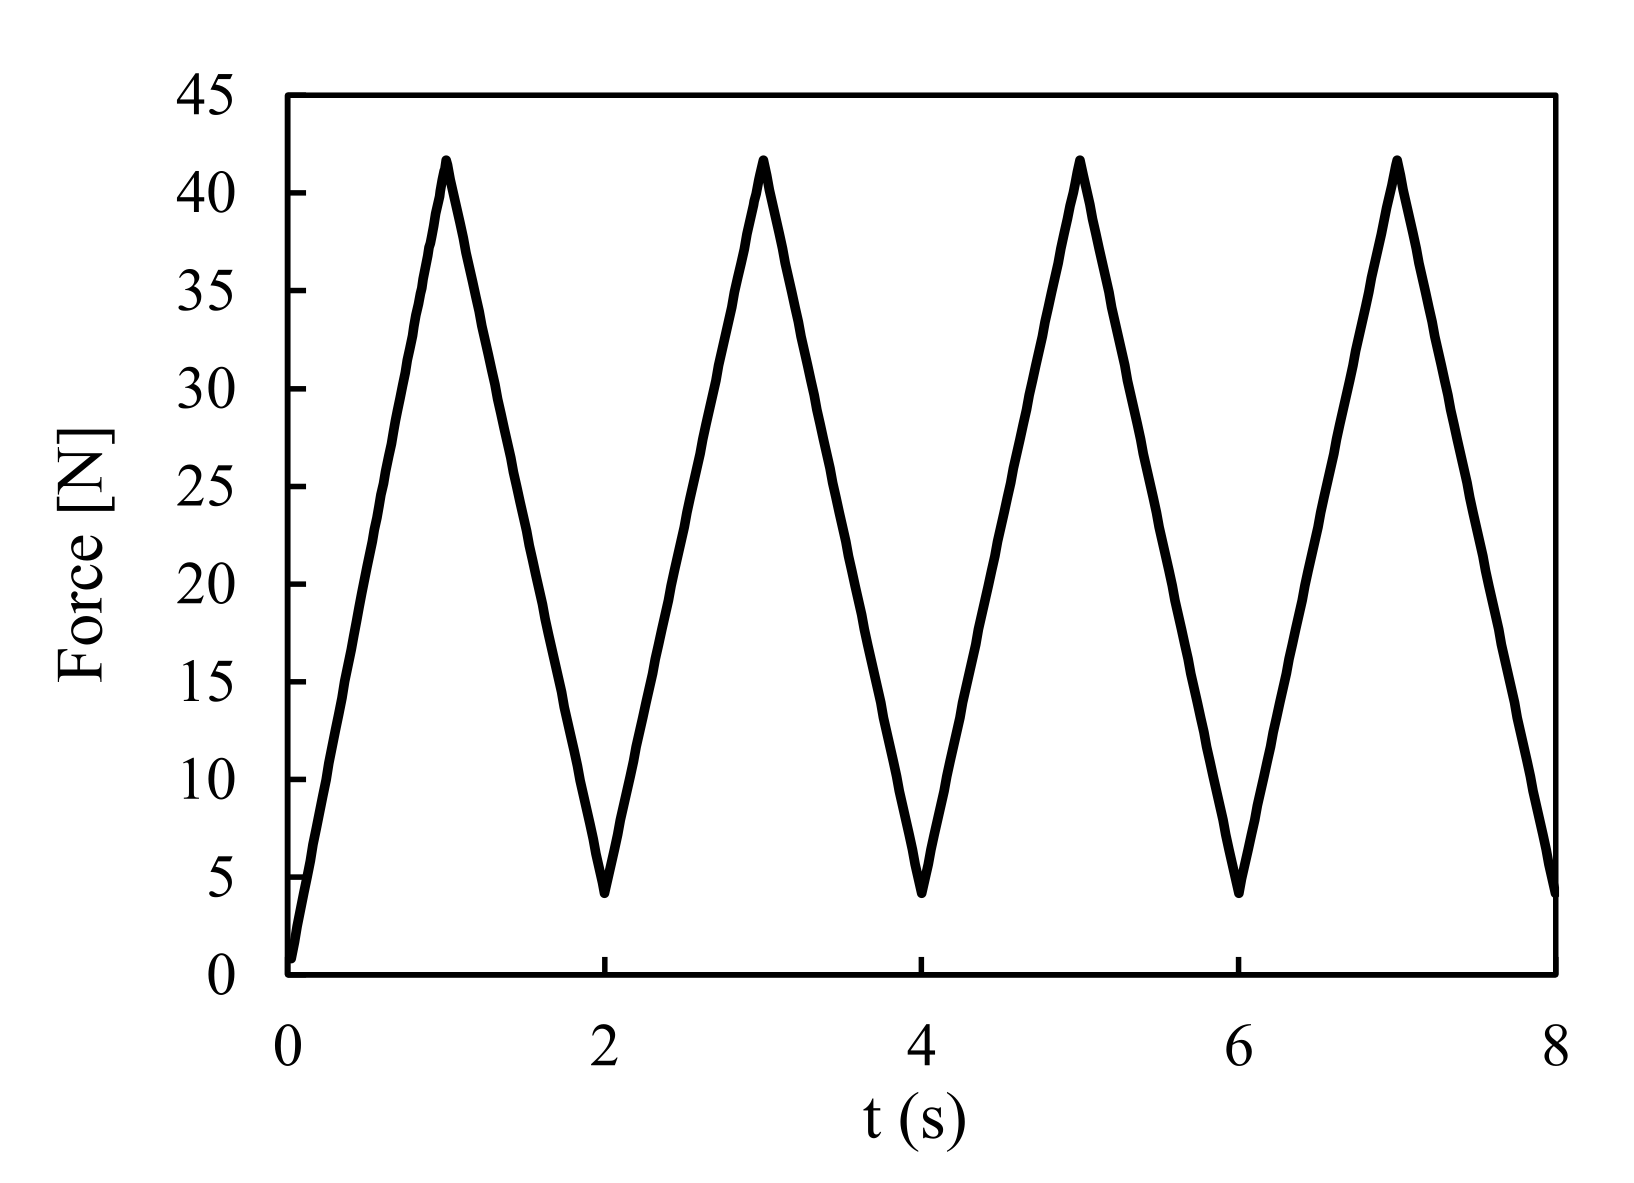
The CT specimen is loaded, in mode I, with constant amplitude load cycles, which vary between a minimum force of 4.17 N (Fmin = 4.17 N) and a maximum force of 41.67 N (Fmax = 41.67 N). This leads to a stress ratio of 0.1 (R = 0.1). Some load cycles are presented, in terms of the pseudo-time in Figure 3, highlighting the triangular load pattern.
During loading, the crack path arises in the symmetry plane of the CT specimen. The advance of the crack is simulated through successive node releases, according to the proposed numerical model. The discretization of the crack path leads to a discrete crack growth, as each increment represents the size of an 8 μm element. When the equivalent plastic strain, evaluated at the node containing the crack tip, reaches a critical value,, which based on a prior study [3] was set to be 110% (), the node is released. Thus, the predicted FCG rate is obtained from the ratio between the crack increment (8 μm) and the number of load cycles, ΔN, required to reach the critical value of plastic strain
Note that the numerical model follows a total plastic strain (TPS) strategy. This means that the plastic strain, and porosity, accumulated in the previous load cycles, at a certain node are not reset when a propagation occurs.
2.4. GTN Model
2.4.1. Gurson’s Damage Model
Gurson firstly proposed a yield potential for porous material, which was derived using micro-mechanical assumptions, by performing an upper bound limit load analysis to a representative volume element (RVE) containing a spherical void [38]. The plastic potential of the initial Gurson’s model is given by [39]
where denotes the trace of the stress tensor and denotes the flow stress in the matrix material which is defined in terms of the effective plastic strain, using the Swift law (Equation (1)). The yield potential for the porous material was described in terms of the void volume fraction, , which represents the ratio between the volume of the void and the volume of the RVE () [20]. Alternatively, it can be described in terms of the volume of the material ()
While the matrix was assumed to be free of voids and obey the pressure insensitive von Mises criteria, Gurson’s surface, by assuming a flow rule, depends on the hydrostatic stress [27]. This plastic flow rule is expressed by [40]
where the plastic strain rate tensor, , involves two terms: the deviatoric, , and volumetric, , plastic strains. is the entity matrix, is the plastic multiplier and the hydrostatic-pressure.
Finally, the evolution law for the void volume fraction is given by
2.4.2. Tvergaard and Needleman Contributions
From Gurson’s yield function, the complete loss of load carrying capacity occurs at = 1, which is unrealistically larger than experimental observations [41]. This way, adjustments to the initial yield surface were proposed by Tvergaard [42,43] to better represent the material response predicted by numerical cell studies [44]. The plastic potential is therefore given by
where ,, and are designated void interaction parameters, as they adjust Gurson’s yield surface to account for the influence of neighboring voids.
In Gurson’s criteria the mechanisms of ductile fracture are modeled by explicitly monitoring the void volume fraction. However, no void volume fraction evolution would be predicted if the initial void ratio were zero, because nucleation was not considered in the original model. Moreover, Gurson stated that plastic dilatation requires that some porosity must be present. In its absence, porosity can sometimes be nucleated during straining at second phases in a ductile matrix or at grain boundary misfits [38]. Several mechanisms were proposed to modify the model to consider void nucleation, depending on strain history [45]. This way the effective porosity, , was expressed by the sum of nucleation, , and growth, , components
Chu and Needleman [46] proposed the most widely used nucleation law, which considers nucleation in a statistical way, following a normal distribution. This process could be driven either by plastic strain or hydrostatic pressure [47]. However, at low temperature the nucleation of voids is dominated by plastic strain [48]. Therefore, one only considered the plastic strain controlled void nucleation, which is given by
where is the nucleation amplitude, i.e., the maximum fraction of porosity that can be nucleated, driven by plastic strain, is the mean nucleation strain, the standard deviation of the normal distribution.
The coalescence process is disabled in the numerical model. The node release occurs when plastic strain reaches a critical value. Thus, the plastic damage is accounted only for the strength loss of the material due to porosity build-up.
In summary, the seven active parameters of the GTN model are: , , , , and . The initial values for these parameters were set considering the standard values for the Tvergaard parameters, the initial porosity was set to 0.01 as a first approximation. The variation on the parameters were made through the possible range of values found on existing bibliography [20,49].
3. Results and Discussion
This section presents the results attained by varying each one of the considered parameters of the GTN model. The da/dN effects are analyzed and the reasons leading to the obtained results are discussed.
3.1. Effect of Initial Void Volume Fraction, f0
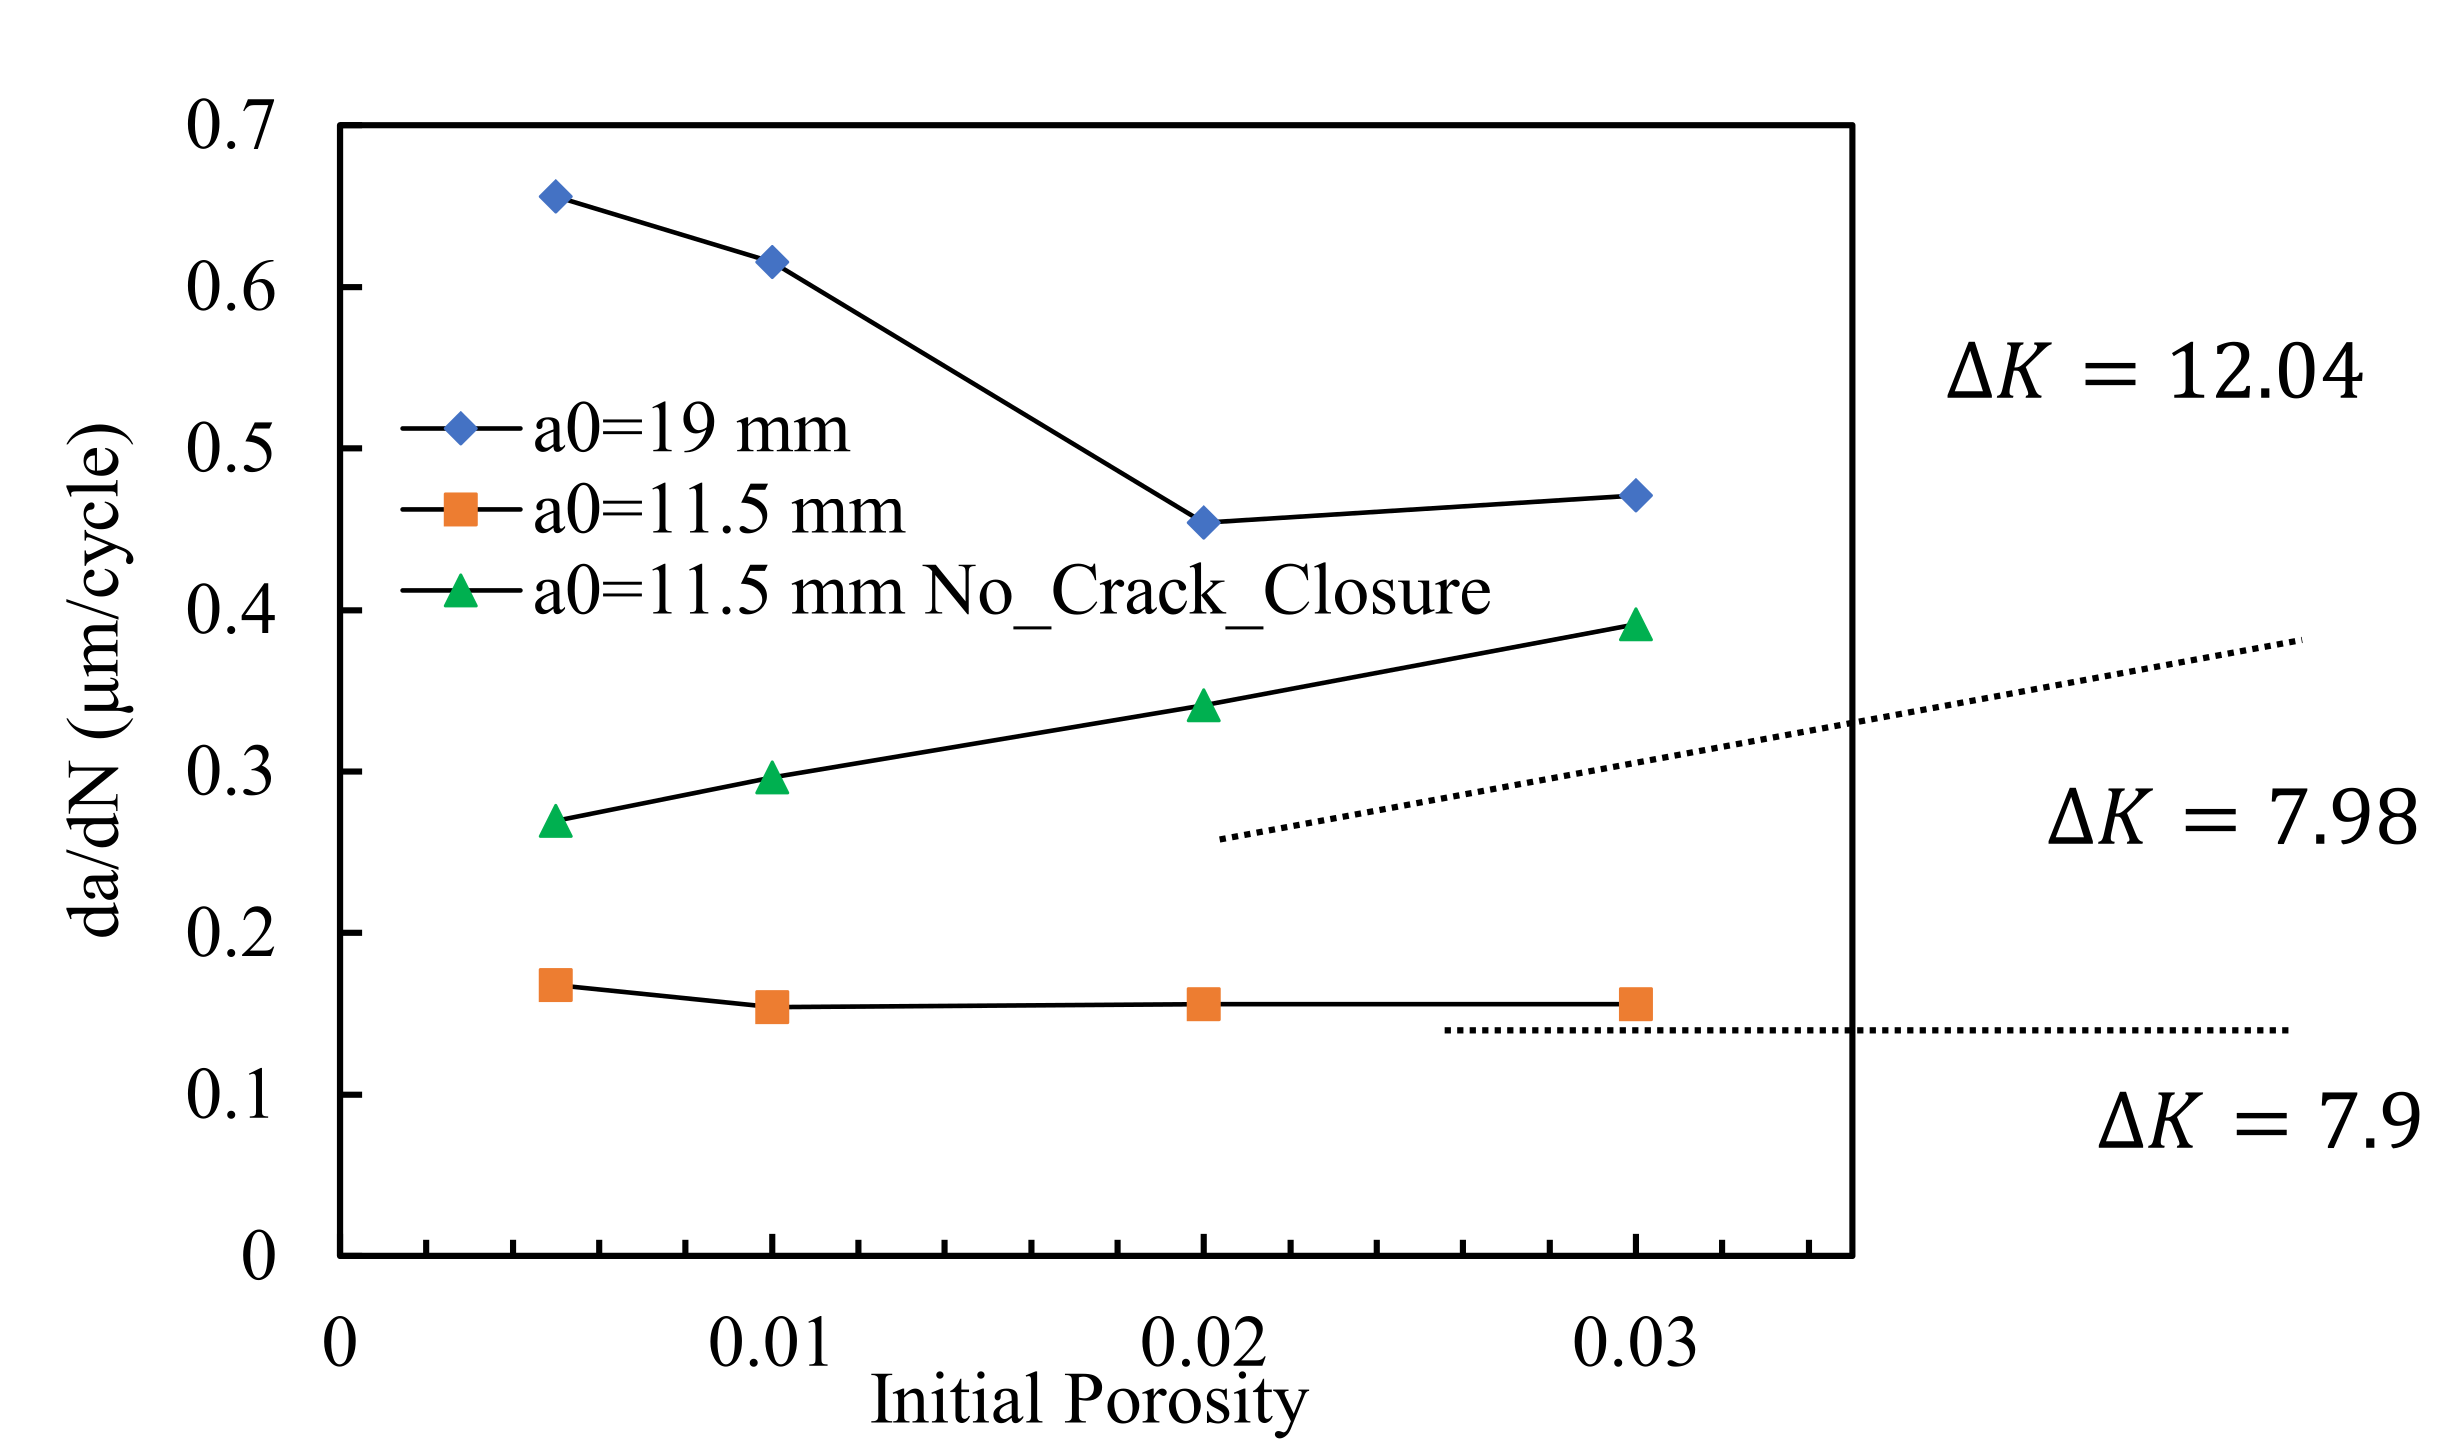
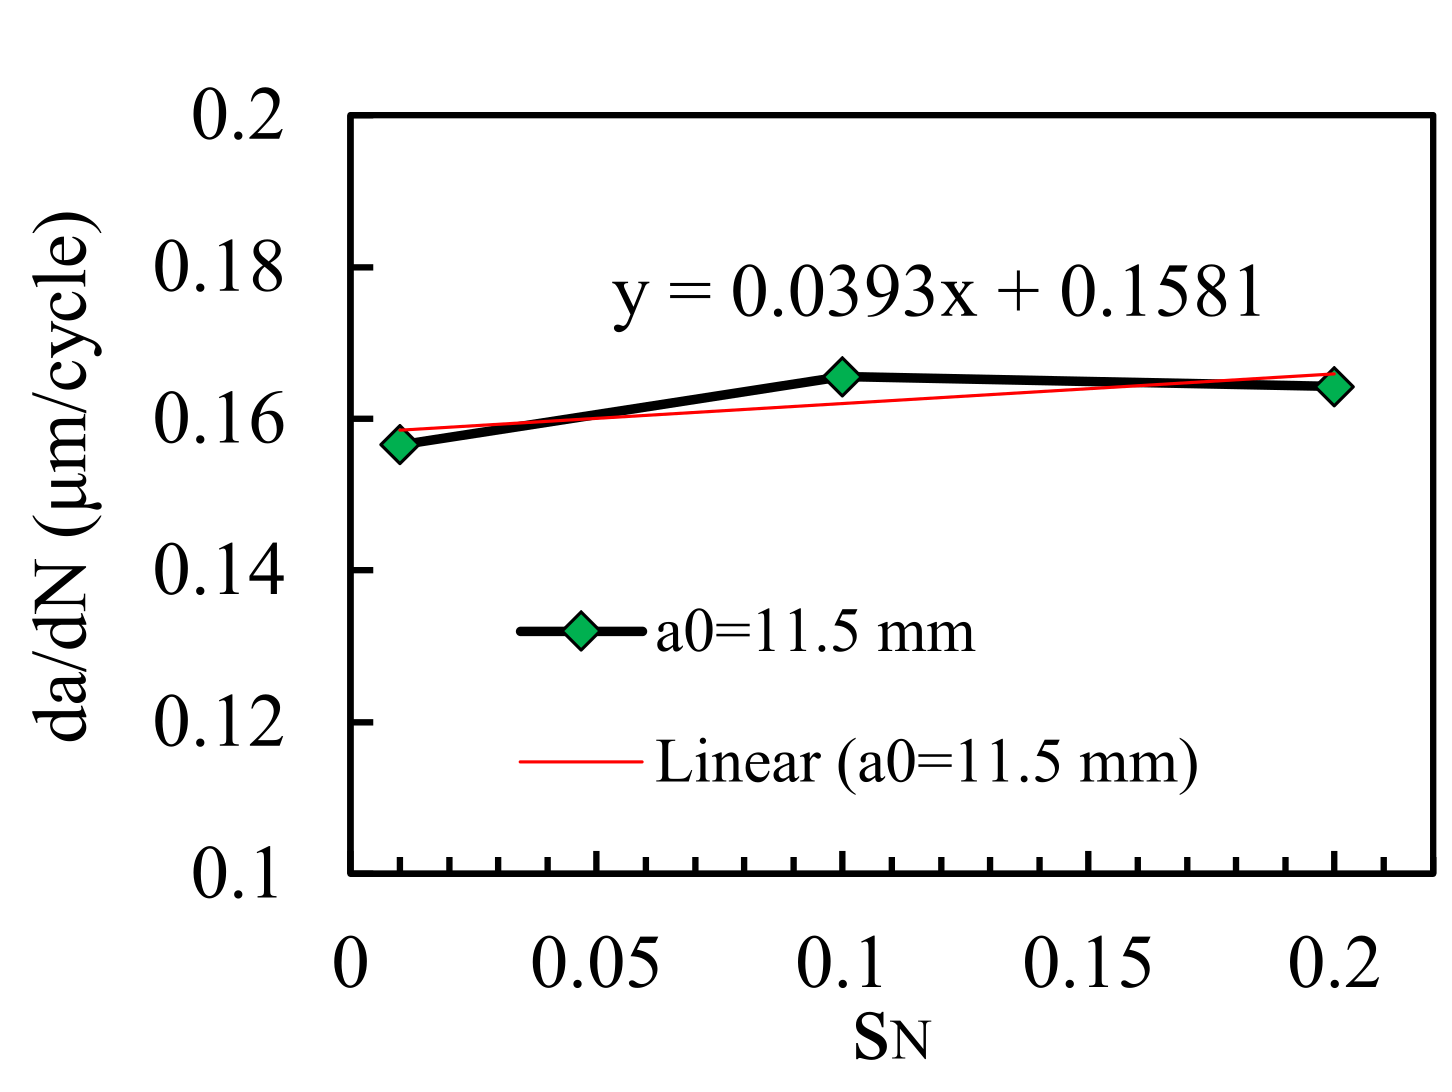
The initial void volume fraction, , represents the fraction of the volume of material, in terms of cells, that a priori, is composed by voids. Note that assuming a not null imposes the existence of defects innate to the material. Moreover, if the nucleation process is disabled, as it is the case, the damage evolution is represented only by the growth of the pre-existing micro-voids. The primordial step to understand the influence of the different GTN parameters on the porosity, plastic strain and, consequentially, fatigue crack growth rate, is to understand the effect of the pre-existing voids. This way, da/dN was studied for two different crack lengths: a0 = 11.5 mm and a0 = 19 mm. Note that these values will lead to different ΔK values. Figure 4 shows the da/dN values, in natural scales, for the two initial crack lengths in terms of four different initial porosities: 0.005, 0.01, 0.02, and 0.03. All the values were obtained regarding the same propagation, at the stable FCG zone, i.e., after the initial transient regime associated with the stabilization of cyclic plastic deformation and formation of residual plastic wake. For a0 = 19 mm there is a clear influence of the initial porosity on the da/dN. Moreover, it was expected that a higher initial porosity would lead to higher plastic strain levels, and this way, higher propagation rates. However, the results follow the opposite trend—i.e., for lower initial porosities the propagation rate is higher—stabilizing for higher levels of porosity as show by the horizontal dotted line. A similar trend is followed for a0 = 11.5 mm. The lower initial porosity also leads to a higher da/dN, however, in this case the difference is much smaller. The stabilization in da/dN also occurs sooner. Crack closure was disabled for a0 = 11.5 mm to identify the effect of this mechanism on da/dN. The contact between the flanks of the crack is modeled considering a rigid plane surface aligned with the crack symmetry plane. By disabling the contact between the crack flank and this plane surface, crack closure is disabled. Results show that in the absence of crack closure the da/dN rises, in an approximately linear fashion with , as the dotted line indicates. However, as the authors believe that crack closure is a crucial mechanism in FCG, it will be kept on the following parameters.
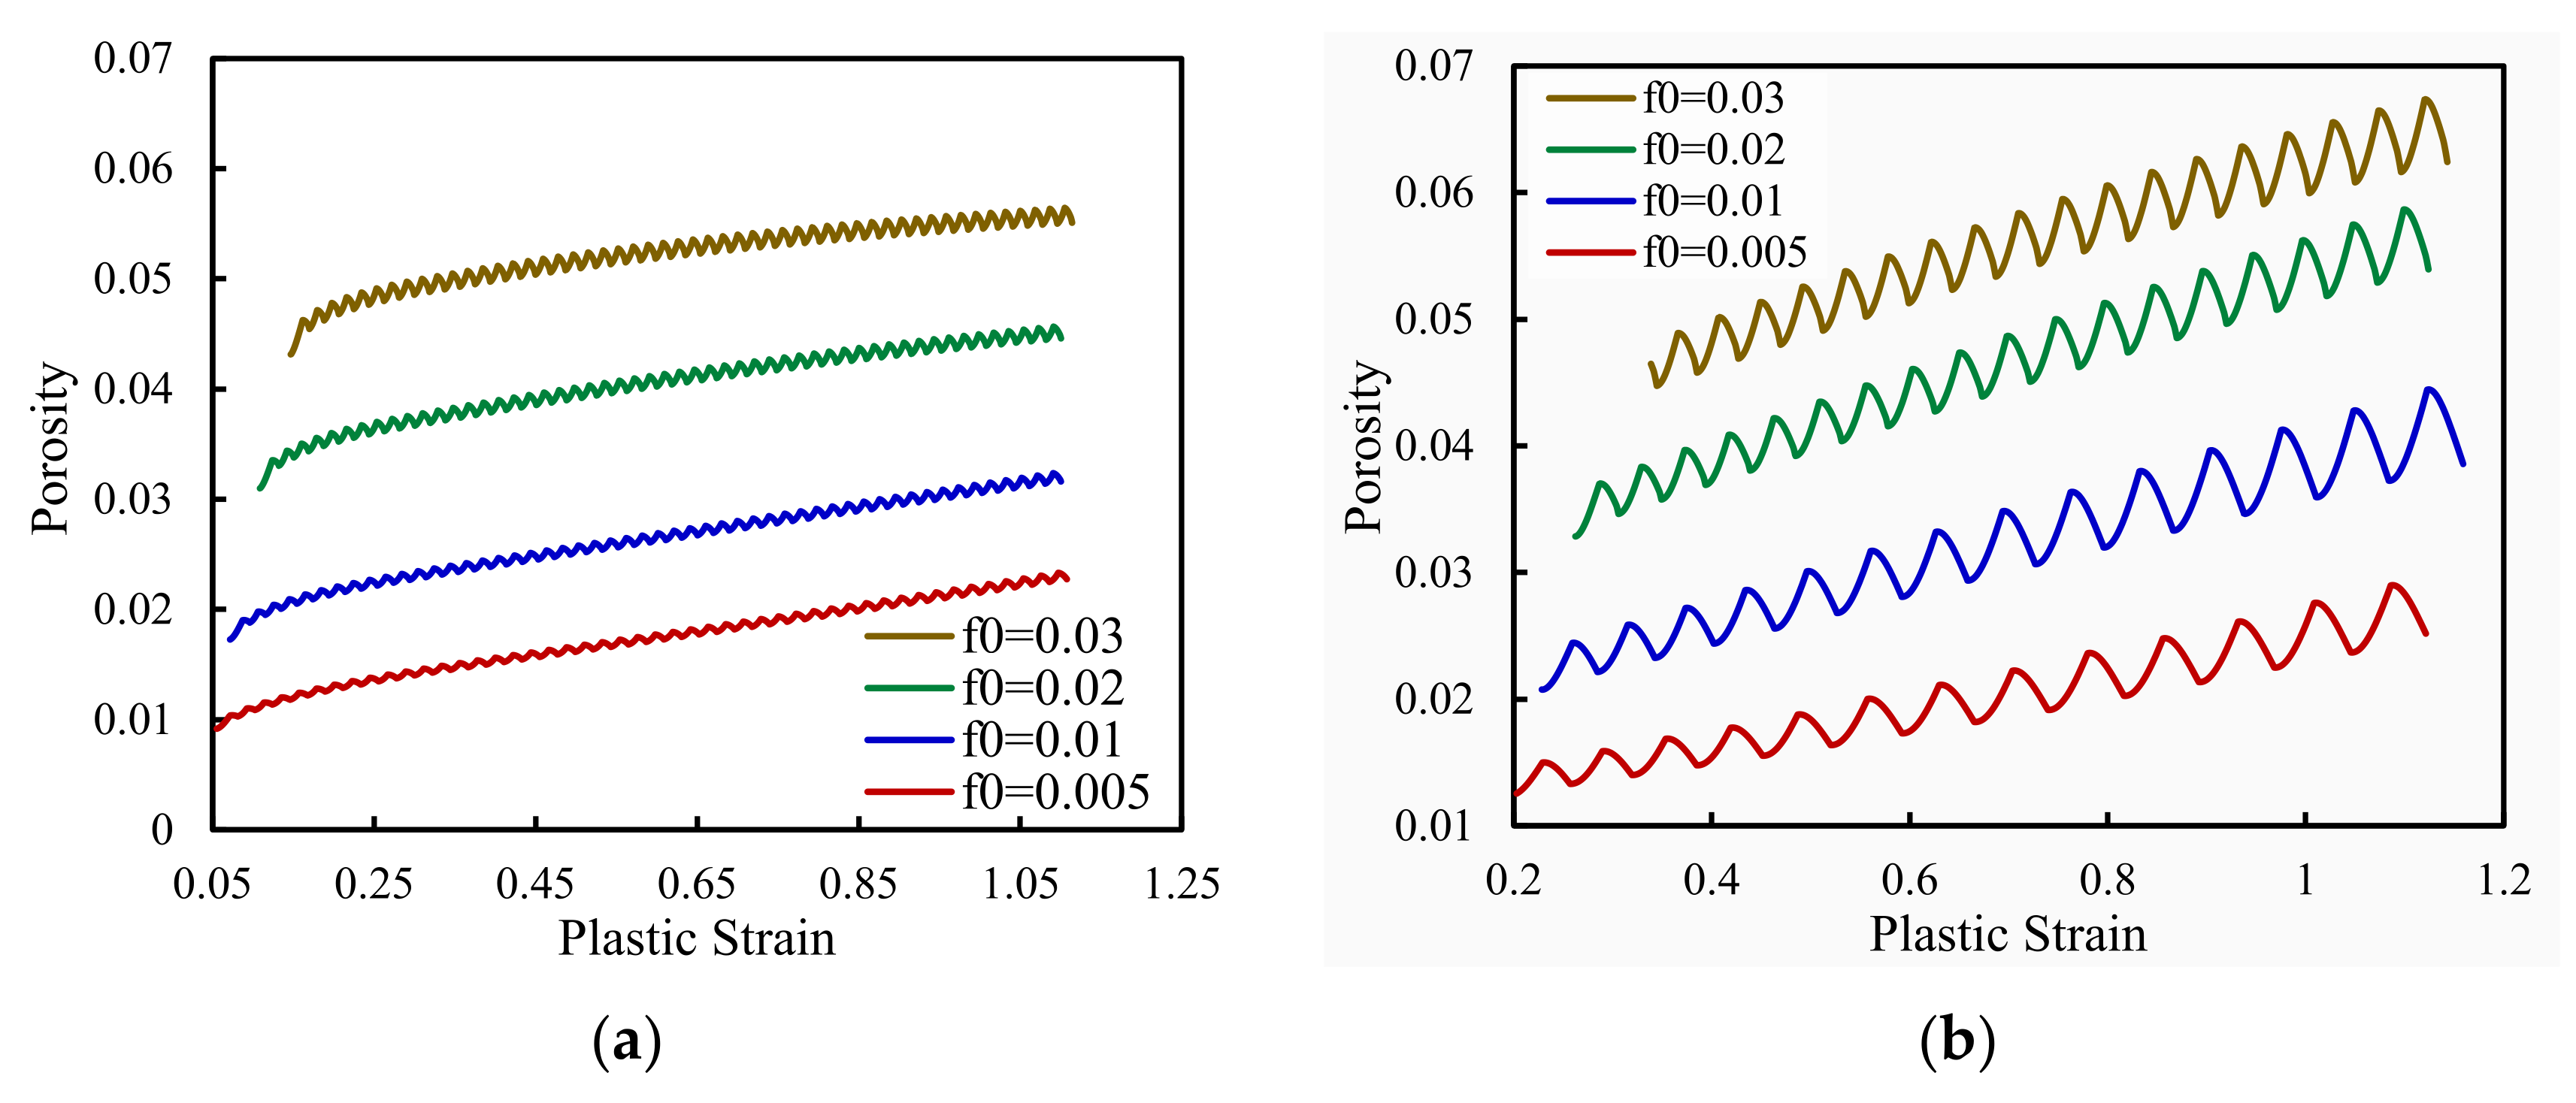
To explain the unexpected behaviour observed in Figure 4, the porosity evolution was studied, in terms of the plastic strain build-up through the load cycles between the 24th and 25th propagation, for all the porosity values on the two distinct crack lengths. Note that plastic strain is the driving force of porosity accumulation. Also, porosity will always present an oscillating behaviour, because during the unloading phase of each loading cycle the stress verified at the crack tip is of compressive nature. This stress causes the partially close of the micro voids on the material. One should note that the micro-cavities do not disappear as the plastic damage is of irreversible character. Figure 5a shows the referred results for a0 = 11.5 mm while Figure 5b presents analogous data, but for a0 = 19 mm. As expected, Figure 5a shows that the porosity, at the beginning of a propagation, rises with . On the other hand, the slope of the curves is slightly higher for lower values of since some saturation occurs for and . These last results were not expected, the initial increase on porosity is higher for these initial porosity values, but on the latter part of the propagation the void growth mechanism saturates. For a0 = 19 mm the porosity at the beginning of the propagation also rises with the initial porosity. However, note that the trends followed for the different values of are opposite to the ones verified for a0 = 11.5 mm: here higher values of initial porosity led to higher porosity accumulation rates during the propagation. Thus, two conclusions may be drawn. Firstly, somehow the initial porosity affects the growth of the micro-voids. Secondly, no saturation occurs for this initial crack length, thus, it must be due to the higher levels of ΔK at the crack tip. Additionally, the porosity variations between the two stages of the load cycles are much more relevant for a0 = 19 mm and the slopes are higher for this crack length too, which is also explainable due to the higher ΔK. Finally, even if higher values of lead to higher porosity levels, for both crack lengths, as it was expected, the distance between the curves is not proportional to the difference between the initial porosities. Thus, other mechanisms need to be involved in the process.
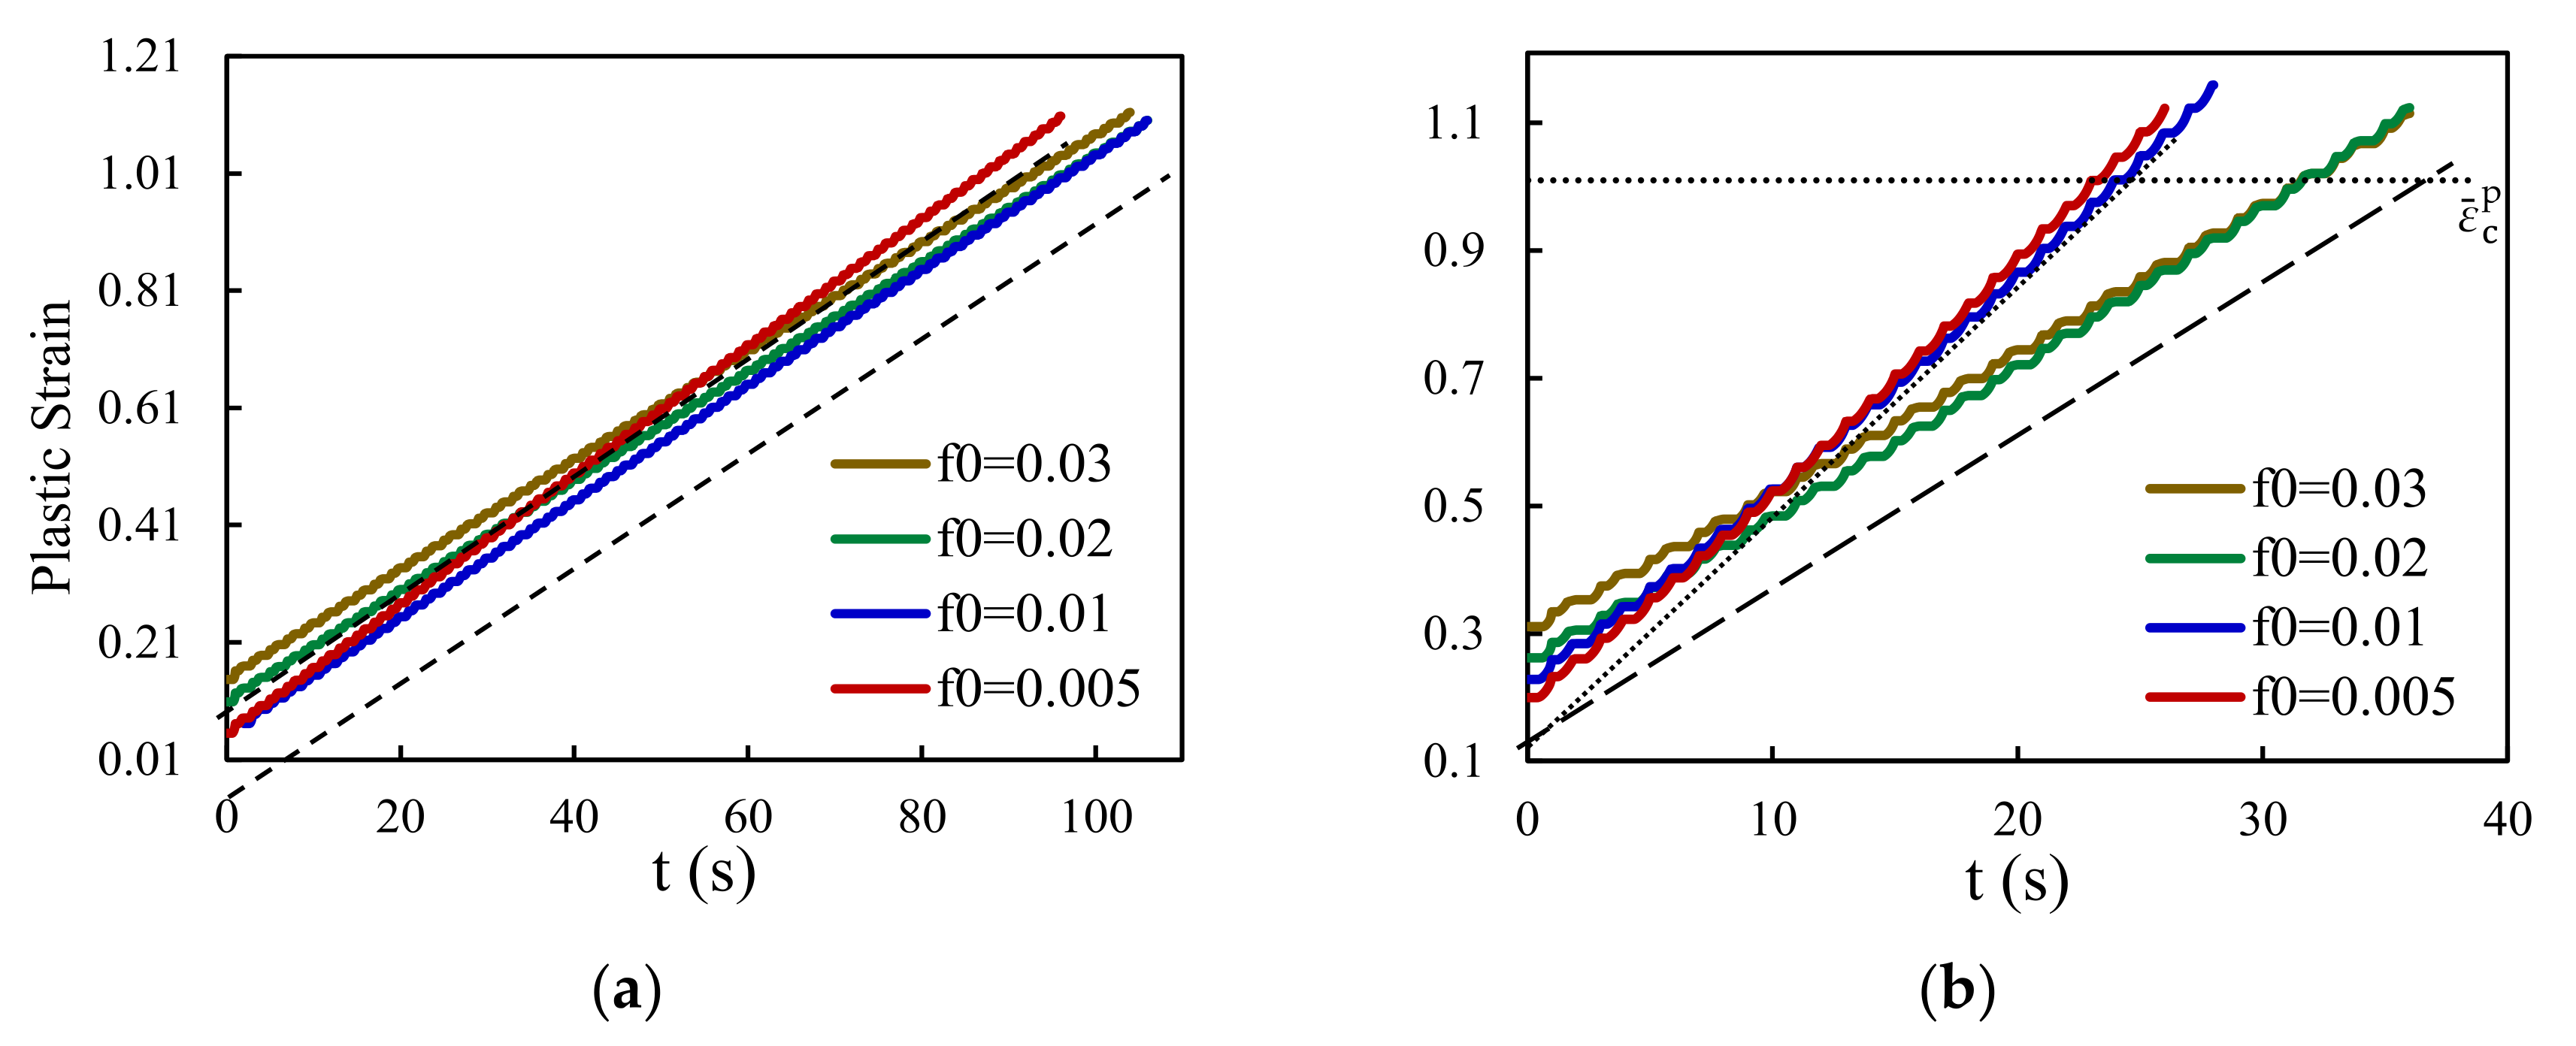
The evolution of the porosity is directly influenced by the material parameters adopted in the GTN model. However, the numerical model considers plastic strain to determine the crack propagation. Thus, this is the entity to be studied to explain the da/dN values shown previously. Figure 6 presents the plastic strain build-up in terms of pseudo-time. Note that the instants presented on the scale are relative to the beginning of the new propagation, the time was reset to allow the comparison of the 25th propagation, which due to the da/dN differences occurs at different instants of the simulation. Results are shown in natural scales. Again, Figure 6a is relative to a0 = 11.5 mm and Figure 6b to a0 = 19 mm. For the first initial crack length, plastic strain grows inside a narrow band, delimited by the traced lines, which explains the similar results of da/dN for the different values of . Note that for the lower initial porosity the plastic strain accumulation is slightly faster, departing from the linear trend followed by the other curves, which is in accordance with the da/dN results. Additionally higher values result in higher plastic strains at the beginning of the propagation, which agrees with the porosity outcomes. For a0 = 19 mm the plastic strain at the beginning of the propagation also rises with , however, overall, it is much higher for this initial crack length. The porosity levels are distinct for both initial crack lengths due to ΔK. Curves can be grouped in two groups: and , which result in a faster, slightly not linear, accumulation, in agreement with the faster da/dN; and lead to a slower, linear, plastic strain build-ups, and propagation rates. The da/dN results are, this way, well explained. However, explaining the plastic strain trends is the major challenge as it will close the questions loop.
Crack closure is usually able to explain the trends followed by the plastic strain. Consequently, an analysis analogous to the ones discussed previously was performed at the node immediately behind the crack tip. Crack closure was evaluated through the following equation:
where Fopen is the crack opening load, Fmin is the minimum load and Fmax is the maximum load. This parameter quantifies the fraction of load cycle during which the crack is closed.
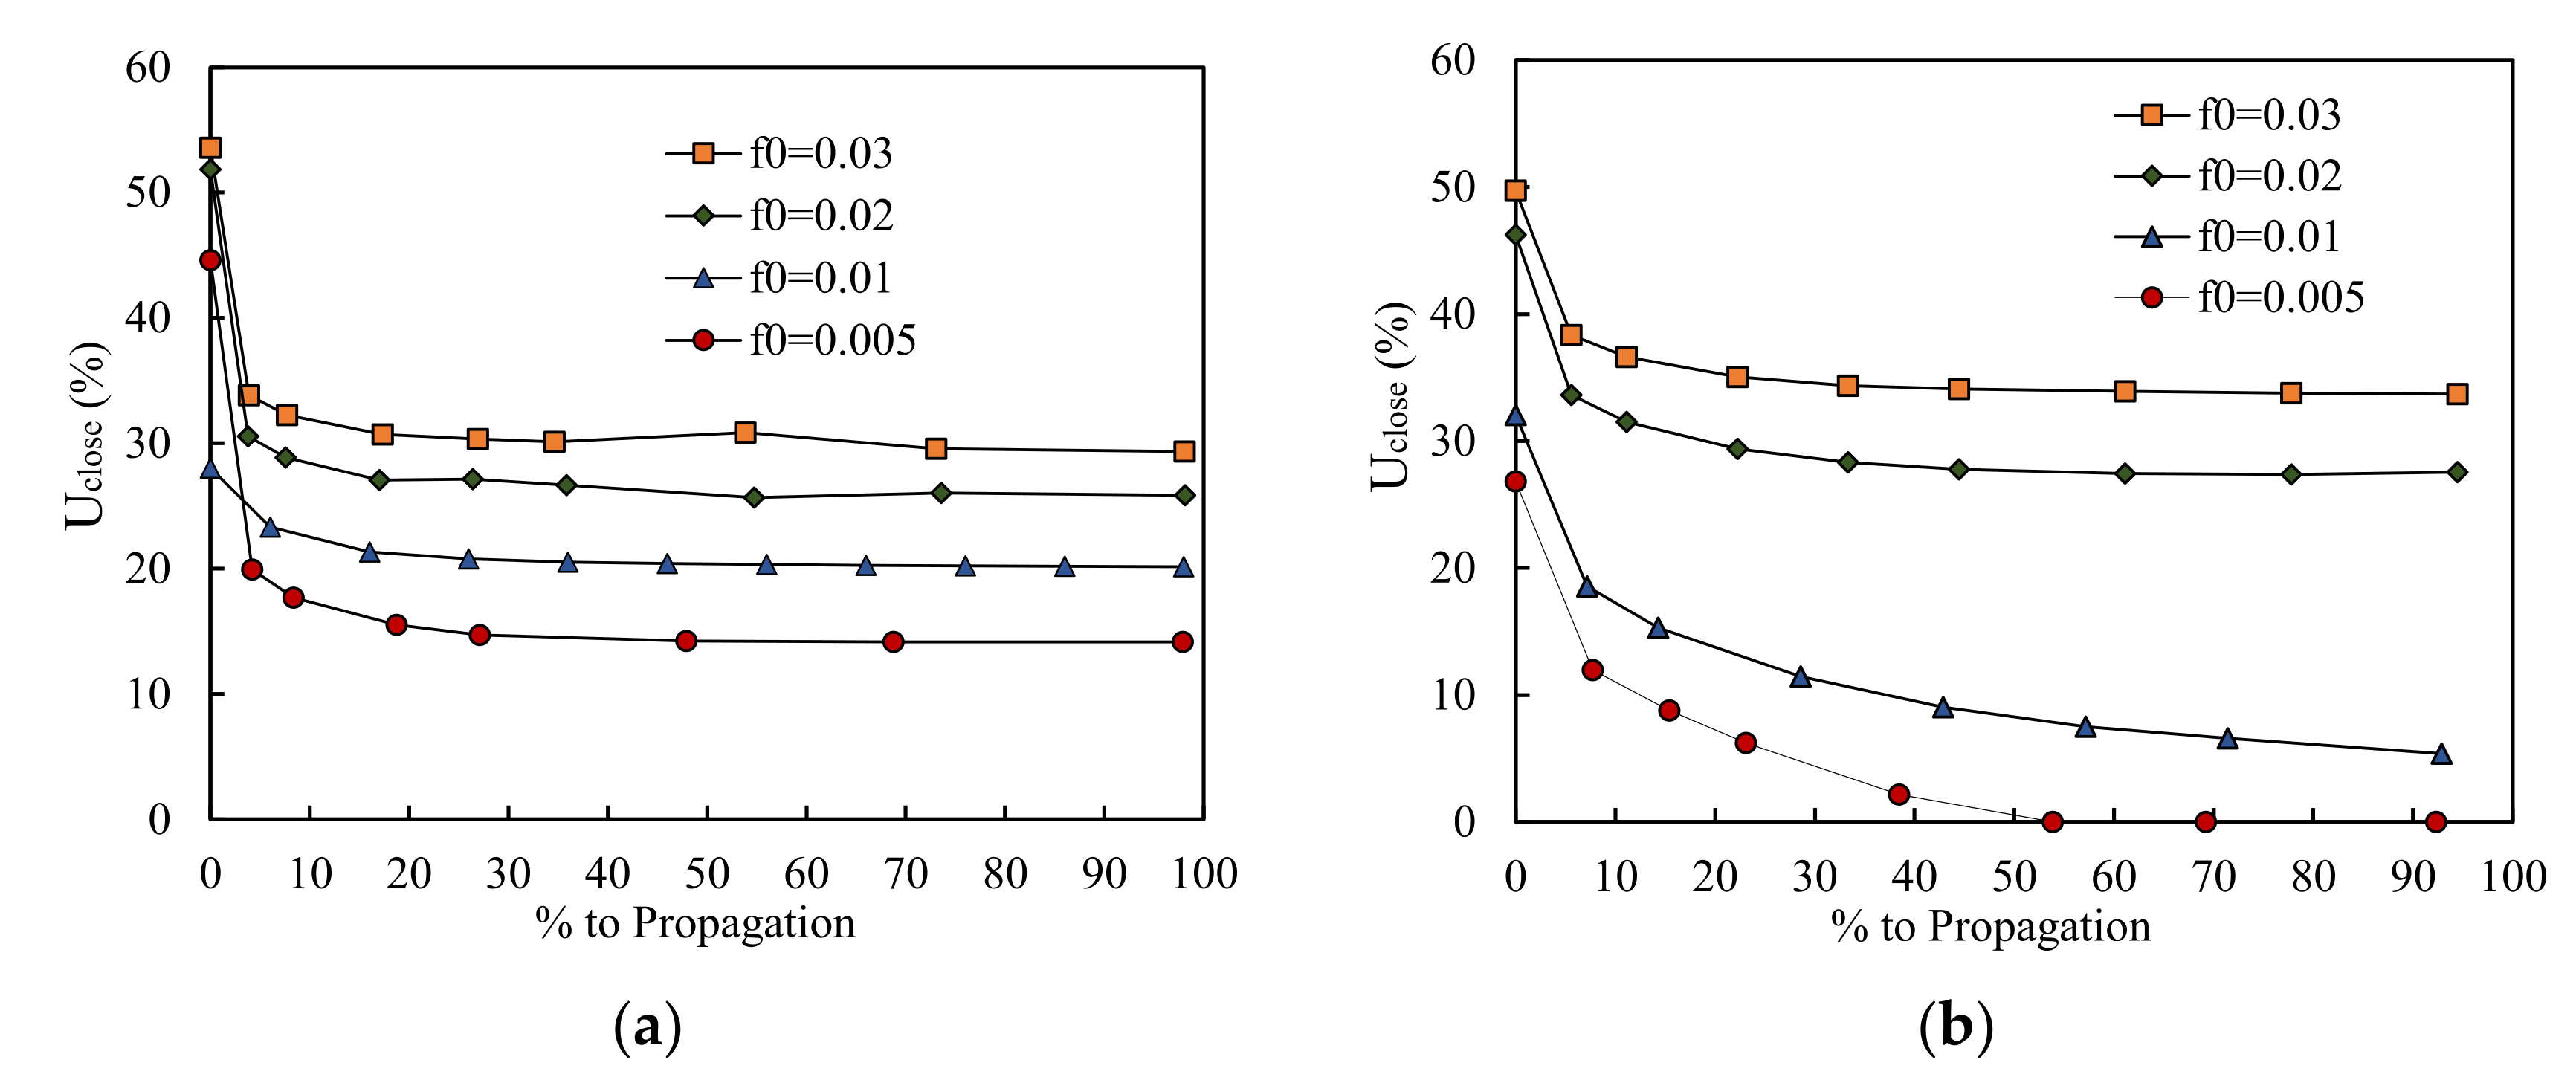
Figure 7a presents the crack closure for a0 = 11.5 mm while Figure 7b refers to a0 = 19 mm. Crack closure is evaluated as a function of propagation percentage. This scale is preferential to pseudo time, in this case, because all curves begin and end at the same point, improving the comparison between them. At 0% the accumulation begins and at 100% node release occurs. For a0 = 11.5 mm the crack closure trend is different for each value of explaining the also alike accumulations of plastic strain. Thus, higher porosities and higher plastic strains generate higher levels of crack closure, which protects the material from the lower mechanical resistance conferred by the higher porosity, levelling the plastic strain accumulation. The lower level of crack closure for results in a faster plastic strain build-up and consequentially a higher da/dN. In the case of a0 = 19 mm the same grouping, performed for plastic strain, can be made. The two lowest values of suffer smaller deformations inducing lower levels of crack closure. Strain ratcheting also occurs disabling the stabilization of crack closure. This allows a faster accumulation of plastic strain, especially for , where crack closure completely ceases, explaining the higher propagation rates. The second group, with higher values, has a much higher crack closure. Consequentially the plastic strain accumulation is delayed resulting in lower levels of da/dN. The obtained propagation rates are, this way, fully explained. Note that for this second group no strain ratcheting occurs. Thus, the disabling of this phenomenon must be related or with the higher or with the higher void growth rate experienced for higher values of .
3.2. Effect of the Tvergaard Parameters, q1, q2, and q3
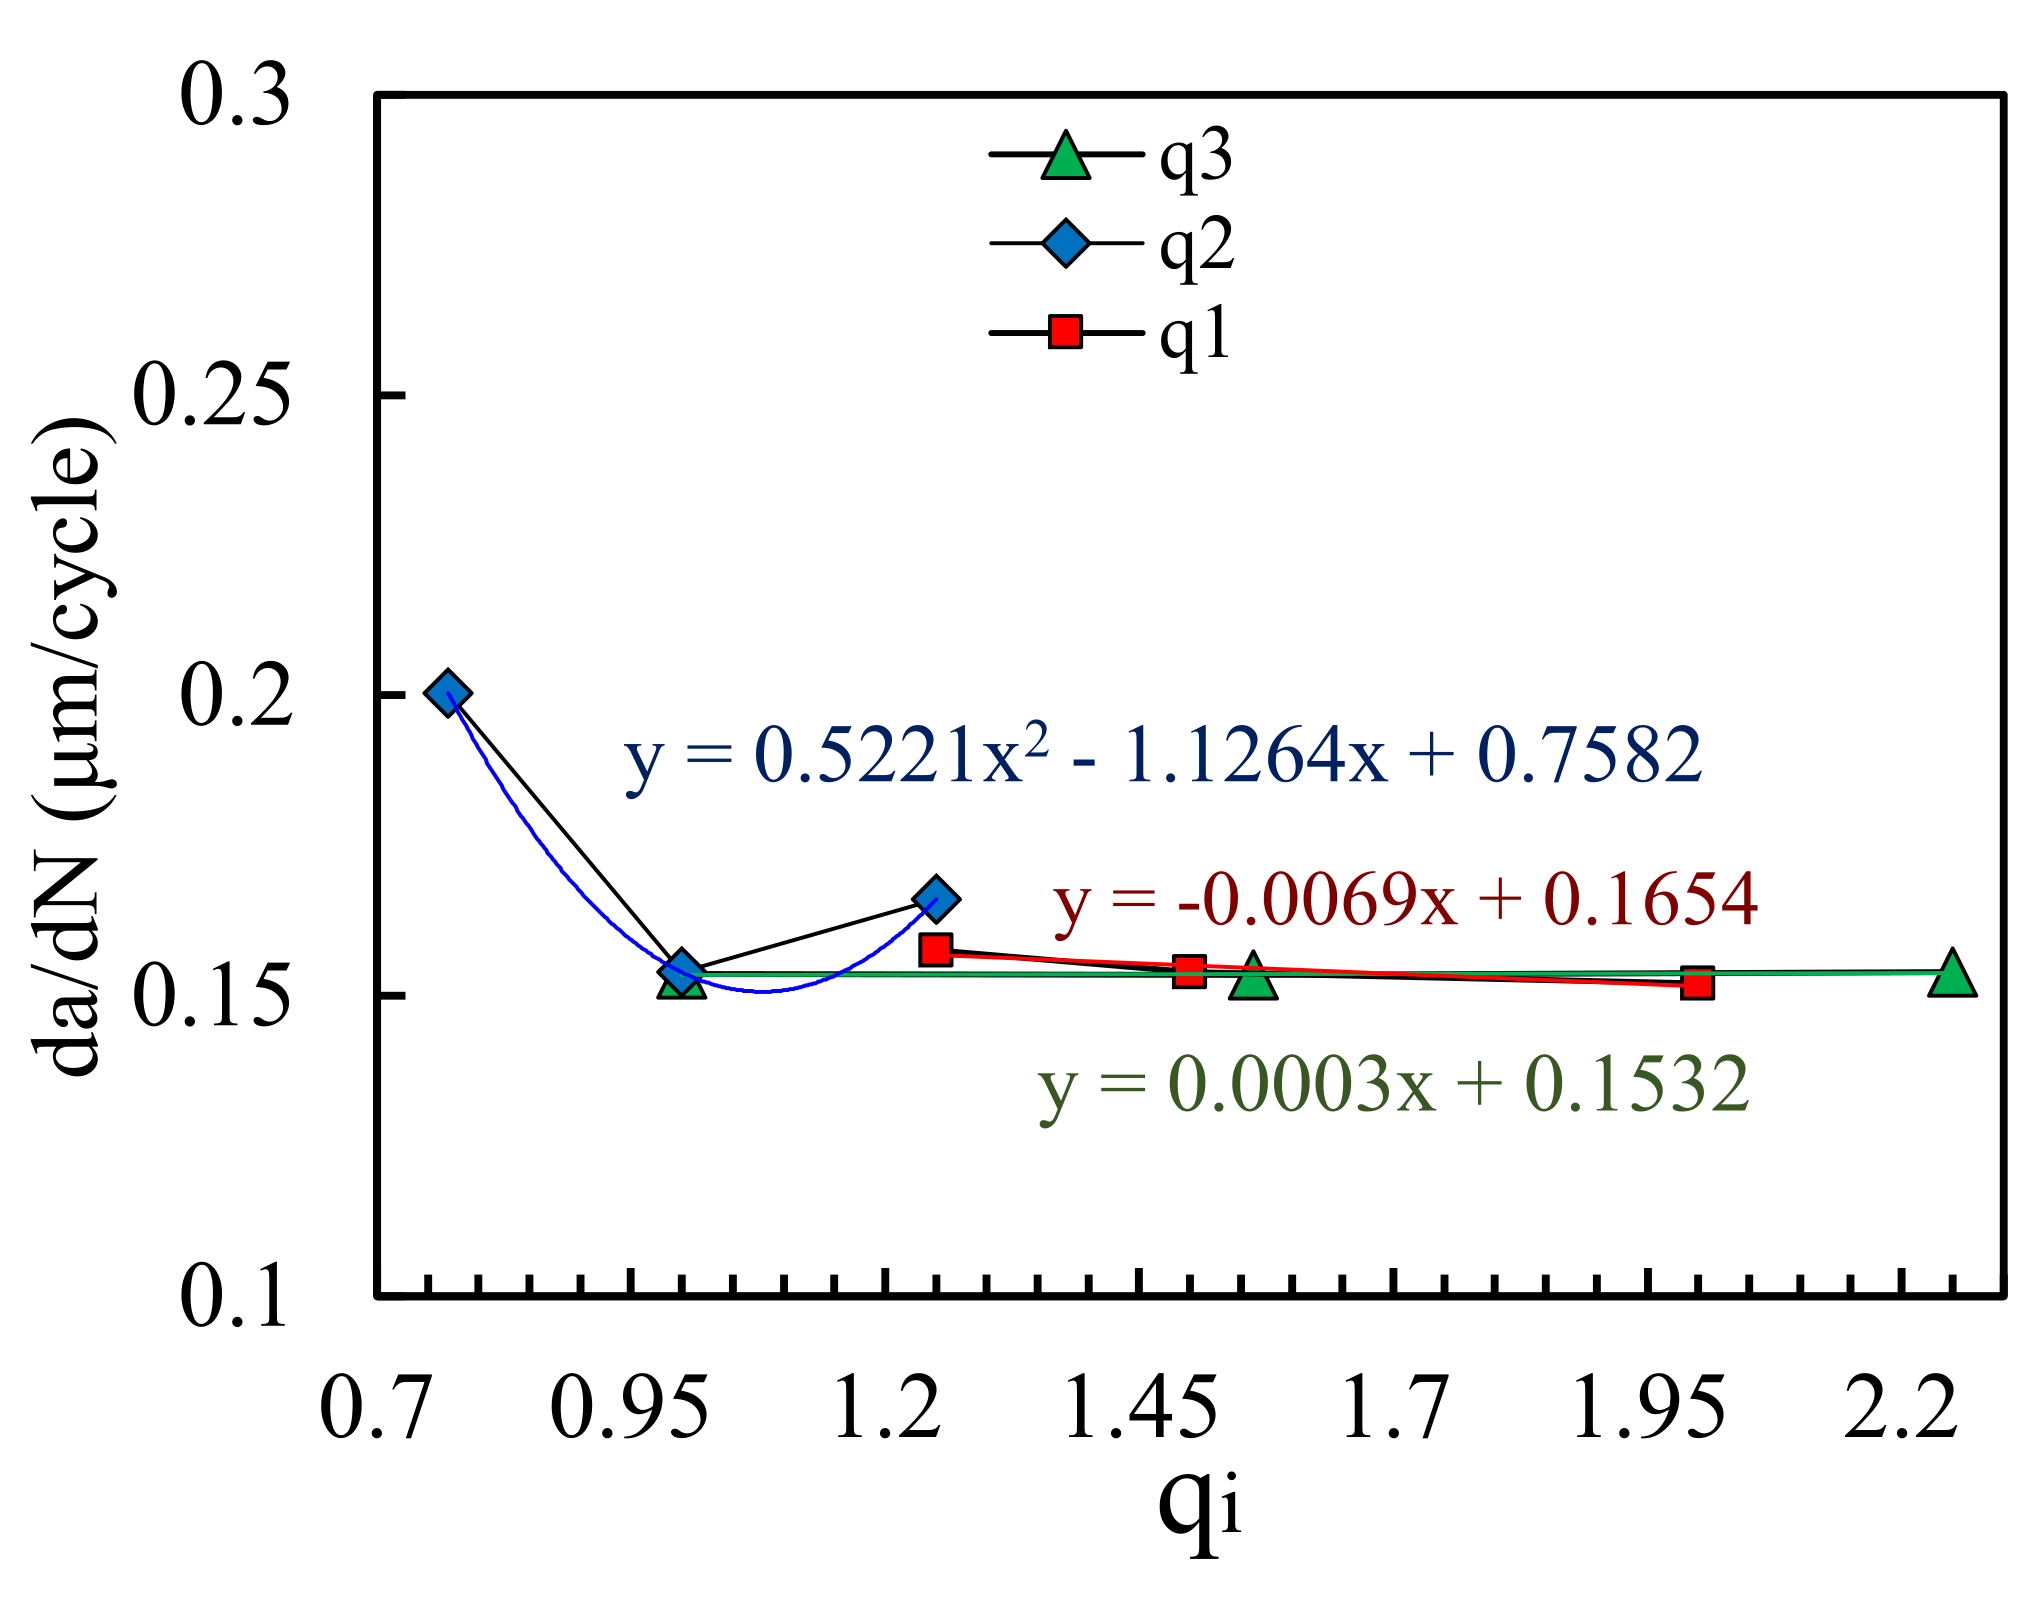
As referred, Tvergaard modified the Gurson’s model to account for micro-void interactions adding three additional parameters: q1, q2, and q3. Each one of these parameters has a specific effect on the growth of micro voids process. q1 accounts for the loss of strength due to the interactions occurring between different voids, q2 and q3 influence the effect of the stress triaxiality and void volume fraction, respectively, on the plastic potential. Tvergaard proposed standard values for these parameters that are widely used (q1 = 1.5, q2 = 1, q3 = 2.25). However, to not disregard the importance of these parameters they were also included in the sensitivity analysis. The effect of these parameters on the predicted da/dN is shown in Figure 8. Each curve represents one of the parameters and the results are presented in natural scales. The loading case is the same applied in the study of .
3.2.1. Analysis of q1
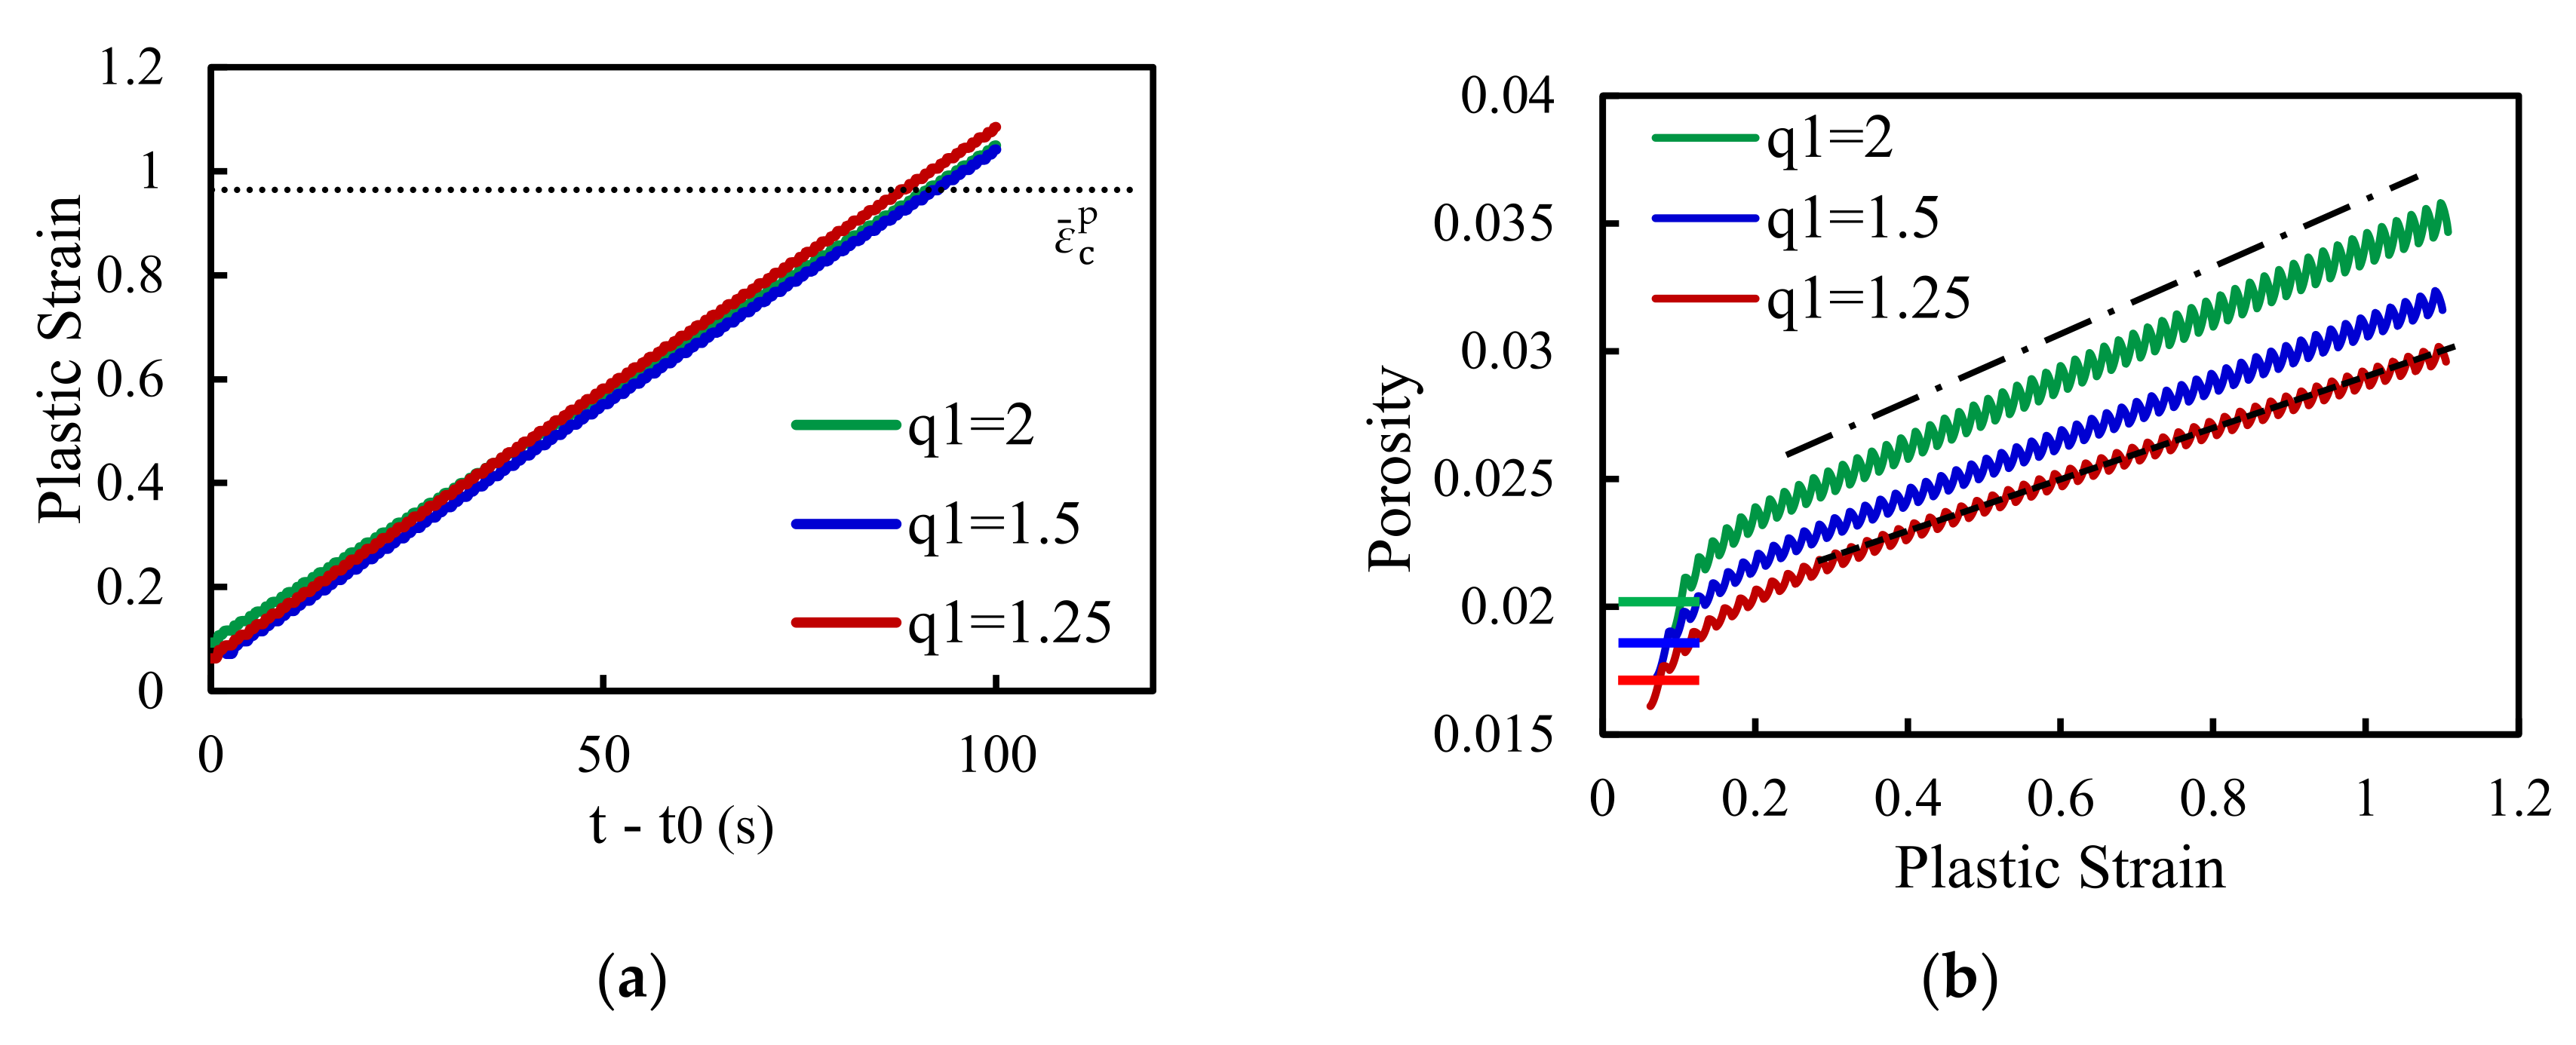
Results presented in Figure 8 show that the variation of q1 has little effect on the FCG rate. The low slope of the trend line is evidence of that. This means that the build-up of plastic strain is similar for all values of q1. This fact does not mean that porosity follows the same trends. These two variables were studied on the node containing the crack tip. Results are presented in Figure 9a, in the case of plastic strain, and Figure 9b, in the case of the porosity. As expected, the plastic strain build ups are almost overlapped, for the three distinct values of q1, explaining the similar da/dN values. In the case of the porosity there is an increase, in the overall porosity level, with q1. This increase in porosity occurs due to two conditions: higher porosities at the beginning of the new accumulation, when the minimum in plastic strain is achieved; and higher slopes of the porosity build-up, during the propagation. Thus, one can conclude that raising q1 results in a harsher loss of strength of the material, which manifests itself by an increase in porosity. However, this effect is not as hard as the one verified for . In the presence of crack closure, the plastic strain build-up ends up being unchanged leading to similar values of da/dN.
3.2.2. Analysis of q2
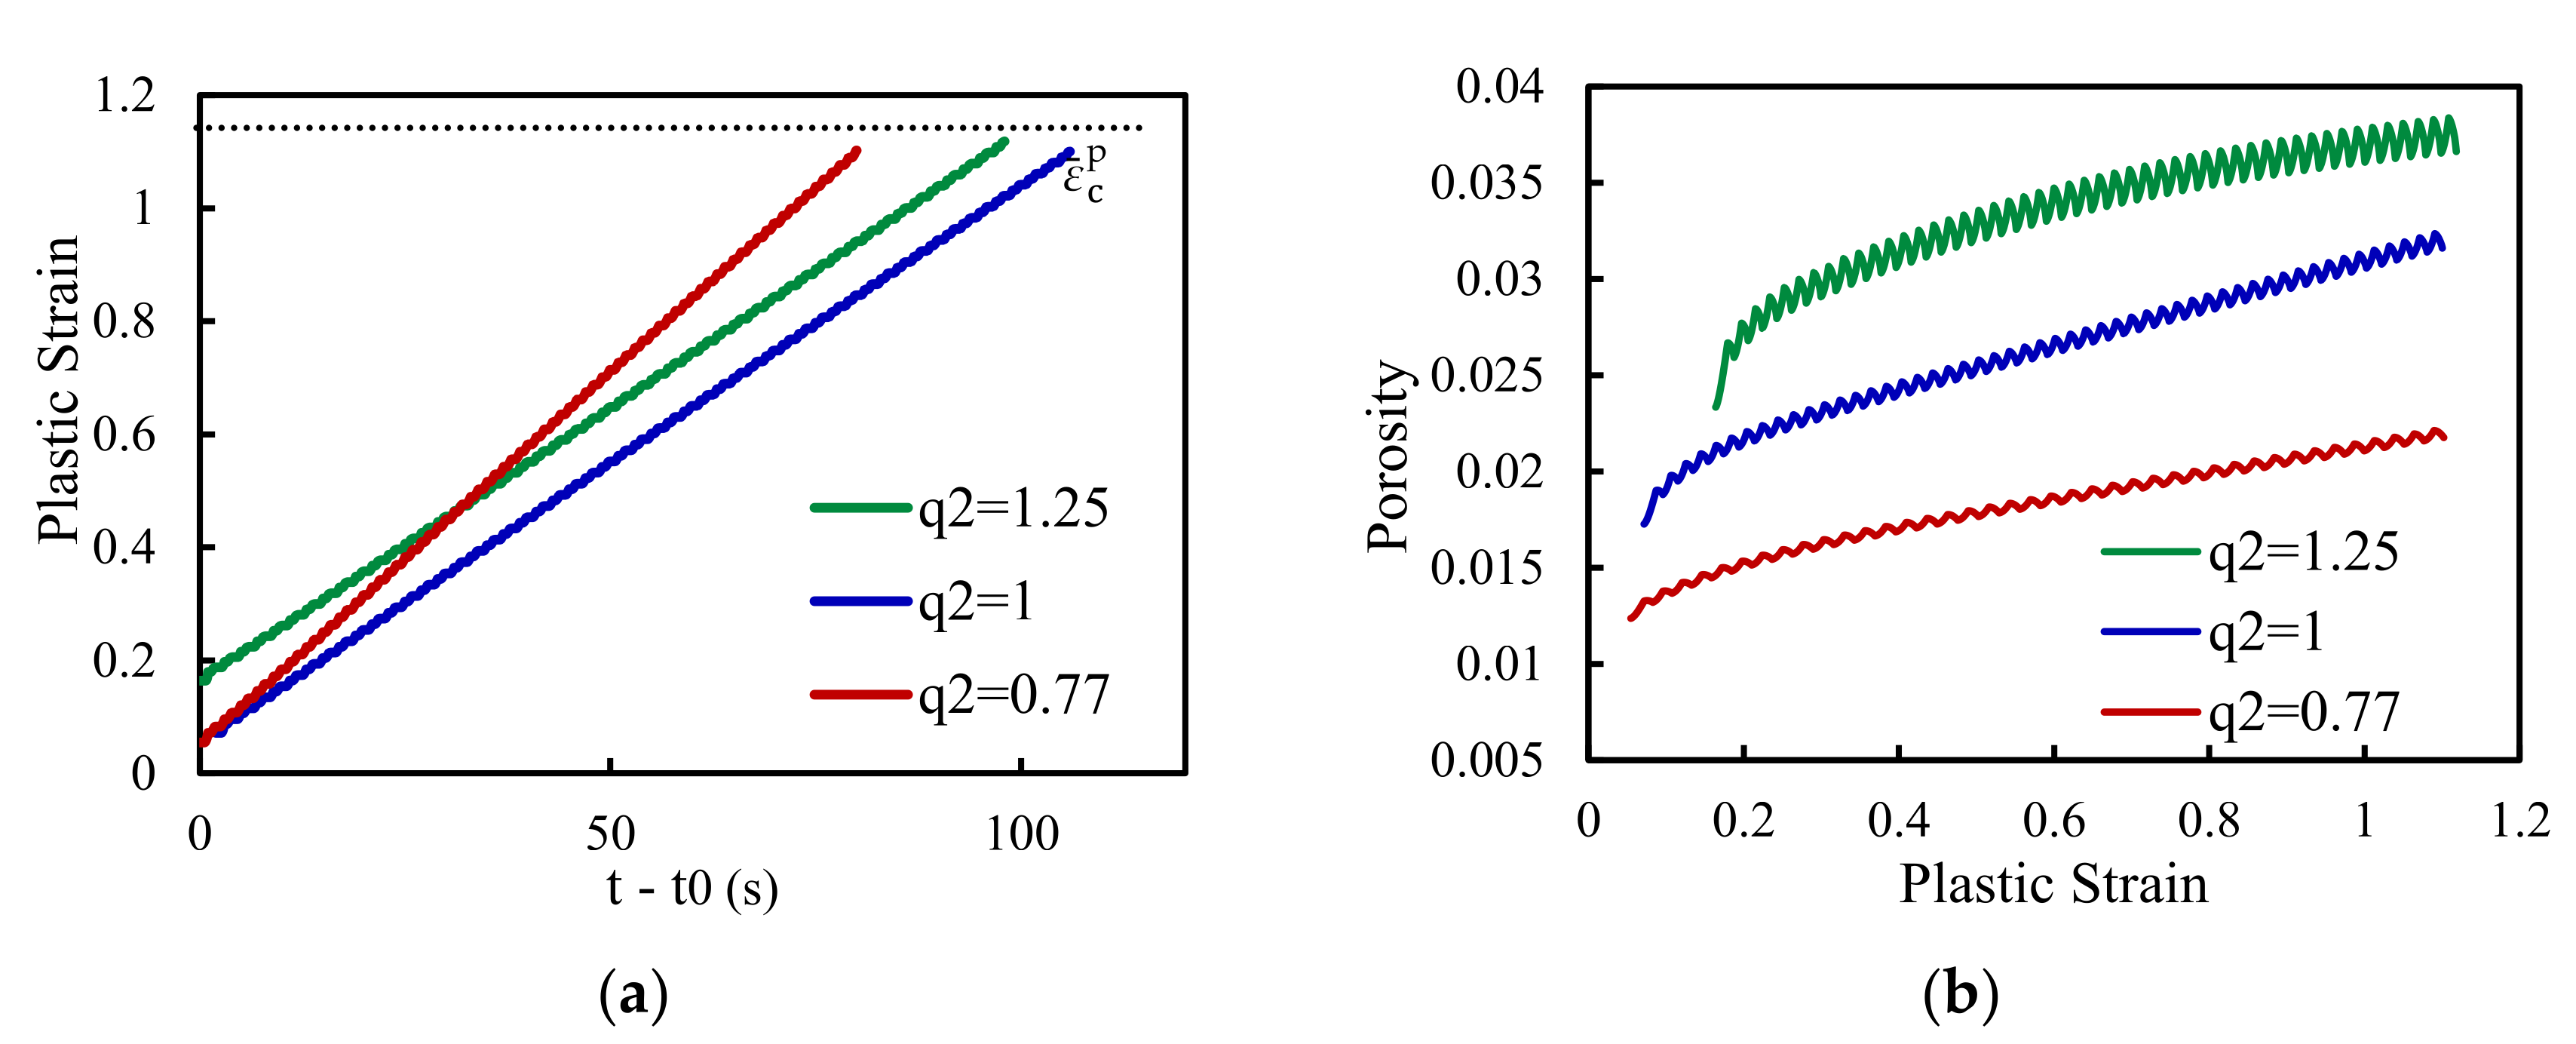
The da/dN values in terms of the three distinct values of q2 parameter (0.77; 1 and 1.25) are shown in Figure 8. There is no linear relation between q2 and da/dN, the higher FCG rate is attained for q2 = 0.77, there is a minimum in the propagation speed for q2 = 1 and then an intermediate value for q2 = 1.25. This trend indicates that another mechanism may be influencing the fatigue crack growth. Empirically, from previous results, one is expecting that crack closure is the responsible for the registered variations. Figure 10a presents the plastic strain accumulation for the studied values of q2. The results agree with the da/dN values and with the expectation that crack closure has a main role in the process. The smaller value of q2 has a lower initial plastic strain, i.e., after the previous propagation occurred. However, the higher plastic strain accumulation rate, evidenced by the higher slope of the respective curve, compensates this fact resulting in the faster propagation rate. Note that for q2 = 1 and q2 = 1.25 the plastic strain accumulation rate is similar, however, as a higher initial plastic strain arises for q2 = 1.25 the da/dN ends up being higher. Figure 10b presents the porosity evolution, with plastic strain, for the previous values of q2. As expected, higher q2 values are translated in higher porosities. However, the relation between the initial plastic strain is not linearly coincident with the initial porosity, i.e., only the higher value of q2 has a higher initial plastic strain. Note that even if the higher porosity leads to the higher initial plastic strain, this entity is very similar for the remaining values of q2, despite the notorious difference in the porosity level. Overall, the porosity trends are similar: there is a harsher initial increase followed by a linear evolution with a lower slope. The slopes are alike for the different q2 values being the initial disparity preserved during the propagation. Thus, one can conclude that higher values of q2 result in higher values of porosity, but not necessarily higher da/dN.
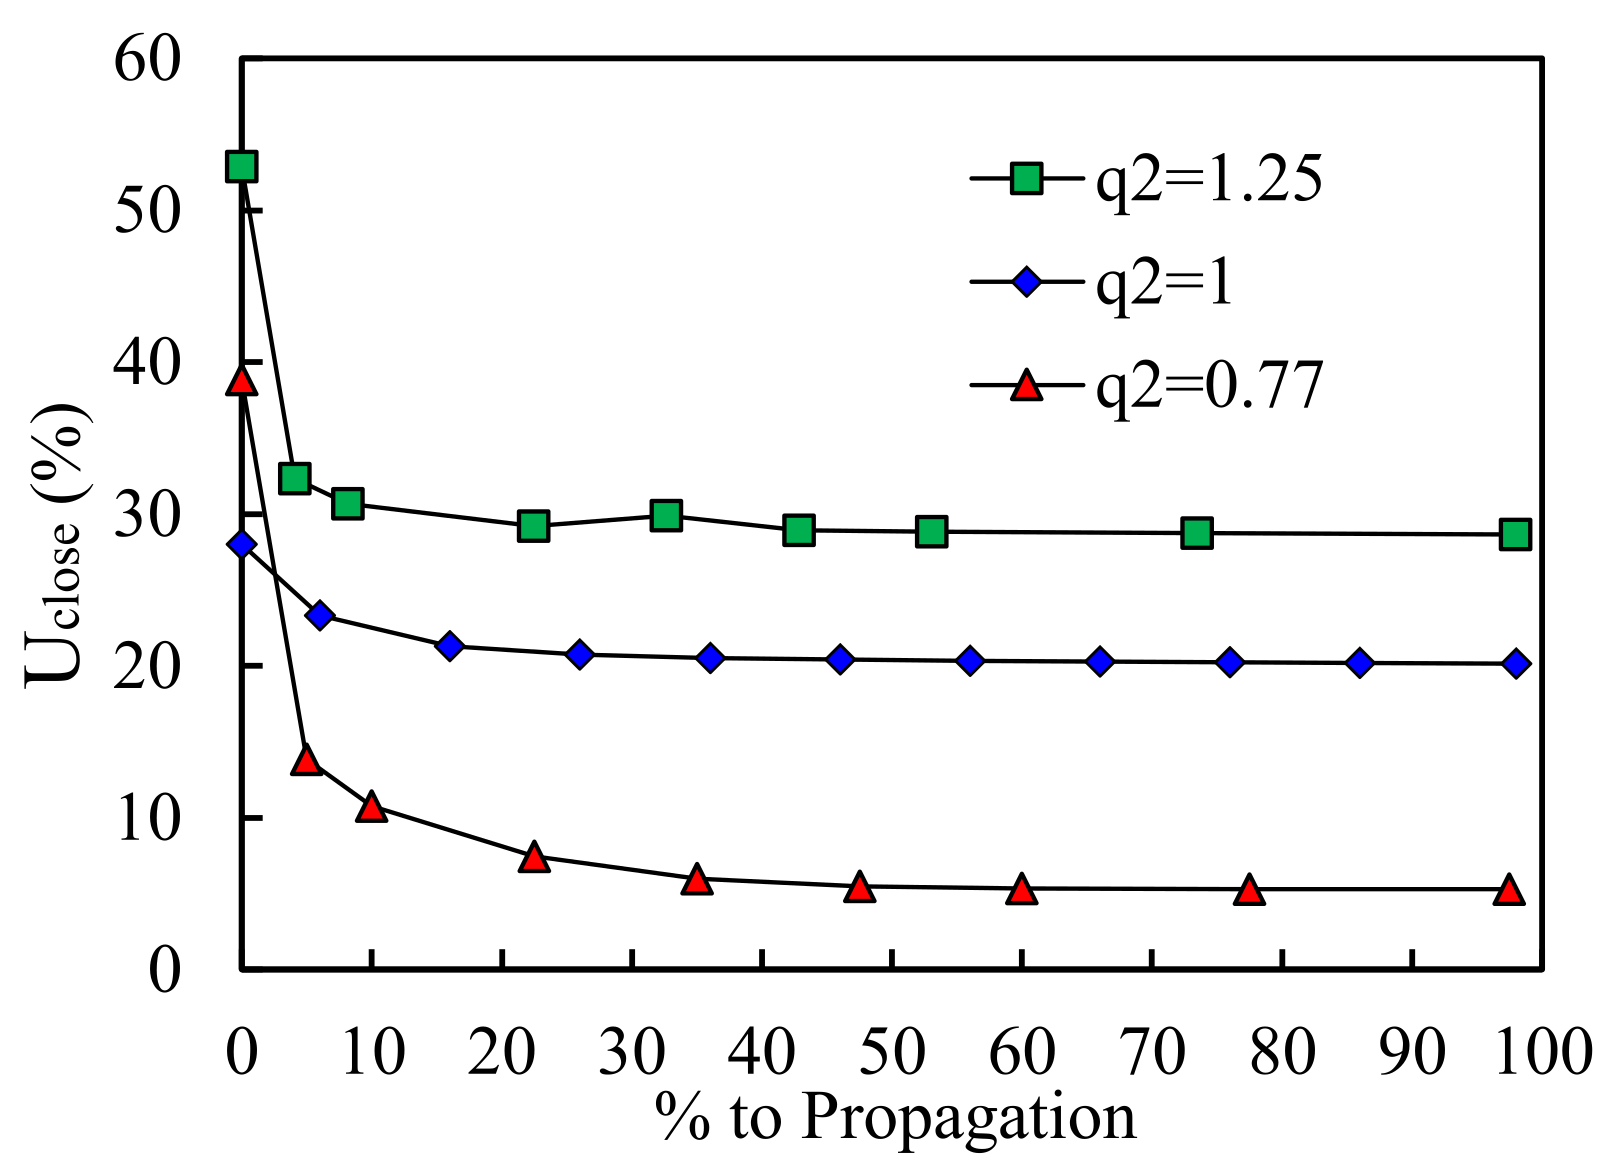
To verify the hypothesis, referred before, that crack closure has a key role in the process, affecting the attained crack propagation rates, the level of this entity during the propagation was studied. A similar approach, to the one presented in Section 3.1, was followed. Results are presented in Figure 11. The trends are once again similar for all the values of the studied parameter as there is a stabilization after an initial peak in crack closure. The higher initial plastic strain, for q2 = 1.25, results in an initial higher crack closure. After stabilizing, the maximum value of crack closure is still reached for q2 = 1.25, but close to the one attained for q2 = 1. This agrees with the similar slopes registered by the plastic strain accumulation (see Figure 10a) for these two values. Note that, with a closer look, one can see that the slope is slightly lower for the higher value of q2 agreeing with the higher crack closure levels attained. The lower value in crack closure is obtained for q2 = 0.77. As the protective fashion induced by this entity is lesser, the plastic strain accumulation is faster resulting in a higher da/dN. In conclusion, higher porosities result in higher crack closure levels which, consequentially, influences da/dN explaining the plastic strain trends and da/dN values.
3.2.3. Analysis of q3
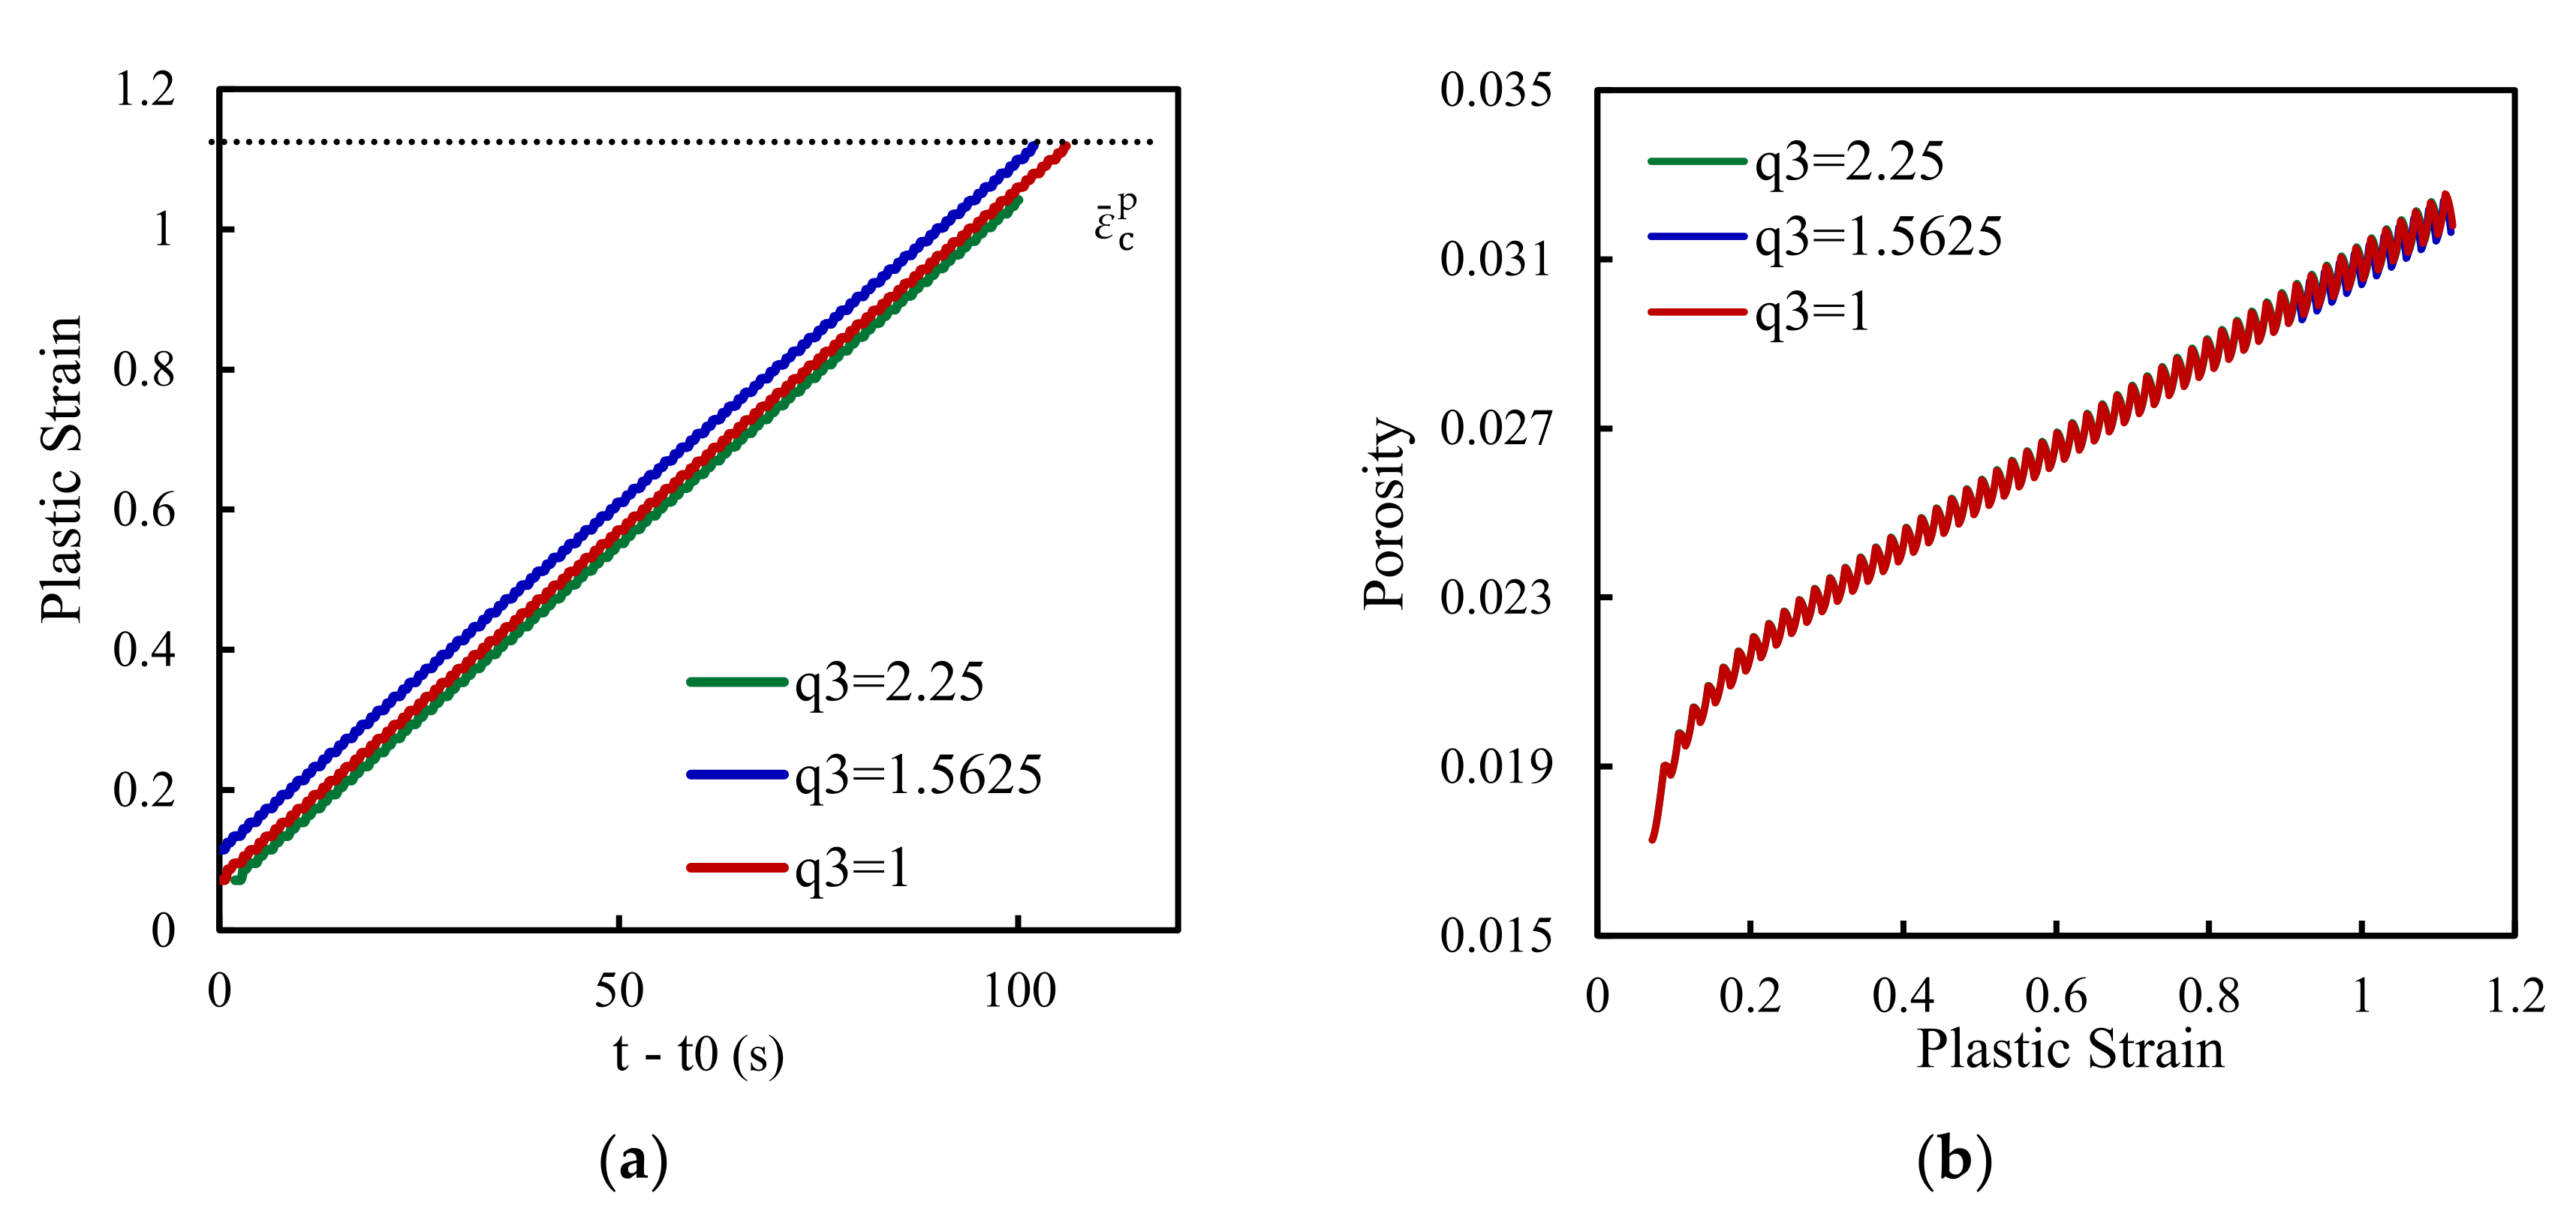
The da/dN results, shown in Figure 8, demonstrate that the q3 parameter has little effect on the FCG rate. The slope of the trend line added to the results is almost null. To support this result, the plastic strain accumulation was studied on the node containing the crack tip. The obtained results are presented in Figure 12a. As expected, the curves are almost overlapped agreeing with the da/dN. The porosity evolution is presented in Figure 12b. The curves are also overlapped, which explains the similarity in the plastic strain accumulation.
3.3. Effect of the Void Fraction to Be Nucleated,
The void fraction to be nucleated by means of plastic strain rate, , influences the nucleation process by means of Equation (10). This parameter is related to the voids nucleated by debonding of the second phase particles, in this case, with dependence on the history of plastic strain. The physical meaning of this numeric parameter is that a total fraction, equal to , of new voids may be nucleated due to plastic strain.
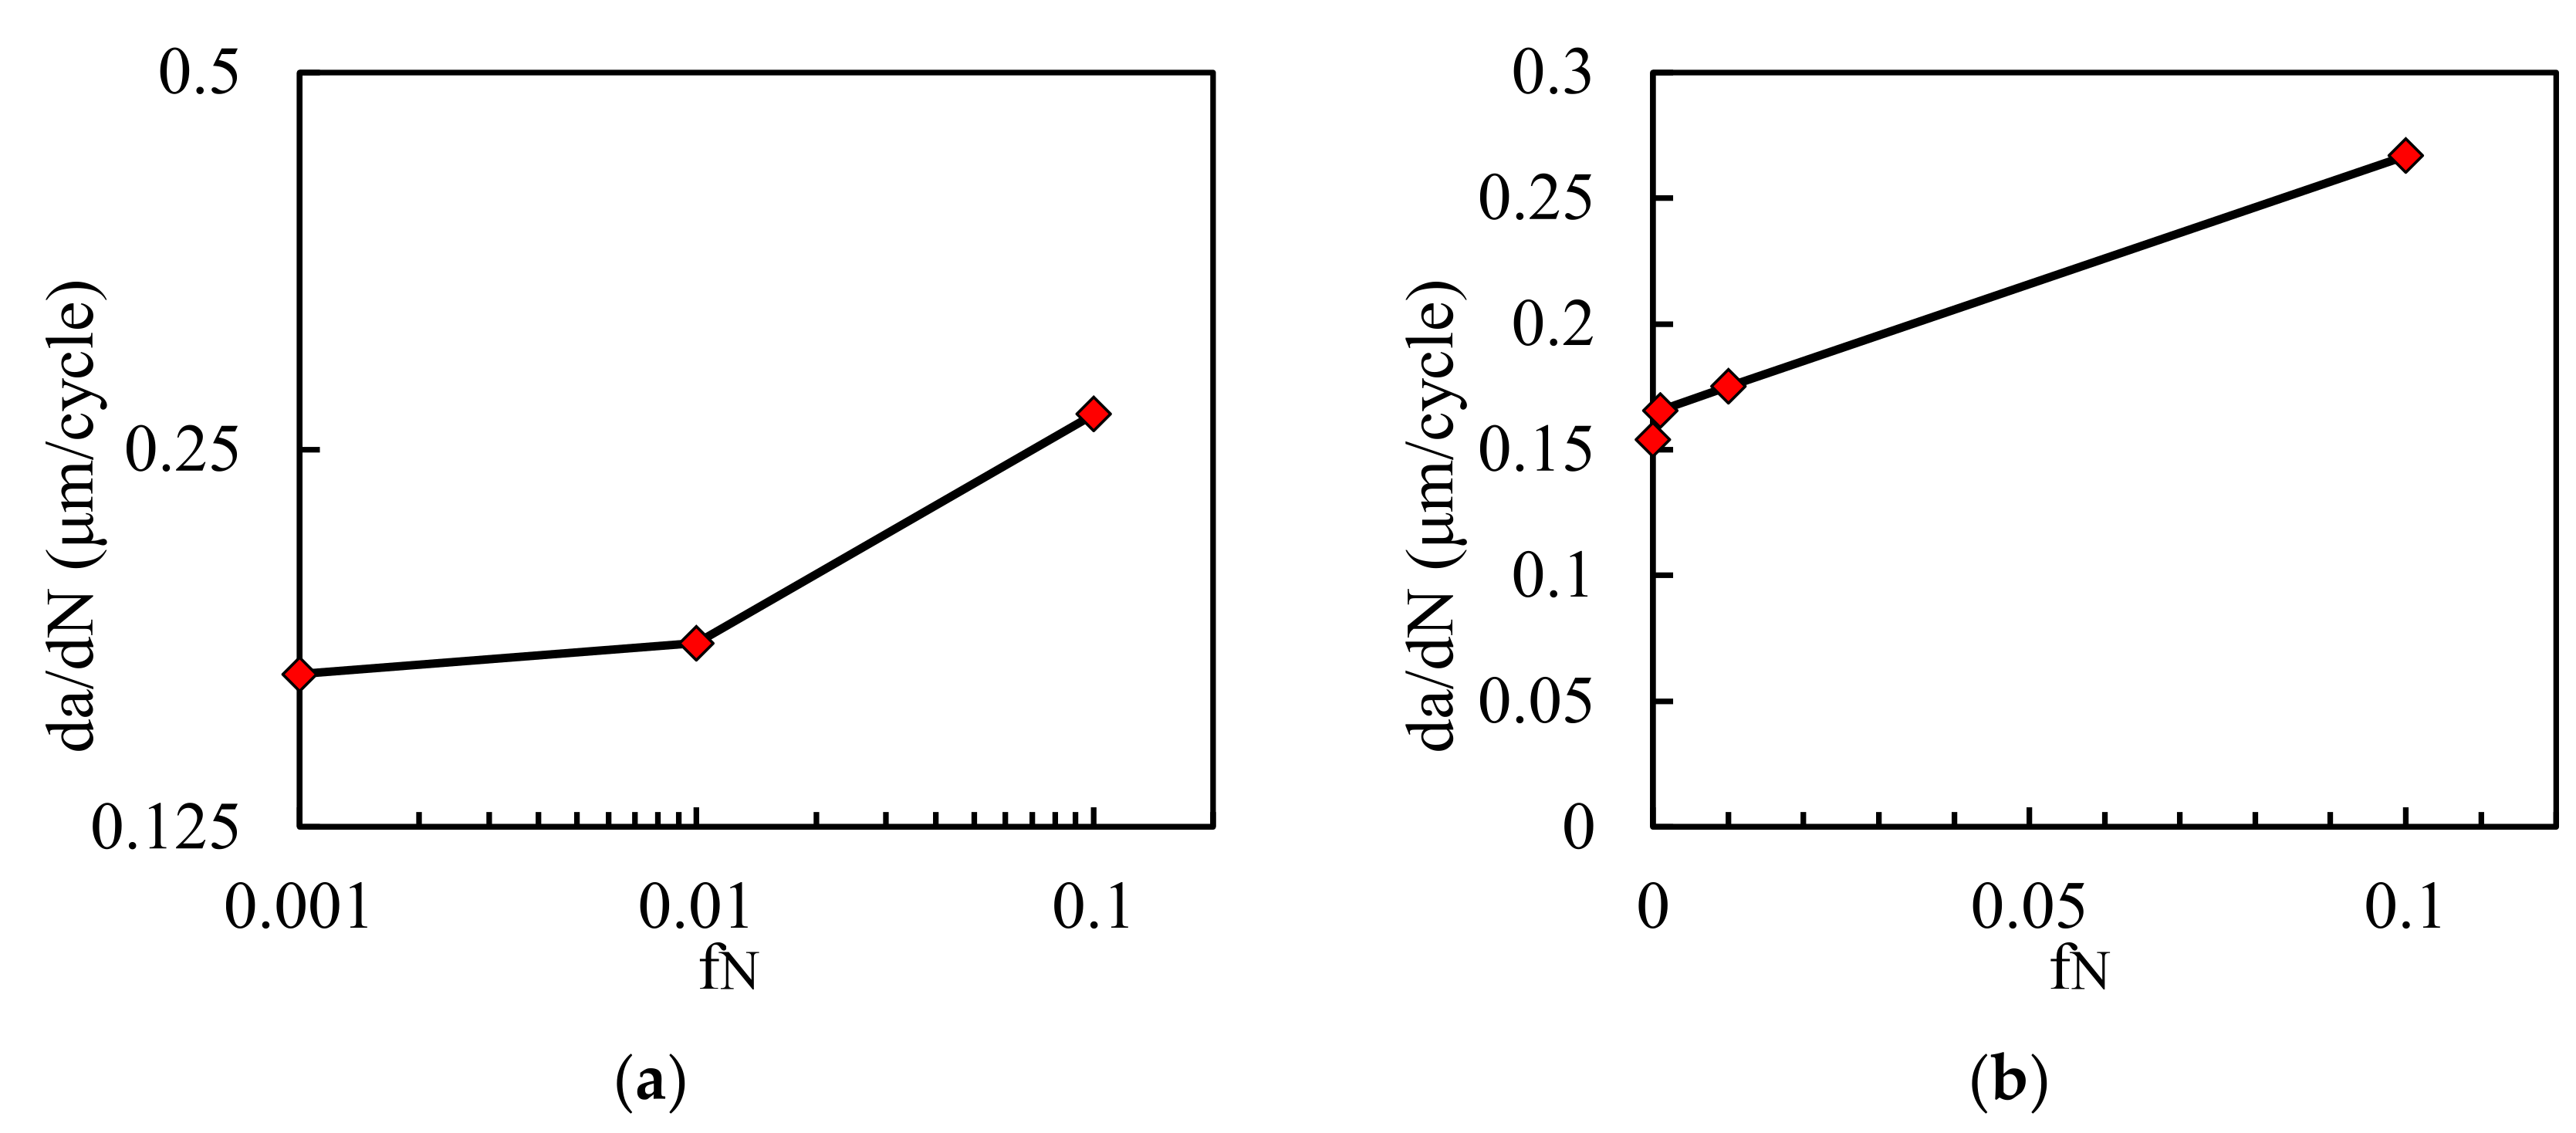
Figure 13 presents the da/dN in terms of different values of in: (a) log-log scales for and (b) natural scales for . These values were selected based on the common range of values for this aluminium alloy (0.001 to 0.1) [33]. The natural scales were introduced to allow the presentation of the point attained for . This value of means that no void nucleation occurs due to plastic strain history. Simulations were performed on an initial crack length of 11.5 mm, which leads to medium levels of ΔK (~7.9 MPa · m2), sitting in the Paris-Erdogan regime of a da/dN-ΔK curve. In log-log scales the curve is not linear, a small increase in da/dN is achieved from 0.001 to 0.01, which was expected since the porosity to be nucleated is smaller or of the magnitude of the considered initial porosity (). da/dN is then almost doubled when the porosity to be nucleated approaches an order of magnitude more than . In natural scales there is an initial increment when nucleation is activated and then the curve stabilizes in a linear trend. These results show that unlike the increase in , the activation of the nucleation process, and the increase on the nucleated porosity, rise the da/dN. Such results suggest that nucleation interferes with crack closure.
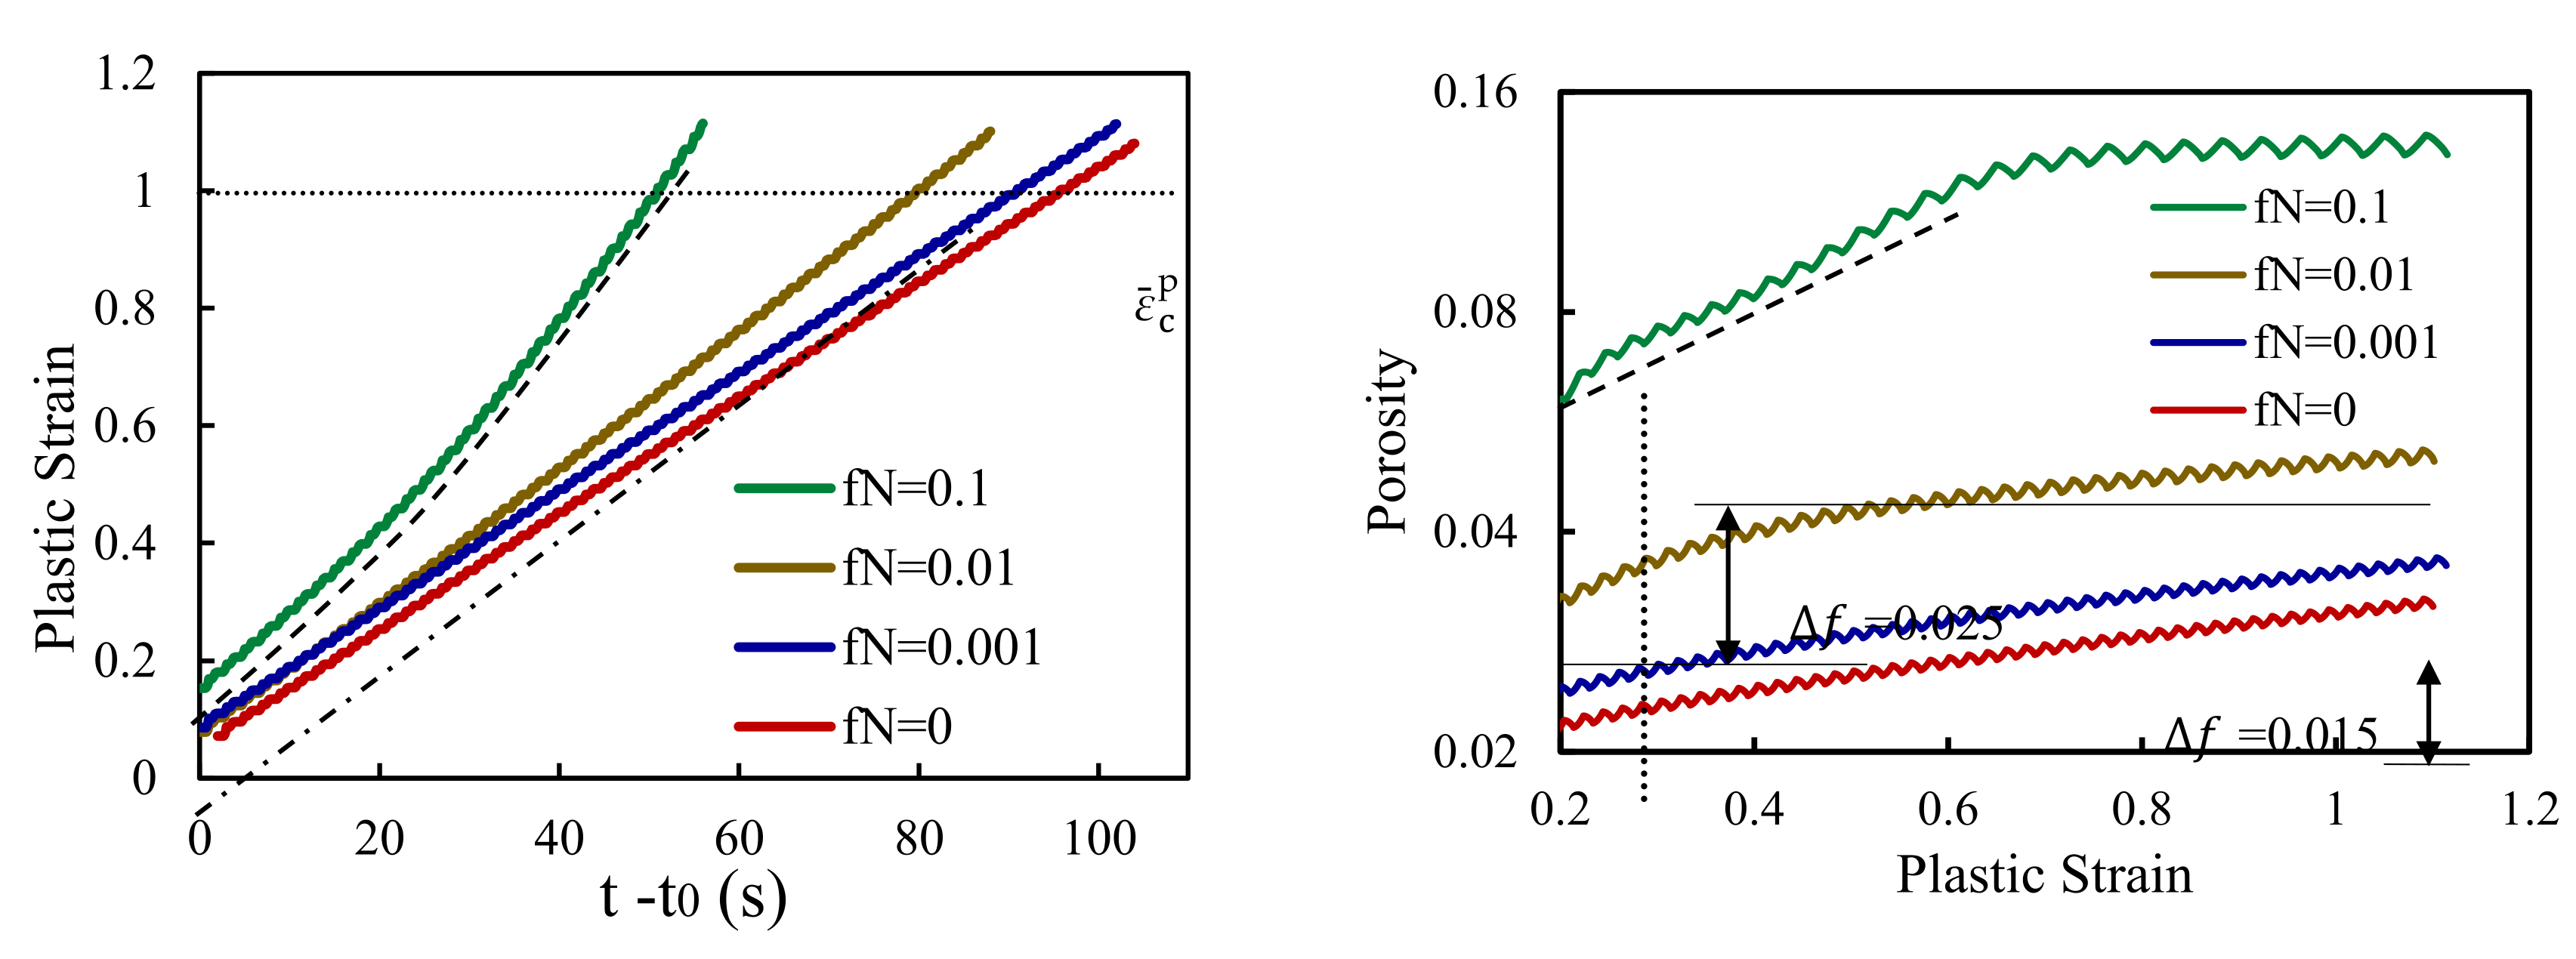
To understand the influence of the nucleation process on da/dN it is crucial to study the porosity and plastic strain evolutions. These entities are proven to highly influence crack closure and da/dN itself. Figure 14a shows the plastic strain evolution for the same entire propagation, in terms of pseudo-time, for the different values. Note that, as with Figure 5, an entire propagation is shown. Figure 14b presents the porosity evolution with plastic strain build-up for the same entire propagations previously referred. Porosity is shown in logarithmic scales due to the different orders of magnitude achieved. The increase on the fraction of porosity to be nucleated causes a small increase on the plastic strain at the beginning of the propagation. As expected, the introduction of the nucleation process accelerates the build-up of plastic strain, explaining the increase in da/dN. Moreover, a small nucleation amplitude () results in a small increase in the accumulation speed of plastic strain, coinciding with the small increment witnessed in natural scales. The plastic strain trend keeps almost linear until the order of magnitude of the initial porosity is reached. For the higher value, a quadratic behaviour is followed, explaining the slope increase in log-log scales. Nucleation was set to occur around a plastic strain of 0.25—marked with a vertical dashed line on Figure 14b. Results show that the nucleation process does not change the initial trend followed by porosity. Also, the porosity evolution is never completely linear, and it tends to saturate. Saturation occurs latter and is more prominent for higher values of . Overall, the porosity level increases with the growth of the nucleation amplitude, validating its effect. Additionally, it does not seem to influence the growth of micro-voids process. Note that for the increase in porosity, which must be due to the growth of micro-voids, is about
0.01 the overall increase in porosity is of 0.025. Being a part, equal to , related to the nucleation process (), to void growth process remain a part of 15, which is the same that was attained when no nucleation occurred.
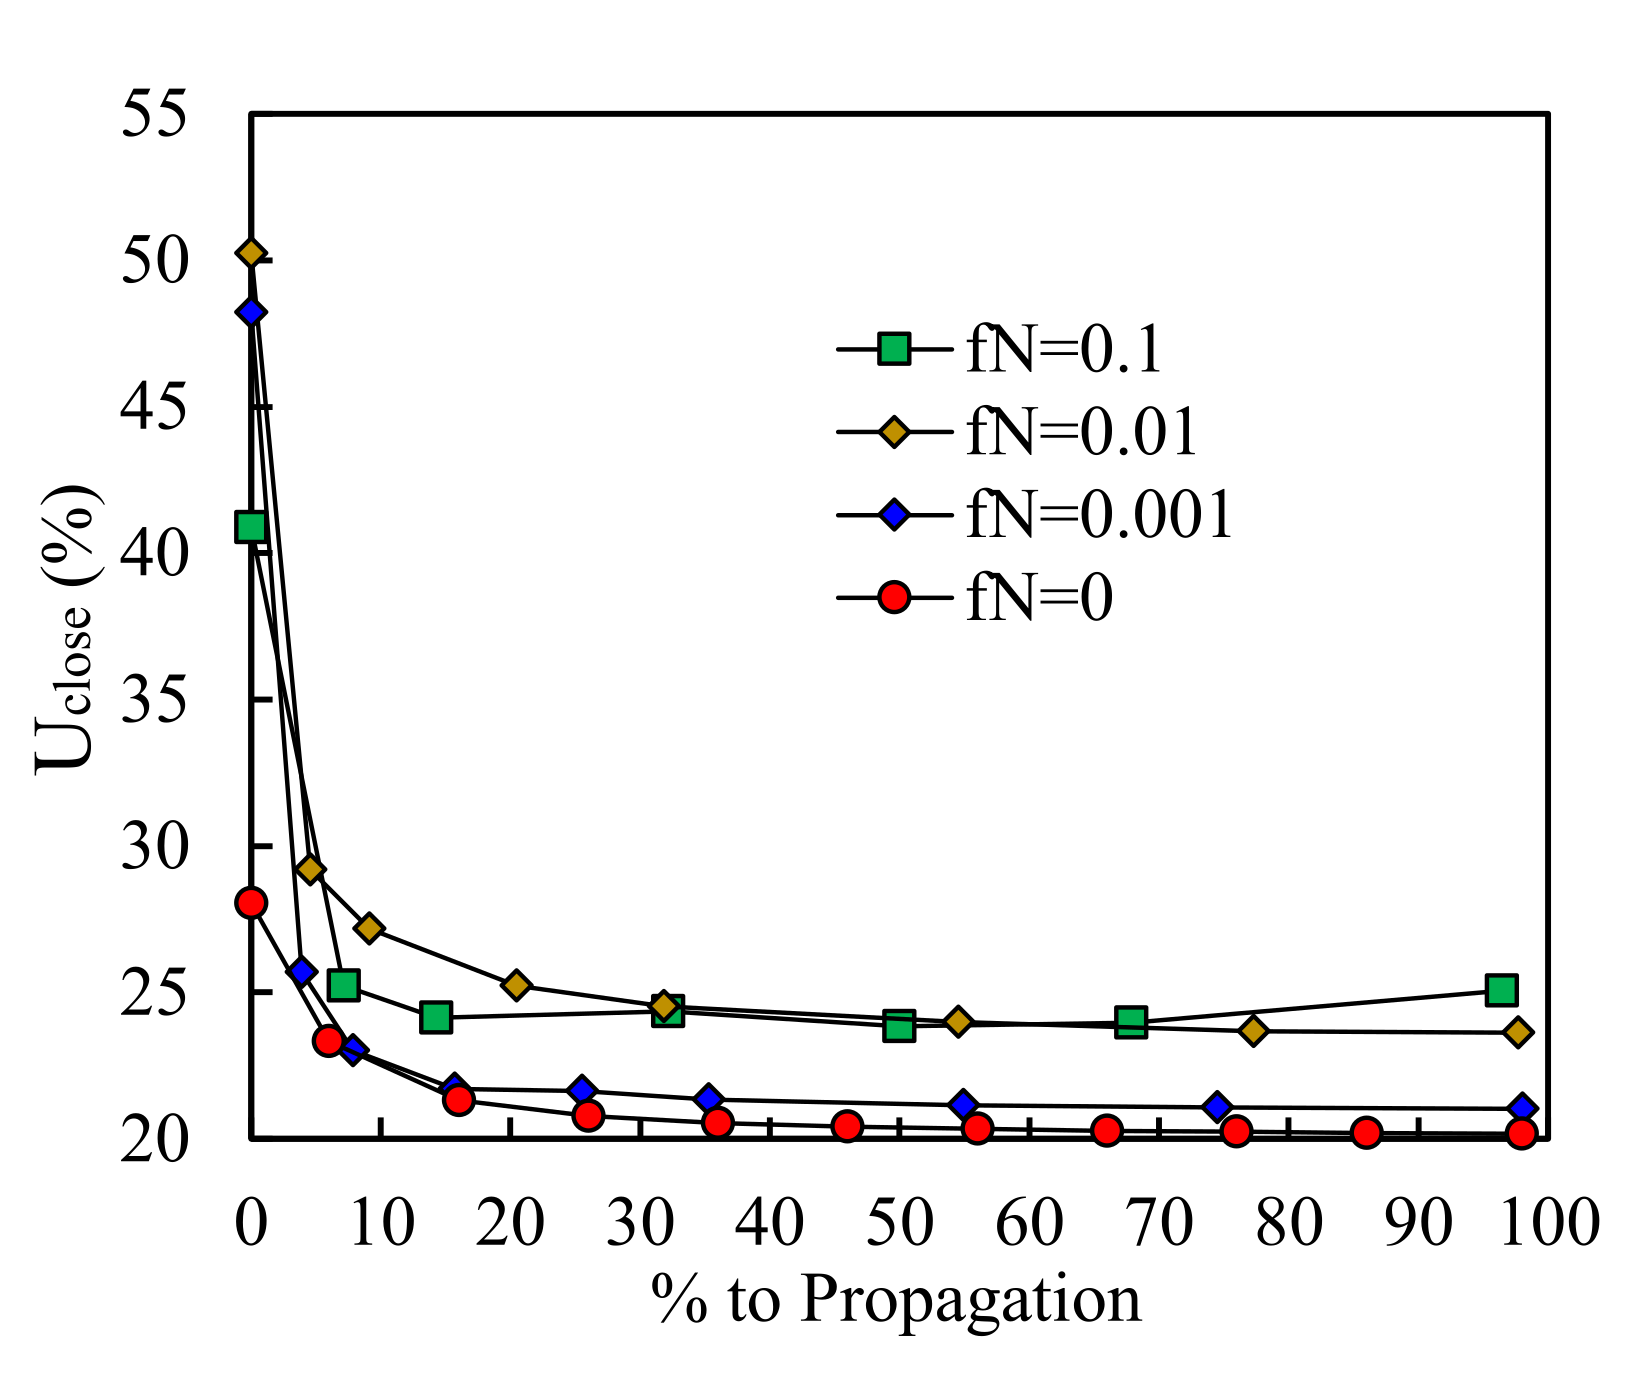
Crack closure was studied, through the same propagation presented in Figure 14, for the different values of . Results are presented in Figure 15 and show that the crack closure evolution is almost independent of . The followed trend is similar for all the values of the nucleation amplitude: there is an initial peak followed by a fast stabilization at low levels of crack closure. Note that the curve for is very close to the curve without nucleation which is in accordance with the previous results. Crack closure is a bit higher for which was also expected due to the higher levels of plastic strain occurring at the crack tip. However, it seems to occur a saturation for as the significantly higher level of plastic strain does not result in a higher crack closure.
3.4. Effect of the Mean Nucleation Strain,
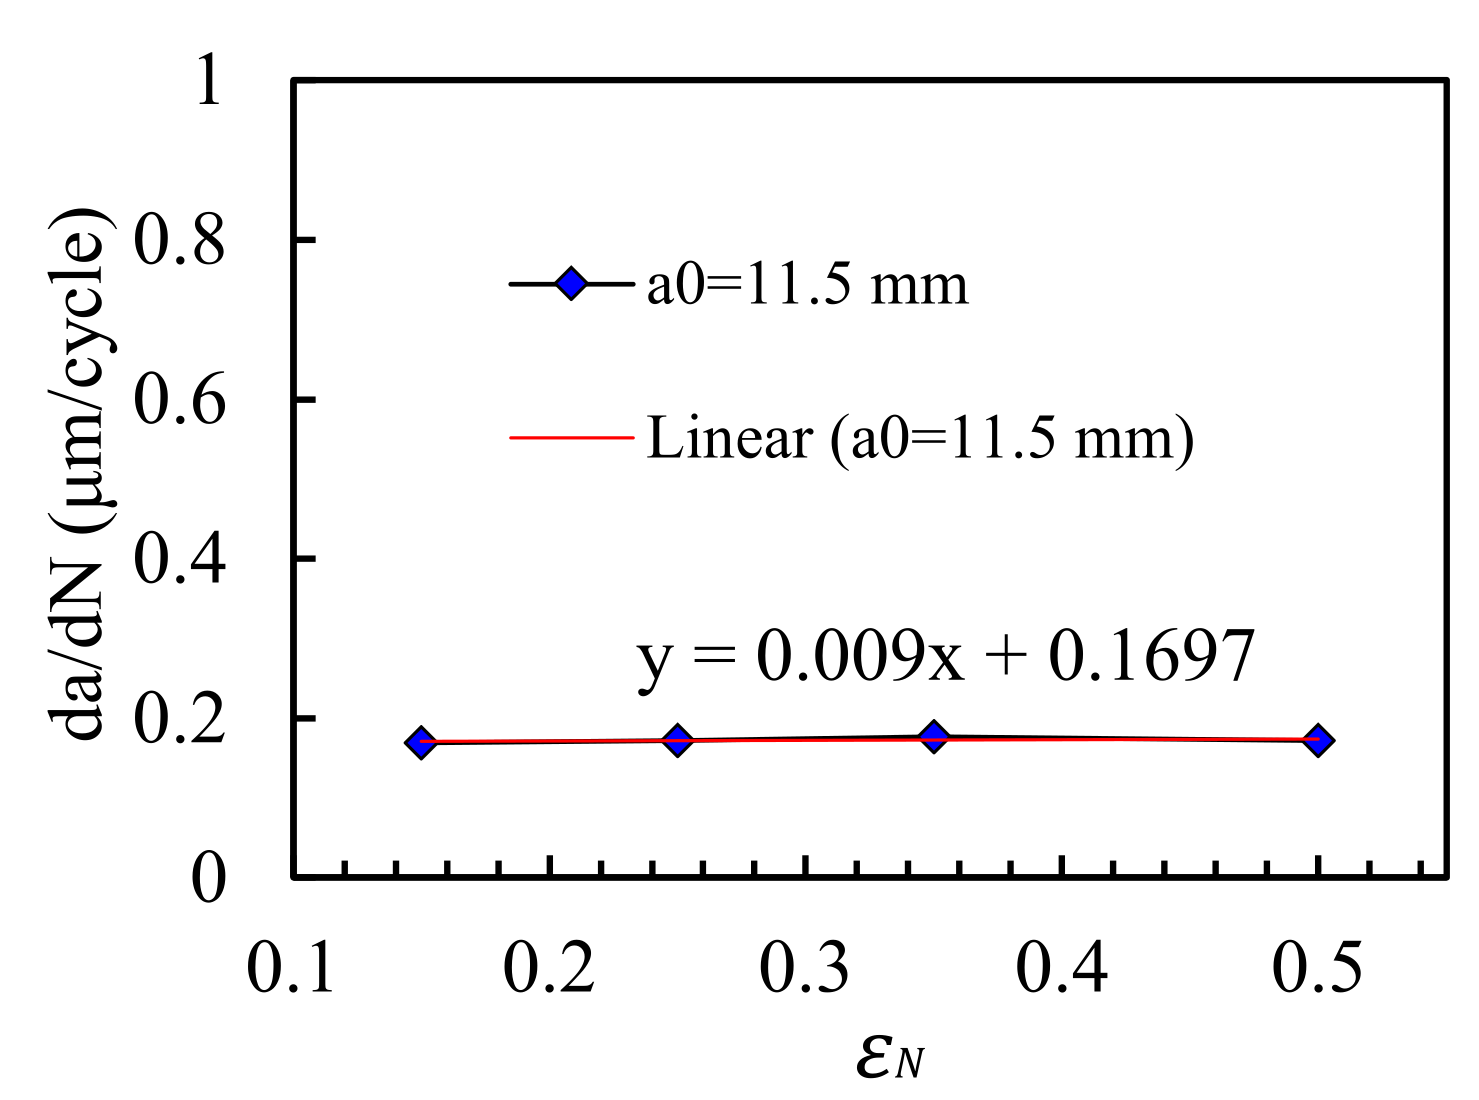
Chu and Needleman [42] idealized that nucleation occurs due to a mean plastic strain, . The nucleation strain is distributed in a normal fashion around that mean. As this distribution is affected by a standard deviation, the nucleation may occur before and, of course, after the mean nucleation strain. This parameter is expected to affect the porosity distribution through the load cycles of each propagation. Figure 16 presents the da/dN values, in natural scales, for a crack with an initial length of 11.5 mm, in terms of four distinct values: 0.15, 0.25, 0.35, and 0.5. Results show that the effect of this parameter in terms of da/dN is negligible.
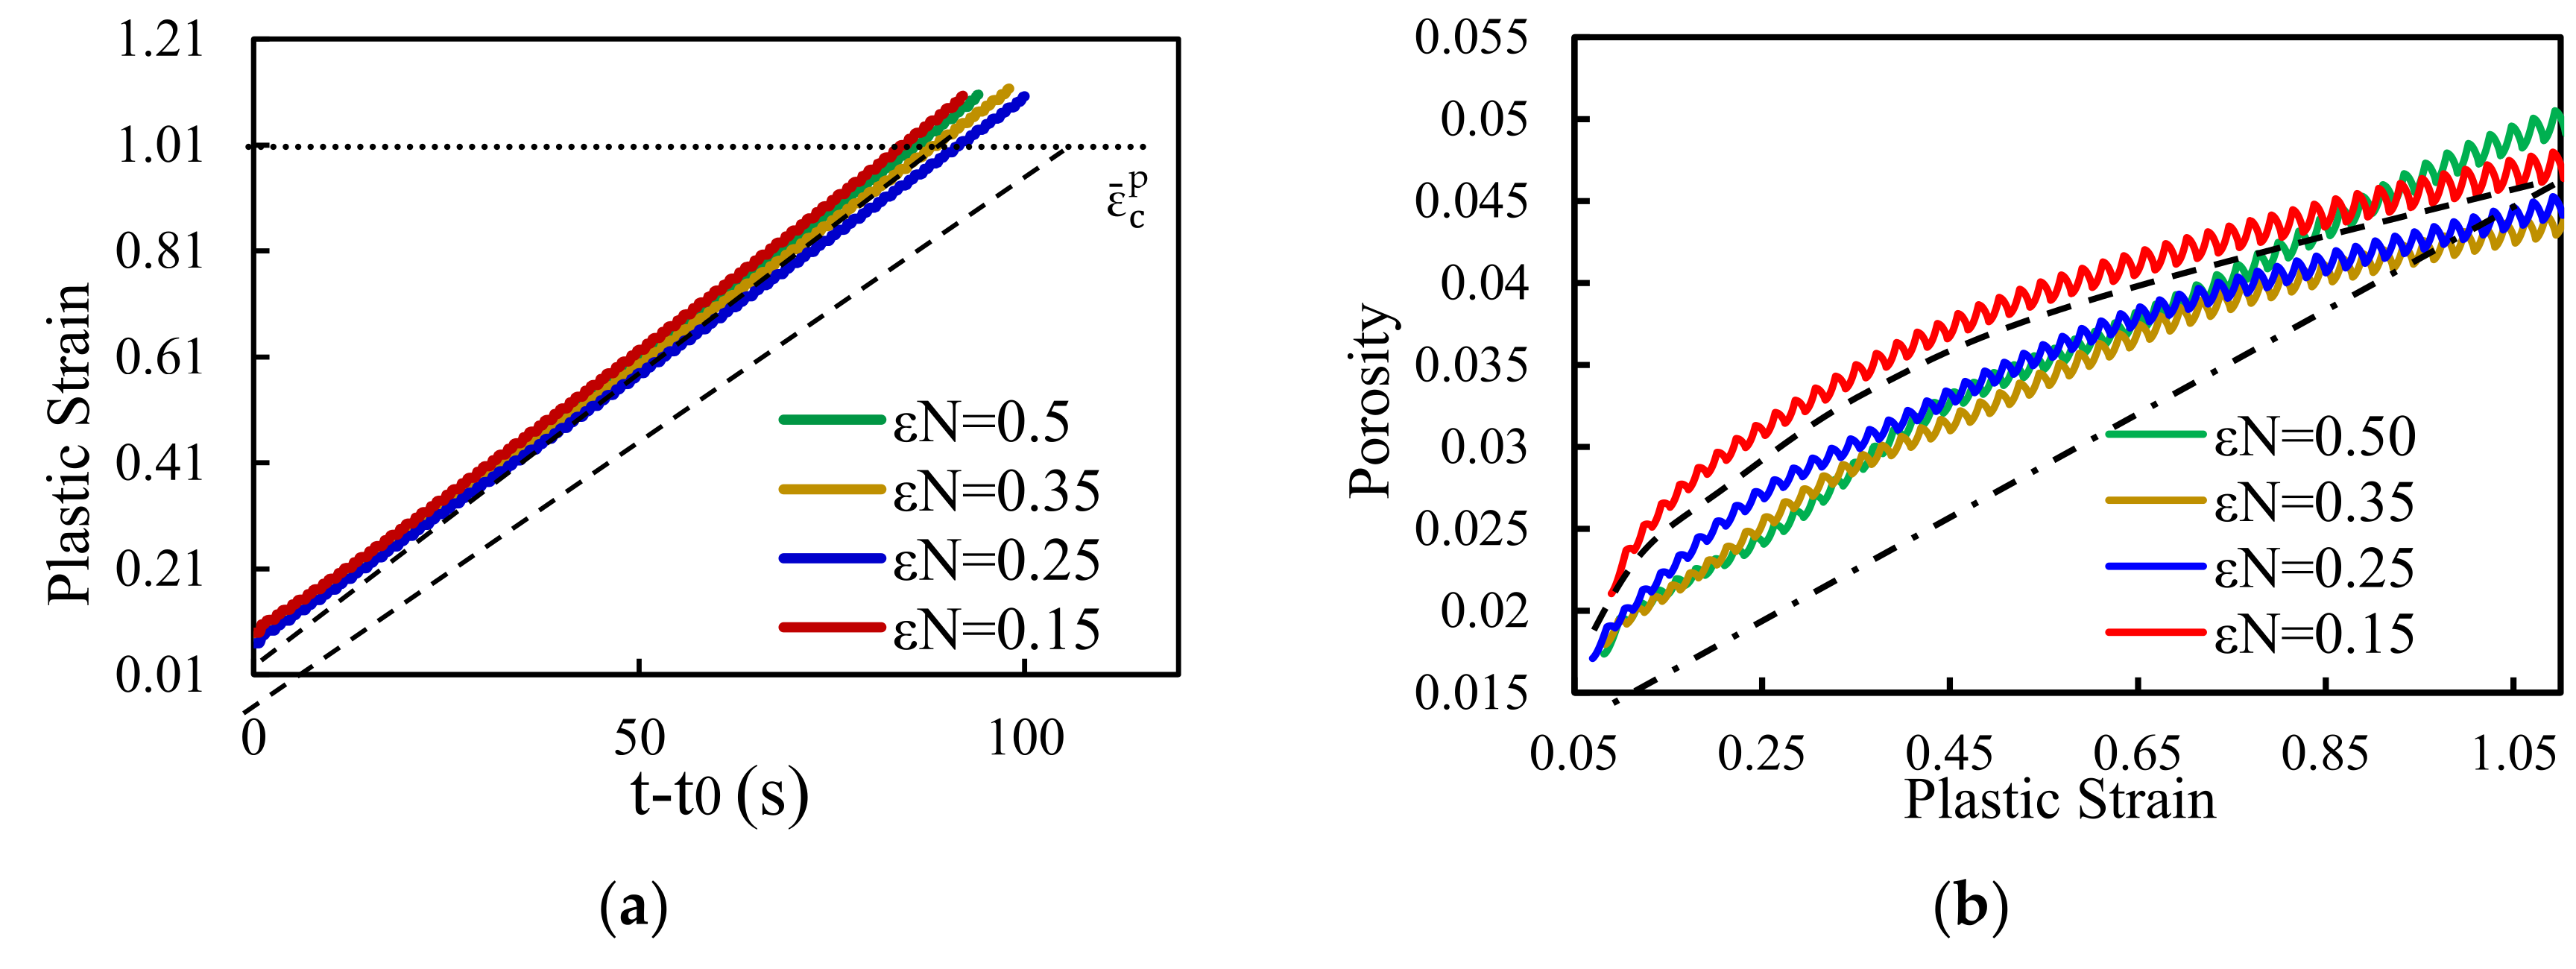
Porosity and plastic strain were studied, on the node located at the crack tip, with the intent to explain the observed da/dN trend. Likewise Figure 6, the plastic strain and porosity evolutions, through a single propagation, are presented in Figure 17. The plastic strain at the beginning of the propagation is very similar for all the values of . Moreover, its evolution is almost linear and the slope variations are contained in a narrow area (delimited by the two dashed lines) for the different values of the mean nucleation strain. This explains the maintenance of da/dN for the different values of . Additionally, the higher value of plastic strain at the beginning of the propagation is achieved for , which is in accordance with higher value of porosity, at the same instant, registered in Figure 17b. As the maximum porosity is reached for , the second higher plastic strain accumulation rate is obtained for this same value of mean nucleation strain. Thus, the plastic strain results are in good agreement with the porosity ones. Figure 17b shows that at the beginning of the propagation, smaller values of lead to higher initial porosities. This is in accordance with the normal distribution concept. Note that a mean nucleation strain of implies that the higher rate of nucleation should occur for a plastic strain of 0.15. Results show that, for this , porosity tend to increase significantly at the beginning of plastic strain accumulation, saturating for higher values of deformation—as it moves away from the nucleation mean strain. On the other hand, for , the normal distribution is centred with the range of plastic strains that were reached. Thus, the porosity evolution has a much more linear trend, as it can be seen by the dashed-pointed line. Also, for the plastic strains covered are almost completely placed on the left side of the distribution, losing importance with the grow up of plastic strain. On the other hand, for , the plastic strain covers a much more important area of the normal distribution, explaining the higher levels of porosity obtained.
3.5. Influence of the Standard Deviation on Void Nucleation,
Varying the standard deviation of the distribution allows to model different ranges of plastic strain over which voids nucleate. Small standard deviations are supposed to cause the porosity to increase in a narrow band of strain increments, while higher deviations should smooth the nucleation process. Also, narrow ranges of nucleation, caused by small values of , were shown to have a destabilizing effect in the model [20]. To access the influence of these particularities on the fatigue crack growth rate, da/dN was calculated for different values of : 0.01, 0.1, and 0.2. The result is presented in Figure 18 in natural scales for the same initial crack length: a0 = 11.5 mm. The influence of this parameter is small—da/dN is basically independent of —as shown by the very small slope of the linear tend line. Although, for da/dN is higher than for the two remaining values.
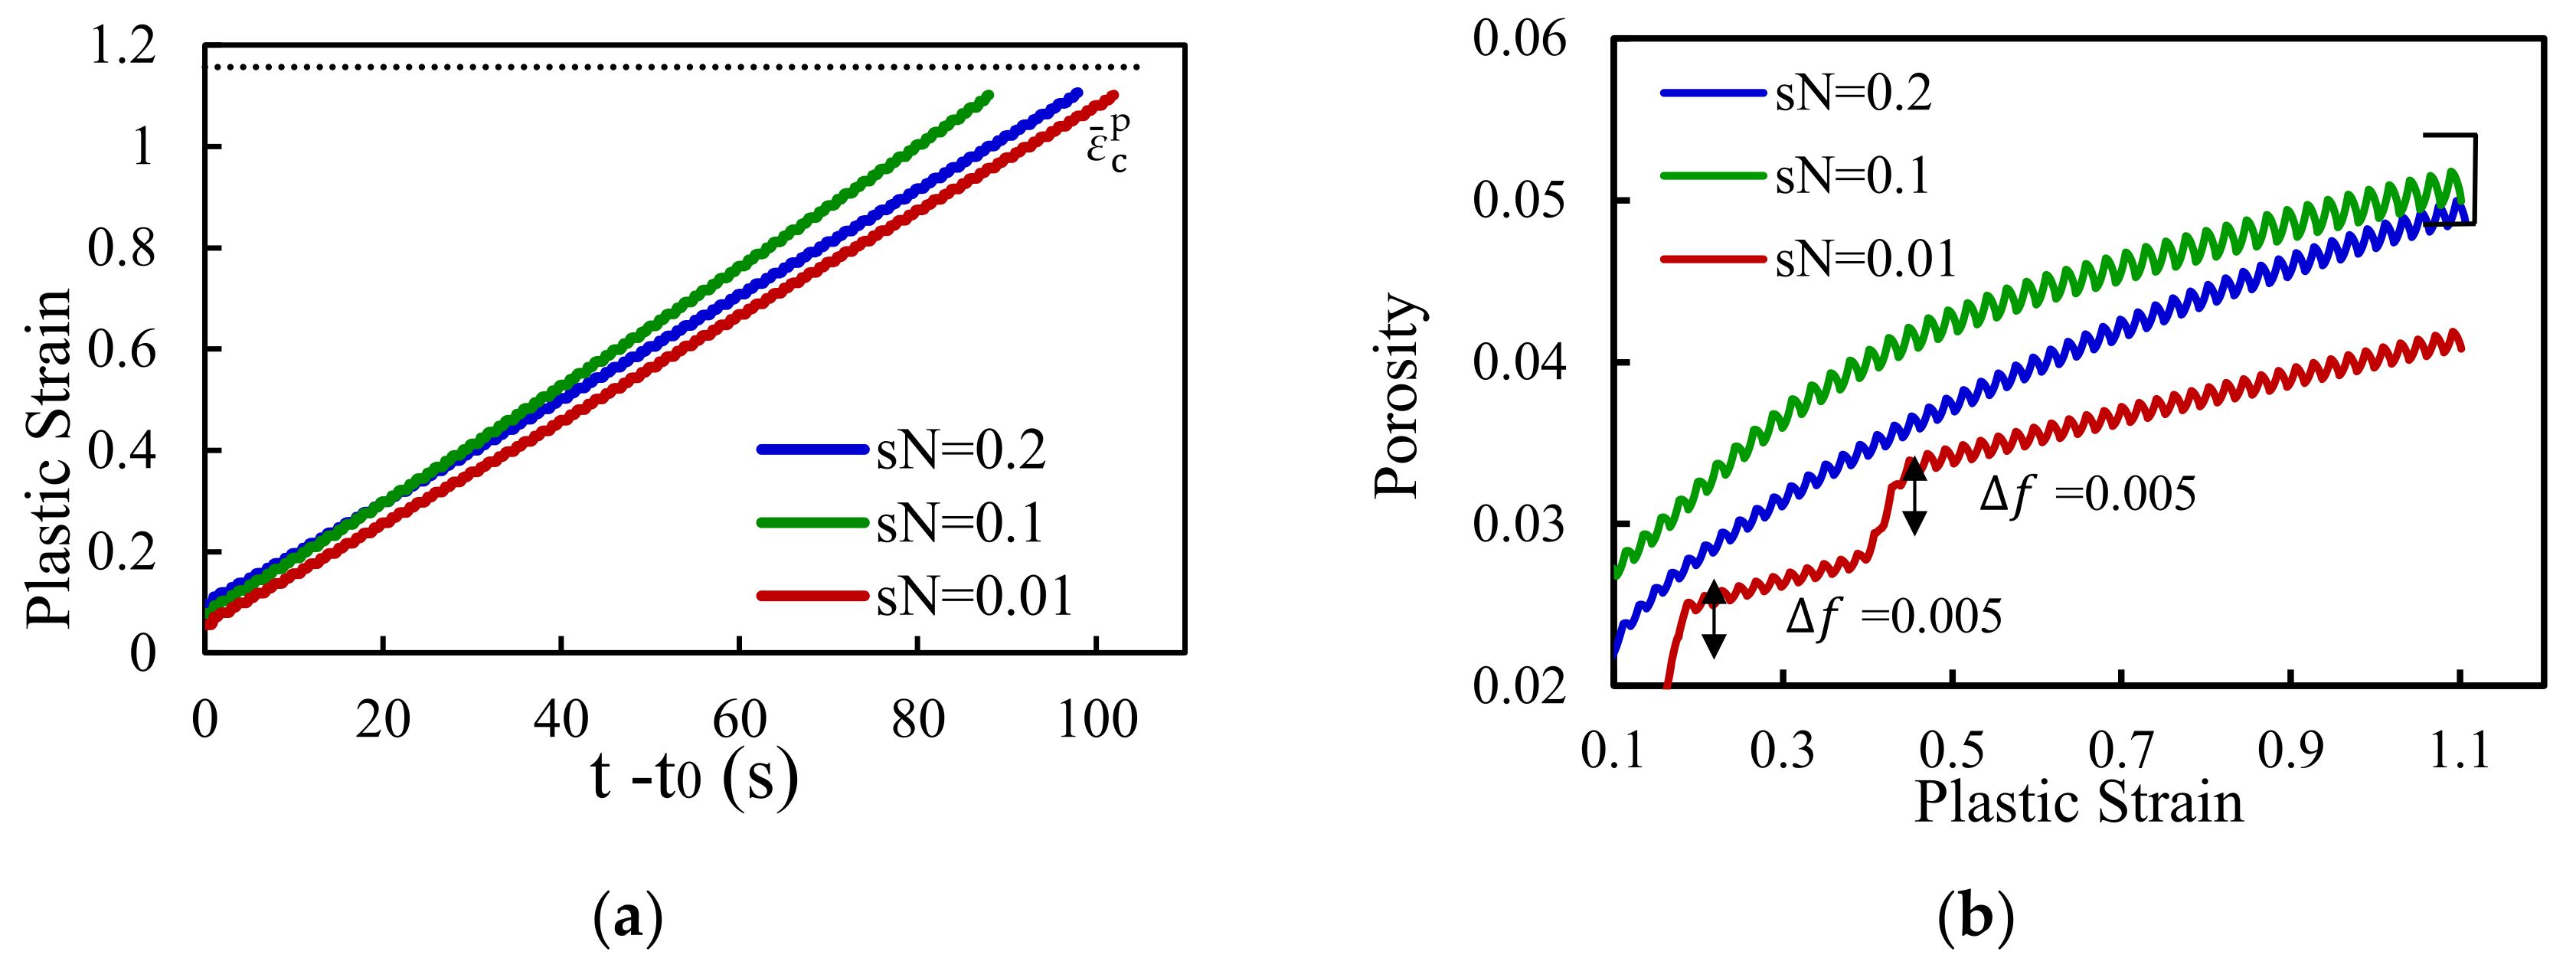
To explain the FCG rates the same process of the previous parameters was followed. The plastic strain and porosity were obtained in the node located at the crack tip. Results are presented in Figure 19a, in the case of plastic strain, for the three values of throughout the same single propagation occurred at the end of the process, where da/dN has already stabilized. Analogous results, but this time for the porosity, are presented in Figure 19b. The plastic strain evolution explains the da/dN differences shown in Figure 18. The trends are similar, however faster accumulations occur for and which is in accordance with the faster propagation rates that were obtained. The standard deviation parameter affects essentially the porosity evolution, which should be able to explain the plastic strain trends. Figure 19b shows that the trends followed by porosity are very distinct. The higher standard deviation results in the more linear trend. This was already expected because nucleation occurs in a larger range of strains reducing the porosity growth for each plastic strain increment. Of course, that nucleation will eventually cease but this event is very smooth. For there is an initial linear increase in porosity until plastic strain reaches about 0.35. This is explained by the fact that nucleation occurs around with a standard deviation of 0.1. After that nucleation starts to decrease and porosity rises only due to the growth of micro voids, resulting in a kind of saturation. The transition here is less smooth as nucleation was more concentrated resulting in higher increments of porosity; when this process ceases, the slope of the curve for falls below the curve for as in the last nucleation is still occurring. The higher initial increase in porosity results in a higher plastic strain level at the initial load cycles. The higher plastic strain then causes more porosity, like a snowball effect. This explains the overall higher porosity resisted for this standard deviation. However, note that, at the end of the propagation, the higher nucleation range for ends up offsetting the initial higher increase for resulting in a similar final porosity value.
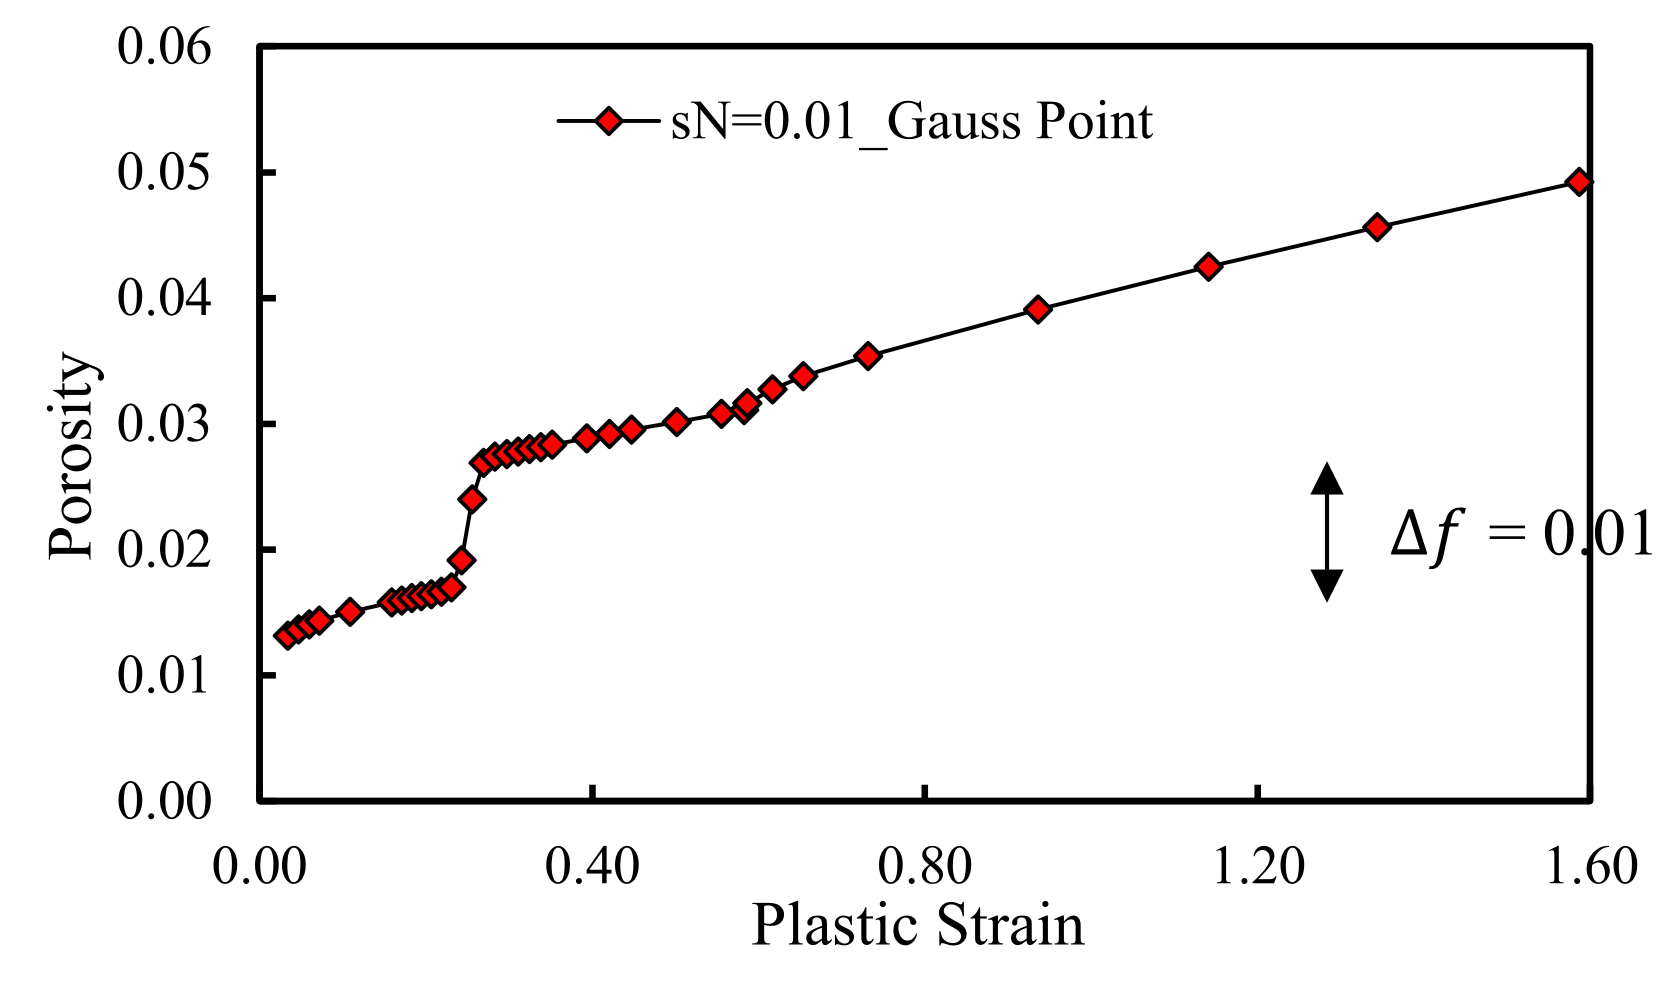
For 1 the nucleation band is so narrow that porosity jumps. Note that porosity is computed at the Gauss points. As this process has a destabilizing effect a smoothening operation is executed by considering the average of the entities in the two Gauss point closer to the node containing the crack tip. This way, two distinct jumps are captured in the process, one for each gauss point considered in the average, as plastic strain increases at different trends in each Gauss point. When nucleation occurs in a Gauss point, in the other it does not, thus when the average is computed the porosity rises half of the nucleation amplitude. The same process eventually occurs in the other Gauss point. To prove this explanation the porosity was measured, in terms of plastic strain growth, for one of the Gauss points closer to the node located at the crack tip (Figure 20), considering . Note that in this case the increase in porosity, due to nucleation, is exactly the nucleation amplitude and only one jump is captured. However, a higher plastic strain is achieved at the end of the propagation because the crack propagates when a plastic strain of 110% is reached in the node, which is the average of the two Gauss points. Thus, the plastic strain in the other Gauss point compensates the higher value reached in the one studied in Figure 20 and the average at the node will be of 110%.
4. Sensitivity Analysis
To access the influence of each parameter, studied in the previous section, a sensitivity analysis was carried out. This process allows to compare the variations on the output entities caused by different input parameters, with different physical dimensions.
The final output of a FCG oriented numerical model is the fatigue crack growth rate, expressed by da/dN. Thus, this is the target entity of the sensitivity analysis. The non-dimensional sensitivity of da/dN, to the selected GTN parameters is expressed as
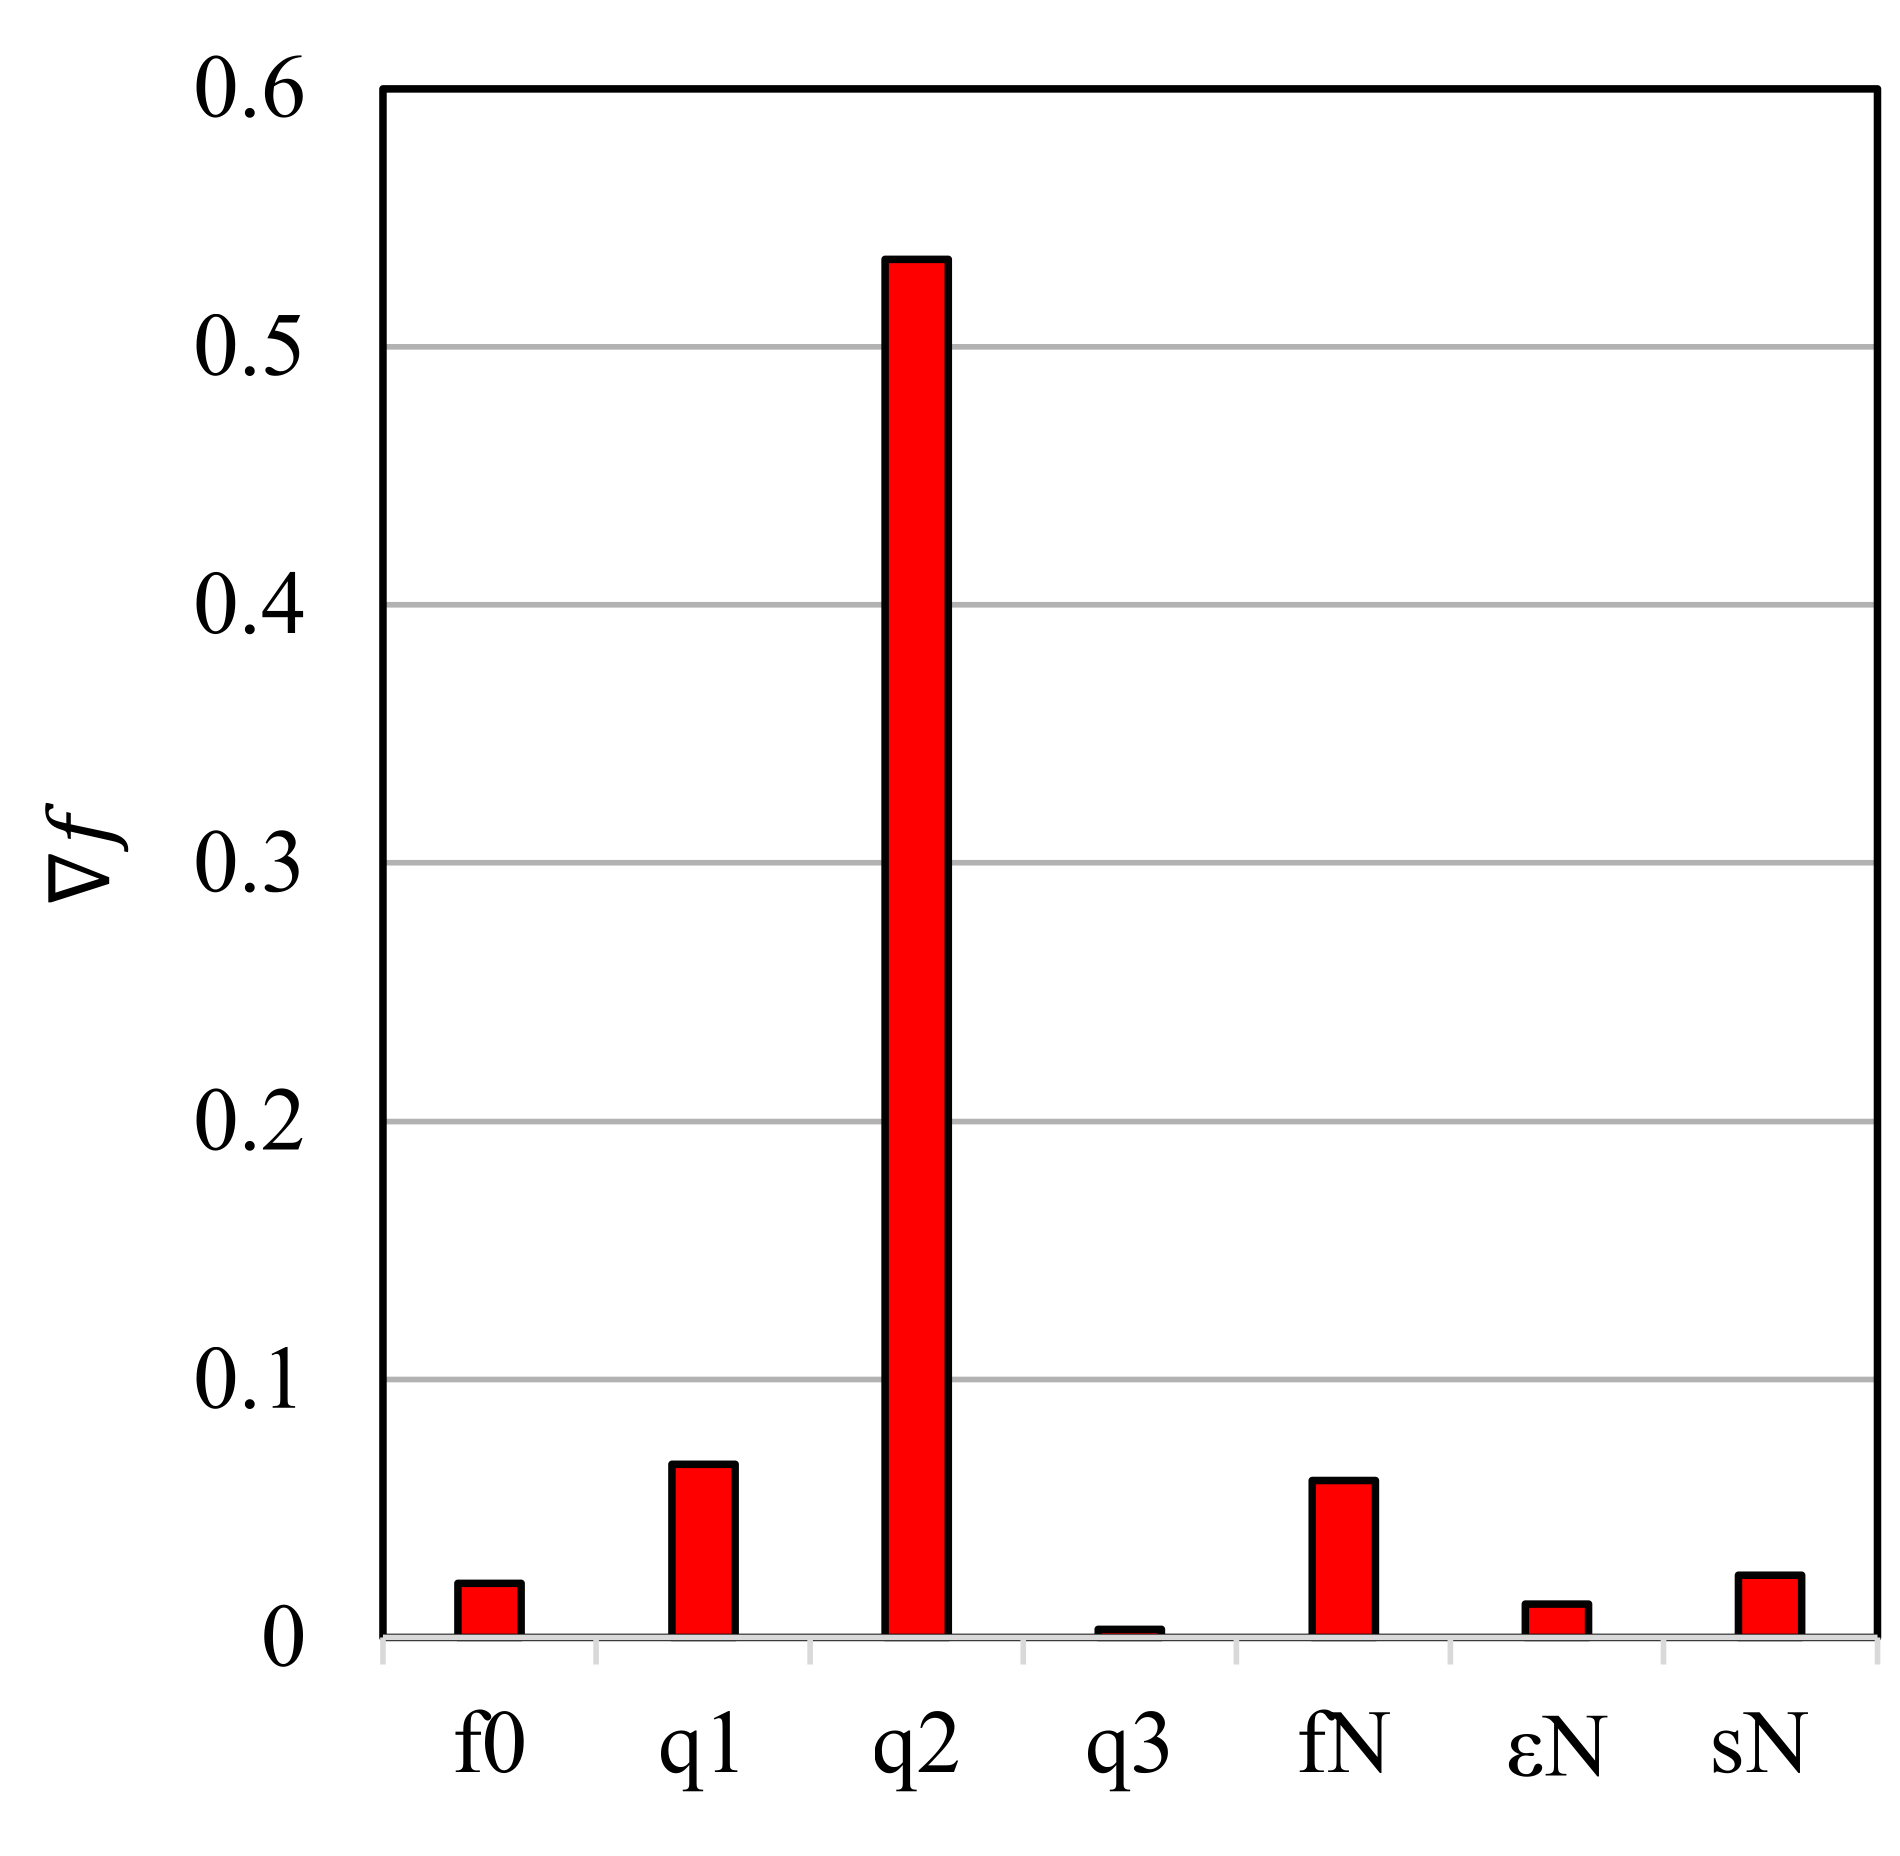
where is the sensitivity coefficient and represents the GTN material parameter. Each sensitivity coefficient represents the change rate of da/dN caused by a variation of a specific material parameter. Note that a sensitivity of 0.5 indicates that a variation of 1% in produces a variation of 0.5% in . The results obtained in the sensitivity analysis are presented in Figure 21. The sensitivity analysis was performed at the central point, or at one of the central points in the case where even number of values for the parameter were studied. Results show that q2 parameter has by far the biggest influence on da/dN. q1 is also important while q3 has almost no influence. is the nucleation related parameter with most importance, followed by and finally . has also low importance.
5. Conclusions
The influence of the growth and nucleation of micro-voids on the fatigue crack growth rate was studied using numerical simulation. The propagation is simulated by node release, which occurs when the accumulated plastic strain reaches a critical value. GTN damage model was adopted to account for the loss of strength, due to the accumulation of damage (porosity), which accompanies the occurrence of plastic strain. Crack closure has been considered in this study and represents a key role, since it reduces the stress intensity at the crack tip, balancing the effect of porosity. Moreover, higher porosity values are linked to large plastic strains, which produce higher crack closure levels, reducing the accumulation of plastic strain. These three entities are interrelated, and their effect cannot be separated. The inclusion of the nucleation process naturally induces higher fatigue crack growth rates while some saturation occurs on crack closure.
The sensitivity analysis showed that the parameter q2, introduced by Tvergaard to account for the effect of stress tri-axiality, which tends to be high at a crack tip, is the most relevant parameter concerning crack growth rates. The nucleation amplitude, , and q1, another parameter introduced by Tvergaard to account for the loss of strength due to inter-void interactions, are of secondary importance. Finally, da/dN showed to have almost null sensitivity to q3.
Author Contributions
Conceptualization, F.V.A.; Methodology, E.R.S.; Software, D.M.N.; Formal analysis, M.F.B.; Investigation, E.R.S.; Writing—original draft preparation, E.R.S.; Writing—review and editing, F.V.A. and M.F.B. All authors have read and agreed to the published version of the manuscript.
Funding
This research was funded by Portuguese Foundation for Science and Technology (FCT) under the project with reference PTDC/EME-EME/31657/2017 and by UIDB/00285/2020.
Institutional Review Board Statement
Not applicable.
Informed Consent Statement
Not applicable.
Conflicts of Interest
The authors declare no conflict of interest. The funders had no role in the design of the study; in the collection, analyses, or interpretation of data; in the writing of the manuscript, or in the decision to publish the results.
References
- Irwin, G.R. Analysis of Stresses and Strains Near the End of a Crack Traversing a Plate. J. Appl. Mech. 1957, 24, 361–364. [Google Scholar] [CrossRef]
- Newman, J.; Raju, I. An empirical stress-intensity factor equation for the surface crack. Eng. Fract. Mech. 1981, 15, 185–192. [Google Scholar] [CrossRef]
- Borges, M.; Neto, D.; Antunes, F. Numerical simulation of fatigue crack growth based on accumulated plastic strain. Theor. Appl. Fract. Mech. 2020, 108, 102676. [Google Scholar] [CrossRef]
- Borrego, L.; Ferreira, J.; Pinho-Da-Cruz, J.; Costa, J. Evaluation of overload effects on fatigue crack growth and closure. Eng. Fract. Mech. 2003, 70, 1379–1397. [Google Scholar] [CrossRef] [Green Version]
- Rao, K.; Yu, W.; Ritchie, R. On the behavior of small fatigue cracks in commercial aluminum-lithium alloys. Eng. Fract. Mech. 1988, 31, 623–635. [Google Scholar] [CrossRef] [Green Version]
- Borrego, L.F.; Ferreira, J.; Costa, J. Fatigue crack growth and crack closure in an AlMgSi alloy. Fatigue Fract. Eng. Mater. Struct. 2001, 24, 255–265. [Google Scholar] [CrossRef]
- Antunes, F.; Branco, R.; Correia, L.; Ramalho, A. A numerical study of non-linear crack tip parameters. Frattura ed Integrità Strutturale 2015, 9, 199–208. [Google Scholar] [CrossRef] [Green Version]
- Antunes, F.; Serrano, S.; Branco, R.; Prates, P. Fatigue crack growth in the 2050-T8 aluminium alloy. Int. J. Fatigue 2018, 115, 79–88. [Google Scholar] [CrossRef]
- Chen, H.; Chen, W.; Li, T.; Ure, J. Effect of circular holes on the ratchet limit and crack tip plastic strain range in a centre cracked plate. Eng. Fract. Mech. 2011, 78, 2310–2324. [Google Scholar] [CrossRef] [Green Version]
- Park, H.-B.; Kim, K.-M.; Lee, B.-W. Plastic zone size in fatigue cracking. Int. J. Press. Vessel. Pip. 1996, 68, 279–285. [Google Scholar] [CrossRef]
- Liaw, P.K.; Kwun, S.I.; Fine, M.E. Plastic work of fatigue crack propagation in steels and aluminum alloys. Met. Mater. Trans. A 1981, 12, 49–55. [Google Scholar] [CrossRef]
- Tvergaard, V. On fatigue crack growth in ductile materials by crack–tip blunting. J. Mech. Phys. Solids 2004, 52, 2149–2166. [Google Scholar] [CrossRef]
- Pippan, R.; Grosinger, W. Fatigue crack closure: From LCF to small scale yielding. Int. J. Fatigue 2013, 46, 41–48. [Google Scholar] [CrossRef] [Green Version]
- Antunes, F.V.; Branco, R.; Prates, P.; Borrego, L.F. Fatigue crack growth modelling based on CTOD for the 7050-T6 alloy. Fatigue Fract. Eng. Mater. Struct. 2017, 40, 1309–1320. [Google Scholar] [CrossRef]
- Vasco-Olmo, J.; Díaz, F.; Antunes, F.; James, M. Characterisation of fatigue crack growth using digital image correlation measurements of plastic CTOD. Theor. Appl. Fract. Mech. 2019, 101, 332–341. [Google Scholar] [CrossRef]
- Hamam, R.; Pommier, S.; Bumbieler, F. Mode I fatigue crack growth under biaxial loading. Int. J. Fatigue 2005, 27, 1342–1346. [Google Scholar] [CrossRef]
- Jiang, Y.; Feng, M. Modeling of Fatigue Crack Propagation. J. Eng. Mater. Technol. 2004, 126, 77–86. [Google Scholar] [CrossRef]
- Hosseini, Z.; Dadfarnia, M.; Somerday, B.P.; Sofronis, P.; Ritchie, R.O. On the theoretical modeling of fatigue crack growth. J. Mech. Phys. Solids 2018, 121, 341–362. [Google Scholar] [CrossRef]
- Kuwamura, H.; Akiyama, H. Brittle fracture under repeated high stresses. J. Constr. Steel Res. 1994, 29, 5–19. [Google Scholar] [CrossRef]
- Kiran, R.; Khandelwal, K. Gurson model parameters for ductile fracture simulation in ASTM A992 steels. Fatigue Fract. Eng. Mater. Struct. 2013, 37, 171–183. [Google Scholar] [CrossRef]
- Rousselier, G. Ductile fracture models and their potential in local approach of fracture. Nucl. Eng. Des. 1987, 105, 97–111. [Google Scholar] [CrossRef]
- Wilsdorf, H.G.F. Void initiation, growth, and coalescence in ductile fracture of metals. J. Electron. Mater. 1975, 4, 791–809. [Google Scholar] [CrossRef]
- Garrison, W.; Moody, N. Ductile fracture. J. Phys. Chem. Solids 1987, 48, 1035–1074. [Google Scholar] [CrossRef]
- Rice, J.R.; Tracey, D.M. On the ductile enlargement of voids in triaxial stress fields*. J. Mech. Phys. Solids 1969, 17, 201–217. [Google Scholar] [CrossRef] [Green Version]
- Bao, Y. Prediction of Ductile Crack Formation in Uncracked Bodies. Ph.D. Thesis, Massachusetts Institute of Technology, Cambridge, MA, USA, 2003. [Google Scholar]
- Anderson, T.L. Fracture Mechanics: Fundamentals and Applications. 2005, pp. 73–74. Available online: http://site.ebrary.com/id/11166314 (accessed on 20 June 2021).
- Besson, J. Continuum Models of Ductile Fracture: A Review. Int. J. Damage Mech. 2010, 19, 3–52. [Google Scholar] [CrossRef] [Green Version]
- Tipper, C.F. Metallurgia, 1948–1949. Volume 39, 133–137.
- Puttick, K.E. Ductile fracture in metals. Philos. Mag. 1959, 4, 964–969. [Google Scholar] [CrossRef]
- Schmitt, J.-H.; Jalinier, J.M.; Baudelet, B. Analysis of damage and its influence on the plastic properties of copper. J. Mater. Sci. 1981, 16, 95–101. [Google Scholar] [CrossRef]
- Brünig, M.; Gerke, S.; Hagenbrock, V. Micro-mechanical studies on the effect of the stress triaxiality and the Lode parameter on ductile damage. Int. J. Plast. 2013, 50, 49–65. [Google Scholar] [CrossRef]
- Menezes, L.F.; Teodosiu, C. Three-dimensional numerical simulation of the deep-drawing process using solid finite elements. J. Mater. Process. Technol. 2000, 97, 100–106. [Google Scholar] [CrossRef] [Green Version]
- Oliveira, M.C.; Alves, J.L.C.M.; Menezes, L.F. Algorithms and Strategies for Treatment of Large Deformation Frictional Contact in the Numerical Simulation of Deep Drawing Process. Arch. Comput. Methods Eng. 2008, 15, 113–162. [Google Scholar] [CrossRef] [Green Version]
- Ferreira, F.F.; Neto, D.M.; Jesus, J.S.; Prates, P.A.; Antunes, F.V. Numerical Prediction of the Fatigue Crack Growth Rate in SLM Ti-6Al-4V Based on Crack Tip Plastic Strain. Metals 2020, 10, 1133. [Google Scholar] [CrossRef]
- Neto, D.; Borges, M.; Antunes, F.; Jesus, J. Mechanisms of fatigue crack growth in Ti-6Al-4V alloy subjected to single overloads. Theor. Appl. Fract. Mech. 2021, 114, 103024. [Google Scholar] [CrossRef]
- Borges, M.F.; Antunes, F.V.; Moreno, B.; Prates, P.; Camas, D.; Neto, D.M. Fatigue crack propagation analysis in 2024-T351 aluminium alloy using nonlinear parameters. Int. J. Fatigue 2021. submitted. [Google Scholar]
- Antunes, F.; Camas, D.; Correia, L.; Branco, R. Finite element meshes for optimal modelling of plasticity induced crack closure. Eng. Fract. Mech. 2015, 142, 184–200. [Google Scholar] [CrossRef] [Green Version]
- Gurson, A.L. Continuum Theory of Ductile Rupture by Void Nucleation and Growth: Part I—Yield Criteria and Flow Rules for Porous Ductile Media. J. Eng. Mater. Technol. 1977, 99, 2–15. [Google Scholar] [CrossRef]
- Chaboche, J.L.; Boudifa, M.; Saanouni, K. A CDM Approach of Ductile Damage with Plastic Compressibility. Int. J. Fract. 2006, 137, 51–75. [Google Scholar] [CrossRef]
- Malcher, L.; Pires, F.; de Sa, J.C. An extended GTN model for ductile fracture under high and low stress triaxiality. Int. J. Plast. 2014, 54, 193–228. [Google Scholar] [CrossRef]
- Xue, L. Ductile Fracture Modeling: Theory, Experimental Investigation and Numerical Verification. Ph.D. Thesis, Massachusetts Institute of Technology, Cambridge, MA, USA, 2009. [Google Scholar]
- Tvergaard, V. Influence of voids on shear band instabilities under plane strain conditions. Int. J. Fract. 1981, 17, 389–407. [Google Scholar] [CrossRef]
- Tvergaard, V. On localization in ductile materials containing spherical voids. Int. J. Fract. 1982, 18, 237–252. [Google Scholar] [CrossRef]
- Nielsen, K. Predicting failure response of spot welded joints using recent extensions to the Gurson model. Comput. Mater. Sci. 2010, 48, 71–82. [Google Scholar] [CrossRef]
- Malcher, L. Continuum Modelling and Numerical Simulation of Damage for Ductile Materials. Ph.D. Thesis, Universidade do Porto, Porto, Portugal, 2012. [Google Scholar] [CrossRef]
- Chu, C.C.; Needleman, A. Void Nucleation Effects in Biaxially Stretched Sheets. J. Eng. Mater. Technol. 1980, 102, 249–256. [Google Scholar] [CrossRef]
- Tvergaard, V.; Needleman, A. Analysis of the cup-cone fracture in a round tensile bar. Acta Met. 1984, 32, 157–169. [Google Scholar] [CrossRef]
- Goods, S.; Brown, L. Overview No. 1. Acta Met. 1979, 27, 1–15. [Google Scholar] [CrossRef]
- Chen, D.; Li, Y.; Yang, X.; Jiang, W.; Guan, L. Efficient parameters identification of a modified GTN model of ductile fracture using machine learning. Eng. Fract. Mech. 2021, 245, 107535. [Google Scholar] [CrossRef]
Figure 1.
Compact tension specimen used to model AA2024-T351, with dimensions in mm.

Figure 2.
Finite element mesh. The refined mesh is shown in the image on the bottom left corner.

Figure 3.
Loading cycles applied to the CT specimen. Fmin = 4.17 N, Fmax = 41.67 N, R = 0.1.

Figure 4.
Fatigue crack growth rate in terms of the initial porosity for two distinct crack lengths (a0 = 11.5 mm and a0 = 19 mm). Results are shown in natural scales. Nucleation and coalescence are disabled. (q1 = 1.5, q2 = 1, q3 = 2.25, Fmax = 41.67, Fmin = 4.17, R = 0.1, plane strain state).
Figure 4.
Fatigue crack growth rate in terms of the initial porosity for two distinct crack lengths (a0 = 11.5 mm and a0 = 19 mm). Results are shown in natural scales. Nucleation and coalescence are disabled. (q1 = 1.5, q2 = 1, q3 = 2.25, Fmax = 41.67, Fmin = 4.17, R = 0.1, plane strain state).

Figure 5.
Porosity growth due to the accumulation of plastic strain for distinct values of for: (a) a0 = 11.5 mm and (b) a0 = 19 mm. Results are shown in natural scales.
Figure 5.
Porosity growth due to the accumulation of plastic strain for distinct values of for: (a) a0 = 11.5 mm and (b) a0 = 19 mm. Results are shown in natural scales.

Figure 6.
Plastic strain accumulation vs. pseudo-time for the different values of .

Figure 7.
Crack closure level for: (a) a0 = 11.5 mm (b) a0 = 19 mm.

Figure 8.
da/dN in terms of each Tvergaard parameter for a0 = 11.5 mm. Results are shown in natural scales. Nucleation and coalescence are disabled. When q1 is changed: q2 = 1 and q3 = 2.25. When q2 is changed: q1 = 1.5 and q3 = 2.25. When q3 is changed: q1 = 1.5 and q2 = 1. (f0 = 0.01).
Figure 8.
da/dN in terms of each Tvergaard parameter for a0 = 11.5 mm. Results are shown in natural scales. Nucleation and coalescence are disabled. When q1 is changed: q2 = 1 and q3 = 2.25. When q2 is changed: q1 = 1.5 and q3 = 2.25. When q3 is changed: q1 = 1.5 and q2 = 1. (f0 = 0.01).

Figure 9.
(a) Plastic strain evolution for distinct values of q1. The q1 = 2 curve is almost indistinguishable because it is overlapped by the others. (b) Porosity evolution due to the increase in plastic strain. Results are shown in natural scales.
Figure 9.
(a) Plastic strain evolution for distinct values of q1. The q1 = 2 curve is almost indistinguishable because it is overlapped by the others. (b) Porosity evolution due to the increase in plastic strain. Results are shown in natural scales.

Figure 10.
(a) Plastic strain evolution in terms of the distinct values of q2. (b) Porosity evolution, due to the increase in plastic strain, for the same values of q2 previously referred. Results are shown in natural scales.
Figure 10.
(a) Plastic strain evolution in terms of the distinct values of q2. (b) Porosity evolution, due to the increase in plastic strain, for the same values of q2 previously referred. Results are shown in natural scales.

Figure 11.
Crack closure level for distinct values of q2. Results are presented in terms of the percentage of load cycles completed to the load cycles needed to propagation to occur.
Figure 11.
Crack closure level for distinct values of q2. Results are presented in terms of the percentage of load cycles completed to the load cycles needed to propagation to occur.

Figure 12.
(a) Plastic strain evolution in terms of the distinct values of q3. (b) Porosity evolution, due to the increase in plastic strain, for the same values of q3 previously referred. Results are shown in natural scales.
Figure 12.
(a) Plastic strain evolution in terms of the distinct values of q3. (b) Porosity evolution, due to the increase in plastic strain, for the same values of q3 previously referred. Results are shown in natural scales.

Figure 13.
da/dN in terms of , for an initial crack length of 11.5 mm in: (a) log-log scales; (b) natural scales. Coalescence is disabled, (q1 = 1.5, q2 = 1, q3 = 2.25, f0 = 0.01, 0.25 and = 0.1).
Figure 13.
da/dN in terms of , for an initial crack length of 11.5 mm in: (a) log-log scales; (b) natural scales. Coalescence is disabled, (q1 = 1.5, q2 = 1, q3 = 2.25, f0 = 0.01, 0.25 and = 0.1).

Figure 14.
(a) Evolution of plastic strain for the same entire propagation depending on the
0.015. With
value. (b) Evolution of porosity in terms of plastic strain for the different values of , porosity is in logarithmic scale.
Figure 14.
(a) Evolution of plastic strain for the same entire propagation depending on the
0.015. With
value. (b) Evolution of porosity in terms of plastic strain for the different values of , porosity is in logarithmic scale.

Figure 15.
Crack closure through the same propagation studied in Figure 6.
Figure 15.
Crack closure through the same propagation studied in Figure 6.

Figure 16.
da/dN in terms of different values of
Results are presented in natural scales. Coalescence is disabled, q1 = 1.5, q2 = 1, q3 = 2.25, f0 = 0.01, 0.01, and = 0.1.
Figure 16.
da/dN in terms of different values of
Results are presented in natural scales. Coalescence is disabled, q1 = 1.5, q2 = 1, q3 = 2.25, f0 = 0.01, 0.01, and = 0.1.

Figure 17.
(a) Evolution of plastic strain for the same entire propagation depending on the
value. (b) Evolution of porosity in terms of plastic strain for the different values of . All the results are in natural scales.
Figure 17.
(a) Evolution of plastic strain for the same entire propagation depending on the
value. (b) Evolution of porosity in terms of plastic strain for the different values of . All the results are in natural scales.

Figure 18.
Effect of
on da/dN. Results are presented in natural scales for three distinct values of : 0.01, 0.1, and 0.2. Coalescence is disabled, q1 = 1.5, q2 = 1, q3 = 2.25, f0 = 0.01, 0.01, and = 0.25.
Figure 18.
Effect of
on da/dN. Results are presented in natural scales for three distinct values of : 0.01, 0.1, and 0.2. Coalescence is disabled, q1 = 1.5, q2 = 1, q3 = 2.25, f0 = 0.01, 0.01, and = 0.25.

Figure 19.
(a) Plastic strain evolution throughout a single propagation for the three values of
(b) Porosity build-up for the same propagations referred before. Results are presented in natural scales.
Figure 19.
(a) Plastic strain evolution throughout a single propagation for the three values of
(b) Porosity build-up for the same propagations referred before. Results are presented in natural scales.

Figure 20.
Porosity accumulation due to the occurrence of plastic strain at the Gauss point located immediately after the node containing the crack tip.
Figure 20.
Porosity accumulation due to the occurrence of plastic strain at the Gauss point located immediately after the node containing the crack tip.

Figure 21.
Sensitivity analysis carried out on the following parameters: ; ; ; ; ; and .


Table 1.
Elastic properties of 2024-T351 aluminium alloy and parameters for the Swift isotropic hardening law combined with the Armstrong–Frederick kinematic hardening law.
Table 1.
Elastic properties of 2024-T351 aluminium alloy and parameters for the Swift isotropic hardening law combined with the Armstrong–Frederick kinematic hardening law.
| Material | E (GPa) | ||||||
|---|---|---|---|---|---|---|---|
| AA 2024-T351 | 72.26 | 0.29 | 288.96 | 389.00 | 0.056 | 111.84 | 138.80 |
Publisher’s Note: MDPI stays neutral with regard to jurisdictional claims in published maps and institutional affiliations. |
© 2021 by the authors. Licensee MDPI, Basel, Switzerland. This article is an open access article distributed under the terms and conditions of the Creative Commons Attribution (CC BY) license (https://creativecommons.org/licenses/by/4.0/).
Share and Cite
MDPI and ACS Style
Sérgio, E.R.; Antunes, F.V.; Neto, D.M.; Borges, M.F. Study on the Influence of the Gurson–Tvergaard–Needleman Damage Model on the Fatigue Crack Growth Rate. Metals 2021, 11, 1183. https://0-doi-org.brum.beds.ac.uk/10.3390/met11081183
AMA Style
Sérgio ER, Antunes FV, Neto DM, Borges MF. Study on the Influence of the Gurson–Tvergaard–Needleman Damage Model on the Fatigue Crack Growth Rate. Metals. 2021; 11(8):1183. https://0-doi-org.brum.beds.ac.uk/10.3390/met11081183
Chicago/Turabian StyleSérgio, Edmundo R., Fernando V. Antunes, Diogo M. Neto, and Micael F. Borges. 2021. "Study on the Influence of the Gurson–Tvergaard–Needleman Damage Model on the Fatigue Crack Growth Rate" Metals 11, no. 8: 1183. https://0-doi-org.brum.beds.ac.uk/10.3390/met11081183
Note that from the first issue of 2016, this journal uses article numbers instead of page numbers. See further details here.