Article

Influence of Electron Beam Welding Parameters on the Microstructure Formation and Mechanical Behaviors of the Ti and Ni Dissimilar Metals Welded Joints

1
Department of Welding and Joining of Materials, Institute of Production Technologies, Faculty of Materials Science and Technology in Trnava, Slovak University of Technology in Bratislava, J. Bottu 25, 917 24 Trnava, Slovakia
2
Department of Manufacturing Technology, Faculty of Mechanical Engineering, Czech Technical University in Prague, Technická 4, 166 07 Prague, Czech Republic
3
Institute of Materials Science, Faculty of Materials Science and Technology in Trnava, Slovak University of Technology in Bratislava, J. Bottu 25, 917 24 Trnava, Slovakia
4
Institute of Materials Science, Joining and Forming, Graz University of Technology, Kopernikusgasse 24/I, 8010 Graz, Austria
*
Author to whom correspondence should be addressed.
Submission received: 22 March 2022 / Revised: 10 May 2022 / Accepted: 19 May 2022 / Published: 24 May 2022

Abstract

:
Commercially pure titanium Ti Grade 2, 2 mm in thickness, was welded to 2 mm thick nickel alloy 201 with electron beam welding. Various welding parameters were used to create the butt-welded joints. The innovation herein consists of welding two dissimilar metals that are declared non-weldable. The welding current used for electron beam welding was 40–70 mA and welding speeds were 20–50 mm/s. In this experiment, we tested two offsets of the electron beam, which were 100–300 μm to the nickel side and 200 μm to the titanium side. It was observed that the offset of the beam had no effect on the weld joint’s strength. The samples were subjected to a visual test in which longitudinal and transverse cracks were recorded along the whole weld. Only four samples retained the integrity of the joint. Microstructures of the weld joints were examined by scanning confocal and scanning electron microscopy. Energy dispersive spectroscopy (EDS) analysis confirmed the phase constitution inside the weld regions and the fusion interfaces. Tensile strength and microhardness tests were used to evaluate the mechanical parameters of the Ti/Ni welded joint. The results showed that cracking of brittle Ni–Ti intermetallic phases in electron beam welded joints occurred. The microstructure in the fusion zone’s center part was primarily NiTi and Ti2Ni. No clear correlation was found between heat input or welding parameters—welding current and welding speed—and tensile strength. The strain–tensile strength curve resulted in brittle fracturing. The hardness of the weld zone was five times higher than that of the base metal and heat-affected zone. The amount of heat input into the welded metal is as critical as the large asymmetry in heat transport that controls the process of solidification from each side of the base metal.

1. Introduction

Titanium alloys are popular construction materials in the aerospace industry due to their high specific strength [1,2]. Above 600 °C, the favorable mechanical properties of these materials diminish significantly [3]. On the contrary, Ni-based alloys can maintain their mechanical properties at higher temperatures, even above 1000 °C [4,5,6]. The dissimilar Ti and Ni weld joints in manufactured and assembled components [7,8] reduce material costs compared to the application of a single material, provide design flexibility, and frequently lead to improved performance [7]. It is important to gain knowledge about joining Ti and Ni alloys and creating a quality welded joint. When the difficulties arising from the high affinity of titanium to oxygen have been overcome, then a major metallurgical problem arises from the formation of the intermetallic phases in the Ti–Ni system [9]. The principals for understanding the welding process of Ti and Ni are in the binary diagram shown in Figure 1. The NiTi phase is represented as hatching, and it only covers a very small area; under 630 °C, it is just a line at 50 at. % Ni, 50 at. % Ti. In accordance with the Ti–Ni binary phase diagram, outside of this narrow central zone, many kinds of Ti–Ni intermetallic compounds (IMC) will form in the weld [10]. If the redundancy of Ti and Ni in the matrix are in the brittle phases, Ti2Ni and TiNi3 arise. The phases Ti2Ni and TiNi3 are stable intermetallic phases that have unacceptable properties besides the base metal (BM). The welded joint will become unacceptable if the volume of these precipitates grows. These intermetallic phases are subsidized by the heat input and the contamination with oxygen, nitrogen, and iron [11,12,13,14,15]. Chatterjee et al. [16] found brittle NiTi2 and Ni3Ti intermetallic compounds in laser welding butt joints of dissimilar Ti–Ni metals.
Solid-state welding methods are used for dissimilar metal joining due to the fact that the base metals can be kept solid during these procedures. Solid-state welding of nickel and titanium is very difficult to perform successfully, due to the limited solubility of nickel in alpha titanium at room temperature [17]. Although solid-state welding approaches appear to be promising for addressing brittleness caused by the creation of an IMC layer, they have significant limitations and are not advised for some situations. Consequently, it is necessary to study the fusion process for welding dissimilar metals for the next research.
The fusion welding method of dissimilar metals brings a set of difficulties which do no appear in the welding of similar metals. One significant distinction in dissimilar metal welding (DMW) is that the various thermo-physical properties of the base metals (melting point, thermal conductivity, specific heat, density) influence the macrostructure and microstructure formation. The binary diagram of a Ti/Ni couple provides a model for all systems, for example, Ti to stainless steel (SS) [18,19,20], Ti3Al alloy to Ni alloy [21], Ti6Al4V to SS [22,23,24], NiTi to Ti6Al4V [25], Ti6Al4V to Inconel 718 [7], NiTi to SS [26,27,28,29,30], and NiTi to Ni alloy [21], for the investigation of the fundamentals of microstructure formation.
Some of the first attempts to joint Ti/Ni by electron beam welding (EBW) reported the creation of intermetallic phases which caused brittleness in these welding joints [30]. “The most common fusion welding technology for joining different metals is electron beam welding because of its benefits, which include a high density of energy, vacuum, heating position, and area control” [31]. Among other things, a very narrow HAZ is produced. The electron beam welding method was successfully used for the joining of Ti3Al–TC4 titanium alloys [32]. In the creation of welded joints with IMC formed, for electron beam welding and laser beam welding, filler metals are frequently required. Gao et al. [33] performed the laser beam welding of the Ti6Al4 titanium alloy and 304L stainless steel using an Mg interlayer. As a result, the welded joint in terms of 221 MPa tensile strength was achieved. An intermetallic phase of Mg17Al12 was observed in the Ti–weld interface, but there was no intermetallic phase in the SS–weld interface. Wang et al. [34,35] reported electron beam welds without cracks and with 310 MPa tensile strength. The welded joint was mainly formed by a Cu solid solution. The thin Cu–Ti IMC was formed in the titanium–weld interface. Tomashchuk et al. [22] came to the conclusion that the interlayer of a pure copper used in the Ti/Fe welds produced by electron beam welding reduced but did not eliminate the formation of brittle phases of Ti–Fe and Ti–Cr. The local cumulating of Cu–Ti and Cu–Fe–Ti phases decreased the strength of the welds, and it was allowed to join.
Compared to other joining processes, fusion welding is always a preferable choice due to its potential ability to produce joints with good metallurgical bonding and mechanical integrity. However, in terms of dissimilar Ti and Ni metals, technical challenges remain, such as process-induced brittle intermetallic compounds (IMCs) and thermal stress [36,37], resulting from not only their different thermo-physical-mechanical properties, but most importantly, also their limited metallurgical miscibility in room temperature [7,30,38]. In this paper, the composition of phases, microstructures, and mechanical properties of the welded joints are analyzed.
The experimental works were part of comprehensive research which has been motivated by the necessity to adjust welding parameters carefully and to protect the materials by vacuum. No comprehensive study dealing with careful investigation of the effects of different welding conditions on the microstructure and properties of these materials had been performed prior. The paper brings some novel and important findings. First, it should be mentioned the used welding parameters affected the penetration depth, the fusion zone width, and also the width of heat affected zone in the welded joints. Second, we determined the relationships between the obtained microstructures, hardness, ultimate tensile strength, and ductility. Finally, the obtained results from the tensile strength testing were coupled with fractographical analysis of the specimens from the tensile tests.

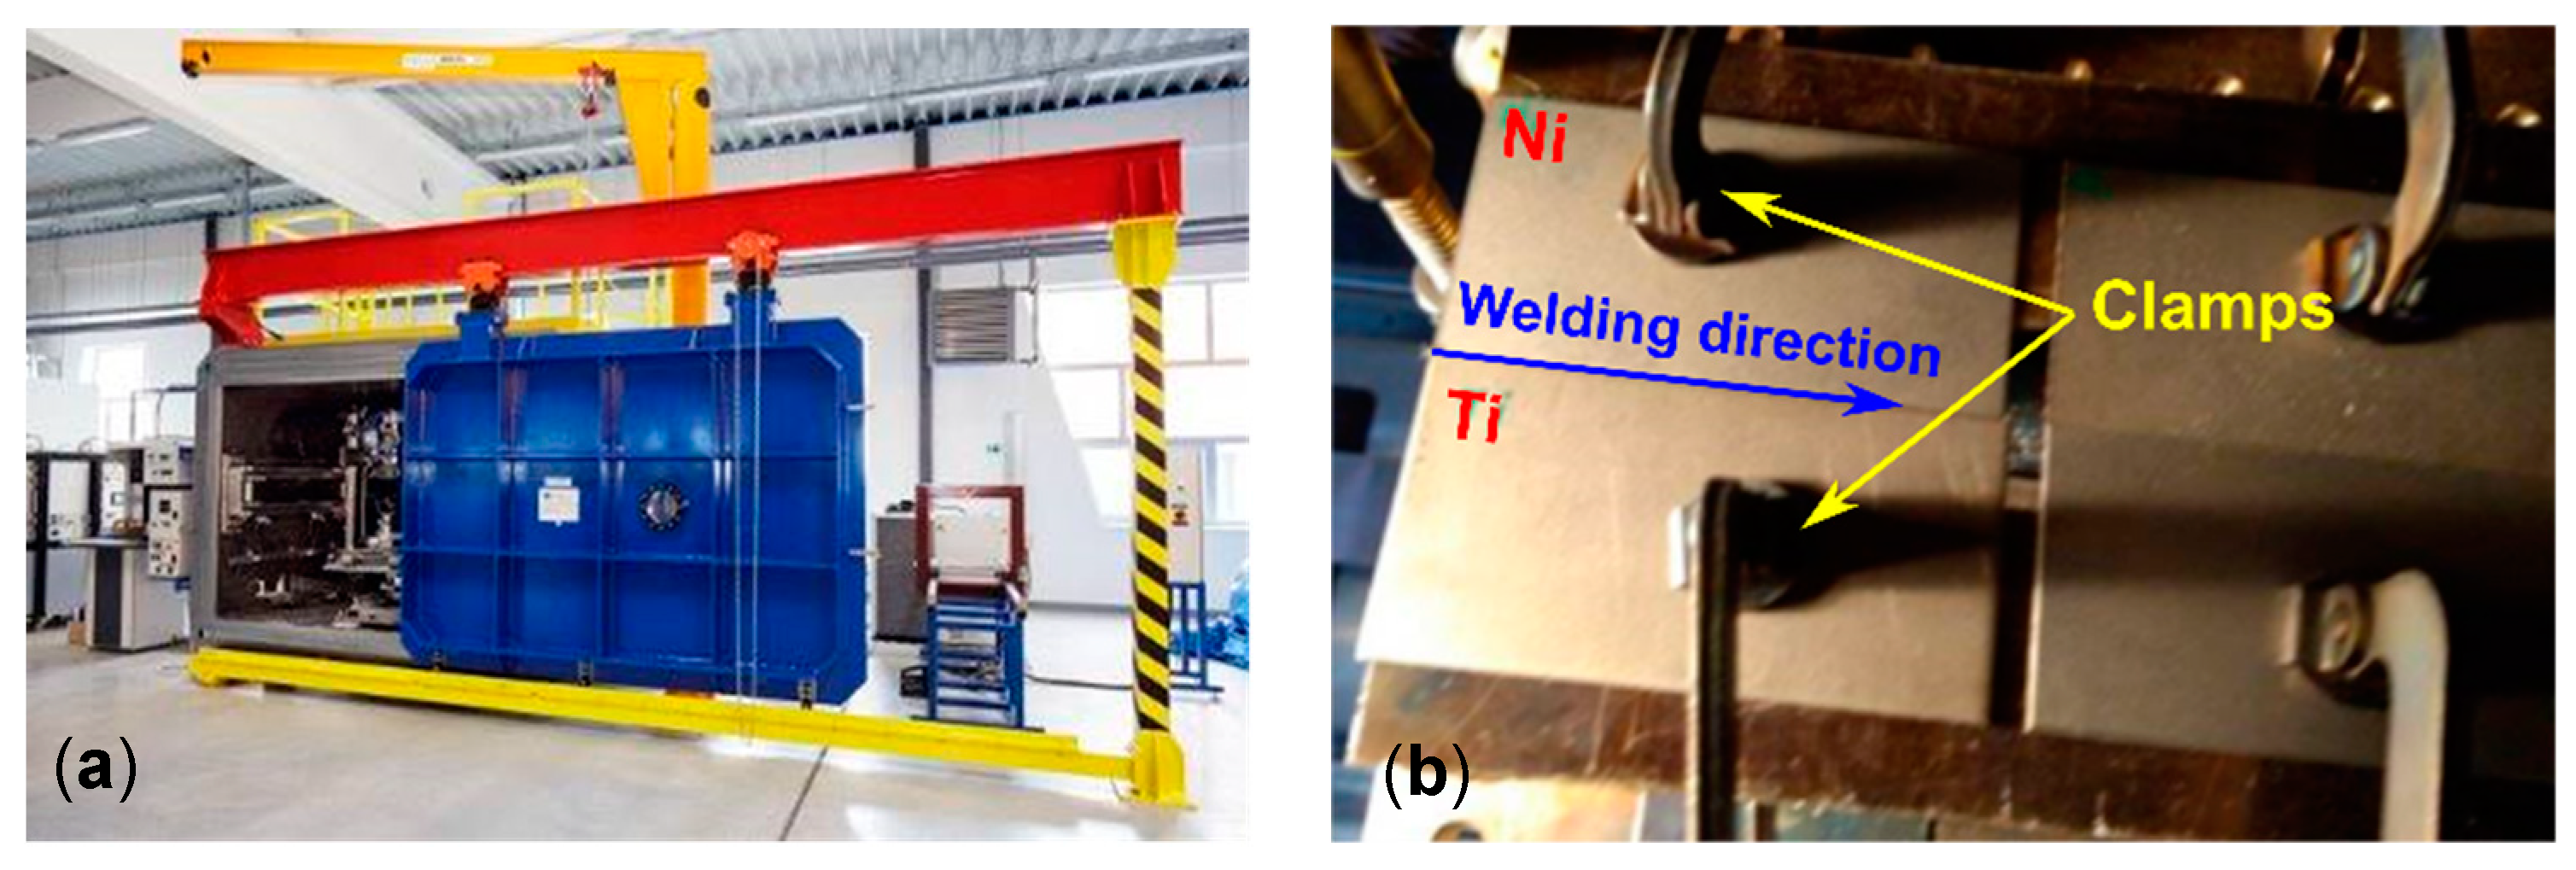
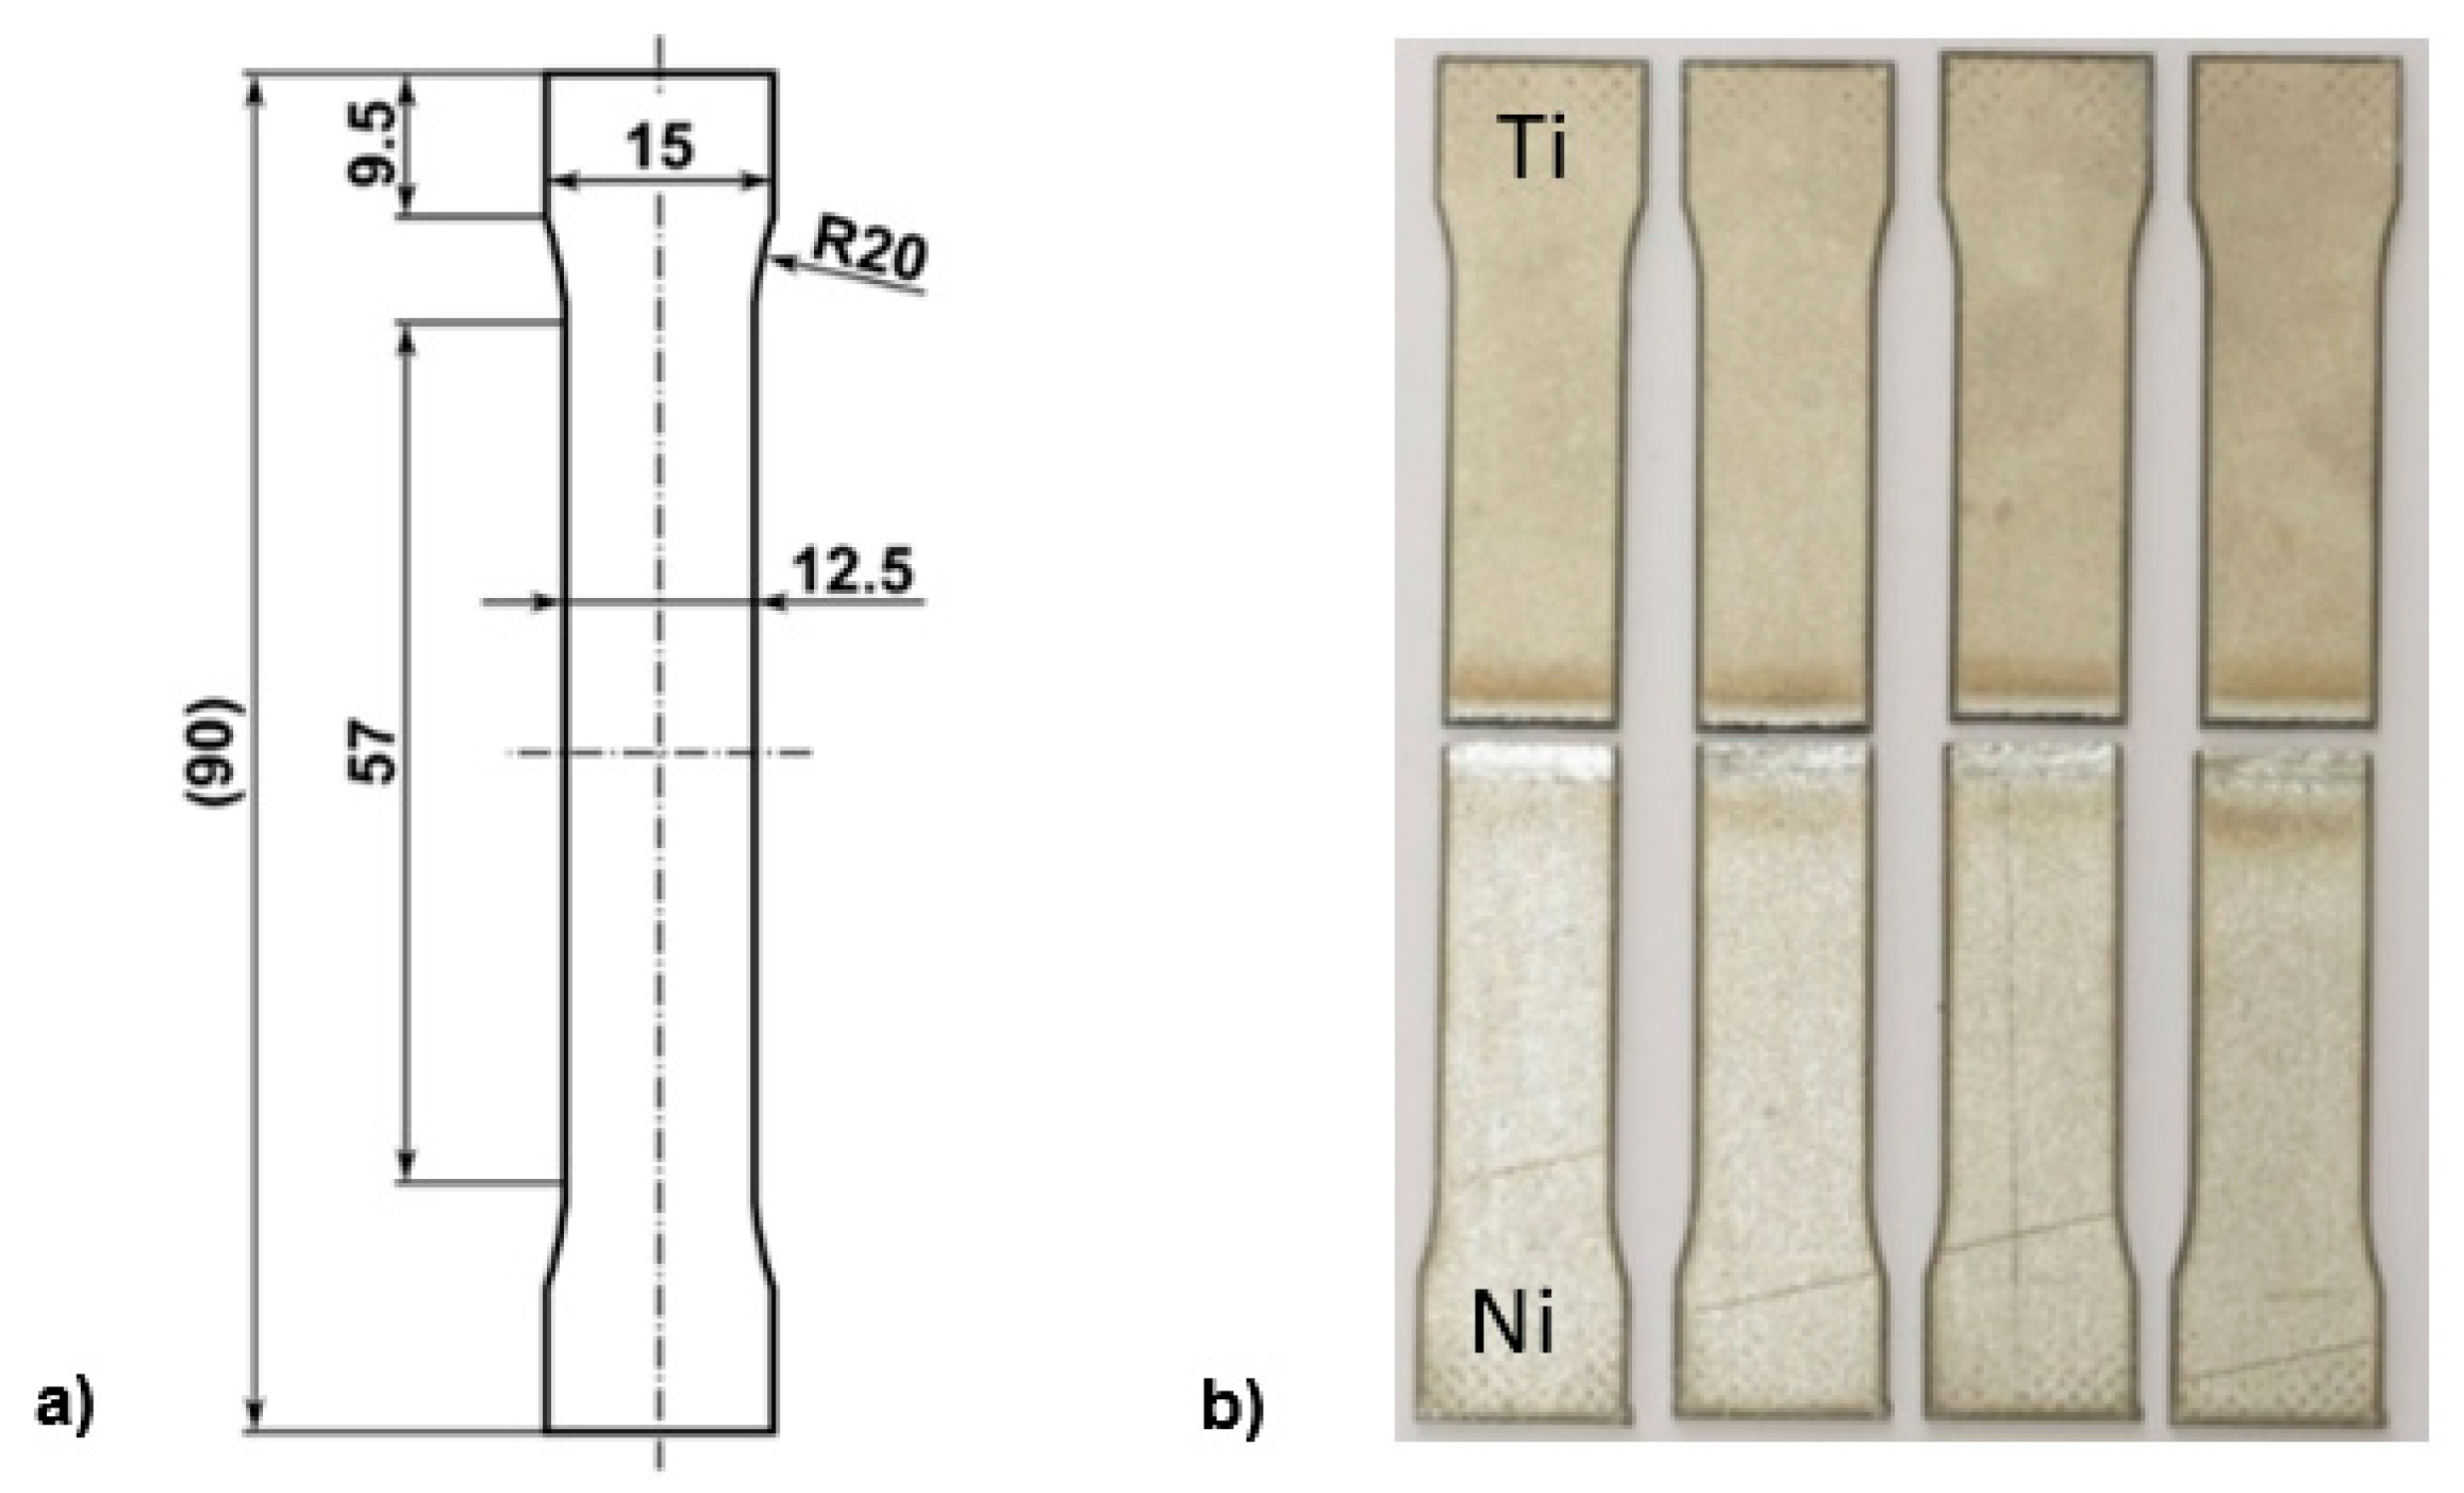
2. Materials and Methods

Titanium Grade 2 (a technically pure material with favorable mechanical properties and high corrosion resistance) and commercially pure Nickel Ni 201 (with high resistance to corrosion and good toughness) with dimensions of 50 × 100 × 2 mm were used as base materials. Table 1 and Table 2 show the chemical compositions of the base materials. The chemical compositions of these base materials were measured using a Bruker Q4 TASMAN optical emission spectrometer (Bruker, Madison, WI, USA). The average values of three different places were calculated for chemical composition. Energy dispersive spectroscopy (EDS) (JEOL Ltd., Tokyo, Japan) analysis confirmed the phase constitution inside the weld regions and the fusion interfaces. The base material’s mechanical properties are given in Table 3 and Table 4. Milling was done on the weld surfaces to ensure precise contact, and acetone was used to remove the oxidation coating. The plates to be welded were clamped in the fixture with minimum restraint in a butt weld geometry and placed into the vacuum chamber (Figure 2). PZ EZ 30 STU electron beam welding complex (First Welding Company, Bratislava, Slovakia) was used for joining dissimilar metals. The maximum accelerating voltage of the equipment is 60 kV. An accelerating voltage of 55 kV was used in the study. A vacuum of 10−2 Pa was created in the chamber, and the vacuum in an electron gun was 10−5 Pa. With the help of a technological computer, the welding parameters were set, which were designed on the basis of literature reporting the same or similar issues, and we performed tests. The experiments consisted of 16 welds. The value of the welding current was changed in the range of 40 to 70 mA, and the welding speed was 20 to 50 mm/s. The electron beam was focused on the top surfaces of the materials to be welded, i.e., a focusing current of 890 mA was used. Positive beam offset was set to Ni 100, 200, and 300 µm (samples 2, 3, 4), and negative beam offset was to the Ti side 200 µm (sample 5) (Table 5). Furthermore, samples 15 and 16 were welded using circular oscillation.
Table 5 and Table 6 list the welding parameters used in the experiment with calculated heat inputs. The following equation [25] was used to calculate the heat input in electron beam welding:
Q = I · U · k v   ( J / mm )
where is welding current in mA; U is accelerating voltage in kV; k is thermal efficiency, which can be 0.9–1.0 [37]; and v is welding speed (mm/s). Thermal efficiency k was 1.0 in our calculations.
Visual inspection was performed for all sixteen samples. Based on the results of the visual inspection, samples 1, 6, 8, and 10 were selected for more detailed analysis. The cross-sections of weld joints were analyzed by ZEISS LSM 700 laser scanning confocal microscope. An etchant with the composition HCl, 50 mL; H2O, 40 mL; HNO3, 10 mL; and CuCl2, 2.5 g, was used to indicate the microstructures of the base metals and Ni-rich weld metal. This process took about 20 s. After purification, the samples were prepared for macroscopic and microscopic analysis. JEOL JSM 7600 F scanning electron microscope (SEM) was applied for the study of chemical composition and microstructure analysis. On etched samples, EDS evaluation was carried out. Microhardness was measured across weld joints by a Buehler IndentaMet 1100 Series tester with the loading of 0.98 N (HV0.1). The distance between gaps was 100 µm. Across the middle of samples 1, 6, 8, and 10, thickness was measured. Dwell time was 10 s. The hardness measurements for the contour plot of samples 8 and 10 were performed with an automated EMCO M1C (EMCO Test, Kuchl, Austria) hardness machine due to the standard DIN EN SO 6507-4: 2006-03. Vickers (HV) indentations with a load of 1.96 N (HV0.2) were performed in a dwell time of 15 s. The distance between indentations was 0.3 mm, and contour plots were derived using Matlab routine (The Mat Works, Natick, MA, USA). For tensile strength tests, we used the LabTest 5.250 SP1-VM tensile testing machine (LABORTECH s.r.o., Opava, Czech Republic). The specimens are in Figure 3. The crosshead speed was 3 mm/s.

3. Results

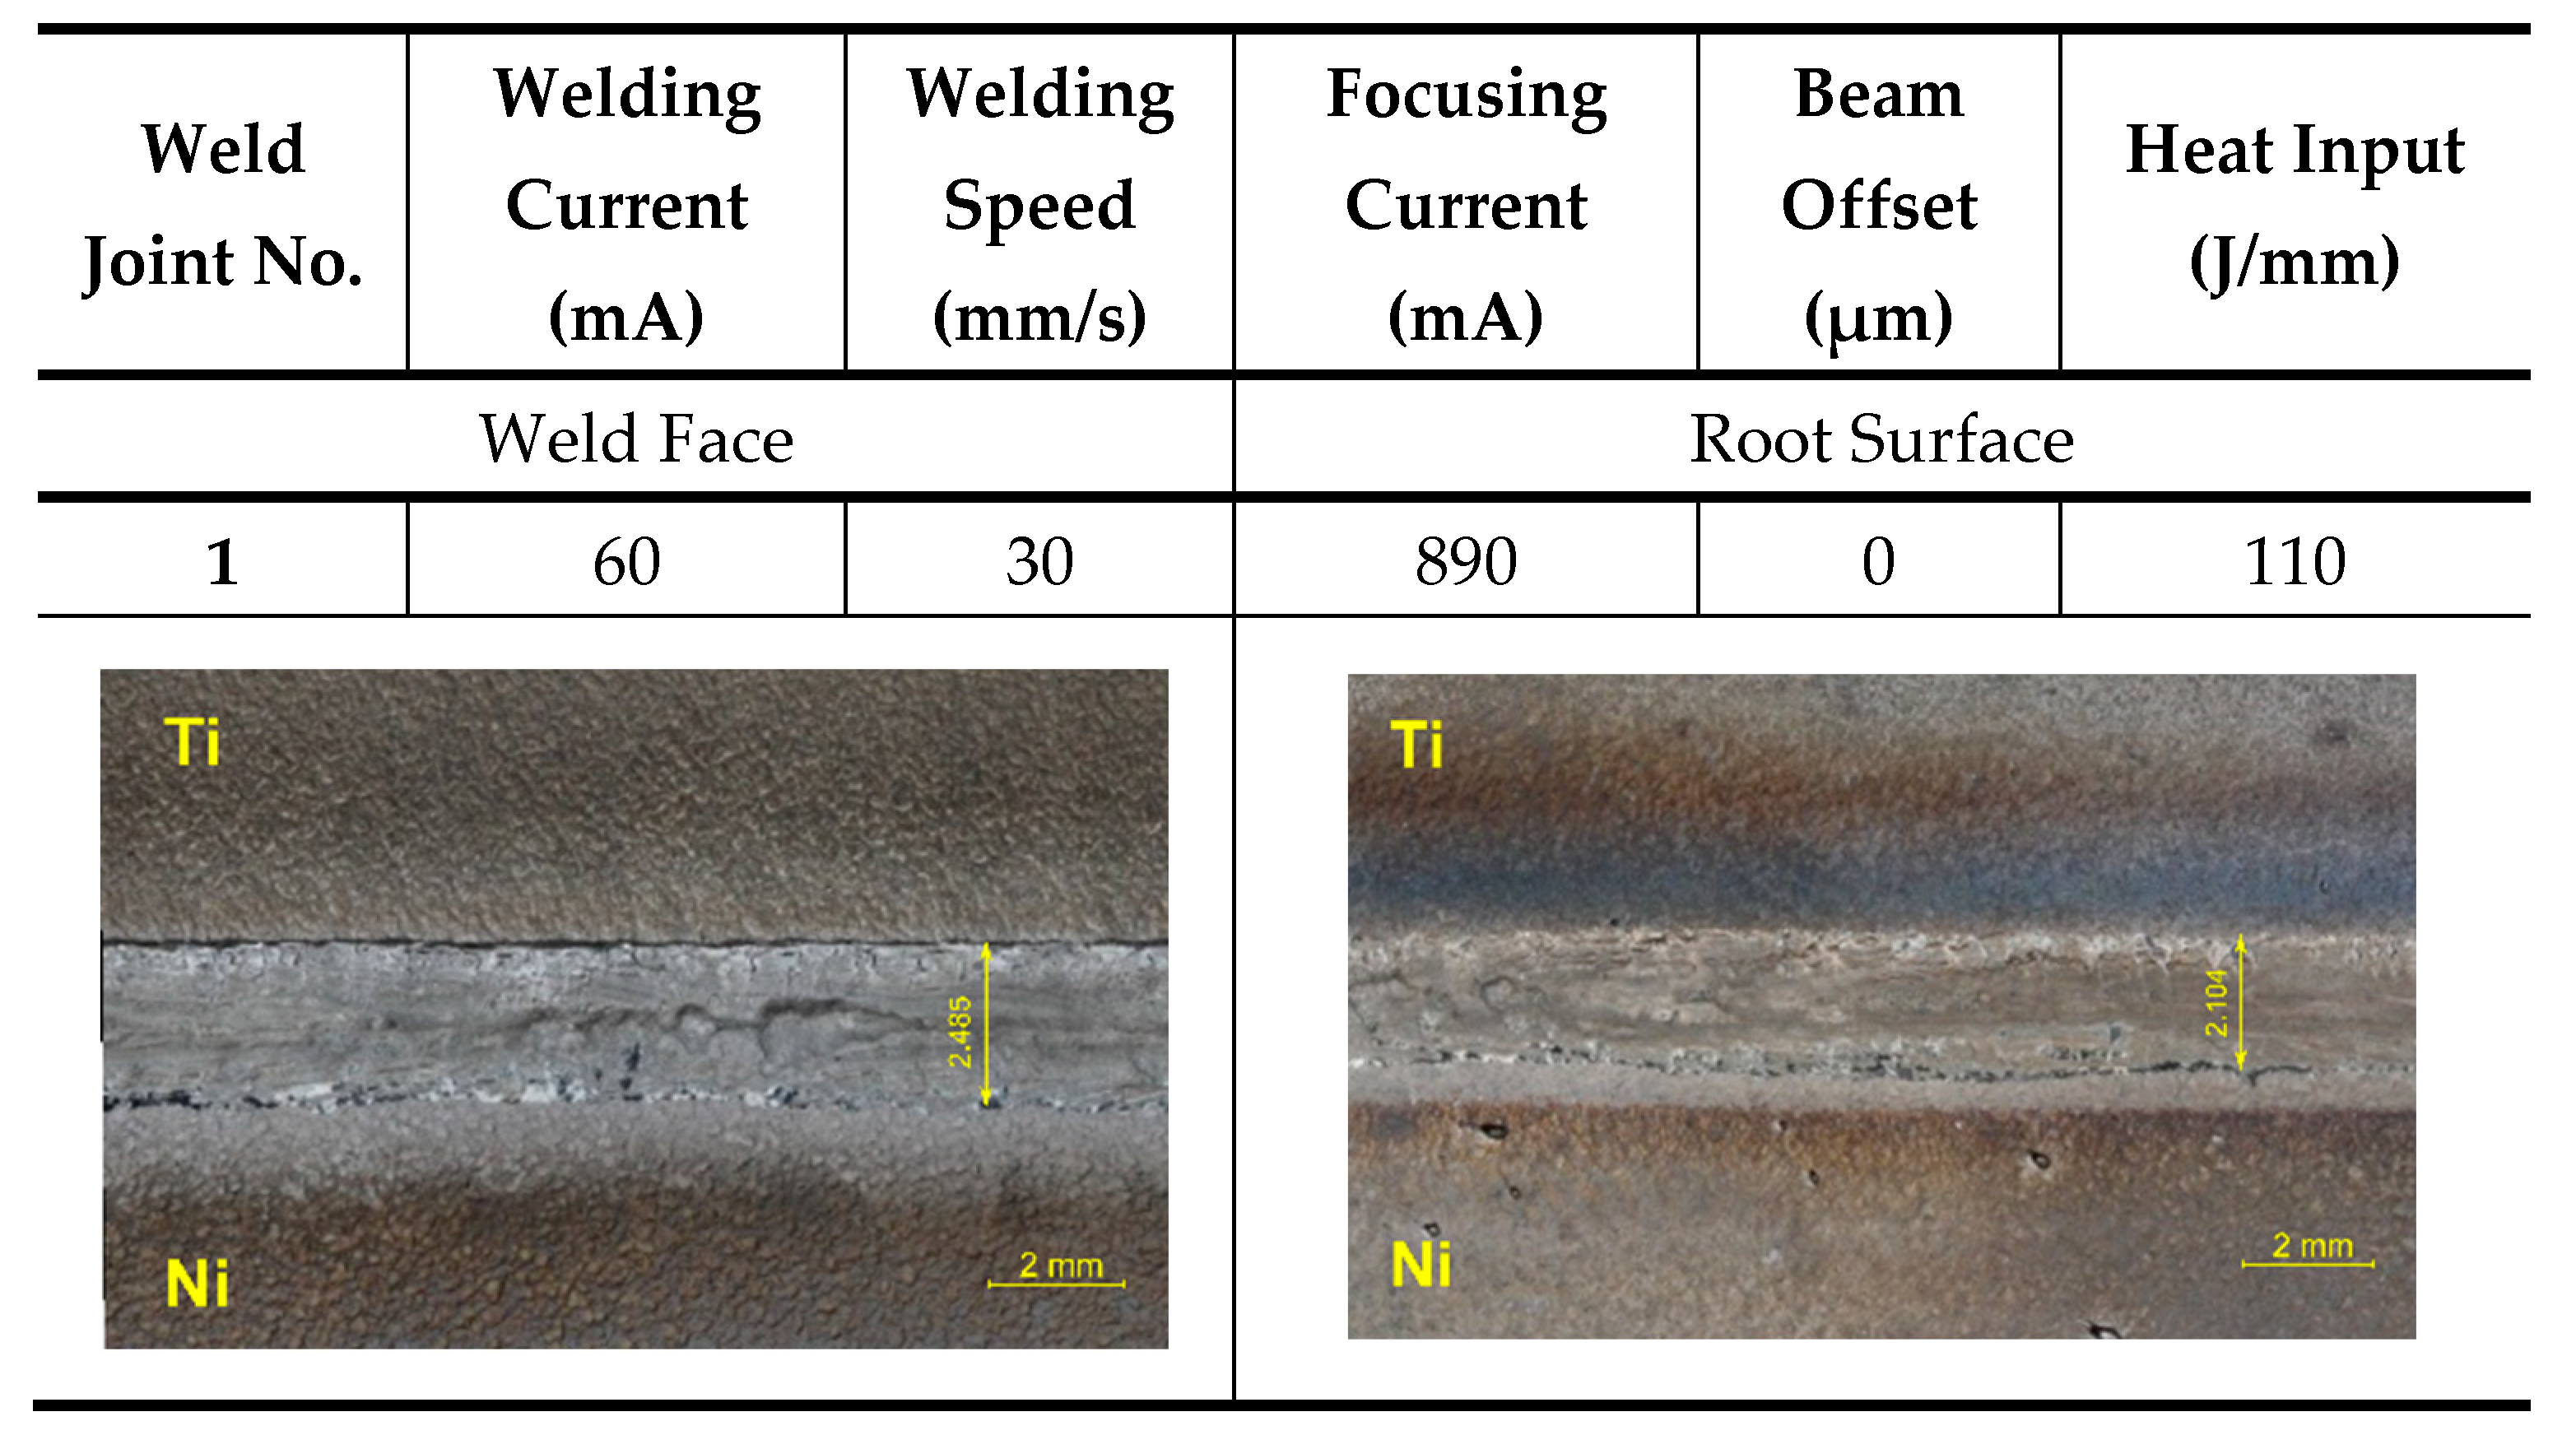
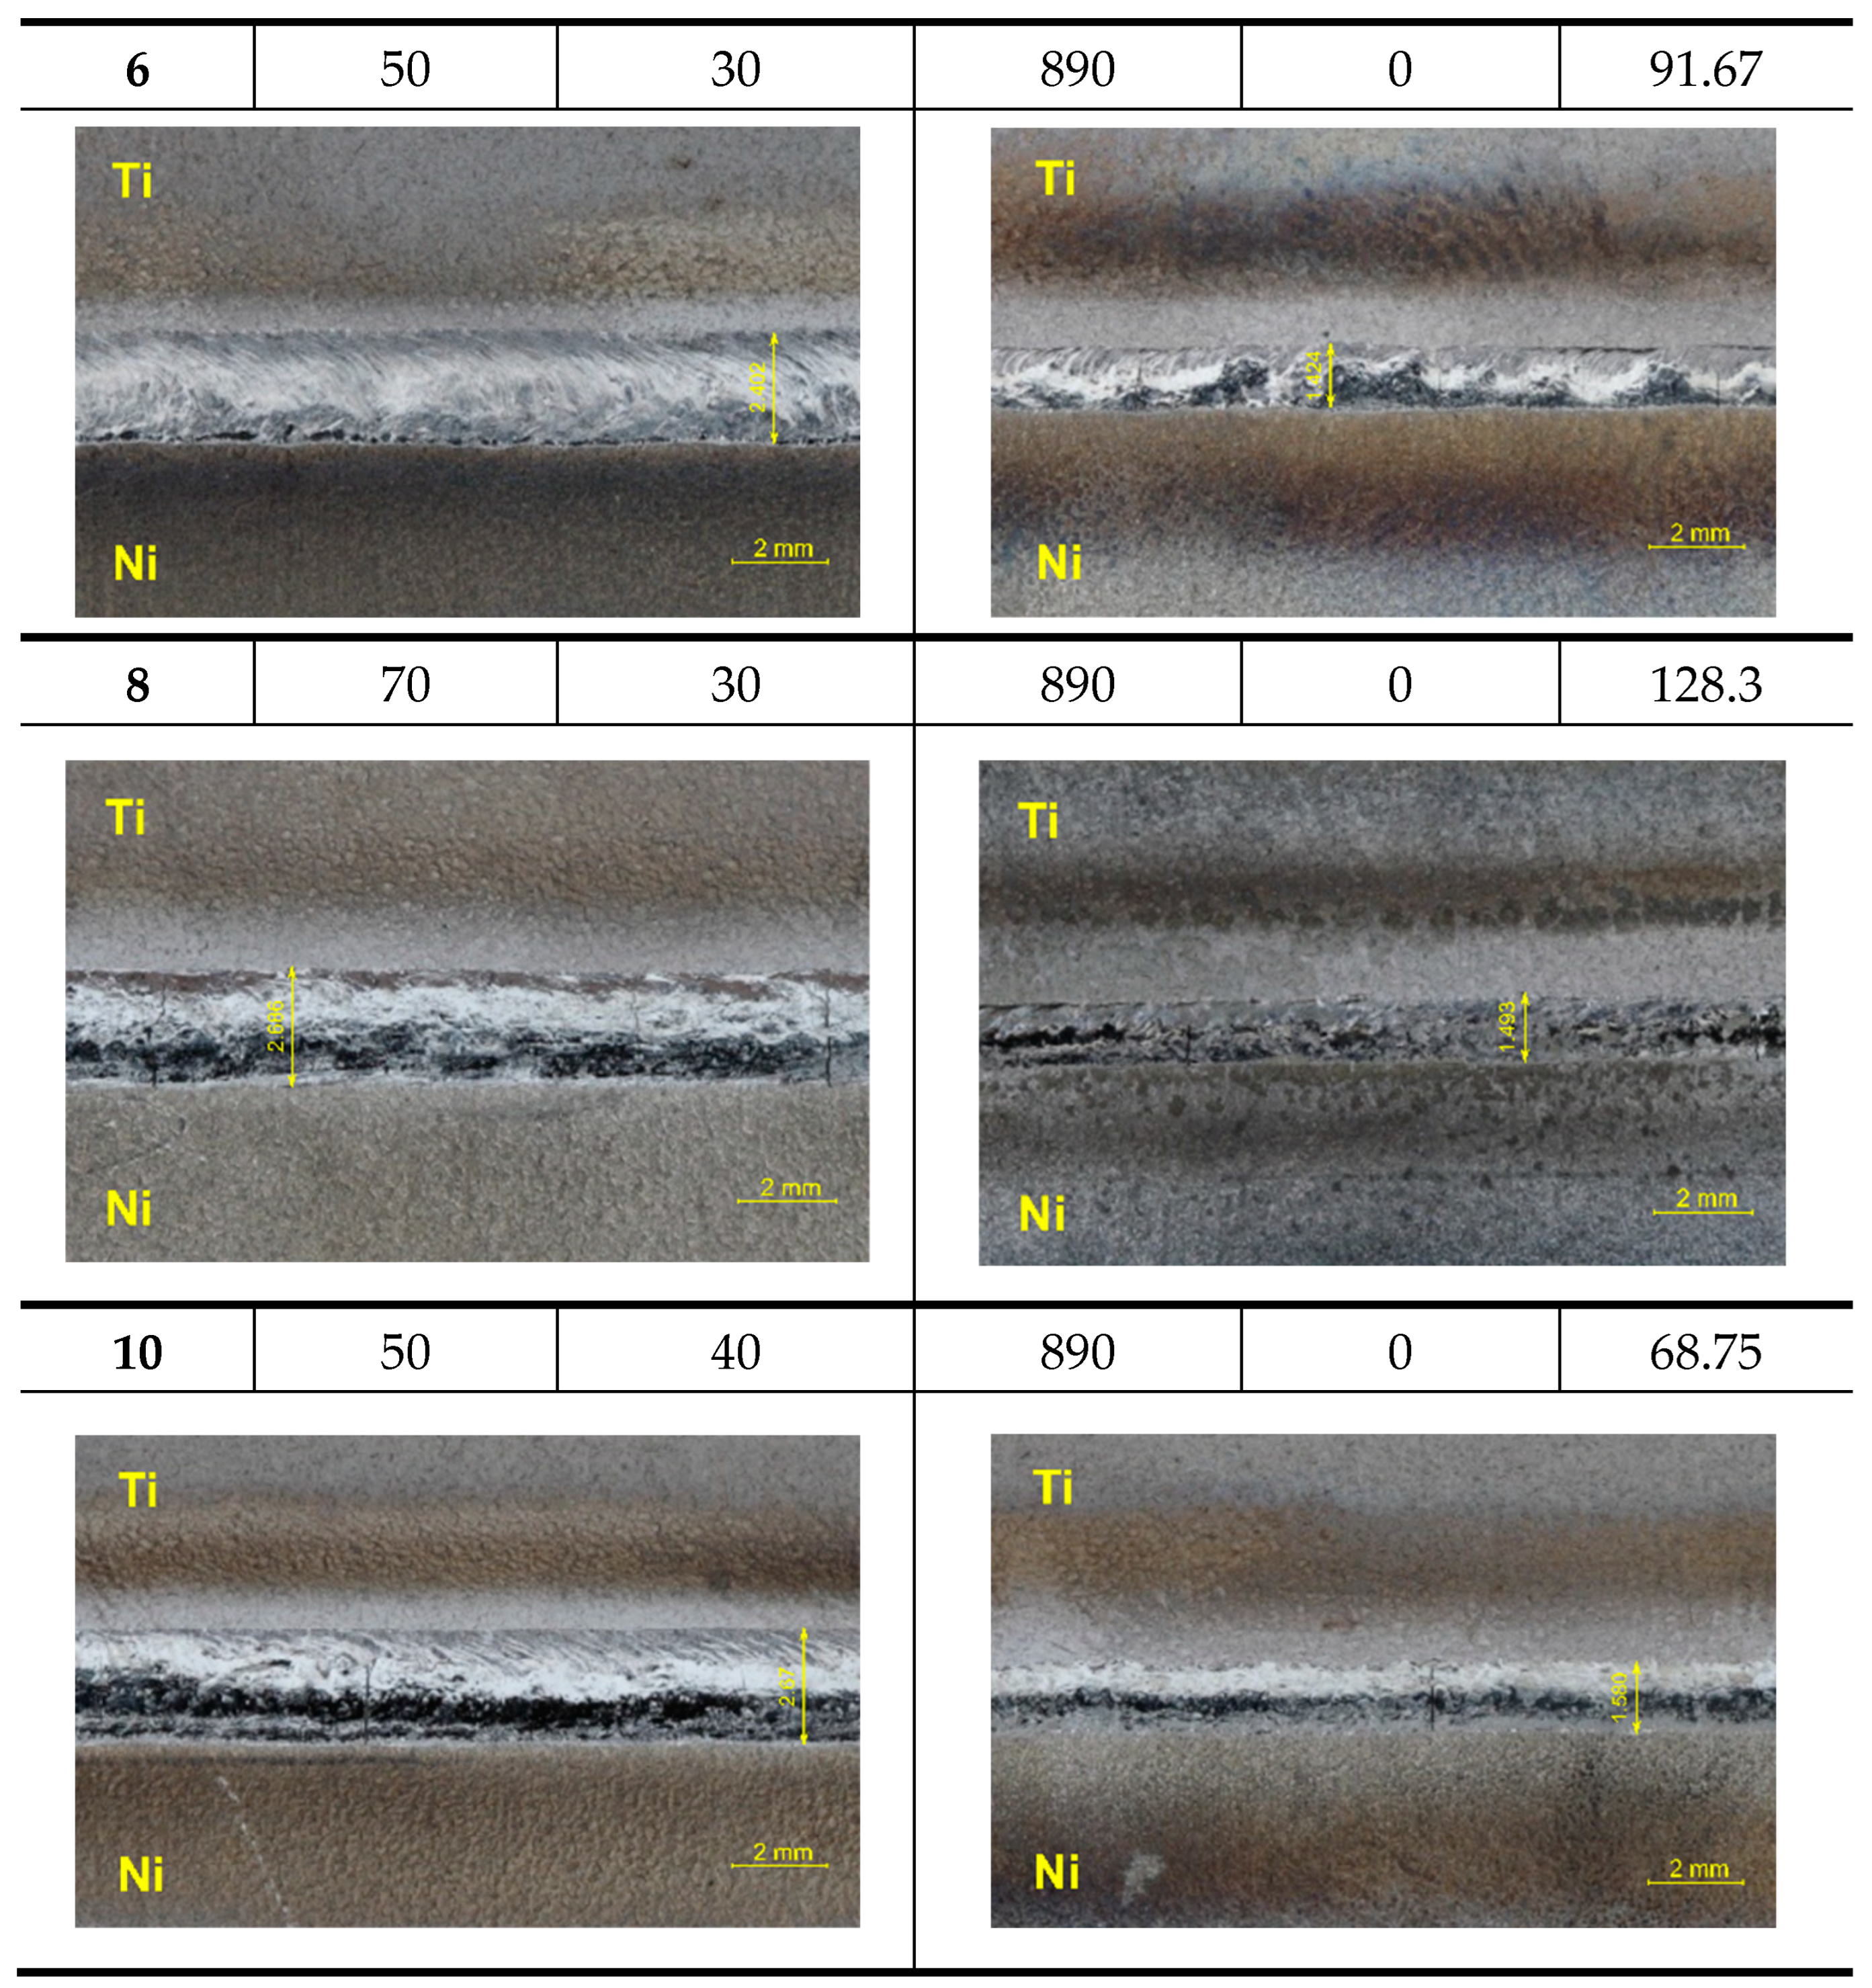
3.1. Weld Bead and Root Appearance

The samples visually assessed, during which longitudinal and transverse cracks were recorded along the whole weld. Cracking in the weld after solidification led to a loss of the integrity of the welded joint. The welds fell apart. Only four samples 1, 6, 8, and 10 retained the integrity of the joint and were prepared by the parameters shown in Table 5.
Figure 4 shows the appearance of the weld bead and root for dissimilar welded joints 1, 6, 8, and 10. The width of the weld bead was in the range of 2.402–2.686 mm (Table 7). The weld bead surface of sample 1 was where the crack was located. For sample 8, the weld root was located in the crack. In both samples, the heat input was higher than in samples 6 and 10. A low heat input per unit length of an EBW weld can significantly reduce residual strains and prevent cracking of the bead and root of the weld joint. The surfaces of the weld bead and root of samples 6 and 10 (Figure 4) were uniform and smooth. The mentioned welded joints were produced with lower heat inputs of 68.75 and 91.67 J/mm. The welding speed was constant at 30 mm/s, but for sample 10 it was increased, thereby reducing the heat input as much as possible. The results in relation to heat input and weld width are shown in Figure 5.

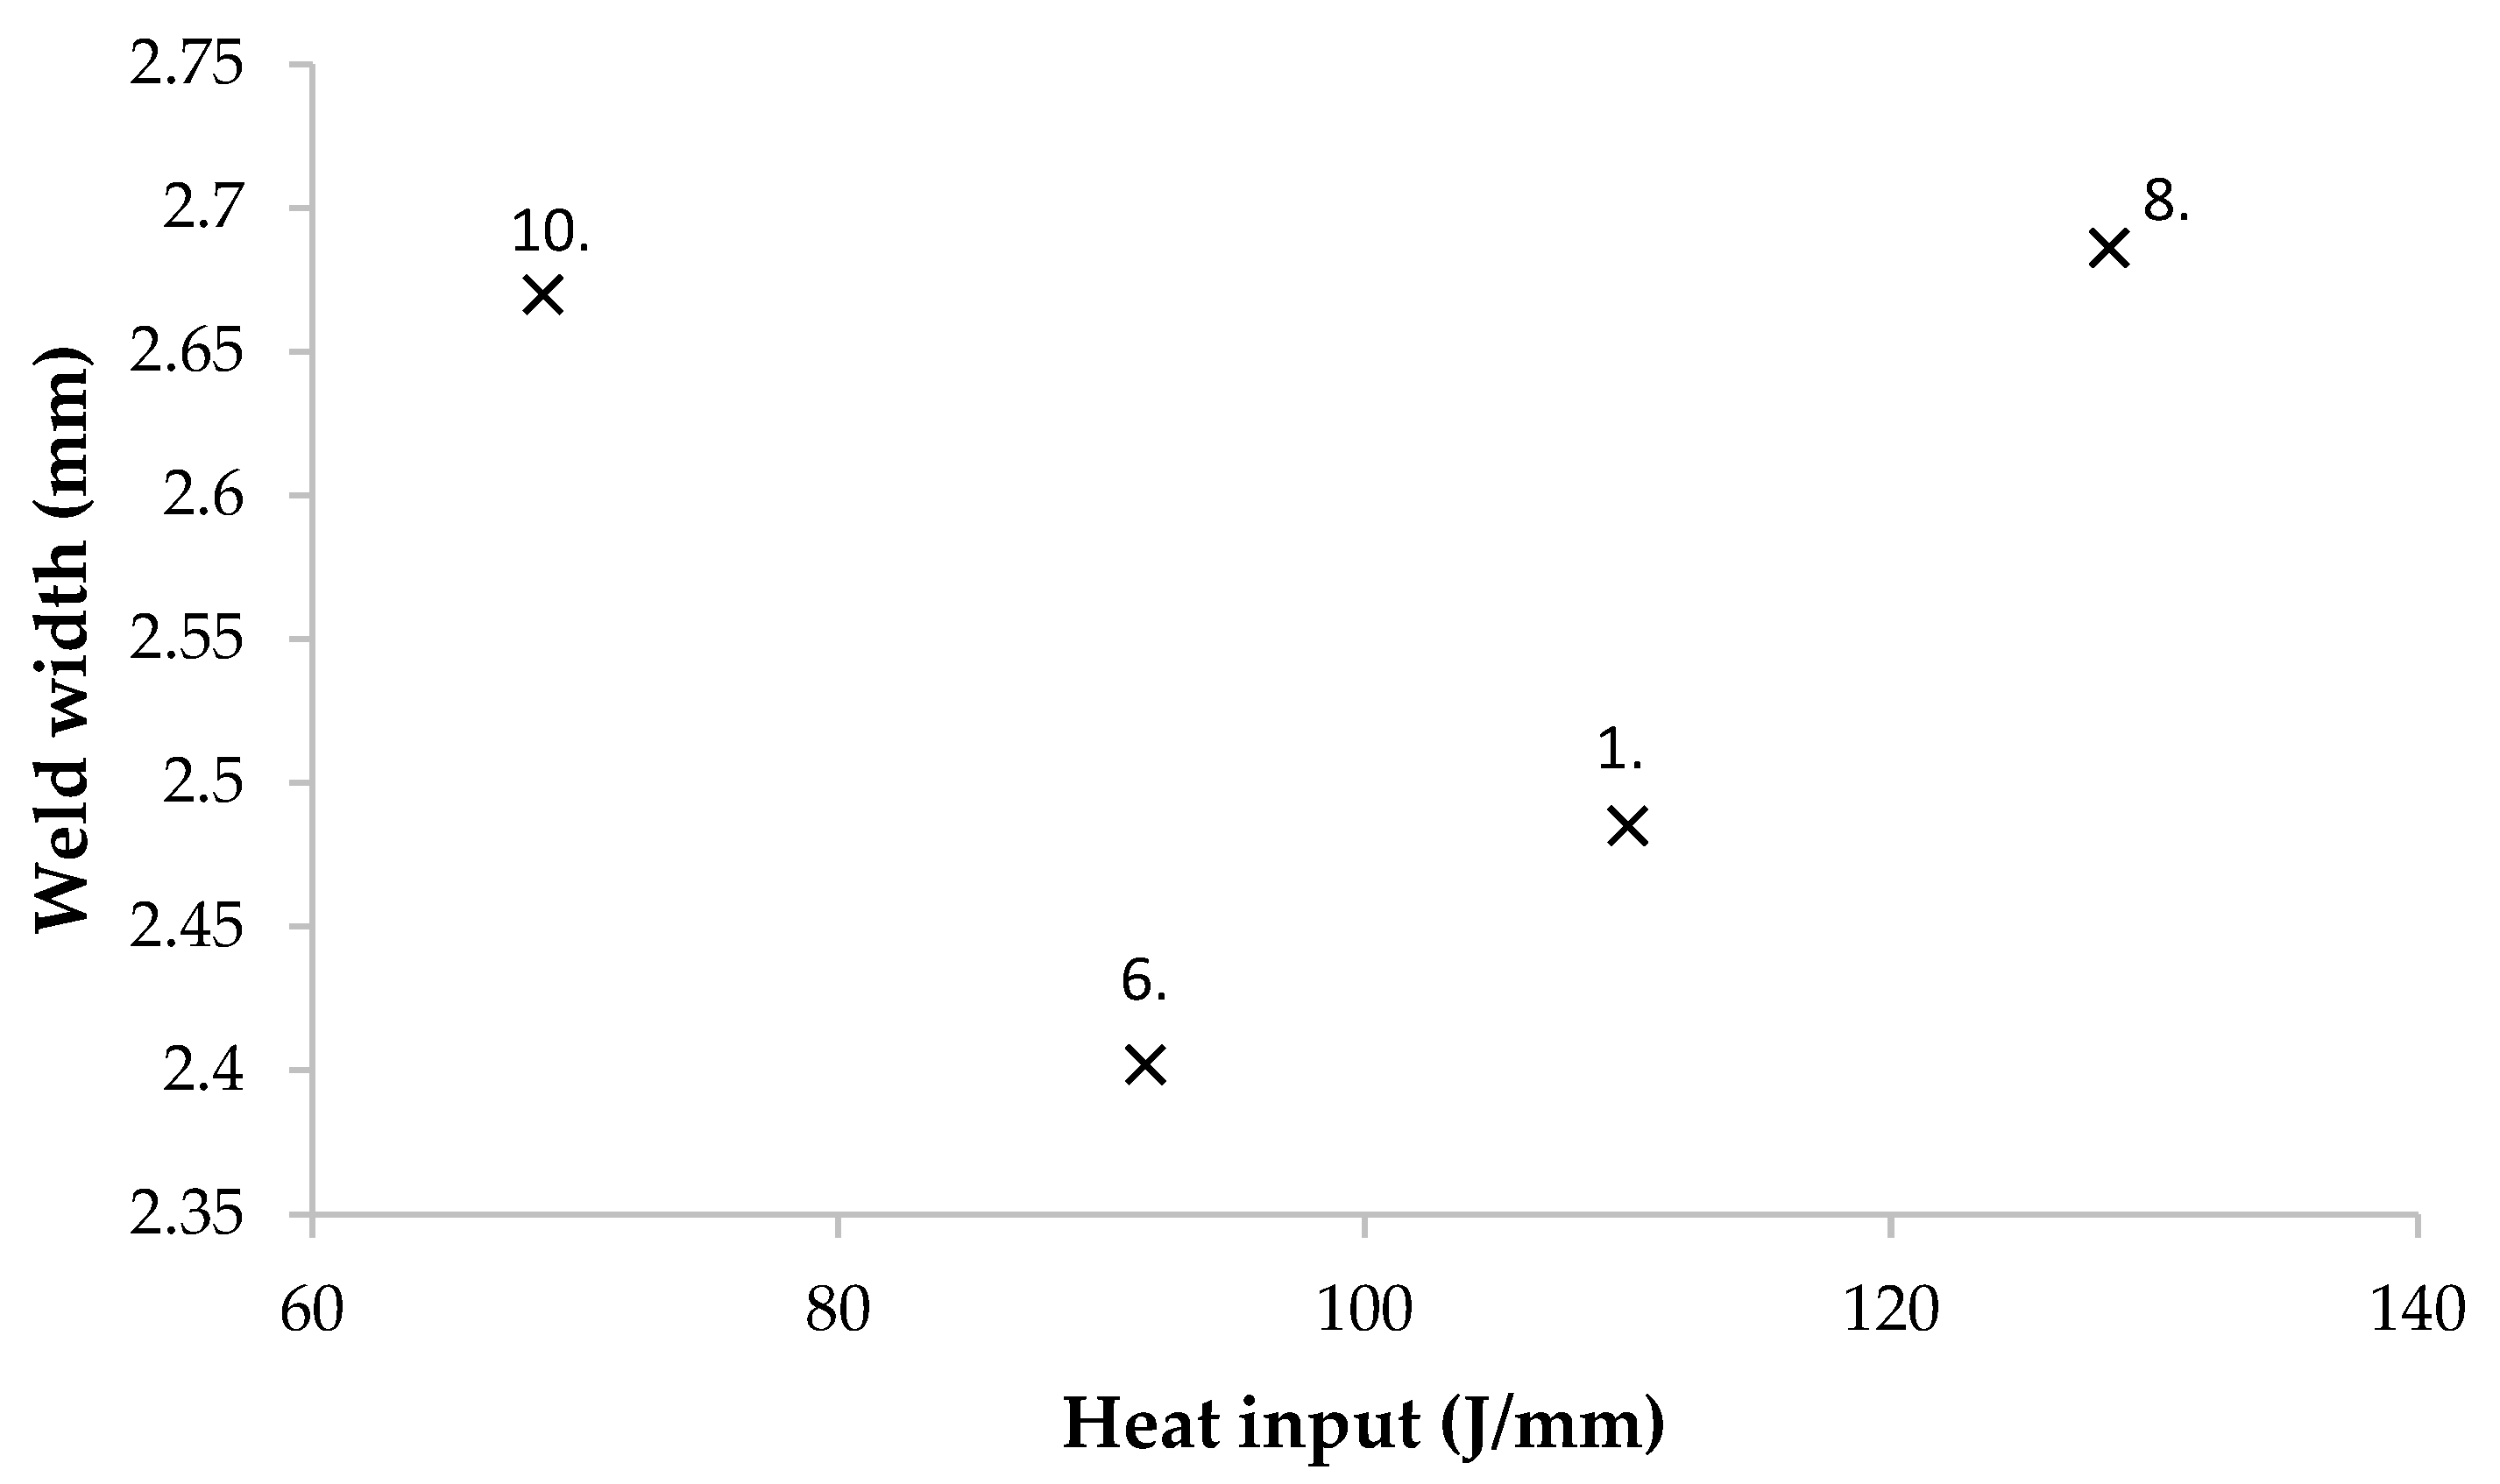
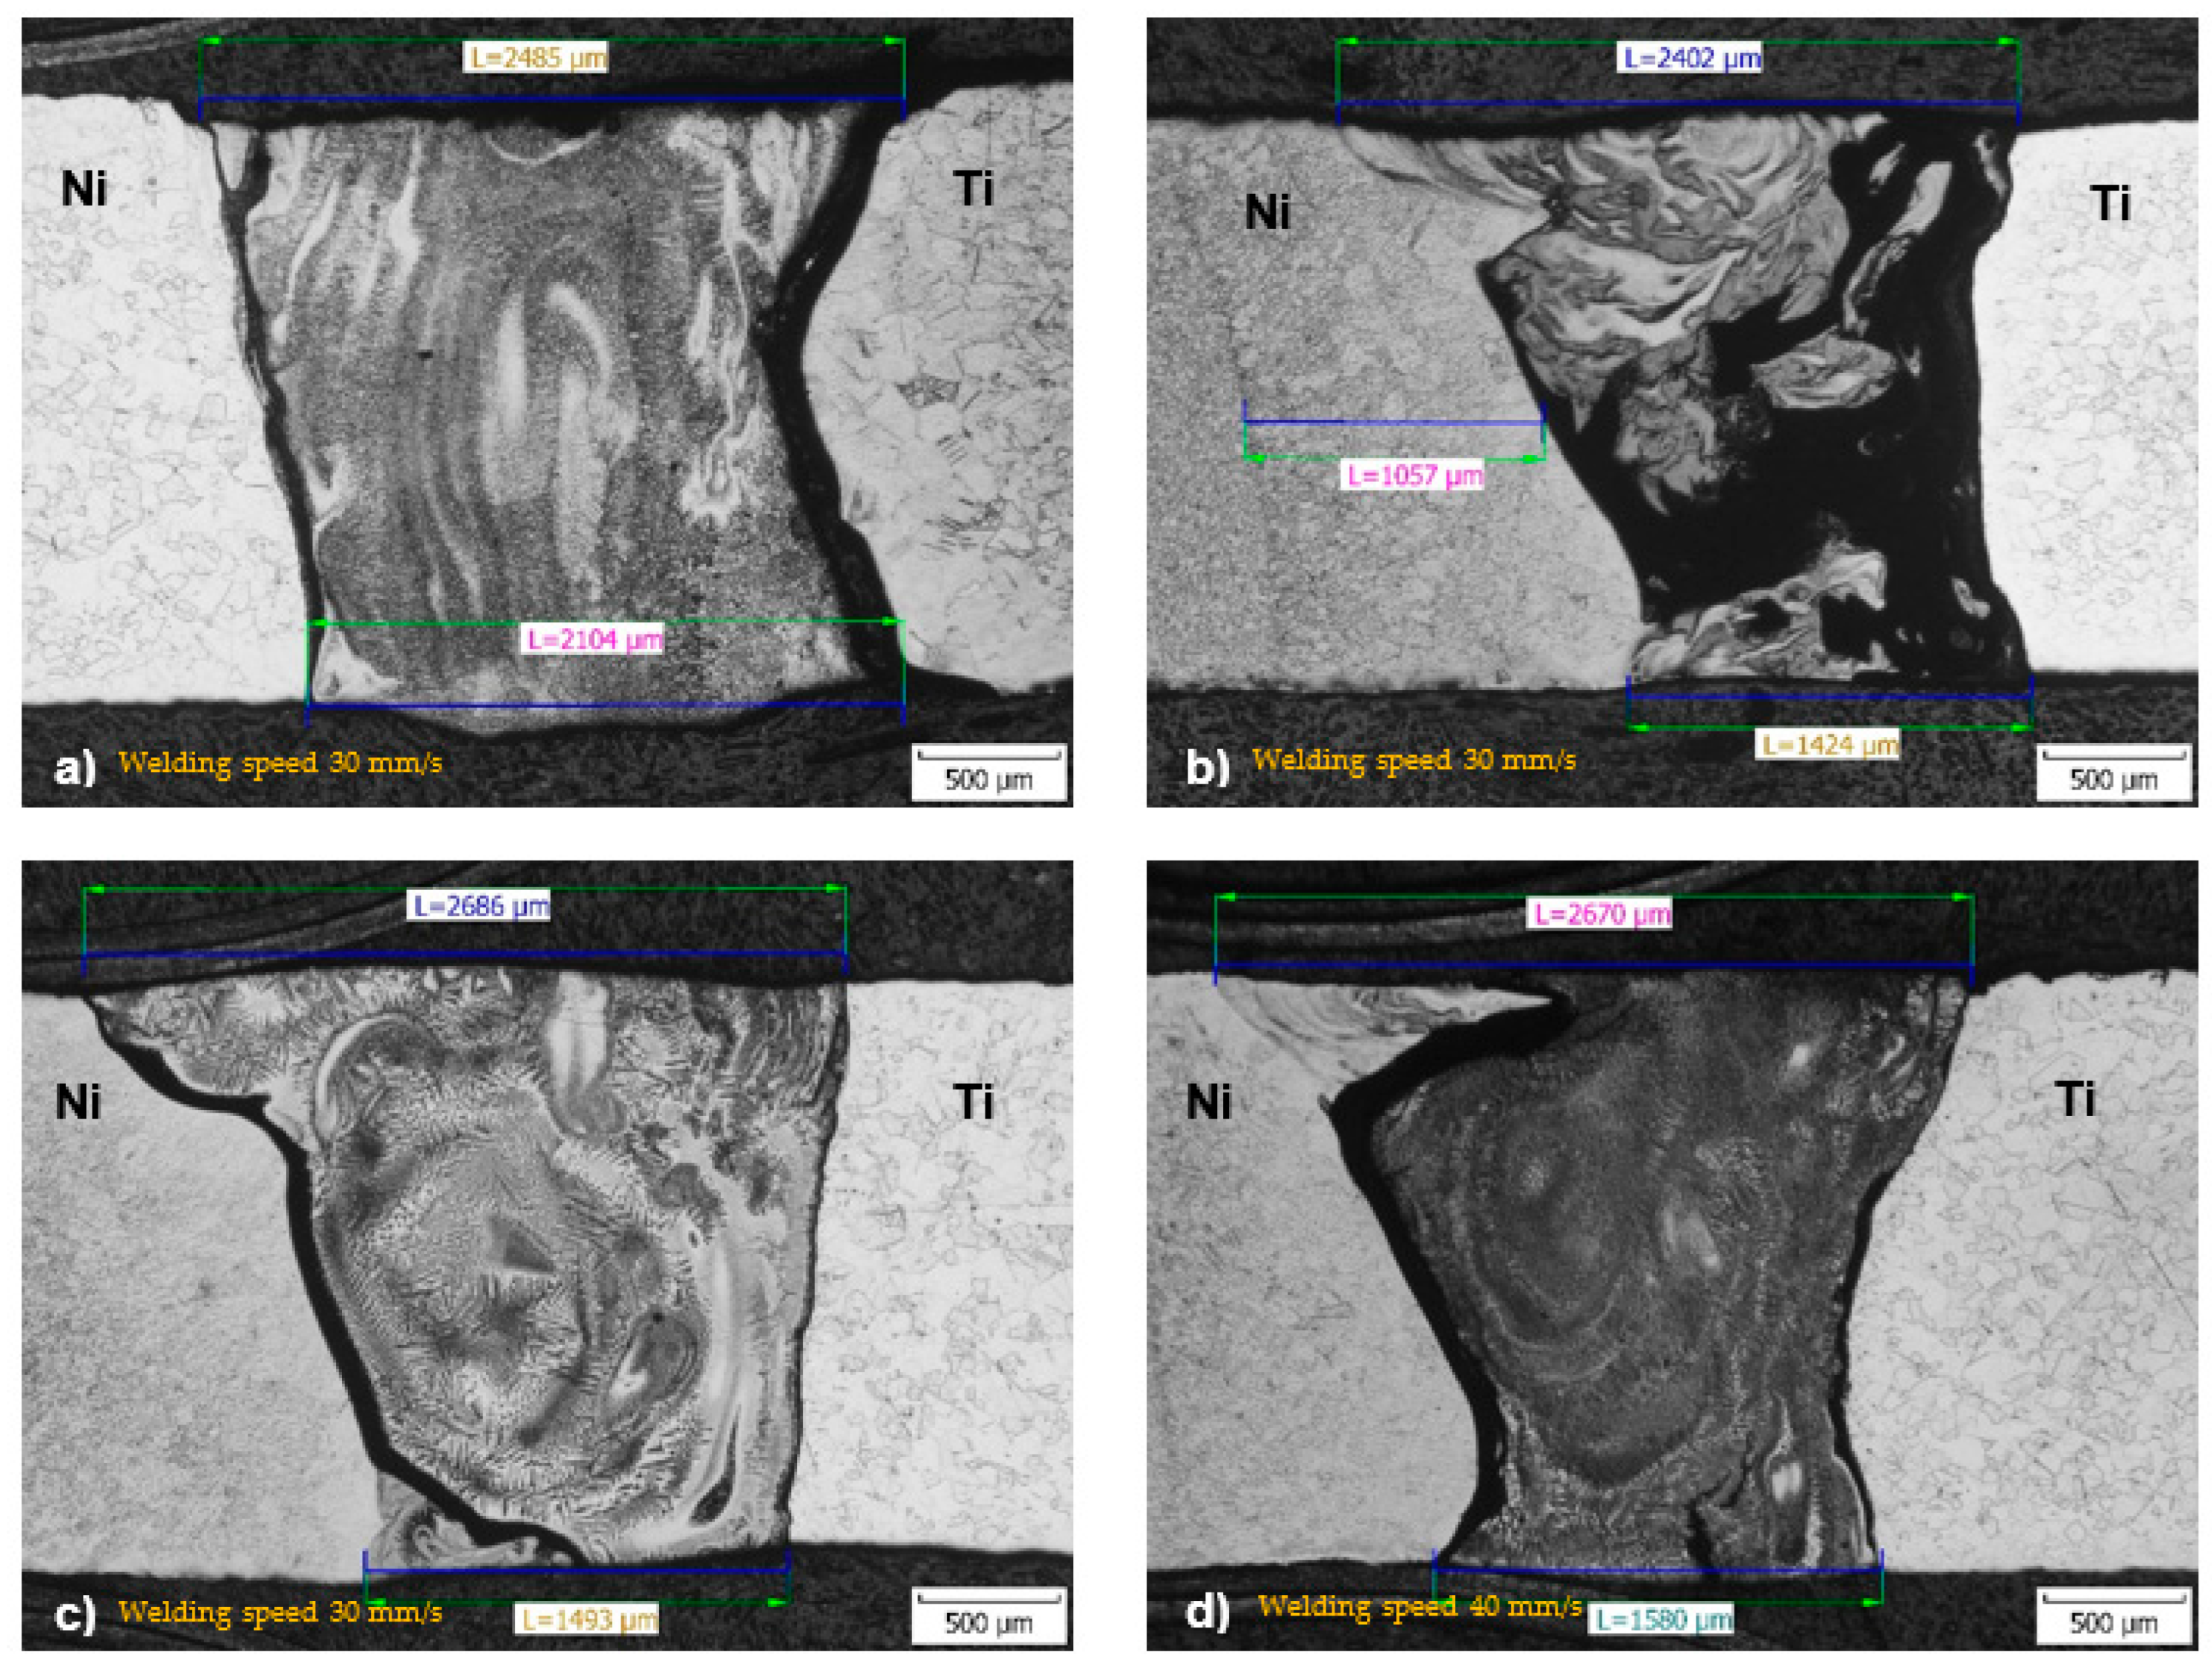
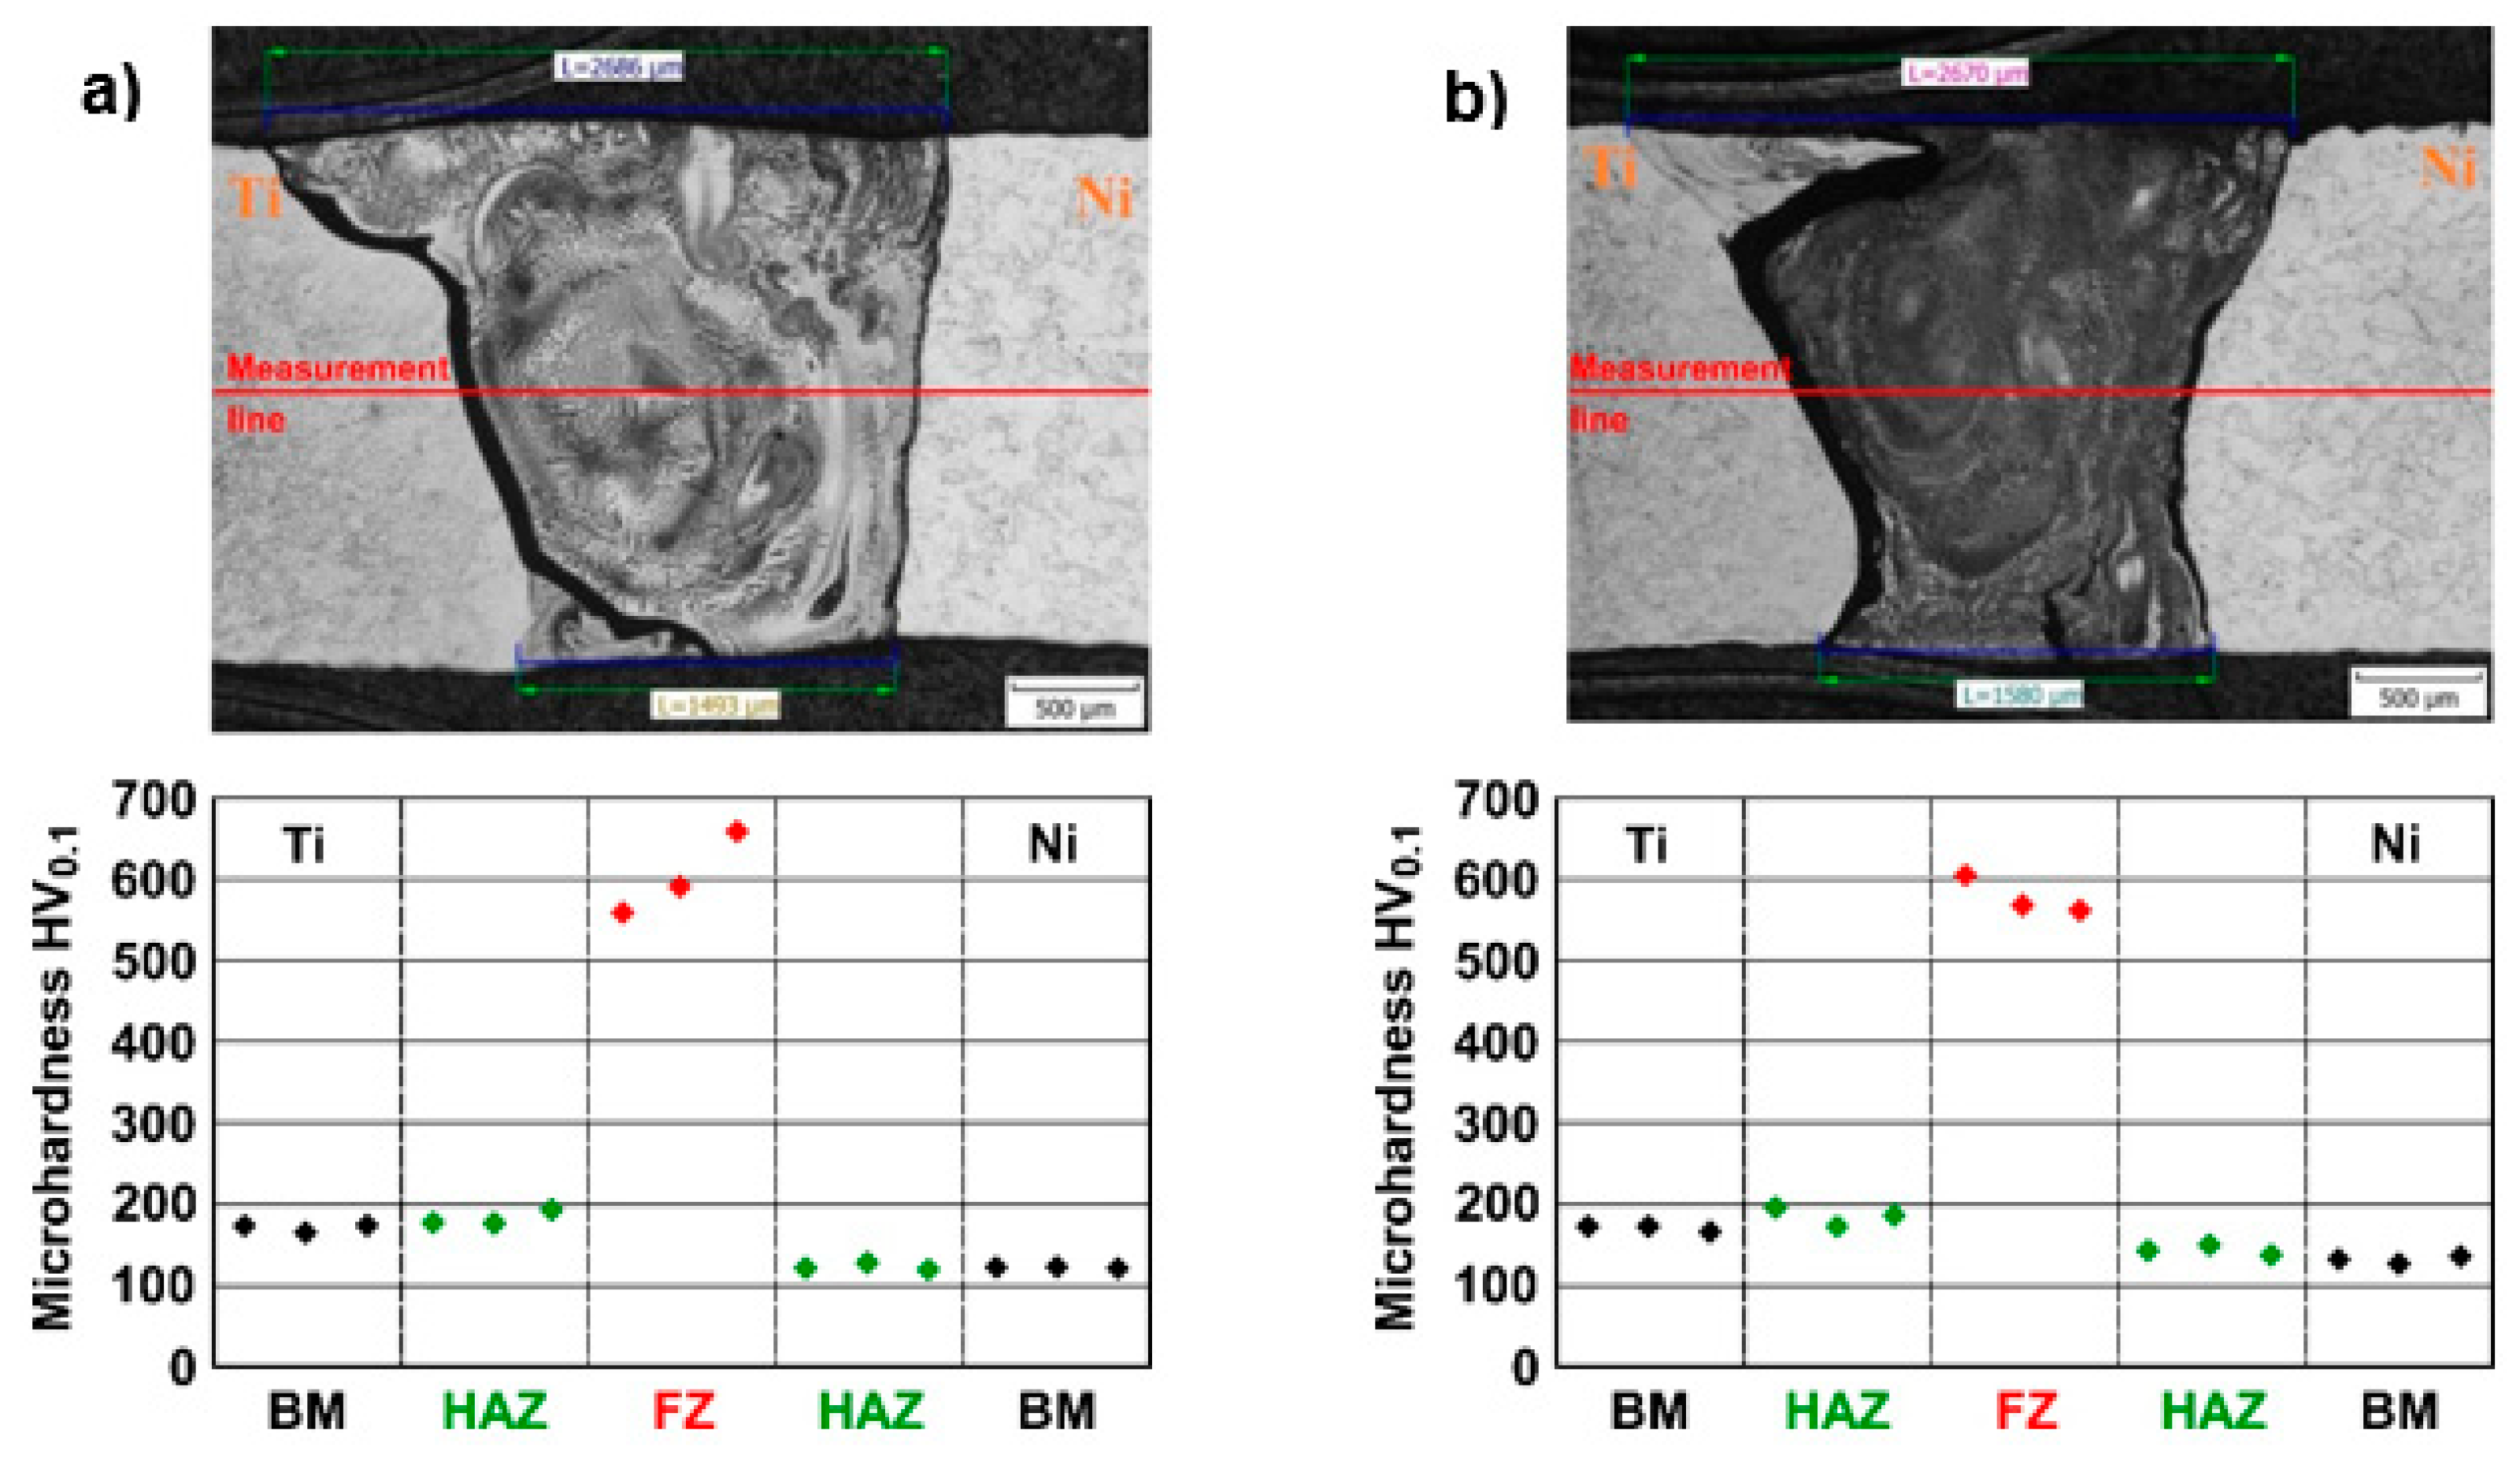
3.2. Analysis of Weld Cross-Sections

The sides of each full penetration weld were nearly parallel. The weld profile on the Ti side was straighter than that of the Ni side. This was visible mainly in samples 6 and 8 (Figure 6). The geometry of welds was different depending on the welding parameters used. The dependence on calculated heat input and weld width can be seen on the chart in Figure 5. The macrostructure images clearly show the melting asymmetry—Ti is more susceptible to melting than Ni. Additionally, in the welds can be observed the segregated Ni-rich regions (brighter contrast). The asymmetric weld pool with a greater extent of melting formed on the Ti side. The reason for weld pool asymmetry is the lower thermal diffusivity of Ti compared to that of Ni, which results in more localized heating, and as a consequence, more melting of Ti.

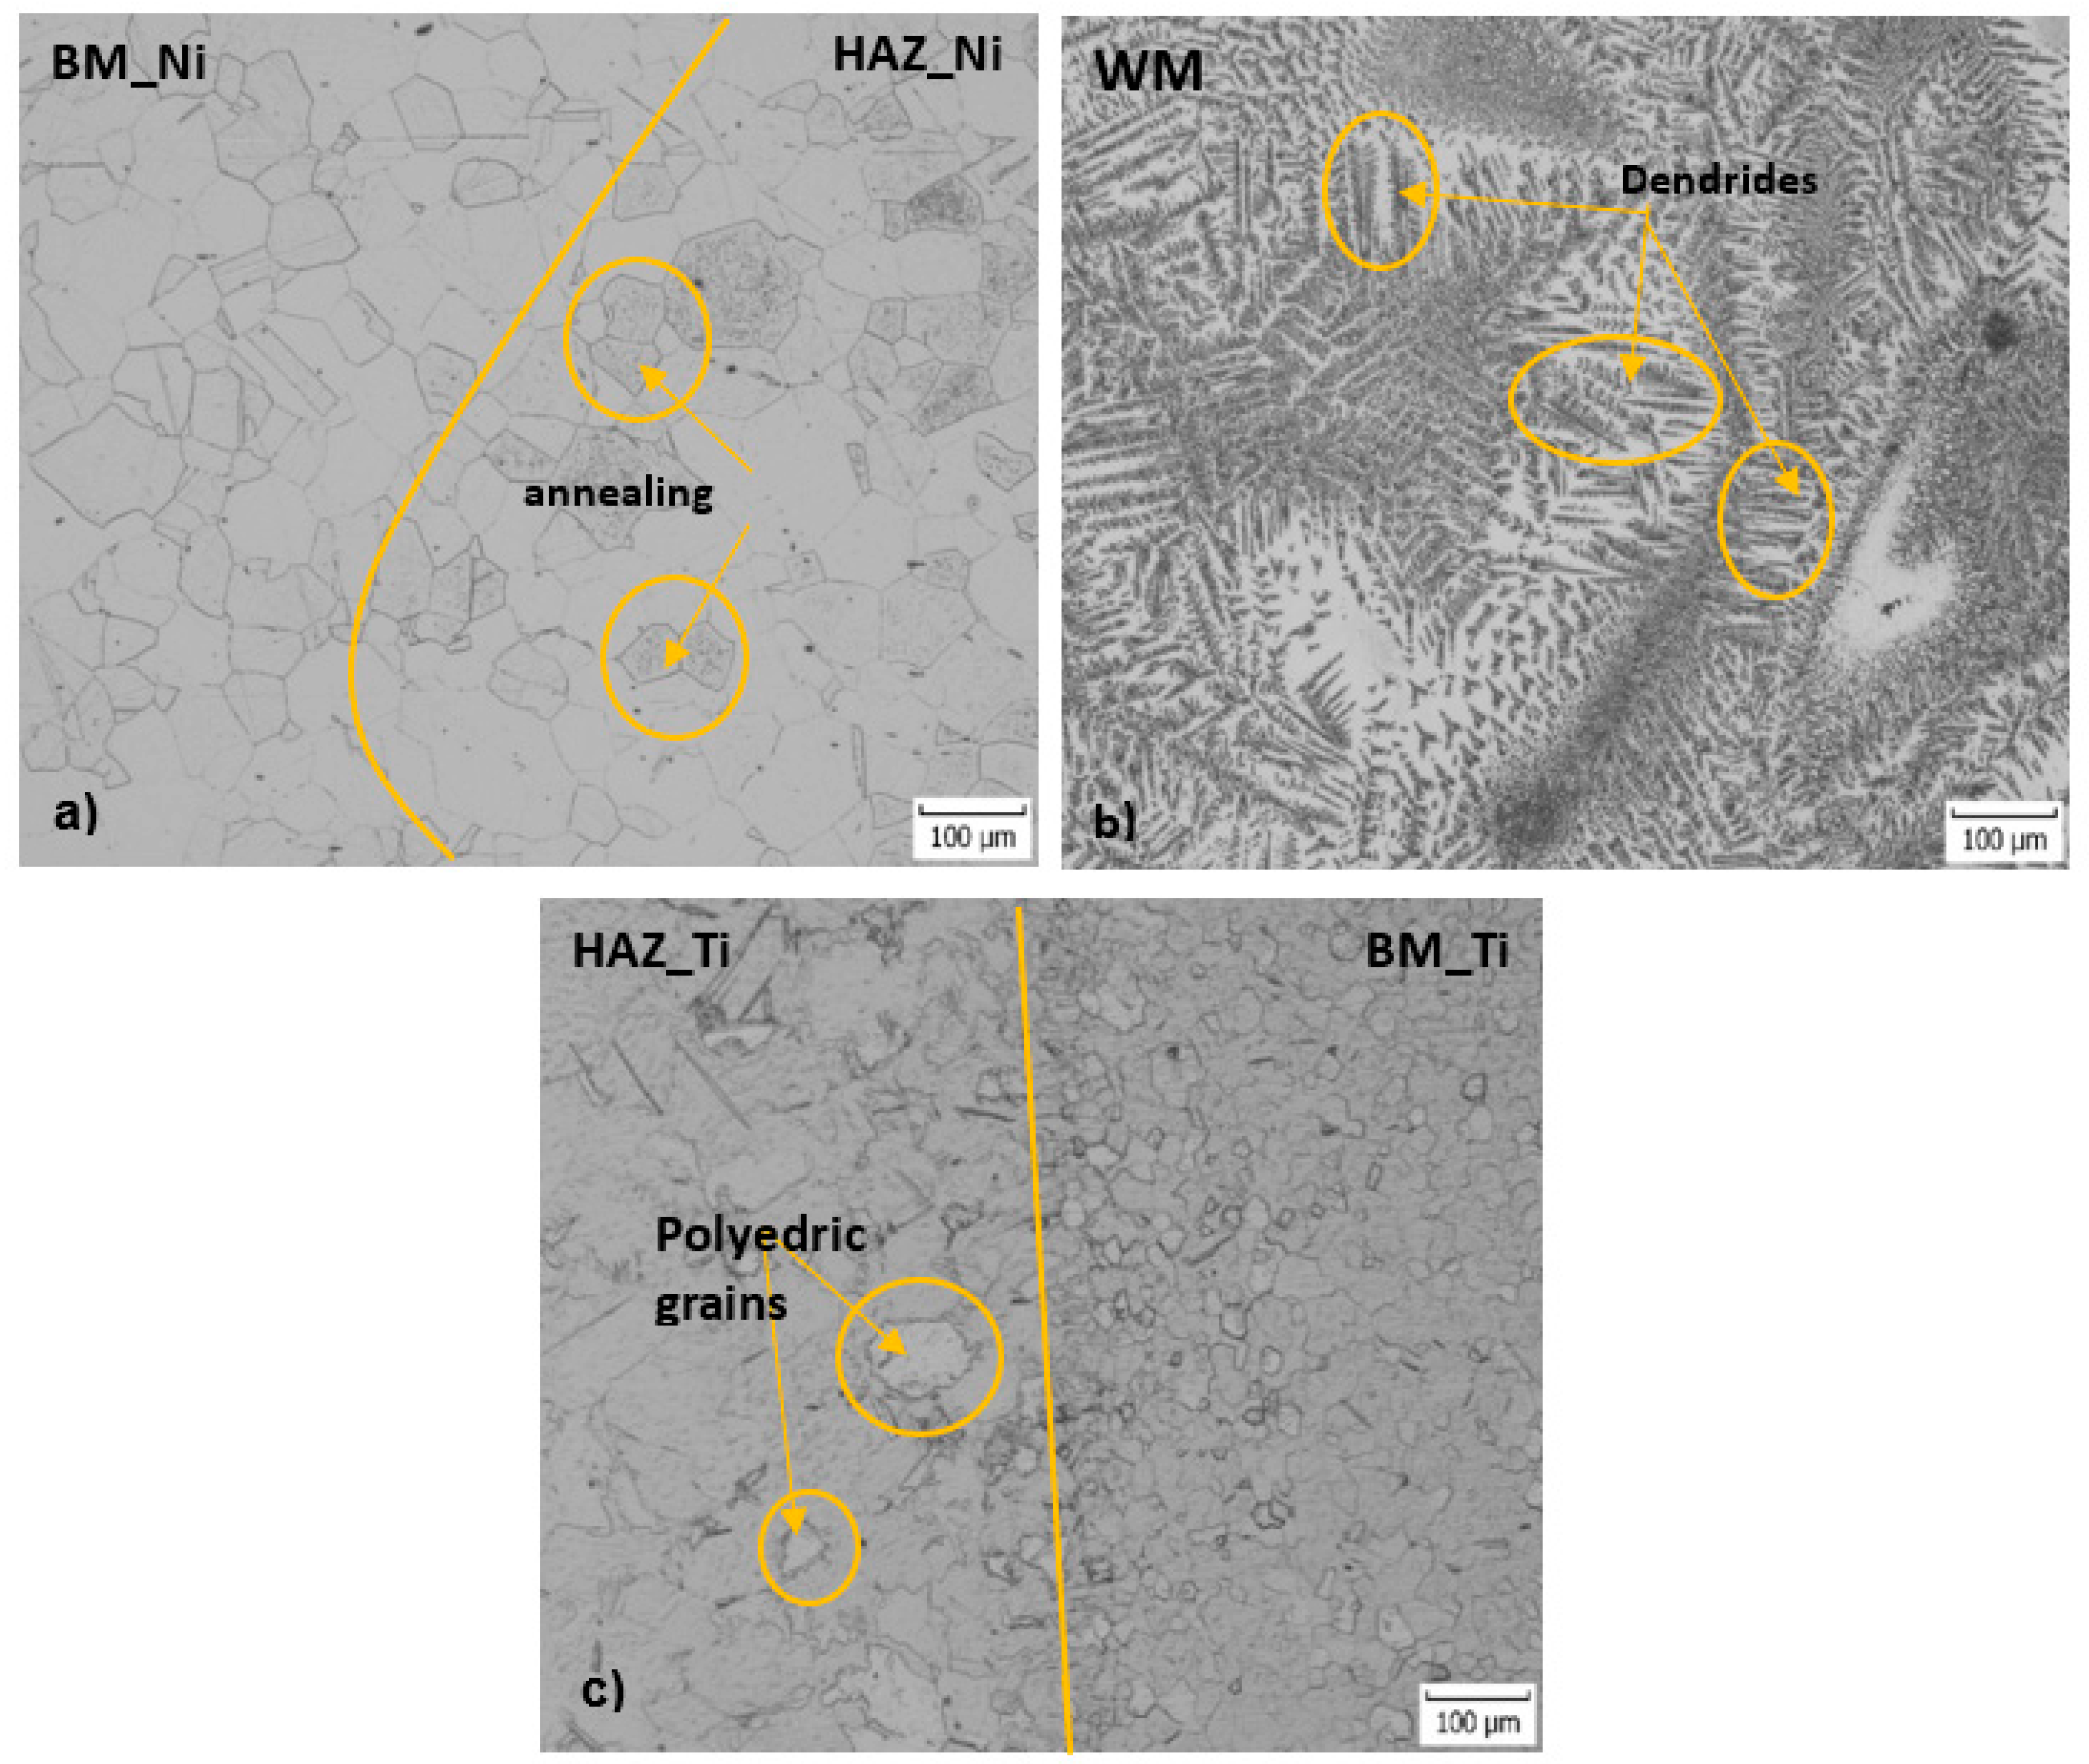
3.3. Analysis of the Microstructure
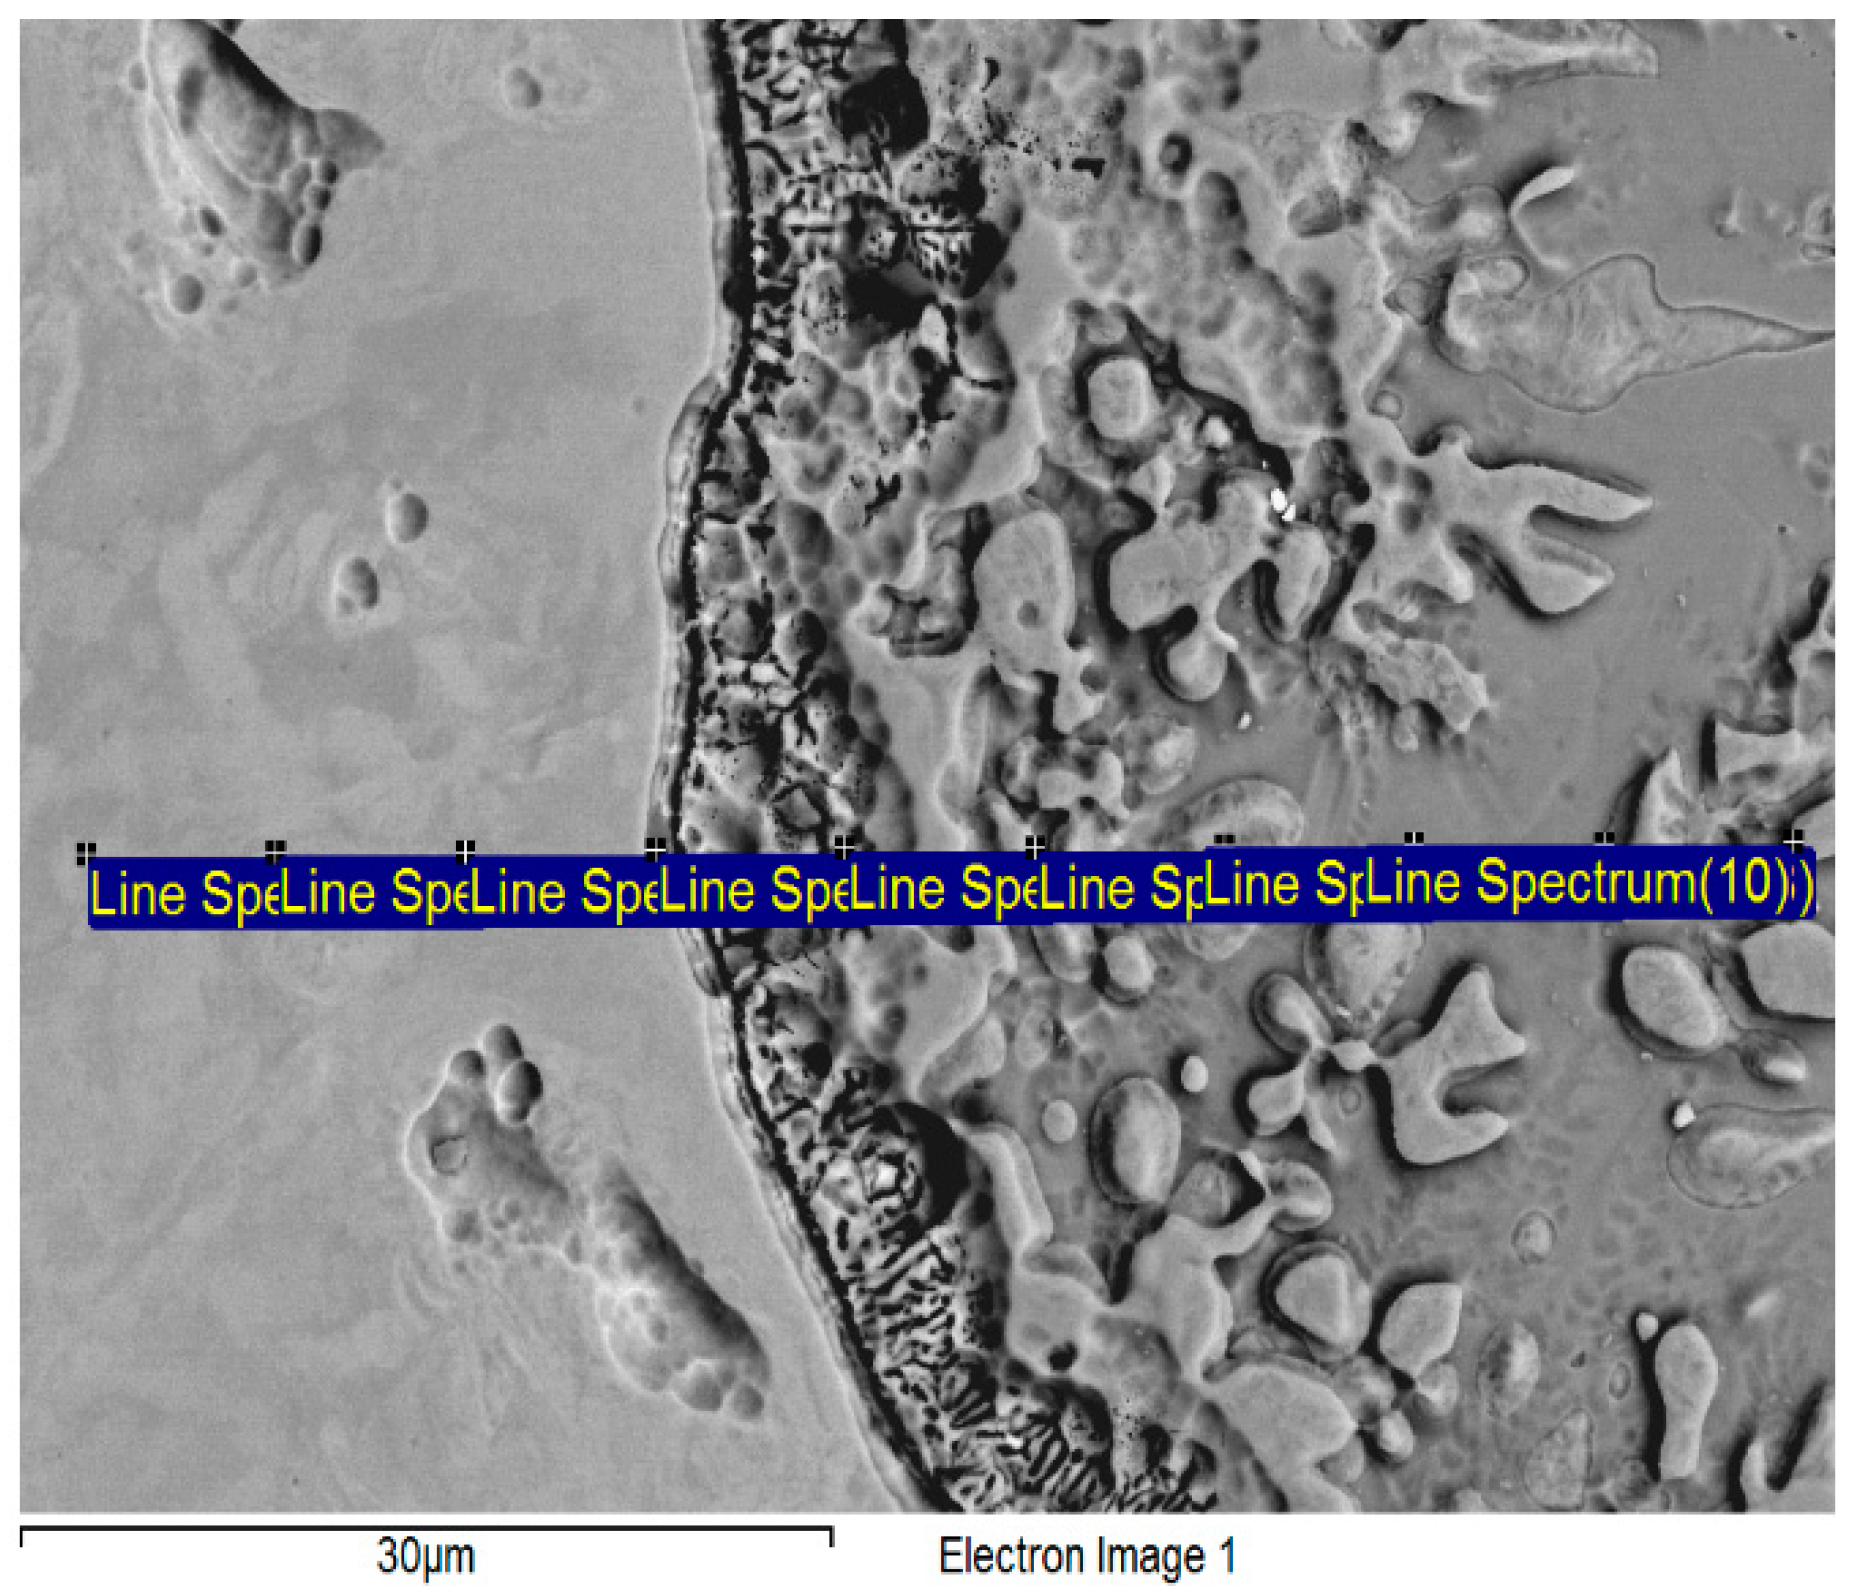
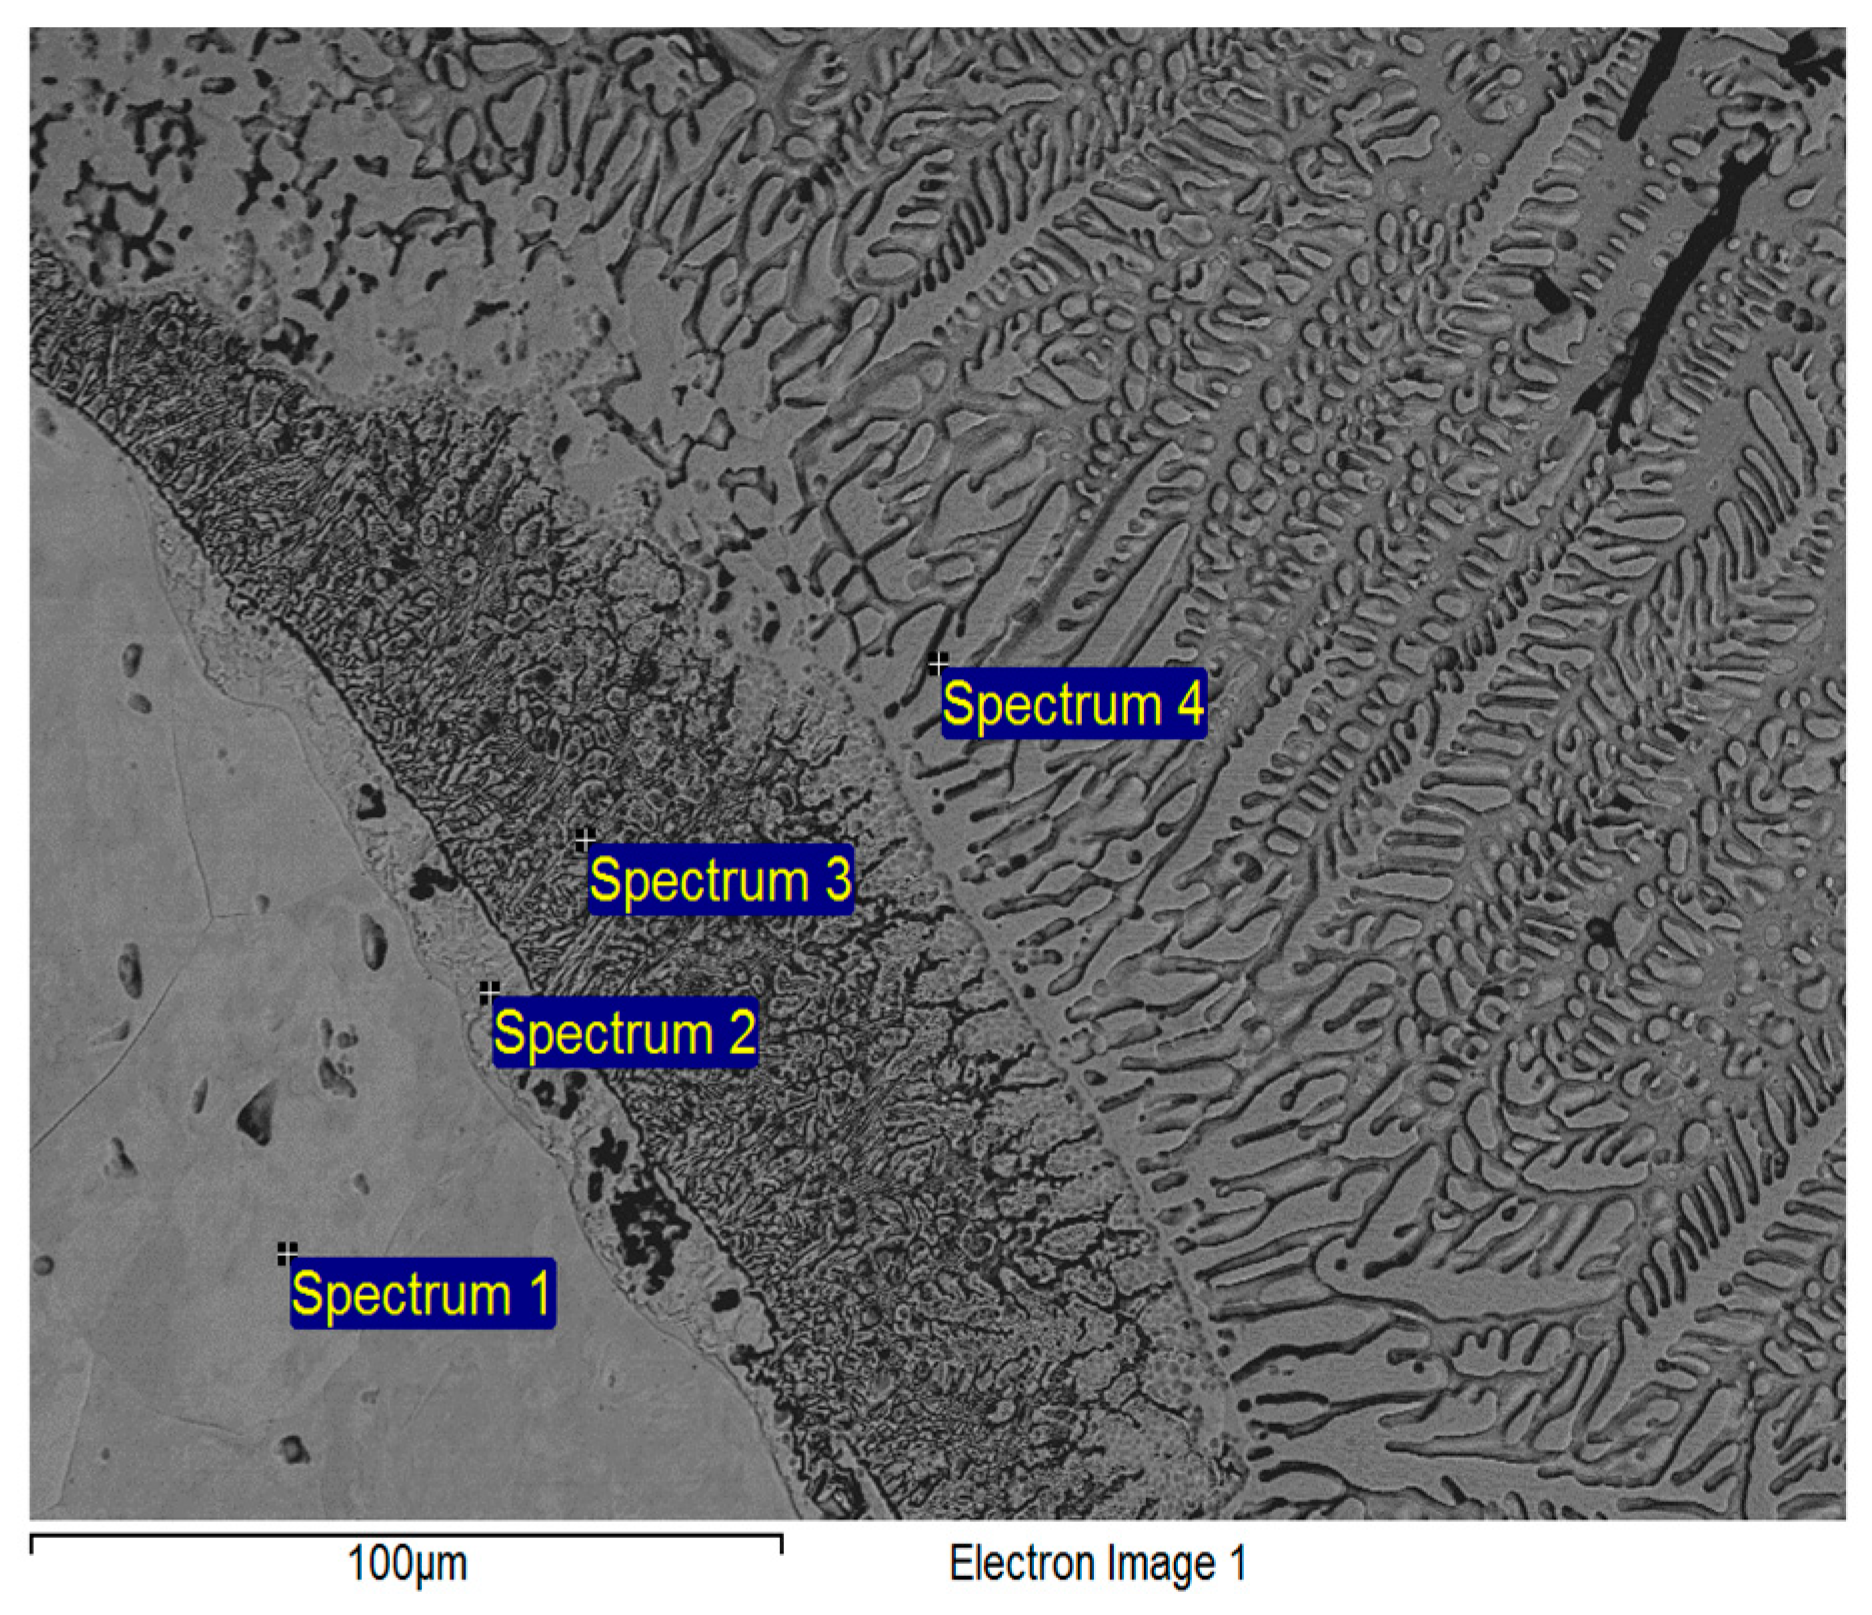
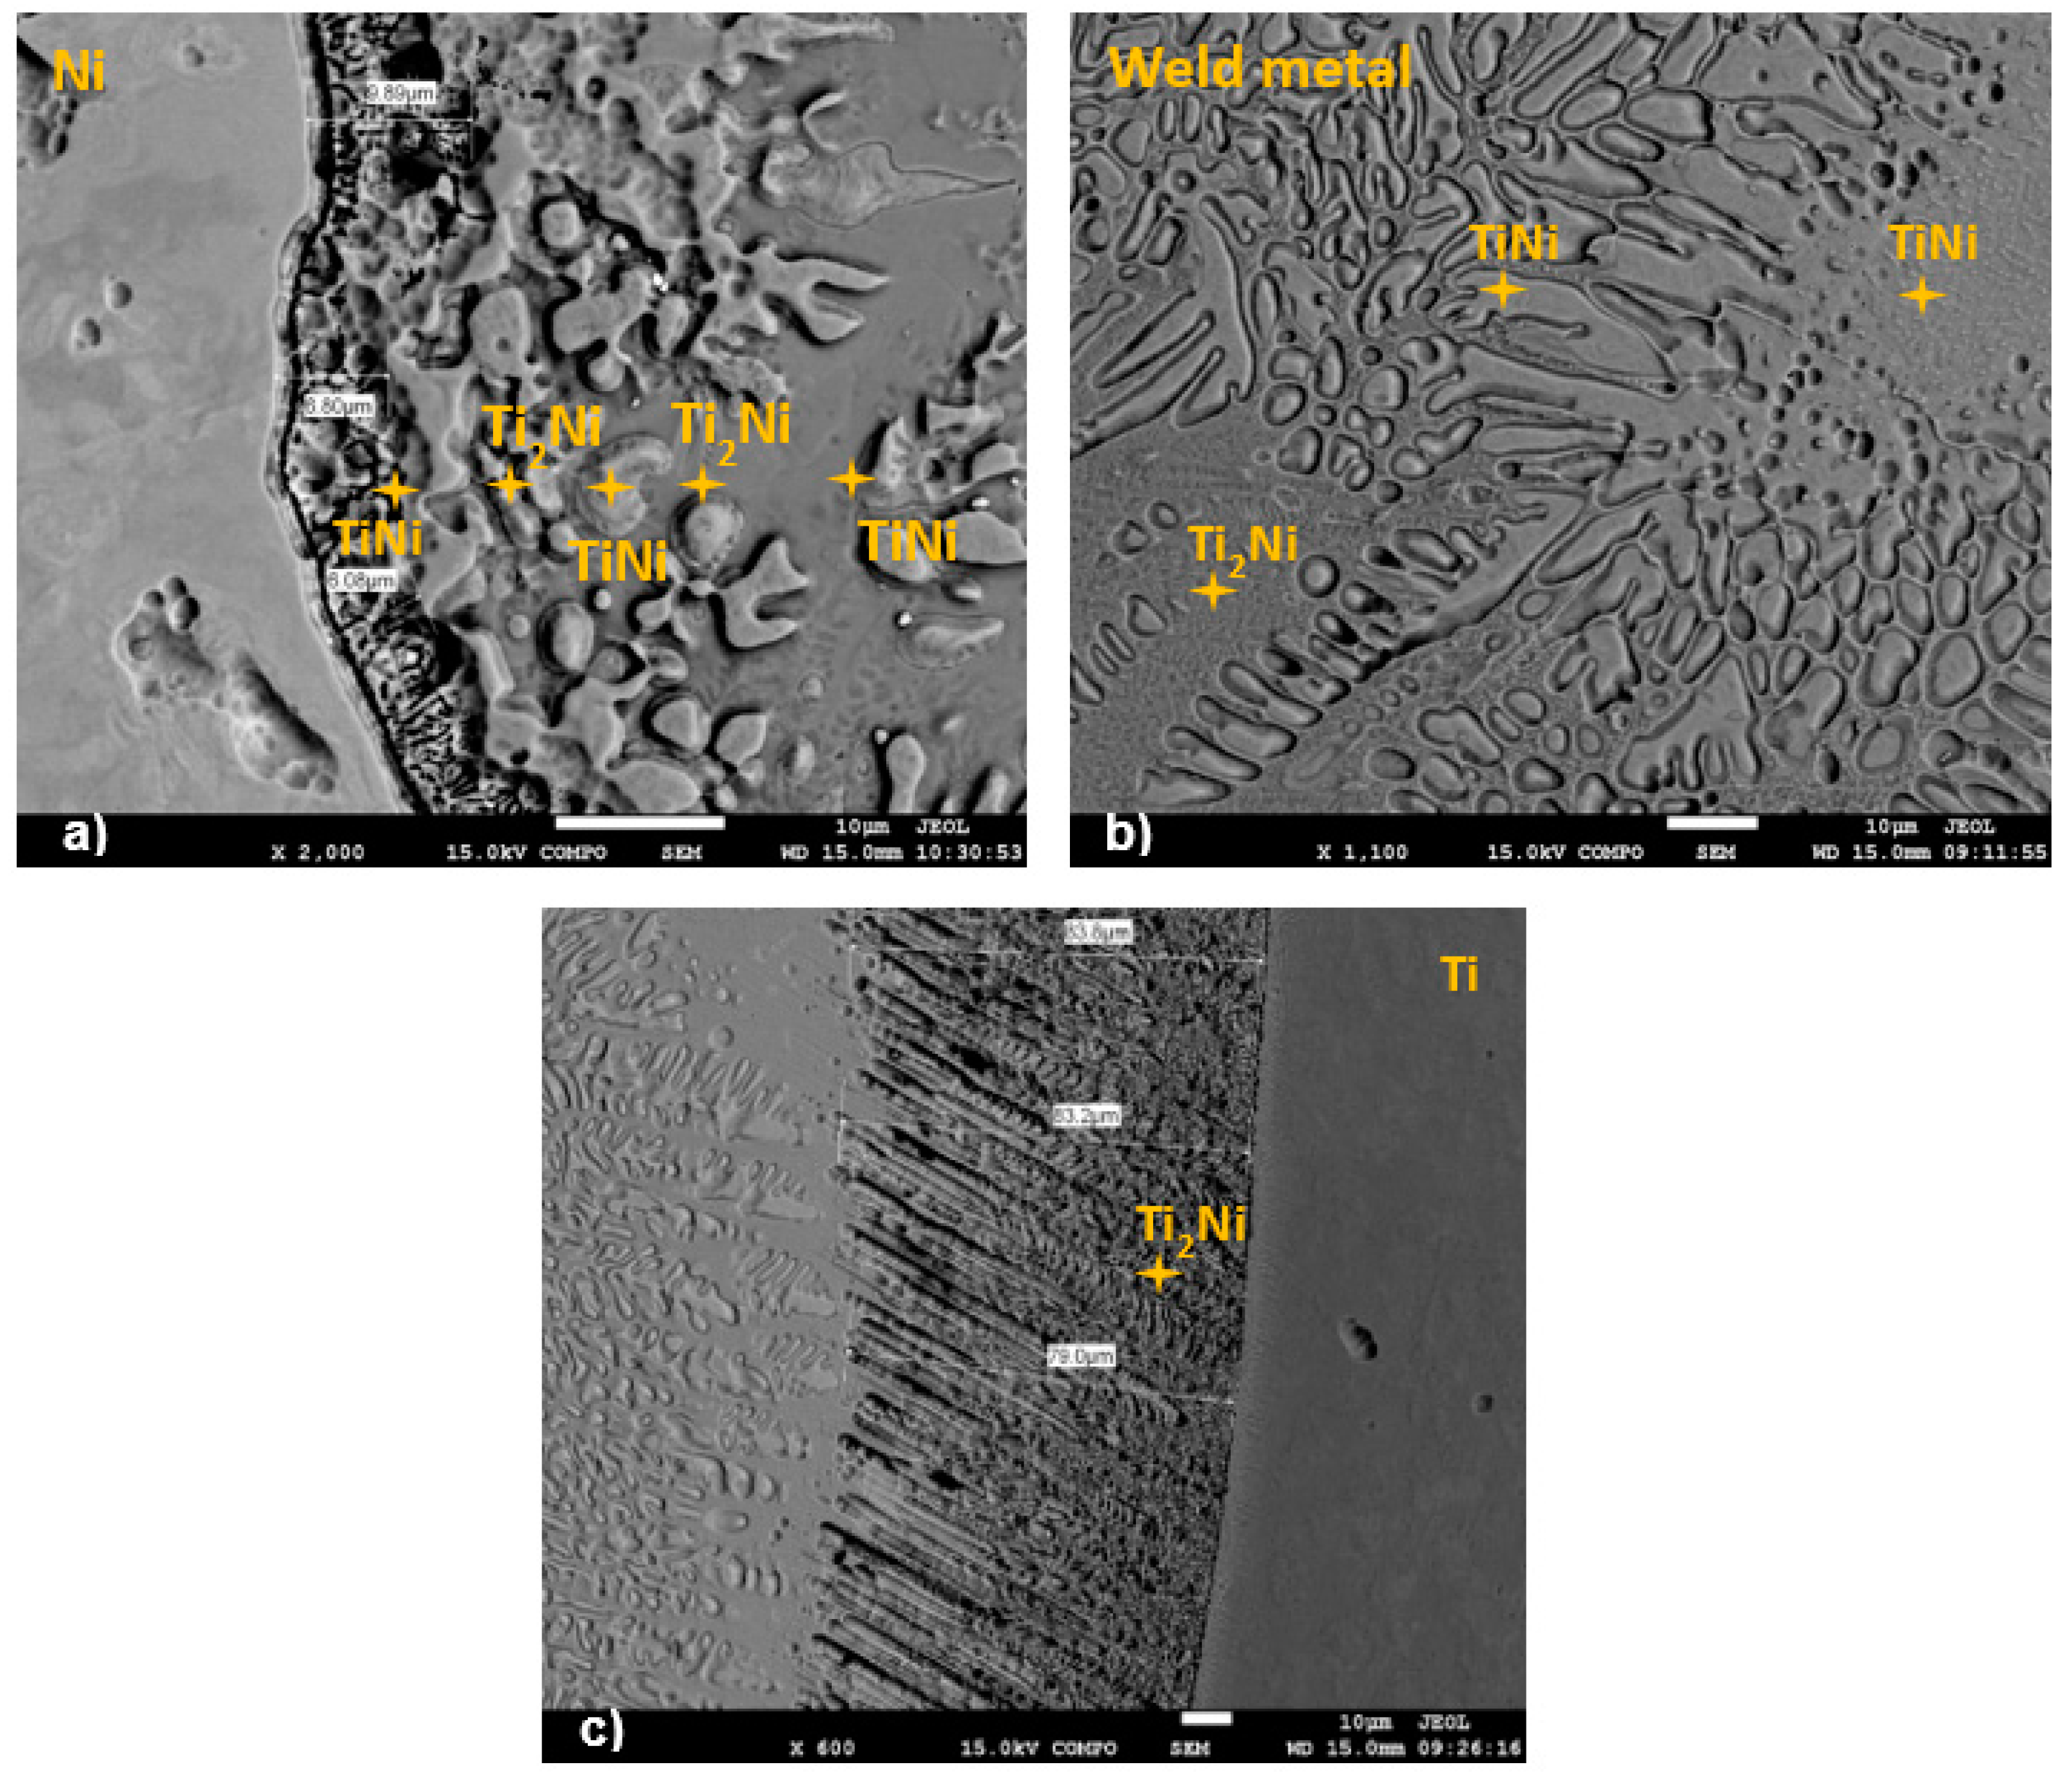
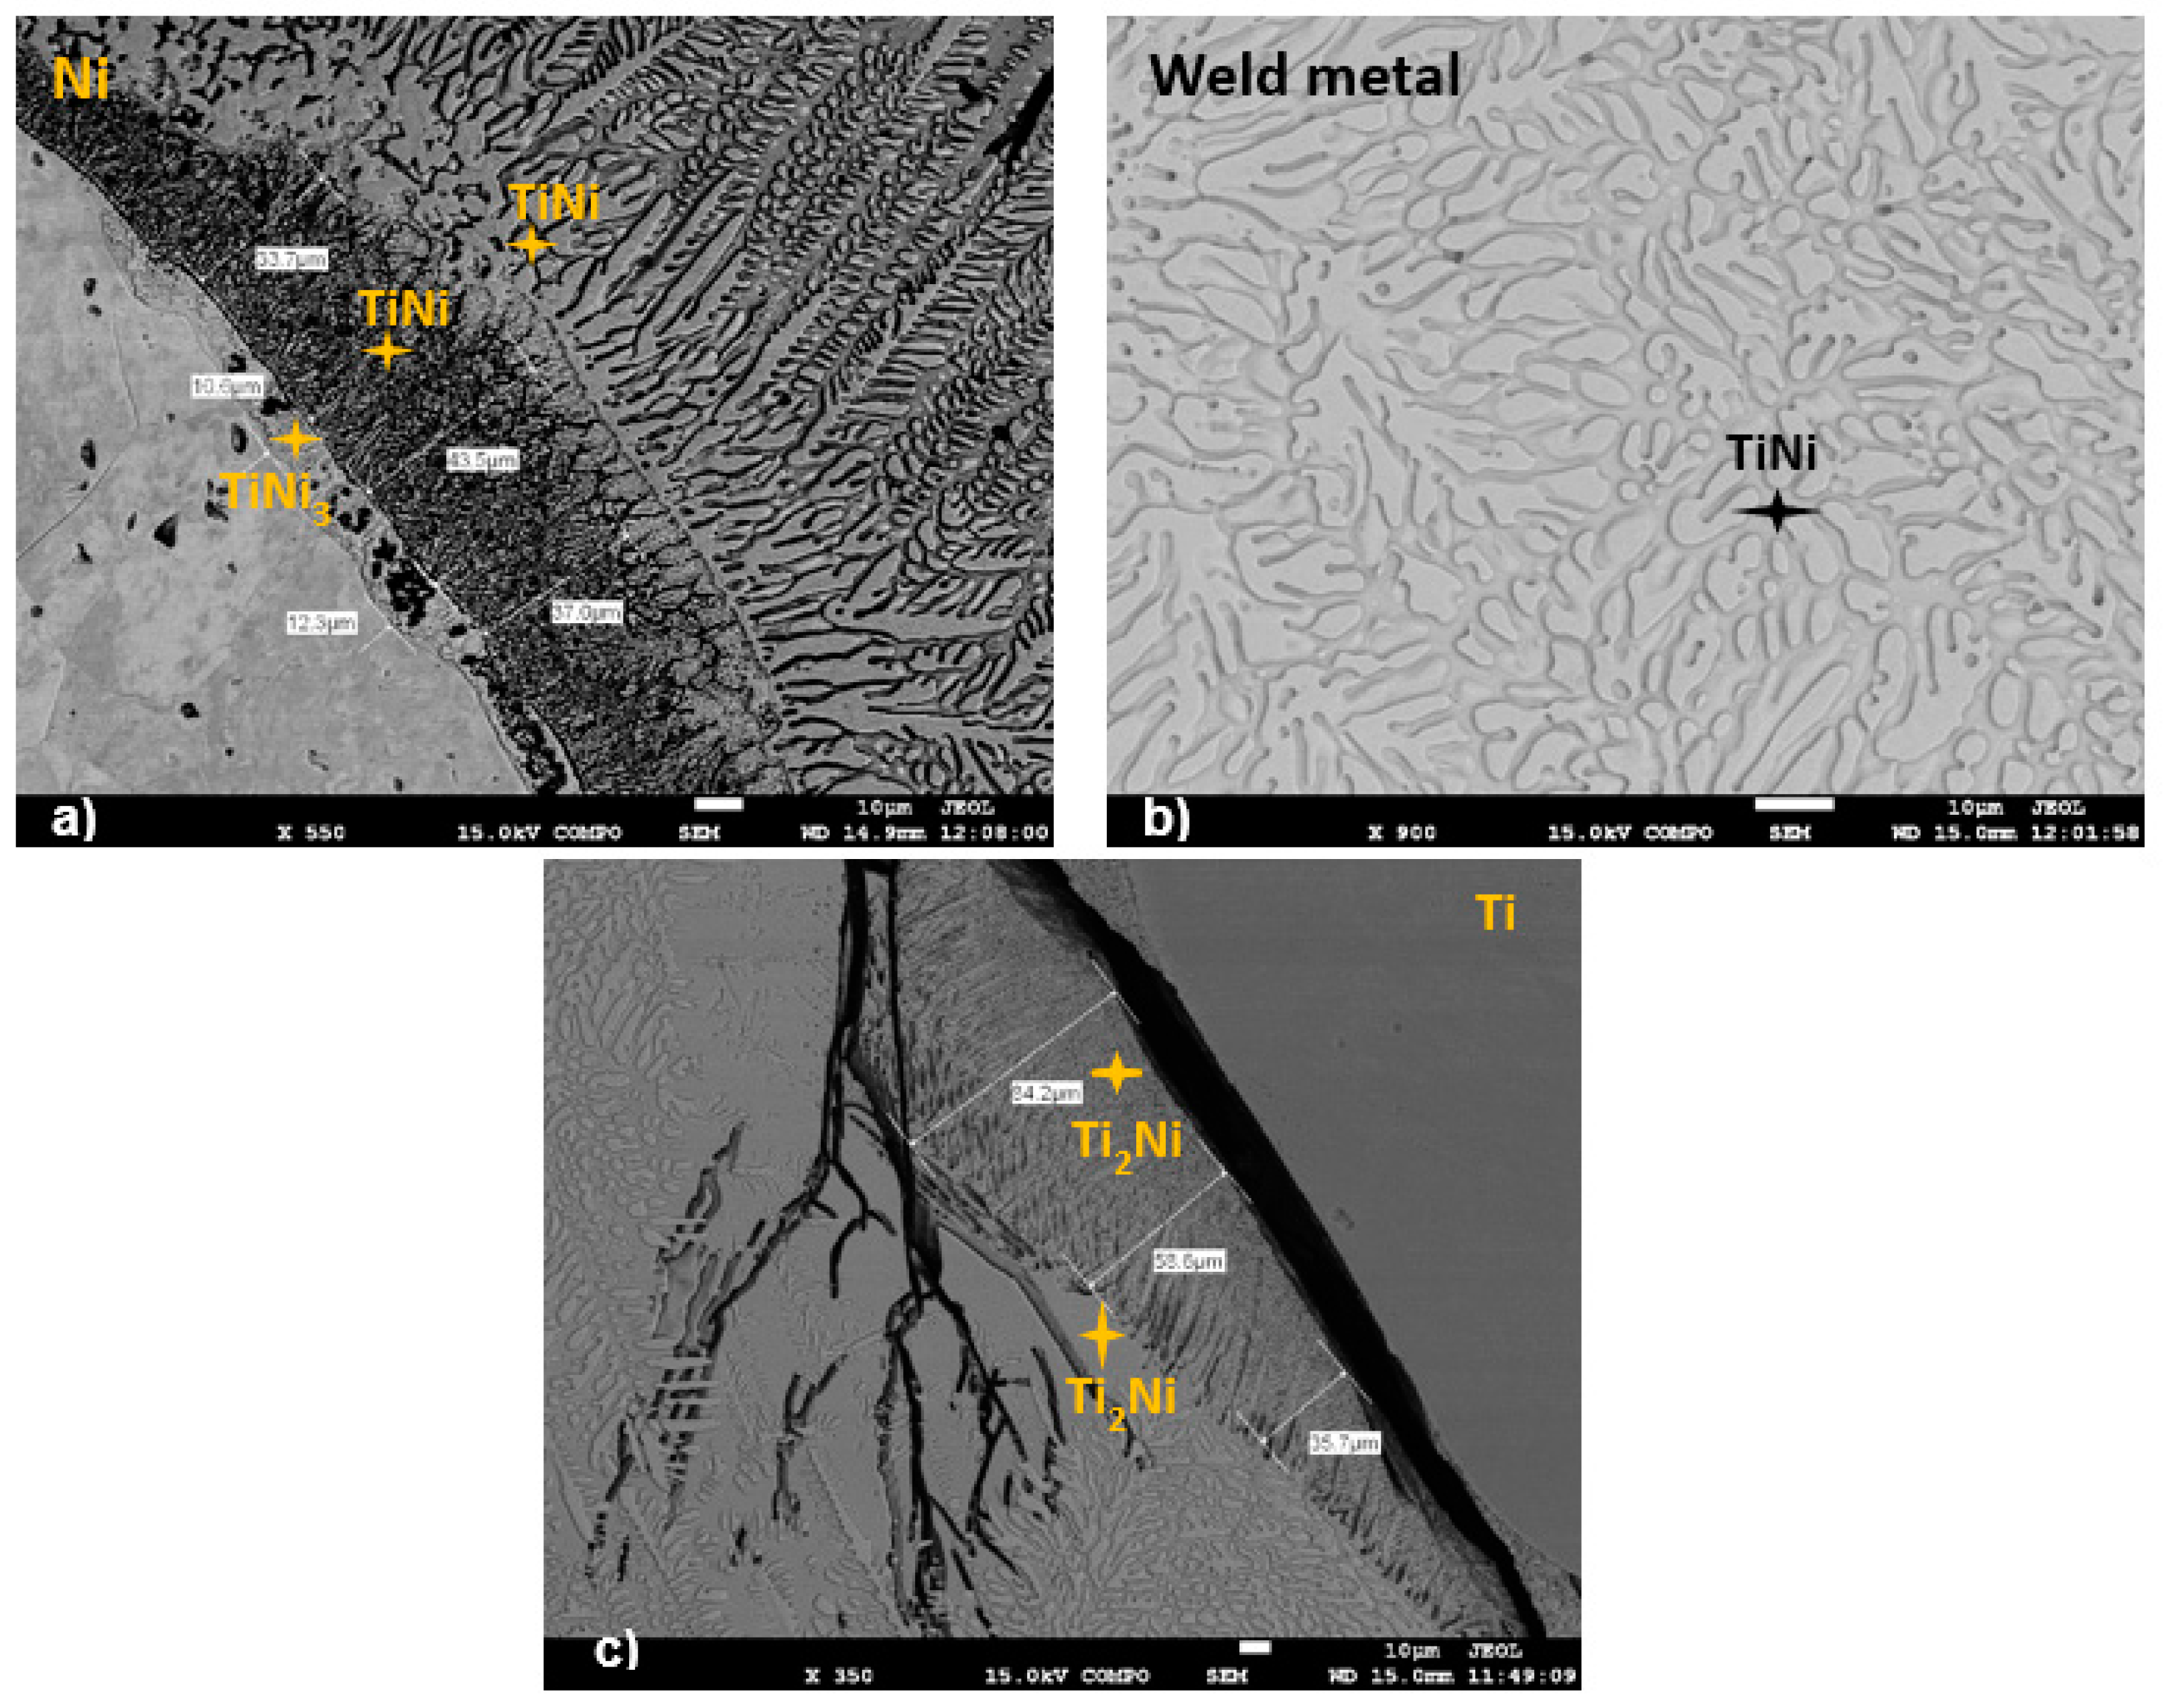
Monitoring of the microstructures of the samples was performed in the following areas: BM (base metal) titanium Grade 2–HAZ (heat affected zone) of the BM Ti, BM–WM (weld metal), BM–HAZ of the BM Ni, and HAZ–BM–nickel 201 (Figure 7).
Titanium Grade 2 has a polyhedral morphology. In terms of chemical composition, it is pure titanium with a small amount of alloying elements. The microstructure contains fine grains with slight heterogeneity in grain size: grains are 5 to 30 μm. The heat-affected area from the base material differs by significant coarsening of the grain (two to three times). The grains have a polyhedral structure, and at some boundaries, it is possible to see the undulations which may have been caused by the heat. The weld metal of samples had a predominantly dendritic morphology. Dendrites are formed by the substitution of a solid solution of the γ phase, which contains nickel and titanium, or a small amount of alloying elements of used alloys.
Ni structures have a polyhedral character. The matrix is made of nickel austenite. The austenite grains are about 10 to 200 μm. The boundaries of grains are clear without the precipitation of secondary phases. Annealing twins could be observed in nickel austenitic grains. Their presence is typical for metals and alloys with a K12 lattice.

3.4. SEM Analysis

The microstructure of the weld pool is composed of different phases, which are determined via EDS analysis. Welded joints produced with a heat input of 128.3 J/mm (8) or 68.75 J/mm (10) were analyzed. As the phases in the Ti–Ni system have distinct compositions, the EDS analysis allowed for unmistakable phase identification (Figure 8 and Figure 9); this was verified with results from previous studies using the same conditions for the electron beam welding. The intermetallic phases in this system have a wide range of compositions. The measurements helped in the phase identification. The intermetallic compounds are referred to by their respective stoichiometric ratios, and the terminal solid solutions with varied solute content are referred to as (Ti) and (Ni).
SEM-EDS was used to analyze each phase of the weld in more depth, and the results are presented in Table 8 and Table 9. The weld microstructure near the titanium is shown in Figure 10 and Figure 11. Based on the Ti–Ni binary phase diagram (Figure 1), the microstructure near Ti Grade 2 side consisted of a mixture of β–Ti and Ti2Ni produced by the eutectic reaction L → β-Ti + Ti2Ni. The content of titanium was about 71 at. % and the nickel content of 29 at. % was detected (Figure 8). Then, in the direction towards the Ni side, the microstructure evolved into a mash-up of TiNi and Ti2Ni which was given by the reaction L → TiNi and peritectic reaction L + TiNi → Ti2Ni. In this location, the titanium content decreased to 65 at. % and nickel content raised to 35 at. %. The brittle intermetallic compounds (IMCs) TiNi and Ti2Ni created cracks more easily in the phase interface and finally resulted in the joint’s failure. EDS results of the cracked interface (Figure 11c) also confirmed the existence of a number of different Ti–Ni based IMCs. The microstructure of the weld metal center is shown in Figure 10b and Figure 11b. The dendritic structure contained the TiNi and TiNi3 IMCs, which were given by the reaction of L → TiNi + TiNi3, which became the base phase. As shown n Figure 10a, the microstructure in the weld near Ni side was mainly formed by the three different shapes of solid solution of γ-Ni. There was about 21.92 at. % of elemental Ti in the γ-Ni (Figure 9 and Table 9), which was considered as the mixture of phases Ni + TiNi3.
Figure 10a shows the fusion line on the Ni side. The base metal grains did not grow into the weld. The solidification process began with the formation of a solid solution layer (Ni) on the pure Ni grains of the base metal and passed to the formation of the intermetallic phase TiNi in HAZ. The Ni layer was wetted. Based on the phase diagram, the Ni3Ti + (Ni) phase region was not observed. However, faceted primary Ti2Ni dendrites were also observed.
The microstructure of the center of weld metal consisted mainly of NiTi and Ti2Ni phases. Figure 10b shows a typical microstructure characteristic of this region. The light grey contrast’s dendrites were NiTi, while the dark grey parts were Ti2Ni, according to composition analyses. Frequently, alternate layers of coarse and fine NiTi formed throughout the central region of the weld. The NiTi layer’s growth in the formation of dendrites was sandwiched betweenTi2Ni layers. The NiTi phase also occurred as a large area of the weld pool. The NiTi phase also created cellular/dendritic morphology that reflected the remaining microstructural characteristics of bright contrast in the figure.
Figure 10c shows the Ti fusion interface microstructure. It was characterized by Ti2Ni dendrites in the interdendritic space and β-Ti + Ti2Ni eutectic. The inset of this picture shows the disintegration of the Ti2Ni solidification front growing toward the Ti base metal from within the weld pool. The microstructure of the weld pool from the Ti interface shows the NiTi dendrites growing in opposite directions, i.e., into the weld pool shown in the next picture.
We can see a Ti fusion interface with the wide area of the HAZ containing the Ti2Ni layer, which grew further into the base metal. The interface of the base material and the HAZ was linear and separated into pure forms. The HAZ created from the Ni side was about 7 µm; in the case of the Ti side, it was wider, around 80 µm.
The fusion line on the Ni side in Figure 11a reveals only a small amount of base metal development into the weld. The base metal formed a cellular morphology and grew as a solid solution phase γ-Ni containing up to 21.92 at. % of Ti. It can be seen that a Ni3Ti layer and the eutectic region grew. In this image, the rest of the microstructure, and the majority of the weld, are composed of the Ni3Ti + NiTi eutectic.

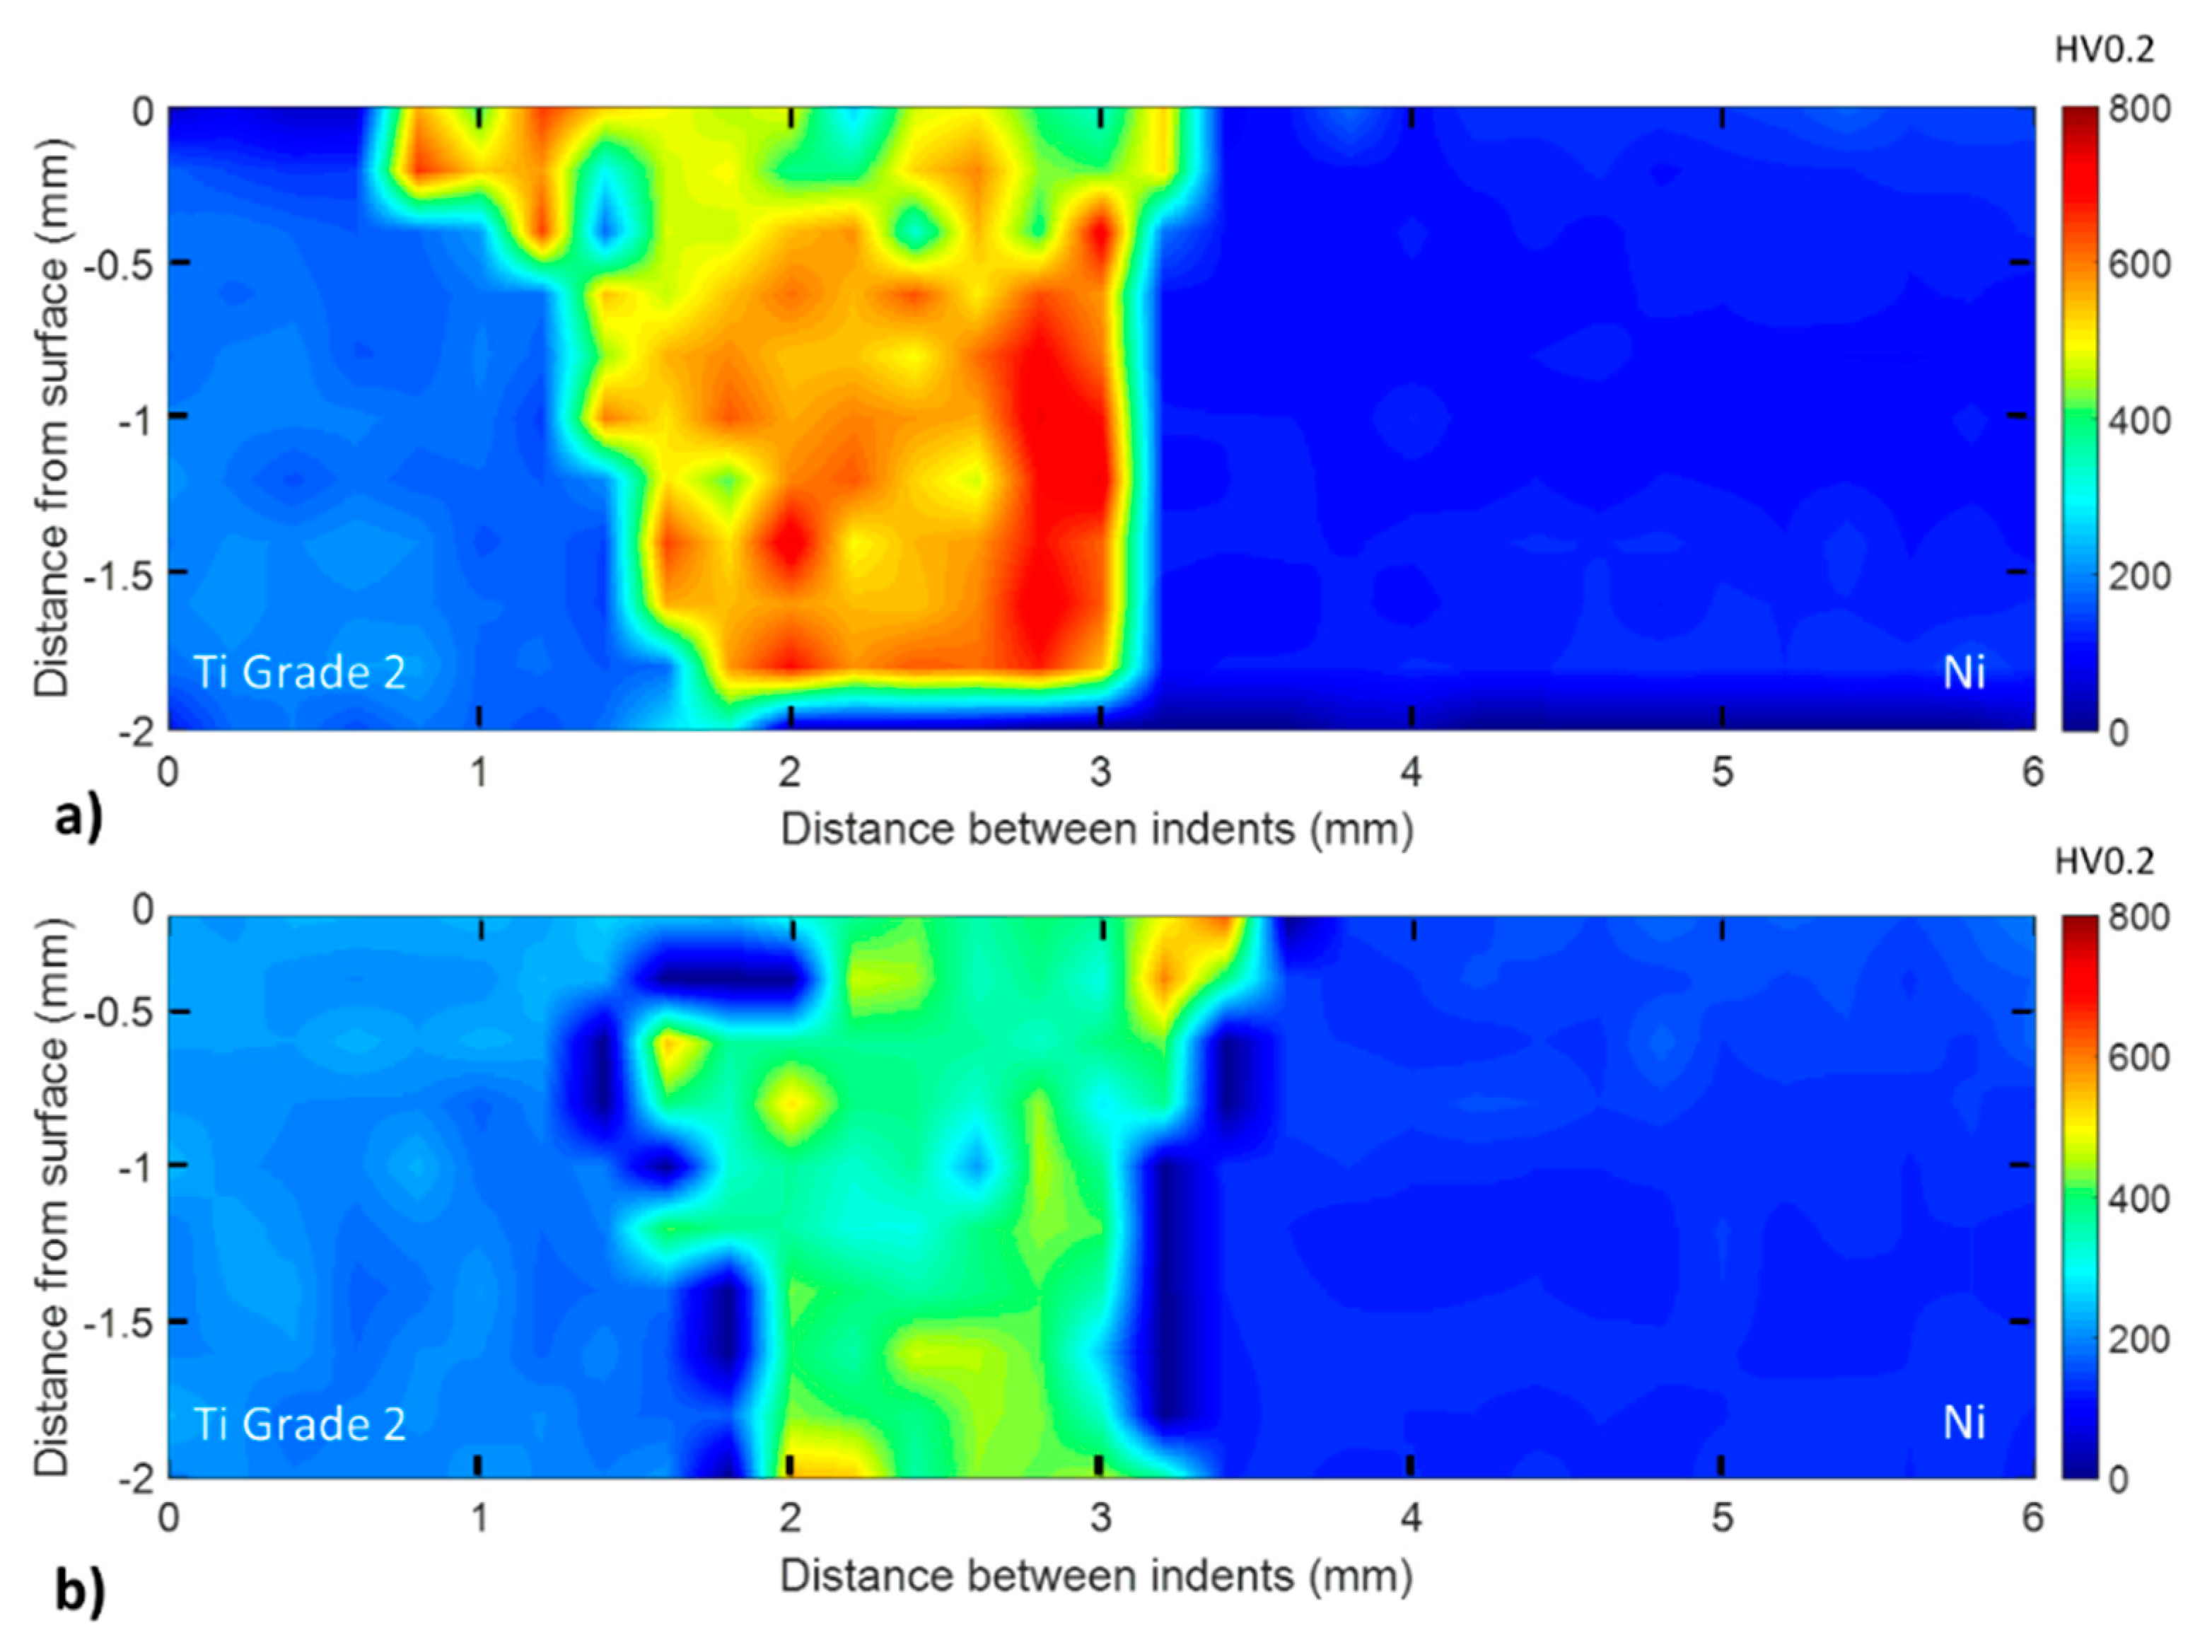
3.5. Microhardness Measurements

The distribution of microhardness across the welded joints was analyzed to further study the microstructure vs. mechanical properties relationships, as illustrated in Figure 12. By keeping the weld centered, microhardness measurements were taken of prepared weld joints. The hardness of weld metal was determined to have a peak hardness value in the range 660.3–483.4 HV, as shown by the hardness profile. The microhardness of base metal was compared to the manufacturer’s reported values. The values of measured microhardness of HAZ were somewhat similar to microhardness values of the base metal. From the above values, it is clear that the microhardness of the weld metal was five times higher than that of the base metal.
By achieving lower microhardness in the Ti/Ni weld, the ductility of the joint and its crack stop property can be improved.
Figure 13a presents the microhardness map of welded joint 8. This weld joint sample was created with the welding speed of 30 mm/s, welding current of 70 mA, which was the highest welding current used in these samples, and the heat input of 128.3 J/mm.
Nickel and titanium, as the base metals, had homogenous distributions of hardness corresponding to their microhardness values as predicted by theory, according to a microhardness contour map generated from microhardness measurements over the weld cross-section. The base metals Ti and Ni and their heat-affected zones microhardness were identical, due to the small heat input by the electron beam welding, as opposed to traditional fusion welding. It effectively eliminates grain development close to the weld metal interface. In the weld metal, the microhardness rapidly grew, which was expected because of the presence of the intermetallic layer. In the weld metal, the average microhardness was much higher than the average microhardness of the base metals. The increase in microhardness in the weld metal was most likely associated with the presence of the brittle intermetallic compound TiNi3. Using a filler metal prevents brittle intermetallic Ti–Ni system compounds from forming, and the hardness decreases [38]. The influence of heat input is clear. Based on the microhardness maps, when the higher heat input was used, higher microhardness in the weld metal was recorded. Microhardness map for weld joint 10 produced with a heat input of 68.8 J/mm is given n Figure 13b. In this case, lower microhardness values were measured in the weld metal. When taking a closer look at the microhardness course across the mid-thickness of both welded joints, it is necessary to underline some important remarks. The microhardness of titanium Grade 2 averaged 194 HV and that of nickel 201 averaged 123 HV. The average value of microhardness of the weld metal in the case of heat input 128.3 J/mm (8) reached the value of 603 HV. The drop of the heat input to 68.8 J/mm (10) resulted in a decrease in the weld metal microhardness to 376 HV. This could be associated with the greater intermixing of both metals when high heat input was used.

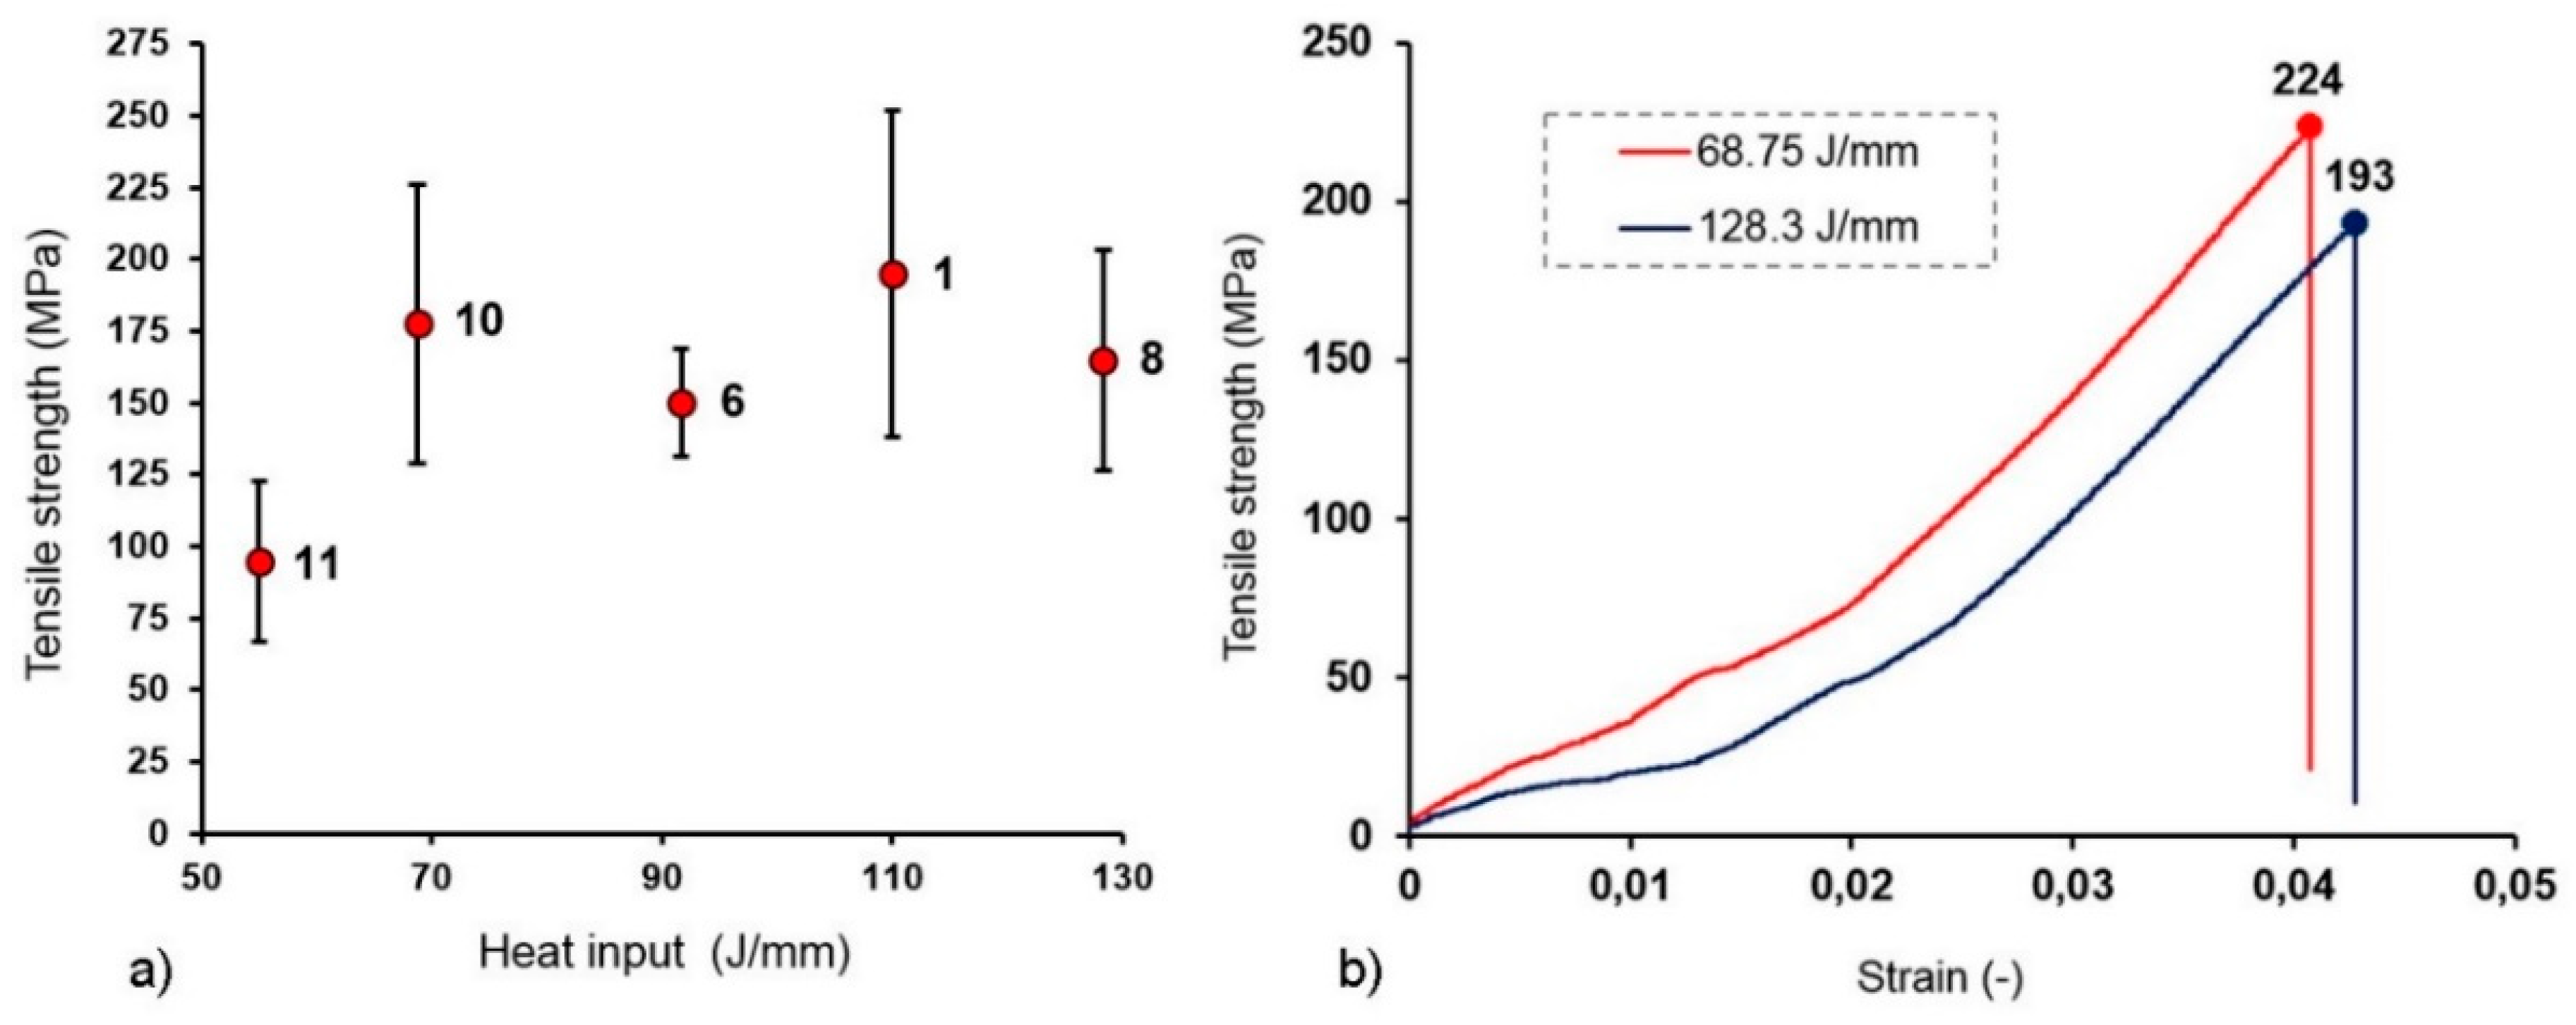
3.6. Tensile Strength Results

Tensile testing was used to determine the mechanical characteristics due to the standard STN 6892-1. The same welding conditions were employed to prepare representative samples for the tensile test as for other samples. Four samples of each weldment were subjected to tensile tests. All samples ruptured at the HAZ of the Ti side. The tensile test measurement values are shown in the graph of heat input vs. tensile strength. No clear trend was found between heat input, beam current, or welding speed and tensile strength. The values of tensile strength were: sample 10—175 MPa; sample 6—155 MPa; sample 1—190 MPa; and sample 8—160 MPa.
Each sample appears to have broken soon after the yield point was reached. Furthermore, the ultimate strength and the fracture point were both coincident. There was no necking in this scenario. Figure 14a,b illustrates the influences of heat input on the weld strength and stress–strain curves of electron beam welded joints 8 and 10.

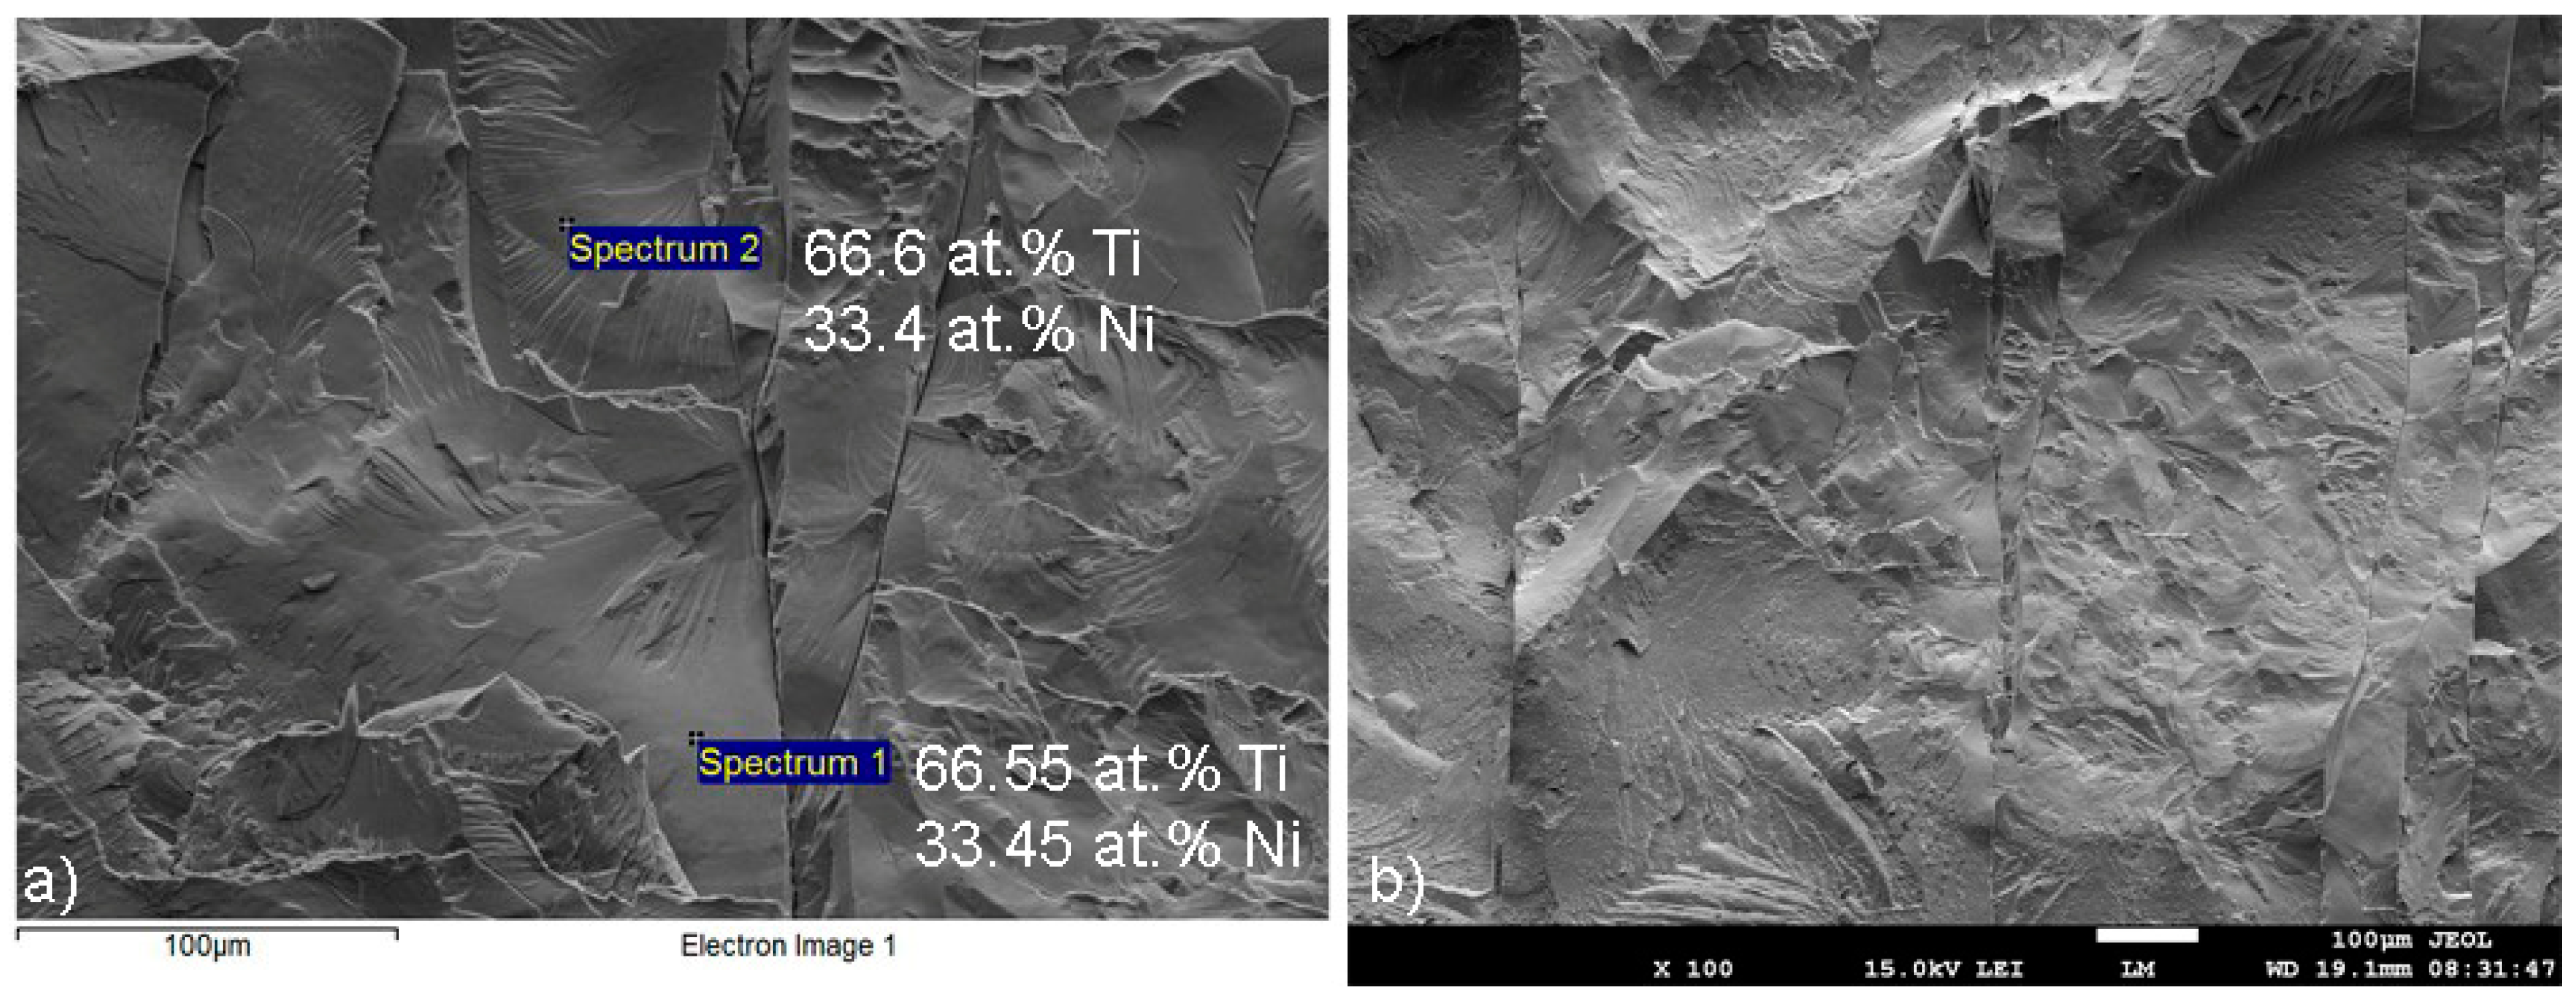
3.7. Fracture Surfaces

The SEM images in Figure 15a,b show the fracture surface’s interface in sample 8 from the Ti side and the weld metal side. We know from previous experiments that the base metal Ti results in an evident ductile dimple fracture, and the interface of the base metal Ti and weld metal had a brittle cleavage fracture on the fracture surface with river markings. There were several crack initiations in the traverse course. The cracks were initiated by a cleavage process.
Several secondary cracks were stopped by grain boundaries. For the fracture of the welded joint at room temperature, the brittle fracture was situated exactly at the interface of base metal Ti and weld metal. This means that this interface was the weakest position of the welded joint, essentially due to the larger grains. There was no plastic area that was visible. Furthermore, EDS point analysis was carried out on the fracture surface. The chemical composition analysis revealed that about 67 at. % of titanium and 33 at. % of nickel were present in the analyzed locations, corresponding to the presence of Ti2Ni MC decreasing the mechanical properties of the welded joint.

4. Discussion

The research was focused on joining different Ti/Ni materials using electron beam welding technology. Two substrates were used for the experiment, Ti Grade2 and Ni201 alloy, both measuring 50 × 100 × 2 mm. Welding parameters were designed on the basis of literature facing the same or similar issues. The experiments consisted of 16 welds. The values of welding current varied from 40 to 70 mA and the welding speed from 20 to 50 mm/s. The electron beam was focused on the upper surfaces of the materials to be welded, using a focusing current of 890 mA. For samples 15 and 16, circular oscillation was used in welding. The analysis of the welded joints took place in several stages. The geometry and shape of the surface and root of the weld were monitored by visual inspection. The width of the weld on the surface and on the root side was measured. Longitudinal and transverse cracks were recorded along the weld on the surface of the weld joint and on the root side. Cracking in the weld after solidification led to a loss of the integrity of the welded joint, and there was a change in the consistency of the joint. As a result of the visual inspection, it was possible to subject samples 1, 6, 8, and 10 to subsequent analysis, as they retained their integrity according to the designed and used welding parameters (Table 7). The width of the surface weld was in the range of 2.402–2.686 mm. Low heat input per unit length of EBW weld can significantly reduce residual deformation and prevent cracking of the surface and the root of the welded joint. For a more detailed analysis, we selected sample 8 with a heat input of 128.3 J/mm and sample 10 with a heat input of 68.75 J/mm. The geometry of the welds varied depending on the welding parameters used, but samples 8 and 10 showed approximately the same values of surface width and weld root, in spite of their different heat input values. The resulting microstructure and the proportion of intermetallic phases in the weld were affected by the cooling rate of the liquid. The cooling rates of melted material in the fusion zones of the weld joints of samples 8 and 10 were estimated by computing Equation (2) [39]:
R = 2 π κ ρ C ( s Q ) 2 ( T T 0 ) 3
where R is the cooling rate (K/s); T is the liquid’s temperature (1583 K for NiTi)); T0 is the room temperature (293 K); κ is the thermal conductivity (8.6 W/m K); ρ is the density of material (6450 kg/m3); C is the specific heat (837 J/kg·K); s is the thickness of welded specimen (0.002 m); Q is heat input (J/m).
Joint 8 (Q = 128300 J/m)    R = 152 K/s
Joint 10 (Q = 68750 J/m)    R = 530 K/s
Cracking can be suppressed by increasing the cooling rate of the liquid. At high cooling rates, a supersaturated solid solution is formed (NiTi diagram Figure 1), which reduces the formation of intermetallic phases NiTi, Ni3Ti, and NiTi2. An increase in cooling rate can be achieved by reducing the heat input (Equation (2)). This corresponds to the results in Figure 2. The influence of heat input is clear. Based on the microhardness maps, when the higher heat input was used, higher microhardness of the weld metal was recorded.
The macrostructural analysis confirmed higher asymmetry of Ti melting. The cause of the asymmetry of the weld pool was the lower thermal diffusion of Ti compared to Ni. The microstructures of the samples were monitored in the areas: BM (base metal) titanium Grade 2–HAZ (heat affected zone) of the BM, Ti BM–WM (weld metal), Ti BM–HAZ of the BM Ni, and HAZ–BM–nickel 201. Ti Grade 2 and Ni 201 had polyhedral morphology. The microstructure of Ti contained fine grains with slight heterogeneity. The heat-affected area differed by significant grain coarsening. The grains had a polyhedral structure, and waves could be seen at some borders. This could have been due to higher heat. The weld metal had a predominantly dendritic morphology. Dendrites were formed by the substitution of the solid solution of the γ phase. The Ni matrix was made of austenite. Austenite grains showed heterogeneity of about 10 to 200 μm. The grain boundaries were clear without precipitation of secondary phases. Annealing twins could be observed in austenitic grains.
The subjects of further research will be the monitoring of the proportions of intermetallic phases in the weld metal, depending on the cooling rate, and attempts at stabilizing the structure and minimizing stresses in the weld metal by means of heat treatment.

5. Conclusions

Dissimilar Ti Grade 2–Ni 201 welds were prepared by EBW by using different welding parameters. The macrostructures and microstructures, microhardness, and tensile properties have been analyzed. The following conclusions can be drawn:
  • The samples were subjected to visual testing, in which longitudinal and transverse cracks were recorded along the whole weld. Cracking in the weld after solidification led to a loss in integrity of the welded joint.
  • Fully penetrated welds had near parallel fusion lines on both sides. The weld profile on the Ni side was straighter than on the Ti side.
  • The weld metal had a predominantly dendritic morphology. Dendrites were formed by a substitution solid solution of the γ phase, which contained nickel and titanium, or a small number of alloying elements used n alloys.
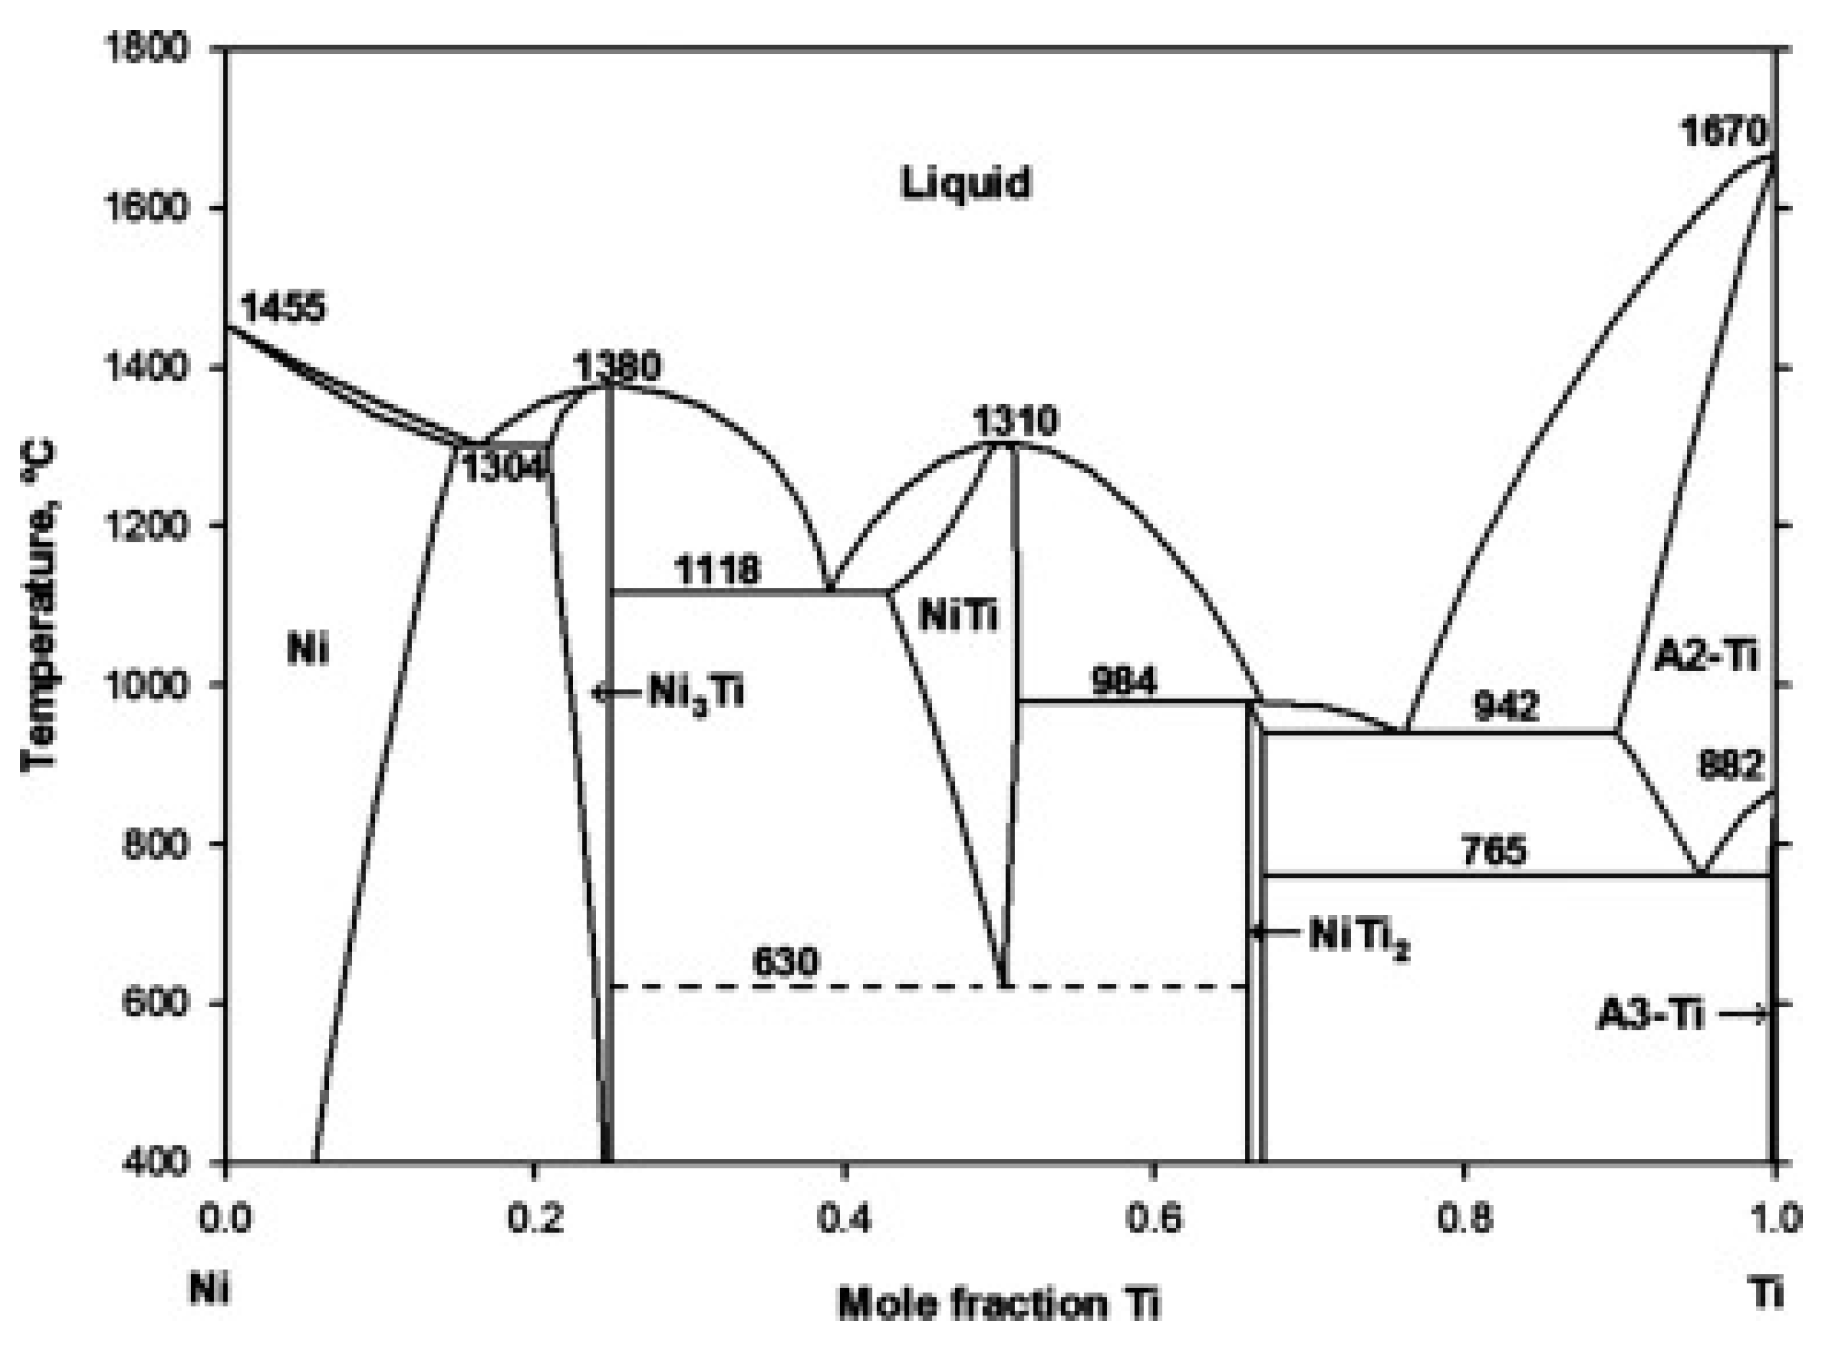
  • The microstructure of the weld pool was composed of various phases, which were detected by SEM composition analysis. The microstructure in the weld pool’s middle section was largely made up of NiTi and TiNi3.
  • The microhardness of the base material was compared to the producer’s declared values. The values of the measured hardness of HAZ were somewhat similar to the hardness values of the base material. The hardness of weld metal was five times higher than that of the base material.
  • No clear trend was found between heat input and tensile strength. Brittle fracturing was observed after tensile testing. There were several crack initiations in the traverse course. The cracks were initiated by a cleavage process due to the formation of intermetallic compounds, namely, Ti2Ni.

Author Contributions

Conceptualization, B.Š. and E.H.; methodology, P.K.; software, F.P.; validation, P.K., I.K. and M.S. (Miroslav Sahul); formal analysis, M.P.; investigation, P.K.; resources, B.Š.; data curation, M.S. (Martin Sahul); writing—original draft preparation, B.Š.; writing—review and editing, E.H.; visualization, M.P.; supervision, P.K.; project administration, I.K.; funding acquisition, E.H. All authors have read and agreed to the published version of the manuscript.

Funding

The research was carried out under the support of the Vedecká grantová agentúra VEGA grant agency of the Ministry of Education, Science, Research and Sport of the Slovak Republic, project 1/0499/21; by the Slovak Research and Development Agency under the contract APVV-SK-AT-20-0013 (Bilateral project Slovakia—Austria SK-AT 2020); and by the International Cooperation in Higher Education Department of the OeAD (“Research on electron beam weldability of hard to join dissimilar materials” SK14/2021).

Institutional Review Board Statement

Not applicable.

Informed Consent Statement

Not applicable.

Data Availability Statement

Not applicable.

Conflicts of Interest

The authors declare no conflict of interest.

References

  1. Fan, X.G.; Yang, H.; Yan, S.L.; Gao, P.F.; Zhou, J.H. Mechanism and Kinetics of Static Globularization in TA15 Titanium. Alloy with Transformed Structure. J. Alloy. Compd. 2012, 533, 1–8. [Google Scholar] [CrossRef]
  2. Yang, L.; Wang, B.; Liu, G.; Zhao, H.; Xiao, W. Behavior and Modeling of Flow Softening and Ductile Damage Evolution in Hot Forming of TA15 Alloy Sheets. Mater. Des. 2015, 85, 135–148. [Google Scholar] [CrossRef]
  3. Ezugwu, E.O.; Wang, Z.M. Titanium Alloys and Their Machinability—A Review. J. Mater. Process. Technol. 1997, 68, 262–274. [Google Scholar] [CrossRef]
  4. Gurappa, I. Protection of Titanium Alloy Components against High Temperature Corrosion. Mater. Sci. Eng. A 2003, 356, 372–380. [Google Scholar] [CrossRef]
  5. Liu, Z.; Bi, Q.; Guo, Y.; Yan, J.; Yang, Z. Convective heat transfer and pressure drop characteristics of near-critical-pressure hydrocarbon fuel in a minichannel. Appl. Therm. Eng. 2013, 51, 1047–1054. [Google Scholar] [CrossRef]
  6. Ii, S.A.P.; Shyam, A.; Ritchie, R.O.; Milligan, W.W. High Frequency Fatigue Crack Propagation Behavior of a Nickel-Base Turbine Disk Alloy. Int. J. Fatigue 1999, 21, 725–731. [Google Scholar] [CrossRef]
  7. Chen, H.C.; Pinkerton, A.J.; Li, L. Fibre laser welding of dissimilar alloys of Ti-6Al-4V and Inconel 718 for aerospace applications. Int. J. Adv. Manuf. Technol. 2011, 52, 977–987. [Google Scholar] [CrossRef]
  8. Cai, Q.; Liu, W.; Ma, Y.; Wang, Z. Diffusion brazing of tungsten and steel using Ti–Ni liquid phase forming interlayer. Fusion Eng. Des. 2015, 91, 67–72. [Google Scholar] [CrossRef]
  9. McQuillan, A.D.; McQuillan, M.K. Titanium; Butterworths Scientific Publications: London, UK, 1956; pp. 124–127. [Google Scholar]
  10. Wang, T.; Zhang, B.; Wang, H.; Feng, J. Microstructures and Mechanical Properties of Electron Beam-Welded Titanium-Steel Joints with Vanadium, Nickel, Copper and Silver Filler Metals. J. Mater. Eng. Perform. 2014, 23, 1498–1504. [Google Scholar] [CrossRef]
  11. Otsuka, K.; Ren, X. Physical metallurgy of Ti–Ni-based shape memory alloys. Prog. Mater. Sci. 2005, 50, 511–678. [Google Scholar] [CrossRef]
  12. Oliveira, J.; Miranda, R.; Braz, F. Welding and Joining of NiTi Shape Memory, Alloys—A Review. Prog. Mater. Sci. 2017, 88, 412–466. [Google Scholar] [CrossRef]
  13. Elahinia, M.; Hashemi, M.; Tabesh, M. Manufacturing and processing of NiTi implants—A review. Prog. Mater. Sci. 2012, 57, 911–946. [Google Scholar] [CrossRef]
  14. Novak, P.; Vojtěch, V.; Pecenová, Z.; Průša, F.; Pokorný, P.; Deduytsche, D.; Detavernier, C.; Bernatiková, A.; Salvetr, P.; Knaislová, A.; et al. Formation of Ni–Ti intermetallics during reactive sintering at 800–900 °C. Mater. Technol. 2017, 51, 679–685. [Google Scholar] [CrossRef] [Green Version]
  15. Skolakova, A.; Novak, P.; Salvetr, P. Influence of elements with high affinity to oxygen on microstructure and phase composition of Ni–Ti alloy. Manuf. Technol. 2017, 16, 808–814. [Google Scholar] [CrossRef]
  16. Chatterjee, S.; Abinandanan, T.A.; Chattopadhya, K. Microstructure Development during Dissimilar Welding: Case of Laser Welding of Ti with Ni involving intermetallic Phase Formation. J. Mater. Sci. 2006, 41, 643–652. [Google Scholar] [CrossRef]
  17. Alemán, B.; Gutiérrez, I.; Urcola, J.J. Interface Microstructures in the Diffusion Bonding of a Titanium Alloy Ti 6242 to an INCONEL 625. Metall. Mater. Trans. A 1995, 26, 437–446. [Google Scholar] [CrossRef]
  18. Sam, S.; Kundu, S.; Chatterjee, S. Diffusion Bonding of Titanium Alloy to Micro-Duplex Stainless Steel Using a Nickel Alloy interlayer: Interface Microstructure and Strength Properties. Mater. Des. 2012, 40, 237–244. [Google Scholar] [CrossRef]
  19. Shanmugarajan, B.; Padmanabham, G. Fusion welding studies using laser on Ti–SS dissimilar combination. Opt. Lasers Eng. 2012, 50, 1621–1627. [Google Scholar] [CrossRef]
  20. Satoh, G.; Yao, Y.L.; Qiu, C. Strength and microstructure of laser fusion-welded Ti–SS dissimilar material pair. Int. J. Adv. Manuf. Technol. 2013, 66, 469–479. [Google Scholar] [CrossRef]
  21. Cavaleiro, A.J.; Ramos, A.S.; Braz Fernandes, F.M.; Schell, N.; Vieira, M.T. In situ characterization of NiTi/Ti6Al4V joints during reaction-assisted diffusion bonding using Ni/Ti multilayers. J. Mater. Eng. Perform. 2014, 23, 1625–1629. [Google Scholar] [CrossRef]
  22. Tomashchuk, I.; Sallamand, P.; Andrzejewski, H.; Grevey, D. The formation of intermetallics in dissimilar Ti6Al4V/copper/AISI 316 L electron beam and Nd:YAG laser joints. Intermetallics 2011, 19, 1466–1473. [Google Scholar] [CrossRef]
  23. Tomashchuk, I.; Sallamand, P.; Belyavina, N.; Pilloz, M. Evolution of microstructures and mechanical properties during dissimilar electron beam welding of titanium alloy to stainless steel via copper interlayer. Mater. Sci. Eng. A 2013, 585, 114–122. [Google Scholar] [CrossRef]
  24. Tomashchuk, I.; Grevey, D.; Sallamand, P. Dissimilar laser welding of AISI 316L stainless steel to Ti6–Al4–6V alloy via pure vanadium interlayer. Mater. Sci. Eng. A 2015, 622, 37–45. [Google Scholar] [CrossRef]
  25. Li, H.; Sun, D.; Cai, X.; Dong, P.; Gu, X. Laser welding of TiNi shape memory alloy and stainless steel using Co filler metal. Opt. Laser Technol. 2013, 45, 453–460. [Google Scholar] [CrossRef]
  26. Li, H.; Sun, D.; Gu, X.; Dong, P.; Lv, Z. Effects of the thickness of Cu filler metal on the microstructure and properties of laser-welded TiNi alloy and stainless steel joint. Mater. Des. 2013, 50, 342–350. [Google Scholar] [CrossRef]
  27. Pouquet, J.; Miranda, R.M.; Quintino, L.; Williams, S. Dissimilar Laser Welding of Nitinol to Stainless Steel. Int. J. Adv. Mater. Technol. 2012, 61, 205–212. [Google Scholar] [CrossRef]
  28. Gugel, H.; Schuermann, A.; Theisen, W. Laser welding of NiTi wires. Mater. Sci. Eng. A 2008, 481–482, 668–671. [Google Scholar] [CrossRef]
  29. Vannod, J.; Bornert, M.; Bidaux, J.-E.; Bataillard, L.; Karimi, A.; Drezet, J.-M.; Rappaz, M.; Hessler-Wyser, A. Mechanical and microstructural integrity of nickel–titanium and stainless steel laser joined wires. Acta Mater. 2011, 59, 6538–6546. [Google Scholar] [CrossRef]
  30. Seretsky, J.; Ryba, E.R. Laser welding of dissimilar metals: Titanium to nickel. Weld. J. 1976, 55, 208–211. Available online: https://files.aws.org/wj/supplement/WJ_1976_07_s208.pdf (accessed on 10 May 2022).
  31. Sun, Z.; Karppi, R. The Application of Electron Beam Welding for the Joining of Dissimilar Metals—An Overview. J. Mater. Process. Technol. 1996, 59, 257–267. [Google Scholar] [CrossRef]
  32. Zhang, H.; He, P.; Feng, J.; Wu, H. Interfacial Microstructure and Strength of the Dissimilar Joint Ti3Al/TC4 Welded by the Electron Beam Process. Mater. Sci. Eng. A 2006, 425, 255–259. [Google Scholar] [CrossRef]
  33. Gao, M.; Mei, S.W.; Wang, Z.M.; Li, X.Y.; Zeng, X.Y. Characterisation of Laser Welded Dissimilar Ti/steel Joint Using Mg interlayer. Sci. Technol. Weld. Join. 2012, 17, 269–276. [Google Scholar] [CrossRef]
  34. Wang, T.; Zhang, B.; Feng, J.; Tang, Q. Effect of a Copper Filler Metal on the Microstructure and Mechanical Properties of Electron Beam Welded Titanium–stainless Steel Joint. Mater. Charact. 2012, 73, 104–113. [Google Scholar] [CrossRef]
  35. Zhang, B.; Wang, T.; Chen, G.; Feng, J. Contact Reactive Joining of TA15 and 304 Stainless Steel Via a Copper interlayer Heated by Electron Beam with a Beam Deflection. J. Mater. Eng. Perform. 2012, 21, 2067–2073. [Google Scholar] [CrossRef]
  36. Swift-Hook, D.T.; Gick, A.E.F. Penetration Welding with Lasers. Weld. J. 1973, 52, 492–499. Available online: https://files.aws.org/wj/supplement/WJ_1973_11_s492.pdf (accessed on 10 May 2022).
  37. Zhan, Z.; Chen, Y.; Wang, S.; Huang, Y.; Mao, Y. Prevention of crack formation in electron-beam welded joints of dissimilar metal compounds (TiNi_Ti6Al4V). Met. Sci. Heat Treat. 2019, 61, 5–6. [Google Scholar] [CrossRef]
  38. Chen, J.; Xue, L.; King, M.; Campbell, G. High power CW YAG laser weldability of dissimilar Ti to Ni metal plates through beam shift. Int. J. Adv. Manuf. Technol. 2019, 104, 489–501. [Google Scholar] [CrossRef]
  39. Wang, G.; Huang, Y.J.; Shagiev, M.; Shena, J. Laser Welding ofTi40Zr25Ni3Cu12Be20 Bulk Metallic Glass. Mater. Sci. Eng. A 2012, 541, 33–37. [Google Scholar] [CrossRef]
Figure 1. Binary diagram of Ni–Ti data from [2].
Metals 12 00894 g001
Figure 2. Electron beam welding workplace—vacuum chamber (a); setup and clamping of welded materials (b).
Metals 12 00894 g002
Figure 3. The tensile test specimens’ schematic (a), and fractured test specimens after tensile testing (b).
Metals 12 00894 g003
Figure 4. Weld bead and root view for joints produced with electron beam welding with different parameters (samples 1, 6, 8, 10).
Metals 12 00894 g004aMetals 12 00894 g004b
Figure 5. Dependence of heat input (J/mm) on weld width (mm) for samples 1, 6, 8, and 10.
Metals 12 00894 g005
Figure 6. Cross-sections of weld joints produced with different welding parameters. Samples 1 (a), 6 (b), 8 (c), 10 (d).
Metals 12 00894 g006
Figure 7. Nickel–HAZ transition zone of weld 8 (a); weld metal 8 (b); titanium–HAZ-base metal of weld 8 (c).
Metals 12 00894 g007
Figure 8. Measurement of chemical composition by EDS analysis (weld 8).
Metals 12 00894 g008
Figure 9. Measurement of chemical composition by EDS analysis (nickel–weld metal interface) (weld 10).
Metals 12 00894 g009
Figure 10. SEM analysis of the Ni–HAZ–weld metal interface of weld 8 (a); high magnification of weld metal area (b); weld metal–Ti HAZ interface (c).
Metals 12 00894 g010
Figure 11. SEM analysis of the Ni–HAZ–weld metal of weld 10 (a); higher magnification of weld metal interface (b); weld metal–Ti HAZ interface (c).
Metals 12 00894 g011
Figure 12. The distribution of microhardness across the Ti–weld metal–Ni interface of sample 8 (a) and sample 10 (b).
Metals 12 00894 g012
Figure 13. Microhardness map of weld joints 8 (a) and 10 (b) produced with various heat inputs.
Metals 12 00894 g013
Figure 14. Heat input influences the weld strength (a). Stress–strain curves of electron beam welded joints 8 (128.3 J/mm) and 10 (68.8 J/mm) (b).
Metals 12 00894 g014
Figure 15. Morphology of the fracture surface at the interface of Ti Grade 2 and weld metal (a,b).
Metals 12 00894 g015
Table 1. Chemical composition of Ni 201 alloy (in wt. %).
FeMnSiCSCuNi
0.400.350.350.150.010.25Balance
Table 2. Chemical composition of Ti Grade 2 (in wt. %).
FeCOHNTi
0.300.080.250.0150.03Balance
Table 3. Mechanical properties of Ni 201 alloy.
Tensile Strength Rm (MPa)Yield Strength Rp0.2 (MPa)Ductility (%)
3457040
Table 4. Mechanical properties of Ti Grade 2.
Tensile Strength Rm (MPa)Yield Strength Rp0.2 (MPa)Ductility (%)
48535020
Table 5. Electron beam welding parameters.
Welded Joint No.Accelerating
Voltage [kV]
Welding
Current [mA]
Welding Speed [mm/s]Focusing Current
[mA]
Heat Input [J/mm]Beam Offset
[µm]
15560308901100
2556030890110+100 Ni
3556030890110+200 Ni
4556030890110+300 Ni
5556030890110−200 Ti
655503089091.670
755403089073.330
8557030890128.30
9555020890137.50
1055504089068.750
11555050890550
12554040890550
1355403089073.330
145540208901100
155560208901650
165560308901100
Table 6. Oscillation parameters.
Welded Joint No.Channel Voltage A
[mV]
Channel Voltage B
[mV]
Frequency [Hz]
15200200200
16200200200
Table 7. Measured widths of the bead and root for dissimilar weld joints.
Welded Joint No.Width of the Weld Bead [mm]Width of the Weld Root [mm]
12.4852.104
62.4021.424
82.6861.493
102.6701.580
Table 8. EDS point analysis of weld 8 (Ni—weld metal interface) (in at. %).
SpectrumTiNi
1.0.00100.00
2.0.00100.00
3.0.3199.69
4.4.5995.41
5.45.4554.55
6.65.0734.93
7.50.7349.27
8.66.5233.48
9.51.4448.56
10.50.8549.15
Table 9. EDS point analysis weld 10 (nickel–weld metal interface) (in at. %).
SpectrumTiNi
1.0.00100.00
2.21.9278.08
3.45.9154.09
4.49.3550.65
Publisher’s Note: MDPI stays neutral with regard to jurisdictional claims in published maps and institutional affiliations.

