Article

Cretaceous Dinosaurs across Alaska Show the Role of Paleoclimate in Structuring Ancient Large-Herbivore Populations

by
Anthony R. Fiorillo
1,*,
Paul J. McCarthy
2,
Yoshitsugu Kobayashi
3 and
Marina B. Suarez
4
1
Huffington Department of Earth Sciences, Southern Methodist University, Dallas, TX 75275, USA
2
Department of Geosciences, and Geophysical Institute, University of Alaska, Fairbanks, AK 99775, USA
3
Hokkaido University Museum, Hokkaido University, Kita 10, Nishi 8, Kita-Ku, Sapporo 060-0810, Hokkaido, Japan
4
Department of Geology, The University of Kansas, Lawrence, KS 66045, USA
*
Author to whom correspondence should be addressed.
Submission received: 17 February 2022 / Revised: 17 March 2022 / Accepted: 30 March 2022 / Published: 2 April 2022

Abstract

:
The partially correlative Alaskan dinosaur-bearing Prince Creek Formation (PCF), North Slope, lower Cantwell Formation (LCF), Denali National Park, and Chignik Formation (CF), Aniakchak National Monument, form an N–S transect that, together, provides an unparalleled opportunity to examine an ancient high-latitude terrestrial ecosystem. The PCF, 75–85° N paleolatitude, had a Mean Annual Temperature (MAT) of ~5–7 °C and a Mean Annual Precipitation (MAP) of ~1250 mm/year. The LCF, ~71° N paleolatitude, had a MAT of ~7.4 °C and MAP of ~661 mm/year. The CF, ~57° N paleolatitude, had a MAT of ~13 °C and MAP of ~1090 mm/year. The relative abundances of the large-bodied herbivorous dinosaurs, hadrosaurids and ceratopsids, vary along this transect, suggesting that these climatic differences (temperature and precipitation) played a role in the ecology of these large-bodied herbivores of the ancient north. MAP played a more direct role in their distribution than MAT, and the seasonal temperature range may have played a secondary role.

1. Introduction

It is now clear that the impacts of a changing climate are of major societal concern. Scientific investigation into a changing global climate centers on issues related to mitigation or modeling how a future warmer world would look. Further, it is also broadly recognized that impacts of change of a warming Earth are most profoundly expressed in the polar regions. In the Arctic, there are many clear examples of the rapid rate of climate change and its dire ecological and societal consequences [1,2]. Admittedly, climate change encompasses many components, but by investigating a window in the deep history of the ancient Arctic, this study identifies the key role that precipitation and temperature play in structuring vertebrate herbivore populations.
The terrestrial rocks of the Late Cretaceous Arctic are producing a rich record of biota that existed during quite different global climatic conditions than those observed today [3,4,5,6,7,8,9,10,11,12,13]. Paleofloras correlate several Cretaceous time slices between Northeastern Asia and Northwestern North America, and, together, the deposits of Northeastern Russia and Northern Alaska have been termed the North Pacific Region [8]. While this record is important within the context of ancient global climate, studies of modern climate change differentiate between global and regional scales, with the latter having only loose formal boundaries ranging from sub-continental areas to local ecological scales [14]. Furthermore, there is now an appreciation in modern biology among conservation biologists that local environmental conditions play a significant role in structuring at least some herbivorous populations in the high latitudes [15]. The Late Campanian–Early Maastrichtian terrestrial rocks of Alaska offer an ideal opportunity to examine the relationship between local environments and extinct herbivore populations in deep time.
The Cretaceous of Alaska has a remarkable record of a vast ancient Arctic terrestrial ecosystem that includes an abundance of dinosaurs. During the latest Cretaceous (Campanian–Maastrichtian), large-bodied (>1000 kg in body mass) herbivorous dinosaurs were dominated by hadrosaurids (duck-billed dinosaurs) and ceratopsids (horned dinosaurs) in the Arctic region of North America [4,5,10,16]. At present, large-bodied herbivores (e.g., elephants) are keystone species for their respective ecosystems, contributing to local biodiversity and ecosystem structure. Furthermore, feedback loops exist between climate, plants, and herbivores [10]. Given these relationships in modern ecosystems, it is interesting to examine them in ancient ecosystems.
In the 1980s, paleobotanical evidence showed that paleotemperatures in the ancient Arctic, while variable, were warmer than the modern Arctic, although they still experienced strong seasonality, due to variation in the annual light regime [17]. Histologic studies of dinosaur bones show that herbivorous dinosaurs had variable growth rates through the year, and these variations were likely tied to seasonal availability of food [18]. Since the seminal study by Parrish and Spicer [17], as well as other paleoclimate studies based on leaf physiognomy [8,11,12], a wealth of new multidisciplinary data have provided an opportunity to further refine our understanding of the regional relationship between biota and climate in the ancient Arctic.
The North Slope of Alaska, Prince Creek Formation (PCF), contains remarkable concentrations of dinosaur bones. Partially correlative rocks of the Lower Cantwell Formation (LCF) in South–Central Alaska in Denali National Park (DENA), and of the Chignik Formation (CF) of southern Alaska in Aniakchak National Monument (ANIA), have abundant records of fossil footprints (Figure 1). These three study areas span the Late Campanian–Early Maastrichtian boundary (Figure 2), and, together, these localities which spanned approximately 20° of paleolatitude, are of comparable paleoelevation (at or near sea level) and indicate the existence of a widespread terrestrial ecosystem that is capable of supporting large-bodied herbivores. The rocks were deposited at latitudes close to, or higher than, current latitudes [19] (Figure 1), making this the paleontologically richest known Cretaceous high-latitude terrestrial ecosystem in the world. Across this large geographic area, the distribution of large-bodied hadrosaurids and ceratopsids was not uniform. Here we suggest that the paleoclimate was the primary determinant of patterns observed within herbivorous Arctic dinosaur populations.

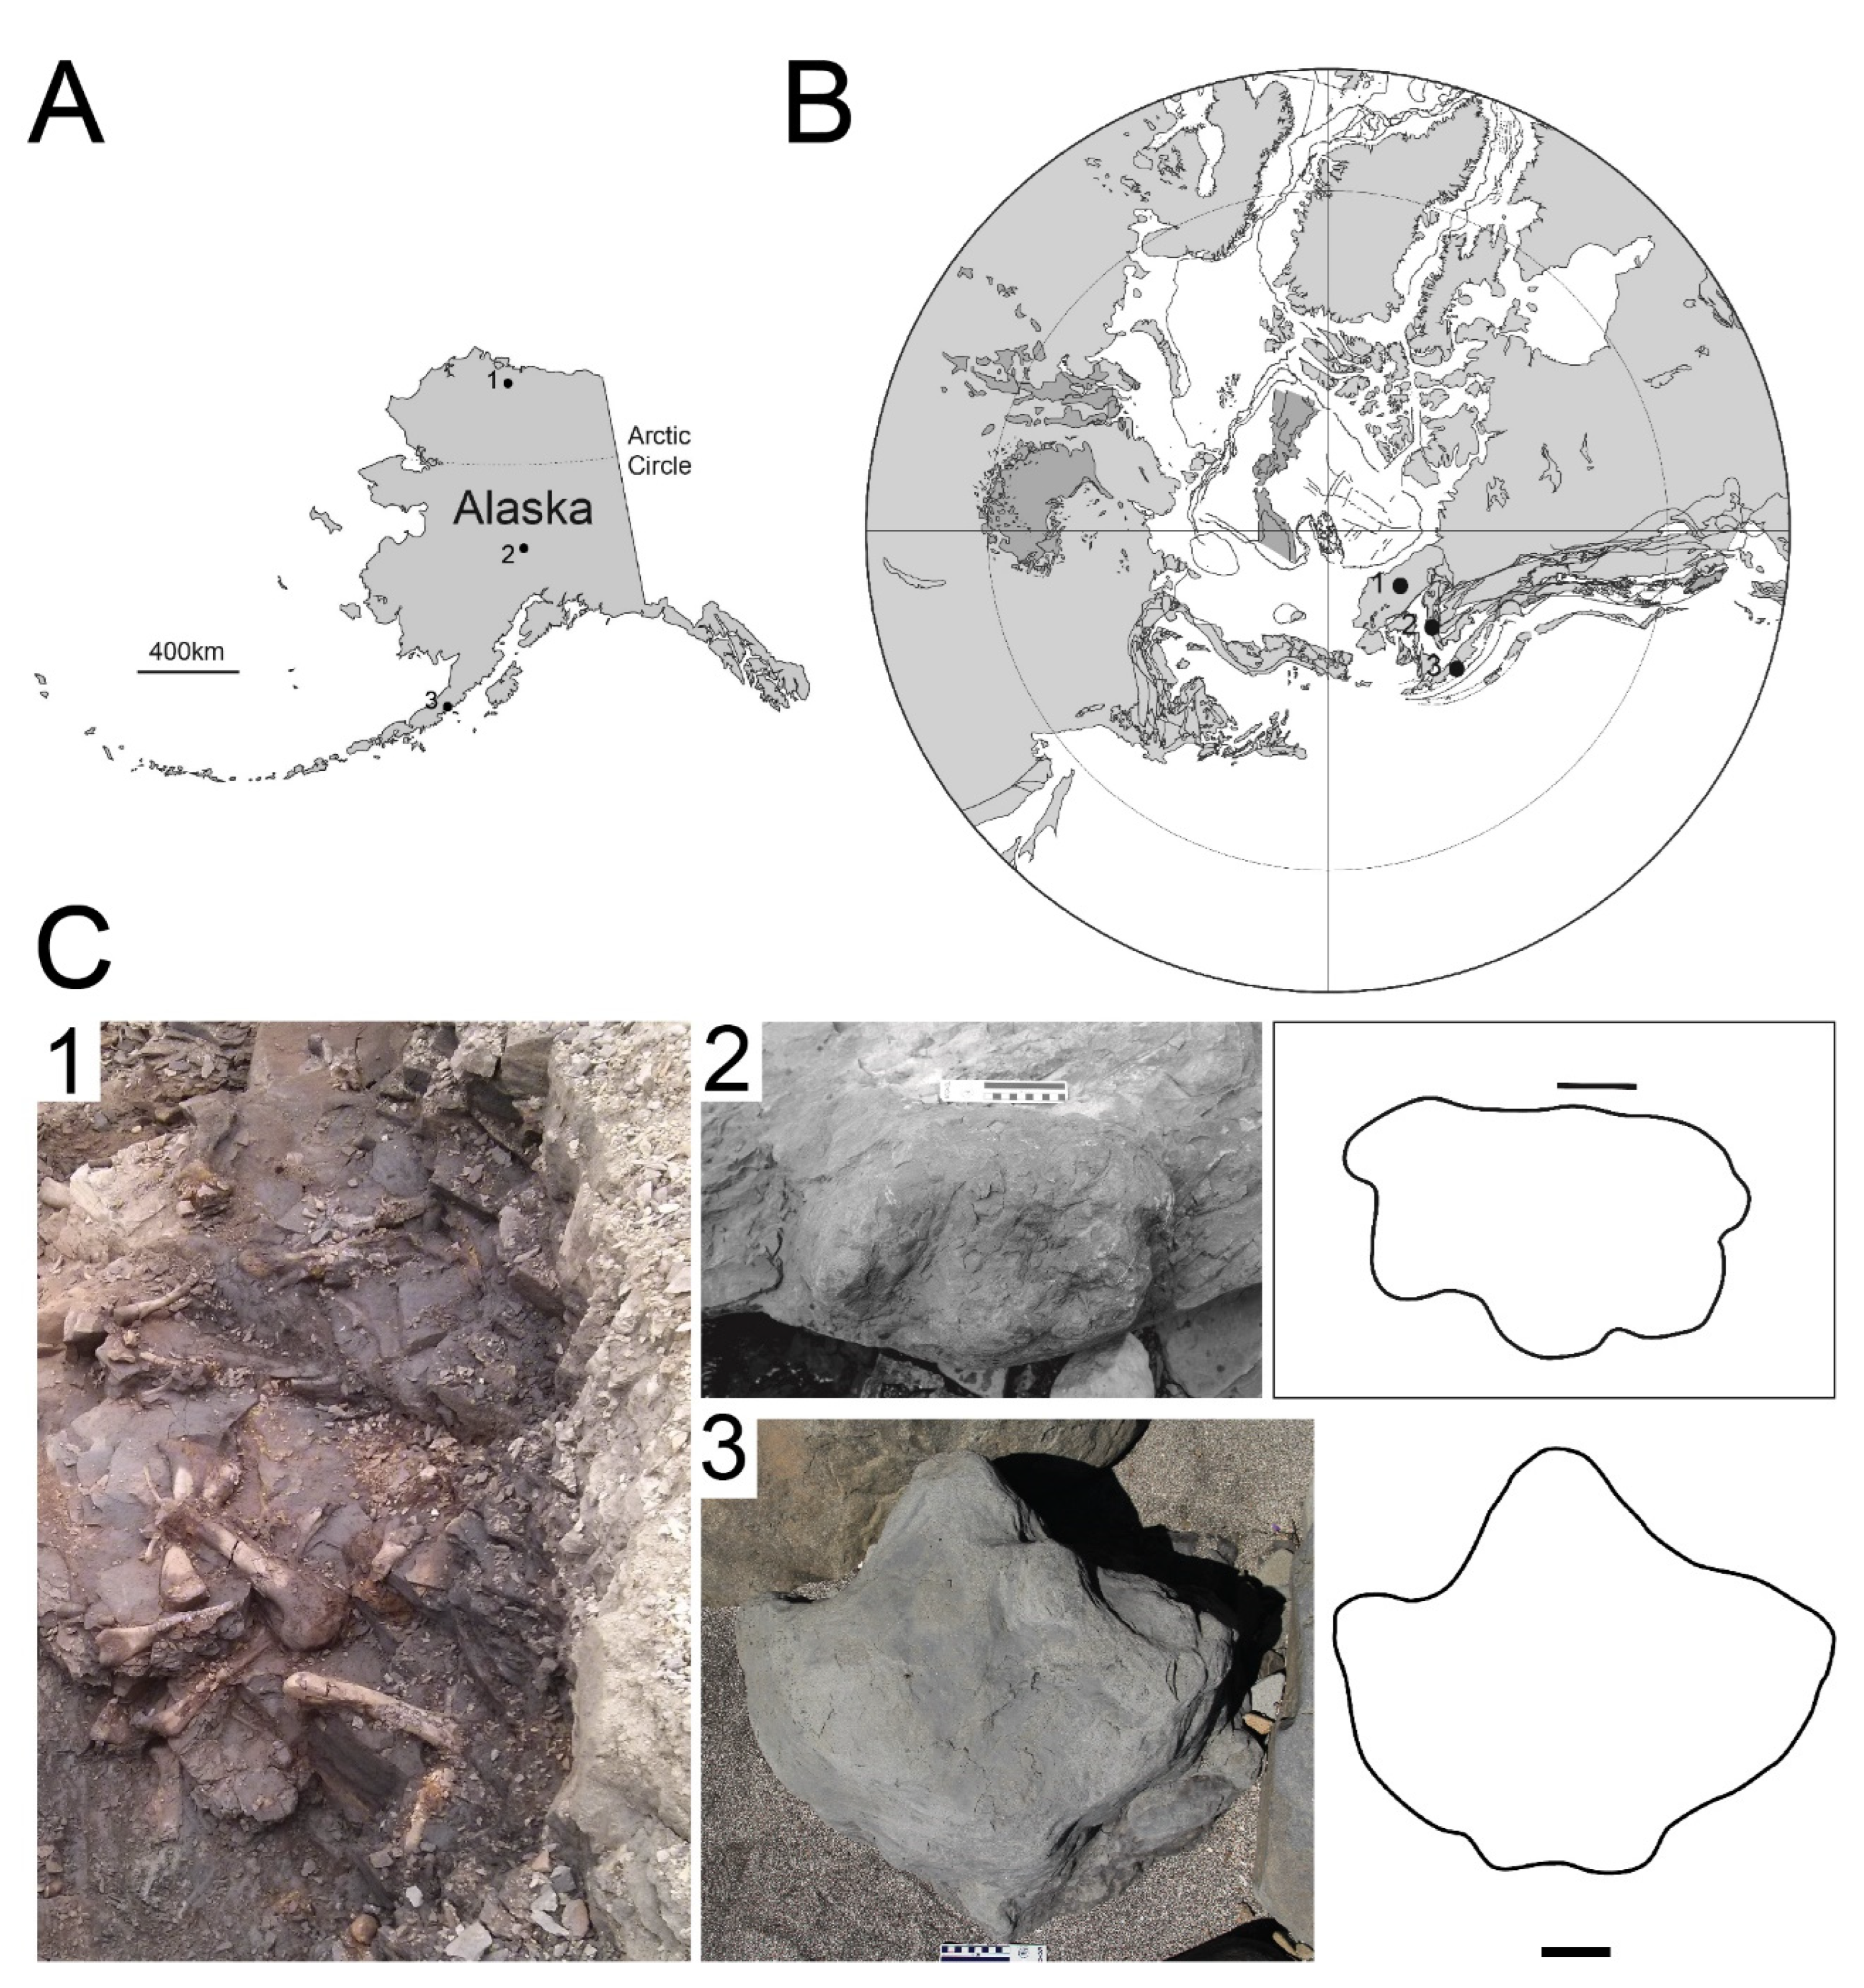
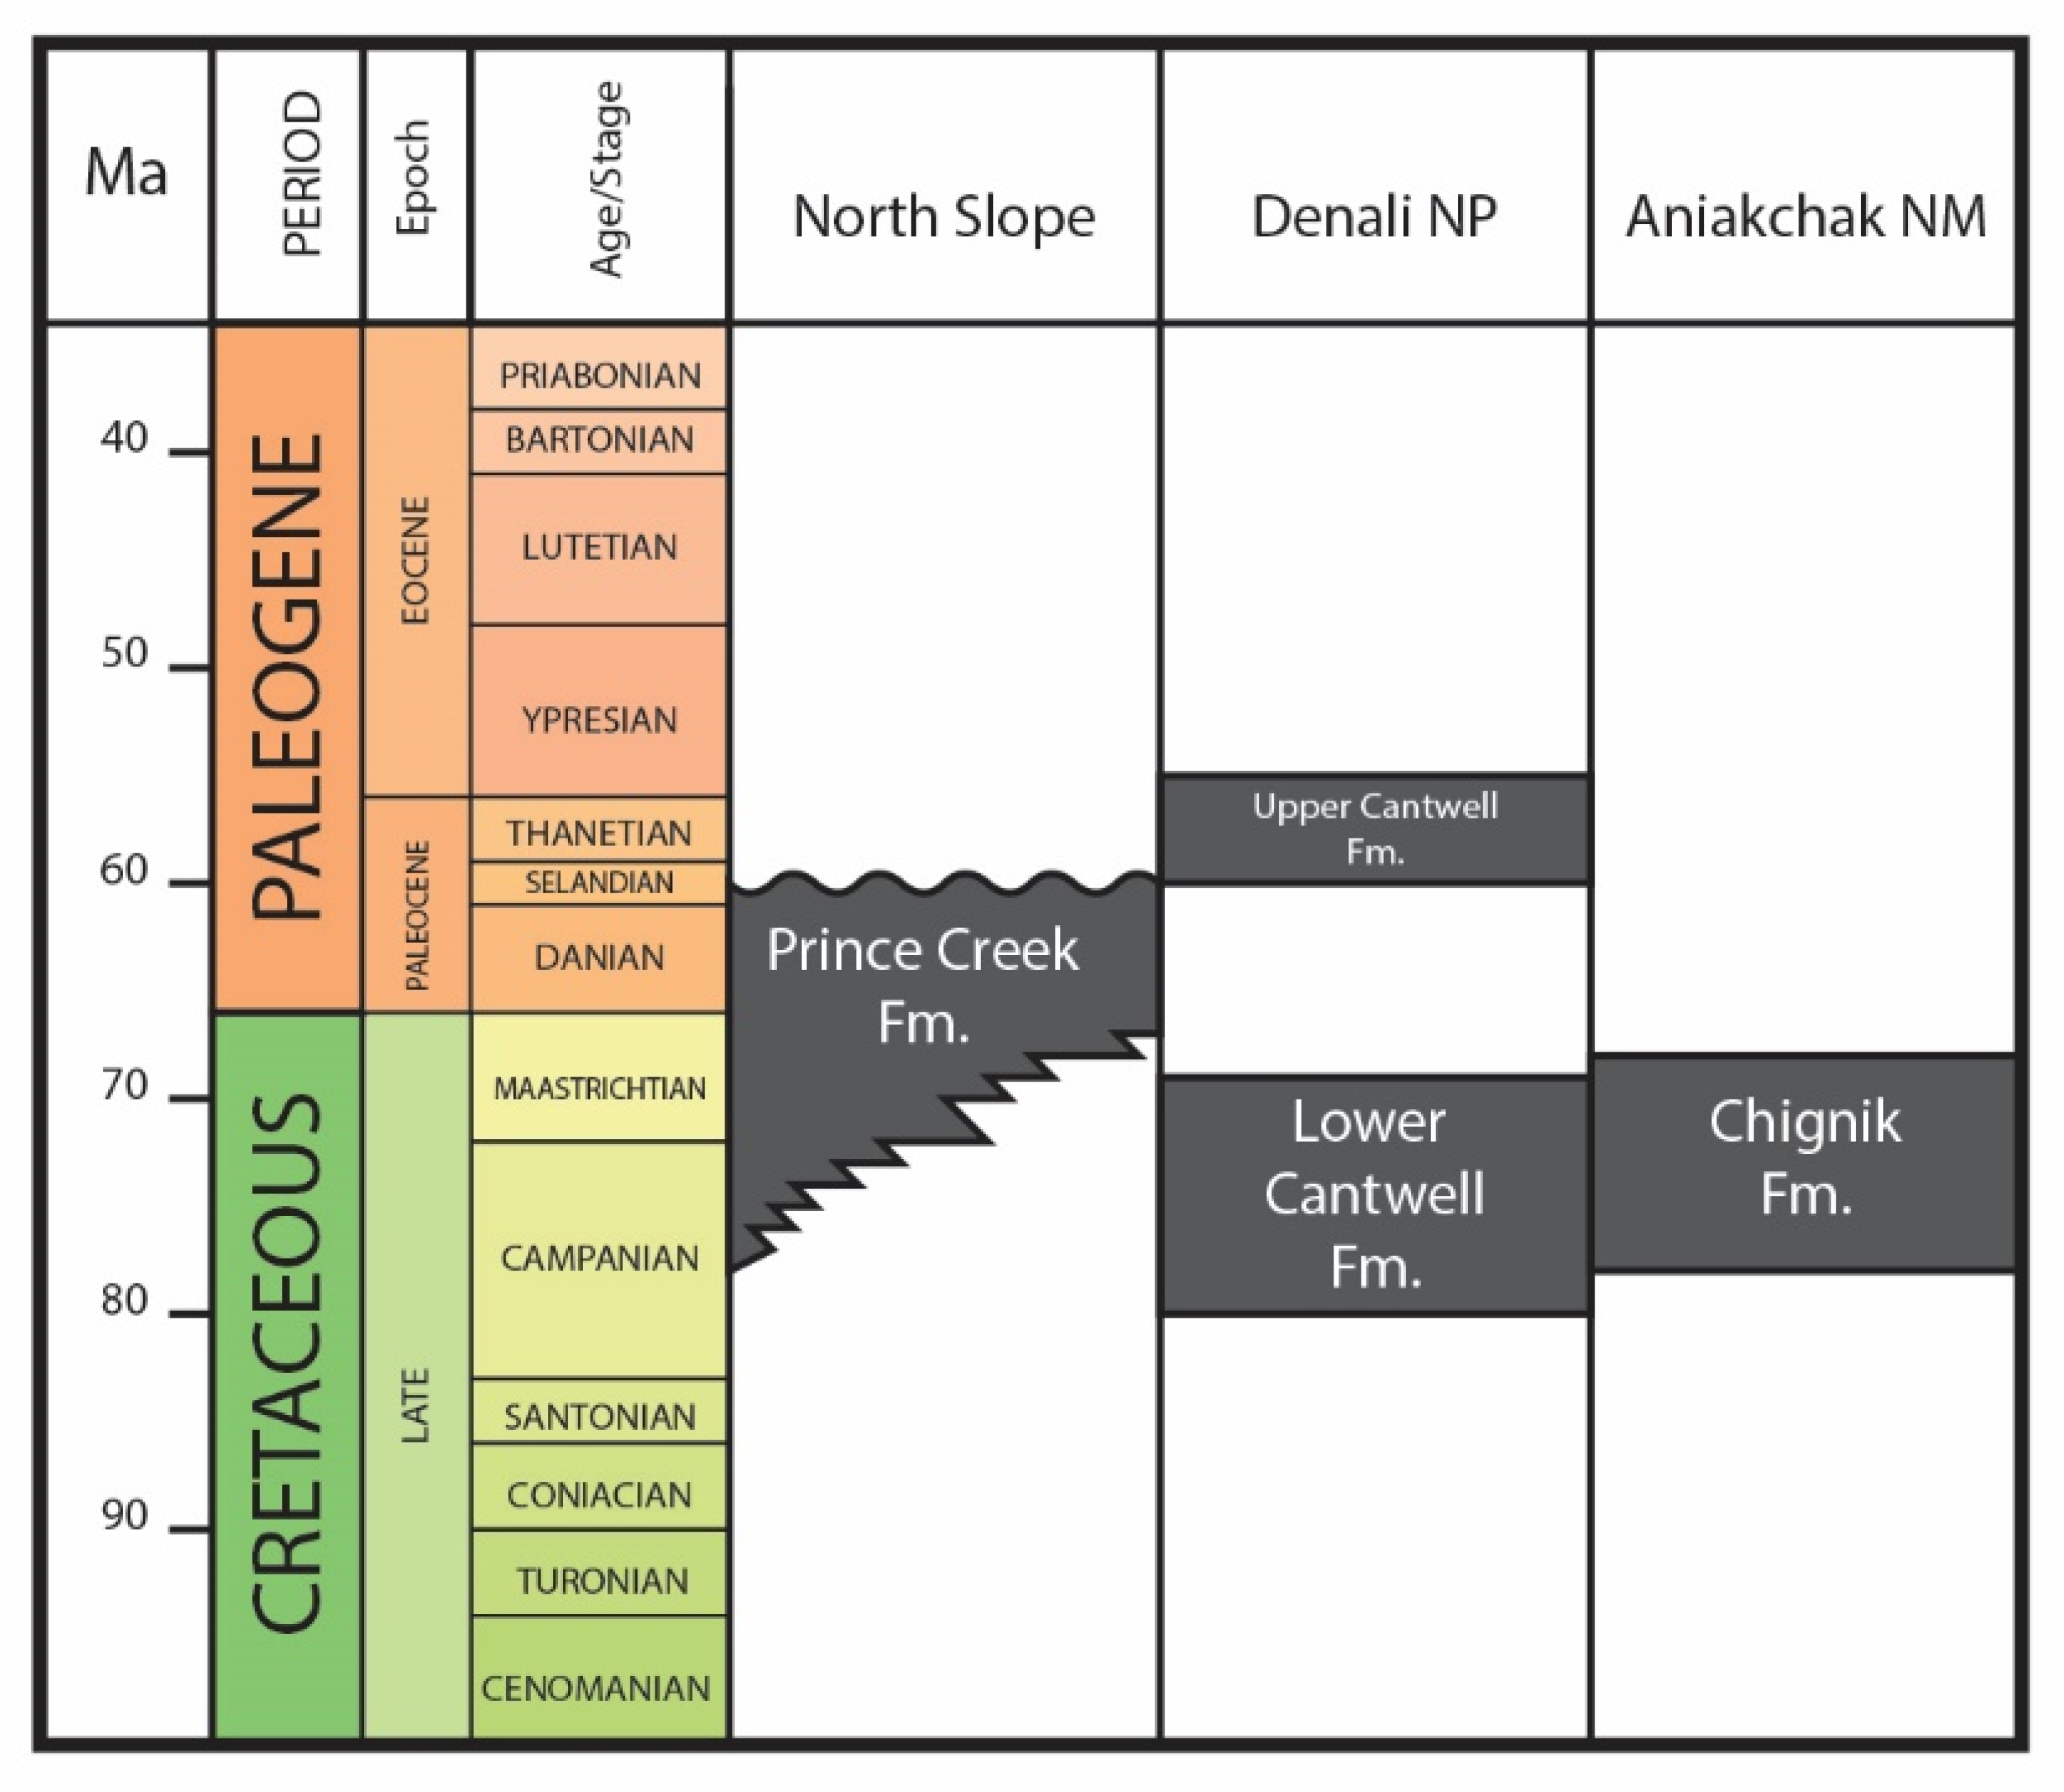
2. Late Cretaceous Paleolatitude and Geochronology Setting

Stereographic projections of tectonic terranes place the three study areas in this report at or near their current latitudes during deposition of these sedimentary sequences [19]. Specifically, tectonic reconstructions for this part of Alaska all result in a Late Cretaceous paleolatitude (57–85° N) above the Arctic Circle [19], while paleomagnetic reconstruction places the Cantwell Basin at 71° ± 10° N paleolatitude [20]. Paleomagnetic reconstructions based on Upper Cretaceous and Lower Tertiary volcanic rocks of this sequence of rocks suggest that sediments of the CF were deposited close to their present latitude of ~57° N [20].
The Prince Creek Formation (PCF) spans the Late Campanian to Paleogene [21], though most of the dinosaur-bearing section is Late Campanian to Early Maastrichtian [5,22,23,24]. Ridgway et al. [25] assigned a Late Campanian–Early Maastrichtian age to the lower Cantwell Formation (LCF: DENA) based on fossil pollen. Recent zircon U-Pb dates from bentonites within the LCF give ages of 71.5 ± 0.9 to 69.5 ± 0.7 Ma [26,27]. Marine invertebrates present in the Chignik Formation (CF: ANIA) suggest a Late Campanian to Early Maastrichtian age [28].
Admittedly, the three formations discussed in this paper (Figure 2) are not directly correlative, in the sense that one cannot typically trace a direct timeline (a single surface) from one unit to another, due to a paucity of radiometric dates. However, given the available biostratigraphic age constraints on the formations themselves, as well as our own limited geochronological data from the areas discussed here, logically all three formations must be partially correlative to some extent (Figure 2). Given the fact that all three formations are at least partially correlative, we feel that we can justify comparing time-averaged paleoclimate and paleontological data from all three study areas to construct a regional picture of the Late Cretaceous Arctic from Alaska.

3. Methods for Determination of Paleoprecipitation and Paleotemperature Estimates

There are multiple paleoprecipitation proxies that can be applied to the Cretaceous Alaskan record. Most notably, leaf physiognomy has provided invaluable estimates for the well-preserved leaf horizons of Alaska and Russia [8,11,12,13]. Here, however, we provide additional geochemical paleoprecipitation estimates by using geochemical proxies (specifically the relationship between Δleaf and MAP and chemical index of alteration and MAP; see Table 1). While these proxies may not provide the detailed mean annual and seasonal records (growing season precipitation, three wettest month values, three driest month values, etc.) that leaf physiognomy proxies may provide, they rely less on well-preserved whole- or almost-whole-leaf preservation, and so they can be sampled from more outcrops. It is also now fully appreciated that there are confounding factors in an uncritical application of leaf physiognomy [29,30,31,32,33,34,35,36,37], so we complement those data with additional geochemical analyses to attain a multi-proxy approach in our analysis.
For novel data presented in this study, (MAP) was calculated by using the relationship between Δleaf and MAP from Diefendorf et al. [38]:
Δ l e a f = 5.54   ( ± 0.22 ) log 10 ( MAP ) + 4.07   ( ± 0.70 )
Δ l e a f = δ 13 C a t m δ 13 C l e a f 1 + δ 13 C l e a f / 1000
New data for MAP come from the Chignik Formation. One wood sample was collected in 2016, and eight samples collected from additional horizons in 2018 were analyzed for their stable carbon isotope composition. The sample collected in 2016 was analyzed at the stable isotope lab at the University of Texas at San Antonio. The samples were decarbonated with 3M HCl to ensure no carbonate material was present. Samples were then dried and weighed into tin capsules and combusted on a Costech 4010 Elemental Analyzer, and the resulting CO2 was analyzed on a Thermofinnigan Delta + XP isotope ratio mass spectrometer (IRMS). Analyses were corrected to VPDB by using internal and international standards (USGS 24, ANU Sucrose (IAEA-C6), and IAEA 600). Reproducibility is monitored via the repeated analyses of Peach Leaves (NIST 1547) and Dogfish muscle (DORM) and is reported as ±0.2‰.
Samples from 2018 were decarbonated and analyzed at the Keck Paleoenvironmental and Environmental Stable Isotope Lab at the University of Kansas. These samples were combusted on a Costech 4010 Elemental Analyzer, and the resulting CO2 was analyzed on a Thermofinnigan MAT 253 IRMS. Samples were corrected to VPDB scale, using internal and international standards (Atropine, ANU Sucrose (IAEA-C6), and DORM). Reproducibility was monitored by repeated analyses of Dogfish muscle (DORM) and Costech Atropine and is reported as ±0.1‰. DORM was analyzed at both locations, and the values are within uncertainty (−17.23‰ for UTSA and −17.26 for KPESIL). The average values of all Chignik Formation samples were −25.8‰ vs. VPDB (1σ = 0.8‰). The maximum value was −24.0‰, and the minimum value was −26.7‰. Interestingly, the sample collected in 2016 and analyzed at UTSA is, on average, 2‰ more enriched than samples collected in 2018 and analyzed at KPESIL. This does not seem to be an analytical artifact, given the similarity in values of DORM during analyses. It could be the result of sampling a different horizon and may show the variability of MAP in the Chignik Formation.
Samples collected consisted of wood fragments. As a result, an offset of −1‰ was applied [39]. The carbon isotope value of atmosphere used for the CF was −6.6‰ to be consistent with PCF and LCF estimates by Salazar-Jaramillo et al. [27]. See Supplementary Table S1 for details on CF carbon isotope data, Δleaf values, and MAP estimates.
The values for the PCF and LCF are derived from the literature [27,40,41]. For the PCF, Salazar Jaramillo et al. [41] calculated the maximum MAP by using the relationship between Δleaf and MAP. To determine Δleaf, Salazar-Jaramillo et al. used δ13Catm values of 6.6‰ for the Late Cretaceous (~80 Ma) and −6.3‰ for the MME (Middle Maastrichtian Event) (~70–69 Ma). Isotopic analyses were conducted at the Alaska Stable Isotope Facility (ASIF), University of Alaska Fairbanks. Paleoprecipitation values were subsequently calculated by using the equation of Diefendorf et al. [38]. Salazar-Jaramillo et al. [27] located the MME in the lower Cantwell Formation (LCF), using chemostratigraphy, and calculated MAP for pre-MME, MME, and post-MME based on δ13C of organic matter and wood sampled at below and above the MME interval, using the methods outlined for the PCF. The means of these three intervals were averaged to obtain the values presented in Table 1.
Table 1. Comparative paleoclimate mean annual precipitation (mm/year) for the correlative PCF, LCF, and CF. Values derived from stable isotopes, with additional results provided by Salazar-Jaramillo et al. [41] as CIA-K from paleosols (K2O free Chemical Index of Alteration, and using the empirical relationship between weathering index and precipitation reported by Sheldon and Tabor [42]). Growing season precipitation (GSP), precipitation of the 3 warmest months (3WM), and precipitation of the 3 driest months (3DM) are based on CLAMP data, using leaf physiognomy [40].
MAPGSP3WM3DM
Prince Creek Formation (PCF)
δ13C1250 [41]
Bulk geochemistry1318 ± 181 [41]---
Lower Cantwell Formation (LCF)-229 ± 670° [4]177 ± 282141 ± 186
Lower Cantwell Formation (LCF)661 [27]
Chignik Formation (CF)1090
Salazar Jaramillo et al. [41] also presented estimates of MAP based on geochemical weathering indices of fossil soils. Abundances (in wt%) of major oxides were measured from bulk samples, using a PANalytical Axios wavelength-dispersive X-ray fluorescence spectrometer at the Advanced Instrumentation Laboratory (AIL), University of Alaska Fairbanks. MAP was calculated by using the relationship between MAP and CIA-K in modern soils outlined in Sheldon and Tabor [42]. Raw data and complete methodological details for precipitation estimates of Salazar Jaramillo et al. can be found in the literature [27,41]. Average values for paleoprecipitation (bulk geochemisty values presented in Salazar-Jaramillo et al. and mean stable isotopic values calculated here) are presented in Table 1.
Paleotemperature estimates are presented in Table 2. All paleotemperature estimates are derived from the literature [8,11,26,40,43,44] and are based on detailed measurements from plant megafossil leaf physiognomy with statistical comparison to reference datasets of modern vegetation. Interested readers are referred to the original papers and the CLAMP (Climate Leaf Analysis Multivariate Program) website [45] for a detailed explanation of the methodology.

4. Prince Creek Formation (PCF)

The PCF crops are out along the Colville River, Alaska. The sedimentary facies, alluvial architecture, and paleosols have been studied in detail [5,6,23]. Large tidally influenced sinuous trunk channels (13–17 m thick) fed this delta plain distributary network, while smaller sandbodies (2–6 m thick) represent small sinuous distributary channels and point bars, and anastomosed channels. Floodplain facies include crevasse splays and levees, small floodplain lakes and ponds, swamps, and paleosols [5,6,23].
During the Late Campanian through the Maastrichtian, polar forests were dominated by a single deciduous conifer, Parataxodium wigginsii. Woody angiosperms were very rare. Ginkgophytes or cycadophytes were present, so that Parataxodium formed a semi-open canopy over a groundcover of ferns and Equisetites [8]. In the PCF, dinosaur skeletal remains are found in numerous bonebeds [5] (Table 3).
Though plant diversity was low in the Early Maastrichtian of Northern Alaska [8], a combination of floristic analysis and CLAMP data [36] from both lower latitudes and earlier times allowed Spicer and Herman [11] to estimate a MAT of ~6.7 °C at 80° N for the Maastrichtian (Table 2). Salazar-Jaramillo et al. [41] calculated a MAP from δ13C of organic matter from paleosol Bt horizons from one measured section and obtained an average MAP value of 1250 mm year−1. They also calculated a MAP value of ~1318 mm year−1 using geochemical climofunctions from paleosols (Table 1).

5. Lower Cantwell Formation (LCF)

The LCF of the Central Alaska Range is a heterogeneous non-marine to marginal marine succession composed of conglomerate, sandstone, siltstone, shale, coaly shale, minor coal, and weakly developed paleosols [25,26]. Lithologies consist generally of upward-fining conglomerate and pebbly sandstone, cross-bedded and massive sandstone, interbedded sandstone and siltstone, organic-rich siltstone and shale, and thin bentonites bounded by thin coals [26]. The LCF consists primarily of axial braided rivers, alluvial fans, floodplains, ponds, and small lakes; paleosols exist, but they are uniformly poorly developed [25,26].
Predominantly sharp-based matrix-supported conglomerates are laterally discontinuous and encased within fine-grained overbank deposits. Medium- and fine-grained sandstones are present in both fining- and coarsening-upward cycles. Burrowed mud drapes and desiccation cracks are locally present at the tops of sandstones [26]. Large conglomerate and pebbly sandstone bodies are interpreted as major channels in a distal alluvial fan setting. The flow was flashy, and the deposition was rapid, due to high sediment influx. Tabular fining-upward sandstones are interpreted as shallow distributary channels that record a recurrent pattern of frequent avulsion and unconfined flow.
Overbank deposits are represented by thin, fine-to-very-fine-grained sandstones interbedded with siltstones, mudstones, and organic-rich shales [26]. More heavily burrowed and rooted thin sandstones and siltstones interbedded with mudstones probably represent thin crevasse splay sands deposited further from active distributary channels. Laterally continuous, tabular massive and trough cross-bedded sandstones are interpreted as sheet flood deposits [26]. Coaly shales and laminated shales represent backswamp deposits and small ponds or lakes in distal alluvial fan and floodplain settings [26]. Rooted sandstones and mudstones represent weakly developed paleosols, suggesting high rates of aggradation on unstable landscapes [26].
Twenty-three plant morphotypes have been recognized [40]. Angiosperms in the LCF are represented by a relatively diverse assemblage of woody dicotyledonous leaf forms, rare seeds, and several monocot leaf forms. According to Herman et al. [8], this assemblage places the northern limit of woody deciduous angiosperm forests as far north as 80° N. In contrast to the PCF, angiosperms are relatively common in the LCF.
The LCF records a remarkable fossil record of thousands of tracks. The vertebrate ichnofauna includes fishes, pterosaurs, theropods (including birds), hadrosaurids, and ceratopsids [7,10]. These are most commonly represented as single tracks or small groups of tracks (N < 5), due to the near-vertical nature of the exposures in many parts of the park. Tracks attributable to the ichnogenus Hadrosauropodus, a presumed hadrosaurid dinosaur, are the most commonly encountered vertebrate footprint within the LCF [7].
A CLAMP analysis of fossil leaves collected in DENA yielded higher MAT and winter CMMT, but a similar summer WMMT, than the modern one [29] (Table 2). Fossil crayfish burrows also indicate paleoclimate conditions that were no colder than modern-day Southern Ontario, Canada [46]. Salazar-Jaramillo et al. [41] calculated a MAP of 661 mm yr−1 (Table 1) from stable δ13C isotopes from bulk organic matter and wood.

6. Chignik Formation (CF)

A 300 m section in the CF indicates primarily non-marine alluvial-coastal plain deposits that are dominated by meandering fluvial channels, with abundant crevasse splays, small lakes, and ponds, and a few thin peat swamps [47]. There is also evidence for tidal influence in distal deposits, as well as marginal marine and shallow marine deposits. In some cases, standing tree trunks are presently rooted in ancient soils [47]. A thick fluvial channel immediately overlying shallow marine deposits contains evidence of brackish water conditions (Teredolites-bored coalified wood, jarosite, and bioturbation). A thick tidal flat succession overlies this, followed by fluvial channel and overbank deposits. Tidal flats and overbank deposits show abundant dinoturbation. The section represents a transgressive–regressive succession that is consistent with a tide-dominated estuary fill [47]. The overview of the flora from the CF by Hollick [48] remains the most recent comprehensive work available; there is a strong likelihood of the need for taxonomic revision and updating, so further discussion of floral diversity is not warranted at this time. Fossil leaves are abundant in multiple horizons within the CF, and carbonized fossil wood is found throughout. We have found at least 12 distinct leaf forms, including cf. Metasequoia, Quereuxia, Nilssonia, a selaginellid moss, Equisetites, and eight different angiosperms.
The vertebrate fossil record of the CF within ANIA consists of a rich assemblage of tracks [38]. Most notable is that 93% of the track sites can be attributed to the ichnogenus Hadrosauropodus, a footprint attributed to a hadrosaurid. Hadrosauropodus tracks found in the CF range in size from those made by full-grown adults to juveniles.
Upchurch et al. [44] provided a MAT of ~13 °C from the CF based on a leaf margin analysis. Wood fragments from the CF were measured for their carbon isotopic composition, and δ13C was used to calculate an average MAP value of 1090 mm year−1 (Table 1).

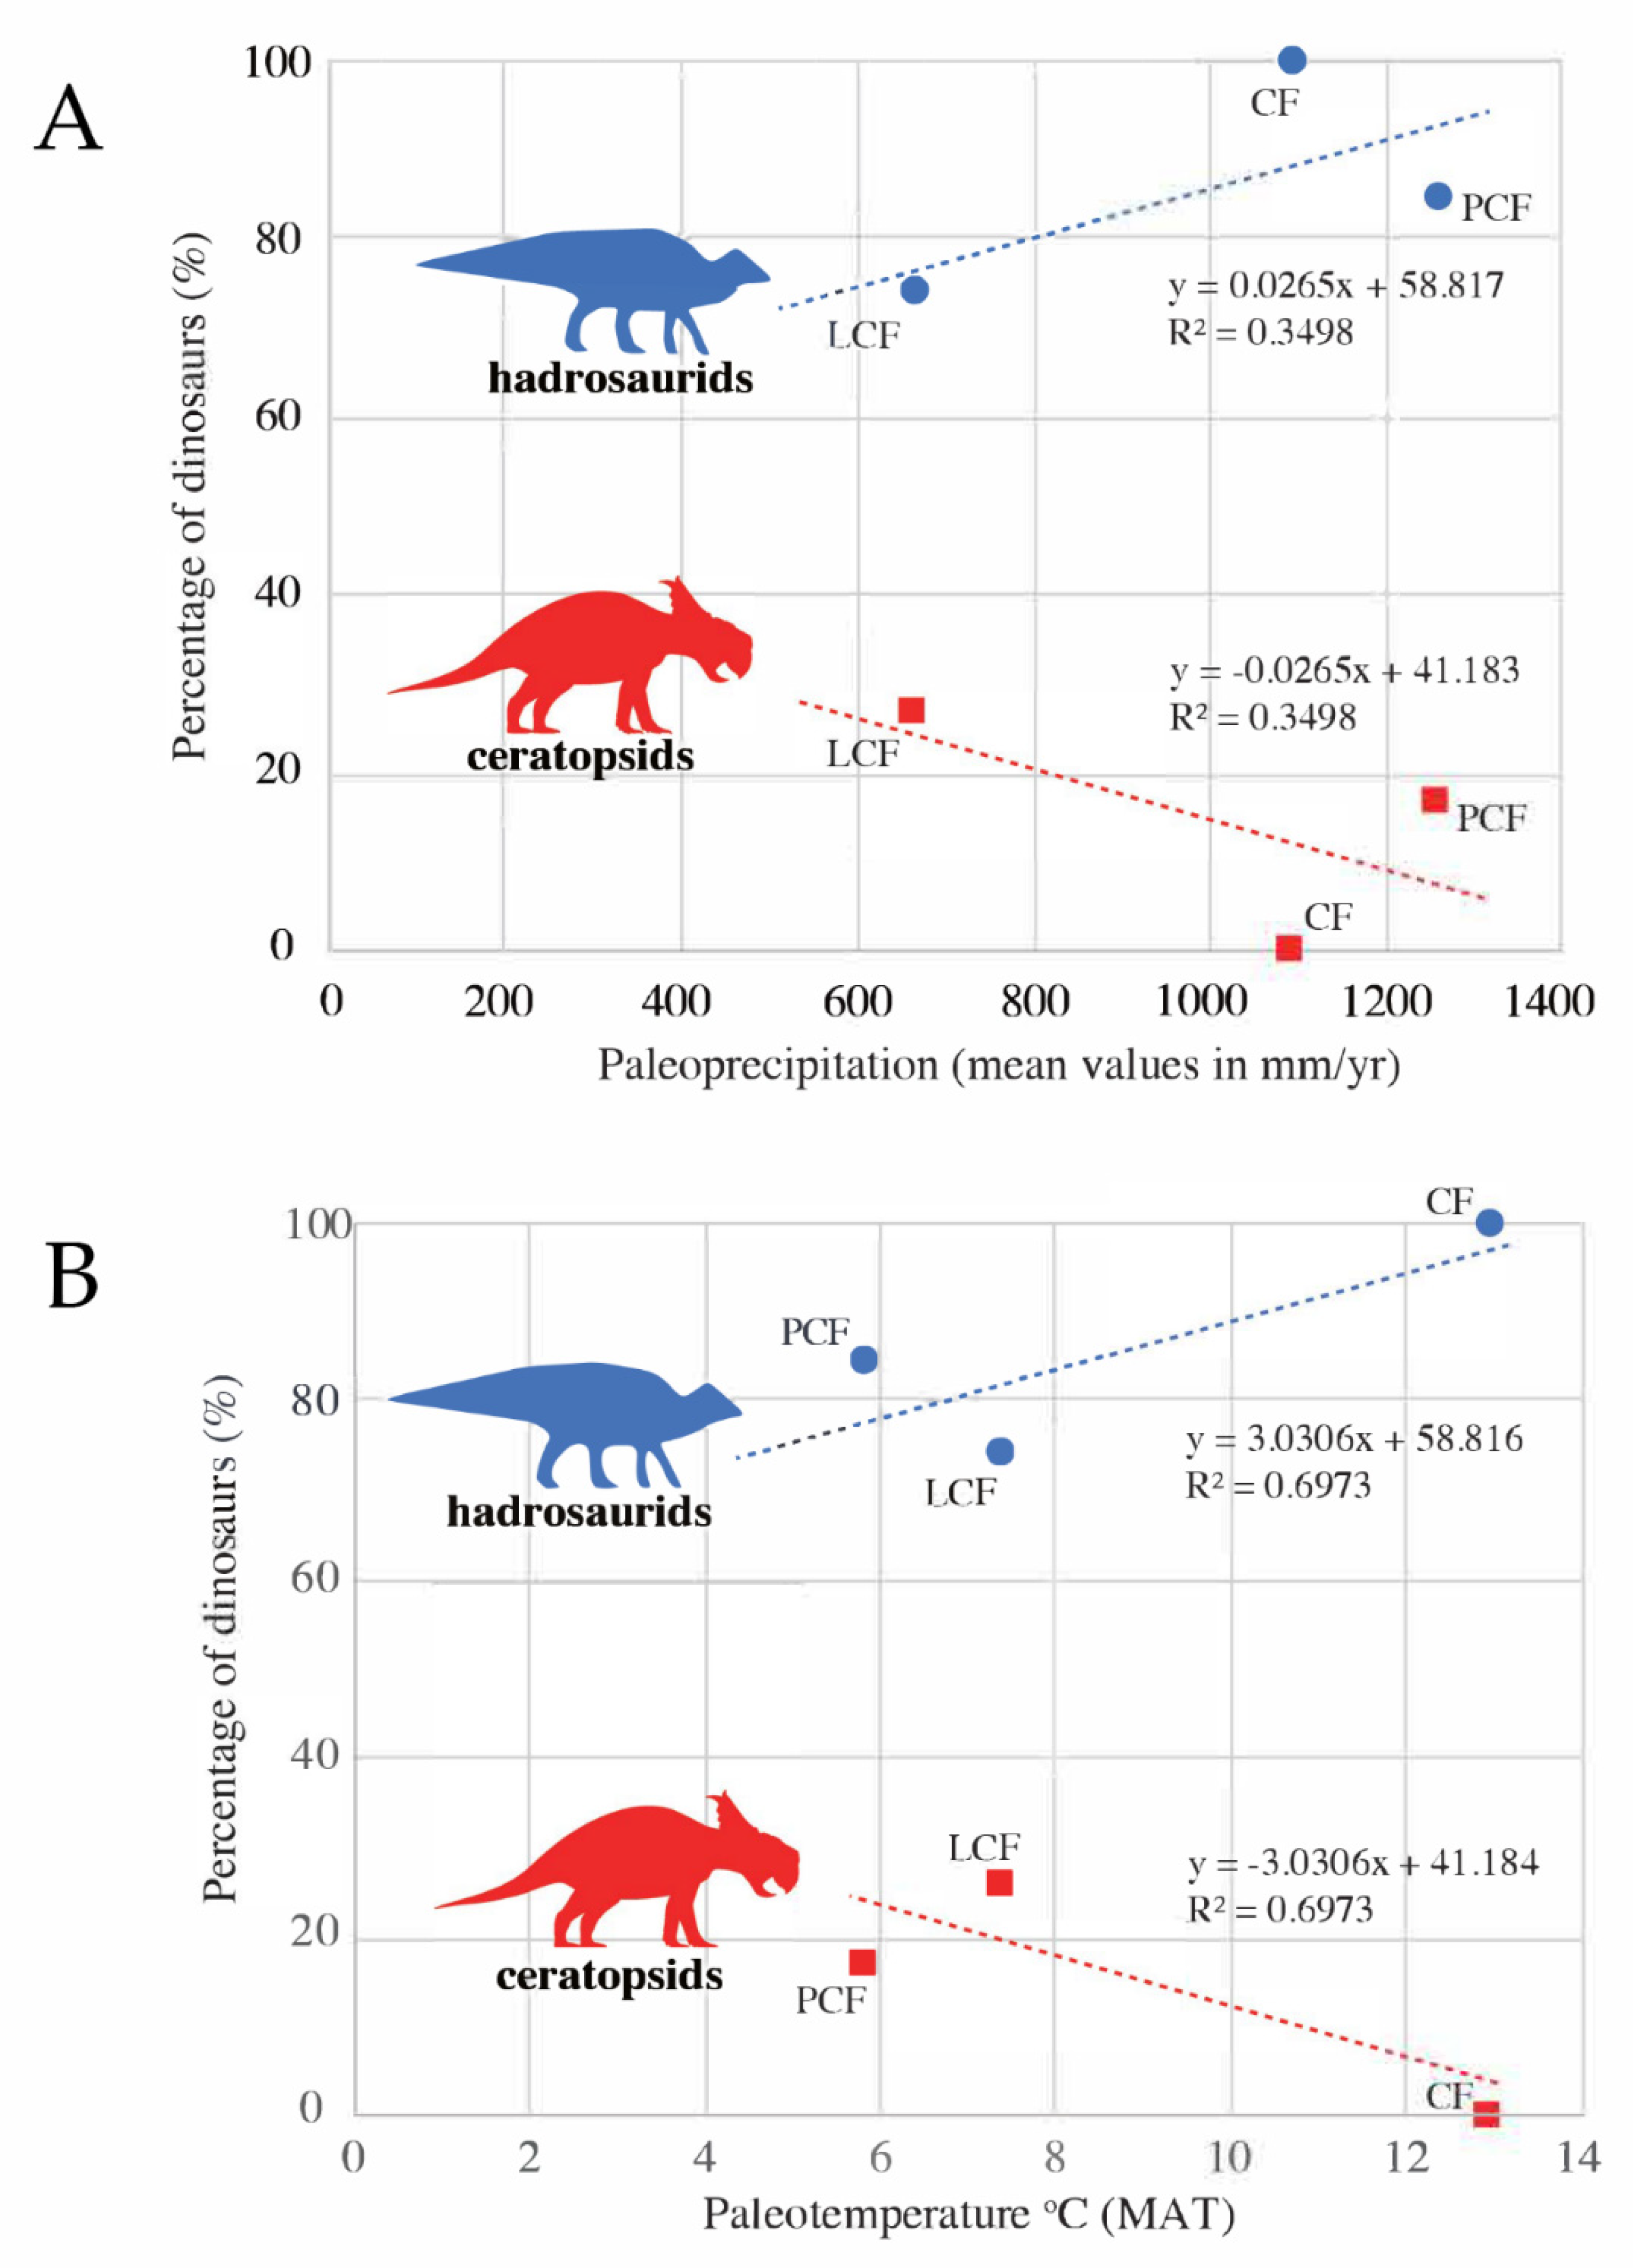
7. Estimating Frequency of Large-Bodied Herbivorous Dinosaurs

The two datasets available here for estimating the frequency of large-bodied herbivorous dinosaurs are dinosaur tracks and dinosaur skeletal material. Detailed dinosaur-track studies have long shown value in improving the understanding of the paleobiology of these animals (see References [49,50], for example). More specifically, tracks can inform us about biodiversity, as well as provide a means for determining relative abundances of the track makers. Similarly, it is recognized that taphonomic analyses of fossil bonebeds provide details on biodiversity and community structure (see Reference [51] for a summary). While both types of data provide insight into the past, the latter dataset can provide species-level taxonomic resolution, while ichnotaxonomy has its limitations on taxonomic resolution. For the purposes of comparisons across datasets, we take a conservative approach and only compare data at the broader family taxonomic level.
With respect to footprints, hadrosaurid footprints found on a single large bedding plane in the LCF of DENA have been used to infer herd demographics, specifically age structure and abundance [7]. We take the distribution of track occurrences through the LCF as a measure of the relative abundances of large-bodied herbivorous dinosaurs, specifically hadrosaurids and ceratopsids. Members of these two groups of dinosaurs in the Late Campanian–Early Maastrichtian typically had body masses of more than 1000 kg. Given their sizes and abundance, it is reasonable to assume that they were intimately linked to their respective ecosystems, much the way elephants are linked to their environment. The inferred relative frequency of these two groups of dinosaurs within the LCF paleoecosystem was determined by the relative abundances of track-site occurrences, rather than individual numbers of tracks. For example, the thousands of tracks found on a single bedding plane in the LCF that can be attributed to hadrosaurids [7] constituted one data point for hadrosaurid frequency in this study. The frequency of hadrosaurids from the CF was taken directly from Fiorillo et al. [47].
Each bonebed in the PCF is dominated by the remains of either hadrosaurids or ceratopsids [4,5,6,16]. We take the frequency of the taxon dominating each bonebed as a measure of the relative abundance of that group within the ecosystem recorded within the PCF. Table 3 compares the relative frequency of the two large-bodied herbivorous dinosaur groups between these two areas. Corroborating this relative abundance, published references to specimen totals [16] combined with cataloged specimens at the Perot Museum of Nature and Science, Dallas, indicate the number of identifiable specimens (NISPs) from these bonebeds that can be attributed to hadrosaurids and ceratopsids is 8337 and 907, respectively. The NISP shows that hadrosaurid remains constitute 90% of the megafauna from these PCF bonebeds, and this is very close to the 83% derived from the bonebed analysis shown in Table 1.

8. Discussion and Conclusions

In his review of studies of modern large herbivore populations ranging from northern high latitudes to the tropics and subtropics, Owen-Smith [52] noted that variations in precipitation have a greater influence than temperature variations on the populations of large herbivores. The role of precipitation likely was expressed by its influence on food production and seasonal availability [52]. Furthermore, food production and seasonal availability of food rely both on the diversity of food types, which are more diverse further south, and the amount of time that the vegetation is available (i.e., length of growing season), which also increases to the south. Therefore, more diverse food was available further south than in the north. Similarly, it has been suggested that ecosystem productivity and faunal richness are positively linked to water availability within some fossil terrestrial ecosystems [53], further emphasizing the primary role that water plays in faunal composition.
Table 1 and Table 3 show that precipitation and temperature were not uniformly distributed in the Alaskan Late Cretaceous. The calculated MAP was higher in the PCF and CF than in the LCF. The trend in MAT values shows a predictable slight-to-moderate increase moving in a southerly direction.
Figure 3A shows the relative frequencies of these two dinosaurian megaherbivores within the PCF, LCF, and CF plotted against the corresponding MAP values for these three rock units. Similarly, Figure 3B shows the relative frequencies of hadrosaurs and ceratopsians plotted against the MAT values for the PCF, LCF, and CF. Neither temperature nor precipitation alone appears to be the dominant factor in the relative abundance of ceratopsians or hadrosaurs. The warmest conditions seem to favor hadrosaurs. Meanwhile, the driest conditions seem to favor ceratopsids. Neither factor is perfectly correlated with relative abundance of herbivores. Although hadrosaurids were the dominant vertebrate taxa in all three formations, ceratopsids had a higher relative frequency in the drier LCF (Table 2 and Figure 3A). Meanwhile, the relationship of megaherbivore relative frequency to MAT is more ambiguous, as the megaherbivore relative frequency does not follow the increase in temperature; specifically, the warmest and coldest MAT values also correspond to the highest relative frequencies of hadrosaurs, and the intermediate MAT value has the lowest relative frequency of hadrosaurs (Figure 3B). Ceratopsians, on the other hand, have the highest relative abundance with the intermediate MAT value. Interestingly, the PCF, with a higher relative abundance of hadrosaurs, has a slightly cooler WMMT and a slightly warmer CMMT than the LCF, containing a lower relative abundance of hadrosaurs. The opposite is true for the relative abundance of ceratopsids, with their abundance being higher in the LCF (warmer WMMT and cooler CMMT) and lower in the PCF (cooler WMMT and warmer CMMT). Because CLAMP data do not exist for the CF, we cannot extend this analysis to the CF. However, it does suggest the intriguing possibility that hadrosaurs preferred the more equable temperatures present in coastal environments.
Neither precipitation nor temperature is perfectly correlated with the relative abundances of each respective herbivore group. Two previous studies related to habitat preferences do allow for further speculation here on which climatic factor may have had a stronger influence. Among the many Arctic dinosaur teeth from the PCF examined by Suarez et al. [54] in their study of oxygen isotope composition were teeth attributed to hadrosaurs and ceratopsians, specifically Edmontosaurus and Pachyrhinosaurus, respectively. Based on the oxygen isotope signal, they suggested that the ceratopsians foraged for food on the coastal floodplains away from riparian areas, while the hadrosaurs may have foraged for food within the riparian areas. These results suggest then that, within a given landscape, the ceratopsians preferred the drier, better-drained regions, while the hadrosaurs preferred the wetter regions of the landscape. Similar to the conclusions of the work by Suarez et al. [54], in a taphonomic study of the occurrences of bonebeds in the PCF, Fiorillo et al. [55] showed that the bonebeds dominated by hadrosaurs (i.e., Edmontosaurus) occurred in the more distal areas of the depositional system, areas which represent lower delta plain facies nearer to the coast. In contrast, the ceratopsians (i.e., Pachyrhinosaurus) preferred a habitat that was the more proximal, slightly elevated, and drier upper coastal plain. These studies allow speculation that, though the data presented have limitations, there is likely a stronger relationship between herbivorous dinosaur relative abundances and MAP than with MAT; however, seasonal variations between summer and winter temperature ranges may also play a role, as suggested above.
Both the PCF and CF were deposited in coastal areas, whereas the LCF was deposited in the interior and on the leeward side of an active tectonic margin, which may have resulted in a rain shadow effect [25], possibly accounting for the lower MAP in the latter formation. We cannot rule out that the annual sunlight seasonality, specifically the profound seasonal changes in light intensity and duration due to the amount of solar insolation resulting from the low angle of the sunlight striking the Earth at high latitudes, might also contribute to this phenomenon. The light regime is also strongly dependent on the paleolatitude of the habitat (particularly in near-polar areas). While this presumably had some form of a latitudinal gradient effect on vegetation in terms of the length of growing season and overall ground temperature, and therefore affected plant diversity, some modern plants across clades, such as the Tracheophyte Equisetum, the conifer Pinus, and the angiosperm Populus, have latitudinal ranges that extend beyond the range of our transect, so the light regime phenomenon may have played a secondary role rather than a primary one.
The availability of light is linked to plant productivity and, hence, to the seasonal availability of fresh food for plant-eating dinosaurs. Relatedly, the differences in precipitation likely impacted the taxonomic composition of the floral assemblages (i.e., diversity) within each study area, as well as vegetative productivity. While taxonomic diversity within fossil plant communities might be accessible, estimating vegetative productivity is beyond the scope of this work. It is sufficient, however, to recognize that these potential vegetative differences may have also had a role in the relative frequencies of hadrosaur and ceratopsian populations, as it is generally accepted that, based on preliminary microwear studies on the teeth of these two herbivore groups, the latter group ate tougher food stuffs than the former in these northern populations [7,56]. However, the role of specific vegetation type may have been minimal given the broad latitudinal rage of the dinosaur genera Edmontosaurus [57] and Pachyrhinosaurus [58,59]. Such a broad geographic range for these genera suggests that these dinosaurs were not tied to specific plant types. Regardless, these formations provide ample evidence for a flourishing high-latitude ecosystem during the Late Cretaceous greenhouse, an ecosystem where the local paleoclimate was a primary driver in structuring the relative abundances of large-bodied herbivores in local environments. Our analysis suggests that MAP played a more direct role in determining the distribution of dinosaurs than did MAT, although seasonal temperature ranges between summer and winter may have also played a secondary role.

Supplementary Materials

The following supporting information can be downloaded at https://0-www-mdpi-com.brum.beds.ac.uk/article/10.3390/geosciences12040161/s1. Table S1: Mean annual precipitation (MAP) derived from carbon isotope values of plants material.

Author Contributions

A.R.F., P.J.M. and Y.K. designed and conceived the research, and collected field samples and additional data. M.B.S. analyzed the geochemical samples from the Chignik Formation. All authors contributed to interpretation, discussion, and writing of the results. All authors have read and agreed to the published version of the manuscript.

Funding

National Science Foundation Office of Polar Programs grants OPP-424594 to ARF and OPP-425636 to PJM, and National Geographic Society grant W221-12 to ARF for work on the North Slope of Alaska. The US National Park Service provided funding for work in Denali National Park and Aniakchak National Monument to ARF. Friends of ISEM Paleo provided additional funding for work in Aniakchak National Monument to ARF.

Acknowledgments

We thank the numerous colleagues who helped in the field. We also thank the National Park Service Anchorage Region, particularly Linda Stromquist, and Troy Hamon of the National Park Service, Katmai National Park & Preserve Office, for logistical and funding support. We acknowledge Bruce Barnett at KPESIL for assistance in C-isotope analysis. We thank Robert Spicer, Alexei Herman, Judith Parrish, and Louis Jacobs for constructive comments on earlier versions of this manuscript. Lastly, we thank Lawrence Lawver and Marcy Davis, and the PLATES Project, University of Texas Institute of Geophysics, for the tectonic base map used in Figure 1.

Conflicts of Interest

The authors declare no conflict of interest.

References

  1. Thoman, R.L.; Richter-Menge, J.; Druckenmiller, M.L. Arctic Report Card 2020; NOAA: Washington, DC, USA, 2020. [Google Scholar] [CrossRef]
  2. Druckenmiller, M.L.; Moon, T.; Thoman, R. State of the Climate in 2020. Bull. Am. Meteor. Soc. 2021, 102, S263–S315. [Google Scholar] [CrossRef]
  3. Godefroit, P.; Golovneva, L.; Shczepetov, S.; Garcia, G.; Alekseev, P. The last polar dinosaurs and the Cretaceous-Tertiary mass extinction event. Naturwissenschaften 2009, 96, 495–501. [Google Scholar] [CrossRef] [PubMed]
  4. Gangloff, R.A.; Fiorillo, A.R. Taphonomy and paleoecology of a bonebed from the Prince Creek Formation, North Slope, Alaska. PALAIOS 2010, 25, 299–317. [Google Scholar] [CrossRef]
  5. Fiorillo, A.R.; McCarthy, P.J.; Flaig, P.P.; Brandlen, E.; Norton, D.W.; Zippi, P.; Jacobs, L.; Gangloff, R.A. New Perspectives on Horned Dinosaurs; Ryan, M.J., Chinnery-Allgeier, B.J., Eberth, D.A., Eds.; Indiana University Press: Bloomington, IN, USA, 2010; pp. 456–477. [Google Scholar]
  6. Fiorillo, A.R.; McCarthy, P.J.; Flaig, P.P. Taphonomic and sedimentologic interpretations of the dinosaur-bearing Upper Cretaceous Prince Creek Formation, Alaska: Insights from an ancient high-latitude terrestrial ecosystem. Palaeogeogr. Palaeoclimatol. Palaeoecol. 2010, 295, 376–388. [Google Scholar] [CrossRef]
  7. Fiorillo, A.R.; Hasiotis, S.T.; Kobayashi, Y. Herd structure in Late Cretaceous polardinosaurs: A remarkable new dinosaur tracksite, Denali National Park, Alaska, USA. Geology 2014, 42, 719–722. [Google Scholar] [CrossRef] [Green Version]
  8. Herman, A.B.; Spicer, R.A.; Spicer, T.E.V. Environmental constraints on terrestrial vertebrate behaviour and reproduction in the high Arctic of the Late Cretaceous. Palaeogeogr. Palaeoclimatol. Palaeoecol. 2016, 441, 317–338. [Google Scholar] [CrossRef] [Green Version]
  9. Shczepetov, S.V.; Herman, A.B. The formation conditions of the burial site of Late Cretaceous dinosaurs and plants in the Kakanaut River Basin (Koryak Highlands, Northeastern Asia). Strat. Geol. Corr. 2017, 25, 400–418. [Google Scholar] [CrossRef]
  10. Fiorillo, A.R. Alaska Dinosaurs: An ancient Arctic World; CRC Press: Boca Raton, FL, USA, 2018. [Google Scholar]
  11. Spicer, R.A.; Herman, A.B. The Late Cretaceous environment of the Arctic: A quantitative reassessment based on plant fossils. Palaeogeogr. Palaeoclimatol. Palaeoecol. 2010, 295, 423–442. [Google Scholar] [CrossRef] [Green Version]
  12. Spicer, R.; Valdes, P.; Hughes, A.; Yang, J.; Spicer, T.; Herman, A.; Farnsworth, A. New insights into the thermal regime and hydrodynamics of the early Late Cretaceous Arctic. Geol. Mag. 2019, 157, 1729–1746. [Google Scholar] [CrossRef] [Green Version]
  13. Zolina, A.A.; Golovneva, L.B.; Spicer, R.A. Latest Cretaceous (Maastrichtian) climate of the Koryak Upland of North-East Russia based on a quantitative analysis of a palaeo-polar flora. Palaeogeogr. Palaeoclimatol. Palaeoecol. 2020, 560, 109997. [Google Scholar] [CrossRef]
  14. Doblas-Reyes, F.J.; Sörensson, A.A.; Almazroui, M.; Dosio, A.; Gutowski, W.J.; Haarsma, R.; Hamdi, R.; Hewitson, B.; Kwon, W.-T.; Lamptey, B.L.; et al. Climate Change 2021: The Physical Science Basis: Contribution of Working Group I to the Sixth Assessment Report of the Intergovernmental Panel on Climate Change; Masson-Delmotte, V., Zhai, P., Pirani, A., Connors, S.L., Péan, C., Berger, S., Caud, N., Chen, Y., Goldfarb, L., Gomis, M.I., et al., Eds.; Cambridge University Press: Cambridge, UK, 2021; Available online: https://centaur.reading.ac.uk/99896/ (accessed on 15 February 2022).
  15. Van de Kerk, M.; Arthur, S.; Bertram, M.; Borg, B.; Herriges, J.; Lawler, J.; Mangipane, B.; Koizumai, C.L.; Wendling, B.; Prugh, L. Environmental influences on Dall’s Sheep survival. J. Wildl. Manag. 2020, 84, 1127–1138. [Google Scholar] [CrossRef]
  16. Mori, H.; Druckenmiller, P.; Erickson, G. A new Arctic hadrosaurid (Dinosauria: Hadrosauridae) from the Prince Creek Formation (lower Maastrichtian) of northern Alaska. Acta Palaeontol. Pol. 2016, 61, 15–32. [Google Scholar] [CrossRef] [Green Version]
  17. Parrish, J.T.; Spicer, R.A. Late Cretaceous terrestrial vegetation: A near-polar temperature curve. Geology 1988, 16, 22–25. [Google Scholar] [CrossRef]
  18. Chinsamy, A.; Thomas, D.B.; Tumarkin-Deratzian, A.R.; Fiorillo, A.R. Hadrosaurs were perennial polar residents. Anat. Rec. 2012, 295, 610–614. [Google Scholar] [CrossRef] [PubMed]
  19. Lawver, L.A.; Grantz, A.; Gahagan, L.M. Tectonic Evolution of the Bering Shelf-Chukchi Sea-Arctic Margin and Adjacent Landmasses; Miller, E.L., Grantz, A., Klemperer, S.L., Eds.; Geological Society of America Special Paper: Boulder, CO, USA, 2002; Volume 360, pp. 333–358. [Google Scholar]
  20. Hillhouse, J.W.; Coe, R.S. The Geology of Alaska; The Geology of North America; Plafker, G., Berg, H.C., Eds.; Geological Society of America: Boulder, CO, USA, 1994; Volume G-1, pp. 797–812. [Google Scholar]
  21. Mull, C.G.; Houseknecht, D.W.; Bird, K.J. Revised Cretaceous and Tertiary stratigraphic nomenclature in the Colville Basin, Northern Alaska. U.S. Geol. Surv. Prof. Paper 2003, 1673, 1–51. [Google Scholar]
  22. Phillips, R.L. Depositional environments and processes in Upper Cretaceous nonmarine and marine sediments, Ocean Point dinosaur locality, North Slope, Alaska. Cretac. Res. 2003, 24, 499–523. [Google Scholar] [CrossRef]
  23. Flaig, P.P.; McCarthy, P.J.; Fiorillo, A.R. New Frontiers in Paleopedology and Terrestrial Paleoclimatology; Driese, S.G., Nordt, L.C., Eds.; SEPM Special Publication: Broken Arrow, OK, USA, 2013; Volume 104, pp. 179–230. [Google Scholar]
  24. Flaig, P.P.; Fiorillo, A.R.; McCarthy, P.J. Dinosaur-bearing hyperconcentrated flows of Cretaceous arctic Alaska: Recurring catastrophic event beds on a distal paleopolar coastal plain. PALAIOS 2014, 29, 594–611. [Google Scholar] [CrossRef]
  25. Ridgway, K.D.; Trop, J.M.; Sweet, A.R. Thrust-top basin formation along a suture zone, Cantwell basin, Alaska Range: Implications for development of the Denali Fault system. Geol. Soc. Am. Bull. 1997, 109, 505–523. [Google Scholar] [CrossRef]
  26. Tomsich, C.S.; McCarthy, P.J.; Fiorillo, A.R.; Stone, D.; Benowitz, J.; O’Sullivan, P. New zircon U-Pb ages for the lower Cantwell Formation: Implications for the Late Cretaceous paleoecology and paleoenvironment of the lower Cantwell Formation near Sable Mountain, Denali National Park and Preserve, central Alaska Range, USA. In Proceedings of the International Conference on Arctic Margins, St. Petersburg, Russia, 2–5 June 2014; Volume VI, pp. 19–60. [Google Scholar]
  27. Salazar-Jaramillo, S.; Fowell, S.J.; McCarthy, P.J.; Benowitz, J.A.; Sliwinski, M.G.; Tomsich, C.S. Terrestrial isotopic evidence for a Middle-Maastrichtian warming event from the lower Cantwell Formation, Alaska. Palaeogeogr. Palaeoclimatol. Palaeoecol. 2016, 441, 360–376. [Google Scholar] [CrossRef]
  28. Detterman, R.L.; Case, J.E.; Miller, J.W.; Wilson, F.H.; Yount, M.E. Stratigraphic framework of the Alaska Peninsula. U.S. Geol. Surv. Bull. 1969, 1969-A, 1–74. [Google Scholar]
  29. Webb, L.J. Environmental relationships of the structural types of Australian rain forest vegetation. Ecology 1968, 49, 296–311. [Google Scholar] [CrossRef]
  30. Greenwood, D.R. Taphonomic constraints on foliar physiognomic interpretations of late Cretaceous and Tertiary paleoclimates. Rev. Palaeobot. Palynol. 1992, 71, 149–190. [Google Scholar] [CrossRef]
  31. Greenwood, D.R. History of the Australian Vegetation: Cretaceous to Recent; Hill, R.S., Ed.; Cambridge University Press: Cambridge, UK, 1994; pp. 44–59. [Google Scholar]
  32. Greenwood, D.R. Fossil angiosperm leaves and climate: From Wolfe and Dilcher to Burnham and Wilf. Adv. Angiosperm Paleobot. Paleoclimat. Reconstr. 2007, 258, 95–108. [Google Scholar]
  33. Jacobs, B.F. Estimation of rainfall variables from leaf characters in tropical Africa. Palaeogeog. Palaeoclimatol. Palaeoecol. 1999, 145, 231–250. [Google Scholar] [CrossRef]
  34. Jacobs, B.F. Estimation of low-latitude paleoclimates using fossil angiosperm leaves: Examples from the Miocene Tugen Hills, Kenya. Paleobiology 2002, 28, 399–421. [Google Scholar] [CrossRef]
  35. Jordan, G.I. A critical framework for the assessment of biological palaeooproxies: Predicting past climate and levels of atmospheric CO2 from fossilil leaves. New Phytol. 2011, 192, 29–44. [Google Scholar] [CrossRef] [PubMed]
  36. Royer, D.L.; Peppe, D.J.; Wheeler, E.A.; Niinemets, U. Roles of climate and functional traits in controlling toothed vs. untoothed leaf margins. Am. J. Bot. 2012, 99, 915–922. [Google Scholar] [CrossRef] [Green Version]
  37. Peppe, D.J.; Baumgartner, A.; Flynn, A.; Blonder, B. Methods in Paleoecology: Reconstructing Cenozoic Terrestrial Environments and Ecological Communities; Croft, D.A., Su, D.F., Simpson, S.W., Eds.; Springer: Berlin/Heidelberg, Germany, 2018; pp. 289–317. [Google Scholar]
  38. Diefendorf, A.F.; Mueller, K.E.; Wing, S.L.; Koch, P.L.; Freeman, K.H. Global patterns in leaf 13C discrimination and implications for studies of past and future climate. Proc. Natl. Acad. Sci. USA 2010, 107, 5738–5743. [Google Scholar] [CrossRef] [Green Version]
  39. Leavitt, S.W.; Long, A. Stable-carbon isotope variability in tree foliage and wood. Ecology 1986, 67, 1002–1010. [Google Scholar] [CrossRef]
  40. Tomsich, C.S.; McCarthy, P.J.; Fowell, S.J.; Sunderlin, D. Paleofloristic and paleoenvironmental information from a Late Cretaceous (Maastrichtian) flora of the lower Cantwell Formation near Sable Mountain, Denali National Park, Alaska. Palaeogeogr. Palaeoclimatol. Palaeoecol. 2010, 295, 389–408. [Google Scholar] [CrossRef]
  41. Salazar-Jaramillo, S.; McCarthy, P.J.; Ochoa, A.; Fowell, S.J.; Longstaffe, F.J. Paleoclimate reconstruction of the Prince Creek Formation, Arctic Alaska, during Maastrichtian global warming. Palaeogeogr. Palaeoclimatol. Palaeoecol. 2019, 532, 109265. [Google Scholar] [CrossRef]
  42. Sheldon, N.D.; Tabor, N.J. Quantitative paleoenvironmental and paleoclimatic reconstruction using paleosols. Earth Sci. Rev. 2009, 95, 1–52. [Google Scholar] [CrossRef]
  43. Spicer, R.A.; Parrish, J.T. Late Cretaceous–early Tertiary palaeoclimates of northern high latitudes: A quantitative view. J. Geol. Soc. 1990, 147, 329–341. [Google Scholar] [CrossRef]
  44. Upchurch, G.R., Jr.; Kiehl, J.; Shields, C.; Scherer, J.; Scotese, C. Latitudinal temperature gradients and high-latitude temperatures during the latest Cretaceous: Congruence of geologic data and climate models. Geology 2015, 43, 683–686. [Google Scholar] [CrossRef]
  45. Spicer, R.A. CLAMP. 2006. Available online: www.open.ac.uk/earth-research/spicer/CLAMP/Clampset1.html (accessed on 2 February 2022).
  46. Fiorillo, A.R.; McCarthy, P.J.; Hasiotis, S.T. Crayfish burrows from the latest Cretaceous lower Cantwell Formation (Denali National Park, Alaska): Their morphology and paleoclimatic significance. Palaeogeogr. Palaeoclimatol. Palaeoecol. 2016, 441, 352–359. [Google Scholar] [CrossRef]
  47. Fiorillo, A.R.; Kobayashi, Y.; McCarthy, P.J.; Tanaka, T.; Tykoski, R.S.; Lee, Y.-N.; Takasaki, R.; Yoshida, J. Dinosaur ichnology and sedimentology of the Chignik Formation (Upper Cretaceous), Aniakchak National Monument, southwestern Alaska; Further insights on habitat preferences of high-latitude hadrosaurs. PLoS ONE 2019, 14, e0223471. [Google Scholar] [CrossRef]
  48. Hollick, A. The Upper Cretaceous floras of Alaska. U.S. Geol. Surv. Prof. Paper 1930, 159, 1–123. [Google Scholar]
  49. Lockley, M.G. The paleobiological and paleoenvironmental importance of dinosaur footprints. Palaios 1986, 1, 37–47. [Google Scholar] [CrossRef]
  50. Lockley, M.G. Tracking Dinosaurs: A New Look at an Ancient World; Cambridge University Press: Cambridge, UK, 1991. [Google Scholar]
  51. Blob, R.W.; Badgley, C. Bonebeds: Genesis, Analysis and Paleobiological Significance; Rogers, R.R., Eberth, D.A., Fiorillo, A.R., Eds.; University of Chicago Press: Chicago, IL, USA, 2007; pp. 333–396. [Google Scholar]
  52. Owen-Smith, N. (Ed.) Dynamics of Large Herbivore Populations in Changing Environments; Wiley-Blackwell: Hoboken, NJ, USA, 2010; pp. 63–97. [Google Scholar]
  53. Myers, T.S.; Tabor, N.J.; Jacobs, L.L.; Mateus, O. Estimating soil pCO2 using paleosol carbonates: Implications for the relationship between primary productivity and faunal richness in ancient terrestrial ecosystems. Paleobiology 2012, 38, 585–604. [Google Scholar] [CrossRef]
  54. Suarez, C.A.; Ludvigson, G.A.; Gonzalez, L.A.; Fiorillo, A.R.; Flaig, P.P.; McCarthy, P.J. Use of multiple oxygen isotope proxies for elucidating Arctic Cretaceous palaeo-hydrology. Geol. Soc. London, Spec. Pub. 2013, 382, 185–202. [Google Scholar] [CrossRef] [Green Version]
  55. Fiorillo, A.R.; McCarthy, P.J.; Flaig, P.P. A multi-disciplinary perspective on habitat preferences among dinosaurs in a Cretaceous Arctic greenhouse world, North Slope, Alaska (Prince Creek Formation: Lower Maastrichtian). Palaeogeogr. Palaeoclimatol. Palaeoecol. 2016, 441, 377–389. [Google Scholar] [CrossRef]
  56. Fiorillo, A.R. Microwear patterns on the teeth of northern high latitude hadrosaurs with comments on microwear patterns in hadrosaurs as a function of latitude and seasonal ecological constraints. Palaeontol. Electron. 2011, 14, 20A. [Google Scholar]
  57. Takasaki, R.; Fiorillo, A.R.; Tykoski, R.S.; Kobayashi, Y. Re-examination of the cranial osteology of the Arctic Alaskan hadrosaurine with implications for its taxonomic status. PLoS ONE 2020, 15, e0232410. [Google Scholar] [CrossRef] [PubMed]
  58. Currie, P.J.; Langston, W.; Tanke, D.H.; Ralrick, P.E.; Ridgely, R.C.; Witmer, L.M. A New Horned Dinosaur from an Upper Cretaceous Bone Bed in Alberta; NRC Research Press: Ottawa, ON, Canada, 2008. [Google Scholar]
  59. Fiorillo, A.R.; Tykoski, R.S. A new Maastrichtian species of the centrosaurine ceratopsid Pachyrhinosaurus from the North Slope of Alaska. Acta Palaeontol. Pol. 2012, 57, 561–573. [Google Scholar] [CrossRef] [Green Version]
Figure 1. Maps showing general locations of study areas. (A) Modern Alaska. (B) Polar projection of tectonic plates during the Late Cretaceous (Base map from PLATES Project, University of Texas Institute of Geophysics). The inner latitudinal ring on map represents 45° N. (C) Examples of vertebrate fossil data used in this study. (1) PCF, North Slope, C1, bonebed. (2) LCF DENA, C2, ceratopsian footprint, DENA. (3) CF, ANIA, C3 hadrosaur footprint.
Geosciences 12 00161 g001
Figure 2. Stratigraphic correlation of rock units discussed in this report.
Geosciences 12 00161 g002
Figure 3. (A) Graph shows relative abundances of ceratopsians and hadrosaurs (shown by red squares and blue dots, respectively) plotted against average isotopic values for mean annual precipitation. PCF, LCF, and CF refer to Prince Creek Formation, lower Cantwell Formation, and Chignik Formation, respectively. Note that there is a clear pattern of ceratopsians dominating in the drier LCF, while hadrosaurs dominate in the wetter PCF and CF. (B) Graph shows relative abundances of dinosaurian megaherbivores plotted against the mean annual temperatures for the PCF, LCF, and CF. (The temperature value entered for the PCF is the average of the values listed in Table 2.) Note that the relationship between relative abundances and MAT is ambiguous.
Geosciences 12 00161 g003
Table 2. Comparative paleoclimate mean annual temperature (°C). These paleotemperature data were compiled from the previous work of others. Methods describing how temperature data were derived are available in Spicer and Parrish [43], Spicer and Herman [11], Herman et al. [8], Tomsich et al. [26], and Upchurch et al. [44]. CLAMP data also generate values for warm-month mean temperature (WMMT) and cold-month mean temperature (CMMT).
MATWMMTCMMT
Prince Creek Formation (PCF)5–6 [44]10–122–4
6.7 ± 2.2 [11] --
6.7 [8]14.5 ± 3.1−2 ± 3.9
Lower Cantwell Formation (LCF)7.4 ± 2.4 [26]17.1 ± 3.2−2.3 ± 3.8
Chignik Formation (CF)13 [44]--
Table 3. Relative frequency of hadrosaur remains versus ceratopsian remains in correlative latest Cretaceous rocks of Alaska. Bonebed occurrences are from the Prince Creek Formation of Northern Alaska. These bonebeds are dominated by either hadrosaur remains or ceratopsian remains. Footprint occurrences are from the lower Cantwell Formation (LCF) of Denali National Park & Preserve. The Chignik Formation (CF) of Aniakchak National Monument & Preserve also preserves footprints, but none has been found that can be attributed to ceratopsians.
Bonebeds%Footprints%Footprints%
(PCF) (LCF) (CF)
Hadrosaurs583777367100
Ceratopsians117282700
Publisher’s Note: MDPI stays neutral with regard to jurisdictional claims in published maps and institutional affiliations.

