Revised Estimation Method for Emissions from Automated Plunger Lift Liquid Unloadings

1
Chevron U.S.A. Inc., Houston, TX 77002, USA
2
Center for Energy and Environmental Resources, The University of Texas at Austin, Austin, TX 78758, USA
*
Author to whom correspondence should be addressed.
Environments 2020, 7(4), 25; https://0-doi-org.brum.beds.ac.uk/10.3390/environments7040025
Submission received: 22 February 2020
/
Revised: 20 March 2020
/
Accepted: 28 March 2020
/
Published: 31 March 2020
(This article belongs to the Special Issue Measurement of Greenhouse Gas Emissions from Natural Gas Systems)
Abstract
:A variety of liquid unloading techniques are used to clear accumulated liquids from the wellbore to increase production rates for oil and gas wells. Data from national measurement studies indicate that a small subset of wells with plunger lift assist, that vent with high frequency and short event duration, contribute a significant fraction of methane emissions from liquid unloading activities in the United States. Compared to direct measurement of emissions at 24 wells in a field campaign, the most commonly used engineering emission estimate for this source category, which is based on the volume of gas in the wellbore, does not accurately predict emissions at the individual well (R2 = 0.06). An alternative emission estimate is proposed that relies on the duration of the venting activity and the gas production rate of the well, which has promising statistical performance characteristics when compared to direct measurement data. This work recommends well parameters that should be collected from future field measurement campaigns that are focused on this emission source.
1. Introduction
Due to technological advances in horizontal drilling and hydraulic fracturing, natural gas and crude oil production in the United States (US) has increased substantially over the last decade [1]. As the production of these resources has grown, many researchers [2,3,4] have made measurements or estimates of emissions of methane, which is the principal component of natural gas and a greenhouse gas (GHG), across oil and gas supply chains.
Methane estimation studies of oil and gas infrastructure have typically used either bottom-up or top-down methods to develop local, regional, or national emission estimates [5]. Top-down estimates utilize atmospheric methane concentration observations, such as from aerial [6,7,8] or satellite [9,10] platforms, and atmospheric transport models to estimate total methane emissions within an area of interest. Bottom-up emission methods [2,11,12] rely on emission factors developed from direct measurement studies or engineering estimates and assumptions on the frequency or count of activity data related to the activity within a region of interest. Most national emission inventories, such as the US GHG Inventory (GHGI) [13], rely on bottom-up emission estimation methods for methane emissions from oil and gas supply chains. Several meta-synthesis studies of methane emissions in the US [4,14] have noted that top-down emission inventories tend to exceed bottom-up emission inventory estimates for a variety of reasons, such as temporal emission variability and the skewed nature of emission rate distributions [15].
Liquid unloading technologies become necessary when the gas pressure from the producing reservoir is insufficient to lift co-produced water and liquid hydrocarbons to the surface, which causes accumulation of fluid in the wellbore and decreased gas production rates [16]. A variety of liquid unloading technology options exist that may be appropriate for different well and reservoir conditions. In the US, the primary liquid unloading techniques that can lead to atmospheric emissions of methane are manual liquid unloading, where a well is manually blown-down to atmosphere by an operator to remove the liquid slug from the wellbore, and plunger-lift systems, which utilize downhole gas pressure build-up to drive a mechanical plunger up the wellbore to carry the liquid slug to the surface [17].
In the 2017 US GHGI (released in 2019) [13], liquid unloading was estimated to account for 3% of total methane emissions from natural gas production in 2017, but historic emissions in the US GHGI have been estimated to be as high as 14% of total methane emissions from natural gas production. Liquid unloading has received additional attention in recent studies since the temporal variability of manual liquid unloadings in the Fayetteville Shale was found to be a key factor for reconciling top-down and bottom-up estimates in a field measurement campaign [7] and as a potential explanation for regional variations in methane emissions that have been observed in different oil and gas production regions in the US [17,18]. National extrapolations of liquid unloading emissions indicate that reported emissions from this source category may be under-reported by a factor of 4.8 [17], particularly for plunger lift wells that vent with high frequency, i.e., more than 100 times per year, and that typically have automated operation [11,17].
A recent national emission estimate for automated plunger lift wells [17] estimated that the practice occurred at 0.43% of natural gas wells in the US but accounted for 28% of methane emissions from liquid unloading activities in 2016. This work discusses the limitations of the current emission estimation approach, US Environmental Protection Agency (EPA) Method 3, [19] used in the US Greenhouse Gas Reporting Program (GHGRP) for automated plunger lift wells and proposes an alternative emission estimation technique that more closely matches direct emission measurements from a field campaign [11] and that relies on commonly reported well parameters.
2. Materials and Methods
2.1. Emission Measurement Data Source
The primary dataset used in this study consists of unloading emission measurements and well parameters for 24 automated plunger lift wells from a direct measurement field campaign [11]. The field campaign data set [20] has 25 automated plunger lift wells with measurements, but one well, (identified as well UBB-42-0901 in the published data set), is excluded from the calculations in this work and in the prior paper [11], since flow rates briefly exceeded the instrument range during the measurement.
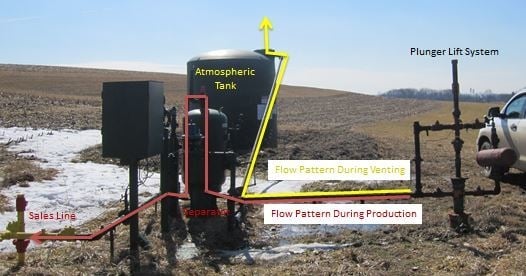
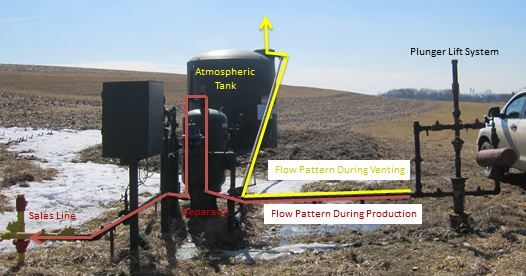
Briefly, the Allen et al. [11] field measurement campaign involved direct measurement of flow rates during liquid unloading events, with site access provided by participating oil and gas companies throughout the US. Depending on available points of access, flow measurements were made either through stack measurements at the point of atmospheric release of emissions, generally tank vent stacks, or by the insertion of in-line flow meters between the well and the point of atmospheric release. Methane compositions were based on site-specific measurements provided by the operator.
2.2. Current US EPA Emission Estimation Methods
In the onshore US, oil and natural gas producers with annual basin-level GHG emissions exceeding 25,000 metric tons of carbon dioxide equivalents (CO2e) are required to report GHG emissions to the EPA through the GHGRP [19]. Producers that vent natural gas to the atmosphere due to liquid unloading with plunger-lift have two emission estimation options: EPA Method 1, which involves direct measurement of a representative subset of venting events in a basin, and EPA Method 3, which is estimated based on well parameters. Based on 2018 reported data in EPA Envirofacts [21], Method 1 is an infrequent choice for reporting emissions associated with plunger lifts as it was utilized for 128 events with estimated emission of 0.02 metric tons of methane. Nearly 2.4 million venting events and 53,000 metric tons of methane were reported using Method 3 in 2018.
EPA Method 3 is an engineering estimation technique to determine whole gas and methane emissions from liquid unloading operations with plunger lift assist that vent to the atmosphere. If a venting event occurs for less than 30 min, Method 3 assumes that the entire volume of gas in the well bore is vented to the atmosphere, regardless of the actual duration of the venting events. The emission rate for liquid unloading events with plunger lifts that exceed 30 minutes are assumed to occur at the gas production rate of the well for any period greater than 30 minutes. For the automated plunger lift wells that are the focus of this work, the venting duration in a past field campaign [11] ranged from approximately 0.5 to 20 min, which is consistent with industry survey data [22] for the venting duration of plunger lift wells.
Emissions associated with liquid unloadings at the 24 wells with field observations are compared to emissions estimated using EPA Method 3 for plunger lift wells with a venting event duration of less than 30 min:
where TDp is the tubing diameter for the well in inches, WDp is the tubing depth in the well to the plunger bumper in feet, and SPp is the flow line pressure in pounds per square inch atmosphere (psia) for the well. The method specifies that the entire volume of gas in the wellbore is vented during each plunger lift venting cycle. The complete derivation of Equation (1) from the full EPA Method 3 equation is available in the Supplementary Materials.
2.3. Revised Emission Estimation Methodology
The revised emission method that is proposed in this work is based on the production rate of gas in the well, the amount of time that the well vents to atmosphere during an automated plunger lift unloading cycle, and a correction factor to account for the difference in pressure drop for the well under unloading conditions compared to production conditions:
where Pshut is the shut-in pressure to which the well builds while the plunger is being dropped (psia), Patm is the local atmospheric pressure and is assumed to be 14.7 psia in this work, Pline is the normal line pressure for the well during normal production operations (psia), Psep is the separator operating pressure (psia), SFRp is the average gas production rate of the well in standard cubic feet per hour (scfh), and HRp is the venting time for the well during the unloading event (h).
The method proposed in Equation (2) is similar to the estimation method described in the previous section for emissions associated with a plunger lift venting event that exceeds 30 min; however, venting durations for wells with automated plunger lifts are typically less than 20 min in duration [11,22]. The correction factor in Equation (2) is based on fluid flow through an orifice [23], which indicates that for a homogeneous fluid, the flow through an orifice depends on the square root of the pressure drop across the orifice. The ratio in Equation (2) provides a first approximation of the ratio of the flow during venting conditions associated with plunger lift operations to the flow during routine production of the well and is derived in the Supplementary Materials. The need for a scaled production rate estimation method was made due to observations in Allen et al. [11] that the maximum measured emission rates during field sampling exceeded the average routine production rate for the well for 21 of the 24 wells with automated plunger lifts, with instantaneous emission rates as large as two orders of magnitude higher than the average gas production rate for the well under normal operations.
Two of the parameters in the correction factor, Pshut and Psep, were not available for all wells in the field study data set [20]. Thus, these parameters were estimated for all wells in the study based on other data sources. The separator pressure, Psep, was estimated as the line pressure, Pline, multiplied by 0.7728, which was based on the linear relationship (R2 = 0.85) between the line pressure and separator pressure for 13 wells in an earlier study of shale gas wells [2] with a line pressure less than 215 psig. A threshold of 215 psig was chosen for this comparison since this bounded the high frequency automated plunger lift well line pressures in Allen et al. [11]. The shut-in pressure, Pshut, was estimated as 1.5 times the line pressure based on the minimum design value for plunger lift wells [16]. For reference, the 10 wells (of 24 total) with reported shut-in pressures in the database [20] used in this work had ratios of Pshut to Pline that ranged from 1.2 to 4.9 with a median of 1.3.
3. Results and Discussion
3.1. Emission Rate Model Performance
Figure 1 and Table 1 show comparisons between measured emissions [11] for 24 automated plunger lift wells, the emissions per well that would be estimated using EPA Method 3, and the estimated emission using the revised method proposed in this work. Comparisons are also made with a subset of 22 wells that exclude 2 outlier measurements with average whole gas emission rates exceeding 8000 scf gas emitted per liquid unloading event. For the 24 wells in the study, a weak correlation (R2 = 0.06) was found between the prediction made by the Method 3 estimation and the field measurements, indicating a poor predictive power for the Method 3 model on an individual well emission basis. This lack of predictive performance for the Method 3 model, which is based only on the volume of gas in the wellbore, was expected based on measurements in the field campaign [11] in which the volume of gas measured in the well unloading events was greater than 150% or less than 50% of the tubing volume in the well for 16 of the 24 automated plunger lifts in the study dataset.
By comparison, the revised estimation method has an R2 = 0.66, indicating that the production rate multiplied by the venting duration explains approximately two-thirds of the variation in emissions per event from the wells in the field sample. The relationship between measured emission rates and the estimated emissions from the revised method in this work is statistically significant (p < 0.10). For the 24 wells in the dataset, the revised emission method has a reduced mean normalized bias (MNB), which is defined in the Supplementary Materials, compared to Method 3 (Table 1). However, the average emissions per event and the mean bias (MB) are not as accurate for the revised method as with Method 3. Both Method 3 and the revised method tend to underpredict absolute emissions per event at the wells with the highest emissions per event (Figure 1).
The two wells with automated plunger lifts in the dataset with the longest duration (~20 min) per venting event, which were UBB-42-0201 and UBB-42-0601, also had the highest whole gas emission rates per event (>8000 scf whole gas per event) and are poorly predicted with the EPA Method 3 model (~1400–2500 scf whole gas per event as shown in Table S1 in Supplemental Materials). The revised method based on venting duration and gas production rate predicts that these events would be elevated compared to other measurements in the dataset, but the revised emission method continues to under-predict the emissions per event from these two wells. The ability of a predictive model to account for outlier wells within a sample is particularly important for estimating emissions from natural gas systems due to numerous findings of skewed distributions for component-level emission rates [24,25,26] and specifically for liquid unloadings [2,11,17]. The statistical performance of the revised method, excluding the two outlier wells, is better than Method 3 in terms of MB and MNB (Table 1), and the revised method (733 scf/event) more accurately predicts the mean emissions per event in the measured dataset (810 scf/event) compared to predictions made with Method 3 (1195 scf/event). The poor linear correlation (R2 = 0.06) for the revised method compared to measured data, however, indicates that the revised method does not explain the underlying variability among the shorter duration venting events for wells with automated plunger lifts.
The performance of the revised modeling framework in Equation (2) may be improved by obtaining actual values for separator pressure, shut-in pressure, and local atmospheric pressure, which were estimated in this work. As discussed in the Materials and Methods section, the field measurements [20] used in the analysis in this work did not collect all of this information as associated metadata, and estimations based on other data sources were made. It is recommended that future field measurement studies on liquid unloading emissions collect the additional pressure information suggested in Equation (2) to test model robustness against actual field emission observations.
3.2. Implications for National Emission Estimates
The national emission estimates for high frequency liquid unloading emissions that are typically automated that was made in Allen et al. [11] were based on direct measurement of the 24 wells in the dataset, site-specific methane emission composition data provided by the company providing site access, and the frequency at which sponsoring company wells had unloading events that led to atmospheric emissions. For the Allen et al. study [11], the average methane emissions per event for automated plunger lift wells was 1260 scf methane per venting event for the 6.6 million venting events from this source category in 2012. Based on these assumptions, emissions from automated plunger lift wells in the US in 2012 were estimated at 159 kt methane. By comparison, Method 3 would have predicted an average emission factor per event of 1035 scf methane, which would imply a national emission estimate in 2012 of 131 kt methane from automated plunger lift wells. Furthermore, Method 3 would not have identified the outlier emissions per event for UBB-42-0201 and UBB-42-0601 with the longest venting duration.
The US national emission estimate for methane emissions from oil and gas sources, including from venting during liquid unloading for wells with plunger lift is made annually by US EPA. The top-line estimate presented in the US GHG inventory does not disaggregate between emissions from automated and non-automated plunger lift. Total emissions from venting from wells with plunger lifts in 2012 was estimated to be 165 kt methane in the most recent US GHGI [13]. As shown in Table 2, the EPA GHG Inventory estimate is close to the estimate that would be inferred from the use of Method 3 for automated plunger lift wells and the Allen et al. [11] central estimated for manual plunger lift wells (169 kt methane). The national emission estimate that utilizes measured emission data from automated plunger lifts [11] leads to a national emission estimate for methane emissions associated with venting from plunger lifts that is ~20% greater for 2012.
The Allen et al. [11] study required significant meta-data input from participating companies to develop national activity data that is not possible to develop with public sources, like the US GHGRP, for more recent years. For reference, work by Zamies et al. [17] estimated that liquid unloadings with automated plunger lifts accounted for 179 kt methane in 2016, which is within 20% of the estimate provided in this work (Table 2) for 2012.
4. Conclusions
The current estimate [13] of total methane emissions from liquid unloading is that the source category is approximately 3% of the methane emissions associated with natural gas production in the US. Several studies [11,17] have identified a subset of wells with liquid unloading activities with high frequency venting using automated plunger lifts as being an important driver of emissions in the source category. When compared to field measurements [20], the current EPA Method 3 engineering estimation approach was shown to have poor predictive power of venting emissions per plunger lift cycle on a well-by-well basis. This work suggests a revised emission estimation approach that relies on commonly tracked well parameters that shows promising statistical performance. It is recommended that future field measurement campaigns that focus on emissions from wells with automated plunger lifts collect additional metadata information on line separator, atmospheric, and shut-in pressures to fully test the revised model proposed in this work versus field data. Additional field data from such a campaign could help to understand the robustness of the revised method described in this work and understand the appropriateness of changes to EPA Method 3.
Supplementary Materials
The following are available online at https://0-www-mdpi-com.brum.beds.ac.uk/2076-3298/7/4/25/s1, Table S1: Well parameters, measured emissions data, and predictions for automated plunger lift wells used in analysis presented in this work.
Author Contributions
Conceptualization, A.P. and D.T.A.; formal analysis, A.P. and D.W.S.; writing—original draft preparation, A.P. and D.T.A.; writing—review and editing, A.P. and D.T.A. All authors have read and agreed to the published version of the manuscript.
Funding
This research received no external funding.
Acknowledgments
The authors thank former research contributors (Audrey Einhorn and Ashley Chan) at the Center for Energy and Environmental Resources at the University of Texas at Austin for their help in framing this work.
Conflicts of Interest
The authors declare the following competing financial interest(s): One of the authors (D.T.A.) has current research support from the National Science Foundation, the Texas Commission on Environmental Quality, the Gas Technology Institute’s Collaboratory for Advancing Methane Science, and Exxon Mobil Upstream Research Company. Over the past five years, he has also worked on methane emission measurement projects that have been supported by multiple natural gas producers and Environmental Defense Fund. D.T.A. has done work as a consultant for multiple companies, including British Petroleum, Eastern Research Group, ExxonMobil, Research Triangle Institute, and SLR International. One of the authors (A.P.) is a current employee of Chevron U.S.A. Inc.
References
- Annual Energy Outlook 2019 with Projections to 2050. Available online: https://www.eia.gov/outlooks/aeo/pdf/aeo2019.pdf (accessed on 30 December 2019).
- Allen, D.T.; Torres, V.M.; Thomas, J.; Sullivan, D.W.; Harrison, M.; Hendler, A.; Herndon, S.C.; Kolb, C.E.; Fraser, M.P.; Hill, A.D.; et al. Measurements of methane emissions at natural gas production sites in the United States. Proc. Natl. Acad. Sci. USA 2013, 110, 17768–17773. [Google Scholar] [CrossRef] [PubMed] [Green Version]
- Littlefield, J.A.; Marriott, J.; Schively, G.A.; Skone, T.J. Synthesis of recent ground-level methane emissions measurements from the U.S. natural gas supply chain. J. Clean. Prod. 2017, 148, 118–126. [Google Scholar] [CrossRef]
- Alvarez, R.A.; Zavala-Araiza, D.; Lyon, D.R.; Allen, D.T.; Barkley, Z.R.; Brandt, A.R.; Davis, K.J.; Herndon, S.C.; Jacob, D.J.; Karion, A.; et al. Assessment of methane emissions from the U.S. oil and gas supply chain. Science 2018, 361, 186–188. [Google Scholar] [CrossRef] [PubMed]
- Allen, D.T. Emissions from oil and gas operations in the United States and their air quality implications. J. Air Waste Manag. 2016, 66, 549–575. [Google Scholar] [CrossRef] [PubMed] [Green Version]
- Karion, A.; Sweeney, C.; Kort, E.A.; Shepson, P.B.; Brewer, A.; Cambaliza, M.; Conley, S.A.; Davis, K.; Deng, A.; Hardesty, M.; et al. Aircraft-based estimate of total methane emissions from the Barnett Shale Region. Environ. Sci. Technol. 2015, 49, 8124–8131. [Google Scholar] [CrossRef]
- Schwietzke, S.; Pétron, G.; Conley, S.; Pickering, C.; Mielke-Maday, I.; Dlugokencky, E.J.; Tans, P.P.; Vaughn, T.; Bell, C.; Zimmerle, D.; et al. Improved mechanistic understanding of natural gas methane emissions from spatially resolved aircraft measurements. Environ. Sci. Technol. 2017, 51, 7286–7294. [Google Scholar] [CrossRef] [PubMed] [Green Version]
- Smith, M.L.; Gvakharia, A.; Kort, E.A.; Sweeney, C.; Conley, S.A.; Faloona, I.; Newberger, T.; Schnell, R.; Schwietzke, S.; Wolter, S. Airborne quantification of methane emissions over the Four Corners Region. Environ. Sci. Technol. 2017, 51, 5832–5837. [Google Scholar] [CrossRef] [PubMed]
- Kort, E.A.; Frankenberg, C.; Costigan, K.R.; Lindenmaier, R.; Dubey, M.K.; Wunch, D. Four corners: The largest US methane anomaly viewed from space. Geophys. Res. Lett. 2014, 41, 6898–6903. [Google Scholar] [CrossRef]
- Varon, D.J.; McKeever, J.; Jervis, D.; Maasakkers, J.D.; Pandey, S.; Houweling, S.; Aben, I.; Scarpelli, T.; Jacob, D.J. Satellite discovery of anomalously large methane point sources from oil/gas production. Geophys. Res. Lett. 2019, 46, 13507–13516. [Google Scholar] [CrossRef] [Green Version]
- Allen, D.T.; Sullivan, D.W.; Zavala-Araiza, D.; Pacsi, A.P.; Harrison, M.; Keen, K.; Fraser, M.P.; Hill, A.D.; Lamb, B.K.; Sawyer, R.F.; et al. Methane emissions from process equipment at natural gas production sites in the United States: Liquid unloadings. Environ. Sci. Technol. 2015, 49, 641–648. [Google Scholar] [CrossRef] [PubMed]
- Mitchell, A.L.; Tkacik, D.S.; Roscioli, J.R.; Herndon, S.C.; Yacovitch, T.I.; Martinez, D.M.; Vaughn, T.L.; Williams, L.L.; Sullivan, M.R.; Floerchinger, C.; et al. Measurements of methane emissions from natural gas gathering facilities and processing plants: Measurement results. Environ. Sci. Technol. 2015, 49, 3219–3227. [Google Scholar] [CrossRef] [PubMed]
- Inventory of U.S. Greenhouse Gas Emissions and Sinks: 1990–2017. Available online: https://www.epa.gov/ghgemissions/inventory-us-greenhouse-gas-emissions-and-sinks-1990–2017 (accessed on 30 December 2019).
- Brandt, A.R.; Heath, G.A.; Kort, E.A.; O’Sullivan, F.; Pétron, G.; Jordaan, S.M.; Tans, P.; Wilcox, J.; Gopstein, A.M.; Arent, D.; et al. Methane leaks from North American natural gas systems. Science 2014, 343, 733–735. [Google Scholar] [CrossRef] [PubMed] [Green Version]
- National Academies of Sciences, Engineering, and Medicine. Improving Characterization of Anthropogenic Methane Emissions in the United States; The National Academies Press: Washington, DC, USA, 2018. [Google Scholar]
- Options for Removing Accumulated Fluid and Improving Flow in Gas Wells. Available online: https://www.epa.gov/sites/production/files/2016-06/documents/ll_options.pdf (accessed on 30 December 2019).
- Zaimes, G.G.; Littlefield, J.A.; Augustine, D.J.; Cooney, G.; Schwietzke, S.; George, F.C.; Lauderdale, T.; Skone, T.J. Characterizing regional methane emissions from natural gas liquid unloading. Environ. Sci. Technol. 2019, 53, 4619–4629. [Google Scholar] [CrossRef] [PubMed] [Green Version]
- Pacsi, A.P.; Harrison, M. Emissions from Liquid Unloadings Vary by Region. Oil Gas J. 2015. Available online: https://www.ogj.com/general-interest/companies/article/17290763/emissions-from-liquid-unloadings-vary-by-region (accessed on 31 December 2019).
- Electronic Code of Federal Regulations, Title 40: Protection of Environment, Part 98: Mandatory Greenhouse Gas Reporting, Subpart W: Petroleum and Natural Gas Systems. Available online: https://www.ecfr.gov/cgi-bin/text-idx?SID=555cd31d46a2d3217eeb4b4e3ec4571a&mc=true&node =sp40.23.98.w&rgn=div6 (accessed on 30 December 2019).
- Methane—Pneumatics and Liquid Unloadings Study Home. Available online: http://dept.ceer.utexas.edu/ methane2/study/ (accessed on 30 December 2019).
- Envirofacts: Greenhouse Gas Customized Search. Available online: https://www.epa.gov/enviro/ greenhouse-gas-customized-search (accessed on 30 December 2019).
- Shires, T.; Lev-On, M. Characterizing Pivotal Sources of Methane Emissions from Natural Gas Production: Summary and Analysis of API and ANGA Survey Responses; American Petroleum Institute: Washington, DC, USA, 2012. [Google Scholar]
- Geankoplis, C.J. Transport Processes and Separation Process Principles, 4th ed.; Prentice Hall: New Jersey, NJ, USA, 2007; p. 40. [Google Scholar]
- Allen, D.T.; Pacsi, A.P.; Sullivan, D.W.; Zavala-Araiza, D.; Harrison, M.; Keen, K.; Fraser, M.P.; Hill, A.D.; Sawyer, R.F.; Seinfeld, J.H. Methane emissions from process equipment at natural gas production sites in the United States: Pneumatic controllers. Environ. Sci. Technol. 2015, 49, 633–640. [Google Scholar] [CrossRef] [PubMed]
- Brandt, A.R.; Heath, G.A.; Cooley, D. Methane leaks in natural gas systems follow extreme distributions. Environ. Sci. Technol. 2016, 50, 12512–12520. [Google Scholar] [CrossRef] [PubMed]
- Pacsi, A.P.; Ferrara, T.; Schwan, K.; Tupper, P.; Lev-On, M.; Smith, R.; Ritter, K. Equipment leak detection and quantification at 67 oil and gas sites in the Western United States. Elem. Sci. Anthrop. 2019, 7, 29. [Google Scholar] [CrossRef] [Green Version]
Figure 1.
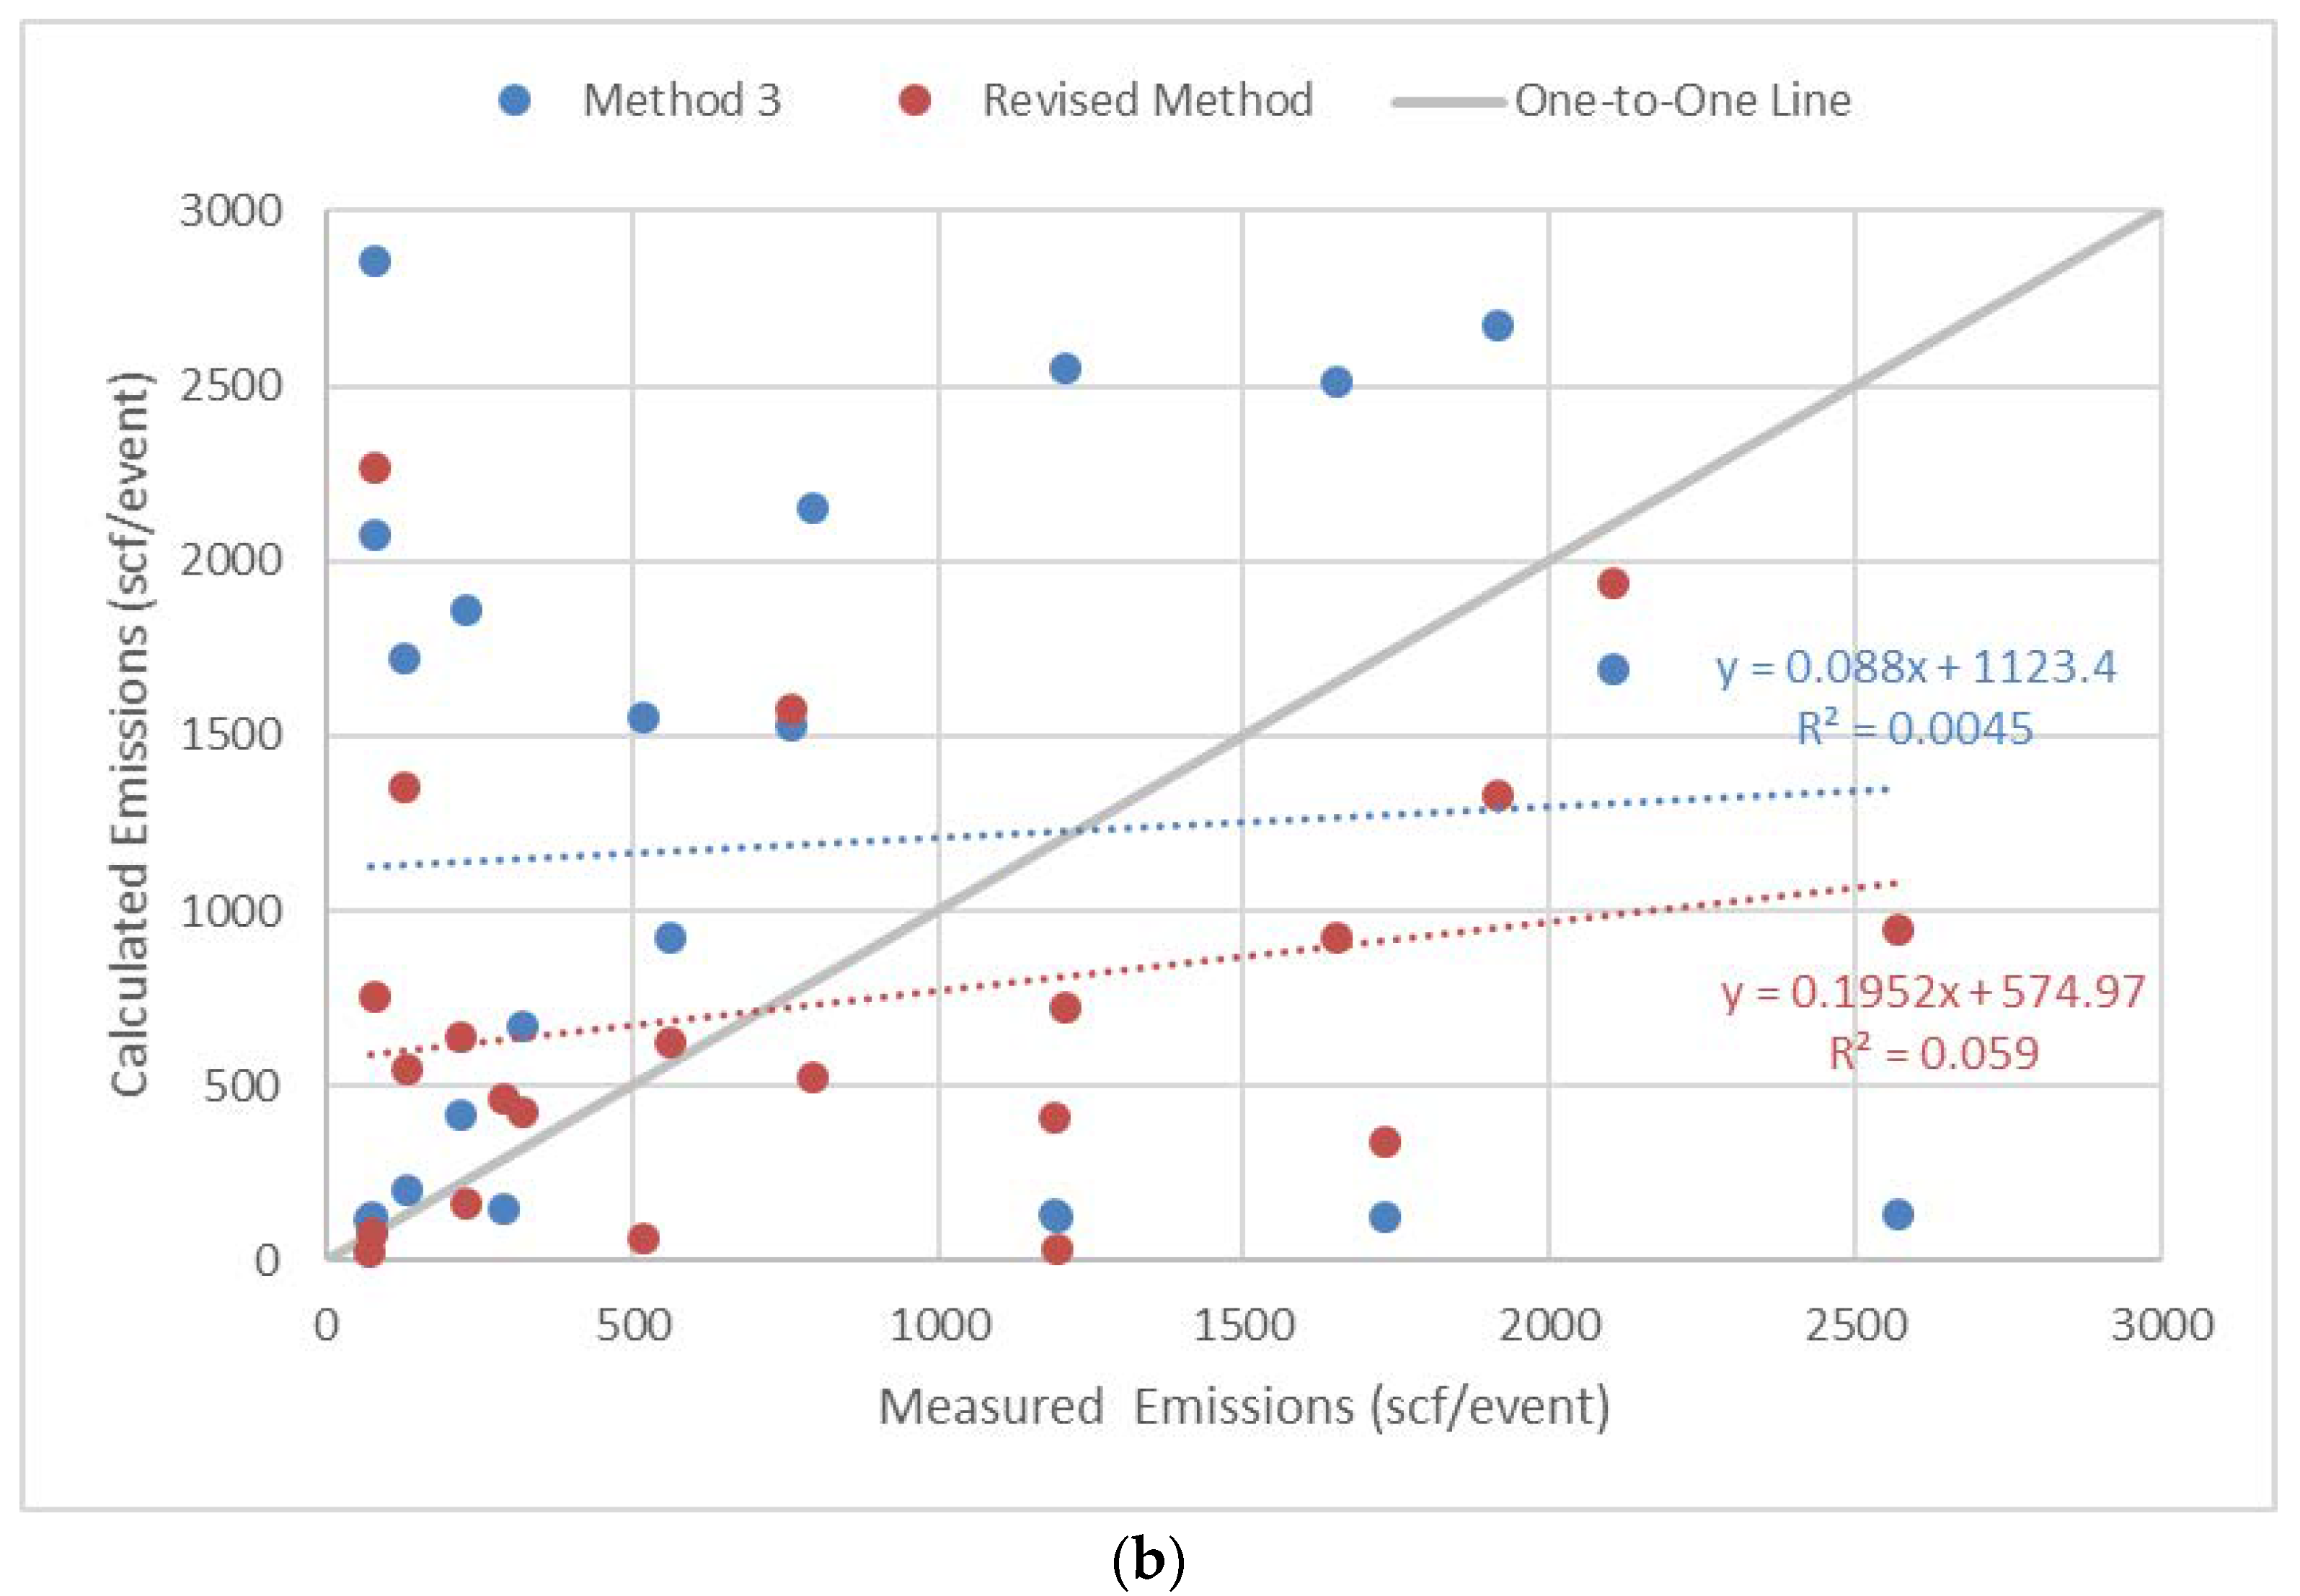
Linear best fit comparisons between measured emissions per event from the Allen et al. [11] field study and two engineering estimation methods: the current EPA Method 3 and the revised method proposed in this study. Comparisons are made for 24 wells in the Allen et al. [11] data set (a) and for 22 non-outlier wells (b).
Figure 1.
Linear best fit comparisons between measured emissions per event from the Allen et al. [11] field study and two engineering estimation methods: the current EPA Method 3 and the revised method proposed in this study. Comparisons are made for 24 wells in the Allen et al. [11] data set (a) and for 22 non-outlier wells (b).


Table 1.
Statistical measurements of model performance for average whole gas emissions in standard cubic feet (scf) per event compared to field measurements from Allen et al. [11]. For comparison, the average measured emission rates per event for the 24 well sample was 1563 scf per event. Analysis with 22 wells eliminated two outlier points with averaged measured emission rates above 8000 scf per event, and this subset of wells had average whole gas emission rates of 810 scf per event.
| Estimation Method | Number of Wells in Sample | Estimated Average Whole Gas Emissions (scf/event) | R2 Value of Best Fit Linear Prediction | p-Value (<0.1 for Significance) | Mean Bias (MB) scf/event | Mean Normalized Bias (MNB) |
|---|---|---|---|---|---|---|
| EPA Method 3 | 24 | 1258 | 0.06 | 0.29 | −305 | 3.6 |
| Revised Method | 24 | 1020 | 0.66 | 0.08 | −543 | 1.9 |
| EPA Method 3 | 22 | 1195 | 0.004 | 0.08 | 385 | 4.0 |
| Revised Method | 22 | 733 | 0.06 | 0.34 | −77 | 2.1 |
Table 2.
Comparison of estimated methane emissions (kt methane) in 2012 for liquid unloading events with plunger-lift assist.
Table 2.
Comparison of estimated methane emissions (kt methane) in 2012 for liquid unloading events with plunger-lift assist.
| Scenario | Automated Plunger Lift Emission Factor (scf/event) | Estimated Events per Year for Automated Plunger Lifts (Million) | Estimated National Emissions from Automated Plunger Lifts(kt Methane) | Estimated Emissions from Non-Automated Plunger Lifts (kt Methane) [11] | Total Emissions from Liquid Unloadings with Plunger Lift |
|---|---|---|---|---|---|
| Measured Data [20] | 1260 | 6.563 | 159 | 38 | 197 |
| Method 3 Estimates | 1035 | 6.563 | 130 | 38 | 169 |
| EPA GHG Inventory [13] | 165 |
© 2020 by the authors. Licensee MDPI, Basel, Switzerland. This article is an open access article distributed under the terms and conditions of the Creative Commons Attribution (CC BY) license (http://creativecommons.org/licenses/by/4.0/).
Share and Cite
MDPI and ACS Style
Pacsi, A.; Sullivan, D.W.; Allen, D.T. Revised Estimation Method for Emissions from Automated Plunger Lift Liquid Unloadings. Environments 2020, 7, 25. https://0-doi-org.brum.beds.ac.uk/10.3390/environments7040025
AMA Style
Pacsi A, Sullivan DW, Allen DT. Revised Estimation Method for Emissions from Automated Plunger Lift Liquid Unloadings. Environments. 2020; 7(4):25. https://0-doi-org.brum.beds.ac.uk/10.3390/environments7040025
Chicago/Turabian StylePacsi, Adam, David W. Sullivan, and David T. Allen. 2020. "Revised Estimation Method for Emissions from Automated Plunger Lift Liquid Unloadings" Environments 7, no. 4: 25. https://0-doi-org.brum.beds.ac.uk/10.3390/environments7040025
Note that from the first issue of 2016, this journal uses article numbers instead of page numbers. See further details here.