
Low Level Carbon Dioxide Indoors—A Pollution Indicator or a Pollutant? A Health-Based Perspective

 , ,
, ,
Abstract
:1. Introduction
2. Methods
2.1. Search Strategy
- Carbon dioxide terms;
- Health/effect terms;
- Location terms (indoor environments).
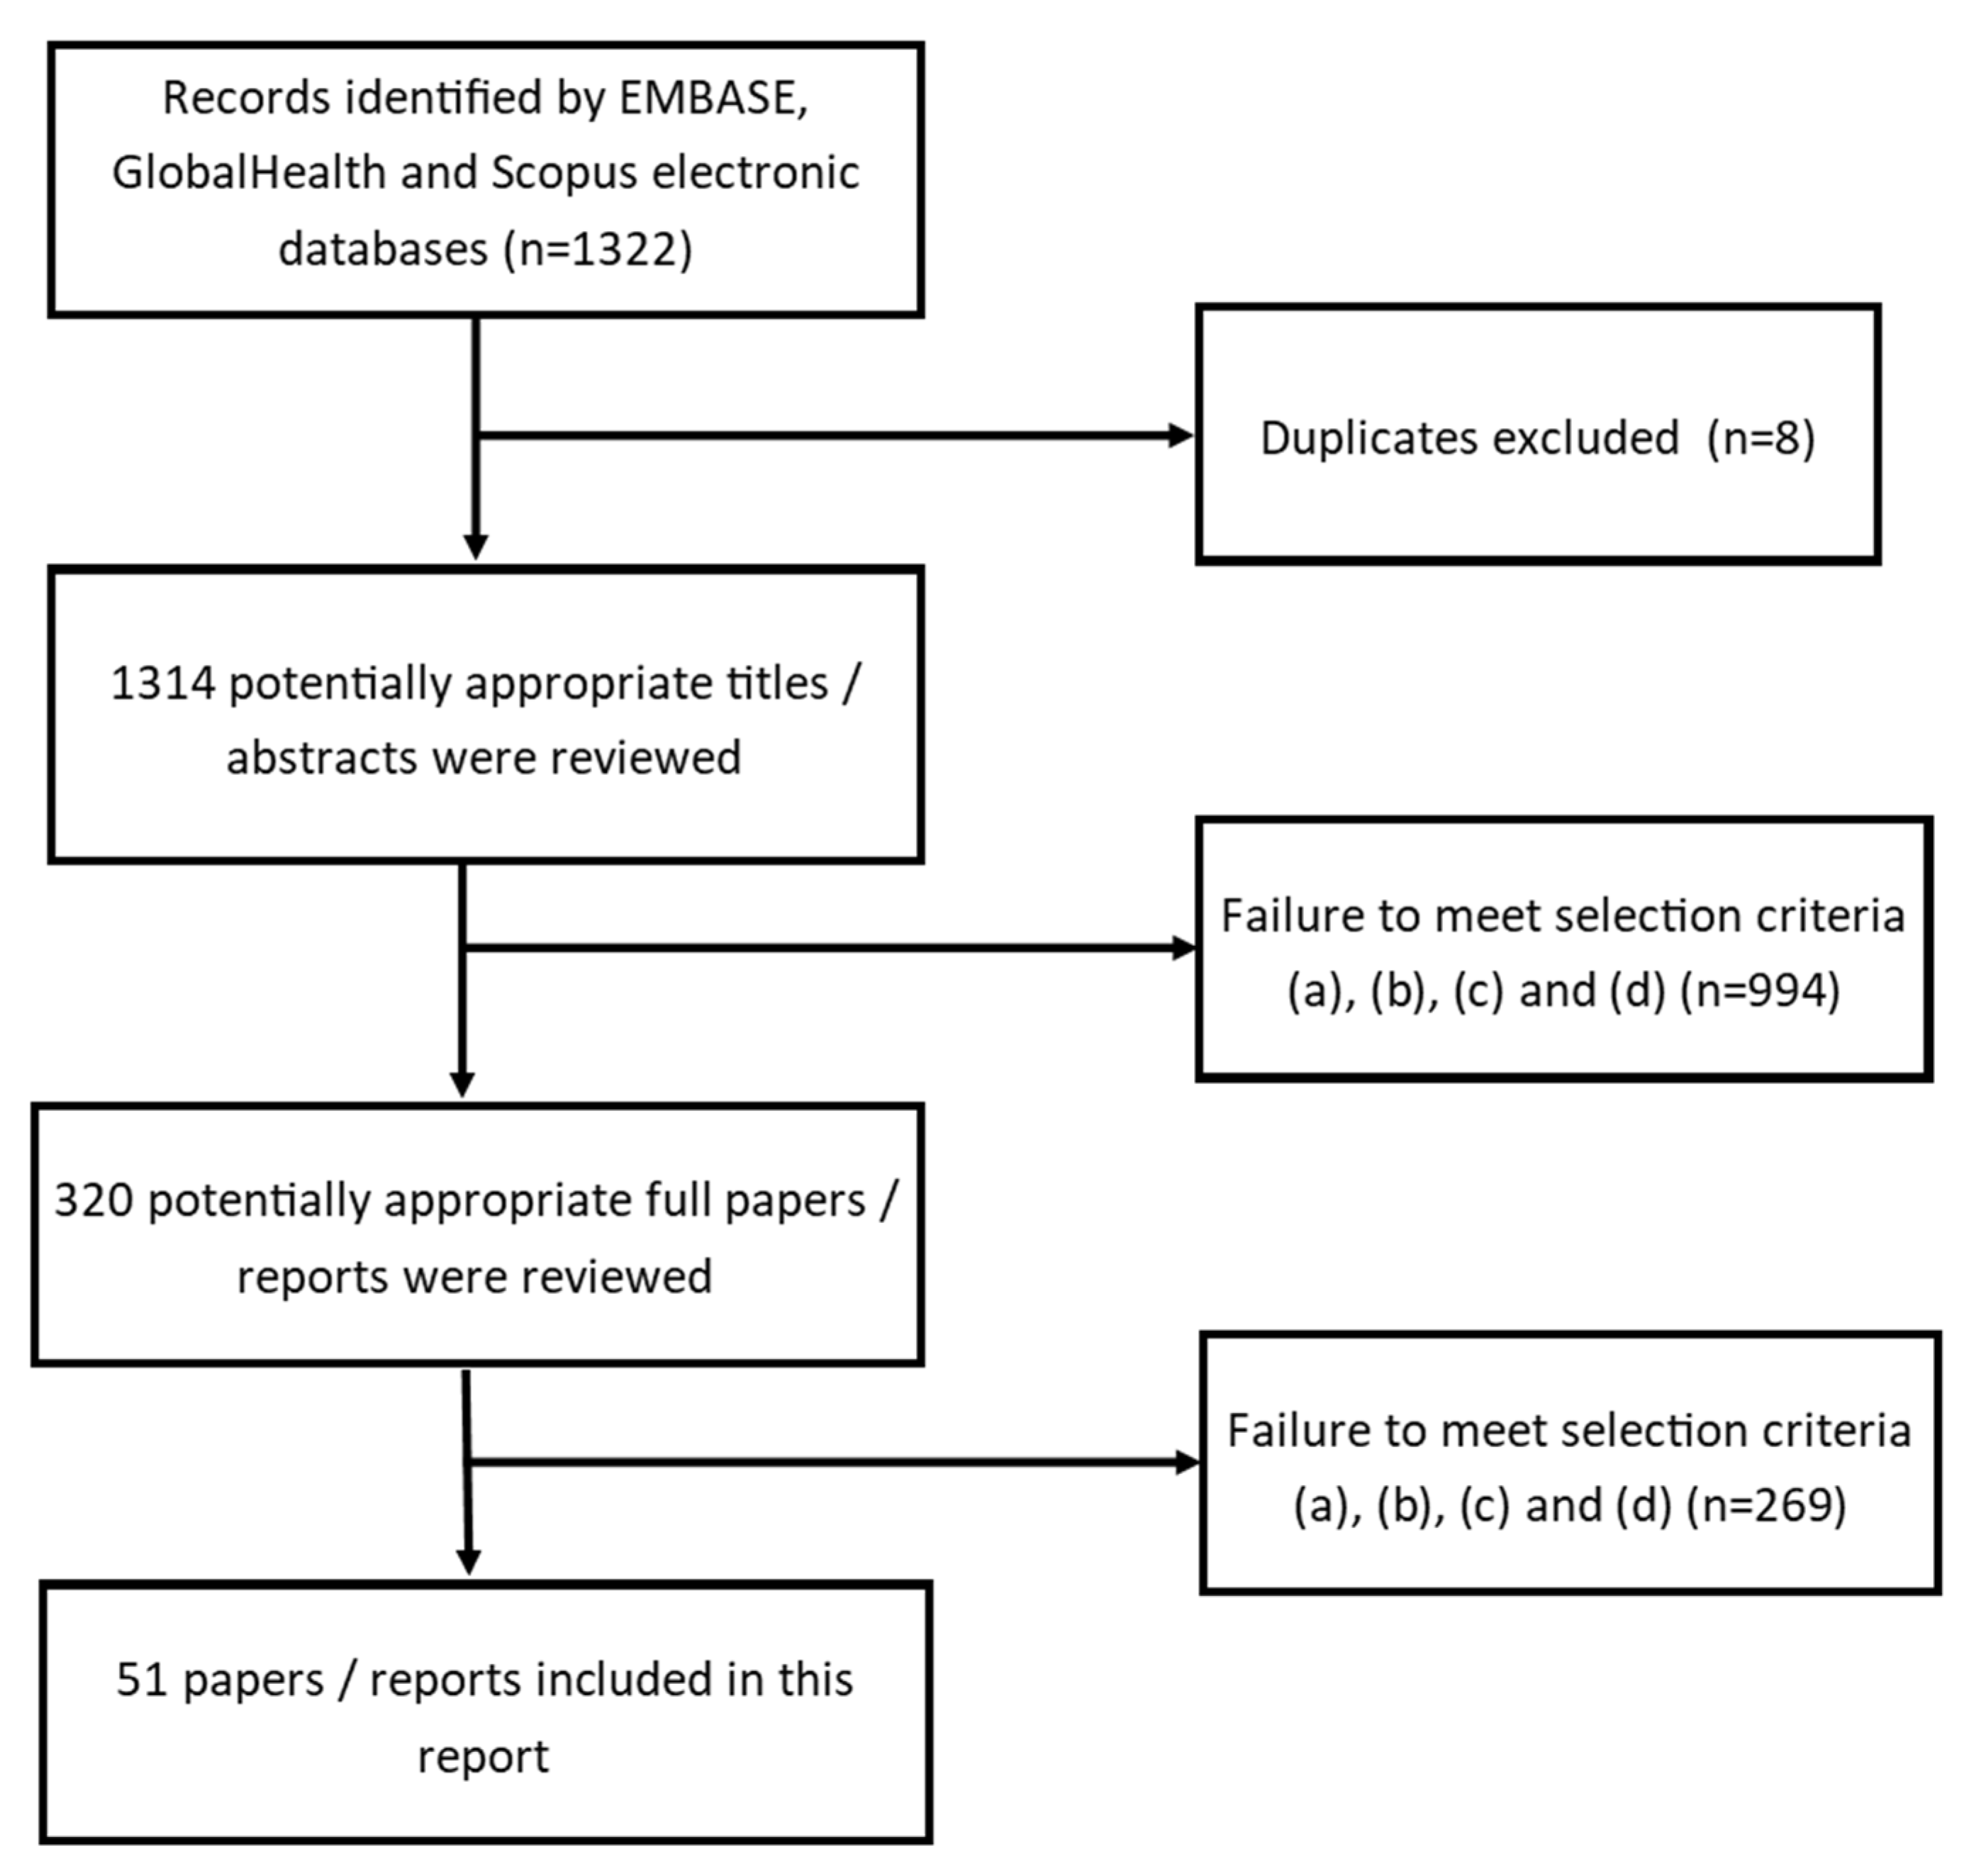
2.2. Initial Literature Search and Analysis
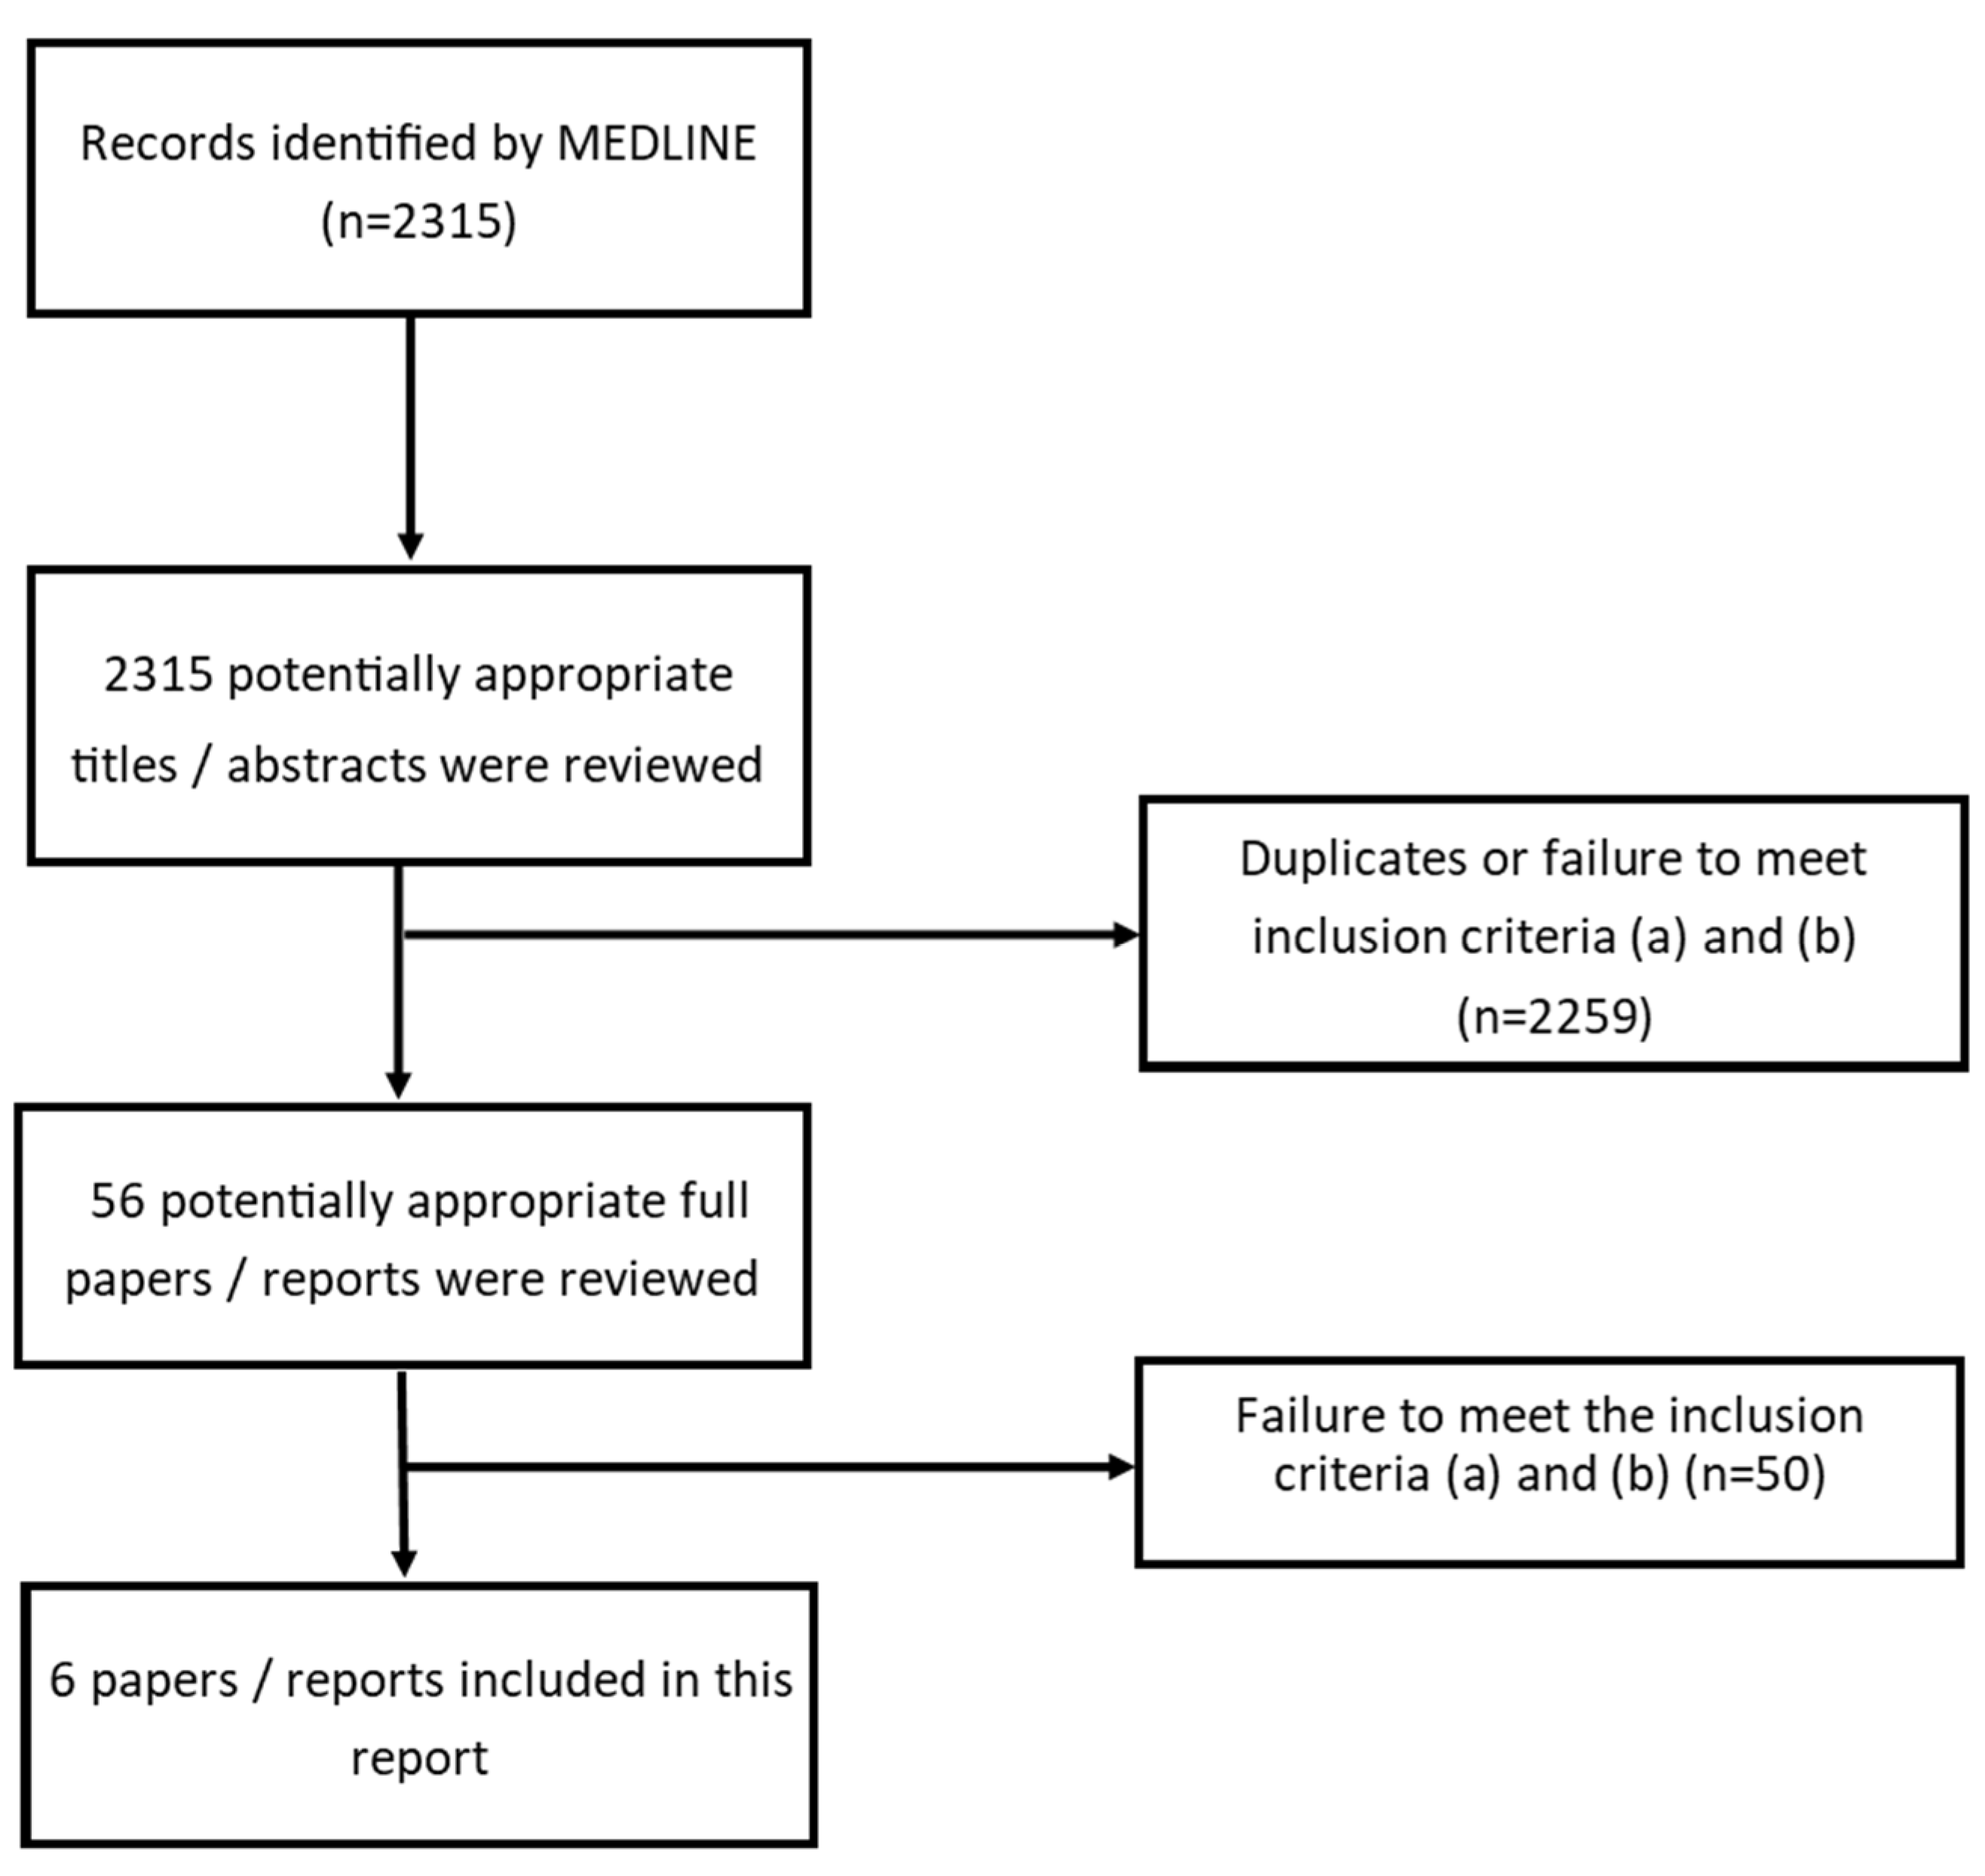
2.3. Second Literature Search
3. Results and Discussion
3.1. CO2 Concentration Guidelines and Recommended Limits
3.2. CO2 Concentration and Health
3.2.1. Cognitive Performance Effects
3.2.2. Respiratory System Effects
3.2.3. Neurological Symptoms and Irritation of the Upper Airway System
3.2.4. Human Physiological Responses
3.2.5. Animal Physiological Responses
3.3. Analysis of Study Design
4. Discussion
4.1. CO2 and Health
4.2. Improving Study Design
4.3. CO2 Guideline Concentrations
5. Conclusions
Author Contributions
Funding
Conflicts of Interest
Appendix A

| # | Database | Search Term |
|---|---|---|
| 1 | EMBASE | (((CO2 OR “carbon dioxide”).ti,ab OR “CARBON DIOXIDE”/) AND ((effect * OR symptom * OR health OR impact).ti,ab OR (headache * OR migrain *).ti,ab OR (sleep * OR drows * OR tired * OR fatigue * OR exhaust *).ti,ab OR (respirat * OR asthma * OR breath *).ti,ab OR (lung OADJ1 (function * OR behavio?r)).ti,ab OR (attendance OR absence *).ti,ab OR (neurodevelopmental OR neurolog * OR cognit * OR neurobehavioral OR neurophysiological).ti,ab OR (performance OR “decision making” OR concentrat * OR confusion).ti,ab OR (dizz * OR disorient *).ti,ab OR (hypercapnia).ti,ab OR (cardiovascular OR heartbeat OR arrhythmia OR “heart rate”).ti,ab OR (depress * OR paranoi * OR anxiety OR anxious OR “panic attack *”).ti,ab OR (physiolog * ADJ1 (response OR change *)).ti,ab OR (blood OADJ1 (pressure OR circulation)).ti,ab OR (muscle * ADJ1 twitch *).ti,ab OR (skin ADJ3 flush *).ti,ab OR (development * OR “nervous system” OR inflam * OR consciousness OR seizure).ti,ab)) AND (indoor OR building * OR workplace * OR (work ADJ1 environment *) OR office * OR occupation * OR profession * OR home * OR house * OR accommodation OR residen * OR dwell * OR tenant * OR nurser * OR (“day care” ADJ1 (centre * OR center *)) OR school * OR schoolchild * OR classroom * OR student * OR pupil * OR college * OR universit *).ti |
| 2 | Scopus | (TITLE-ABS-KEY (CO2 OR “carbon dioxide”)) AND (((ABS (effect * OR symptom * OR health OR impact)) OR (ABS (headache * OR migrain *)) OR (ABS (sleep * OR drows * OR tired * OR fatigue * OR exhaust *)) OR (ABS (respirat * OR asthma * OR breath *)) OR (ABS (respirat * OR asthma * OR breath *)) OR (ABS (lung W/1 (function * OR behavio?r))) OR (ABS (attendance OR absence *)) OR (ABS (neurodevelopmental OR neurolog * OR cognit * OR neurobehavioral OR neurophysiological)) OR (ABS (performance OR “decision making” OR concentrat * OR confusion)) OR (ABS (dizz * OR disorient *))) OR ((ABS (hypercapnia)) OR (ABS (cardiovascular OR heartbeat OR arrhythmia OR “heart rate”)) OR (ABS (depress * OR paranoi * OR anxiety OR anxious OR “panic attack *”)) OR (ABS (physiolog * W/1 (response OR change *))) OR (ABS (blood W/1 (pressure OR circulation))) OR (ABS (muscle * W/1 twitch *)) OR (ABS (skin W/3 flush *)) OR (ABS (development * OR “nervous system” OR inflam * OR consciousness OR seizure)))) AND ((TITLE (indoor OR building * OR workplace *)) OR (TITLE (office * OR occupation * OR profession * OR home * OR house * OR accommodation OR residen * OR dwell * OR tenant * OR nurser *)) OR (TITLE (school * OR schoolchild * OR classroom * OR student * OR pupil * OR college * OR universit *)) OR (TITLE (work W/1 environment *)) OR (TITLE (“day care” W/1 (centre * OR center *)))) |
| 3 | Global Health | TI (CO2 OR “carbon dioxide”) OR SU (CO2 OR “carbon dioxide”) |
| 4 | Global Health | AB (effect * OR symptom * OR health OR impact) OR AB (headache * OR migrain *) OR AB (sleep * OR drows * OR tired * OR fatigue * OR exhaust *) OR AB (respirat * OR asthma * OR breath *) OR AB (lung w1 (function * OR behavio?r)) OR AB (attendance OR absence *) OR AB (neurodevelopmental OR neurolog * OR cognit * OR neurobehavioral OR neurophysiological) OR AB (performance OR “decision making” OR concentrat * OR confusion) OR AB (dizz * OR disorient *) OR AB hypercapnia OR AB (cardiovascular OR heartbeat OR arrhythmia OR “heart rate”) OR AB (depress * OR paranoi * OR anxiety OR anxious OR “panic attack *”) |
| 5 | Global Health | AB (physiolog * n1 (response OR change *)) OR AB (blood w1 (pressure OR circulation)) OR AB muscle * n1 twitch * OR AB skin n3 flush * OR AB (development * OR “nervous system” OR inflam * OR consciousness OR seizure) |
| 6 | Global Health | TI (indoor OR building * OR workplace *) OR TI work n1 environment * OR TI (office * OR occupation * OR profession * OR home * OR house * OR accommodation OR residen * OR dwell * OR tenant * OR nurser *) OR TI (“day care” n1 (centre * OR center *)) OR TI (school * OR schoolchild * OR classroom * OR student * OR pupil * OR college * OR universit *) |
| 7 | Global Health | 4 or 5 |
| 8 | Global Health | 3 and 6 and 7 |
| 9 | Medline | (((toxic *).ti,ab OR ((adverse OR health) ADJ2 effect *).ti,ab OR (“immune response”).ti,ab OR (“serum bicarbonate”).ti,ab OR (“end tidal CO2” OR “end-tidal CO2”).ti,ab OR (Acidosis).ti,ab OR ((“acid-base” OR “acid base”) ADJ1 (disturbance OR alteration)).ti,ab OR (“elevated plasma calcium”).ti,ab OR (inflammation).ti,ab OR (“vascular damage”).ti,ab OR (adaptive ADJ1 (change OR compensation)).ti,ab OR (bone ADJ1 (deminerali?ation OR deposition)).ti,ab OR (“kidney calcification”).ti,ab OR (“Oxidative stress”).ti,ab OR (“Reactive oxygen species”).ti,ab OR (“Endothelial dysfunction”).ti,ab OR ((vulnerable OR sensitive) AND population).ti,ab OR (“CO2 hypersensitivity”).ti,ab OR (“brain development”).ti,ab OR (“impaired learning” OR memory).ti,ab OR (elevat * ADJ2 (corticosterone OR corticosteroid)).ti,ab OR (“growth reduction”).ti,ab OR (“apoptotic activity” AND brain).ti,ab OR (hypercapnia).ti,ab) AND (*”CARBON DIOXIDE”/OR (“Carbon dioxide” OR CO2 OR CO2).ti)) [DT 2000-2020] [Languages English] |
Appendix B
| Source | CO2 Concentration (ppm) | Health Effects/Comments |
|---|---|---|
| Bloch-Salisbury, 2000 | N/A | Lab: High partial pressure of CO2 in arterial blood has no significant effects on cognitive function or alertness. Low partial pressure of CO2 in arterial blood has no significant effects on cognitive function or alertness. |
| Hong et al., 2018 | >1000 | Lab: Statistically significant decreases in task performances observed. |
| Satish et al., 2012 | 1000 | Lab: Moderate and statistically significant reductions were seen for 6 out of 9 markers of decision-making performance relative to 600 ppm. |
| 2500 | Lab: Large and statistically significant reductions were seen for 7 out of 9 of the markers. Two markers, “Focused Activity” and “Information search” did not seem to be significantly affected by changes in CO2 concentration. | |
| Allen et al., 2016 | 945 | Lab: For seven out of nine cognitive function domains, average scores decreased as CO2 concentrations increased. Aggregate cognitive scores dropped by 15%. |
| 1400 | For seven out of nine cognitive function domains, average scores decreased as CO2 concentrations increased. Aggregate cognitive scores dropped by 50%. | |
| Maddalena et al., 2015 | 1800 | Lab: Reduced performances in decision-making tests relative to 900 ppm. |
| Maula et al., 2017 | 540 | Lab: Office workers: High ventilation rate (28.1 l/s/p). No health symptoms were found to office workers. |
| 2260 | Low ventilation rate (2.31 l/s/p). Exposure of office workers had a weak negative effect on performance only in the information retrieval tasks and slightly increased subjective workload and perceived fatigue. No effects on health symptoms were found. | |
| Allen et al., 2019 | 1500 | Lab: Pilot’s odds of passing a manoeuvre was 1.52 times larger when exposed to 1500 ppm rather than 2500 ppm. |
| 2500 | Pilot’s odds of passing a manoeuvre was 1.69 times larger when exposed to 700 ppm rather than 2500 ppm. | |
| Snow et al., 2019 | 830, 2700 | Lab: 31 volunteers; experiment of <60 min; reported no significant association between CO2 concentrations, cognitive performance, academic attainment and quality of work produced. The addition of CO2 may have influenced aspects of cognitive performance only after certain periods. There was absence of clear physiological drivers. |
| Zhang et al., 2016 | 500, 5000 | Lab: 2.5 h exposure to artificially raised CO2 up to 5000 ppm compared to 500 ppm did not cause any significant change in perceived air quality, acute health symptoms or the performance of tasks (typical office work). |
| Zhang et al., 2017 | 1000, 3000 | Lab: 25 subjects were exposed for 255 min to each condition. Subjective ratings, physiological responses and cognitive performance were measured. No statistically significant effects on perceived air quality, acute health symptoms or cognitive performance were seen during exposures when CO2 was added. Exposures to bio-effluents with CO2 at 3000 ppm reduced perceived air quality; increased the intensity of reported headache, fatigue, sleepiness, and difficulty in thinking clearly; and reduced speed of addition, the response time in a redirection task, and the number of correct links made in the cue-utilization test. This suggests that moderate concentrations of bio-effluents, but not pure CO2, will result in deleterious effects on occupants during typical indoor exposures. |
| Zhang et al., 2020 | 1500, 3500, 5000 | Lab: For the subjective mental workload, there were no significant differences at different CO2 conditions. The MATB (Multi-attribute Task Battery) task performance declined significantly when the CO2 concentration increased from 1500 ppm to 3500 ppm, but there was no significant difference between 3500 ppm and 5000 ppm, or 1500 ppm and 5000 ppm. |
| Kajtar and Herczeg, 2012 | 4000 | Lab: Participants struggled with maintaining concentration over the 2–3 h period, reporting high scores on the tiredness scales and showing decreased mental performance. |
| 5000 | Subjects perceived the environment as more unpleasant and exhausting. At 5000 ppm, a small but significant increase in diastolic blood pressure was observed. At 5000 ppm, the majority of subjects experienced greater respiratory frequency and volumes. This indicates that although the work output and quality was not significantly affected by CO2 concentration, more mental effort was required at higher CO2 concentrations. | |
| Lu et al., 2015 | Increase of 100 | Office workers: Not significantly associated with difficulties in concentrating |
| Vehviläinen et al., 2016 | 700–4000 | Office workers: Associated with an elevated CO2 level in transcutaneously assessed pCO2 in blood circulation, elevated CO2 concentrations in tissues, changes in heart rate variation and an increase in peripheral blood circulation. This may be associated with reductions in functional ability. |
| 600–5000 | Amount and quality of work produced by subjects was not significantly impacted by the degree of CO2 concentration. | |
| Gaihre et al., 2014 | 1000 | School children: time-weighted CO2 average was significantly associated with decreased attendance but was not associated with academic attainments. |
| Increase of 100 | Significantly associated with a reduced annual attendance of 0.2%. | |
| Petersen et al., 2016 | 1500 | School children: Associated with decreased numbers of correct answers and increased numbers of errors in four performance tests compared to 900 ppm. |
| Madureira et al., 2009 | 500–1700 | School children: Associated with concentration difficulties. |
| Riham Jaber et al., 2017 | 1000 | School children: Statistically significant decrease in accuracy in performance in all tasks relative to 600 ppm (5.3% errors). |
| 1800 | Statistically significant decrease in accuracy in performance in all tasks relative to 600 ppm (12.16% errors). | |
| Twardella et al., 2012 | 2115 | School children: No significant effect on participants concentration performance or amount of work completed compared to 1045 ppm. However, a significant increase in the total number of errors was observed 1.65 (95% CI 0.42–2.87). |
| Ferreira and Cardoso, 2014 | ~900–2500 | School children: Lack of concentration significantly correlated with CO2 concentrations. |
| Coley et al., 2007 | 2900 | School children: Statistically significant decrease in power of attention of approximately 5% relative to 690 ppm. |
| Hutter et al., 2013 | 350–3000 | School children: Significantly decreased cognitive performance observed. |
| Dorizas et al., 2015 | N/A | School children: 17% increase in indoor CO2 associated with a statistically significant reduction in test performance of 16%. |
| Shendell et al., 2004 | Increase of 1000 dCO2 | School children: 1000 ppm increase above the outdoor concentration was associated with a 0.5–0.9% decrease in annual average daily attendance (ADA) of students, corresponding to a relative 10–20% increase in student absence. Annual ADA was 2% higher in traditional than in portable classrooms. |
| Kolarik et al., 2016 | Increase of 100 dCO2 | School children: Associated with a 2% increase in sick leave (not statistically significant). |
| Source | CO2 Concentration (ppm) | Health Effect |
|---|---|---|
| Shriram et al., 2019 | 2000 | Lab: Statistically significant reduction in forced expiratory volume and forced vital capacity relative to 1000 ppm. |
| 3000 | Statistically significant reduction in forced expiratory volume and forced vital capacity relative to 1000 ppm. A predicted increase in the partial pressure of CO2 in the lungs of 3 mm Hg and a decrease in the partial pressure of O2 of 7 mm Hg. This did not cause a significant reduction in oxygen saturation content in the blood. | |
| Mendell et al., 2015 | 400–800 | Office workers: Not significantly associated with respiratory illnesses and respiratory-illness-related absences, building-related symptoms and dissatisfaction with indoor air quality and odours. However, this may be due to relatively high ventilation rates and low CO2 concentrations. |
| Mohd et al., 2015 | 579–784 | School children: Not significantly associated with decreased lung function or wheezing. |
| Simoni et al., 2010 | >1000 Increase of 100 | School children: Significantly associated with dry cough (OR 2.99, 95% CI 1.65–5.44) and rhinitis (OR 2.07, 95% CI 1.14–3.73). Significantly associated with dry cough (OR 1.06, 95% CI 1.00–1.13) and rhinitis (OR 1.06, 95% CI 1.00– 1.11). |
| Mi et al., 2006 | 500–1900 | Schools: Significantly associated with asthma and need for asthma medication as well as daytime breathlessness. Not significantly associated with wheezing or nocturnal breathlessness. |
| Fraga et al., 2008 | >2100 | School children: Statistically significant association with exercise-induced wheeze (OR = 1.86 (95%CI:1.20–2.89)) and night cough (OR = 1.40 (4.20–2.89)) |
| Ferreira and Cardoso, 2014 a | 984–2942 | School children: Decreased spirometry values. |
| Kim et al., 2011 | 900–4000 | School children: Significantly associated with wheeze (OR = 1.03 (1.001–1.06)), but not with doctor diagnosed asthma (OR = 1.01 (0.97–1.04)). |
| Madureira et al., 2015 | 800–3000 | School children: No clear relationship between CO2 concentration and wheezing, nasal allergy, cough episodes or phlegm episodes. |
| Sa et al., 2019 | 1700–4000 | School children: No significant association with wheezing. |
| Source | CO2 Concentration (ppm) | Health Effect |
|---|---|---|
| Norback et al., 1995 | 850 and 1020 | Home: Significantly associated with nocturnal chest tightness. |
| Hill et al., 1992 | <600 | Office workers: CO2 concentrations had no significant effect on a variety of health outcomes. |
| Tsai et al., 2015 | >800 | Office: Compared with workers exposed to CO2 concentrations of less than 500 ppm, office workers exposed to CO2 concentrations of >800 ppm were more likely to report SBS symptoms: “eye irritation” and “upper respiratory symptoms”, and more specifically, “tired or strained eyes”, “dry, itching, or irritated eyes” and “difficulty in remembering things or in concentrating”. Headache was marginally increased at CO2 levels >800 ppm. Female workers were more likely to report SBS than male workers, and more specifically “eye irritation”, “nonspecific symptoms”, “higher respiratory symptoms” and “skin irritation”. Workers with a history of allergies tended to report more “eye irritation,” “nonspecific symptoms” and “lower respiratory symptoms”. |
| Lu et al., 2015 | 467 to 2800 | Office workers: After controlling for personal and environmental variables, per 100 ppm increase in dCO2 had significant associations with dry throat, tiredness, dizziness and non-specific syndrome, but had a protective association with eye irritation. |
| Erdmann and Apte, 2004 | dCO2 (difference between I/O CO2) increased per 100 ppm | Office workers: Covariate-adjusted odds ratios per 100 ppm increases in dCO2 were statistically significant for dry eyes, sore throat, nose/sinus, sneeze and wheeze symptoms and ranged from 1.1 to 1.2. |
| Muscatiello et al., 2015 | >1000 | School teachers: Non-significantly associated with increased reporting of neuro-physiological (i.e., headache, fatigue, difficulty concentrating) symptoms. |
| Carreiro-Martins et al., 2014 | Median 1440 (1085–1970) | Children in daycare centres. Phase I: exposure of 3186 children (mean age 3.1 ± 1.5 years) to indoor CO2 concentration was associated with reported wheezing in the past 12 months (27.5%) (adjusted odds ratio (OR) for each increase of 200 ppm. Phase I: the association in the subsample of 1196 children seen in 19 out of the initial 45 DCCs was not significant. |
| Chatzidiakou et al., 2014 | Average: 764–1206 Max: 2061 | Schoolchildren: Significantly related to neurological symptoms (headaches, fatigue, malaise) and dissatisfaction with perceived IAQ. Subjective air quality perception was significantly related to indoor environmental conditions such as temperature and CO2 levels, higher concentrations of airborne dust (PM10), exposure to microbial parameters, such as Penicillium spp./Aspergillus spp., cat allergen (Der f 1), and Streptomyces spp. and exposure to high VOC levels, such as formaldehyde and limonene. Prevalence of dermal and mucosal symptoms, often associated with SBS symptoms, were slightly higher in an urban school, while eczema prevalence was slightly higher in a suburban school. |
| Jurado et al., 2014 | ~1400 | Schools: Statistically significant associations with eye irritation, nasal irritation, throat irritation, headaches, difficulties in concentration and fatigue. |
| Norback and Nordstrom, 2008 | Variable, depending on ventilation Reduced air flow: 1030 to 1170 Increased air flow: 1200 to 920 | University room temperatures and CO2 levels were positively associated with different types of SBS symptoms. After mutual adjustment, independent effects of room temperature could be demonstrated, while the associations between CO2 levels and symptoms were reduced and mostly no longer statistically significant. Headache and tiredness were most prevalent; mucous membrane symptoms were less prevalent. |
| Kim et al., 2011 | 900–4000 | Not significantly associated with headaches (OR 1.00, 95% CI 0.97–1.02) or tiredness (OR 1.01, 95% CI 1.00–1.03) |
| Source | CO2 Concentration (ppm) | Health Effect |
|---|---|---|
| Shriram et al., 2019 | 2000 3000 | Lab: Statistically significant reduction in forced expiratory volume and forced vital capacity relative to 1000 ppm. Statistically significant reduction in forced expiratory volume and forced vital capacity relative to 1000 ppm. A predicted increase in the partial pressure of CO2 in the lungs of 3 mm Hg and a decrease in the partial pressure of O2 of 7 mm Hg. This did not cause a significant reduction in oxygen saturation content in the blood. |
| Zhang, Wargocki and Lian [74] | 500, 3000 | Lab: Exposure to 3000 ppm and bio-effluents, by restricting ventilation, significantly increased diastolic blood pressure and salivary α-amylase (biomarker of stress) levels compared to 500 ppm. They only found associations with ETCO2. |
| Zhang et al. (2016) | 500, 5000 | Lab: Compared to CO2 at 500 ppm, 2.5 h exposures to artificially raised CO2 up to 5000 ppm increased ETCO2 slightly more. No other significant changes were seen in the measured physiological responses that included blood pressure, respiration rate and stress biomarkers. |
| Lu et al., 2007 | ~400–1500 | Office: Associated with higher levels of 8-OHdG in urine. Higher levels of 8-OHdG in urine were significantly associated with eye dryness, nose itching, sneezing, dry throat, skin dryness and dizziness. |
| Vehviläinen et al., 2016 | 700–4000 | Office workers: Associated with an elevated CO2 level in transcutaneously assessed pCO2 in blood circulation, elevated CO2 concentrations in tissues, changes in heart rate variation and an increase in peripheral blood circulation, through changes in ventilation rate. |
| Jung et al., 2014 | N/A | Office: CO2 concentrations, the difference in concentration between indoor and outdoor and the ratio of indoor and outdoor CO2 concentrations had a statistically significant association with allostatic load on the neuroendocrine system, with allostatic load on the neuroendocrine system being hypothesised to be related to increased incidence of sick building syndrome. This may provide a mechanism by with CO2 is related to sick building syndrome. |
| MacNaughton et al., 2016 | Increase of 1000 | Office workers: Participants who perceived a lack of air movement would report on average 67% more symptoms each day. The 1000 ppm increase was associated with a 43% increase in reported symptoms per person per day and a 2.3bpm statistically significant increase in heart rate, after accounting for potential confounding factors. |
| Tomoda et al., 1995 | 700–1500 | School: Associated with increases in urinary pH and bicarbonate levels |
| Animal Physiological Responses | |||
|---|---|---|---|
| Source | CO2 Concentration (ppm) | Animal | Health Effect |
| Martrette et al., 2017 | 700 | Young female rats | Lethargy, increased grooming and drinking, changes in muscle composition and increased plasma corticosterone levels. |
| Kiray et al., 2014 | 1000 and 3000 | Postnatal rats | At 1000 and 3000 ppm increased anxiety behaviour, structural changes in the brain, elevated corticosterone levels and reduced insulin-like growth factor 1 levels in the blood and brain. At 3000 ppm spatial learning and memory impaired |
| Schaefer et al., 1979 | 5000 | Guinea pigs | Increase in plasma calcium and kidney calcium content. All values returned to control levels following an 8-week recovery period |
| Schneberger et al., 2017 | 5000 | Mice | Increased expression of inflammatory marker ICAM-1 (intercellular adhesion molecule 1). Co-exposure to CO2 and hog barn dust resulted in a dose-dependent increase in expression of other pro-inflammatory markers |
| Thom et al., 2017 | 1000, 2000 and 4000 | Ex vivo—human and murine neutrophils | At 1000–4000 ppm, increased human and murine neutrophil production of microparticles that contain high levels of Interleukin-1β |
| Thom et al., 2017 | 1000, 2000 and 4000 | Mice | At 2000–4000 ppm, increased neutrophil production of microparticles that contain high levels of Interleukin-1β. Signs of inflammatory vascular damage in various tissues which resolved 13 h post exposure |
| Wade et al., 2000 | 3000 | Rat | At 3000 ppm, decreases in food intake, increased total body sodium and reduced adrenal mass |
References
- Lu, T.; Knuutila, A.; Viljanen, M.; Lu, X. A novel methodology for estimating space air change rates and occupant CO2 generation rates from measurements in mechanically-ventilated buildings. Build. Environ. 2010, 45, 1161–1172. [Google Scholar] [CrossRef] [Green Version]
- Persily, A.; Emmerich, S. Indoor Air Quality in Sustainable, Energy Efficient Buildings. HVAC&R Res. 2011, 18. [Google Scholar] [CrossRef]
- Shriram, S.; Ramamurthy, K.; Ramakrishnan, S. Effect of occupant-induced indoor CO2 concentration and bioeffluents on human physiology using a spirometric test. Build. Environ. 2019, 149, 58–67. [Google Scholar] [CrossRef]
- Seppänen, O.A.; Fisk, W.J. Summary of human responses to ventilation. Indoor Air 2004, 14 (Suppl. 7), 102–118. [Google Scholar] [CrossRef] [PubMed] [Green Version]
- Goromosov, M.S. The Physiological Basis of Health Standards for Dwellings; World Health Organization: Geneva, Switzerland, 1968. [Google Scholar]
- Eliseeva, O.V. On the determination of maximum permissible carbon dioxide concentrations in the air of apartment buildings and public buildings. Gig. Sanit. 1964, 29, 10–15. [Google Scholar] [PubMed]
- NOAA. Climate Change: Atmospheric Carbon Dioxide. Available online: https://www.climate.gov/news-features/understanding-climate/climate-change-atmospheric-carbon-dioxide (accessed on 1 December 2020).
- CIBSE. KSI7 Indoor Air Quality and Ventilation; Chartered Institution of Building Services Engineers, October 2011; ISBN 9781906846190. Available online: https://www.cibse.org/knowledge/knowledge-items/detail?id=a0q20000008I7gSAAS (accessed on 1 November 2021).
- BB101—Department for Education (DfE). Guidelines on Ventilation, Thermal Comfort and Indoor Air Quality in Schools, UK. 2018. Available online: https://www.gov.uk/government/publications/building-bulletin-101-ventilation-for-school-buildings (accessed on 1 September 2021).
- British Standard. BS EN 16798-1:2019—Energy Performance of Buildings—Ventilation for Buildings—Part 1: Indoor Environmental Input Parameters for Design and Assessment of Energy Performance of Buildings Addressing Indoor Air Quality, Thermal Environment, Lighting and Acoustics—Module M1-6; BSI: London, UK, 2019; ISBN 978 0 580 85868 0. Available online: https://0-shop-bsigroup-com.brum.beds.ac.uk/products/energy-performance-of-buildings-ventilation-for-buildings-indoor-environmental-input-parameters-for-design-and-assessment-of-energy-performance-of-buildings-addressing-indoor-air-quality-thermal-environment-lighting-and-acoustics-module (accessed on 1 November 2021).
- Langford, N.J. Carbon dioxide poisoning. Toxicol. Rev. 2005, 24, 229–235. [Google Scholar] [CrossRef]
- PHE. Carbon Dioxide: Health Effects and Incident Management. Available online: https://www.gov.uk/government/publications/carbon-dioxide-properties-and-incident-management (accessed on 2 September 2021).
- Klepeis, N.E.; Nelson, W.C.; Ott, W.R.; Robinson, J.P.; Tsang, A.M.; Switzer, P.; Behar, J.V.; Hern, S.C.; Engelmann, W.H. The National Human Activity Pattern Survey (NHAPS): A resource for assessing exposure to environmental pollutants. J. Expo. Anal. Environ. Epidemiol. 2001, 11, 231–252. [Google Scholar] [CrossRef] [Green Version]
- Azuma, K.; Kagi, N.; Yanagi, U.; Osawa, H. Effects of low-level inhalation exposure to carbon dioxide in indoor environments: A short review on human health and psychomotor performance. Environ. Int. 2018, 121, 51–56. [Google Scholar] [CrossRef]
- Du, B.; Tandoc, M.C.; Mack, M.L.; Siegel, J.A. Indoor CO2 concentrations and cognitive function: A critical review. Indoor Air 2020, 30, 1067–1082. [Google Scholar] [CrossRef]
- Jacobson, T.A.; Kler, J.S.; Hernke, M.T.; Braun, R.K.; Meyer, K.C.; Funk, W.E. Direct human health risks of increased atmospheric carbon dioxide. Nat. Sustain. 2019, 2, 691–701. [Google Scholar] [CrossRef]
- Seppänen, O.A.; Fisk, W.J.; Mendell, M.J. Association of ventilation rates and CO2 concentrations with health and other responses in commercial and institutional buildings. Indoor Air 1999, 9, 226–252. [Google Scholar] [CrossRef] [PubMed]
- Ahola, M.; Säteri, J.; Sariola, L. Revised Finnish classification of indoor climate 2018. E3S Web Conf. 2019, 111, 6. [Google Scholar] [CrossRef] [Green Version]
- WELL. WELL Building Standard v1 with May 2016 Addenda. Available online: https://resources.wellcertified.com/articles/well-building-standard-v1-addenda-update-may-2016/ (accessed on 2 September 2021).
- HKSAR-Indoor Air Quality Management Group. A Guide on Indoor Air Quality Certification Scheme for Offices and Public Places; The Government of the Hong Kong Special Administrative Region. Available online: https://www.iaq.gov.hk/media/65346/new-iaq-guide_eng.pdf (accessed on 2 September 2021).
- BREEAM. In-Use International Commercial Technical Manual V6; Building Research Establishment; Available online: https://www.breeam.com/discover/technical-standards/breeam-in-use/ (accessed on 2 September 2021).
- U.S. Environmental Protection Agency (USEPA). EPA Facilities Manual: Volume 2 Arcitecture and Engineering Guidelines. 2020. Available online: https://www.epa.gov/sites/production/files/2018-03/documents/ae_guidelines_508.pdf (accessed on 17 December 2020).
- Hao, J.; Zhu, T.; Fan, X. Indoor Air Pollution and Its Control in China. Indoor Air Pollut. 2018, 64, 145–170. [Google Scholar] [CrossRef]
- Federal Environment Agency (UBA). Guidelines for Indoor Air Hygiene in School Buildings; Federal Environment Agency (UBA): Berlin, Germany, 2008. Available online: https://www.umweltbundesamt.de/sites/default/files/medien/publikation/long/4113.pdf (accessed on 1 December 2020).
- SAIQG. Guidelines for Good Indoor Air Quality in Office Premises; Institute of Environmental Epidemiology Ministry of the Environment: Singapore, 1996. Available online: https://www.bca.gov.sg/greenmark/others/NEA_Office_IAQ_Guidelines.pdf (accessed on 2 September 2021).
- KOSHA. Guideline Development for Evaluation and Management of Office Air Quality(II); Reported in Jeong, J.Y. Recently Issues on Indoor Air Quality in Korea 2006; Korea Occupational Safety and Health Agency, 2005; Available online: http://www.zyaura.com/quality/Archives/Recently%20issues%20on%20Indoor%20air%20quality%20in%20Korea%5B1%5D.pdf (accessed on 1 December 2020).
- Department of Occupational Safety and Health Ministry of Human Resources Malaysia. Industry Code of Practice on Indoor Air Quality 2010. Available online: https://www.dosh.gov.my/index.php/chemical-management-v/indoor-air-quality (accessed on 17 December 2020).
- US Green Building Council. LEED v4.1 Building Operations and Maintenance; 2019; Available online: https://www.usgbc.org/leed (accessed on 1 November 2021).
- ANSI/ASHRAE 62.1-2019. Vntilation for Acceptable Indoor Air Quality. American Society of Heating, Refrigerating and Air-Conditioning Engineers. 2019. Available online: https://www.ashrae.org/technical-resources/standards-and-guidelines/read-only-versions-of-ashrae-standards (accessed on 2 September 2021).
- NCCEH. Carbon Dioxide in Indoor Air; National Collaborating Centres for Public Health: Canada, 2010; Available online: https://ncceh.ca/documents/practice-scenario/carbon-dioxide-indoor-air (accessed on 2 September 2021).
- SAÚDE E AMBIENTE E AÇÃO CLIMÁTICA Portaria n.º 138-G/2021 (Diário da República, 1.ª Série, Ministry of Health, Portugal, 2021). Available online: https://dre.pt/dre/analise-juridica/portaria/138-g-2021-166296490 (accessed on 1 November 2021).
- HSE. EH40/2005 Workplace Exposure Limits; Health and Safety Executive: UK, 2005; ISBN 9780717667031. Available online: https://www.hse.gov.uk/pubns/priced/eh40.pdf (accessed on 2 September 2021).
- NOHSC. Adopted National Exposure Standards for Atmospheric Contaminants in the Occupational Environment; National Occupational Health and Safety Commission: Australia, 1995. Available online: https://www.safeworkaustralia.gov.au/system/files/documents/1702/adoptednationalexposurestandardsatmosphericcontaminants_nohsc1003-1995_pdf.pdf (accessed on 2 September 2021).
- NIOSH. Carbon Dioxide; National Institute for Occupational Safety and Health: USA, 2019. Available online: https://www.cdc.gov/niosh/npg/npgd0103.html (accessed on 4 January 2021).
- Permanent Senate Commission for the Investigation of Health Hazards of Chemical Compounds in the Work Area. List of MAK and BAT Values Report No. 50; Wiley: Germany, 2014. [Google Scholar]
- Dorizas, P.V.; Assimakopoulos, M.N.; Santamouris, M. A holistic approach for the assessment of the indoor environmental quality, student productivity, and energy consumption in primary schools. Environ. Monit. Assess. 2015, 187, 1–18. [Google Scholar] [CrossRef]
- Maddalena, R.; Mendell, M.J.; Eliseeva, K.; Chan, W.R.; Sullivan, D.P.; Russell, M.; Satish, U.; Fisk, W.J. Effects of ventilation rate per person and per floor area on perceived air quality, sick building syndrome symptoms, and decision-making. Indoor Air 2015, 25, 362–370. [Google Scholar] [CrossRef]
- Allen, J.G.; MacNaughton, P.; Satish, U.; Santanam, S.; Vallarino, J.; Spengler, J.D. Associations of Cognitive Function Scores with Carbon Dioxide, Ventilation, and Volatile Organic Compound Exposures in Office Workers: A Controlled Exposure Study of Green and Conventional Office Environments. Environ. Health Perspect 2016, 124, 805–812. [Google Scholar] [CrossRef] [PubMed] [Green Version]
- Allen, J.G.; MacNaughton, P.; Cedeno-Laurent, J.G.; Cao, X.; Flanigan, S.; Vallarino, J.; Rueda, F.; Donnelly-McLay, D.; Spengler, J.D. Airplane pilot flight performance on 21 maneuvers in a flight simulator under varying carbon dioxide concentrations. J. Expo. Sci. Environ. Epidemiol. 2019, 29, 457–468. [Google Scholar] [CrossRef] [PubMed]
- Hong, T.; Kim, J.; Lee, M. Integrated task performance score for the building occupants based on the CO2 concentration and indoor climate factors changes. Appl. Energy 2018, 228, 1707–1713. [Google Scholar] [CrossRef]
- Hutter, H.P.; Haluza, D.; Piegler, K.; Hohenblum, P.; Frohlich, M.; Scharf, S.; Uhl, M.; Damberger, B.; Tappler, P.; Kundi, M.; et al. Semivolatile compounds in schools and their influence on cognitive performance of children. Int. J. Occup. Med. Environ. Health 2013, 26, 628–635. [Google Scholar] [CrossRef]
- Petersen, S.; Jensen, K.L.; Pedersen, A.L.S.; Rasmussen, H.S. The effect of increased classroom ventilation rate indicated by reduced CO2 concentration on the performance of schoolwork by children. Indoor Air 2016, 26, 366–379. [Google Scholar] [CrossRef]
- Jaber, A.R.; Mumovic, D.; Ucci, M. The Effect of Indoor Temperature and CO2 Levels on Cognitive Performance of Adult Females in a University Building in Saudi Arabia. Energy Procedia 2017, 122, 451–456. [Google Scholar] [CrossRef]
- Satish, U.; Mendell, M.J.; Shekhar, K.; Hotchi, T.; Sullivan, D.; Streufert, S.; Fisk, W.J. Is CO2 an indoor pollutant? direct effects of low-to-moderate CO2 concentrations on human decision-making performance. Environ. Health Perspect. 2012, 120, 1671–1677. [Google Scholar] [CrossRef] [PubMed] [Green Version]
- Twardella, D.; Spegel, H.; Hendrowarsito, L.; Matzen, W.; Fromme, H.; Lahrz, T.; Burghardt, R.; Frenzel, A.C. Effect of classroom air quality on students’ concentration: Results of a cluster-randomized cross-over experimental study. Indoor Air 2012, 22, 378–387. [Google Scholar] [CrossRef] [PubMed]
- Gaihre, S.; Semple, S.; Miller, J.; Fielding, S.; Turner, S. Classroom carbon dioxide concentration, school attendance, and educational attainment. J. Sch. Health 2014, 84, 569–574. [Google Scholar] [CrossRef]
- Kolarik, B.; Moller, E.; Brauner, E.V.; Andersen, Z.J.; Ibfelt, T.; Engelund, E.H. Ventilation in day care centers and sick leave among nursery children. Indoor Air 2016, 26, 157–167. [Google Scholar] [CrossRef] [PubMed]
- Shendell, D.G.; Prill, R.; Fisk, W.J.; Apte, M.G.; Blake, D.; Faulkner, D. Associations between classroom CO2 concentrations and student attendance in Washington and Idaho. Indoor Air 2004, 14, 333–341. [Google Scholar] [CrossRef]
- Bloch-Salisbury, E.; Lansing, R.; Shea, A.S. Acute changes in carbon dioxide levels alter the electroencephalogram without affecting cognitive function. Psychophysiology 2000, 37, 418–426. [Google Scholar] [CrossRef]
- Kajtár, L.; Herczeg, L. Influence of carbon-dioxide concentration on human well-being and intensity of mental work. Időjárás 2012, 116, 145–169. [Google Scholar]
- Snow, S.; Boyson, A.S.; Paas, K.H.W.; Gough, H.; King, M.-F.; Barlow, J.; Noakes, C.J.; Schraefel, M.C. Exploring the physiological, neurophysiological and cognitive performance effects of elevated carbon dioxide concentrations indoors. Build. Environ. 2019, 156, 243–252. [Google Scholar] [CrossRef]
- Zhang, X.; Wargocki, P.; Lian, Z. Human responses to carbon dioxide, a follow-up study at recommended exposure limits in non-industrial environments. Build. Environ. 2016, 100, 162–171. [Google Scholar] [CrossRef] [Green Version]
- Maula, H.; Hongisto, V.; Naatula, V.; Haapakangas, A.; Koskela, H. The effect of low ventilation rate with elevated bioeffluent concentration on work performance, perceived indoor air quality, and health symptoms. Indoor Air 2017, 27, 1141–1153. [Google Scholar] [CrossRef] [PubMed]
- Coley, D.A.; Greeves, R.; Saxby, B.K. The effect of low ventilation rates on the cognitive function of a primary school class. Int. J. Vent. 2007, 6, 107–112. [Google Scholar] [CrossRef]
- Ferreira, A.M.; Cardoso, M. Indoor air quality and health in schools. J. Bras. Pneumol. Publicacao Soc. Bras. Pneumol. Tisilogia 2014, 40, 259–268. [Google Scholar] [CrossRef] [Green Version]
- Madureira, J.; Alvim-Ferraz, M.C.M.; Rodrigues, S.; Goncalves, C.; Azevedo, M.C.; Pinto, E.; Mayan, O. Indoor air quality in schools and health symptoms among portuguese teachers. Hum. Ecol. Risk Assess. 2009, 15, 159–169. [Google Scholar] [CrossRef]
- Lu, C.Y.; Lin, J.M.; Chen, Y.Y.; Chen, Y.C. Building-related symptoms among office employees associated with indoor carbon dioxide and total volatile organic compounds. Int. J. Environ. Res. Public Health 2015, 12, 5833–5845. [Google Scholar] [CrossRef]
- Vehviläinen, T.; Lindholm, H.; Rintamäki, H.; Pääkkönen, R.; Hirvonen, A.; Niemi, O.; Vinha, J. High indoor CO2 concentrations in an office environment increases the transcutaneous CO2 level and sleepiness during cognitive work. J. Occup. Environ. Hyg. 2016, 13, 19–29. [Google Scholar] [CrossRef]
- Zhang, X.; Wargocki, P.; Lian, Z. Physiological responses during exposure to carbon dioxide and bioeffluents at levels typically occurring indoors. Indoor Air 2017, 27, 65–77. [Google Scholar] [CrossRef] [Green Version]
- Zhang, J.; Pang, L.; Cao, X.; Wanyan, X.; Wang, X.; Liang, J.; Zhang, L. The effects of elevated carbon dioxide concentration and mental workload on task performance in an enclosed environmental chamber. Build. Environ. 2020, 178, 106938. [Google Scholar] [CrossRef]
- Gall, E.T.; Mishra, A.K.; Li, J.; Schiavon, S.; Laguerre, A. Impact of Cognitive Tasks on CO2 and Isoprene Emissions from Humans. Environ. Sci. Technol. 2021, 55, 139–148. [Google Scholar] [CrossRef] [PubMed]
- Fraga, S.; Ramos, E.; Barros, H.; Martins, A.; Samudio, M.J.; Silva, G.; Fernandes, E.O.; Guedes, J. Qualidade do ar interior e sintomas respiratorios em escolas do Porto—Indoor air quality and respiratory symptoms in Porto schools. Rev. Port. Pneumol. 2008, 14, 487–507. [Google Scholar] [CrossRef] [Green Version]
- Kim, J.L.; Toren, K.; Elfman, L.; Wieslander, G.; Norback, D.; Ferm, M. Respiratory health among Korean pupils in relation to home, school and outdoor environment. J. Korean Med. Sci. 2011, 26, 166–173. [Google Scholar] [CrossRef] [Green Version]
- Madureira, J.; Paciencia, I.; Rufo, J.; de Oliveira Fernandes, E.; Ramos, E.; Barros, H.; Teixeira, J.P. Indoor air quality in schools and its relationship with children’s respiratory symptoms. Atmos. Environ. 2015, 118, 145–156. [Google Scholar] [CrossRef] [Green Version]
- Mi, Y.H.; Norbäck, D.; Tao, J.; Mi, Y.L.; Ferm, M. Current asthma and respiratory symptoms among pupils in Shanghai, China: Influence of building ventilation, nitrogen dioxide, ozone, and formaldehyde in classrooms. Indoor Air 2006, 16, 454–464. [Google Scholar] [CrossRef]
- Mohd Nor Rawi, N.A.; Jalaludin, J.; Chua, P.C. Indoor air quality and respiratory health among malay preschool children in Selangor. BioMed Res. Int. 2015, 2015, 248178. [Google Scholar] [CrossRef] [PubMed]
- Sá, J.P.; Branco, P.T.B.S.; Alvim-Ferraz, M.C.M.; Martins, F.G.; Sousa, S.I.V. Children’s exposure to indoor air in schools: Impact on wheezing. WIT Trans. Ecol. Environ. 2019, 236, 205–212. [Google Scholar] [CrossRef] [Green Version]
- Norbäck, D.; Nordström, K. Sick building syndrome in relation to air exchange rate, CO2, room temperature and relative air humidity in university computer classrooms: An experimental study. Int. Arch. Occup. Environ. Health 2008, 82, 21–30. [Google Scholar] [CrossRef] [PubMed]
- Simoni, M.; Viegi, G.; Cancianie, M.; Sestini, P.; Annesi-Maesano, I.; Sigsgaard, T.; Norback, D.; Wieslander, G.; Nystad, W. School air quality related to dry cough, rhinitis and nasal patency in children. Eur. Respir. J. 2010, 35, 742–749. [Google Scholar] [CrossRef]
- Mendell, M.J.; Eliseeva, E.A.; Spears, M.; Chan, W.R.; Cohn, S.; Sullivan, D.P.; Fisk, W.J. A longitudinal study of ventilation rates in California office buildings and self-reported occupant outcomes including respiratory illness absence. Build. Environ. 2015, 92, 292–304. [Google Scholar] [CrossRef] [Green Version]
- Erdmann, C.A.; Apte, M.G. Mucous membrane and lower respiratory building related symptoms in relation to indoor carbon dioxide concentrations in the 100-building BASE dataset. Indoor Air Suppl. 2004, 14, 127–134. [Google Scholar] [CrossRef]
- Chatzidiakou, L.; Mumovic, D.; Summerfield, A.J.; Hong, S.M.; Altamirano-Medina, H. A Victorian school and a low carbon designed school: Comparison of indoor air quality, energy performance, and student health. Indoor Built Environ. 2014, 23, 417–432. [Google Scholar] [CrossRef]
- Jurado, S.R.; Bankoff, A.D.P.; Sanchez, A. Indoor air quality in Brazilian universities. Int. J. Environ. Res. Public Health 2014, 11, 7081–7093. [Google Scholar] [CrossRef] [PubMed] [Green Version]
- MacNaughton, P.; Spengler, J.; Vallarino, J.; Santanam, S.; Satish, U.; Allen, J. Environmental perceptions and health before and after relocation to a green building. Build. Environ. 2016, 104, 138–144. [Google Scholar] [CrossRef] [PubMed] [Green Version]
- Tsai, D.H.; Lin, J.S.; Chan, C.C. Office workers’ sick building syndrome and indoor carbon dioxide concentrations. J. Occup. Environ. Hyg. 2012, 9, 345–351. [Google Scholar] [CrossRef] [PubMed]
- Ferreira, A.M.; Cardoso, S.M. Effects of Indoor Air Quality on Respiratory Function of Children in the 1st Cycle of Basic Education of Coimbra. In Occupational Safety and Hygiene II; CRC Press: Boca Raton, FL, USA, 2014; pp. 347–350. ISBN 9780429227349. Available online: https://www.taylorfrancis.com/chapters/edit/10.1201/b16490-63/effects-indoor-air-quality-respiratory-function-children-1st-cycle-basic-education-coimbra-portugal-ferreira-cardos (accessed on 2 September 2021).
- Hill, B.A.; Craft, B.F.; Burkart, J.A. Carbon dioxide, particulates, and subjective human responses in office buildings without histories of indoor air quality problems. Appl. Occup. Environ. Hyg. 1992, 7, 101–111. [Google Scholar] [CrossRef]
- Carreiro-Martins, P.; Viegas, J.; Papoila, A.L.; Aelenei, D.; Caires, I.; Araújo-Martins, J.; Gaspar-Marques, J.; Cano, M.M.; Mendes, A.S.; Virella, D.; et al. CO2 concentration in day care centres is related to wheezing in attending children. Eur. J. Pediatrics 2014, 173, 1041–1049. [Google Scholar] [CrossRef] [PubMed]
- Jung, C.-C.; Liang, H.-H.; Lee, H.-L.; Hsu, N.-Y.; Su, H.-J. Allostatic Load Model Associated with Indoor Environmental Quality and Sick Building Syndrome among Office Workers. PLoS ONE 2014, 9, e95791. [Google Scholar]
- Lu, C.Y.; Ma, Y.C.; Lin, J.M.; Li, C.Y.; Lin, R.S.; Sung, F.C. Oxidative stress associated with indoor air pollution and sick building syndrome-related symptoms among office workers in Taiwan. Inhal. Toxicol. 2007, 19, 57–65. [Google Scholar] [CrossRef]
- Tomoda, A.; Yamanaka, S.; Kawai, H.; Itoh, H.; Katsumata, M.; Minami, M.; Hashimoto, T.; Tanii, H.; Hashimoto, K. Variation of urinary pH and bicarbonate concentrations of students in metropolitan and rural areas of Japan. Arch. Environ. Health 1995, 50, 457–461. [Google Scholar] [CrossRef]
- Terleph, T.A.; Klein, R.G.; Roberson-Nay, R.; Mannuzza, S.; Moulton, J.L., 3rd; Woldehawariat, G.; Guardino, M.; Pine, D.S. Stress responsivity and HPA axis activity in juveniles: Results from a home-based CO2 inhalation study. Am. J. Psychiatry 2006, 163, 738–740. [Google Scholar] [CrossRef]
- Thom, S.R.; Bhopale, V.M.; Hu, J.; Yang, M. Increased carbon dioxide levels stimulate neutrophils to produce microparticles and activate the nucleotide-binding domain-like receptor 3 inflammasome. Free Radic. Biol. Med. 2017, 106, 406–416. [Google Scholar] [CrossRef] [Green Version]
- Thom, S.R.; Bhopale, V.M.; Hu, J.; Yang, M. Inflammatory responses to acute elevations of carbon dioxide in mice. J. Appl. Physiol. 2017, 123, 297–302. [Google Scholar] [CrossRef] [PubMed] [Green Version]
- Schneberger, D.; DeVasure, J.M.; Bailey, K.L.; Romberger, D.J.; Wyatt, T.A. Effect of low-level CO2 on innate inflammatory protein response to organic dust from swine confinement barns. J. Occup. Med. Toxicol. 2017, 12, 9. [Google Scholar] [CrossRef] [PubMed] [Green Version]
- Wade, C.E.; Wang, T.J.; Lang, K.C.; Corbin, B.J.; Steele, M.K. Rat growth, body composition, and renal function during 30 days increased ambient CO2 exposure. Aviat. Space Environ. Med. 2000, 71, 599–609. [Google Scholar] [PubMed]
- Martrette, J.M.; Egloff, C.; Clement, C.; Yasukawa, K.; Thornton, S.N.; Trabalon, M. Effects of prolonged exposure to CO2 on behaviour, hormone secretion and respiratory muscles in young female rats. Physiol. Behav. 2017, 177, 257–262. [Google Scholar] [CrossRef] [PubMed]
- Schaefer, K.E.; Douglas, W.H.J.; Messier, A.A.; Shea, M.L.; Gohman, P.A. Effect of Prolonged Exposure to 0.5-Percent CO2 on Kidney Calcification and Ultrastructure of Lungs. Undersea Biomed. Res. 1979, 6, S155–S161. [Google Scholar] [PubMed]
- Kiray, M.; Sisman, A.R.; Camsari, U.M.; Evren, M.; Dayi, A.; Baykara, B.; Aksu, I.; Ates, M.; Uysal, N. Effects of carbon dioxide exposure on early brain development in rats. Biotech. Histochem. 2014, 89, 371–383. [Google Scholar] [CrossRef]
- Norback, D.; Bjornsson, E.; Janson, C.; Widstrom, J.; Boman, G. Asthmatic symptoms and volatile organic compounds, formaldehyde, and carbon dioxide in dwellings. Occup. Environ. Med. 1995, 52, 388–395. [Google Scholar] [CrossRef]
- Muscatiello, N.; McCarthy, A.; Kielb, C.; Hsu, W.H.; Hwang, S.A.; Lin, S. Classroom conditions and CO2 concentrations and teacher health symptom reporting in 10 New York State Schools. Indoor Air 2015, 25, 157–167. [Google Scholar] [CrossRef]
- Lu, C.Y.; Ma, Y.C.; Lin, J.M.; Sung, F.C.; Chuang, C.Y. Oxidative DNA damage estimated by urinary 8-hydroxydeoxyguanosine and indoor air pollution among non-smoking office employees. Environ. Res. 2007, 103, 331–337. [Google Scholar] [CrossRef]
- Apte, M.G. Associations between indoor CO2 concentrations and sick building syndrome symptoms in U.S. office buildings: An analysis of the 1994–1996 BASE study data. Indoor Air 2000, 10, 246–257. [Google Scholar] [CrossRef] [Green Version]


| CO2 Guideline Concentration (ppm) | Country | Standard | Year | Description |
|---|---|---|---|---|
| 750 | Finland | Revised Finnish classification of indoor environment, Society of Indoor Air Quality and Climate (FISIAQ [18]) | 2018 | Best quality, highest occupant satisfaction (S1 target value, <350 above outdoor level) |
| 800 | International | WELL Building Standard [19] | 2016 | (non-residential) |
| Hong Kong | HKSAR-Indoor Air Quality Management Group [20] | 2019 | 8 h average (excellent class) (non-residential) | |
| 950 | Finland | Revised Finnish classification of indoor environment, Society of Indoor Air Quality and Climate (FISIAQ [18]) | 2018 | Good indoor air quality (S2 target value, <550 above outdoor level) |
| 950 | International | BREEAM (Building Research Establishment Environmental Assessment Method) [21] | 2019 | High indoor air quality (non-residential) |
| 1000 | UK | British Standard (BS EN 16798-1:2019) [10] | 2019 | Good indoor air quality (residential and non-residential) |
| UK | BB101—Department for Education (DfE [9]) | 2018 | Good IAQ (schools) | |
| US | US EPA Facilities Manual Vol 2: Architecture and Engineering Guidelines [22] | 2020 | 8 h average | |
| China | GB/T 18883-2002, Indoor air quality standard. Standards Press of China [23] | 2002 | 24 h average (0.1% CO2 = 1000 ppm) | |
| Hong Kong | HKSAR-Indoor Air Quality Management Group [20] | 2005 | 8 h average (good class) | |
| Germany | Federal Environment Agency (UBA) [24] | 2008 | Hygienically safe | |
| Singapore | Singapore Institute of Environmental Epidemiology (SAIQG) [25] | 1996 | 8 h average | |
| Korea | Korea Occupational Safety and Health Agency (KOSHA), Guideline development for evaluation and management of office air quality (II) [26] | 2005 | 8 h average (office) | |
| Malaysia | Industry COP on IAQ Malaysia (DOSHM) [27] | 2010 | 8 h average | |
| 1030 | International | US Green Building Council (USGBC)—Leadership in Energy and Environmental Design (LEED) [28] | 2010 | |
| 1100 | ASHRAE | ANSI/ASHRAE 62.1-2019. Ventilation for acceptable indoor air quality [29] | 2019 | Acceptable (no greater about 700 ppm above outdoor levels) |
| 1100 | Canada | National Collaborating Centres for Public Health (NCCEH) [30] | 2019 | A surrogate for human comfort (odour) but not considered a health risk |
| 1200 | Finland | Revised Finnish classification of indoor environment, Society of Indoor Air Quality and Climate (FISIAQ [18]) | 2018 | Acceptable (S3 target value, <800 above outdoor) |
| UK | BB101—Department for Education (DfE [9]) | 2018 | Acceptable (schools) | |
| UK | British Standard (BS EN 16798-1:2019) [10] | 2019 | Medium indoor air quality | |
| International | BREEAM (Building Research Establishment Environmental Assessment Method) [21] | 2019 | Medium indoor air quality (non-residential) | |
| 1250 | Portugal | SAÚDE E AMBIENTE E AÇÃO CLIMÁTICA Portaria n.º 138-G/2021 (Diário da República, 1.ª série, 2021) [31] | 2021 | Protection threshold and tolerance margin (commercial buildings) |
| 1500 | UK | BB101—Department for Education (DfE [9]) | 2018 | Acceptable max (schools) |
| 1750 | UK | BB101—Department for Education (DfE [9]) | 2018 | Need for additional ventilation (schools) |
| UK | British Standard (BS EN 16798-1:2019) [10] | 2019 | Poor indoor air quality (residential and non-residential) | |
| International | BREEAM (Building Research Establishment Environmental Assessment Method) [21] | 2020 | Moderate or low indoor air quality (non-residential) | |
| 1000–2000 | Germany | Federal Environment Agency (UBA) [24] | 2008 | Hygienically noticeable |
| >2000 | Germany | Federal Environment Agency (UBA) [24] | 2008 | Hygienically unacceptable |
| 2800 | UK | BB101—Department for Education (DfE [9]) | 2018 | (schools) |
| 5000 | UK | HSE EH40/2005 Workplace exposure limits [32] | 2018 | Permissible exposure limit 8 h time (workplaces) |
| Australia | National Occupational Health and Safety Commission (NOHSC) [33] | 1995 | 8 h average working day (workplaces) | |
| International | Chartered Institute of Building Service Engineers (CIBSE) KS17 [8] | 2011 | 8 h time-weighted average | |
| US | National Institute for Occupational Safety and Health (NIOSH) [34] | 2019 | ||
| Germany | Commission for the Investigation of Health Hazards of Chemical Compounds in the Work Area (MAK) [35] | 2014 | 8 h average |
| Test Subjects | ||||||||||||||
|---|---|---|---|---|---|---|---|---|---|---|---|---|---|---|
| Source | Study Type | CO2 Levels (ppm) | T | RH | N | IAP | V | HB | Li | Prior Health of Participants | Cross-Over Effects | Duration of Measurement | Certainty in Measured CO2 Data | Statistically Significant Effects Reported |
| Cognitive performance studies | ||||||||||||||
| Bloch-Salisbury et al. [49] | L | N/A | ~ | ~ | ~ | ✓ | ✓ | ✓ | ~ | ✓ | ✓ | N/A | N/A | ✕ |
| Hong et al. [40] | L | >1000 | ✓ | ✓ | ~ | ~ | ✓ | ~ | ~ | ✓ | ✕ | ✓ | ✓ | ✓ |
| Satish et al. [44] | L | 1000, 2500 | ✓ | ✓ | ~ | ~ | ✓ | ✕ | ~ | ~ | ~ | N/A | ✓ | ✓ |
| Allen et al. [38] | L | 945, 1400 | ✓ | ✓ | ✓ | ~ | ✓ | ✕ | ✓ | ✓ | N/A | N/A | ✓ | ✓ |
| Maddalena et al. [37] | L | 1800 | ✓ | ✓ | ✓ | ✓ | ✕ | ✕ | ✓ | ✓ | ✕ | N/A | ~ | ✓ |
| Maula et al. [53] | L | 540, 2260 | ✓ | ✕ | ~ | ✓ | ✓ | ✓ | ~ | ✓ | ✓ | N/A | ✓ | ✓ |
| Allen et al. [39] | L | 1500, 2500 | ✓ | ✓ | ~ | ~ | ✓ | ~ | ~ | ~ | ✕ | N/A | ✓ | ~ |
| Snow et al. [51] | L | 830, 2700 | ✓ | ✓ | ~ | ~ | ✓ | ~ | ~ | ~ | ~ | N/A | ✓ | ✕ |
| Zhang et al. [52] | L | 500, 5000 | ✓ | ✓ | ✓ | ✓ | ✓ | ✓ | ✓ | ✓ | ~ | ✓ | ✓ | ✕ |
| Zhang et al. [59] | L | 1000, 3000 | ✓ | ✓ | ✓ | ✓ | ✓ | ✓ | ✓ | ✓ | ✓ | ✓ | ✓ | ✕ |
| Zhang et al. [60] | L | 1500, 3500, 5000 | ✓ | ✓ | ✓ | ✓ | ✓ | ✓ | ✓ | ~ | ✓ | N/A | ✓ | ✕ |
| Kajtár and Herczeg [50] | L | 4000, 5000 | ✓ | ✓ | ✓ | ✓ | ✓ | ✓ | ✓ | ✕ | ✕ | N/A | ✓ | ~ |
| Lu et al. [57] | O | Increase of 100 | ✕ | ✕ | ✕ | ✕ | ✕ | ✕ | ✕ | ~ | N/A | ✓ | ✓ | ✓ |
| Vehviläinen et al. [58] | O | 700–4000 | ✕ | ✕ | ✕ | ✕ | ✓ | ✕ | ✕ | ~ | N/A | ✓ | ✓ | ✓ |
| Gaihre et al. [46] | S | 1000 | ✓ | ✓ | ✕ | ✕ | ✕ | ✕ | ✕ | ~ | N/A | ✓ | ✓ | ✓ |
| Petersen et al. [42] | S | 1500 | ✕ | ✕ | ✕ | ✕ | ✓ | ✕ | ✕ | ✕ | ✓ | ✓ | ✓ | ✓ |
| Madureira et al. [56] | S | 500–1700 | ✕ | ✕ | ✕ | ✕ | ✕ | ✕ | ✕ | ✓ | N/A | ~ | ✓ | ✓ |
| Jaber et al. [43] | S | 1000, 1800 | ✓ | ✓ | ✓ | ✕ | ✕ | ✕ | ✓ | ✕ | ~ | N/A | ✓ | ✓ |
| Twardella et al. [45] | S | 2115 | ✕ | ✕ | ✕ | ✕ | ✓ | ✕ | ✕ | ~ | N/A | ✓ | ✓ | ✓ |
| Ferreira and Cardoso [55] | S | 900–2500 | ✕ | ✕ | ✕ | ✕ | ✕ | ✕ | ✕ | ✕ | N/A | ✓ | ✓ | ✓ |
| Coley et al. [54] | S | 2900 | ✓ | ✕ | ✕ | ✕ | ✓ | ✕ | ✕ | ✕ | ✕ | ✓ | ✓ | ✓ |
| Hutter et al. [41] | S | 350–3000 | ✕ | ✕ | ✕ | ✕ | ✕ | ✕ | ✕ | ~ | N/A | ✓ | ~ | ~ |
| Dorizas et al. [36] | S | N/A | ✕ | ✕ | ✕ | ✕ | ✕ | ✕ | ✕ | ✕ | N/A | ✓ | ✓ | ✓ |
| Shendell et al. [48] | S | dCO2 1000 ppm increase | ✕ | ✕ | ✕ | ✕ | ✓ | ✕ | ✕ | ✕ | N/A | ✓ | ✓ | ✓ |
| Kolarik et al. [47] | S | Increase of 100 Variable, depending on ventilation | ✕ | ✕ | ✕ | ✕ | ✕ | ✕ | ✕ | ~ | N/A | ✓ | ✓ | ✕ |
| Respiratory system effects | ||||||||||||||
| Shriram et al. [3] | L | 2000, 3000 | ✓ | ✓ | ✓ | ~ | ✓ | ✕ | ~ | ~ | ✓ | N/A | ✓ | ✓ |
| Mendell et al. [70] | O | 400–800 | ✕ | ✕ | ✕ | ✕ | ✕ | ✕ | ✕ | ~ | N/A | ✓ | ✓ | ✕ |
| Mohd Nor Rawi et al. [66] | S | 579–784 | ✕ | ✕ | ✕ | ✕ | ✕ | ✕ | ✕ | ~ | N/A | ~ | ✓ | ✕ |
| Simoni et al. [69] | S | >1000 | ✕ | ✕ | ✕ | ✕ | ✕ | ✕ | ✕ | ~ | N/A | ✓ | ✓ | ✓ |
| Norbäck and Nordström [68] | S | 700–1500 | ✕ | ✕ | ✕ | ✕ | ✓ | ✕ | ✕ | ~ | ✓ | ~ | ✓ | ✓ |
| Mi et al. [65] | S | 500–1900 | ✕ | ✕ | ✕ | ✕ | ✕ | ✕ | ✕ | ~ | N/A | ~ | ✓ | ✓ |
| Fraga et al. [62] | S | >2100 | ✕ | ✕ | ✕ | ✕ | ✕ | ✕ | ✕ | ~ | N/A | ✓ | ✓ | ✓ |
| Ferreira and Cardoso [76] | S | 984–2942 | ✕ | ✕ | ✕ | ✕ | ✕ | ✕ | ✕ | ~ | N/A | ✓ | ✓ | ~ |
| Kim et al. [63] | S | 900–4000 | ✕ | ✕ | ✕ | ✕ | ✕ | ✕ | ✕ | ✓ | N/A | ✓ | ✓ | ✓ |
| Madureira et al. [64] | S | 800–3000 | ✕ | ✕ | ✕ | ✕ | ✕ | ✕ | ✕ | ~ | N/A | ✓ | ✓ | ✕ |
| Sá et al. [67] | S | 1700–4000 | ✕ | ✕ | ✕ | ✕ | ✕ | ✕ | ✕ | ~ | N/A | ~ | ✓ | ✕ |
| Neurological symptoms and irritation of the upper airway system | ||||||||||||||
| Norback et al. [90] | H | 850, 1020 | ✕ | ✕ | ✕ | ✕ | ✕ | ✕ | ✕ | ✓ | N/A | ~ | ✓ | ✓ |
| Hill et al. [77] | O | <600 | ✕ | ✕ | ✕ | ✕ | ✕ | ✕ | ✕ | ~ | N/A | ✓ | ✓ | ✕ |
| Tsai et al. [75] | O | >800 | ✓ | ✓ | ✕ | ✓ | ✕ | ✕ | ✕ | ✓ | N/A | ✓ | ✓ | ✓ |
| Lu et al. [57] | O | 467 to 2800 | ✓ | ✓ | ✕ | ✓ | ✓ | ✕ | ✕ | ✕ | N/A | ✓ | ✓ | ✓ |
| Erdmann and Apte [71] | O | dCO2 100 ppm increase | ✓ | ✓ | ✕ | ✓ | ✓ | ✕ | ✕ | ✓ | N/A | ✓ | ✓ | ✓ |
| Muscatiello et al. [91] | S | >1000 | ✕ | ✕ | ✕ | ✕ | ✕ | ✕ | ✕ | ~ | N/A | ✓ | ✓ | ✓ |
| Carreiro-Martins et al. [78] | S | Median 1440 (1085–1970) | ✓ | ✓ | ✕ | ✕ | ✕ | ✕ | ✕ | ~ | N/A | ~ | ✓ | ~ |
| Chatzidiakou et al. [72] | S | Average 764–1206 Max: 2061 | ✓ | ✓ | ✕ | ✓ | ✓ | ✕ | ✕ | ~ | N/A | ✓ | ✓ | ✓ |
| Jurado et al. [73] | S | 1400 | ✕ | ✕ | ✕ | ✕ | ✕ | ✕ | ✕ | ~ | N/A | ✓ | ✓ | ✓ |
| Kim et al. [63] | S | 900–4000 | ✕ | ✕ | ✕ | ✕ | ✕ | ✕ | ✕ | ✓ | N/A | ✓ | ✓ | ✕ |
| Norbäck and Nordström [68] | U | Reduced air flow: 1030 to 1170 Increased air flow: 1200 to 920 | ✓ | ✓ | ✕ | ✓ | ✓ | ✕ | ✓ | ✓ | N/A | ✓ | ✓ | ✕ |
| Human Physiological Responses | ||||||||||||||
| Zhang et al. [52] | L | 500, 5000 | ✓ | ✓ | ✓ | ✓ | ✓ | ✓ | ✓ | ✓ | ~ | ✓ | ✓ | ✕ |
| Zhang et al. [59] | L | 1000, 3000 | ✓ | ✓ | ✓ | ✓ | ✓ | ✓ | ✓ | ✓ | ✓ | ✓ | ✓ | ✕ |
| Lu et al. [92] | O | ~400–1500 | ✕ | ✕ | ✕ | ✕ | ✕ | ✕ | ✕ | ~ | N/A | ✓ | ✓ | ✓ |
| Vehviläinen et al. [58] | O | 700–4000 | ✕ | ✕ | ✕ | ✕ | ✓ | ✕ | ✕ | ~ | N/A | ✓ | ✓ | ✓ |
| Jung et al. [79] | O | N/A | ✕ | ✕ | ✕ | ✕ | ✕ | ✕ | ✕ | ~ | N/A | ✓ | ✓ | ✓ |
| MacNaughton et al. [74] | O | ✓ | ✓ | ✕ | ✓ | ✕ | ✕ | ✕ | ✕ | N/A | ✓ | ✓ | ✓ | |
| Tomoda et al. [81] | S | 700–1500 | ✕ | ✕ | ✕ | ✕ | ✕ | ✕ | ✕ | ✕ | N/A | N/A | ✓ | ✓ |
Publisher’s Note: MDPI stays neutral with regard to jurisdictional claims in published maps and institutional affiliations. |
© 2021 by the authors. Licensee MDPI, Basel, Switzerland. This article is an open access article distributed under the terms and conditions of the Creative Commons Attribution (CC BY) license (https://creativecommons.org/licenses/by/4.0/).
Share and Cite
Lowther, S.D.; Dimitroulopoulou, S.; Foxall, K.; Shrubsole, C.; Cheek, E.; Gadeberg, B.; Sepai, O. Low Level Carbon Dioxide Indoors—A Pollution Indicator or a Pollutant? A Health-Based Perspective. Environments 2021, 8, 125. https://0-doi-org.brum.beds.ac.uk/10.3390/environments8110125
Lowther SD, Dimitroulopoulou S, Foxall K, Shrubsole C, Cheek E, Gadeberg B, Sepai O. Low Level Carbon Dioxide Indoors—A Pollution Indicator or a Pollutant? A Health-Based Perspective. Environments. 2021; 8(11):125. https://0-doi-org.brum.beds.ac.uk/10.3390/environments8110125
Chicago/Turabian StyleLowther, Scott D., Sani Dimitroulopoulou, Kerry Foxall, Clive Shrubsole, Emily Cheek, Britta Gadeberg, and Ovnair Sepai. 2021. "Low Level Carbon Dioxide Indoors—A Pollution Indicator or a Pollutant? A Health-Based Perspective" Environments 8, no. 11: 125. https://0-doi-org.brum.beds.ac.uk/10.3390/environments8110125