
Sustainable Mobility in Universities: The Case of the University of Foggia (Italy)


1
Department of Economics, Management and Territory, University of Foggia, 71121 Foggia, Italy
2
Department of Economics and Finance, University of Bari Aldo Moro, 70121 Bari, Italy
*
Author to whom correspondence should be addressed.
Environments 2021, 8(6), 57; https://doi.org/10.3390/environments8060057
Submission received: 23 April 2021
/
Revised: 1 June 2021
/
Accepted: 10 June 2021
/
Published: 15 June 2021
Abstract
:Among the 17 Sustainable Development Goals (SDGs) that make up the 2030 Agenda and refer to different areas of social, economic and environmental development, goal 11.2 concerns access to safe, cheap, accessible and sustainable transport systems, increasing road safety particularly through the enhancement of public transport. Universities can also contribute to increasing the use of more sustainable means of transport through policies and strategies to encourage students and staff in choosing sustainable transport modes. Numerous universities around the world and in Italy have adopted initiatives to reduce the environmental impact related to the mobility of the entire academic community. In Italy, the Italian Network of Sustainable Universities has set up, within its organization, a working group that has drawn up numerous studies on the sustainable mobility of Italian universities. The University of Foggia also conducted a study on mobility to detect and evaluate the mobility routines of community members (students, academic and administrative staff). In this paper, the first results in terms of descriptive analysis are shown. We submitted a survey consisting of 17 questions, and we obtained 3495 answers. After cleaning the data set, we were able to extract various contingency tables, through which we can statistically describe the main means of transport used by members of the University of Foggia community and, thanks to detailed data about the different means of transport, we can estimate their emissions. According to the results shown in the paper, further considerations could be made concerning the environmental implications of the choices of transportation modes. This could address policies about mobility at universities and provide useful information for applying actions to enhance these sustainable choices.
1. Introduction
According to data reported by the FAOSTAT, a national body specializing in statistical analysis and sector studies concerning the university world, in the 2017/2018 academic year, the number of students enrolled at Italian universities was approximately 1.691 million. To this category, it is then necessary to add a whole series of other categories of people who gravitate around the university context, such as students of postgraduate courses, teaching and research staff, and technical administrative staff. The total is very close to two million individuals, a very high value that is approximately 3.22% of the entire Italian population [1,2,3,4]. Sustainable mobility is included in objective 11.2 of the Sustainable Development Goals (SDGs), that is, access to safe, cheap, accessible and sustainable transport systems, increasing road safety particularly through the enhancement of public transport [5,6,7]. Some Italian universities have implemented forms of sustainable mobility for both students and staff. In Italy, the Sustainable Universities Network (RUS) was set up with the aim of encouraging Italian universities to pursue the objectives of sustainable development and, among these, also that of sustainable mobility [8]. The best practices adopted by Italian universities mainly concern the following:
- The agreement of reduced fares for public transport in favor of students stipulated with bus and train companies.
- The implementation of sharing mobility, such as the Zeta A project of the University of Bologna, which provides for a fleet of 42 service cars to be shared between the departments for business travel [9], and the Almabike service, which allows for the purchase or rental of bicycles at discounted prices [10]. An agreement of the University of Turin with the Buustle company provides for sharing bus services and the Carpooling hub platform for sharing cars [11]. The Verysoon initiative of the University of Campania provides a carpooling service dedicated to students and employees [12]. The MoveAPP project of the University of Naples L’Orientale involves the use of a dedicated app to encourage car-pooling [13]. Other universities have entered into agreements with private companies that provide sharing mobility services, such as the Politecnico di Milano [13].
- The use of buses dedicated to students and employees, such as the Verysoon project of the University of Campania, BRT and Metro-Shuttle of the University of Catania, which enabled the construction of a bus and underground line dedicated to the connection between the university and the city [16]. The University of Bergamo has involved, with its U-Mob LIFE project, the municipalities of Bergamo and Dalmine, in which it has its headquarters, to work together to identify sustainable mobility solutions in the home–university journeys of students and university staff [17].
Many of the Italian universities, before adopting best practices, distributed questionnaires to students and staff to learn about their difficulties in reaching the headquarters, to receive useful suggestions to solve problems, and to collect proposals on the use of sustainable mobility solutions. The University of Foggia (UniFG) has also started a process of implementing sustainable mobility through the distribution of a questionnaire, the results of which are discussed in the following pages (see supplementary material, Figure S1). The aim of this paper is to argue about the results of the survey, which represents the first step in the assessment of the sustainable performances of this community.
2. Literature Review
The sustainable mobility paradigm was well-investigated in the literature both as urban transport planning and as land-use policy [20,21,22,23,24]. In the same way, some attempts to define metrics and indicators were carried out in order to assess the sustainability of transport [25,26,27,28]. As far as the evaluation of sustainability of transportation systems and planning approaches at the universities are concerned, Dehghanmongabadi et al. [29] underline the problem of parking and the needs for enhancing more sustainable transport modes such as carpooling and bikes. They analyze possible solutions by submitting a survey to the community of Eastern Mediterranean University. Dell’Olio et al. [30] elaborated a methodology for evaluating different parking and transport policies in order to encourage and empower more sustainable mobility on university campuses and tested it at the University of Cantabria campus in Northern Spain with a survey. The research showed how the on-campus parking fare is a fundamental variable not only for reducing the demand for traveling by private car but also to reinforce and finance alternative and more sustainable transport modes. Scheffer et al. [31] analyze the current mobility at the campus with the aim to elaborate a sustainable mobility plan (SMP) applied at the University of Passo Fundo (UPF). Stakeholders were engaged with a questionnaire in order to understand opinions about possible solutions and the plan’s implementation. Ribeiro et al. [32] examine the travel patterns of the community of the University of Minho, in Portugal, by submitting a questionnaire to 1482 individuals, including students, lecturers/researchers and staff. The research highlights how the mobility in that context is unsustainable due to the convenience of students using their own car. They conclude by underlining the importance of implementing sustainable mobility strategies based on the enhancing of public transport, walking pathways, transport hubs and cycling facilities. As shown in this literature overview, research into mobility and transport policies in higher education is not widespread. This paper utilizes the experience carried out at the University of Foggia, where a huge community was involved with the use of questionnaires. The great number of answers provides interesting information for implementing sustainable mobility policies and to promote further research in sustainability of transport plans.
3. Materials and Methods
3.1. University Structure
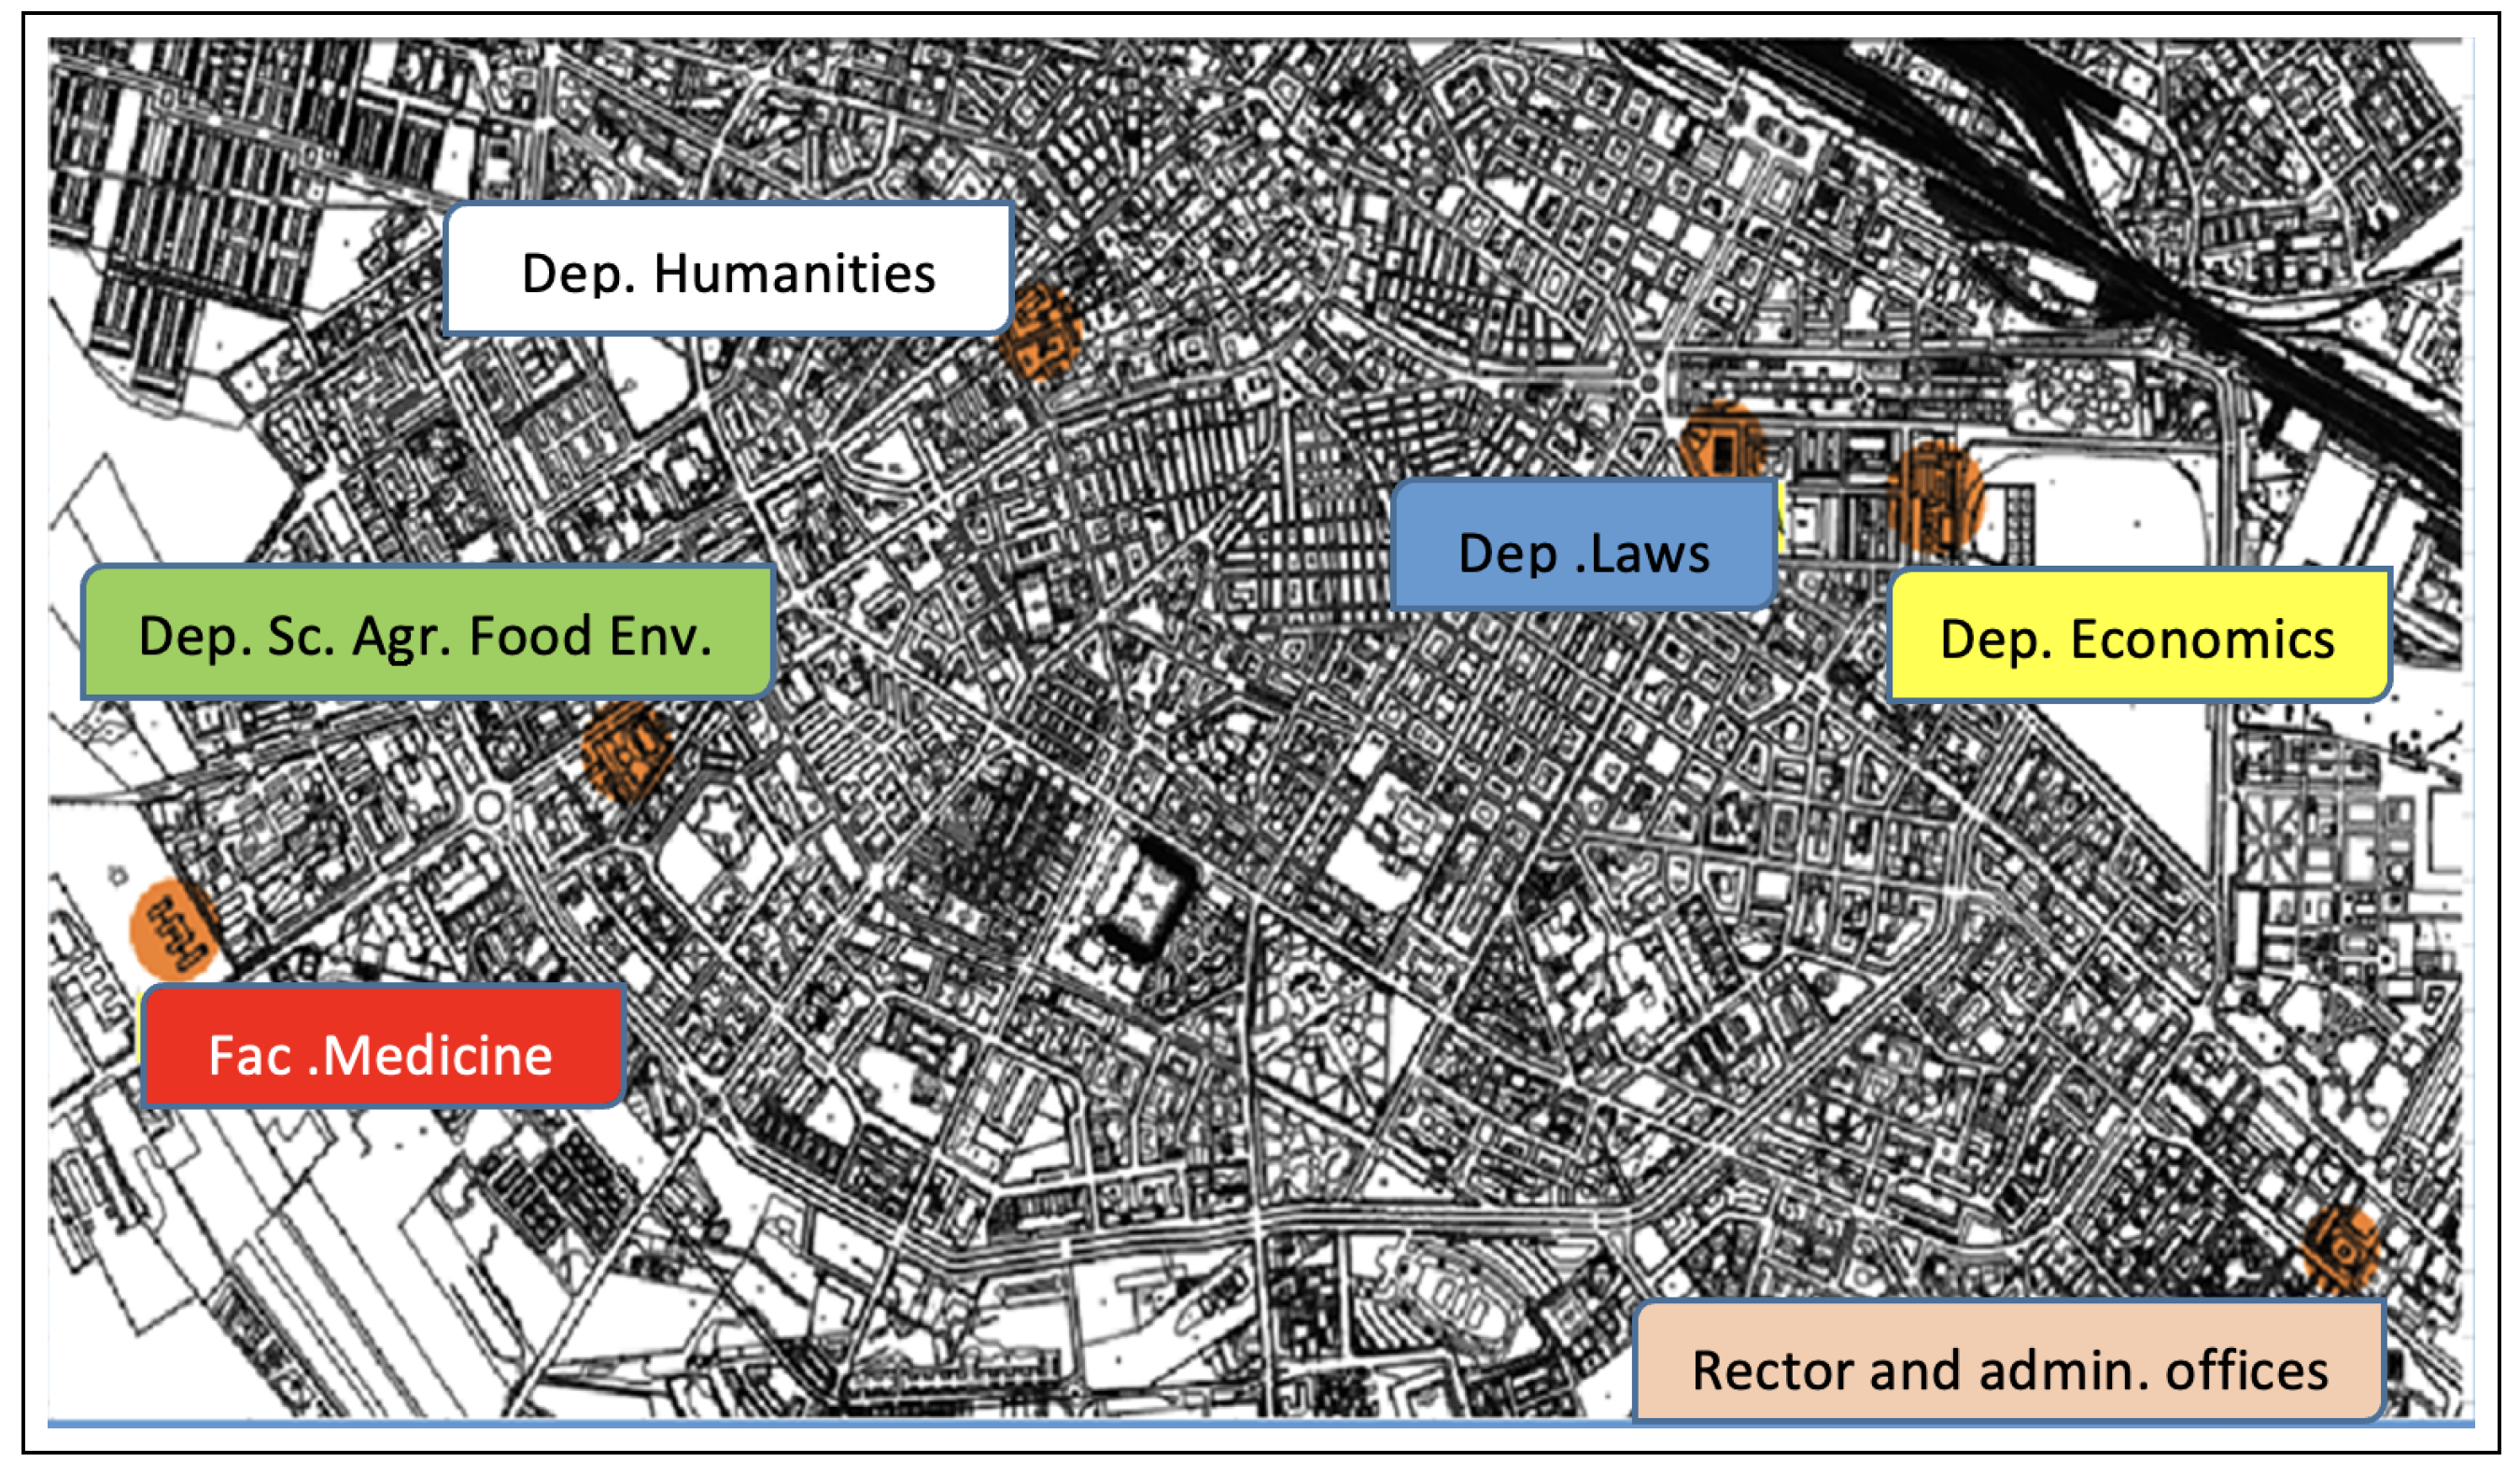
Since it was founded (Italian Ministerial Decree 5 August 1999), the University of Foggia has presented (in terms of education and research) a dynamic and innovative proposal. A module was characterized by didactics in step with the territorial requirements by applied local research projects, internationalization, orientation, cultural events and promotion of University activities. The six departments (Sciences of Agriculture, Food and Environment (SAFE); Economics; Law; Humanities, Literature, Cultural Heritage, Education Sciences; and Faculty of Medicine with the departments of Clinical and Experimental Medicine and Medical and Surgical Sciences) with three year degree courses, specialist degrees, Master’s degree courses, an Interdepartmental Research center, a large number of Master’s courses, research doctorates, and the specialist colleges, have contributed to turning the University of Foggia into a cultural center in which young people can acquire professional training that meets the needs expressed by society and the world of work. During the last year (and in line with the actions undertaken in previous years), the University of Foggia has expanded and consolidated all the initiatives and activities aimed at improving and qualifying the teaching methodology, research, international relations (by participating in a large number of international cooperation projects promoting students’ and teachers’ exchange) and services to students, as well as the development of the university buildings (with the adaptation of the existing structures and the acquisition of new ones), the information system and the library system. The buildings of the University of Foggia are located within inhabited centers, and the available parking spaces are limited because it was preferred to build green areas and to encourage sustainable mobility. The University of Foggia has six departments, namely
- Agriculture, Food and Environment;
- Law;
- Humanities, Literature, Cultural Heritage, Education Sciences;
- Economics;
- Medical and Surgical Science; and
- Clinical and Experimental Medicine,
located around the city, as shown in Figure 1.
Given the ever-expanding training offered, the university has exponentially increased in terms of its number of members in recent years. For example, it has a number of members of academic staff (divided into different departments and broken up by gender) equal to 374, of which 212 are males and 162 are females (respectively, and ), as shown in Figure 2.
On the other hand, the technical–administrative staff consists of 434 employees (divided into different categories, including B, C, D, EP), of which 266 are males and 168 are females ( and , respectively), as shown in Figure 3.
The total number of students enrolled in the academic year 20/21 amounts to 11,614, who, as shown in Figure 4, are mostly enrolled in the Department of Humanities.
Furthermore, it is possible to note (as shown in Figure 5a) how the students of the various departments are divided by gender (the Departments of Economics, Management and Territory can register students enrolled from the a.y. 20/21) and by age (Figure 5b).
The growing importance of the University of Foggia in the territory has made it possible to expand the regions of origin of the students, not limited only to the neighboring regions of Puglia, as shown in Figure 6, which is divided by gender.
3.2. Mobility Habits
To determine the mobility routines of the subjects who are found around the UniFG, we prepared a questionnaire, via Google Forms, consisting of 17 questions, to which 3495 subjects replied (see supplementary material, Figure S1). The first step was to clean up the data set:
- Fifty-one records were deleted because the respondents said they never go to the university (thus, such records are not useful for the mobility analysis);
- Three records were deleted because they lacked some essential information, such as the structure of affiliation;
- Some questions with free text fields were standardized to make them fit into a series of categories (about 250 were edited in this way, with particular reference to questions 7, 8, 14, 15 and 17);
- A total of 443 records were deleted due to the incompatibility between the indicated mode of transport and the total kilometers for a round trip from the university. For this question in particular, we used the following Table 1 as a reference to estimate the average speed of respondents:
Following this pre-processing phase, which involved a loss of 497 observations (14.22%), the data set we used for the subsequent analyses consisted of 2998 observations.
4. Results
We can distinguish the analyses carried out in relation to some key variables [33], including gender, age, role within the university and membership structure, in all cases with the aim of identifying the mobility habits of the UniFG population.
4.1. Characteristics of Respondents
Regarding the personal characteristics of the respondents, about 62% were 18–26 years old (representing the largest slice of the UniFG population), and surprisingly, 66% of the total were women, as shown in Figure 7. Of these, as shown in Table 2, 1639 were students, out of a population of 2418 respondents. This is an exciting result and is in line with the Survey on the Profile of Graduates (https://www.almalaurea.it/sites/almalaurea.it/files/docs/universita/profilo/profilo2020/almalaurea_profilo_rapporto2020.pdf, accessed on 19 April 2021) (AlmaLaurea), which highlights that women represent about 59% of Italian graduates.
Given the high number of respondents of such a young age, we expected the largest portion of the roles assumed at the university to be students. Students, in fact, represented about 81% of the total, as shown in Figure 8 (for simplicity, we have aggregated the scientific technical staff and the administrative technical staff).
Furthermore, regarding the distribution between departments, the department with the highest percentage of respondents (25%) is the Department of Humanities, as shown in Figure 9, probably due to the high number of courses offered.
In particular, when age is combined with role, students under the age of 26 represent about 75% of respondents, in line with the data collected by UniFG, as shown in Table 3.
4.2. Traveling to the University
In this section, we analyze the variables concerning the movements of the UniFG population toward the university. As the respondents could enter the round trip kilometers by hand, we grouped them into eight categories: 0 to 5 km, 5.1 to 10 km, 10.1 to 30 km, 30.1 to 60 km, 60.1 to 100 km, 100.1 to 200 km, 200.1 to 400 km and, finally, over 400 km. As shown in Figure 10, about 25% of respondents make a 5 km round trip from their university, highlighting that a large portion of the UniFG population lives less than 50 km away.
We are also interested in understanding respondents’ distances based on their role and membership structure. In particular, in Figure 11a, we can see how the distance over 200 km involves teachers and researchers much more consistently (as already hypothesized), while it is evident in Figure 11b that the greatest distances (over 400 km) are covered by those belonging to the Departments of Law and Humanities.
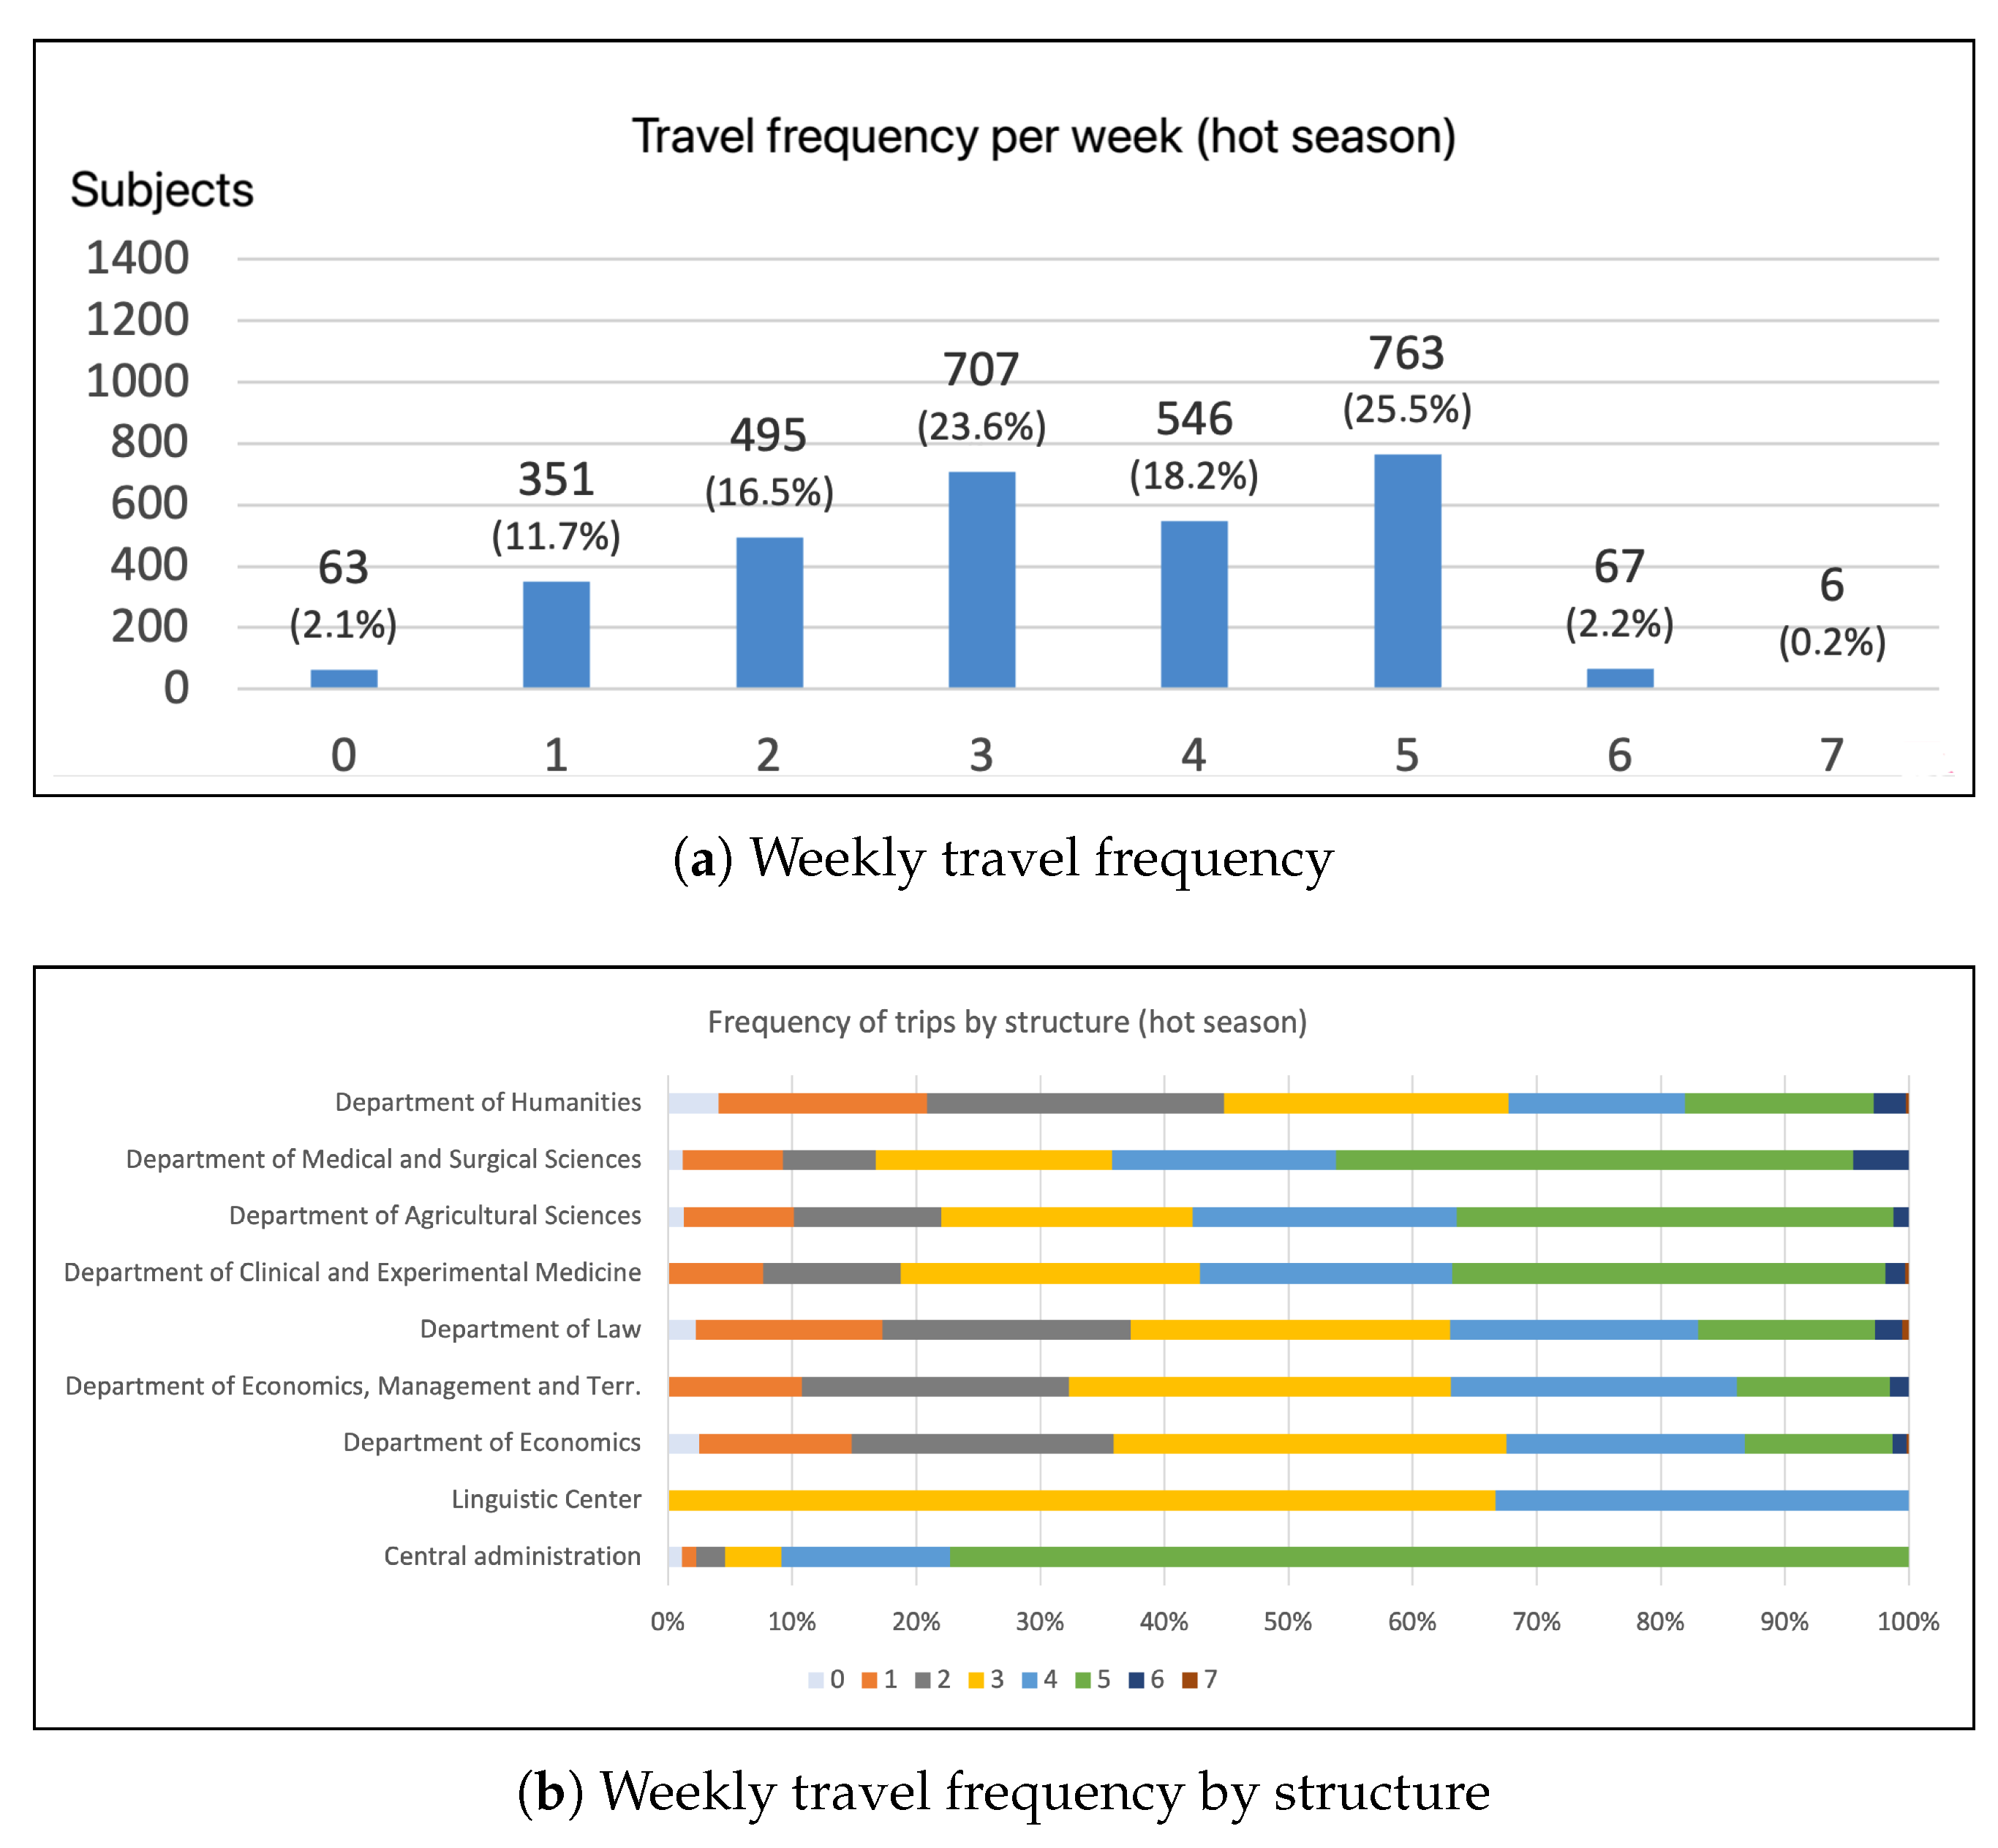
Another key variable of interest is how many days (during hot and cold seasons) the respondents go to the university. The interest is evident, because subject will have to use a certain means of transport based on how many days they go to their offices. Starting with the hot season (April to September), as shown in Figure 12, about 30% visit less frequently (from 0 to 2 times a week), whereas half of the respondents go to the department three or five times a week, and the most popular departments are those of the Agricultural Sciences and Medicine (probably for practical and laboratory activities).
The responses show that respondents go to the departments more often in the cold season (from October to March) (probably due to the largest number of lessons being in the first semester), with the same most-frequently visited departments as in the warm season (Agricultural Sciences and Medicine), as shown in Figure 13.
Table 4 presents the percentage variation in respondents’ movements during the different days of the week, going from the hot to the cold season.
4.3. Means of Transport for Respondents
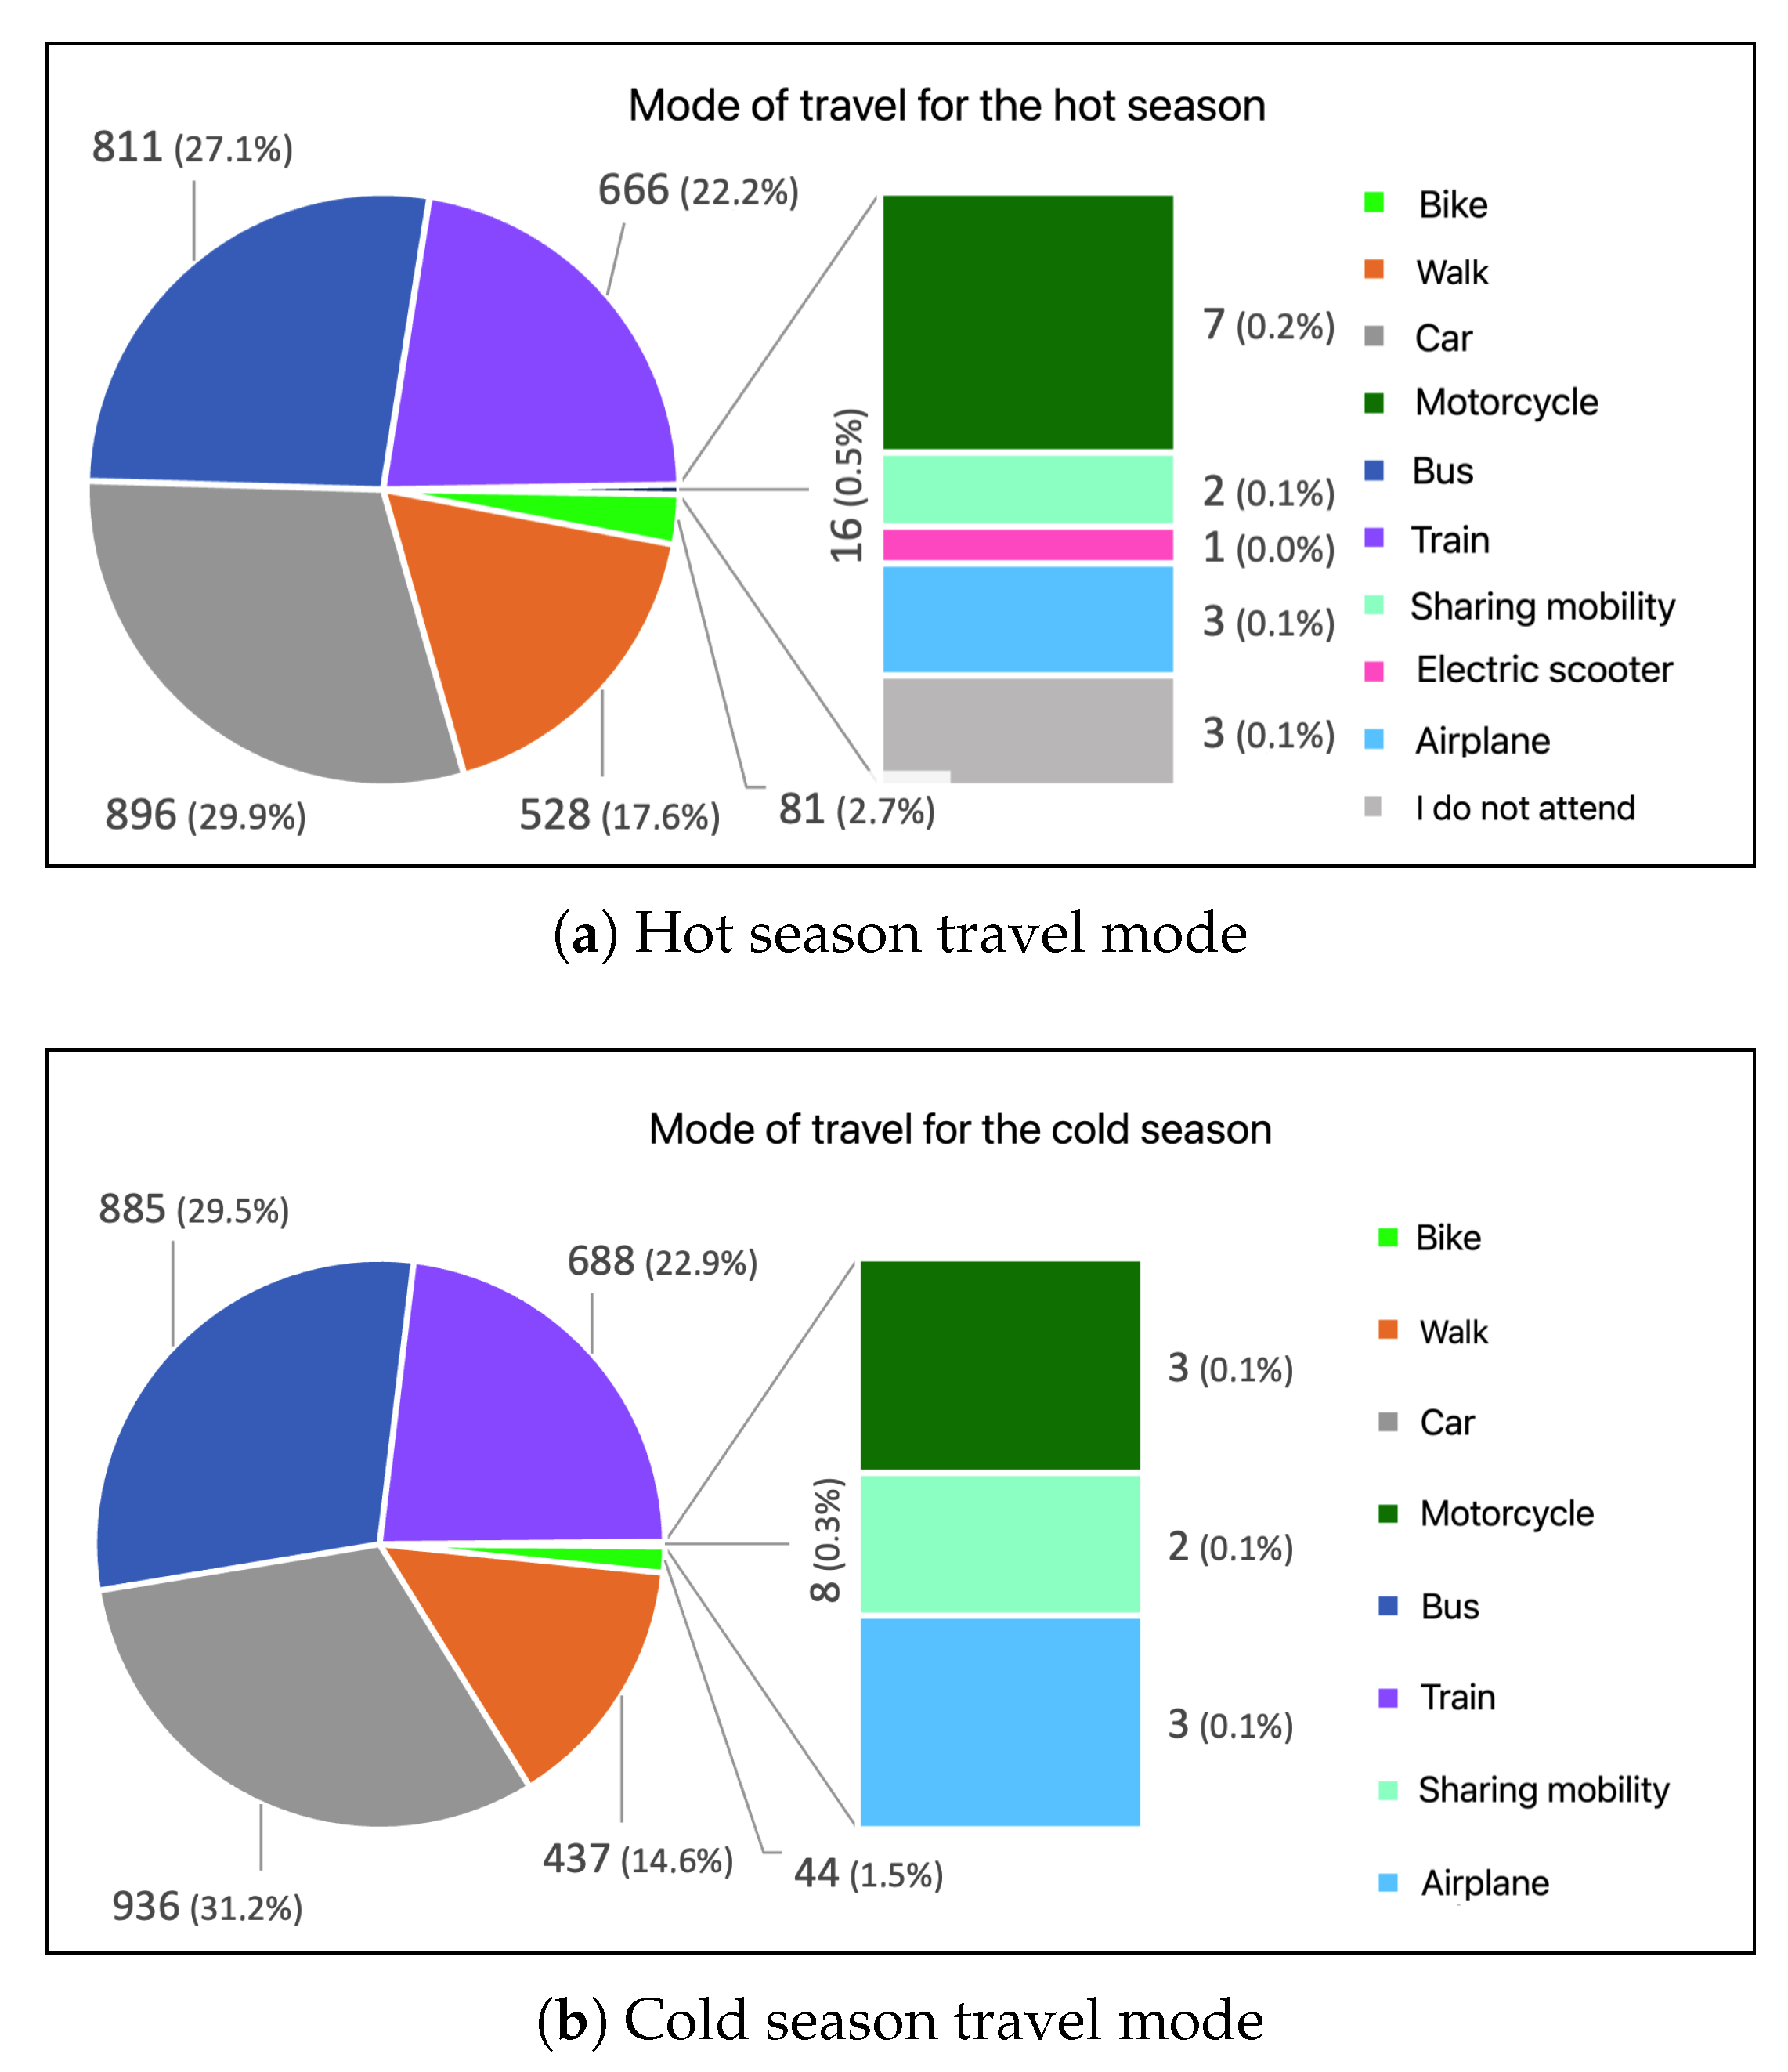
Questions related to means of transport are of particular interest to understand respondents’ mobility habits. As shown in Figure 14 and Table 5, during the transition from the hot to the cold season, there is a decline in bicycle users, motorcycle users and people walking. The absence of sustainable methods is also evident. In any case, about 84% of respondents travel to UniFG by car (31.3%), bus (29.5%) and train (22.9%).
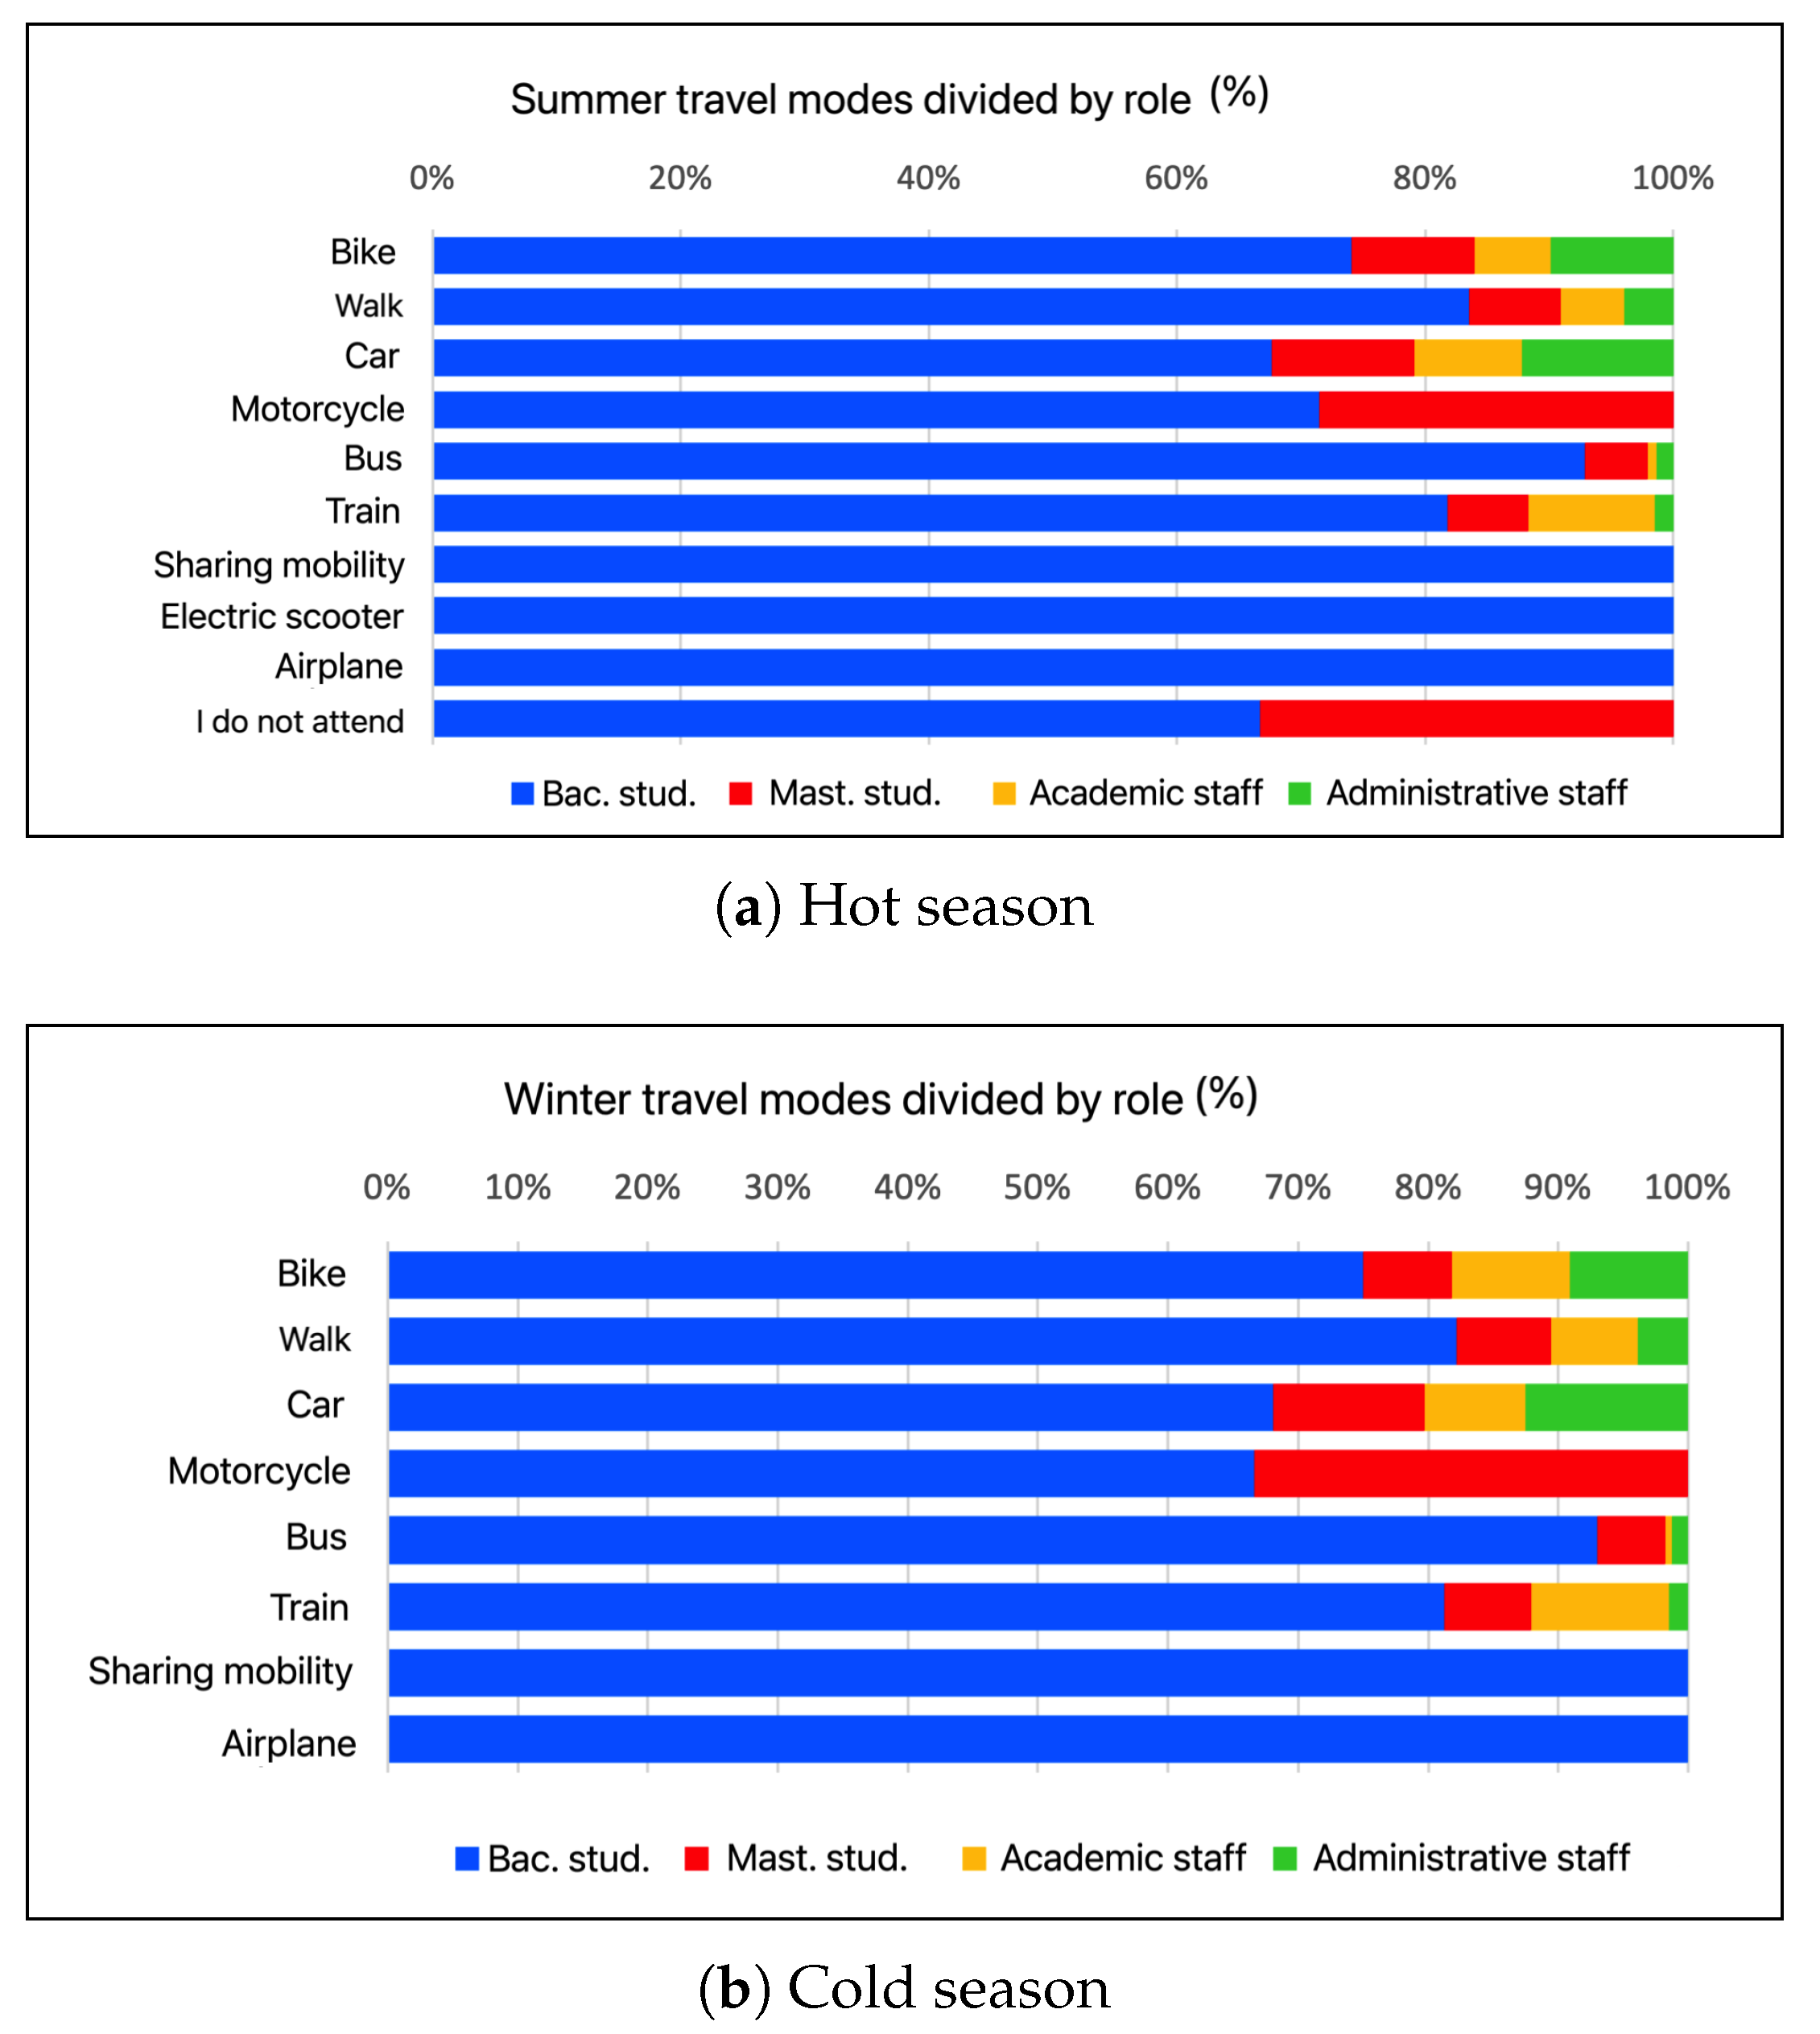
There is an interesting relationship between the role played and the means used, as shown in Figure 15. From this analysis, there are no evident relationships between the two variables: for example, among the students, only 68% use a car, which is compensated for by the use of the bus (for which they are the main users).
At this point, we can address the questions dedicated exclusively to respondents who indicated the car as a means of transport (for at least one of the two seasons): for this analysis, the data set is limited to 1018 respondents (approximately 34% of the total). Figure 16a shows the breakdown of the power supplies of the respondents’ vehicles traveling by car.
Grouping by age, about 38% of those who use a car own a medium-sized diesel vehicle. However, Figure 16b indicates how widespread (especially among young people, from 18 to 26) the idea is that, in the choice between a gasoline or diesel car of small dimensions, the gasoline car prevails, because the consumption is mostly equivalent.
Closely linked to the power supply of cars is their registration, a symptom of the amount of atmospheric emission. The options available for this variable range (according to the EURO class indicator) go from the pre-EURO class (before 1993) to the EURO 6C (after 2018). Figure 17 shows the distribution of the different EURO classes among the respondents traveling by car.
We are pleased to note that cars registered before 2006 (lower than the EURO 3 class and therefore more polluting) are a minority, at about 23%. This is probably due to the policies implemented by the European Union and the Italian State. We are also interested in understanding how these different types of cars are distributed in relation to age group and role.
As shown in Figure 18, students aged between 18 and 26 represent the largest share of EURO 3 vehicle users; a shift in attention can be noted toward newer-generation vehicles by all age groups, but above all by students.
Respondents who stated that they use a car to travel were also asked how many passengers they had in the car to highlight forms of carpooling that could increase the load of emissions.
As shown in Figure 19, 55.7% of respondents travel by car totally alone; only 18% practice carpooling regularly.
Finally, to understand the mobility between the different UniFG departments, respondents were asked how many times a week they move from one location to another (scattered around the city). This response again involves the entire data set.
As shown in Figure 20a, about 84% of respondents go to other UniFG offices at a very low frequency (at most occasionally), while the remaining 16% move regularly between departments. The most frequent trips, as shown in Figure 20b, concern those departments that (as is well known) do not have an internal cafeteria (such as the Department of Economics, Management and Territory) or in which the lessons are divided between different university structures (such as the Department of Medicine).
4.4. Ancillary Questions
We gave respondents the possibility to indicate different alternatives, in the choice between sustainable mobility services, with respect to which they would prefer to use. Because this variable allowed the possibility of inserting free text, we aggregated the answers into different categories, conveying those that required new parking spaces in the answer “none of the above”, because it does not strictly pertain to sustainable mobility (for which they were not taken into consideration for the analyses). For this question, respondents could enter up to four alternatives. For this reason, we consider the first alternative individually (because it can be considered the most desired by the respondents) and the three remaining as cumulative alternatives (in this case, the answers will be higher than 2998).
As shown in Figure 21a, about 40% of respondents would make improvements to public transport services, in terms of both their efficiency and the arrangement of stops near the UniFG structures. The second most requested sustainable mobility system is represented by the adoption of rental bicycles, probably desired by those traveling by bus. Regarding the remaining alternatives chosen by respondents, as shown in Figure 21b, public transport still ranks first (at about 60%), followed in this case by the request for cycling paths. This request is probably linked to the subjects who indicated rental bikes as their first choice and would prefer to be able to move around the city using them.
It may be interesting, at this point, to understand the required sustainable mobility services according to department.
In particular, as shown in Figure 22a, departments such as the Humanities Department, located in historic areas of the city, have a stronger demand for more public transport stops, as opposed to departments such as the Economics Department, which, located near a public transport hub, require more efficient transport. As Figure 22b shows, on the other hand, respondents from the Humanities Department chose rental bikes in large numbers as alternatives after the first one. It is therefore possible to conclude that the members of that department are looking for more ways of moving (probably due to the positioning of the building in a historic area). For other departments, however, the greatest demand is always linked to more efficient public transport.
Finally, it might be useful to understand sustainable mobility services based on the means of transport used regularly by the questionnaire respondents. In this regard, as shown in Figure 23, we restrict the choice to the first alternative only (understood as the most important) and note how the requests of the respondents do not differ much according to the season.
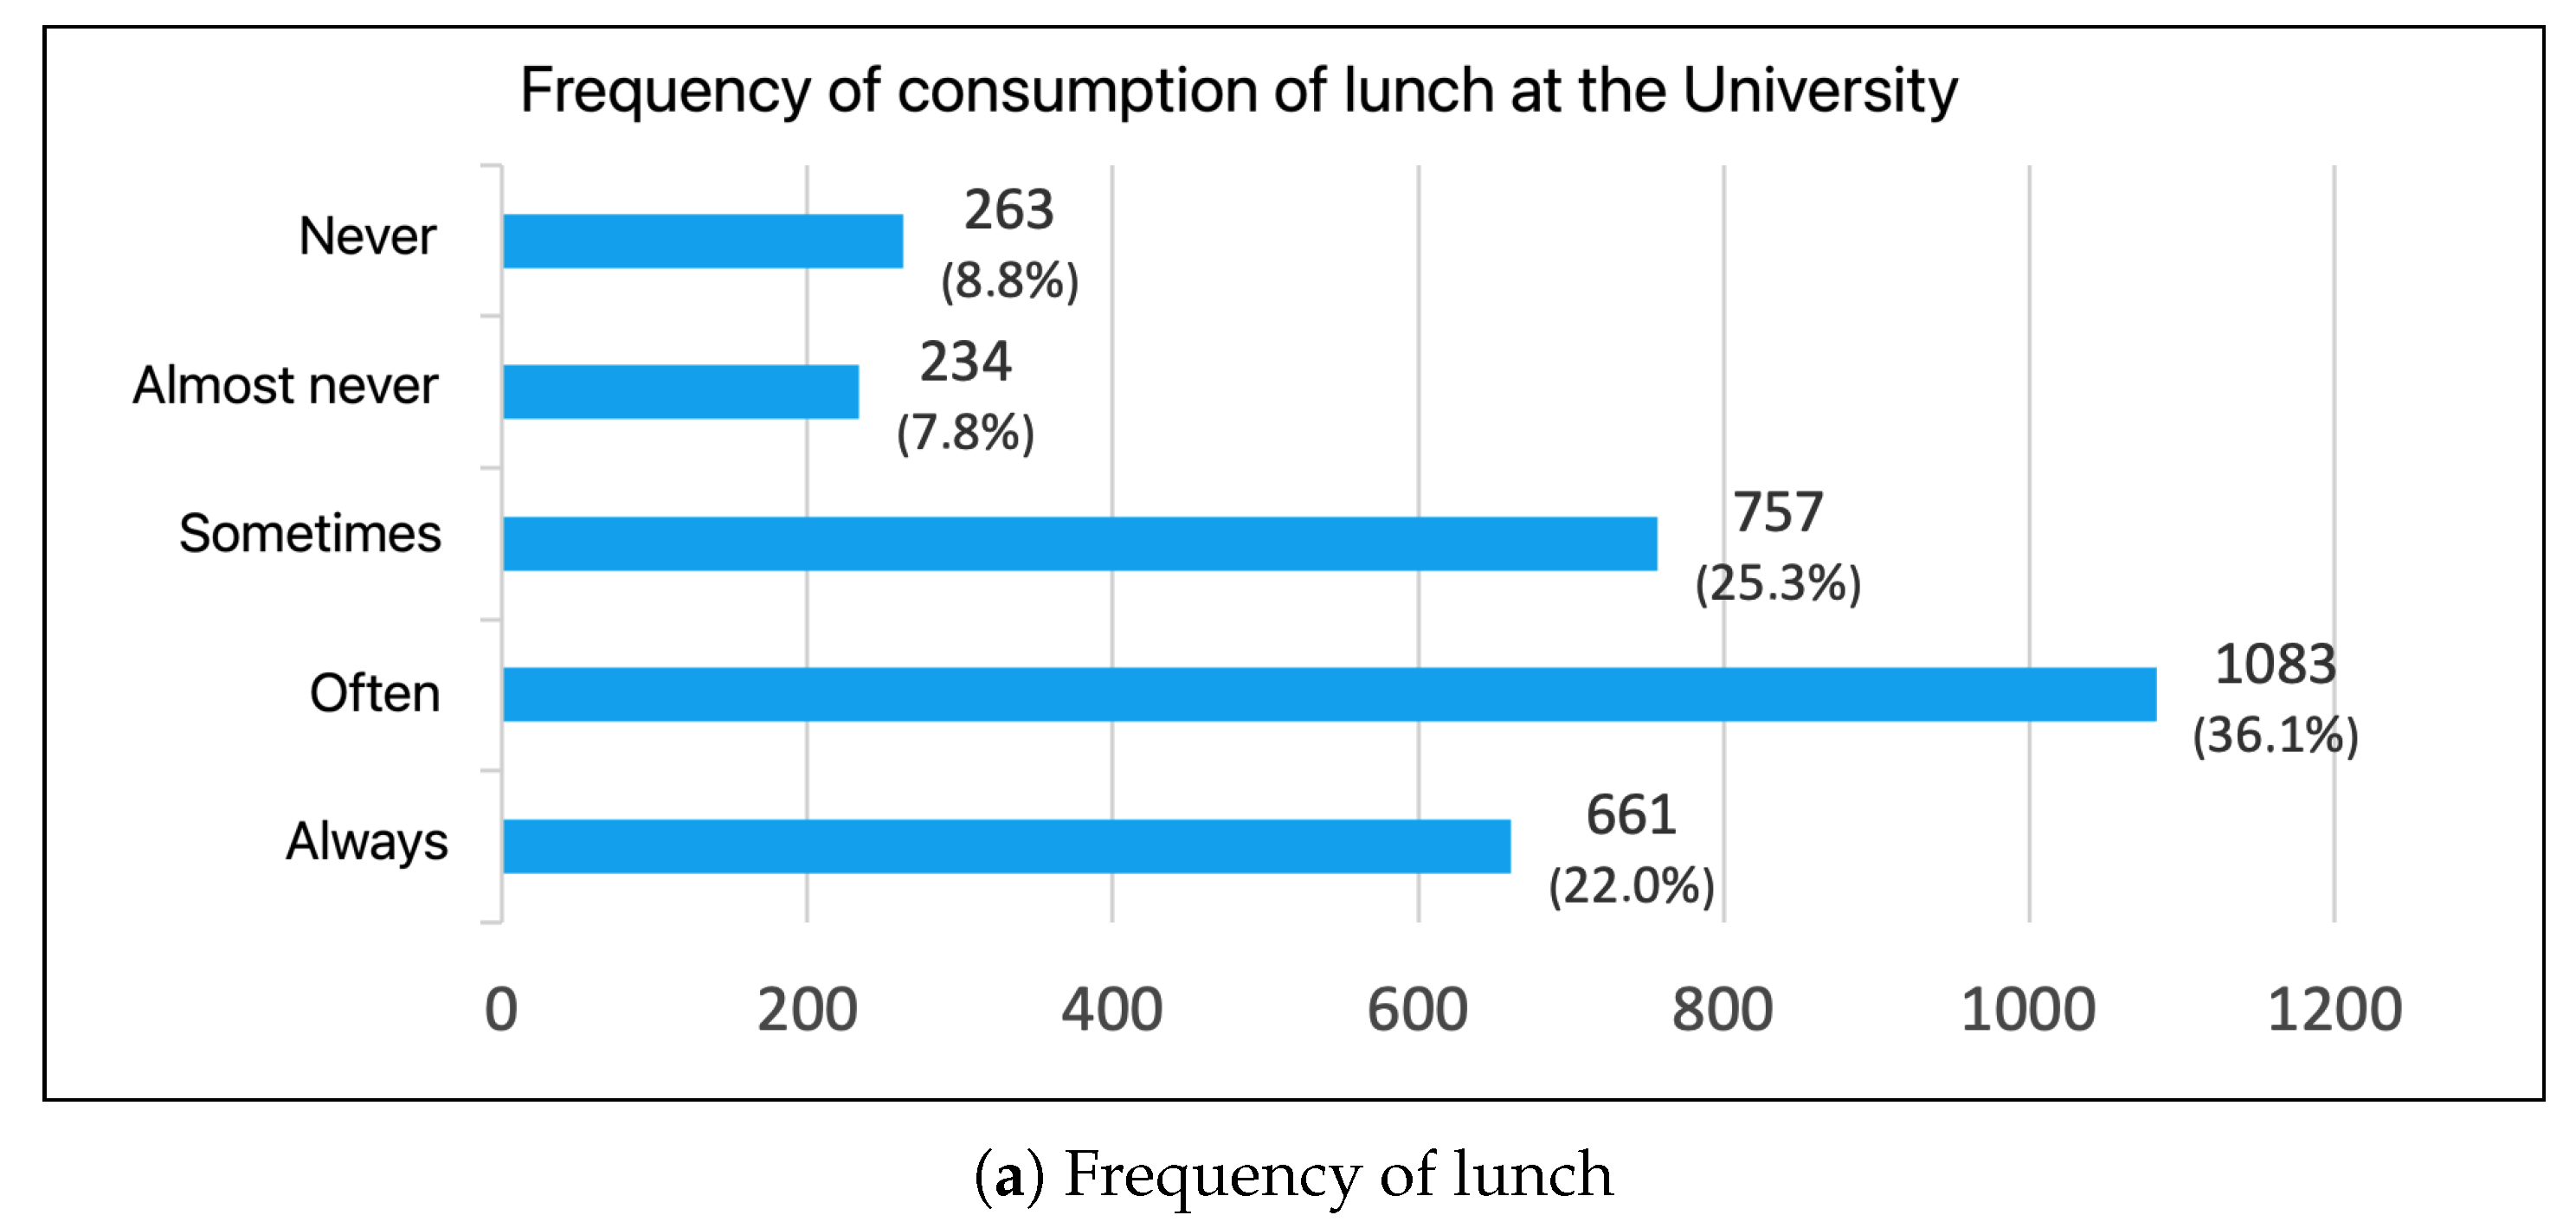
The last two questions were related to the lunch habits of the respondents, particularly how often they have lunch at the university and the source of the lunch (when consumed in one of the UniFG structures). Figure 24a presents, according to the number of times, the breakdown of respondents who declared that they have lunch at the university. Over 55% of the subjects have lunch on site more than three times a week (indicated with responses “often” and “always”) and are broken down by department in Figure 24b.
This could be an incentive, especially for the Departments of Economics and Humanities, to increase the number of classrooms/spaces for attendants intended for refreshments. Finally, Figure 25 shows the source of lunch for those who dine at the venue.
Because over 50% of those who have lunch at the university consume a lunch brought from home, it could be an excellent proposal to equip the departments with appliances that allow, for example, staff to be able to heat their dishes.
5. Conclusions
The paper provides very important information that could be processed in a lifecycle perspective to analyze the implications of choices about modes of transport in terms of environmental impacts. This could help to define a picture about the sustainability of mobility at the UniFG and to provide a way to evaluate the environmental consequences of these choices that potentially apply to other communities. Further developments could foresee the definition of a sustainable profile for each member of the community as well. By assessing the relative impact of each choice regarding mobility, the university could also implement policies and strategies aimed at facing the issue and addressing sustainable habits of students, professors and personnel staff. The use of a standardized methodology such as life cycle assessment could represent the best way to translate the information presented in this research into a simple eco-indicator that is accurate from a scientific point of view and easy for the public to understand and accept. The main idea of this paper is to study the transport habits of the members of the UniFG community to determine which means of transportare preferred and consequently to estimate the emissions produced. After an initial phase of cleaning the data set, we extracted information of different types regarding the habits of the subjects in relation to their membership structure, their age and their role at the UniFG. These data show how the majority of the academic community (represented by young students) is oriented towards sustainable mobility, and in particular towards the improvement of public transport. Finally, based on the knowledge of the transportation habits and distance traveled, we were able to determine and statistically describe the emission quantity for the different categories of means of transport. The study carried out aims to develop a methodology that, starting from the University of Foggia, can be applied generically to any public/private organization. In this way, organizations can become aware of the habits of their members and can consequently improve them. This study can allow the University of Foggia to adopt more eco-sustainable policies, but at the same time, if transferred to another context, it allows us to understand in which direction the interest in sustainable mobility is moving.
Further, in future works, we could study what the best scenarios are that members of the academic community might prefer (i.e., which means could be the preferred to stay below a certain threshold), or consider the possibility of creating a label that describes the level of pollutant emissions of a community (organization) with reference to other similar European experiences. In this way, an organization would be able to qualify for the label to a certain degree based on the kilometers traveled by its members and their preferred vehicles. Furthermore, we could study (based on the data obtained and for the specific UniFG community) through Machine Learning algorithms, the quantity of emissions that each member of the academic community could produce, based on a very small number of prior information. These forecasts could allow the various departments to adopt incentive policies for sustainable mobility.
Supplementary Materials
The following are available online at https://0-www-mdpi-com.brum.beds.ac.uk/article/10.3390/environments8060057/s1, Figure S1: the questionnaire submitted to the UniFG community and used for this study.
Author Contributions
Conceptualization, G.M.C.; L.G.; C.R. and D.S.; methodology, G.M.C.; L.G.; C.R. and D.S.; validation, C.R. and D.S.; formal analysis, G.M.C.; L.G.; C.R. and D.S.; investigation, G.M.C.; L.G.; C.R. and D.S.; resources, G.M.C.; L.G.; C.R. and D.S.; data curation, C.R. and D.S.; writing—original draft preparation, G.M.C.; L.G.; C.R. and D.S.; writing—review and editing, G.M.C.; L.G.; C.R. and D.S.; visualization, C.R. and D.S.; supervision, G.M.C.; L.G.; C.R. and D.S. All authors have read and agreed to the published version of the manuscript.
Funding
This research received no external funding.
Data Availability Statement
Data available on request, please contact the corresponding author (G.M.C.).
Acknowledgments
We want to thank the Rector, Pierpaolo Limone and the Vice Rector, Agostino Sevi of the University of Foggia for their concrete support and encouragement to carry out this research. We also thank the student associations for disseminating the questionnaire and encouraging students to complete it.
Conflicts of Interest
The authors declare no conflict of interest.
References
- USTAT: Statistica e Studi di Settore per l’Università—Portale dei dati dell’Istruzione Superiore. Didattica di tutti gli Atenei. 2020. Available online: http://ustat.miur.it/dati/didattica/italia/atenei (accessed on 19 April 2020).
- Garlick, S.; Pryor, G. Compendium of Good Practice University–Regional Development Engagement Initiatives. Supplement to the Report: Universities and Their Communities: Creative Regional Development through Knowledge-Based Engagement. 2002. Available online: http://gov.viu.ca/sites/default/files/compendiumofgoodpracticeuniversity-regionaldevelopmentengagementinitiatives.pdf (accessed on 19 April 2020).
- Arena, M.; Cheli, F.; Zaninelli, D.; Capasso, A.; Lamedica, R.; Piccolo, A. Smart mobility for sustainability. In Proceedings of the AEIT Annual Conference, Palermo, Italy, 3–5 October 2013. [Google Scholar] [CrossRef]
- Trombin, M.; Veglianti, E.; Pinna, R.; Musso, M. Best Practices and Strategies in Sustainability and Smart Mobility: Student Engagement in Italian Universities. In Lecture Notes in Information Systems and Organisation; Springer: Cham, Switzerland, 2021; pp. 47–63. [Google Scholar]
- Luca, G.D.; Pizzolante, F. Detecting Leaders Country from Road Transport Emission Time-Series. Environments 2021, 8, 18. [Google Scholar] [CrossRef]
- Chaplin, G.; Wyton, P. Student engagement with sustainability: Understanding the value–action gap. J. Sustain. High. Educ. 2014, 15, 404–417. [Google Scholar] [CrossRef] [Green Version]
- Paulino, F.; Pina, A.; Baptista, P. Evaluation of Alternatives for the Passenger Road Transport Sector in Europe: A Life-Cycle Assessment Approach. Environments 2018, 5, 21. [Google Scholar] [CrossRef] [Green Version]
- Chi Siamo. Rete delle Università per lo Sviluppo Sostenibile. 2020. Available online: https://sites.google.com/unive.it/rus/chi-siamo?authuser=0 (accessed on 19 April 2020).
- Zeta, A. Multicampus Sostenibile—L’Università di Bologna per la Sostenibilità. 2020. Available online: https://site.unibo.it/multicampus-sostenibile/it/mobilita/zetaa (accessed on 19 April 2020).
- Almabike. Multicampus Sostenibile—L’Università di Bologna per la Sostenibilità. 2020. Available online: https://site.unibo.it/multicampus-sostenibile/it/mobilita/almabike (accessed on 19 April 2020).
- Mobility and Transport. Politecnico di Torino: Sustainable Path. 2020. Available online: http://www.campus-sostenibile.polito.it/it/ambiti/mobility_and_transport (accessed on 19 April 2020).
- Il Progetto Integrato di Mobilità “VerySoon” dell’Università della Campania L. Vanvitelli. 2020. Available online: https://drive.google.com/file/d/10LK4UPIrGwcud3Gmq5a-_Iv5FRVl6umF/view (accessed on 19 April 2020).
- Le Convenzioni del Politecnico di Milano Nell’Ambito Della Sharing Mobility. 2020. Available online: https://drive.google.com/file/d/1LAHzgm1oxmVHQDyzf6xMMvP2kti7x3aO/view (accessed on 19 April 2020).
- Convenzione con Dynamo—La Velostazione di Bologna, Multicampus Sostenibile—L’Università di Bologna per la Sostenibilità. 2020. Available online: https://site.unibo.it/multicampus-sostenibile/it/mobilita/convenzione-con-dynamo-la-velostazione-di-bologna (accessed on 19 April 2020).
- Mobilità Sostenibile dell’Università Ca’ Foscari Venezia. 2020. Available online: https://drive.google.com/file/d/1h-J8h0VlTpaEcbe-JkkyGRv7VVOJVWio/view (accessed on 19 April 2020).
- Università degli Studi di Catania. Migliorare L’accessibilità dell’Università di Catania. 2020. Available online: https://drive.google.com/file/d/10Q_L7NByx6HqvwoZrhJpKcVfzgbi1hyJ/view (accessed on 19 April 2020).
- Università degli Studi di Bergamo. L’esperienza del Living Lab. 2020. Available online: https://drive.google.com/file/d/1N_k97T__uSYnB59iCnB0eLkDCHTFqP5G/view (accessed on 19 April 2020).
- Il Programma Volontario del Comportamento di Viaggio per la Mobilità Sostenibile Dell’Università di Cagliari. 2020. Available online: https://drive.google.com/file/d/1_7diCYFKVUhFRvFrkpjsuULa_rb6GTqg/view (accessed on 19 April 2020).
- Garau, C.; Masala, F.; Pinna, F. Cagliari and smart urban mobility: Analysis and comparison. Cities 2016, 56, 35–46. [Google Scholar] [CrossRef]
- Banister, D. The sustainable mobility paradigm. Transp. Policy 2008, 15, 73–80. [Google Scholar] [CrossRef]
- Köhler, J.; Whitmarsh, L.; Nykvist, B.; Schilperoord, M.; Bergman, N.; Haxeltine, A. A transitions model for sustainable mobility. Ecol. Econ. 2009, 6, 2895–2995. [Google Scholar] [CrossRef]
- Hickman, R.; Hall, P.; Banister, D. Planning more for sustainable mobility. J. Transp. Geogr. 2013, 33, 210–219. [Google Scholar] [CrossRef]
- Mozos-Blanco, M.A.; Pozo-Menéndez, E.; Arce-Ruiz, R.; Baucells-Aletà, N. The way to sustainable mobility. A comparative analysis of sustainable mobility plans in Spain. Transp. Policy 2018, 72, 45–54. [Google Scholar] [CrossRef]
- Holden, E.; Gilpin, G.; Banister, D. Sustainable Mobility at Thirty. Sustainability 1965, 11, 1965. [Google Scholar] [CrossRef] [Green Version]
- Campos, V.B.G.; Ramos, R.A.R.; de Miranda e Silva Correia, D. Multi-Criteria Analysis Procedure for Sustainable Mobility Evaluation in Urban Areas. J. Adv. Transp. 2009, 43, 371–390. [Google Scholar] [CrossRef]
- Haghshenas, H.; Vaziri, M. Urban sustainable transportation indicators for global comparison. Ecol. Indic. 2012, 15, 115–121. [Google Scholar] [CrossRef]
- Shiau, T.A.; Liu, J.S. Developing an indicator system for local governments to evaluate transport sustainability strategies. Ecol. Indic. 2013, 34, 361–371. [Google Scholar] [CrossRef]
- Zheng, J.; Garrick, N.W.; Atkinson-Palombo, C.; McCahill, C.; Marsall, W. Guidelines on developing performance metrics for evaluating transportation sustainability. Res. Transp. Bus. Manag. 2013, 7, 4–13. [Google Scholar] [CrossRef]
- Dehghanmongabadi, A.; Hoskara, S. Challenges of Promoting Sustainable Mobility on University Campuses: The Case of Eastern Mediterranean University. Sustainability 2018, 10, 4842. [Google Scholar] [CrossRef] [Green Version]
- dell’Olio, L.; Cordera, R.; Ibeas, A.; Barreda, R.; Alonso, B.; Moura, B.A. A methodology based on parking policy to promote sustainable mobility in college campuses. Transp. Policy 2019, 80, 148–156. [Google Scholar] [CrossRef] [Green Version]
- Scheffer, A.P.; Cechetti, V.P.; Lauermann, L.P.; Porto, E.R.; Rosa, F.D. Study to promote the sustainable mobility in university. Int. J. Sustain. High. Educ. 2019, 20, 871–886. [Google Scholar] [CrossRef]
- Ribeiro, P.; Fonseca, F.; Meireles, T. Sustainable mobility patterns to university campuses: Evaluation and constraints. Case Stud. Transp. Policy 2020, 8, 639–647. [Google Scholar] [CrossRef]
- Suchanek, M.; Szmelter-Jarosz, A. Environmental Aspects of Generation Y’s Sustainable Mobility. Sustainability 2019, 11, 3204. [Google Scholar] [CrossRef] [Green Version]
Figure 1.
Arrangement of the departments in Foggia.

Figure 2.
Composition of academic staff.

Figure 3.
Composition of technical–administrative staff.

Figure 4.
Total students enrolled.

Figure 5.
Composition of total students.

Figure 6.
Regions of origin of the students enrolled.

Figure 7.
Gender and age of respondents.

Figure 8.
Roles of respondents.

Figure 9.
Respondents’ membership structures.

Figure 10.
Kilometers traveled by respondents.

Figure 11.
Kilometers traveled by respondents for role and structures.

Figure 12.
Travel in hot season.

Figure 13.
Travel in cold season.

Figure 14.
Travel mode in different seasons.

Figure 15.
Travelling modes grouped by role.

Figure 16.
Contributions of cars.

Figure 17.
Distribution of car registration year to reach UniFG.

Figure 18.
Distribution of EURO classes by age and role.

Figure 19.
Number of passengers per car.

Figure 20.
Transfers to other UniFG offices.

Figure 21.
Sustainable mobility services required.

Figure 22.
Sustainable mobility services required by Department.

Figure 23.
Sustainable mobility services required according to means of transport.

Figure 24.
Frequency of lunch at UniFG.


Figure 25.
Origin of the lunch when consumed at the university.


Table 1.
Speed limits for our processing.
| Transport | Speed Limit | Transport | Speed Limit |
|---|---|---|---|
| Walk | 5 km/h | Sharing Mobility | 130 km/h |
| Bike | 30 km/h | Bus | 130 km/h |
| Motorcycle | 130 km/h | Train | 200 km/h |
| Car | 130 km/h | Plane | 800 km/h |
Table 2.
Distribution by gender of students.
| Students | Males | Females |
|---|---|---|
| 2418 | 779 | 1639 |
Table 3.
Age of respondents grouped by role.
| Bachelor Student | Master Student | Academic Staff | Administr. Staff | |
|---|---|---|---|---|
| 18–26 | 1823 | 54 | 0 | 2 |
| 27–35 | 428 | 96 | 11 | 4 |
| 36–44 | 111 | 64 | 42 | 39 |
| 45–35 | 45 | 19 | 79 | 69 |
| 54–62 | 9 | 4 | 41 | 41 |
| 63 and over | 2 | 0 | 11 | 4 |
| Total | 2418 | 237 | 184 | 159 |
Table 4.
Percentage variations from hot to cold season.
| Days | Hot Season | Cold Season | Variation % |
|---|---|---|---|
| 0 | 63 | 12 | −81.0% |
| 1 | 351 | 189 | −46.2% |
| 2 | 495 | 217 | −56.2% |
| 3 | 707 | 485 | −31.4% |
| 4 | 546 | 746 | +36.6% |
| 5 | 763 | 1212 | +58.8% |
| 6 | 67 | 119 | +77.6% |
| 7 | 6 | 18 | +200.0% |
Table 5.
Percentage variation in the use of different means of transport.
| Means of Transport | Hot Season | Cold Season | Variation % |
|---|---|---|---|
| Bike | 81 | 44 | −45.7% |
| Walk | 528 | 437 | −17.2% |
| Car | 896 | 936 | 4.5% |
| Motorcycle/scooter | 7 | 3 | −57.1% |
| Bus | 811 | 885 | 9.1% |
| Train | 666 | 688 | 3.3% |
| Sharing mobility | 2 | 2 | 0.0% |
| Electric scooter | 1 | 0 | −100.0% |
| Airplane | 3 | 3 | 0.0% |
| I do not attend | 3 | 0 | −100.0% |
Publisher’s Note: MDPI stays neutral with regard to jurisdictional claims in published maps and institutional affiliations. |
© 2021 by the authors. Licensee MDPI, Basel, Switzerland. This article is an open access article distributed under the terms and conditions of the Creative Commons Attribution (CC BY) license (https://creativecommons.org/licenses/by/4.0/).
Share and Cite
MDPI and ACS Style
Cappelletti, G.M.; Grilli, L.; Russo, C.; Santoro, D. Sustainable Mobility in Universities: The Case of the University of Foggia (Italy). Environments 2021, 8, 57. https://0-doi-org.brum.beds.ac.uk/10.3390/environments8060057
AMA Style
Cappelletti GM, Grilli L, Russo C, Santoro D. Sustainable Mobility in Universities: The Case of the University of Foggia (Italy). Environments. 2021; 8(6):57. https://0-doi-org.brum.beds.ac.uk/10.3390/environments8060057
Chicago/Turabian StyleCappelletti, Giulio Mario, Luca Grilli, Carlo Russo, and Domenico Santoro. 2021. "Sustainable Mobility in Universities: The Case of the University of Foggia (Italy)" Environments 8, no. 6: 57. https://0-doi-org.brum.beds.ac.uk/10.3390/environments8060057
Note that from the first issue of 2016, this journal uses article numbers instead of page numbers. See further details here.