Article

Assessment of Fish Abundance, Biodiversity and Movement Periodicity Changes in a Large River over a 20-Year Period

1
Laboratory of Fish Demography and Hydroecology, Management of Aquatic Resources and Aquaculture Unit, Freshwater and Oceanic Science Unit of Research-FOCUS, University of Liège, 22 Quai E. Van Beneden, B-4020 Liège, Belgium
2
SPW, Public Service of Wallonia, 15 Avenue Prince de Liège, B-5100 Jambes, Belgium
*
Author to whom correspondence should be addressed.
Submission received: 24 November 2021 / Revised: 25 January 2022 / Accepted: 27 January 2022 / Published: 29 January 2022
(This article belongs to the Special Issue Feature Papers in Environments in 2021)

Abstract

:
A river is an ecosystem where fish fauna represents an important structural element. To re-establish connectivity, it is imperative to allow movement between functional habitats. Due to the hydromorphological complexity of large anthropized rivers and the lack of study techniques that can be used in such environments, relevant data with regard to fish ecology are scarce. On the River Meuse, Belgium, at a point 323 km upstream from the North Sea, the Lixhe hydroelectric dam is equipped with two fishways. Both were continuously monitored using capture traps for 20 consecutive years (from 1999 to 2018), representing 4151 monitoring events. The objectives of the present study were to describe the overall abundance and movement indicators of mainly holobiotic potamodromous fish species and to analyse their temporal evolution. We captured 388,631 individuals (n = 35 fish species) during the 20 years of fishway monitoring; 22.7% were adults (>75% of which were cyprinids), and 83.3% juveniles (>90% cyprinids). From 1999 to 2018, the results showed a drastic reduction in yearly captures for some native species as well as the apparent emergence of non-native (e.g., Silurus glanis) and reintroduced species (e.g., Salmo salar). The annual capture periodicities associated with environmental factors were clearly defined and were mostly related to the spring spawning migration of the adult stage. This long-term monitoring demonstrated how the fishways are used by the whole fish community and allowed a better understanding of their movement ecology in a large lowland anthropized river. The appearance of non-native species and the drastic decline in abundance of some common and widespread European fish should prompt river managers to adopt conservation measures.

1. Introduction

Rivers are fragmented by many obstacles for the purposes of hydropower, navigation, flow control, or water supply [1]. River fragmentation by dams causes physicochemical and hydromorphological modifications of upstream and downstream habitats, hydropeaking, alterations to the river’s natural flow, and obstruction to sediment and biological organisms such as fish and invertebrates [2,3,4]. In an ecosystem where fish fauna represents an important functional element, it is imperative to re-establish connectivity to allow each species to complete its life cycle [5,6,7], because these barriers fragment previously natural rivers and can thus preclude movement between functional habitats [8,9]. The complete removal of obstacles would constitute the ideal scenario, but this is typically complicated to implement due to the presence of numerous social and usage constraints [4,10]. A mitigation solution for the restoration of free movement is the development of a fishway, which must be multi-species and allow the circumvention of the obstacle in question by both diadromous (highly migratory) and potamodromous species [5,9,11,12]. The latter are important because they constitute sentinel species in terms of the ecological conditions of river environments due to their abundance and their ecological requirements.
Anthropogenic pressures such as migration barriers can affect global freshwater biodiversity [13]. Temporal surveys offer a useful means to detect potential effects, including the identification of endangered species [14]. Nevertheless, long-term comparisons of fish assemblages in rivers are rarely possible because of the scarcity of historical data [15]. Consequently, few studies have attempted to highlight multi-species temporal evolutions in complex environments such as lowland rivers using point-electrofishing data [16,17,18], or partial count data from fishways [19], where the data are not collected using the same method in the same place within a historical context. Electrofishing in small units of a habitat is frequently performed in large rivers where extensive fish surveys are impossible, but inevitably provides uncertain estimates of fish community characteristics [20]. Moreover, presence and absence data do not reflect the majority of changes in biota, given that such changes are more complex than the simple disappearance or appearance of particular species; a more nuanced understanding can only be obtained from a quantitative analysis [15]. Indeed, the International Union for Conservation of Nature (IUCN) uses the rate of abundance decrease as a criterion for building its Red List. Furthermore, surveys of fish populations provide crucial information on the population dynamics of invasive species, thereby allowing identification of those species for which control operations are required [14]. Finally, climate change, habitat degradation, and artificial connections between river basins can enable the establishment of invasive species, which present an ecological risk through affecting community structure and ecosystem functions [19,21].
Studies of potamodromous fish species’ mobility patterns tended to use radio telemetry, e.g., [22,23,24,25], Passive Integrated Transponder (PIT) telemetry [11,26] and, more recently, acoustic telemetry, e.g., [27,28,29,30]. Fish movements have rarely been studied in large lowland hydrosystems, as noted by Radinger and Wolter [31] in their review, finding that 80% of studies involved small rivers (<15 m3/s) with a narrow stream width (<10 m). This situation can be explained by both practical and environmental constraints. Indeed, although the data collected by active telemetry (radio and acoustic) tend to be very accurate, these methods require significant financial (transmitters, detection systems) and human resources (e.g., fish capture, tagging, fish tracking, data processing). Another limitation of such studies is the duration as demonstrated by Radinger and Wolter [31], who noted a median duration of 150 days, mainly due to the short life span of the transmitters used and the small number of species and individuals studied.
New methods of fish-passage inventories have appeared with the development of video [32], but their operation has proved limited owing to the turbidity that exists in lowland rivers and the difficulty of distinguishing between close species. A fishway combined with a capture trap with a real and continuous counting may be an alternative tool for studying fish abundance and fish movements at a multi-species level in such environments, considering that a fishway in the upstream direction is necessary to enable movement towards upstream habitats [11]. The use of a capture trap at large time scales allows one to collect complementary information on the local fish fauna, such as changes in species diversity, abundance, and seasonality of migration patterns, at different developmental stages [5,19]. The simultaneous and continuous recording of environmental factors allows the identification of thresholds (triggers or inhibitors) affecting fish movements, such as spawning migration and dispersal movement outside the spawning season [33,34]. Indeed, it is imperative to study fish behavioural ecology more precisely at large time scales in order to improve our understanding of their biological responses, particularly when environmental changes (both climatic and anthropogenic) are so prevalent.
In the lowland Belgian Meuse River, two fishways (an old pool-type and a new vertical-slot pool-type) equipping a hydroelectric dam have been monitored by capture traps, using the same methodology for 20 consecutive years. Such long-term monitoring can be regarded as a useful tool to understand changes in an aquatic environment, using fish as biological sentinel species. The aims of this study were to study the overall and temporal evolution of fish abundance as well as fish movement indicators of holobiotic potamodromous and diadromous fish species in the River Meuse at multi-species and multi-stage scales. We analysed: (i) fishway utilisation (fish biodiversity, headcount, biomass and proportion of different life-stage and ecological groups); (ii) the difference in fish biodiversity between the old and new fishways; (iii) the evolution of fish communities, using abundance and fish biodiversity indices over time; and (iv) mobility patterns at annual scales for adult and juvenile stages using fish movement indicators and their changes over time.

2. Materials and Methods

2.1. Study Site

The Meuse River basin drains a catchment area of 36,000 km². The Belgian downstream part of the Meuse has an average annual discharge of 400 m3/s and is, therefore, classified as a bream fish zone [35]. This study was conducted at the first dam of the Belgian part of the Meuse (at Lixhe), 323 km upstream from the North Sea, on a non-navigable part of the river. Built in 1980, the Lixhe dam, which measures 8 m high (Figure 1), was built to facilitate navigation and to produce hydroelectricity via its four Kaplan turbines on the right bank of the river (a 23,200 kW hydroelectric plant). Since its construction, a first fishway F1 (Table 1) working at low discharge (maximum 0.3 m3/s) has been located in the middle of the dam between the turbines and the valves. F1 is equipped with a cone trap in the most upstream pool and a fine grid in the upstream slot, retaining all the fish that use it, including eels and small fish (minimum capture size: 10 mm). A second fishway F2 (Table 1) was built in 1998 to cater more specifically for the migration of large fish species such as Atlantic salmon Salmo salar and sea trout Salmo trutta. It operates at high flow (1 m3/s) and includes an attraction flow of 2.5 m3/s. F2 is located on the right bank and is equipped with a cage trap and a lift in the upper pool, which retains large fish, but not eels and small fish (minimum capture size: 150 mm).

2.2. Fishway Monitoring and Environmental Factors

From January 1999 to December 2018 (20 years), fishways and capture traps were in continuous operation and were each equipped with an upstream grid preventing the capture of individuals from upstream. Any fish (>150 mm for F2) that arrived upstream of the pass was therefore present in the trap while waiting to be monitored. A total of 4,151 fishway monitoring events of capture traps were performed (n = 1,704 for F1, and n = 2,447 for F2). The monitoring frequency of capture traps varied from one to five times per week (mean times = 2.3/week), according to the intensity of fish capture. From 2011, for safety reasons during winter conditions, F1 was monitored only between April and October, although only 1.3% of captures were observed in F1 from 1999 to 2010. During monitoring, the upstream part of F1 was completely closed to drastically reduce the flow within the five first pools, and fish were caught with a dip net in the upper pool. During the monitoring of F2, a grid was manually placed downstream of the cage just before the ascent, preventing other fish from passing during the monitoring. The cage was lifted partially out of the water. On each monitoring date, captured individuals were: (i) taken out of the upstream pool of F1 or the cage of F2 with a hand net; (ii) placed in a tank containing river water; (iii) anaesthetised in a solution of 4-allyl-2-methoxyphenol (Eugenol: 0.1 mL/L); (iv) identified to the species level, counted, measured (±1 mm, fork length), and weighed (±1 g); they were then (v) released upstream of the dam after a 10-minute recuperation period.
Fish were categorised into the ecological groups (eurytopic, limnophilic and rheophilic species) proposed by Schiemer and Spindler [36] according to their preferred habitat. We used Philippart and Vrancken’s [37] research on the Meuse River basin to delineate the size limit (maturity size) between adult and juvenile stages for each fish individual of all species. Water temperature (°C) was recorded continuously every hour using data loggers (Tidbit Onset) installed at the inlet of F1. Hourly flow data (m3/s) and hourly dissolved oxygen (mg/L) were provided by the Wallonia Public Service of Hydrological Studies (SETHY, Walloon Region) of a station installed just upstream of the Lixhe dam. The environmental data were then transformed into daily average values. During each monitoring event, each fish capture was linked with the environmental data of the previous day’s capture [5].

2.3. Data and Statistical Analysis

We analysed environmental factors during the study period (1999 to 2018) using boxplots. To detect any monotonic temporal trend, non-parametric Mann–Kendall tests (MK test) [38,39] were applied to the median annual values for water temperature, water flow, and dissolved oxygen. The relative abundance of captured fish for both fishways was described at the ecological group level and at the species level for both stages. The distribution of proportions of adult and juvenile stages was compared between the fishways using the parametric chi-square test. We studied temporal trends in: (i) proportions by year of headcount and biomass (total and by ecological group), and (ii) capture headcount by year for the most abundant species for both stages, using the MK test (positive trend = increase in capture by year; negative trend = decrease in capture by year). The mobility patterns were defined by annual capture periodicities through the date of capture within fishways. To investigate the characteristics of capture periodicities by capture peak, for adult and juvenile stages, environmental values (temperature and flow) and fish-size data were assigned to the 10th, 50th, and 90th percentiles for fish species with a total abundance of more than 10 individuals over the 20 years of monitoring. Finally, we analysed temporal trends (MK test) in migration phenology for the adult stage of the most abundant species (reaching a minimum of five individuals over 10 years) and used a simple linear regression analysis to identify relationships between migration indicators by year, the capture headcount per year, and the mean spring temperature. For all statistical tests, the significance level was set at p < 0.05 and performed using the R statistical programme (The R Foundation for Statistical Computing, Vienna, Austria, version 3.1.1.).

3. Results

3.1. Fluctuations in Environmental Factors

The median annual water temperature between 1999 and 2018 (median annual value ± IQR) varied between 13.6 ± 11.7 °C (2012) and 17.0 ± 11.0 °C (2007, Figure 2). The median annual water flow between 1999 and 2018 varied between 41.8 ± 158.6 m3/s (2005) and 358.4 ± 441.4 °C (2001). No significant positive or negative temporal trend was observed in median annual water temperatures or median annual water flows (MK test, p > 0.05). The median annual dissolved oxygen showed a significant positive temporal trend (MK test, tau = 0.35, p = 0.03), with values ranging from 6.6 mg/L to 10.1 mg/L.

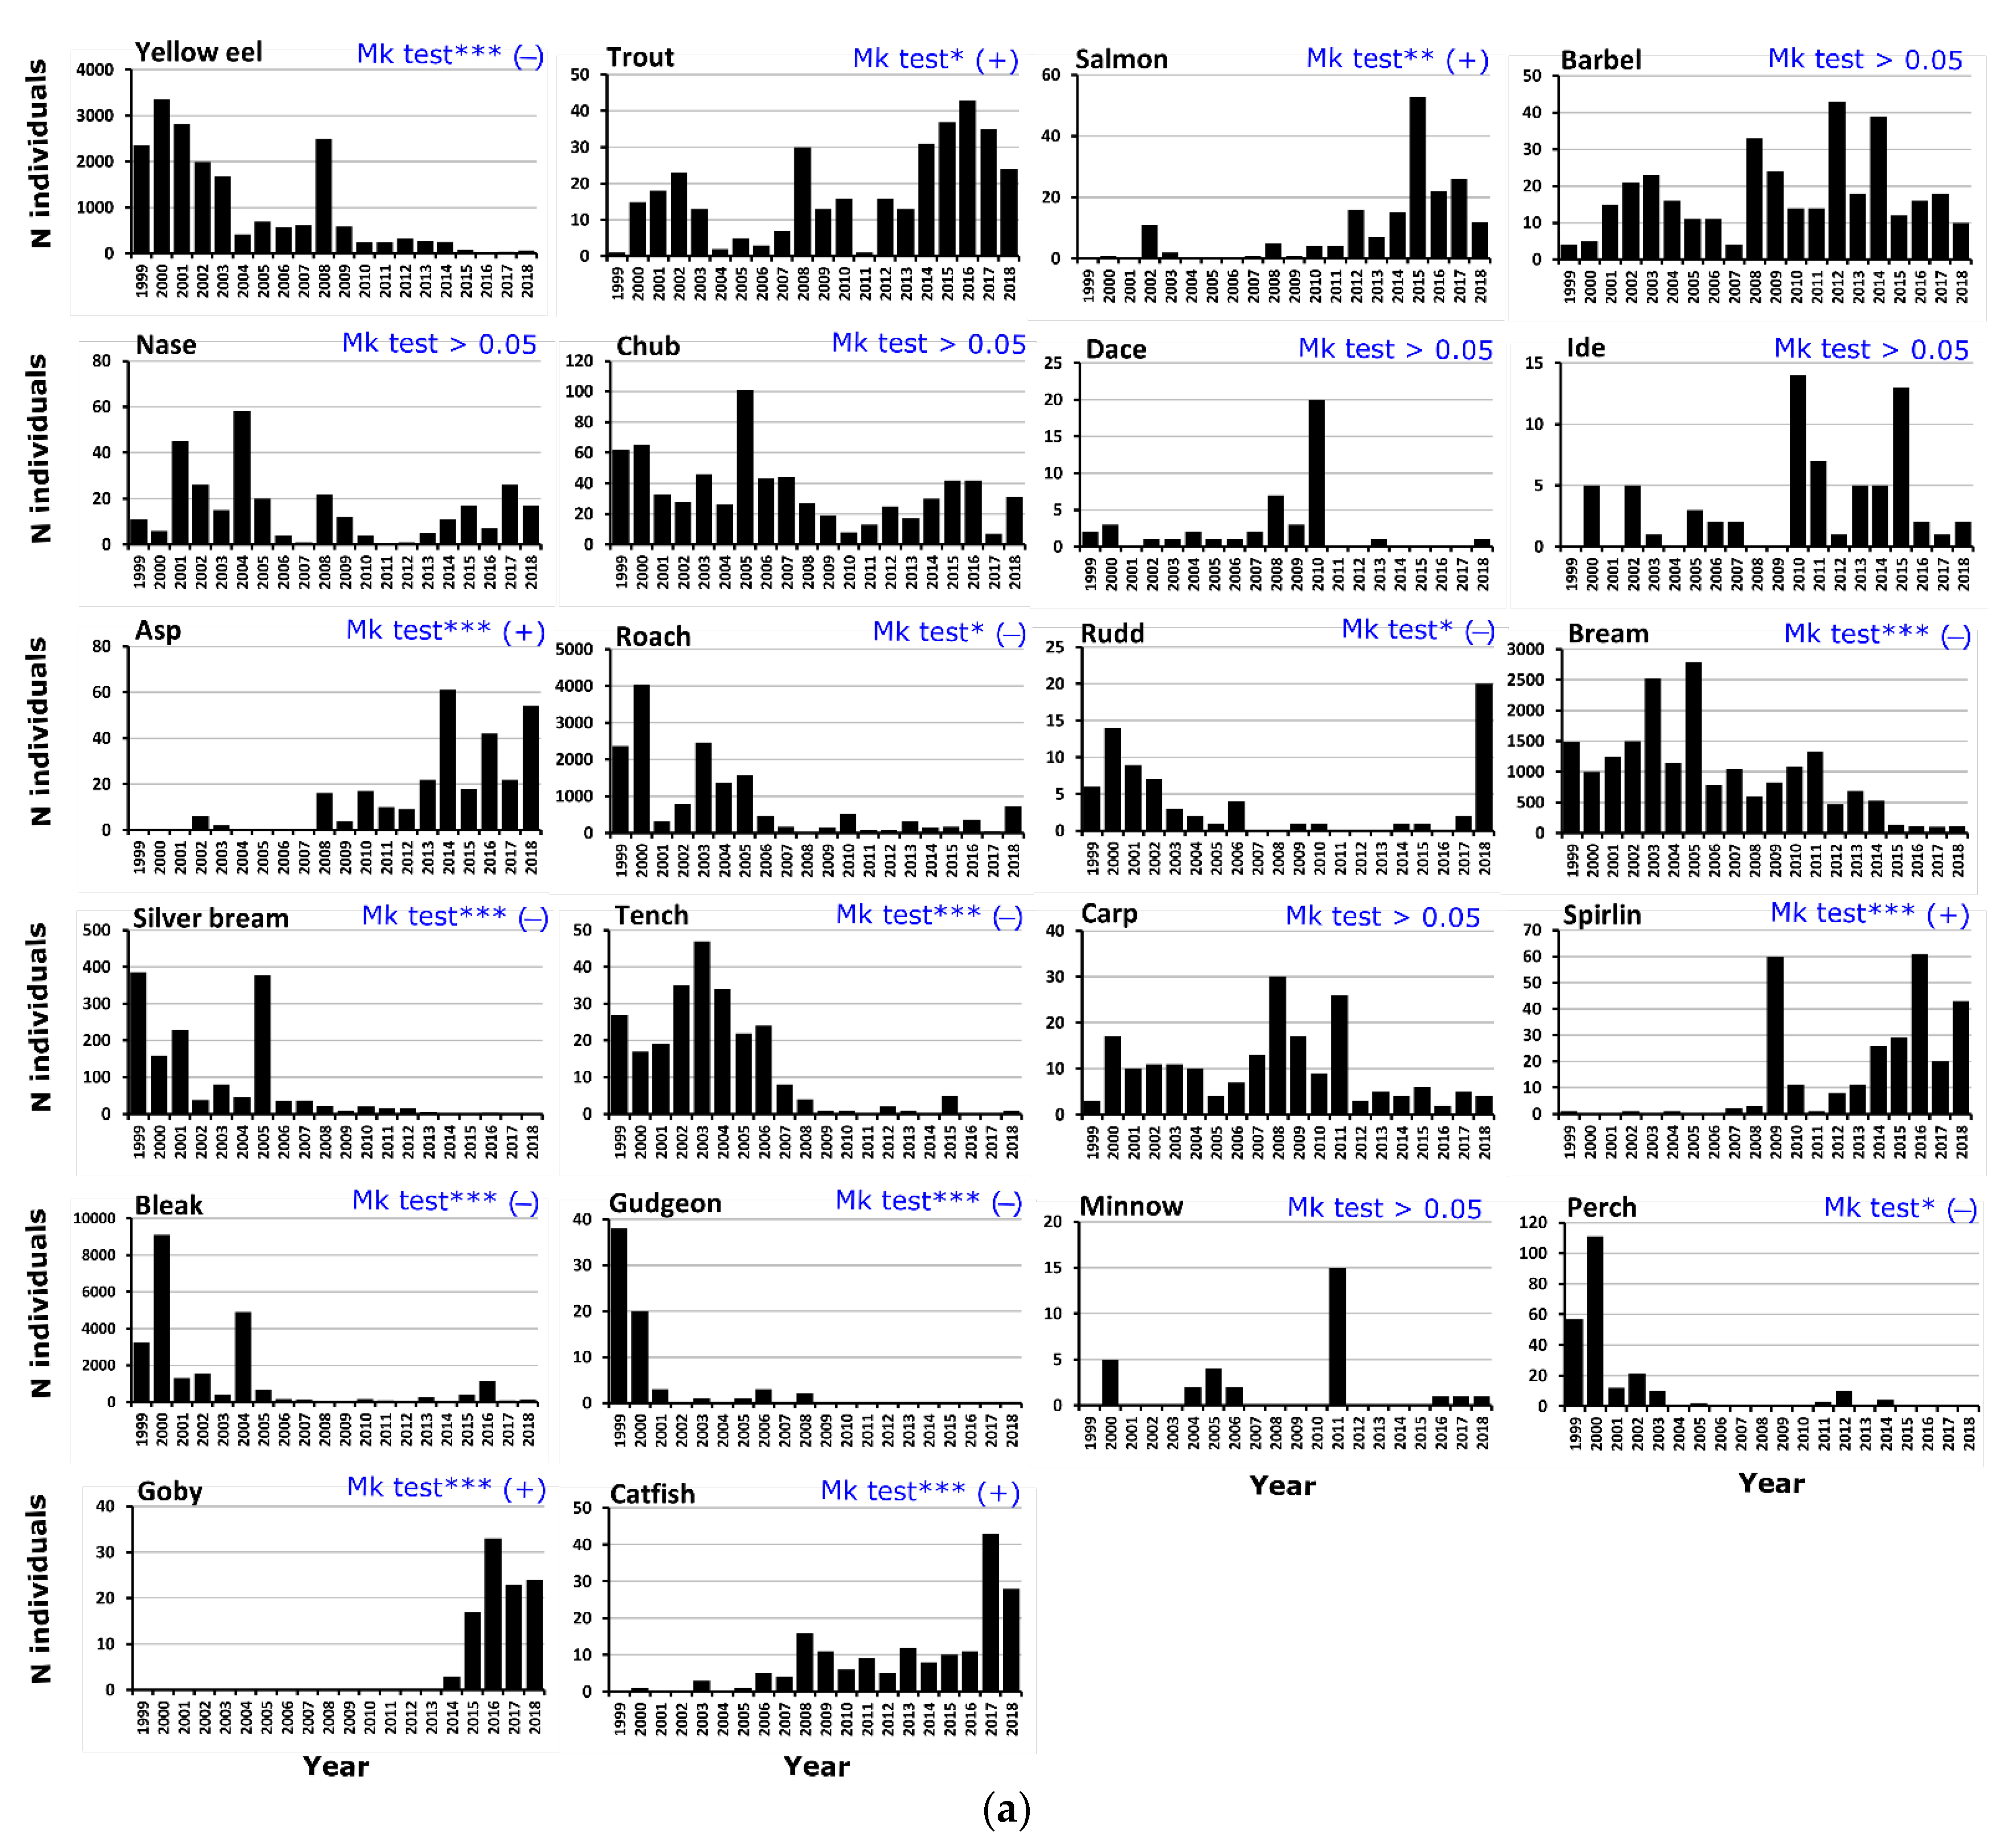
3.2. Overall Biodiversity and Change over Time

From January 1999 to December 2018, 388,631 fish belonging to 35 species were captured in the fishways of the Lixhe dam (93.6% in F1, 6.4% in F2; Table 2), with a total biomass of 30,229 kg. Juveniles accounted for 83.3% of total captures in terms of the number of individuals and for 2.5% of the total biomass. The proportions of adults and juveniles differed significantly between F1 (16.3% vs. 83.7%, respectively) and F2 (99.4% vs. 0.6%, respectively) (chi-square test, p < 0.001). Combining the data from F1 and F2, the most represented fish families were Cyprinidae (85.4%), Aercidae (9.3%) and Anguillidae (4.9%). By ecological group, eurytopic species were in the majority (88.4%), far exceeding limnophilic (9.5%) and rheophilic species (2.1%). At the specific level, roach Rutilus rutilus (67.6%), common bleak, Alburnus alburnus (17.9%) and perch Perca fluviatilis (11.7%) were the most frequently captured species in the juvenile stage. In the adult stage, the most common species were common bleak (28.4%), common bream Abramis brama (23.2%), European eel Anguilla anguilla (22.8%), and roach (19.2%).
Over the 20-year period, in the case of the adult stage of all species, we observed a significant negative temporal trend with regard to the proportions of all individuals captured per year (MK test, tau = −0.72, p < 0.001) (Figure 3). In terms of ecological groups, there were significant temporal trends (negative) only for proportions of eurytopic individuals at adult stage (MK test, tau= −0.74, p < 0.001). Furthermore, in the adult stage, there were significant negative temporal trends (MK test, p < 0.05) with regard to the total biomass captured per year (tau = −0.54) and the proportions of eurytopic (tau= −0.55) and limnophilic biomass (tau = −0.54). On the other hand, we observed a significant positive temporal trend with regard to the proportion of rheophilic biomass per year (MK test, tau = 0.50, p = 0.002). The number of adults per year (Figure 4a) significantly decreased over time (MK tests, p < 0.05) for nine species: bream (tau = −0.81), yellow eel (tau = −0.74), tench (tau = −0.63), silver bream (tau = −0.62), gudgeon (tau = −0.60), bleak (tau = −0.44), perch (tau = −0.41), roach (tau = −0.41), and rudd (tau = −0.37). Conversely, we observed a significant increasing trend between 1999 and 2018 with regard to the number of adults (MK test, p < 0.05) of six species: catfish (tau = 0.70), asp (tau = 0.69), spirlin (tau = 0.67), goby (tau = 0.64), Atlantic salmon (tau = 0.62), and trout (tau = 0.41). The species showing no significant temporal trend in number in the adult stage (MK test, p > 0.05) were chub, dace, nase, carp, barbel, ide, and minnow.
Over the 20-year period, in the case of the juvenile stage of all species, we observed a significant negative temporal trend (MK test, p < 0.001) with regard to the proportions of all individuals captured per year (tau = −0.46, p < 0.001) and for the total proportions of biomass captured per year (tau = −0.39) (Figure 3). In terms of ecological groups, there were significant negative temporal trends (MK test, p < 0.05) only for the proportions of eurytopic individuals (tau = −0.47) and eurytopic biomass (tau = −0.48). Six species showed a significant decreasing trend (MK test, p < 0.05; Figure 4b) in number over time: chub (tau = −0.62), bream (tau = −0.60), roach (tau = −0.59), bleak (tau = −0.55), dace (tau = −0.40), and nase (tau = −0.39). Two species significantly increased in number between 1999 and 2018 (MK test, p < 0.05): goby (tau = 0.64) and asp (tau = 0.50). The other four species represented in the juvenile stage (roach, ide, spirlin, barbel and perch) showed no significant temporal trend in number (MK test, p > 0.05).

3.3. Overall Fish Movement Indicators and Their Changes over Time

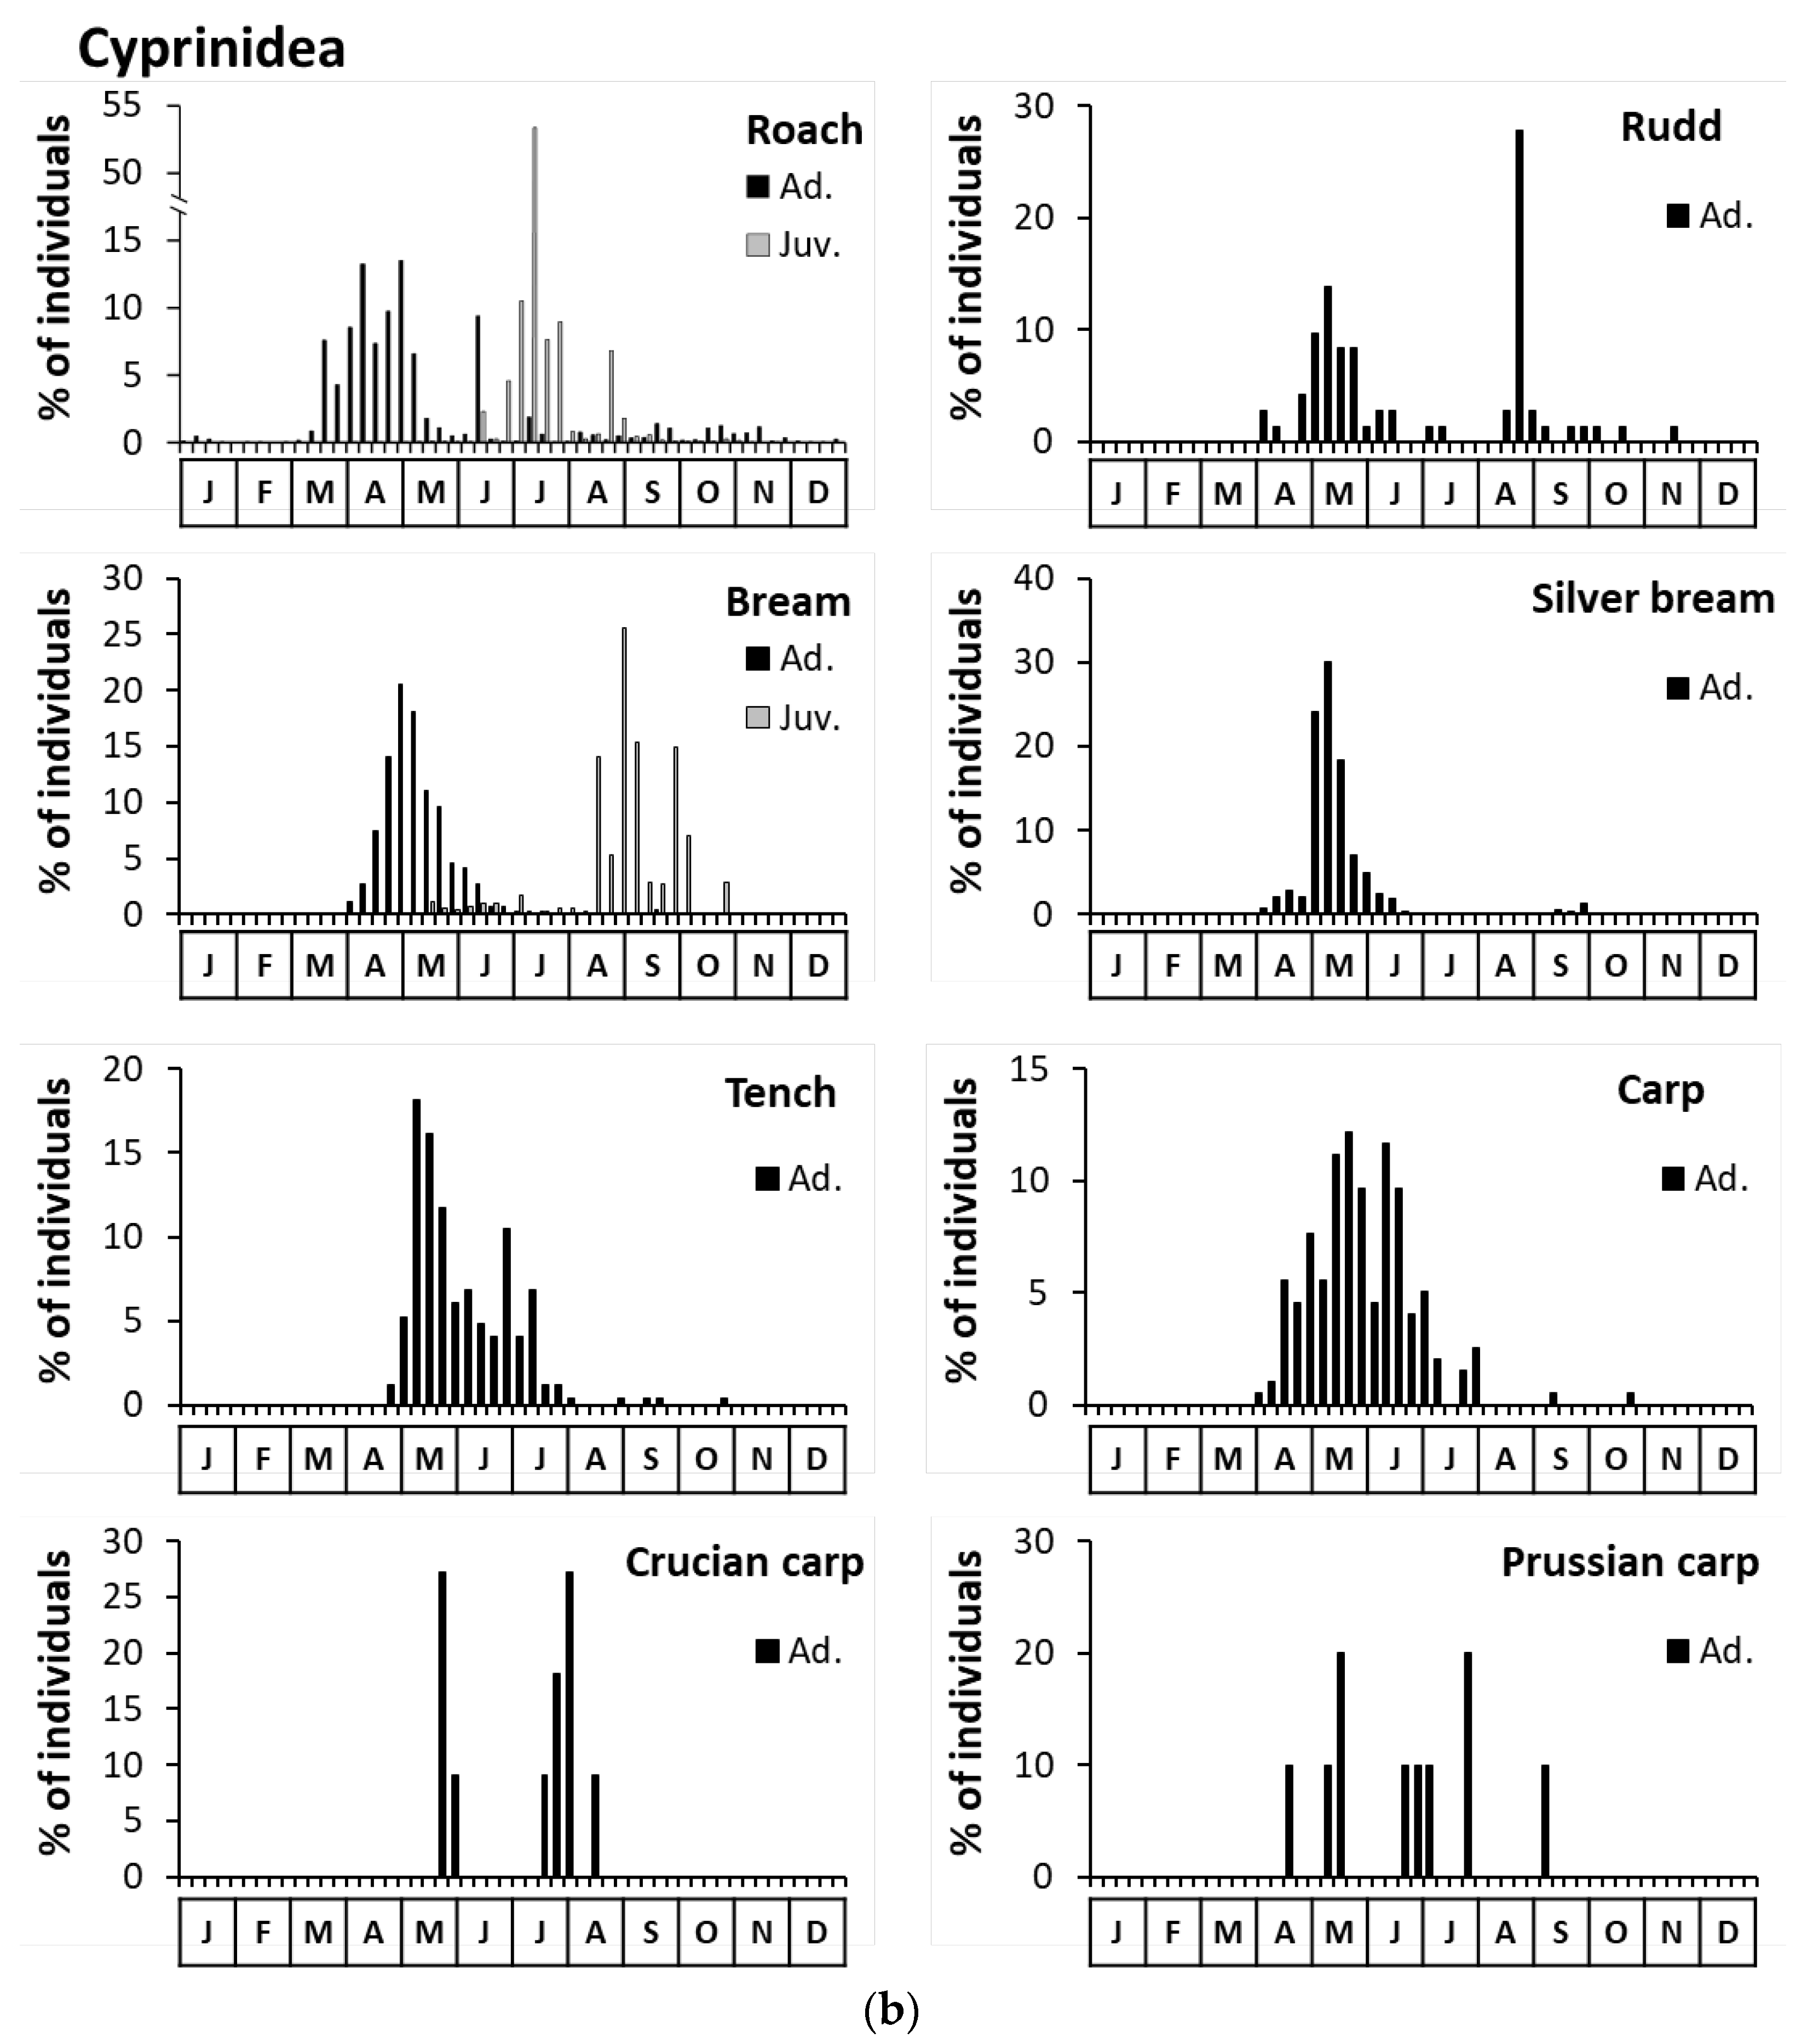
3.3.1. Annual Capture Periodicities by Species

Among the 35 species captured, a degree of seasonality was observed in the adult stage in 24 species (Figure 5a–c). Some species were captured mainly during the spring: nase (97.7%), bream (97.1%), silver bream (97.1%), bleak (89.3%), chub (85.6%), roach (85.2%), gudgeon (83.8%), and carp (83.7%). One species (spirlin) was captured mainly during the summer (90.3%). Several species were captured in the trap during the spring and the summer: asp (79.9% in spring, 19.8% in summer), catfish (78.0%, 20.8%), goby (75.0%, 23.0%), tench (74.2%, 25.4%), minnow (64.5%, 35.5%), eel (60.9%, 38.9%), rudd (55.6%, 38.9%), Prussian carp (50%, 50%), and crucian carp (36.4%, 63.6%). Three other species were observed during the spring and the autumn: barbel (69.8% in spring, 25.6% in autumn), dace (51.1%, 46.7%), and ide (45.6%, 45.7%). Finally, some species used the fishway during the spring, the summer, and the autumn: perch (75.5% in spring, 13.9% in summer, 9.7% in autumn), trout (40.7%, 25.4%, 28.6%), and salmon (36.1%, 11.1%, 51.1%).
During the study period, the seasonality of capture in the juvenile stage was calculated for 13 species (Figure 5a–c). Juveniles were mainly captured during the summer: asp (99.6%), perch (99.4%), ide (97.2%), roach (96.2%), chub (92.7%), and bleak (92.2%). Six species were captured during the summer but also during the spring and the autumn: barbel (15.9% in spring, 72.6% in summer, 11.5% in autumn), bream (5.0%, 69.9%, 25.1%), dace (15.6%, 62.5%, 18.7%), nase (17.7%, 57.1%, 24.2%), goby (54.9%, 42.8%, 2.2%), and spirlin (56.6%, 42.3%, 1.2%). Minnow juveniles were captured only in the spring.

3.3.2. Fish Size and Environmental Factors Associated with Captures

During the monitoring period 1999–2018, water temperature and flow were associated with the capture peaks of 22 species in the adult stage (Table 3). The median size by species in the adult stage and by capture peak ranged from 66 mm (goby) to 1033 mm (catfish) for the capture size. Nase was the species with the lowest median capture temperature (11 °C) and the highest median capture flow (263.3 m3/s) during the spring between the 78th and the 108th days of the year (from 19 March to 18 April). Bleak was the species with the highest median capture temperature (23 °C) during the summer between the 183rd and the 239th days of the year (from 2 July to 27 August).
The size, temperature, and water flow ranges for juvenile captures were defined for 13 species (Table 4). The median capture size values per species in juvenile stage and per peak capture ranged from 36 mm (nase) to 105 mm (bream). Bleak was the species with the highest median capture temperature (24.2 °C) as a juvenile during the summer between the 207th and the 240th days of the year (from 27 July to 28 August). Roach juveniles captured during the spring exhibited the lowest median capture flow (25.4 m3/s).

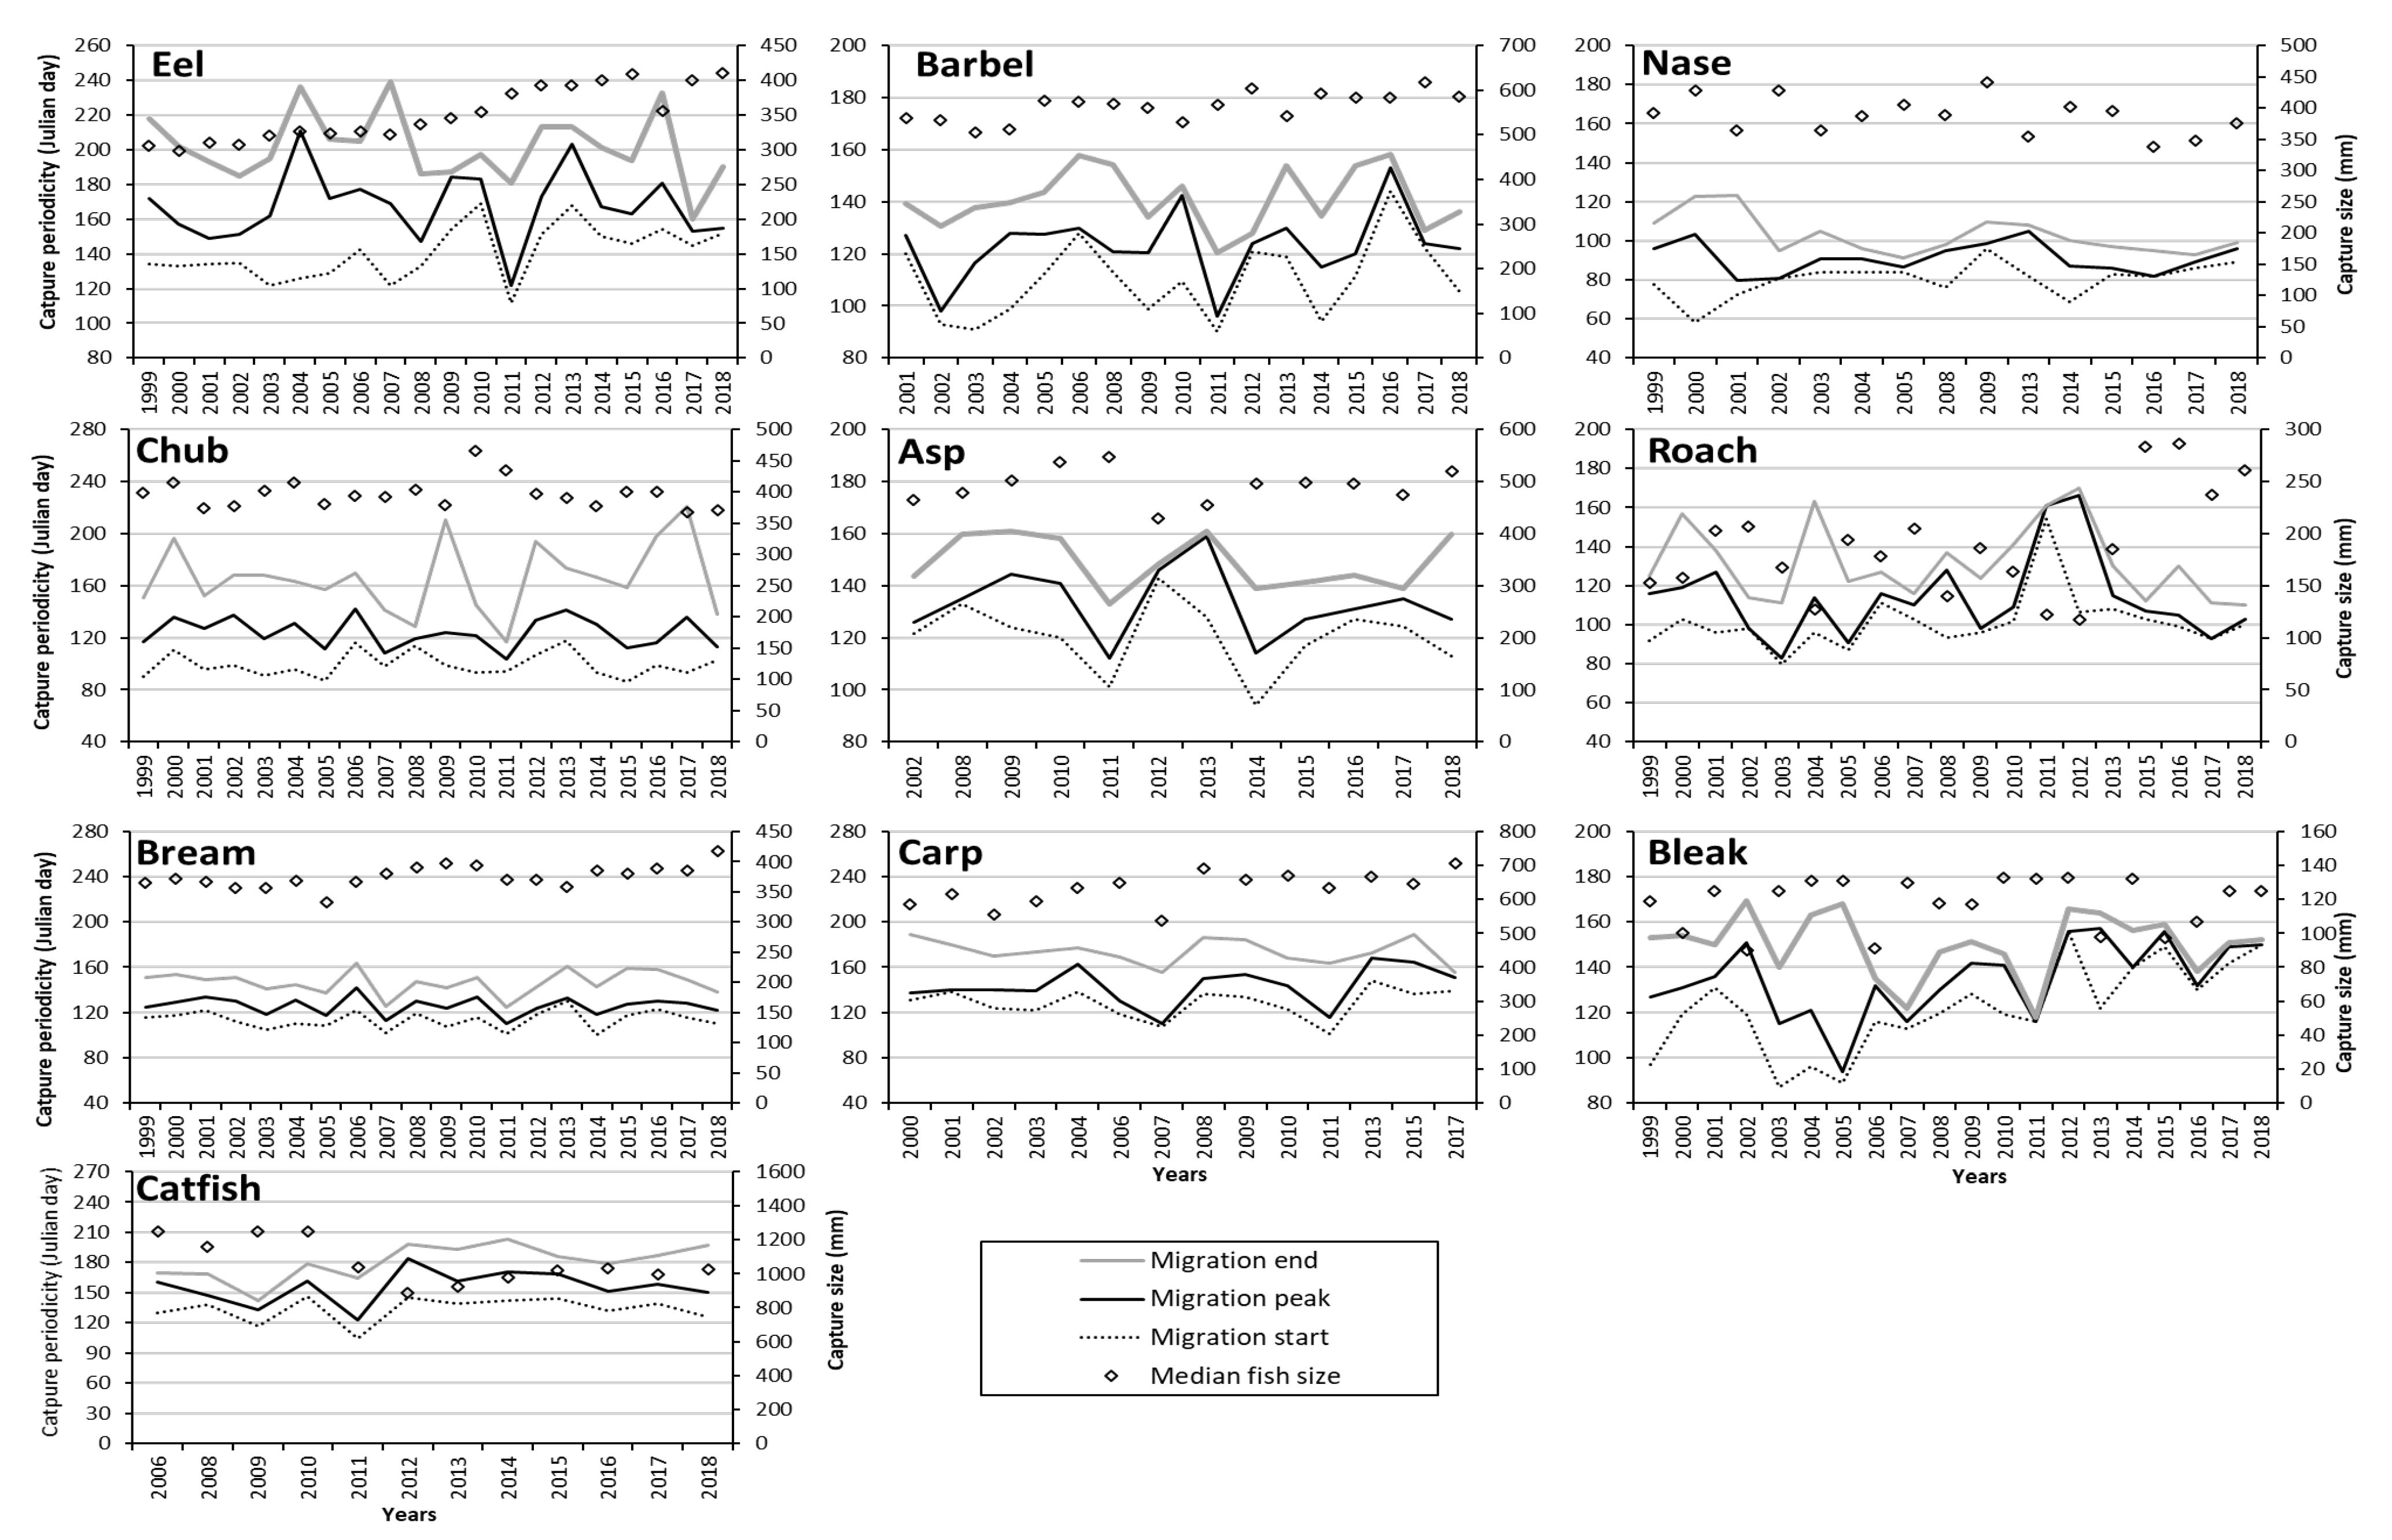
3.3.3. Temporal Trends in Fish Movement Indicators and Fish Size

The temporal trends in migration indicators over the study period were analysed with respect to nine species in the adult stage during their spawning migration (Figure 6), reaching a minimum of five individuals over 10 years. The start migration showed a positive temporal trend only for eel (from 134th to the 152th day of the year), nase (from 78th to the 89th day of the year), and bleak (from 97th to 150th day of the year) (MK tests, p < 0.05). Bleak also showed a significant positive temporal trend of the migration peak (from 127th to 150th day of the year) (MK test, p = 0.03). These temporal trends in the timing of migration were not significantly associated with the numbers captured (linear regressions, p > 0.05), but they were associated with the mean spring temperature (linear regressions, p < 0.05) for eel (migration start) and bleak (migration peak). Other species without a significant temporal trend showed migration indicators significantly negatively related to the mean spring temperature (linear regression, p < 0.05): eel (migration peak), barbel (migration start, peak, and end), chub (migration start and peak), asp (migration start and peak), bream (migration start, peak, and end), and carp (migration start and peak). The median size of four species (eel, barbel, bream, and carp) exhibited a significant positive temporal evolution (MK test, p < 0.05), with increases ranging from 46 mm (barbel) to 113 mm (carp). The increase in size of eel and bream were significantly associated with decreased numbers of annual captures (Table 5).

4. Discussion

Prior to this study, a continuous manual monitoring of fishways over a 20-year period using capture traps at a multispecies level had never been undertaken. However, it proved to be an efficient method for the acquisition of data on fish ecology in a large lowland river. The presence of two distinct meso-habitats (the river banks and the main river channel) in large rivers has far-reaching implications for assessments of fish populations in such large ecosystems [40]; a combination of sampling methods would be required to capture more species and to complete the species inventory [40,41]. Although the analysis of fishway use is an indirect and selective fish inventory method which provides no information on resident individuals, it is still a useful tool for riverine management. In particular, it is useful for analysing the evolution and migration dynamics of fish populations over long periods of time [5,12,42]. Biodiversity measures enhance our understanding of the complex components driving ecosystems [43], but data may be biased, because the abundance of species and the densities of fish can vary in identical habitats during ontogeny [44], from season to season, and even from day to night [45]. Continuous, multi-annual monitoring helps to counter these difficulties in ecosystems where fragmentation causes freshwater biodiversity to decline [8]. In addition to the potential selectivity of the fishway, which is contingent on its multi-species efficiency [9,46], another potential source of bias is the fact that many fish species are either largely stationary or largely mobile throughout their life cycle [31], meaning that the data collected via fish passage monitoring only cover the mobile fraction of the population. Furthermore, it is essential to assess fish migration dynamics after the restoration of longitudinal connectivity with fishways and the most efficient post-evaluation studies in this regard involve long-term monitoring [46].
During the 20 years of monitoring, 388,631 individuals representing 35 species were recorded. The proportions of juveniles and small species were higher in the pool-and-weir fishway, F1. This is partly because F2 cannot capture fish less than 150 mm in length, which leads to underestimates of juveniles and small species in the latter. Although juveniles were frequently observed in F1, it was not possible to assess the fishway preferences of juveniles, eels, and small species. However, it was clear from the comparison of ecological categories between fishways that large rheophilic species preferred the modern fishway, as already observed by Stuart and Berghuis [47]. With regard to both fishways, the families most represented in the adult stage were Cyprinidae (85.4%) and the ecological group of eurytopic species (88.4%). As previously observed for the annual headcount of the diadromous eel in the River Meuse [48], the annual headcount of many eurytopic and limnophilic species (roach, rudd, bream, silver bream, tench, bleak, and perch) decreased drastically, despite several years of improvement in the physicochemical water quality of the River Meuse. Although temperature and flow trigger the movement of most fish species, we did not observe a mutual trend between temperature and flow and the annual quantity of mobile individuals captured in the studied fishways. On the contrary, we observed a significant increase in dissolved oxygen in the river, following the construction of numerous sewage treatment plants [49], whereas populations of eurytopic and limnophilic species showed a significant decrease in headcount over time. Declining fish abundance is thought to owe to the effects of the reported drastic decline in phytoplankton biomass simultaneously with the sufficient presence of nutrients for plankton growth [19], prompted by the large-scale invasion of Asian clams, Corbicula spp. [50]. Unlike rheophilic species, which showed an increasing temporal trend in their proportion of biomass, limnophilic and eurytopic fish species clearly preferred eutrophic water bodies inversely correlated to water quality [51] and were probably affected by this decrease in resources at the base of the food pyramid [16,30]. Other hypotheses include a possible increase in predation by the great cormorant Phalacrocorax carbo [52] and the appearance of piscivorous fish species. One study has suggested that the emergence of catfish in a new setting had little impact on the composition of the ichthyofauna present [53], but counts of catfish and asp both significantly increased over the period investigated. These noted increases will likely have implied a new predation pressure on the largest native fish species (which previously were rarely consumed by native predatory fish), resulting in potentially different trophic interactions [54,55] as have been reported for salmon [56]. Moreover, the decreases in captures in the adult stage were accompanied by significant decreases in the juvenile stage in some species, especially eurytopic species such as roach, bream, and bleak, suggesting a possible overall decrease in the recruitment of these species into the Meuse basin. Nevertheless, inter-annual fluctuations in the number of captured juveniles appear to be related to shoal effects [5], as captures were generally found to be clumped in time and counts might have been underestimated from 2011, when the F1 monitoring period was shortened.
The construction of F2 in 1998 at Lixhe dam was a part of the ‘Meuse salmon programme’ that aims to restore the complete life cycle of migratory salmonids in the River Meuse basin, improving free movement (upstream and downstream) via the installation of modern fishways adapted to diadromous salmonids [57]. The continuous monitoring revealed the first beneficial outcome of the restoration project: a significant upward trend in the number of adult salmon and sea trout in reproductive migration caught in the lower Belgian Meuse. A low number of returning Atlantic salmon in the lower Belgian Meuse currently remains, supported by a stocking management strategy [58] aimed at maintaining a naturally sustainable population. Indeed, the River Meuse is equipped with several no fish-friendly hydropower plants which have a negative impact on the survival of downstream migratory fish. Supplementary efforts must be undertaken in the future, especially to evaluate the efficiency of fishways [4] and thereby support smolts’ downstream migration and escapement success as well as to optimise restocking practices [59,60]. Furthermore, the continuous monitoring of fishways is a good tool for identifying and quantifying invasion of non-native species. Indeed, in the Belgian Meuse, the emergence of the piscivorous species asp and catfish (as already mentioned) was identified in the early 2000s, while goby was first seen in the early 2010s. All three species increased during the study period, while another six non-native species were seen more occasionally. The addition of invasive species further impairs the functions and services of such already fragile ecosystems [13]. Moreover, the artificialisation of ecosystems appears to be a key driver of non-native species’ colonisation around the world [16], and the connection of large hydrographic basins for navigation facilitates these invasions [61]. Selective fish passage technologies that allow the passage of native species without aiding the dispersal of non-natives would increase the management options available both to protect vulnerable species and to meet legislative obligations [62].
Our analysis of the seasonal variations in captured adult abundances revealed that fishway use was distributed throughout the year, with a clear periodicity of movements indicating that populations of potamodromous species carry out migratory movements. Three main seasonal peaks of fish mobility (spring, summer, and autumn) were clearly observed, as already recorded in the Meuse [11] and other medium-sized rivers [5]. The spring peaks mostly comprised cyprinid species (barbel, nase, chub, bream, silver bream, roach, gudgeon, tench and bleak) and occurred when water temperatures ranged from 10 °C to 20 °C, depending on the species. These coincided with the circum-reproduction period and were clearly associated with spawning activity (further indicated by the capture of a large number of sexually mature fish). The other peaks of cyprinid mobility occurred in the autumn (barbel, dace, ide, roach, bream, and bleak) and the summer (chub, asp, roach, bream, carp, and tench), corresponding to exploratory movements towards thermal refuges or research of wintering habitats [5,11]. In the case of salmonids (trout and salmon), the capture peak during autumn represents a spawning migration [24], but the spring peak may represent pre-spawning movements during a period characterized by comfortable temperatures or possibly the exploration of fresh tributaries before the summer, during which temperatures in the Meuse are often high. In the case of catfish, a set of upstream movements was observed in the spring and early summer when water temperatures were between 17 °C and 23 °C; this is in line with other studies [28,29] and possibly related to reproduction [53]. Moreover, when all the juveniles combined are considered, we observed three peaks of movement (spring, summer, and autumn) when the water flow was low (<100 m3/s) and the water temperature was above 20 °C. The juvenile capture peaks in the spring (spirlin, roach, bleak, and bream) and the autumn (nase, barbel, roach, chub, and bream) involved smaller numbers of individuals than in the summer, but they took place under environmental conditions close to the summer peak, specifically temperatures near 20 °C for the spring peak and near 17 °C for the autumn peak. This certainly suggests ontogenetic movement, with individuals taking advantage of low flow conditions and a thermal threshold sufficiently high for their relatively poor swimming capacity [63]. In addition, these juvenile capture data indicate that: (i) juveniles can explore their environment via upstream movements, not just downstream drifting [64]; (ii) suitable spawning habitats exist downstream for species counted in the juvenile stage (no salmonids); and (iii) reproductive success clearly varies greatly given the wide range of numbers recorded over the years.
Radinger and Wolter [31] have noted that the duration of movement behaviour studies rarely exceeds 200 days, rendering multi-year comparisons impossible. In this study, we were able to assess the evolution over the years of spawning migration indicators for nine species in the adult stage, thanks to our use of a continuous monitoring methodology. Only three species (eel, nase, and bleak) demonstrated a significant temporal trend in any of their migration indicators; in these specific cases generally, there was a later migration start. These trends were not associated with the annual numbers captured; in the case of eel and bleak, they were negatively associated with the mean spring temperature. Eel, barbel and bream showed a temporal trend of increasing size. For the eel, this resulted from a drastic decrease in numbers caught and a loss in colonisation behaviour as already explained by Nzau Matondo and Ovidio [65]. Although not measured in this study, explanations for variations in migration indicators include predation risk, the proportion of mobile and stationary individuals, downstream recruitment, and environmental and anthropic influences [31,66]. Our results demonstrated that the migration period is flexible and that the triggering environmental factors, such as the contribution of the temperature, also vary slightly from year to year. This corroborates Benitez and Ovidio’s [33] finding showing flexibility in the responses of barbel to environmental variables and an optimisation of the starting date of migration to spawning grounds depending on the fish’s position in the river basin.

5. Conclusions

Over the 20 years of monitoring, we observed that fishways in a large anthropized river were used by diverse fish species across a wide variety of stages and size ranges. Moreover, a previous study of the mobility patterns of fish from the Lixhe fishways in the upstream part had already demonstrated the value of restoring the river’s connectivity for the whole fish community, so that optimal habitats can be exploited [11]. More specifically, the significant proportion of young fish observed indicates the prominent role of fishways in the context of the ontogenic dispersal of juveniles and sub-adults. This implies that when passage devices represent the only solution, they must be adapted to their swimming capacity. We observed changes in fish assemblages with a decreasing overall abundance of fish. The drastic decline in abundance of some common and widespread European fish (eurytopic and limnophilic cyprinids as well as eels) and the appearance of invasive species (asp, catfish, and goby) allowed us to detect major ecological changes in the Meuse and should prompt the adoption of active conservation measures in the future [67,68]. Doing so would enable a decision to be made to support some fish populations through restocking programmes, as has already proved successful for eels [69], or to develop specific artificial spawning grounds [70] for species in serious decline. Furthermore, the studied fishways were most heavily used in the spring, during the circum-spawning period, although movements occurred throughout the year, confirming the importance of maintaining ecological continuity in a lowland river year-round [5,71]. These results highlight the usefulness of fishway monitoring in contributing to the management of river environments and in conserving the functionality of fishways over time. Despite the quantity of data collected, some questions remain unanswered, particularly concerning the temporal evolution of the number of captured fish but also patterns of mobility. It would be interesting, for example, to obtain fish abundance data in upstream and downstream parts of the dam, whether by traditional methods (nets and electrofishing) or new methods such as environmental DNA [72,73]. Finally, the Anthropocene has ushered in innumerable direct and indirect anthropogenic effects on all freshwater taxa, and there exists considerable potential for ecosystem-level changes through bottom-up and top-down responses [74]. These must be studied and monitored in order to most effectively guide management decisions for river ecosystems.

Author Contributions

M.O. and J.-P.B. designed the research, analysed the data, and wrote the paper. J.-P.B., A.D. and M.O. participated in data encoding; J.-P.B., A.D., M.O., G.R., B.N.M., S.R., J.-C.P., P.P., X.R., F.D. and A.G. participated in data collection in the field. All authors have read and agreed to the published version of the manuscript.

Funding

This research was funded by the Public Service of Wallonia, Belgium, General Operational Direction of Agriculture, Natural Resources and Environment, Nature and Forest Department, thanks to the ‘Meuse Salmon programme’.

Institutional Review Board Statement

Not applicable.

Informed Consent Statement

Not applicable.

Data Availability Statement

The data presented in this study are available on request from the corresponding author.

Acknowledgments

We thank the Public Service of Wallonia and LUMINUS for their kind collaboration and for providing access to the fishways, and we thank SPW-SETHY-MET for the river flow data. We thank all the students and members of LPDH-ULIEGE who participated in collecting field data between 1999 and 2018. We deeply thank the three anonymous reviewers who provided valuable comments that increased the quality of the paper.

Conflicts of Interest

The authors declare no conflict of interest.

References

  1. Nilsson, C.; Reidy, C.A.; Dynesius, M.; Revenga, C. Fragmentation and flow regulation of the world’s large river systems. Science 2005, 308, 405–408. [Google Scholar] [CrossRef] [PubMed] [Green Version]
  2. Capra, H.; Plichard, L.; Bergé, J.; Pella, H.; Ovidio, M.; McNeil, E.; Lamouroux, N. Fish habitat selection in a large hydropeaking river: Strong individual and temporal variations revealed by telemetry. Sci. Total Environ. 2017, 578, 109–120. [Google Scholar] [CrossRef] [PubMed]
  3. Petts, G.E.; Gurnell, A.M. Dams and geomorphology: Research progress and future directions. Geomorphology 2005, 71, 27–47. [Google Scholar] [CrossRef]
  4. Silva, A.T.; Lucas, M.C.; Castro-Santos, T.; Katopodis, C.; Baumgartner, L.; Thiem, J.; Aarestrup, K.; Pompeu, P.S.; O’Brien, G.; Braun, D.C.; et al. The future of fish passage science, engineering, and practice. Fish Fish. 2018, 19, 340–362. [Google Scholar] [CrossRef] [Green Version]
  5. Benitez, J.-P.; Nzau Matondo, B.; Dierckx, A.; Ovidio, M. An overview of potamodromous fish upstream movements in medium-sized rivers, by means of fish passes monitoring. Aquat. Ecol. 2015, 49, 481–497. [Google Scholar] [CrossRef]
  6. Lucas, M.C.; Baras, E. Migration of Freshwater Fishes; Blackwell Science: Oxford, UK, 2001. [Google Scholar]
  7. Pringle, C.M. Hydrologic connectivity and the management of biological reserves: A global perspective. Ecol. Appl. 2001, 11, 981–998. [Google Scholar] [CrossRef]
  8. Birnie-Gauvin, K.; Nielsen, J.; Frandsen, S.B.; Olsen, H.-M.; Aarestrup, K. Catchment-scale effects of river fragmentation: A case study on restoring connectivity. J. Environ. Manag. 2020, 264, 110408. [Google Scholar] [CrossRef]
  9. Ovidio, M.; Sonny, D.; Watthez, Q.; Goffaux, D.; Detrait, O.; Orban; Nzau Matondo, B.; Renardy, S.; Dierckx, A.; Benitez, J.-P. Evaluation of the performance of successive multispecies improved fishways to reconnect a rehabilitated river. Wetl. Ecol. Manag. 2020, 28, 641–654. [Google Scholar] [CrossRef]
  10. Gardner, C.J.; Deeming, D.C.; Eady, P.E. Seasonal movements with shifts in lateral and longitudinal habitat use by common bream, Abramis brama, in a heavily modified lowland river. Fish. Manag. Ecol. 2013, 20, 315–325. [Google Scholar] [CrossRef]
  11. Benitez, J.-P.; Dierckx, A.; Nzau Matondo, B.; Rollin, X.; Ovidio, M. Movement behaviours of potamodromous fish within a large anthropised river after the reestablishment of the longitudinal connectivity. Fish. Res. 2018, 207, 140–149. [Google Scholar] [CrossRef]
  12. Roscoe, D.W.; Hinch, S.G. Effectiveness monitoring of fish passage facilities: Historical trends, geographic patterns and future directions. Fish Fish. 2010, 11, 12–33. [Google Scholar] [CrossRef]
  13. Dudgeon, D.; Smith, R.E.W. Exotic species, fisheries and conservation of freshwater biodiversity in tropical Asia: The case of the Sepik River, Papua New Guinea. Aquat. Conserv. 2006, 16, 203–215. [Google Scholar] [CrossRef]
  14. Poulet, N.; Beaulaton, L.; Dembski, S. Time trends in fish populations in metropolitan France: Insights from national monitoring data. J. Fish Biol. 2011, 79, 1436–1452. [Google Scholar] [CrossRef] [PubMed]
  15. Kruk, A.; Ciepłucha, M.; Zięba, G.; Tybulczuk, S.; Tszydel, M.; Marszał, L.; Błońska, D.; Galicka, W.; Przybylski, M. Recovery of fish fauna in the upper Warta River, Poland: Long-term (1963–2012) monitoring study. Ecol. Inform. 2016, 33, 109–118. [Google Scholar] [CrossRef]
  16. Belliard, J.; Beslagic, S.; Delaigue, O.; Tales, E. Reconstructing long-term trajectories of fish assemblages using historical data: The Seine River basin (France) during the last two centuries. Environ. Sci. Pollut. Res. 2018, 25, 23430–23450. [Google Scholar] [CrossRef] [PubMed]
  17. Kuczynski, L.; Chevalier, M.; Laffaille, P.; Legrand, M.; Grenouillet, G. Indirect effect of temperature on fish population abundances through phenological changes. PLoS ONE 2017, 12, e0175735. [Google Scholar] [CrossRef]
  18. Lamouroux, N.; Olivier, J.-M.; Capra, H.; Zylberblat, M.; Chandesris, A.; Roger, P. Fish community changes after minimum flow increase: Testing quantitative predictions in the Rhône River at Pierre-Bénite, France. Freshw. Biol. 2006, 51, 1730–1743. [Google Scholar] [CrossRef]
  19. Latli, A.; Descy, J.-P.; Mondy, C.P.; Floury, M.; Viroux, L.; Otjacques, W.; Marescaux, J.; Depiereux, E.; Ovidio, M.; Usseglio-Polatera, P.; et al. Long-term trends in trait structure of riverine communities facing predation risk increase and trophic resource decline. Ecol. Appl. 2017, 27, 2458–2474. [Google Scholar] [CrossRef]
  20. Daufresne, M.; Veslot, J.; Capra, H.; Carrel, G.; Poirel, A.; Olivier, J.-M.; Lamouroux, N. Fish community dynamics (1985–2010) in multiple reaches of a large river subjected to flow restoration and other environmental changes. Freshw. Biol. 2015, 60, 1176–1191. [Google Scholar] [CrossRef]
  21. Gido, K.B.; Dodds, W.K.; Eberle, M.E. Retrospective analysis of fish community change during a half-century of landuse and streamflow changes. J. N. Am. Benthol. Soc. 2010, 29, 970–987. [Google Scholar] [CrossRef]
  22. Fredrich, F. Long-term investigations of migratory behaviour of asp (Aspius aspius L.) in the middle part of the Elbe River, Germany. J. Appl. Ichthyol. 2003, 19, 294–302. [Google Scholar] [CrossRef]
  23. Lucas, M.C.; Batley, E. Seasonal movements and behaviour of adult barbel Barbus barbus, a riverine cyprinid fish: Implications for river management. J. Appl. Ecol. 1996, 33, 1345–1358. [Google Scholar] [CrossRef]
  24. Ovidio, M.; Baras, E.; Goffaux, D.; Birtles, C.; Philippart, J.C. Environmental unpredictability rules the autumn migration of brown trout (Salmo trutta L.) in the Belgian ardennes. Hydrobiologia 1998, 371–372, 263–274. [Google Scholar] [CrossRef] [Green Version]
  25. Ovidio, M.; Parkinson, D.; Philippart, J.-C.; Baras, E. Multiyear homing and fidelity to residence areas by individual barbel (Barbus barbus). Belg. J. Zool. 2007, 137, 183–190. [Google Scholar]
  26. Lennox, R.J.; Aarestrup, K.; Cooke, S.J.; Cowley, P.D.; Deng, Z.D.; Fisk, A.T.; Harcourt, R.G.; Heupel, M.; Hinch, S.G.; Holland, K.N.; et al. Envisioning the Future of Aquatic Animal Tracking: Technology, Science, and Application. BioScience 2017, 67, 884–896. [Google Scholar] [CrossRef]
  27. Bergé, J.; Capra, H.; Pella, H.; Steig, T.; Ovidio, M.; Bultel, E.; Lamouroux, N. Probability of detection and positioning error of a hydro acoustic telemetry system in a fast-flowing river: Intrinsic and environmental determinants. Fish. Res. 2012, 125–126, 1–13. [Google Scholar] [CrossRef]
  28. Brevé, N.W.P.; Buijse, A.D.; Kroes, M.J.; Wanningen, H.; Vriese, F.T. Supporting decision-making for improving longitudinal connectivity for diadromous and potamodromous fishes in complex catchments. Sci. Total Environ. 2014, 496, 206–218. [Google Scholar] [CrossRef]
  29. Capra, H.; Pella, H.; Ovidio, M. Individual movements, home ranges and habitat use by native rheophilic cyprinids and non-native catfish in a large regulated river. Fish. Manag. Ecol. 2018, 25, 136–149. [Google Scholar] [CrossRef] [Green Version]
  30. Poulet, N.; Reyjol, Y.; Collier, H.; Lek, S. Does fish scale morphology allow the identification of populations at a local scale? A case study for rostrum dace Leuciscus leuciscus burdigalensis in River Viaur (SW France). Aquat. Sci. 2005, 67, 122–127. [Google Scholar] [CrossRef]
  31. Radinger, J.; Wolter, C. Patterns and predictors of fish dispersal in rivers. Fish Fish. 2014, 15, 456–473. [Google Scholar] [CrossRef]
  32. Bao, J.; Li, W.; Zhang, C.; Mi, X.; Li, H.; Zhao, X.; Cao, N.; Twardek, W.M.; Cooke, S.J.; Duan, M. Quantitative assessment of fish passage efficiency at a vertical-slot fishway on the Daduhe River in Southwest China. Ecol. Eng. 2019, 141, 105597. [Google Scholar] [CrossRef]
  33. Benitez, J.-P.; Ovidio, M. The influence of environmental factors on the upstream movements of rheophilic cyprinids according to their position in a river basin. Ecol. Freshw. Fish 2018, 27, 660–671. [Google Scholar] [CrossRef]
  34. Rasmussen, J.E.; Belk, M.C. Individual Movement of Stream Fishes: Linking Ecological Drivers with Evolutionary Processes. Rev. Fish. Sci. Aquac. 2017, 25, 70–83. [Google Scholar] [CrossRef]
  35. Huet, M. Aperçu des relations entre la pente et les populations piscicoles des eaux courantes. Schweiz. Z. Hydrol. 1949, 11, 332–351. [Google Scholar] [CrossRef]
  36. Schiemer, F.; Spindler, T. Endangered fish species of the Danube river in Austria. River Res. Appl. 1989, 4, 397–407. [Google Scholar] [CrossRef]
  37. Philippart, J.C.; Vrancken, M. Atlas des poissons de Wallonie. Distribution, écologie, éthologie, pêche, conservation. Cah. D’éthologie Appliquée 1983, 3, 1–395. [Google Scholar]
  38. Mann, H.B. Nonparametric tests against trend. Econometrica 1945, 13, 245–259. [Google Scholar] [CrossRef]
  39. Kendall, M.G. Rank Correlation Methods; Griffin: London, UK, 1975. [Google Scholar]
  40. Zajicek, P.; Wolter, C. The gain of additional sampling methods for the fish-based assessment of large rivers. Fish. Res. 2018, 197, 15–24. [Google Scholar] [CrossRef] [Green Version]
  41. Clark, S.J.; Jackson, J.R.; Lochmann, S.E. A comparison of shoreline seines with fyke nets for sampling littoral fish communities in floodplain lakes. N. Am. J. Fish. Manag. 2007, 27, 676–680. [Google Scholar] [CrossRef]
  42. Legrand, M.; Briand, C.; Buisson, L.; Artur, G.; Azam, D.; Baisez, A.; Barracou, D.; Bourré, N.; Carry, L.; Caudal, A.-L.; et al. Contrasting trends between species and catchments in diadromous fish counts over the last 30 years in France. Knowl. Manag. Aquat. Ecosyst. 2020, 421, 7. [Google Scholar] [CrossRef] [Green Version]
  43. Morris, E.K.; Caruso, T.; Buscot, F.; Fischer, M.; Hancock, C.; Maier, T.S.; Meiners, T.; Müller, C.; Obermaier, E.; Prati, D.; et al. Choosing and using diversity indices: Insights for ecological applications from the German Biodiversity Exploratories. Ecol. Evol. 2014, 4, 3514–3524. [Google Scholar] [CrossRef] [Green Version]
  44. Blondel, J. Guilds or functional groups: Does it matter? Oikos 2003, 100, 223–231. [Google Scholar] [CrossRef]
  45. Wolter, C.; Freyhof, J. Diel distribution patterns of fishes in a temperate large lowland river. J. Fish Biol. 2004, 64, 632–642. [Google Scholar] [CrossRef]
  46. Ovidio, M.; Sonny, D.; Dierckx, A.; Watthez, Q.; Bourguignon, S.; de le Court, B.; Detrait, O.; Benitez, J.P. The use of behavioural metrics to evaluate fishway efficiency. River Res. Appl. 2017, 33, 1484–1493. [Google Scholar] [CrossRef]
  47. Stuart, I.G.; Berghuis, A.P. Upstream passage of fish through a vertical-slot fishway in an Australian subtropical river. Fish. Manag. Ecol. 2002, 9, 111–122. [Google Scholar] [CrossRef]
  48. Nzau Matondo, B.; Ovidio, M. Dynamics of upstream movements of the European eel Anguilla anguilla in an inland area of the River Meuse over the last 20 years. Environ. Biol. Fishes 2016, 99, 223–235. [Google Scholar] [CrossRef] [Green Version]
  49. Descy, J.-P.; Leitao, M.; Everbecq, E.; Smitz, J.S.; Delige, J.-F. Phytoplankton of the river Loire, France: A biodiversity and modelling study. J. Plankton Res. 2012, 34, 120–135. [Google Scholar] [CrossRef] [Green Version]
  50. Pigneur, L.-M.; Falisse, E.; Roland, K.; Everbecq, E.; Deliège, J.-F.; Smitz, J.S.; Van Doninck, K.; Descy, J.-P. Impact of invasive Asian clams, Corbicula spp., on a large river ecosystem. Freshw. Biol. 2014, 59, 573–583. [Google Scholar] [CrossRef]
  51. Otjacques, W.; Latli, A.; Bernard, B.; Ovidio, M.; Depiereux, E.; Kestemont, P. Recent decline of roach Rutilus rutilus stock in a large river ecosystem in relation with its population dynamics. Fundam. Appl. Limnol. 2015, 187, 151–163. [Google Scholar] [CrossRef]
  52. Otjacques, W.; De Laender, F.; Kestemont, P. Discerning the causes of a decline in a common European fish, the roach (Rutilus rutilus L.): A modelling approach. Ecol. Model. 2016, 322, 92–100. [Google Scholar] [CrossRef]
  53. Guillerault, N.; Delmotte, S.; Boulêtreau, S.; Lauzeral, C.; Poulet, N.; Santoul, N. Does the non-native European catfish Silurus glanis threaten French river fish populations? Freshw. Biol. 2015, 60, 922–928. [Google Scholar] [CrossRef] [Green Version]
  54. Cucherousset, J.; Horký, P.; Slavík, O.; Ovidio, M.; Arlinghaus, R.; Boulêtreau, S.; Britton, R.; García-Berthou, E.; Santoul, F. Ecology, behaviour and management of the European catfish. Rev. Fish Biol. Fish. 2018, 28, 177–190. [Google Scholar] [CrossRef] [Green Version]
  55. Pfauserová, N.; Slavík, O.; Horký, P.; Kolářjová, J.; Randák, T. Migration of non-native predator Asp (Leuciscus aspius) from a reservoir poses a potential threat to native species in tributaries. Water 2019, 11, 1306. [Google Scholar] [CrossRef] [Green Version]
  56. Boulêtreau, S.; Gaillagot, A.; Carry, L.; Tétard, S.; De Oliveira, E.; Santoul, F. Adult Atlantic salmon have a new freshwater predator. PLoS ONE 2018, 13, e0196046. [Google Scholar] [CrossRef] [PubMed] [Green Version]
  57. Prignon, C.; Micha, J.C.; Rimbaud, G.; Philippart, J.C. Rehabilitation efforts for Atlantic salmon in the Meuse basin area: Synthesis 1983–1998. Hydrobiologia 1999, 410, 69–77. [Google Scholar] [CrossRef]
  58. Ovidio, M.; Dierckx, A.; Bunel, S.; Grandry, L.; Spronck, C.; Benitez, J.P. Poor Performance of a Retrofitted Downstream Bypass Revealed by the Analysis of Approaching Behaviour in Combination with a Trapping System. River Res. Appl. 2017, 33, 27–36. [Google Scholar] [CrossRef]
  59. Ovidio, M.; Renardy, S.; Dierckx, A.; Nzau Matondo, B.; Benitez, J.-P. Improving bypass performance and passage success of Atlantic salmon smolts at an old fish-hostile hydroelectric power station: A challenging task. Ecol. Eng. 2021, 160, 106148. [Google Scholar] [CrossRef]
  60. Teichert, N.; Benitez, J.; Dierckx, A.; Tétard, S.; De Oliveira, E.; Trancart, T.; Feunteun, E.; Ovidio, M. Development of an accurate model to predict the phenology of Atlantic salmon smolt spring migration. Aquat. Conserv. 2020, 30, 1552–1565. [Google Scholar] [CrossRef]
  61. Jurajda, P.; Černý, J.; Polačik, M.; Valová, Z.; Janáč, M.; Blažek, R.; Ondračková, M. The recent distribution and abundance of non-native Neogobius fishes in the Slovak section of the River Danube. J. Appl. Ichthyol. 2005, 21, 319–323. [Google Scholar] [CrossRef]
  62. Kerr, J.R.; Vowles, A.S.; Crabb, M.C.; Kemp, P.S. Selective fish passage: Restoring habitat connectivity without facilitating the spread of a non-native species. J. Environ. Manag. 2021, 279, 110908. [Google Scholar] [CrossRef]
  63. Baudoin, J.M.; Bergun, V.; Chanseau, M.; Larinier, M.; Ovidio, M.; Sremski, W.; Steinbach, P.; Voegtle, B. Assessing the Passage of Obstacles by Fish. Concepts, Design and Application; Onema: Paris, France, 2015. [Google Scholar]
  64. Reichard, M.; Jurajda, P.; Ondračková, M. The effect of light intensity on the drift of young-of-the-year cyprinid fishes. J. Fish Biol. 2002, 61, 1063–1066. [Google Scholar] [CrossRef]
  65. Nzau Matondo, B.; Ovidio, M. Decreased stock entering the Belgian Meuse is associated with the loss of colonisation behaviour in yellow-phase European eels. Aquat. Living Resour. 2018, 31, 7. [Google Scholar] [CrossRef]
  66. Brönmark, C.; Skov, C.; Brodersen, J.; Nilsson, P.A.; Hansson, L.A. Seasonal migration determined by a trade-off between predator avoidance and growth. PLoS ONE 2008, 3, e1957. [Google Scholar] [CrossRef] [PubMed] [Green Version]
  67. Santos, J.M.; Ferreira, M.T. Use of aquatic biota to detect ecological changes in freshwater: Current status and future directions. Water 2020, 12, 1611. [Google Scholar] [CrossRef]
  68. Santos, R.; Poulet, N.; Besnard, A. Life-history traits correlate with temporal trends in freshwater fish populations for common European species. Freshw. Biol. 2021, 66, 317–331. [Google Scholar] [CrossRef]
  69. Nzau Matondo, B.; Benitez, J.-P.; Dierckx, A.; Rollin, X.; Ovidio, M. An evaluation of restocking practice and demographic stock assessment methods for cryptic juvenile european eel in upland rivers. Sustainability 2020, 12, 1124. [Google Scholar] [CrossRef] [Green Version]
  70. Mouton, A.M.; Buysse, D.; Stevens, M.; van den Neucker, T.; Coeck, J. Evaluation of riparian habitat restoration in a lowland river. River Res. Appl. 2012, 28, 845–857. [Google Scholar] [CrossRef]
  71. van Leeuwen, C.H.A.; Museth, J.; Sandlund, O.T.; Qvenild, T.; Vøllestad, L.A. Mismatch between fishway operation and timing of fish movements: A risk for cascading effects in partial migration systems. Ecol. Evol. 2016, 6, 2414–2425. [Google Scholar] [CrossRef] [PubMed] [Green Version]
  72. Yamanaka, H.; Minamoto, T. The use of environmental DNA of fishes as an efficient method of determining habitat connectivity. Ecol. Ind. 2016, 62, 147–153. [Google Scholar] [CrossRef] [Green Version]
  73. Deiner, K.; Fronhofer, E.A.; Mächler, E.; Walser, J.-C.; Altermatt, F. Environmental DNA reveals that rivers are conveyer belts of biodiversity information. Nat. Commun. 2016, 7, 12544. [Google Scholar] [CrossRef] [Green Version]
  74. Reid, A.J.; Carlson, A.K.; Creed, I.F.; Eliason, E.J.; Gell, P.A.; Johnson, P.T.J.; Kidd, K.A.; MacCormack, T.J.; Olden, J.D.; Ormerod, S.J.; et al. Emerging threats and persistent conservation challenges for freshwater biodiversity. Biol. Rev. 2019, 94, 849–873. [Google Scholar] [CrossRef] [Green Version]
Figure 1. Location of the study site at the Belgian scale (a); schematic representation of the study site (b); pictures of the dam, the fishways (F1 and F2) and the capture traps (CT1 and CT2) (c).
Environments 09 00022 g001
Figure 2. Global values per year from 1999 to 2018 of mean daily water temperature (a), mean daily water flow (b), and mean daily dissolved oxygen (c).
Environments 09 00022 g002
Figure 3. Temporal evolution of proportions of individuals captured as adults (a) and as juveniles (b); and proportions of biomass for adults (c) and for juveniles (d) both according to their ecological group (bar charts) and in total (black dotted lines).
Environments 09 00022 g003
Figure 4. Temporal evolution of the headcount (number of individuals captured per year) by species (a) in the adult stage from 1999 to 2018 and (b) in the juvenile stage from 1999 to 2018; in blue, the results of the Mann–Kendall test (positive temporal evolution of the headcount: +; negative temporal evolution: −; level of significance: (* p < 0.05; ** p < 0.01; *** p < 0.001).
Environments 09 00022 g004aEnvironments 09 00022 g004b
Figure 5. Overall capture periodicity (1999–2018) by species in terms of percentages of individuals (a) of yellow eel, catfish, and rheophilic Cyprinidae (barbel, nase, chub, dace, ide and asp), (b) of eurytopic and limnophilic Cyprinidae (roach, rudd, bream, silver bream, tench, carp, crucian carp, and Prussian carp) and (c) of small Cyprinidae (bleak, spirlin, gudgeon and minnow), Salmonidae (trout and salmon) and other families (perch for percid and goby for Gobiidae), distinguishing between adult (black) and juvenile (white) stages.
Environments 09 00022 g005aEnvironments 09 00022 g005bEnvironments 09 00022 g005c
Figure 6. Annual temporal trends in the migration phenology (migration start, migration peak, migration end, and median fish size) of species in the adult stage during their spawning migration period.
Environments 09 00022 g006
Table 1. Characteristics of the fishways at Lixhe dam on the Meuse River.
CharacteristicsFishway F1Fishway F2
Fishway typePool and weirAlterne vertical slot
Construction year19801998
Discharge of fishway (m3/s)0.31
Attraction flow (m3/s)0.22.5
Length (m)48165
Pool number5626
Pool size, length × width (m)1.5 to 2.5 × 1.24.7 to 9.7 × 2.5
Pool water depth (m)11.5
Height between pools (m)0.150.3
Water depth of slot (m)0.31.3
Slot width (m)0.350.4
Table 2. Overall results (i.e., total for F1 and F2) of fish capture numbers from 1999 to 2018 differentiating between adult and juvenile results and ecological group information (Eury. = eurytopic; Rheo. = rheophilic and Limno. = limnophilic).
SpeciesEcol. GroupN TotalN F1N F2
Common NameLatin Name(N Adult—N Juvenile)(N Adult—N Juvenile)(N Adult—N Juvenile)
Anguillidae
European eelAnguilla anguillaEury.19,163 (19,163–0)19,163 (19,163–0)0
Cyprinidae
Asp Aspius aspiusRheo.752 (283–469)470 (1–469)282 (282–0)
BarbelBarbus barbusRheo.464 (351–113)127 (24–103)337 (327–10)
ChubLeuciscus cephalusRheo.1309 (709–600)642 (45–597)667 (664–3)
Common bleakAlburnus alburnusEury.78,342 (23,866–54,476)77,358 (22,882–54,476)984 (984–0)
Common breamAbramis bramaEury.21,944 (19,504–2440)6352 (3921–2431)15,592 (15,583–9)
Common Carp Cyprinus carpioEury.198 (197–1)3 (2–1)195 (195–0)
Crucian carpCarassius carassiusLimno.11 (11–0)6 (6–0)5 (5–0)
DaceLeuciscus leuciscusRheo.77 (45–32)76 (44–32)1 (1–0)
Grass carp Ctenopharyngodon idella 2 (2–0)02 (2–0)
GudgeonGobio gobioRheo.69 (68–1)64 (63–1)5 (5–0)
IdeLeuciscus idusRheo3209 (68–3141)3148 (12–3136)61 (56v5)
Koi Cyprinus carpioLimno.6 (6–0)0 6 (6–0)
MinnowPhoxinus phoxinusRheo.53 (31–22)53 (31–22)0
NaseChondrostoma nasusRheo.676 (308–368)369 (3–366)307 (305v2)
Prussian carp Carassius gibelioLimno.10 (10–0)9 (9–0)1 (1–0)
RoachRutilus rutilusEury.222,256 (16,136–206,120)217,767 (11,700–206,067)4489 (4436–53)
RuddScardinius erythrophthalmusEury.73 (72–1)52 (51–1)21 (21–0)
Silver breamBlicca bjoerknaEury.1482 (1477–5)461 (456–5)1021 (1021–0)
SpirlinAlburnoides bipunctatusRheo.780 (278–502)777 (275–502)3 (3–0)
TenchTinca tincaLimno.249 (248–1)57 (57–0)192 (191–1)
Percidae
PerchPerca fluviatilisLimno.36,107 (237–35,870)35,985 (192–35,793)122 (45–77)
RuffeGymnocephalus cernuaLimno.5 (4–1)5 (4–1)0
ZanderSander luciopercaLimno.4 (3–1)2 (2–0)2 (1–1)
Salmonidae
Brook trout Salvelinus fontinalisRheo.3 (3–0)2 (2-0)1 (1–0)
Rainbow trout Oncorhynchus mykissRheo.14 (14–0)7 (7-0)7 (7–0)
Salmon Salmo salarRheo.180 (180–0)1 (1-0)179 (179–0)
TroutSalmo truttaRheo.353 (346–7)37 (31-6)316 (315–1)
Other species
PikeEsox luciusLimno.8 (8–0)0 8 (8–0)
Pumpkinseed Lepomis gibbosusLimno.1 (1–0)00
Catfish Silurus glanisEury.173 (173–0)0 173 (173–0)
Tilapia Oreochromis niloticusLimno.1 (1–0)00
Round goby Neogobius melanostomusLimno.655 (100–555)653 (98-555)2 (2–0)
Kessler’s goby Ponticola kessleriLimno.1 (1–0)0 1 (1–0)
SticklebackGasterosteus aculeatusEury.1 (1–0)00
Total 388,631 (83,905–304,726)363,648 (59,084–304,564)24,983 (24,821–162)
non-native species; reintroduced species.
Table 3. Characteristics of capture (number of individuals, capture size, capture periodicity, capture temperature and capture flow) by species and capture peak for adults.
SpeciesPeak PeriodNCapture Size (mm)Capture PeriodicityCapture Temperature (°C)Capture Flow (m3/s)
(Capture Date)
P10P50P90P10P50P90P10P50P90P10P50P90
Yellow eelSpr + Sum + Aut19,16325331640513316020218.322.124.849.3121.2219.7
TroutSpr + Sum22637150064813716419817.520.122.750.198.3248.4
Aut994545626902843163449.411.918.240.9151.1411.7
SalmonSpr6366778092111914016314.318.121.244.395.3222.4
Aut9565575490026728732610.314.817.043.694.2287.6
BarbelSpr2444385686489412415012.314.919.460.7175.4382.2
Aut9031243560427328732512.115.218.030.998.6304.9
NaseSpr30333538244078911089.411.313.8130.4236.3829.7
ChubSpr + Sum6733273954629012016713.316.02.980.7165.0366.4
Aut1717236248326127932510.216.920.116.0117.3486.6
DaceSpr23105125173931281579.317.921.371.1160.2454.4
Aut2110812017528129133410.514.615.065.365.3277.6
IdeSpr3219941450182971359.213.417.1167.5208.3409.8
Aut3225634241528730533011.114.718.223.940.9165.4
AspSpr23343649854810813015715.217.221.155.6102.6214.6
Sum4841544952517619322119.822.024.152.4122.2277.7
RoachSpr13,0351141672428711015712.015.420.8120.1187.4306.9
Sum98410311719218721625519.220.722.936.647.6135.4
Aut119111517229026529131611.615.020.315.757.7331.1
RuddSpr4018827533711112515515.117.820.6115.4193.3328.8
Sum2911012428822923224819.122.623.132.835.7386.76
BreamSpr18,94031436641110712314713.917.120.069.9141.9301
Sum46415937041917318726017.821.023.640.888.2278.2
Aut8715418038126326730414.219.020.349.768.6174.9
Silver breamSpr143413222227111512414514.417.118.9130.8174.5346.8
Aut3011212315926326729114.920.120.465.3174.9174.9
TenchSpr + Sum24437442046812414218517.318.824.151.3115.3238.8
CarpSpr + Sum19648764176211314518216.919.723.843.7113.6229.5
Crucian carpSpr + Sum1117227837413620222115.122.224.174.4141.6654.1
Prussian carpSpr + Sum1016024532610917424017.720.023.868.4129.0188.2
BleakSpr21,3279511013610113115614.119.021.491.5154.5239.3
Sum2084909011718321023820.622.723.241.552.1136.1
Aut411839012227327429115.017.120.357.884.6165.6
SprilinSpr + Sum50266708217019724418.622.924.722.264.1149.3
GudgeonSpr579210413210212915115.118.920.7129.2163.2310.9
PerchSpr17917422933211812915115.318.120.895.8171.3241.0
Aut2215818531726727331811.019.620.219.557.7323.9
Sum3415217232118723826017.722.024.136.282.5200.2
CatfishSpr + Sum1718511033134012815518917.121.323.826.784.5211.1
GobySpr75617510613014015316.919.121.352.31108.4558.5
Sum23606611520223225618.723.124.117.835.784.9
Table 4. Characteristics of capture (number of individuals, capture size, capture periodicity, capture temperature and capture flow) by species and capture peak for juveniles.
SpeciesPeak PeriodNCapture Size (mm)Capture PeriodicityCapture Temperature (°C)Capture Flow (m3/s)
(Day of the Year)
P10P50P90P10P50P90P10P50P90P10P50P90
BarbelSpr18567415410214516814.419.722.836.161.9169.1
Sum86489715718120725118.722.124.234.178.8257.7
NaseSum25930366916818623919.822.625.422.576.2217.2
Aut8940476128128929817.317.517.991.592.1263.1
ChubSum55740506918119023222.323.625.151.586.497.3
DaceSum2047668017619722721.123.924.623.250.396.4
IdeSum305960667518119022021.822.924.335.556.578.3
AspSum46774788818118521122.022.923.921.551.161.3
RoachSpr601149498414016116220.222.222.225.425.4147.0
Sum198,46041496018119022821.823.625.140.070.097.3
Aut164951578826828930213.317.719.544.2109.9193.6
BreamSpr1186910512413314916514.220.722.169.5161.6498.5
Sum172350607022423724420.721.823.020.238.571.2
Aut59965659726526529115.319.419.418.228.965.3
BleakSpr166450707813516017119.222.124.553.099.5156.5
Sum50,29950516020722124021.924.225.951.582.084.9
Aut251358677226626928716.018.221.333.064.9165.6
SpirlinSpr + Sum50247556314916819619.221.123.545.784.3137.2
MinnowSpr2238424412912915519.619.621.727.347.0145.9
PerchSpr924310212714216417116.420.622.730.3121.0163.0
Sum35,66568737619720322319.323.023.750.864.996.4
Aut929210112127529129115.315.317.861.465.3102.6
GobySpr30138475613914215617.619.222.552.358.997.3
Sum25427365218622924521.323.925.417.048.074.6
Table 5. Results by species in the adult stage with regard to temporal trends in migration phenology (Mann–Kendall test) and the relationships (simple linear regression) between the migration indicators by year and both the capture headcount per year and the mean spring temperature (* p < 0.05; ** p < 0.01; *** p < 0.001).
SpeciesN YearsIndicatorsTemporal TrendHeadcountMean Spring Temperature
Taup-Valuet-Valuep-Valuet-Valuep-Value
Eel20Migration start0.340.04 *−1.840.080.16−3.820.001 **0.45
Migration peak0.030.87−1.450.160.10−2.540.02 *0.26
Migration end−0.120.47−0.400.700.001−0.700.490.03
Fish size0.86<0.001 ***−4.69<0.001 ***0.55−0.530.610.02
Barbel16Migration start0.190.30−0.370.720.01−3.980.001 **0.51
Migration peak0.070.71−1.060.310.07−2.950.001 **0.37
Migration end0.050.80−1.540.150.14−4.42<0.001 ***0.56
Fish size0.480.01 *1.680.110.16−0.060.950.00
Nase15Migration start0.400.04 *0.350.730.01−0.250.800.00
Migration peak0.011.00−1.640.120.17−0.280.780.01
Migration end−0.320.10−0.320.750.01−0.190.850.00
Fish size−0.280.17−0.320.750.011.500.160.15
Chub20Migration start0.040.39−0.980.340.05−2.660.02 *0.28
Migration peak−0.090.60−1.190.250.07−2.460.02 *0.25
Migration end0.060.69−0.370.720.01−1.160.260.07
Fish size−0.140.390.400.690.010.400.690.01
Asp12Migration start−0.180.45−2.670.02 *0.41−2.470.03 *0.38
Migration peak0.001−1.540.150.19−3.890.003 **0.60
Migration end−0.120.62−0.370.720.01−1.930.080.27
Fish size0.100.730.880.40.071.990.070.28
Roach19Migration start0.210.23−1.190.280.070.600.560.02
Migration peak−0.110.530.720.480.03−0.010.970.00
Migration end−0.120.480.550.590.020.010.990.00
Fish size0.230.18−0.970.350.05−0.900.380.05
Bream20Migration start−0.020.92−1.670.110.13−7.41<0.001 ***0.75
Migration peak−0.090.58−1.430.170.10−5.07<0.001 ***0.59
Migration end−0.060.74−1.520.140.11−5.33<0.001 ***0.61
Fish size0.440.01 *−4.50<0.001 ***0.530.250.810.00
Carp14Migration start0.080.74−1.270.230.12−3.090.01 *0.44
Migration peak0.280.19−1.290.220.12−2.680.02 *0.37
Migration end−0.260.210.880.390.06−1.010.330.08
Fish size0.490.02 *0.040.970.00−1.790.100.21
Bleak20Migration start0.520.002 **−1.220.240.08−1.020.320.05
Migration peak0.350.03 *−0.870.400.04−2.250.04 *0.22
Migration end−0.070.670.750.460.03−1.590.130.12
Fish size0.110.51−0.700.490.032.600.02 *0.27
Catfish12Migration start010.020.980.00−1.710.120.23
Migration peak0.030.94−0.390.70.02−1.330.210.15
Migration end0.410.070.570.580.03−0.240.810.01
Fish size−0.360.12−0.670.520.04−0.070.940.00
Publisher’s Note: MDPI stays neutral with regard to jurisdictional claims in published maps and institutional affiliations.

