
Structural Selectivity of PAH Removal Processes in Soil, and the Effect of Metal Co-Contaminants


1
Department of Geography and Environmental Sciences, Northumbria University, Newcastle upon Tyne NE1 8ST, UK
2
School of Health and Life Sciences, Teesside University, Middlesbrough TS1 3BX, UK
*
Author to whom correspondence should be addressed.
Environments 2022, 9(2), 23; https://0-doi-org.brum.beds.ac.uk/10.3390/environments9020023
Submission received: 15 November 2021
/
Revised: 10 January 2022
/
Accepted: 25 January 2022
/
Published: 29 January 2022
(This article belongs to the Special Issue Soil Pollution Assessment and Sustainable Remediation Strategies)
Abstract
:Polycyclic aromatic hydrocarbons (PAHs) form a convenient structural series of molecules with which to examine the selectivity exerted on their removal by soil microbiota. It is known that there is an inverse relationship between PAH molecular size and degradation rates in soil. In this paper, we look at how the magnitude of the slope for this relationship, m, can be used as an indicator of the effect of metal co-contaminants on degradation rates across a range of PAH molecular weights. The analysis utilises data collected from our previous microcosm study (Deary, M.E.; Ekumankama, C.C.; Cummings, S.P. Development of a novel kinetic model for the analysis of PAH biodegradation in the presence of lead and cadmium co-contaminants. Journal of Hazard Materials 2016, 307, 240–252) in which we followed the degradation of the 16 US EPA PAHs over 40 weeks in soil microcosms taken from a high organic matter content woodland soil. The soil was amended with a PAH mixture (total concentration of 2166 mg kg−1) and with a range of metal co-contaminant concentrations (lead, up to 782 mg kg−1; cadmium up to 620 mg kg−1; and mercury up to 1150 mg kg−1). It was found that the magnitude of m increases in relation to the applied concentration of metal co-contaminant, indicating a more adverse effect on microbial communities that participate in the removal of higher molecular weight PAHs. We conclude that m is a useful parameter by which we might measure the differential effects of environmental contaminants on the PAH removal. Such information will be useful in planning and implementing remediation strategies.
Keywords:
PAHs; metal co-contamination; cadmium; lead; mercury; microcosm; structural selectivity; biodegradation; remediation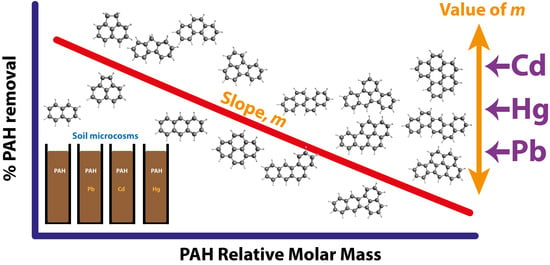
1. Introduction
Polycyclic aromatic hydrocarbons (PAHs) are hydrophobic, microbially recalcitrant, organic pollutants that are commonly found in areas of previous and current industrialisation [1,2,3]. They comprise two or more fused benzene rings and may contain alkyl substituents and five-membered rings. In this paper, we examine how the size and structure of the PAHs affects their removal from soil, and the influence of metal co-contaminants on this process. Table 1 shows the structures of the sixteen US EPA priority EPAs that are the subject of this study.
PAHs are a significant environmental problem because of their toxic effects, which can include mutagenicity, carcinogenicity, and teratogenicity [1,2,3,4,5,6]. They are also persistent in the environment and have a high potential for biomagnification [5]. PAHs bound to fine soil particles, colloids and organic matter can be transported to other parts of the environment, for example, to groundwater, river systems and aquatic sediments, where they can accumulate to high concentrations [5,7,8]. Historical PAH contamination is associated with heat-related processing of hydrocarbons, such as in the petroleum industry, coal tar manufacture, creosote production, coal gasification and coke production [1,2,8,9,10,11], but also with fuel combustion and waste incineration [8]. Whilst spillages and disposal of high PAH-content products and wastes at industrial sites accounts for many of the highest soil-PAH concentrations [2], atmospheric deposition from combustion processes has also contributed a significant proportion of the accumulated PAHs in soil found in industrial areas [2]. Natural combustion processes, such as bush and forest fires, also contribute PAHs to the environment, as have natural thermal geologic reactions [12].
PAH concentrations in the environment will depend on the nature of past and current industrial activity within the local area, with typical total PAH concentrations in contaminated sites ranging from hundreds to several thousand mg kg−1 [2,5,9]. Of particular concern are the concentrations of the most harmful PAH components, such as the carcinogen benzo-a-pyrene (BaP), which may represent 10% or more of the total PAH concentration in some contaminated sites [13]. Other high molecular weight (HMW) PAHs are also of concern due to their recalcitrance in the environment and the observation that toxic effects tend to increase as a function of the number of fused rings [5].
In the soil environment, PAHs will partition between multiple soil phases, including organic, mineral and pore water, though due to their hydrophobicity, which increases with molecular mass, the amount of PAH in the solution phase will be limited. A complex community of soil bacteria and fungi are involved in the biodegradation process, aided by the production of bacterial biosurfactants and extracellular polymeric substances [14,15,16] that increase the bioavailability of hydrocarbon contaminants and provide protection to the bacterial species. The soil rhizosphere is also thought to play an important role, with PAHs exerting a selective effect on the rhizosphere microbiota of certain plants, facilitating detoxification of the soil and therefore better plant growth [17,18,19].
Biodegradation is a commonly used remediation strategy for PAHs [20], but this can be negatively affected by the presence of co-contaminants, particularly metals [1,9,21]. Large numbers of sites that are contaminated with PAHs are also contaminated with metals [22,23] and so it is important that we understand the nature and extent of the effect. In the present study, we examine whether the well-documented structural selectivity of PAH removal by soil microbial communities [8,11] is affected by the presence of cadmium (Cd), lead (Pb) and mercury (Hg) co-contaminants at different concentrations. We hypothesise that, because of the restricted microbiota that can metabolise HMW PAHs [24], the removal of this class of PAHs will be most affected by the presence of co-contaminants. Furthermore, because there is an inverse linear relationship between PAH removal and PAH molecular weight [8,11], we would expect the presence of co-contaminant metals to affect the magnitude of the slope, m, for this relationship.
2. Materials and Methods
The data used in this paper was obtained as part of a previously detailed 40-week soil microcosm PAH degradation study [1,9], from which the full experimental details can be obtained. However, in summary, soil used in the microcosms was obtained from an urban woodland in Newcastle upon Tyne, UK (11.4% organic carbon and 0.37% nitrogen) [1]. The soil was spiked with a total concentration of 2166 mg kg−1 PAH (dry wt) and individual soil microcosms were prepared in 30 cm long, 3.3 cm diameter PVC piping. Each microcosm contained approximately 250 g wet weight of soil and was maintained at 75% of the maximum determined water holding capacity. Initial concentrations for the 16 US EPA PAHs, determined using Gas Chromatography with Mass Spectrometry after extraction using Accelerated Solvent Extraction [1], are shown in Table 1. The effect of metal co-contaminants on PAH degradation was determined by spiking the PAH-amended soils with an appropriate amount of metal salt solution. For Pb, the following dry weight amendment concentrations were obtained: control (210 mg kg−1), 339 mg kg−1, 523 mg kg−1 and 782 mg kg−1. Similar Pb concentrations have been used in literature co-contamination PAH degradation studies as ‘worst case’ scenarios [25]. The high background Pb concentration in the control was due to historical atmospheric emissions from smelters and paint works that operated at nearby locations [26]. For cadmium, the spiked concentrations were: control (<1 mg kg−1), 134 mg kg−1, 302 mg kg−1 and 620 mg kg−1. Atagana [21] used similar concentrations of Cd in a PAH degradation study. In addition, microcosms were spiked with a single concentration of mercury, giving a control of (<1 mg kg−1), and a (final) spiked Hg concentration of 1115 mg kg−1. The Hg-spiked microcosms were intended to be abiotic controls for the biodegradation study [1,9]; however, some microbial activity was observed after the initial applied concentration of 627 mg kg−1 and so the Hg concentration was increased to 1115 mg kg−1 at 5 weeks [9]. The microcosms were stored in a plant growth room at 20 °C and subjected to a diurnal light cycle.
In this paper, we are interested in the relationship between PAH molecular weight and extent of PAH removal from the microcosms. Percentage PAH removal was calculated for each individual PAH at 1, 2, 3, 5, 7, 9, 12, 15, 20, 25, 30, 35 and 40 weeks. The percentage removal of each PAH is analysed as a function of (a) PAH relative molar mass (RMM), (b) the amended metal concentration and (c) the total incubation time after PAH amendment.
3. Results and Discussion
3.1. Relationship between PAH Relative Molar Mass and % Removal
We will first discuss the trends in structural selectivity of PAH removal for the control study that contained no metal amendments. The results of this experiment reflect the physico-chemical and biological removal processes that are occurring in the soil at background metal concentrations ([Pb] = 210 mg kg−1; Cd < 1 mg kg−1; Hg < 1 mg kg−1). Figure 1 shows the relationship between PAH RMM and the percentage removal of the initially applied PAH concentration, for each of the 16 US EPA priority PAHs at three weeks. This time point was chosen because the microcosm will have acclimatised after the initial PAH amendment. In Figure 1, the PAHs are identified as either alternant or non-alternant, though there is no obvious difference between the relationships of these two sub-groups. Literature studies have suggested that having a 5-member ring in the PAH structure (non-alternant) can result in lower degradation rates, though this information largely comes from experiments carried out in solution [11,27]. The clear trend in Figure 1 is that of decreasing percentage removal with increasing RMM, which is a relationship that has been reported in the literature [1,3,4,5,7,8,11,24]. Bacteria can utilize LMW PAHs as sole carbon sources [4], with degradation initiated by intracellular dioxygenase enzymes; however, there are a limited number of bacterial species that can metabolise HMW PAHs. It is thought that the predominant partitioning of HMW PAHs into the soil phase, particularly into bio-inaccessible organic phases, may have hindered the evolution of HMW PAH degrading bacterial enzymes [24]. Fungi can also degrade PAHs, for example ligninolytic soil fungi where lignin peroxidases participate in the non-specific extra-cellular degradation of PAHs. The non-specificity of fungal enzymatic processes means that they can initiate degradation of a wide range of PAHs, including HMW PAHs [4], achieving detoxification of the chemical environment. There are also physical removal processes such as volatilization, and the migration of PAHs to biologically inaccessible soil phases [1,9,28] that are particularly associated with organic matter and are likely to be significant for the high organic matter woodland soil used in this study.
The slope, m, associated with the line of best fit in Figure 1 can be thought of as a parameter that quantifies the degree of structural selectivity of the physico-chemical and biological PAH removal processes. A steeper slope indicates a greater disparity in the overall removal of HMW PAHs compared to LMW PAHs. Moreover, if conditions in the microcosm are changed, for example the addition of metal-contaminants, then the resultant effects on the physico-chemical and biological processes are likely to be reflected by a change in the structural selectivity, and therefore an increase or decrease in the magnitude of m. Thus, we might predict that because the diversity of HMW degrading microorganisms is relatively low [2,7,24], any additional stress on this sub-population might have a greater effect on removal of HMW PAHs compared to LMW PAHs, with a consequential increase in magnitude of m, i.e., the percentage removal of HMW PAHs would decrease relative to LMW PAHs.
3.2. Effect of Microcosm Incubation Time on ‘m’
In the following sections, we examine whether changes in the value of m, due to the presence of metal co-contaminants, or as a function of incubation time, can yield useful information about PAH degradation processes. Figure 2 shows that the magnitude of m reduces over the 40-week study period, indicating that for these microcosms, which have not been amended with metal co-contaminants, structural selectivity decreases over time. It can be seen from the relative position of the points on the plots that the observed decrease in the value of m is due to the % removal of the HMW PAHs ‘catching up’ with that of the LMW PAHs at later stages of the study. Rate constants for the biological removal of PAHs are faster for the LMW compounds, but with sufficient time the overall percentage removal will become similar [1].
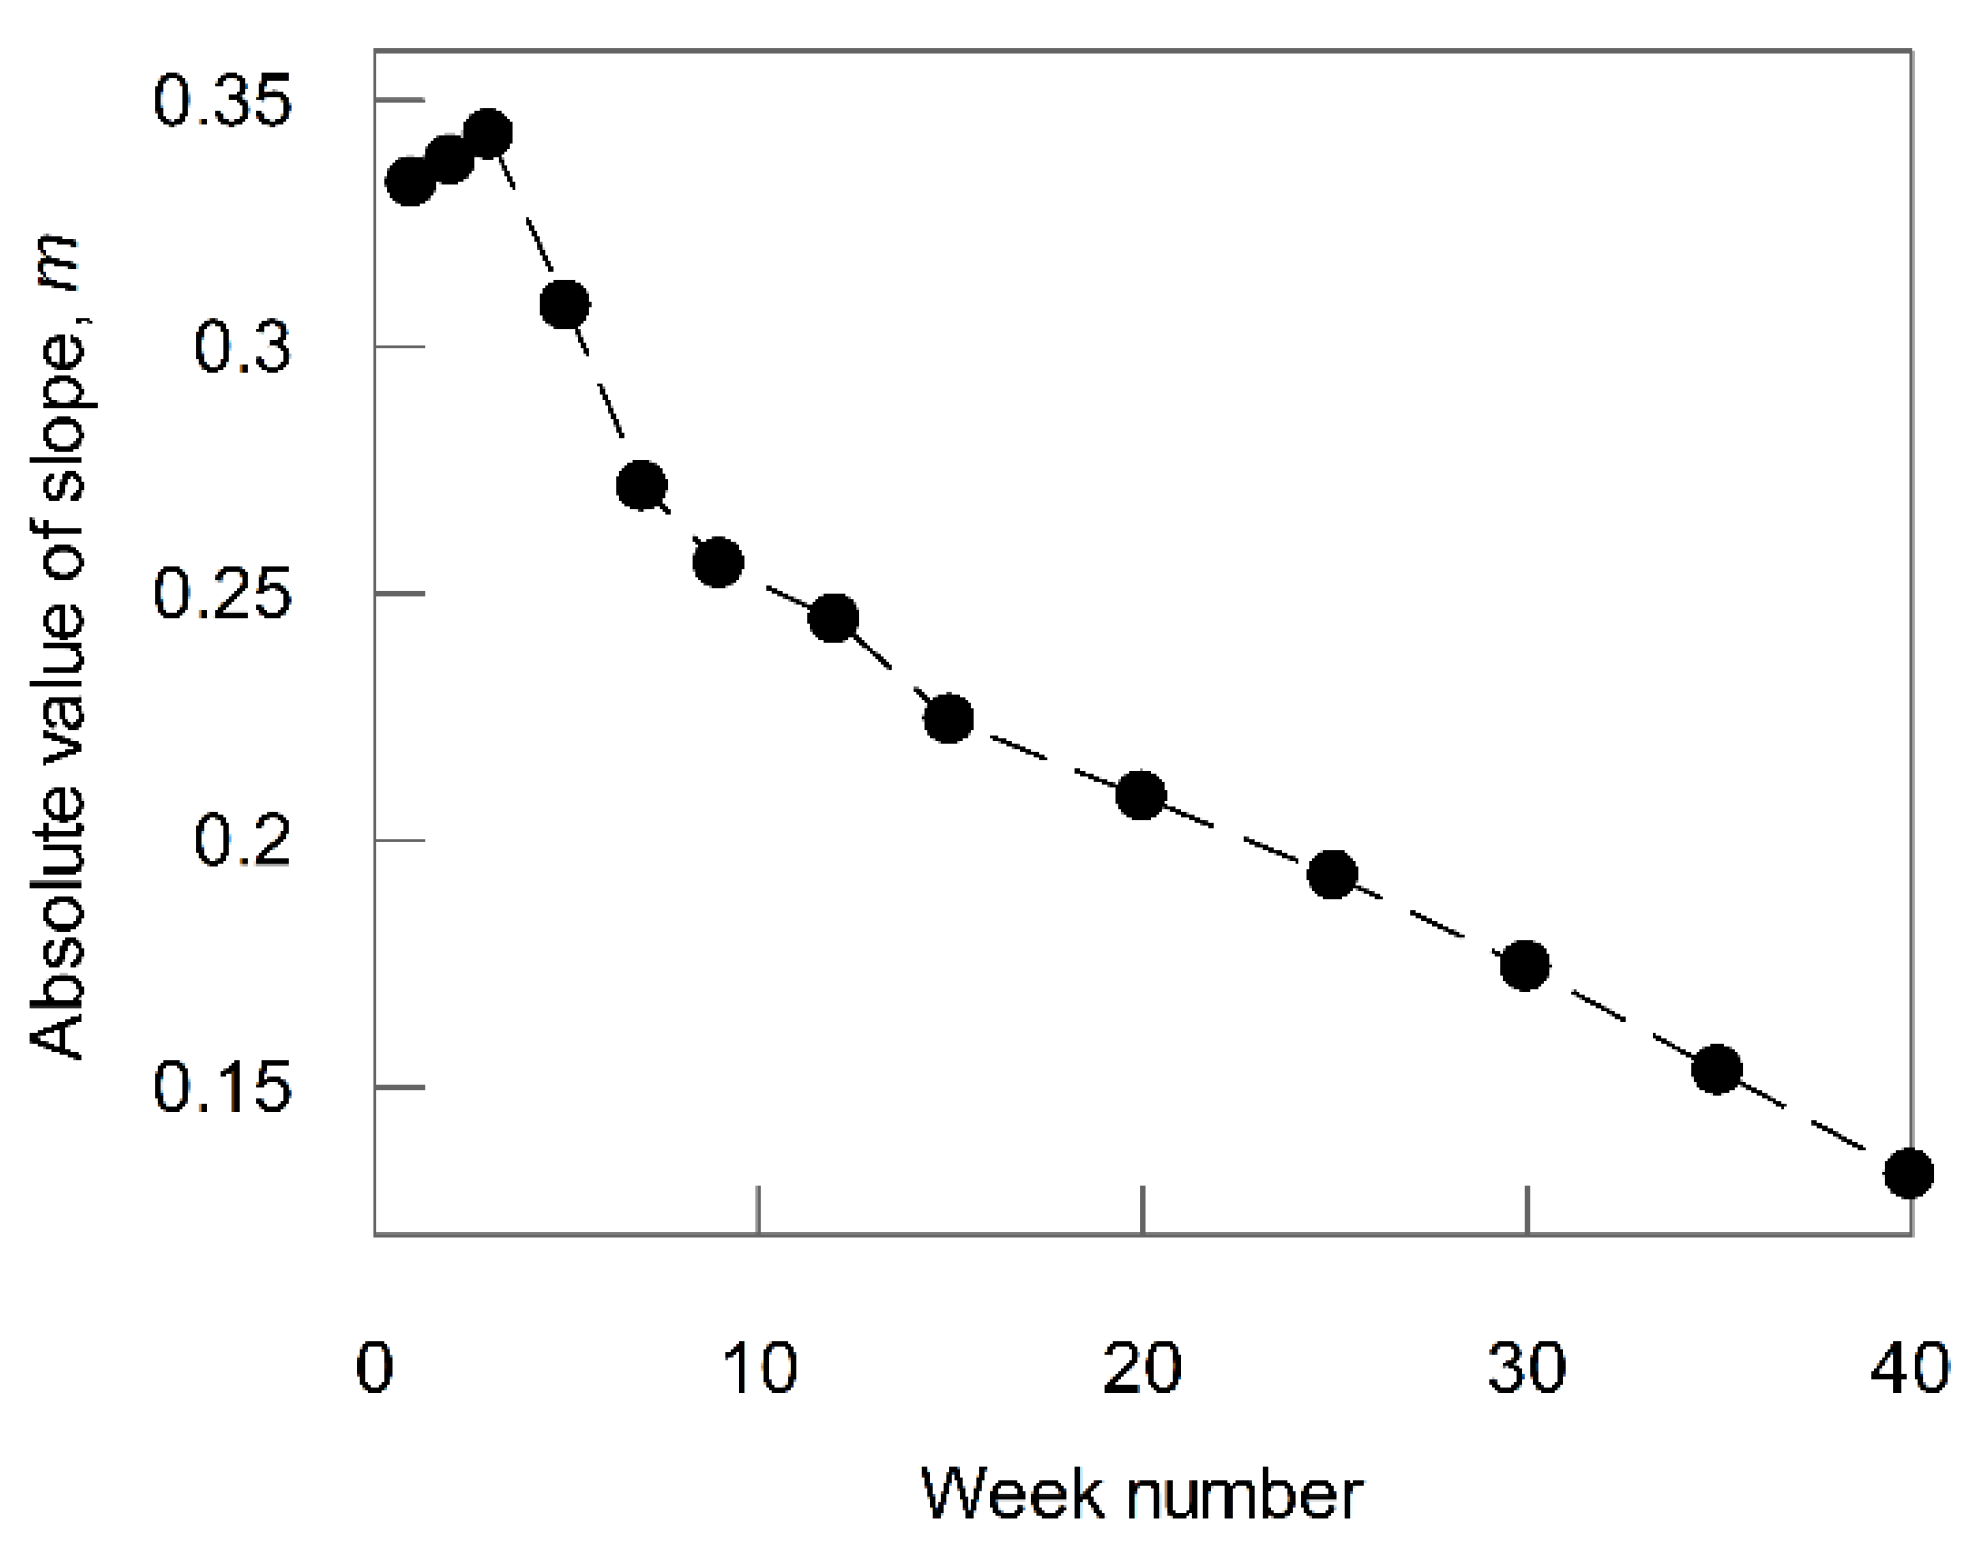
Another way of visualizing these changes is to plot the variation of m with incubation time, as shown in Figure 3, where, after a small increase in slope over the first three weeks, there is a reduction in the magnitude of m over the subsequent weeks.
3.3. Effect of Metal Co-Contaminant Concentration on ‘m’
To discern the effects of Cd, Pb and Hg co-contaminants on the structural selectivity of PAH removal processes, we carried out a similar analysis to that described in Section 3.2. The individual plots for the four metal concentrations at 3, 9, 20 and 40 weeks are shown in the Supplementary Figures S1–S3. These week numbers were chosen as being indicative of the overall trends over the 40-week period. The values for m at all weeks are shown in Supplementary Table S1.
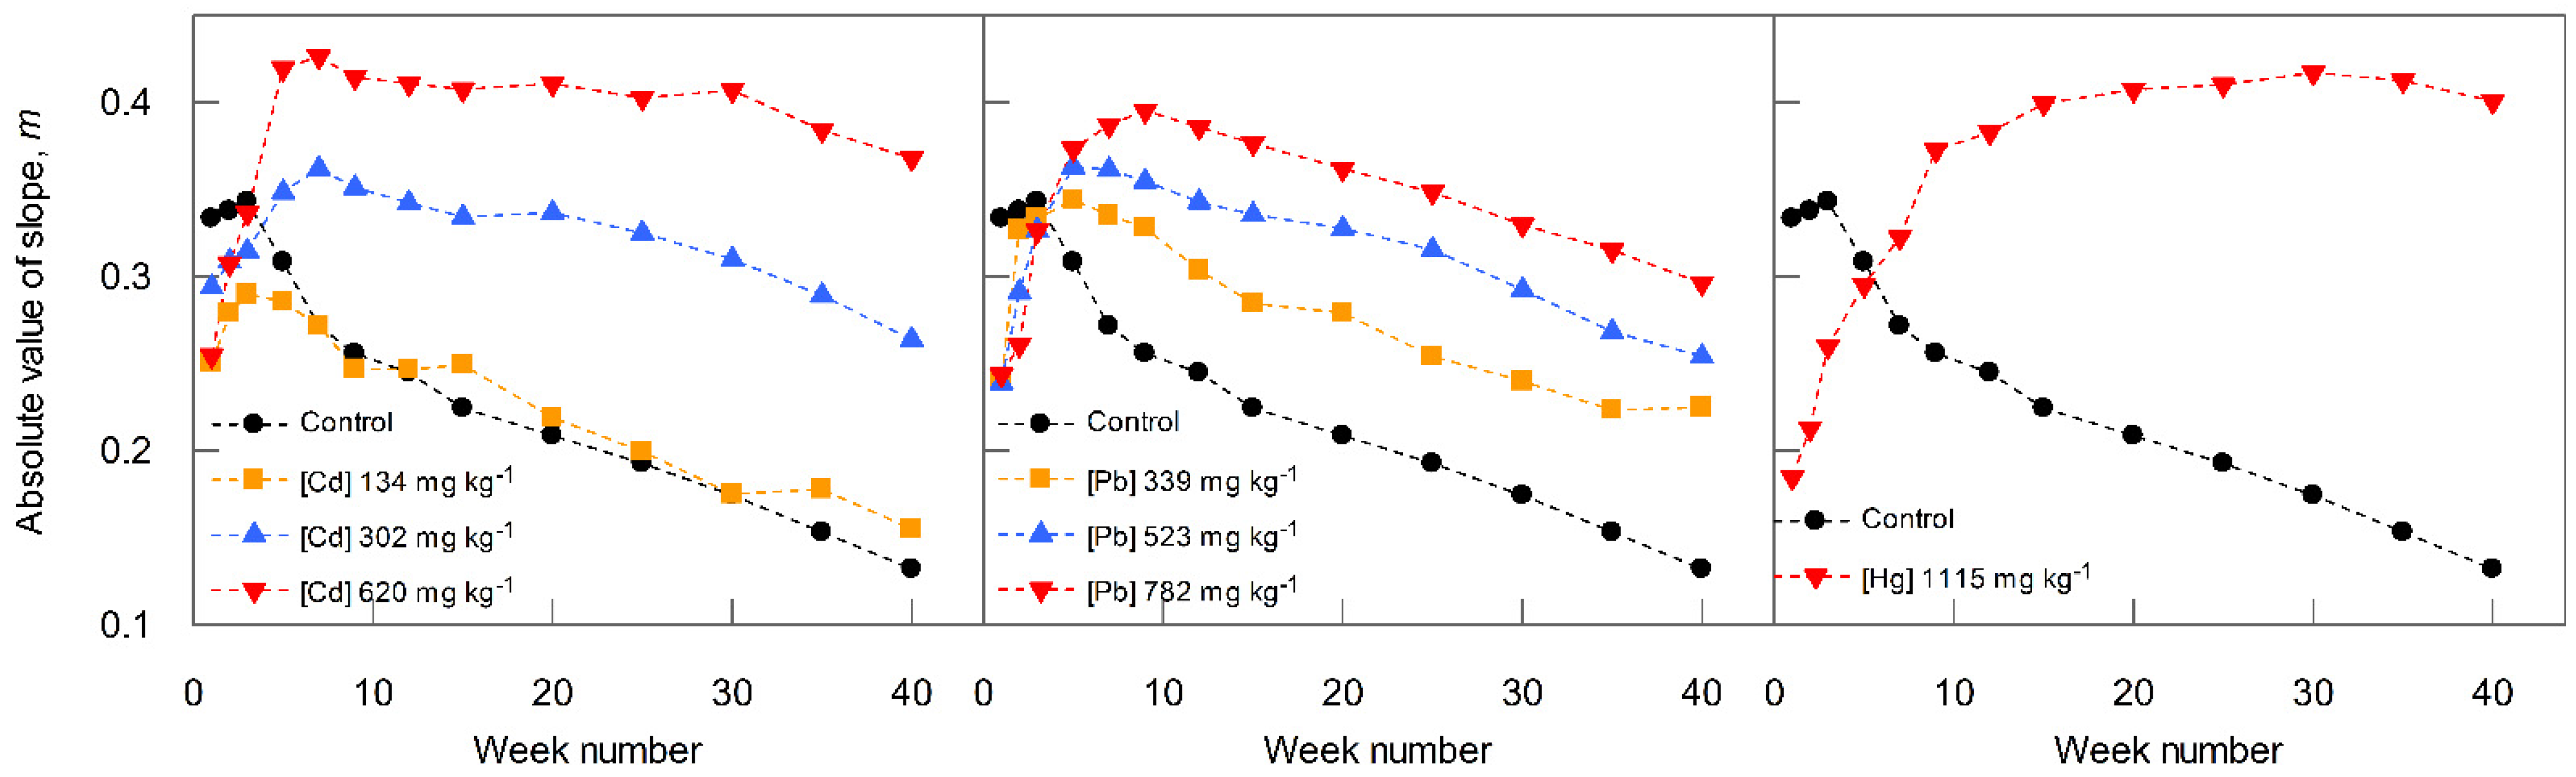
The trends in the magnitude of the m are best visualized by plotting against week number at each of the metal co-contaminant concentrations, as shown in Figure 4 for all weeks. For the lowest concentration of Cd, the value of m approximately follows the control, i.e., there is a steady reduction in the value of m with incubation time, indicating that the removal of HMW PAHs is catching up with the LMW PAHs over the 40-week study period. However, at the two highest Cd concentrations, the value of m remains much higher, and in fact increases between weeks 1 and 7, before decreasing again. The value for m at 40 weeks is greater at the two highest Cd concentrations compared to the lowest Cd concentration and the control. This indicates that there is an impact of the highest Cd concentrations on the physico-chemical and/or biological processes associated with removal of HMW PAHs. A similar trend to Cd is shown for Pb in Figure 3, except that the lowest Pb concentration does not follow the control, as was the case for Cd, i.e., all Pb concentrations have a negative impact on the removal of HMW PAHs. Finally, for Hg, with only one metal concentration applied, we see an initial increase in the value of m, followed by a levelling off at a much steeper slope than for the control at 40 weeks.
For these microcosms, we have previously reported that the microbial diversity, soil respiration rate and soil microbial biomass all decreased as the metal concentrations increased [1,9]. Lead seemed to have a marginally greater effect. The negative effect of metals on biodegradation of PAHs is well known [1,18,29,30]. It is thought that co-contamination exacerbates the overall toxic effect on microbial cells. PAHs are known to disrupt the bacterial cell membranes, allowing easier transport of the metals into the cell [22]. It is also thought that the formation of non-covalent metal cation-π complexes with PAHs [10,31,32,33] may facilitate this process [22]. Such complexes might also affect physico-chemical processes such as volatilisation and migration of PAHs to bio-inaccessible soil phases. With particular reference to the effect of metals on m, it has been shown in the literature that the degradation of HMW PAHs are most affected by metal co-contaminants, possibly as a result of the reliance of HMW PAH biodegradation on co-metabolic enzymic pathways by the soil microbiota [24,34] and the potential sensitivity of such microbial communities to metal toxicity. The increase, then decrease in m shown in Figure 4 for the two highest applied Cd and Pb concentrations, may be indicative of a build-up of metal community tolerance in the soil microbiota [35,36,37].
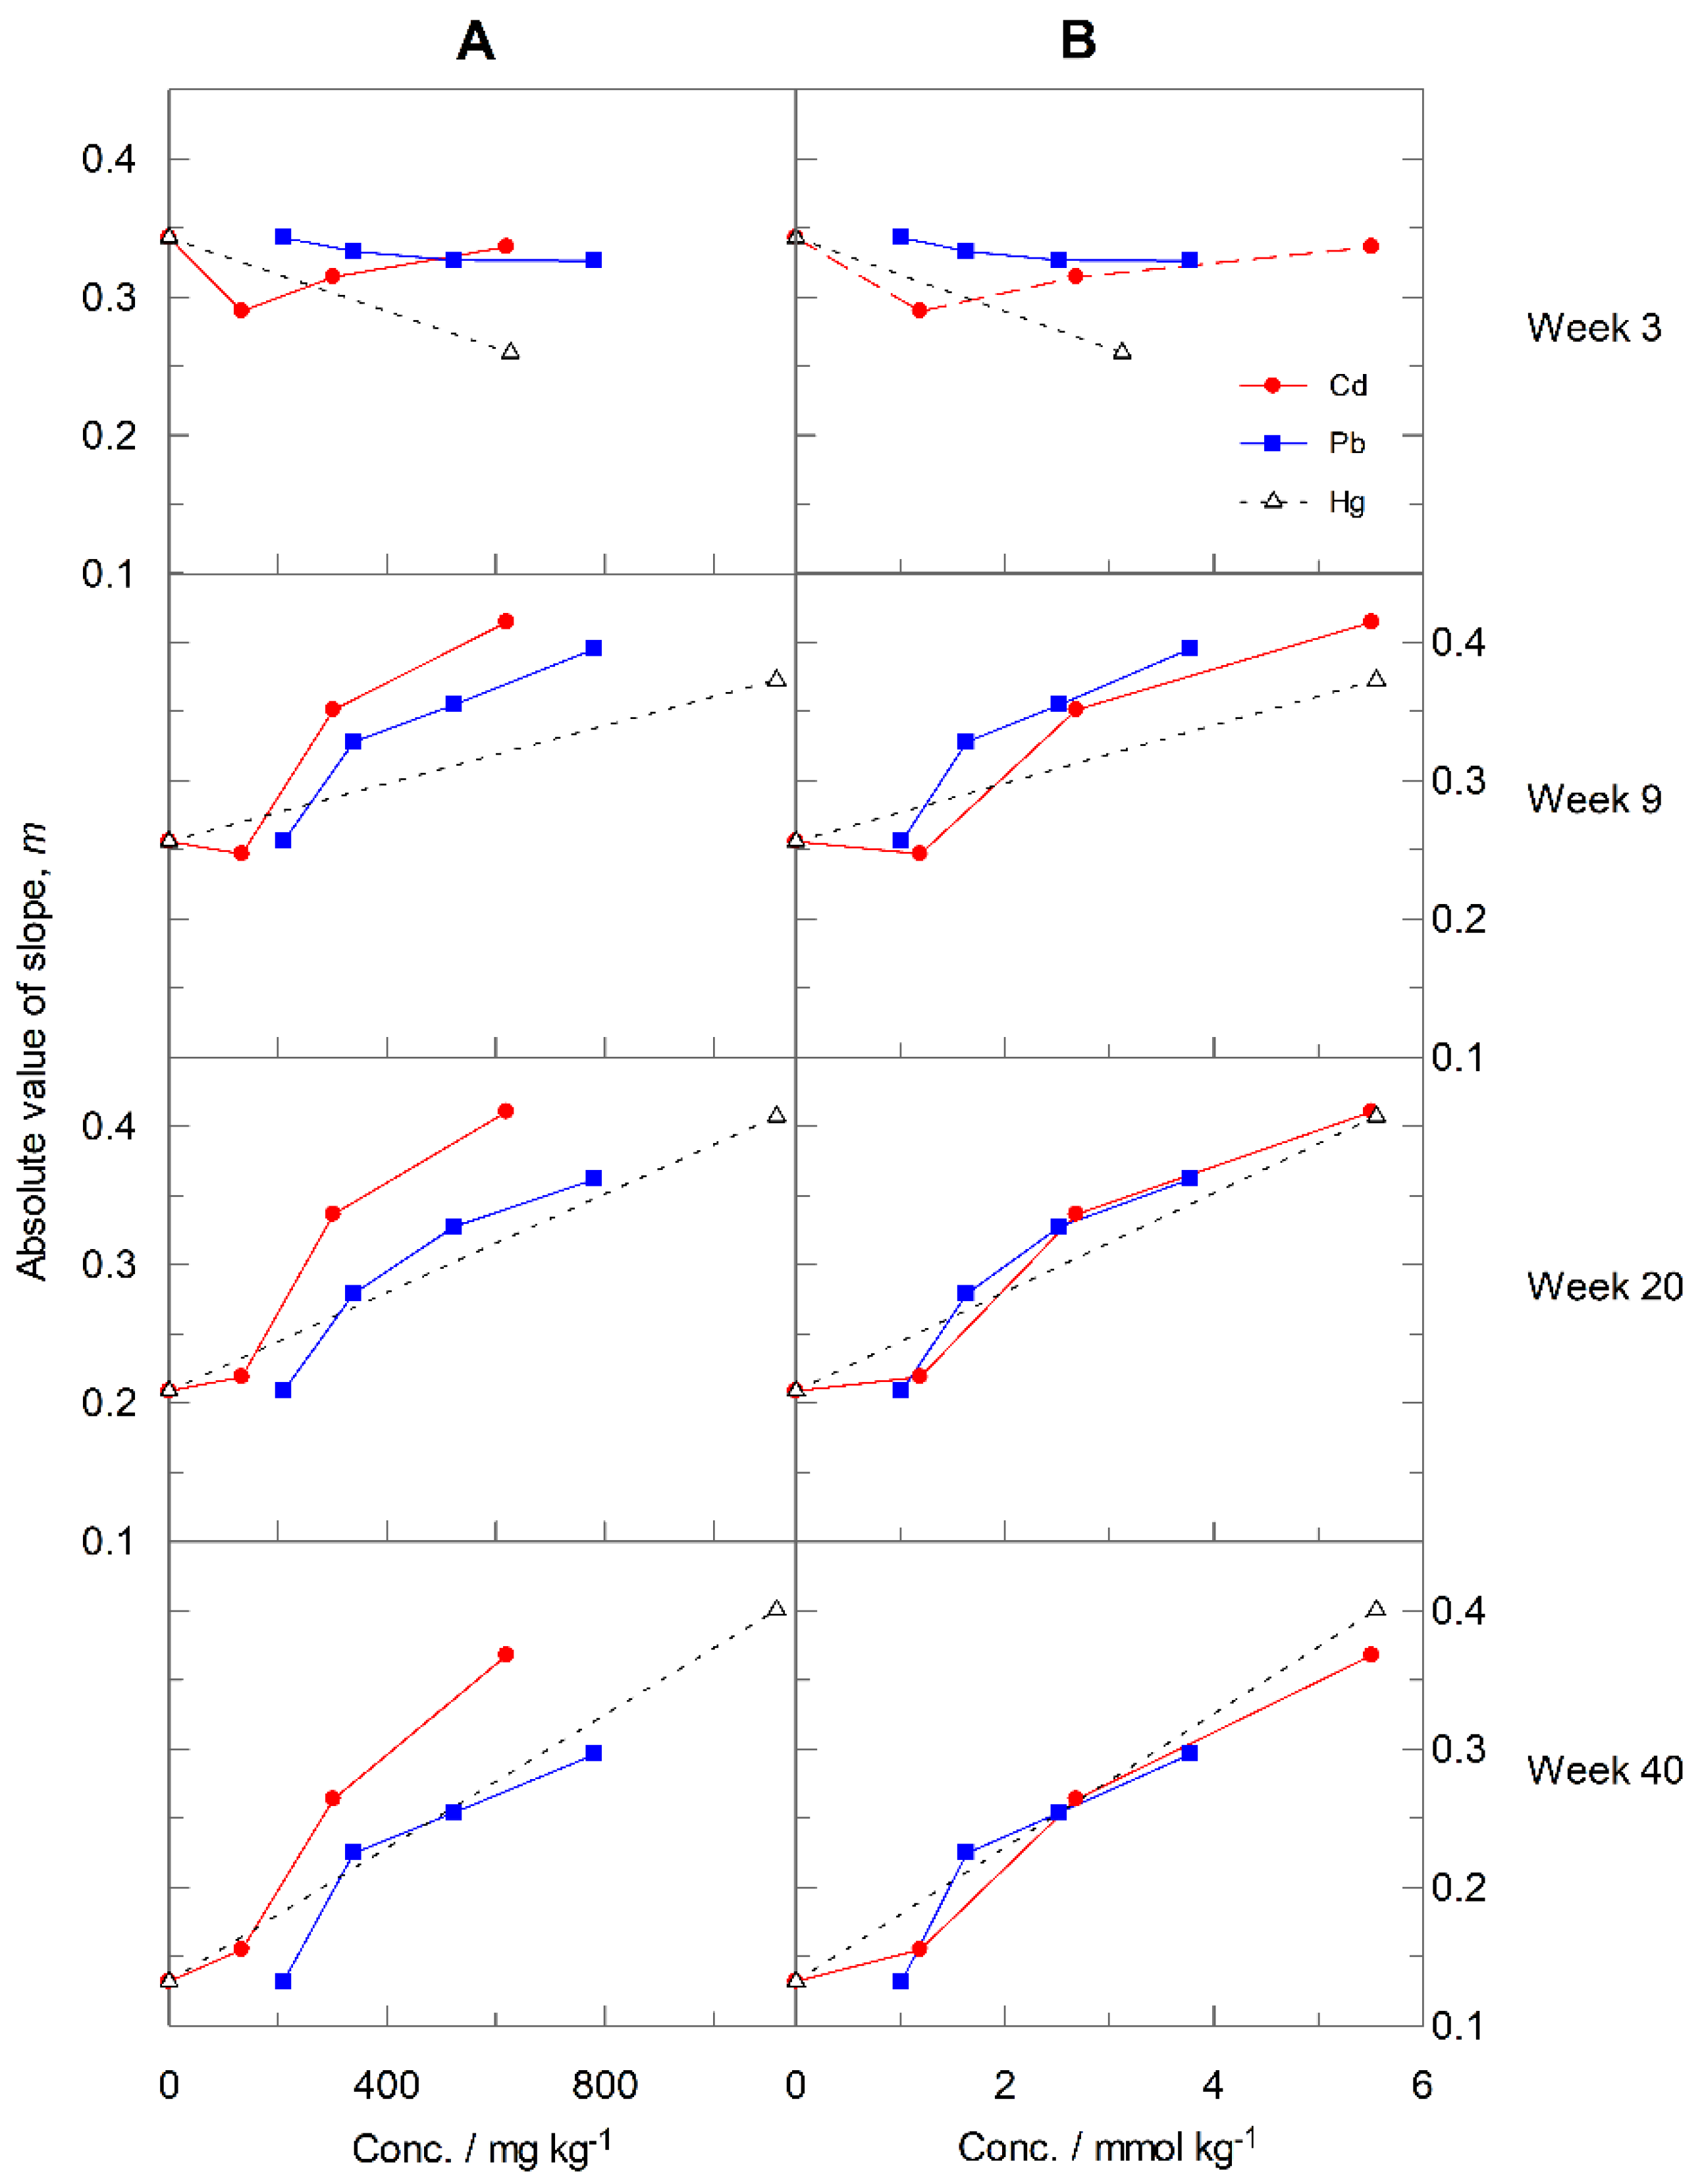
It is also intuitive to plot the data for m as a function of soil metal concentration, as shown in Figure 5, for weeks 3, 9, 20 and 40, both for mass (column A) and molar concentrations (column B). For the relationships shown in Figure 5A, at week 3 there is very little variation in the magnitude of m with increasing concentration, except for Hg where m decreases at the higher concentration. The relative invariance of m with concentration for Cd and Pb implies that the structural selectivity of the PAH removal processes is unaffected by increasing metal concentrations at 3 weeks. Our previous studies have shown that microbial degradation will be the most significant removal process in the early weeks of the study [1], and therefore we can conclude that these remain relatively unaffected at increasing metal concentrations. This may be due to the build-up, of short term tolerance, which in the case of Cd has been shown to be exhibited in periods as short as a few days [36]. Similar short-term development of metal tolerance has also been reported for other metals such as zinc [38].
The profile for Hg at week 3, albeit based on only one applied concentration (627 mg kg−1), may be indicative of the build-up of community tolerance to Hg in the early weeks of the study. Hg tolerance has been shown to emerge after relatively short periods of metal exposure [39], and in our previous studies, we have reported significant microbial activity in the Hg-sterilised microcosms after only one or two weeks, necessitating a reapplication of Hg (to 1115 mg kg−1) at 5 weeks in order to re-establish an abiotic control [1,9].
Notwithstanding the possible development of microbial community tolerance to metal co-contaminants at the early stages of the study, Figure 5 shows that the long-term stress of exposure to high metal concentration results in an increase in structural selectivity (the magnitude of m) with metal concentration in later weeks.
Figure 5A indicates that Cd has the greatest effect on structural selectivity when based on a mass concentration. However, when the metal concentrations are expressed as molar concentrations (Figure 5B) the curves at weeks 20 and 40, overlap to a significant extent, including for Hg. Whilst this is notable, perhaps implying a common mechanism of action, it should be remembered that there was a high background concentration of 210 mg kg−1 for Pb in the urban woodland soil that we used in this study and so ‘ageing’ will have occurred, with partitioning of Pb into various mineral and organic phases of the soil. Therefore, the total Pb, Cd and Hg concentrations might not be a like for like comparison. In literature comparisons of the toxicity of metals to soil microbiota, Cd is often reported as being more toxic than Pb [40,41]. Nevertheless, the effect of metals on soil microbiota is complex and is likely to depend on several factors such as bioavailability, soil organic matter concentration, duration of exposure and metal tolerance of microbiota species [41,42,43].
3.4. Significance and Application of ‘m’
The observation that m can be used as a sensitive measure of the impact of co-contaminants on biodegradation across a range of PAH molecular weights over time gives us an additional tool to aid the understanding of the microbial processes involved. The usefulness of m lies in the ability to quantify, within a single parameter, the effect of co-contaminants on PAH degradation across the range of molecular weights. Other methods of quantifying the effect of co-contaminants on biodegradation, such as soil respiration, soil biomass carbon concentration and soil metabolic quotient [9], yield parameters that show a dependence on co-contaminant concentration, but they do not convey the same level of information on the complexity of effect, as m does. There are other approaches that will yield more complex information about microbial diversity and the propensity to metabolise a wide range of PAHs, such as community level physiological profiling (CLPP) [44], and 16S DNA analysis of community DNA extracted from soil [45]. Nevertheless, for both these approaches, the implications for PAH biodegradation need to be inferred.
The most significant downside to the use of m is that it requires a long incubation period (40 weeks in our case) so that the time dimension can be adequately studied, as well as a laboratory equipped for the determination of environmental organic contaminants at low levels. The other methods that we have discussed can yield results over a period of only a couple of days or less. Nevertheless, the measurement of m could be simplified, for example by using a representative set of four or five PAHs across the molecular weight range, together with a more restricted set of incubation times. Such an assay, using a standardized soil, has the potential to be used as an ecotoxicological soil parameter, allowing a relative comparison of the effect of a wide range of organic and inorganic contaminants. In addition, the same methodology of determining m for PAHs can be applied to other structural series, for example to aliphatic compounds or other series of aromatic compounds.
4. Conclusions
In this paper, we have shown that the percentage PAH removal in a high organic matter-content urban woodland soil shows an inverse linear relationship with the RMM of the PAH, based on an analysis of the 16 US EPA priority PAHs. Furthermore, we have shown that the slope obtained from this linear relationship, m, is a useful and sensitive measure of structural selectivity of PAH removal processes. The change in the extent of structural selectivity as a function of incubation time and/or the presence of different concentrations of metal co-contaminants allows some insight into the effects on the soil microbiota and its ability to metabolise PAHs across a range of molecular weights. The increase in structural selectivity at higher concentrations of Cd and Pb and also in the presence of Hg suggests that the microbial community involved in removing HMW PAHs is more sensitive to environmental stresses compared to microbes responsible for LMW PAH removal. In terms of wider application, our study has shown that PAHs form a convenient structural series of organic molecules upon which the effect of a range of inorganic and organic environmental stressors can be tested. The relative effects of such stressors in different soil types might provide information that will be of use to the planning and implementation of remediation strategies in co-contaminated sites.
Supplementary Materials
The following are available online at https://0-www-mdpi-com.brum.beds.ac.uk/article/10.3390/environments9020023/s1, Table S1: Slope, m, (± Standard error) for the relationship between PAH Relative Molar Mass (RMM) and % removal of initial PAH concentration over a 40-week period at different metal concentrations; Figure S1: Change in slope, m, with time at different applied cadmium concentrations. The panels show the relationship between PAH Relative Molar Mass (RMM) and % removal of initial concentration at 3, 9, 20 and 40 weeks after application of the PAH mixture to soil microcosms in the presence of four different cadmium concentrations. The symbols represent 16 individual PAHs: the filled circles and filled square show alternant and non-alternant PAHs respectively. The dashed line is the line of best fit through the points. Error bars are ±1 standard deviation; Figure S2: Change in slope, m, with time at different applied lead concentrations. The panels show the relationship between PAH Relative Molar Mass (RMM) and % removal of initial concentration at 3, 9, 20 and 40 weeks after application of the PAH mixture to soil microcosms in the presence of four different lead concentrations. The symbols represent 16 individual PAHs: the filled circles and filled square show alternant and non-alternant PAHs respectively. The dashed line is the line of best fit through the points. Error bars are ±1 standard deviation.; Figure S3: Change in slope, m, with time at different applied mercury concentrations. The panels show the relationship between PAH Relative Molar Mass (RMM) and % removal of initial concentration at 3, 9, 20 and 40 weeks after application of the PAH mixture to soil microcosms in the presence mercury. The symbols represent 16 individual PAHs: the filled circles and filled square show alternant and non-alternant PAHs respectively. The dashed line is the line of best fit through the points. Error bars are ±1 standard deviation.
Author Contributions
Conceptualization, M.E.D., C.C.E. and S.P.C.; methodology, M.E.D., C.C.E. and S.P.C.; validation, M.E.D. and C.C.E.; formal analysis, M.E.D.; investigation, C.C.E.; resources, M.E.D.; data curation, M.E.D. and C.C.E.; writing—original draft preparation, M.E.D.; writing—review and editing, M.E.D., C.C.E. and S.P.C.; visualization, M.E.D.; supervision, M.E.D. and S.P.C.; project administration, M.E.D. All authors have read and agreed to the published version of the manuscript.
Funding
This research received no external funding.
Institutional Review Board Statement
Not applicable.
Informed Consent Statement
Not applicable.
Data Availability Statement
Data is contained within the article and supplementary material.
Acknowledgments
We are grateful to Northumbria University for financially supporting this study.
Conflicts of Interest
The authors declare no conflict of interest.
References
- Deary, M.E.; Ekumankama, C.C.; Cummings, S.P. Development of a novel kinetic model for the analysis of PAH biodegradation in the presence of lead and cadmium co-contaminants. J. Hazard Mater. 2016, 307, 240–252. [Google Scholar] [CrossRef] [PubMed] [Green Version]
- Juhasz, A.L.; Naidu, R. Bioremediation of high molecular weight polycyclic aromatic hydrocarbons: A review of the microbial degradation of benzo [a] pyrene. Int. Biodeterior. 2000, 45, 57–88. [Google Scholar] [CrossRef]
- Park, K.S.; Sims, R.C.; Dupont, R.R.; Doucette, W.J.; Matthews, J.E. Fate of PAH compounds in two soil types: Influence of volatilization, abiotic loss and biological activity. Environ. Toxicol. Chem. 1990, 9, 187–195. [Google Scholar] [CrossRef]
- Cerniglia, C.E. Biodegradation of polycyclic aromatic hydrocarbons. Curr. Opin. Biotech. 1993, 4, 331–338. [Google Scholar] [CrossRef]
- Kanaly, R.A.; Harayama, S. Biodegradation of high-molecular-weight polycyclic aromatic hydrocarbons by bacteria. J. Bacteriol. 2000, 182, 2059–2067. [Google Scholar] [CrossRef] [Green Version]
- Lu, M.; Xu, K.; Chen, J. Effect of pyrene and cadmium on microbial activity and community structure in soil. Chemosphere 2013, 91, 491–497. [Google Scholar] [CrossRef]
- Heitkamp, M.A.; Cerniglia, C.E. Effects of chemical structure and exposure on the microbial degradation of polycyclic aromatic hydrocarbons in freshwater and estuarine ecosystems. Environ. Toxicol. Chem. 1987, 6, 535–546. [Google Scholar] [CrossRef]
- Knightes, C.D.; Peters, C.A. Aqueous phase biodegradation kinetics of 10 PAH compounds. Environ. Eng. Sci. 2003, 20, 207–218. [Google Scholar] [CrossRef]
- Deary, M.E.; Ekumankama, C.C.; Cummings, S.P. Effect of lead, cadmium, and mercury co-contaminants on biodegradation in PAH-polluted soils. Land Degrad Dev. 2018, 29, 1583–1594. [Google Scholar] [CrossRef]
- Gao, Y.; Xiong, W.; Ling, W.; Xu, J. Sorption of phenanthrene by soils contaminated with heavy metals. Chemosphere 2006, 65, 1355–1361. [Google Scholar] [CrossRef]
- Wammer, K.H.; Peters, C.A. Polycyclic aromatic hydrocarbon biodegradation rates: A structure-based study. Environ. Sci. Technol. 2005, 39, 2571–2578. [Google Scholar] [CrossRef] [PubMed]
- Lors, C.; Ryngaert, A.; Perie, F.; Diels, L.; Damidot, D. Evolution of bacterial community during bioremediation of PAHs in a coal tar contaminated soil. Chemosphere 2010, 81, 1263–1271. [Google Scholar] [CrossRef] [PubMed]
- Bogan, B.W.; Lamar, R.; Burgos, W.; Tien, M. Extent of humification of anthracene, fluoranthene, and benzo [α] pyrene by Pleurotus ostreatus during growth in PAH-contaminated soils. Lett. Appl. Microbiol. 1999, 28, 250–254. [Google Scholar] [CrossRef]
- Calvo, C.; Silva-Castro, G.; Uad, I.; García Fandiño, C.; Laguna, J.; González-López, J. Efficiency of the EPS emulsifier produced by Ochrobactrum anthropi in different hydrocarbon bioremediation assays. J. Ind. Microbiol. Biot. 2008, 35, 1493–1501. [Google Scholar] [CrossRef] [PubMed]
- Hino, S.; Watanabe, K.; Takahashi, N. Isolation and characterization of slime-producing bacteria capable of utilizing petroleum hydrocarbons as a sole carbon source. J. Ferment. Bioeng. 1997, 84, 528–531. [Google Scholar] [CrossRef]
- Hua, X.; Wu, Z.; Zhang, H.; Lu, D.; Wang, M.; Liu, Y.; Liu, Z. Degradation of hexadecane by Enterobacter cloacae strain TU that secretes an exopolysaccharide as a bioemulsifier. Chemosphere 2010, 80, 951–956. [Google Scholar] [CrossRef]
- Guarino, C.; Zuzolo, D.; Marziano, M.; Conte, B.; Baiamonte, G.; Morra, L.; Benotti, D.; Gresia, D.; Stacul, E.R.; Cicchella, D. Investigation and assessment for an effective approach to the reclamation of polycyclic aromatic hydrocarbon (PAHs) contaminated site: SIN Bagnoli, Italy. Sci. Rep. 2019, 9, 11522. [Google Scholar] [CrossRef] [Green Version]
- Kotoky, R.; Pandey, P. Difference in the rhizosphere microbiome of Melia azedarach during removal of benzo (a) pyrene from cadmium co-contaminated soil. Chemosphere 2020, 258, 127175. [Google Scholar] [CrossRef] [PubMed]
- Cristaldi, A.; Conti, G.O.; Jho, E.H.; Zuccarello, P.; Grasso, A.; Copat, C.; Ferrante, M. Phytoremediation of contaminated soils by heavy metals and PAHs. A brief review. Environ. Technol. Innov. 2017, 8, 309–326. [Google Scholar] [CrossRef]
- Gan, S.; Lau, E.V.; Ng, H.K. Remediation of soils contaminated with polycyclic aromatic hydrocarbons (PAHs). J. Hazard Mater. 2009, 172, 532–549. [Google Scholar] [CrossRef]
- Atagana, H.I. Biodegradation of PAHs by fungi in contaminated-soil containing cadmium and nickel ions. Afr. J. Biotechnol. 2009, 8, 5780–5789. [Google Scholar] [CrossRef] [Green Version]
- Czarny, J.; Staninska-Pięta, J.; Piotrowska-Cyplik, A.; Juzwa, W.; Wolniewicz, A.; Marecik, R. Acinetobacter sp. as the key player in diesel oil degrading community exposed to PAHs and heavy metals. J. Hazard Mater. 2020, 383, 121168. [Google Scholar] [CrossRef] [PubMed]
- Obuekwe, I.S.; Semple, K.T. Impact of Al and Fe on the development of phenanthrene catabolism in soil. J. Soils Sediments 2013, 13, 1589–1599. [Google Scholar] [CrossRef]
- Johnsen, A.R.; Wick, L.Y.; Harms, H. Principles of microbial PAH-degradation in soil. Environ. Pollut. 2005, 133, 71–84. [Google Scholar] [CrossRef] [PubMed]
- Thavamani, P.; Malik, S.; Beer, M.; Megharaj, M.; Naidu, R. Microbial activity and diversity in long-term mixed contaminated soils with respect to polyaromatic hydrocarbons and heavy metals. J. Environ. Manag. 2012, 99, 10–17. [Google Scholar] [CrossRef] [PubMed]
- Mellor, A.; Bevan, J.R. Lead in the soils and stream sediments of an urban catchment in Tyneside, UK. Water Air Soil Poll. 1999, 112, 327–348. [Google Scholar] [CrossRef]
- Knightes, C.D.; Peters, C.A. Multisubstrate biodegradation kinetics for binary and complex mixtures of polycyclic aromatic hydrocarbons. Environ. Toxicol. Chem. 2006, 25, 1746–1756. [Google Scholar] [CrossRef]
- Northcott, G.L.; Jones, K.C. Partitioning, extractability, and formation of nonextractable PAH residues in soil. 1. Compound differences in aging and sequestration. Environ. Sci. Technol. 2001, 35, 1103–1110. [Google Scholar] [CrossRef]
- Staninska-Pięta, J.; Czarny, J.; Piotrowska-Cyplik, A.; Juzwa, W.; Wolko, Ł.; Nowak, J.; Cyplik, P. Heavy metals as a factor increasing the functional genetic potential of bacterial community for polycyclic aromatic hydrocarbon biodegradation. Molecules 2020, 25, 319. [Google Scholar] [CrossRef] [Green Version]
- Wang, R.; Lou, J.; Fang, J.; Cai, J.; Hu, Z.; Sun, P. Effects of heavy metals and metal (oxide) nanoparticles on enhanced biological phosphorus removal. Rev. Chem. Eng. 2020, 36, 947–970. [Google Scholar] [CrossRef]
- Müller, S.; Totsche, K.; Kögel-Knabner, I. Sorption of polycyclic aromatic hydrocarbons to mineral surfaces. Eur. J. Soil Sci. 2007, 58, 918–931. [Google Scholar] [CrossRef]
- Dougherty, D.A. The cation—π interaction. Acc. Chem. Res. 2013, 46, 885–893. [Google Scholar] [CrossRef] [PubMed] [Green Version]
- Vijay, D.; Sastry, G.N. Exploring the size dependence of cyclic and acyclic π-systems on cation–π binding. Phys. Chem. 2008, 10, 582–590. [Google Scholar] [CrossRef]
- Thavamani, P.; Megharaj, M.; Naidu, R. Bioremediation of high molecular weight polyaromatic hydrocarbons co-contaminated with metals in liquid and soil slurries by metal tolerant PAHs degrading bacterial consortium. Biodegradation 2012, 23, 823–835. [Google Scholar] [CrossRef] [PubMed]
- Niklinska, M.; Chodak, M.; Laskowski, R. Pollution-induced community tolerance of microorganisms from forest soil organic layers polluted with Zn or Cu. Appl. Soil Ecol. 2006, 32, 265–272. [Google Scholar] [CrossRef]
- Muniz, S.; Lacarta, J.; Pata, M.P.; Jimenez, J.J.; Navarro, E. Analysis of the diversity of substrate utilisation of soil bacteria exposed to Cd and earthworm activity using generalised additive models. PLoS ONE 2014, 9, e85057. [Google Scholar] [CrossRef]
- Almås, Å.R.; Bakken, L.R.; Mulder, J. Changes in tolerance of soil microbial communities in Zn and Cd contaminated soils. Soil Biol. Biochem. 2004, 36, 805–813. [Google Scholar] [CrossRef]
- Diaz-Ravina, M.; Baath, E. Development of metal tolerance in soil bacterial communities exposed to experimentally increased metal levels. Appl. Environ. Microbiol. 1996, 62, 2970–2977. [Google Scholar] [CrossRef] [Green Version]
- Frossard, A.; Donhauser, J.; Mestrot, A.; Gygax, S.; Bååth, E.; Frey, B. Long-and short-term effects of mercury pollution on the soil microbiome. Soil Biol. Biochem. 2018, 120, 191–199. [Google Scholar] [CrossRef]
- Muhammad, A.; Xu, J.; Li, Z.; Wang, H.; Yao, H. Effects of lead and cadmium nitrate on biomass and substrate utilization pattern of soil microbial communities. Chemosphere 2005, 60, 508–514. [Google Scholar] [CrossRef]
- Bååth, E. Effects of Heavy-Metals in Soil on Microbial Processes and Populations (a Review). Water Air Soil Poll. 1989, 47, 335–379. [Google Scholar] [CrossRef]
- Giller, K.E.; Witter, E.; McGrath, S.P. Heavy metals and soil microbes. Soil Biol. Biochem. 2009, 41, 2031–2037. [Google Scholar] [CrossRef]
- Giller, K.E.; Witter, E.; Mcgrath, S.P. Toxicity of heavy metals to microorganisms and microbial processes in agricultural soils: A review. Soil Biol. Biochem. 1998, 30, 1389–1414. [Google Scholar] [CrossRef]
- Kirk, J.L.; Beaudette, L.A.; Hart, M.; Moutoglis, P.; Klironomos, J.N.; Lee, H.; Trevors, J.T. Methods of studying soil microbial diversity. J. Microbiol. Meth. 2004, 58, 169–188. [Google Scholar] [CrossRef] [PubMed]
- Müller, A.K.; Westergaard, K.; Christensen, S.; Sørensen, S.J. The effect of long-term mercury pollution on the soil microbial community. FEMS Microbiol. Ecol. 2001, 36, 11–19. [Google Scholar] [CrossRef]
Figure 1.
Relationship between PAH Relative Molar Mass (RMM) and % removal of initial PAH concentration at three weeks after application of PAH mixture to soil microcosms. The symbols represent 16 individual PAHs: the filled circles and filled squares show alternant and non-alternant PAHs, respectively. The dashed line is the line of best fit through the points. Error bars are ±1 standard deviation. No metal additions were made to this microcosm. PAH abbreviations are as follows: NAP (Naphthalene); ACY (Acenaphthylene); ACE (Acenaphthene); FLU (Fluorene); PHE (Phenanthrene); ANT (Anthracene); FLA (Fluoranthene); PYR (Pyrene); BaA (Benzo[a]anthracene); CHR (Chrysene); BbF (Benzo[b]fluoranthene); BkF (Benzo[k]fluoranthene); BaP (Benzo[a]pyrene); IcdP (Indeno[cd-123]pyrene); DahA (Dibenzo[ah]anthracene); BghiP (Benzo[ghi]perylene).

Figure 2.
Change in slope, m, with time. The panels show the relationship between PAH Relative Molar Mass (RMM) and % removal of initial concentration at 3, 9, 20 and 40 weeks after application of the PAH mixture to soil microcosms. The symbols represent 16 individual PAHs: the filled circles and filled squares show alternant and non-alternant PAHs, respectively. The dashed line is the line of best fit through the points. Error bars are ±1 standard deviation. No metal amendments were made to these microcosms.

Figure 3.
Plot of the absolute value of m with time. The dashed line is a guide for the eye. The raw data for this plot, including standard errors of the slopes is given in Table S1 in the Supplementary Material.
Figure 3.
Plot of the absolute value of m with time. The dashed line is a guide for the eye. The raw data for this plot, including standard errors of the slopes is given in Table S1 in the Supplementary Material.

Figure 4.
Plot of the absolute value of m as a function of time for different concentrations of Cd, Pb, and Hg. The raw data for this plot, including standard errors is given in Table S1 in the Supplementary Material. The lines are guides for the eye.
Figure 4.
Plot of the absolute value of m as a function of time for different concentrations of Cd, Pb, and Hg. The raw data for this plot, including standard errors is given in Table S1 in the Supplementary Material. The lines are guides for the eye.

Figure 5.
Plot of the absolute value of m, against metal concentration at weeks 3, 9, 20 and 40. Panel sets (A,B) represent metal concentrations expressed as mass and molar concentrations, respectively. Values for m were obtained from Figures S1–S3 for Cd, Pb and Hg, respectively. The lines are guides for the eye. The raw data for this plot, including standard errors, is given in Table S1 in the Supplementary Material.


Table 1.
Structure, relative molar mass (RMM) and initial concentrations of the 16 US EPA PAHs reported on in this study.
Table 1.
Structure, relative molar mass (RMM) and initial concentrations of the 16 US EPA PAHs reported on in this study.
| Name, RMM and Initial Concentration (mg kg−1) in Microcosms | Structure | Name, RMM and Initial Concentration (mg kg−1) in Microcosms | Structure |
|---|---|---|---|
| Naphthalene 128.17 3.28 ± 0.63 |  | Benzo[a]anthracene 228.29 167.9 ± 25.9 |  |
| Acenaphthylene 152.19 1.44 ± 0.23 |  | Chrysene 228.29 196.1 ± 33.3 |  |
| Acenaphthene 154.21 7.75 ± 1.92 |  | Benzo[b]fluoranthene 252.31 324.7 ± 55.5 |  |
| Fluorene 166.22 9.53 ± 1.63 |  | Benzo[k]fluoranthene 252.31 138.1 ± 20.1 |  |
| Phenanthrene 178.23 93.43 ± 15.08 |  | Benzo[a]pyrene 252.31 254.9 ± 40.12 |  |
| Anthracene 178.23 27.56 ± 4.12 |  | Indeno[1,2,3-cd]pyrene 276.33 246.31 ± 43.1 |  |
| Fluoranthene 202.25 217.6 ± 35.6 |  | Dibenzo[a,h]anthracene 278.34 105.4 ± 17.9 |  |
| Pyrene 202.25 187.8 ± 31.5 |  | Benzo[g,h,i]perylene 276.33 184.5 ± 31.8 |  |
Publisher’s Note: MDPI stays neutral with regard to jurisdictional claims in published maps and institutional affiliations. |
© 2022 by the authors. Licensee MDPI, Basel, Switzerland. This article is an open access article distributed under the terms and conditions of the Creative Commons Attribution (CC BY) license (https://creativecommons.org/licenses/by/4.0/).
Share and Cite
MDPI and ACS Style
Deary, M.E.; Ekumankama, C.C.; Cummings, S.P. Structural Selectivity of PAH Removal Processes in Soil, and the Effect of Metal Co-Contaminants. Environments 2022, 9, 23. https://0-doi-org.brum.beds.ac.uk/10.3390/environments9020023
AMA Style
Deary ME, Ekumankama CC, Cummings SP. Structural Selectivity of PAH Removal Processes in Soil, and the Effect of Metal Co-Contaminants. Environments. 2022; 9(2):23. https://0-doi-org.brum.beds.ac.uk/10.3390/environments9020023
Chicago/Turabian StyleDeary, Michael E., Chinedu C. Ekumankama, and Stephen P. Cummings. 2022. "Structural Selectivity of PAH Removal Processes in Soil, and the Effect of Metal Co-Contaminants" Environments 9, no. 2: 23. https://0-doi-org.brum.beds.ac.uk/10.3390/environments9020023
Note that from the first issue of 2016, this journal uses article numbers instead of page numbers. See further details here.