Parameter Evaluation of Exponential-Form Critical State Line of a State-Dependent Sand Constitutive Model

1
Université Paris-Est, Ecole des Ponts ParisTech, Navier-CERMES, 6-8 av. Blaise Pascal, Cité Descartes, Champs-sur-Marne, 77455 Marne-la-Vallée, CEDEX 2, France
2
Department of Civil Engineering, Zhejiang University, Hangzhou 310058, China
*
Author to whom correspondence should be addressed.
Appl. Sci. 2020, 10(1), 328; https://0-doi-org.brum.beds.ac.uk/10.3390/app10010328
Submission received: 18 November 2019
/
Revised: 16 December 2019
/
Accepted: 30 December 2019
/
Published: 1 January 2020
(This article belongs to the Special Issue Seismic Geotechnical Hazards Studies)
Abstract
:Featured Application
In this paper, the influence of two model parametersandof critical state line on sand dilatancy behaviour are discussed. However, the emphasis is still put on liquefaction behaviour of clean loose sand. Moreover, a large number of real field studies have indicated that the presence of silt is very common at the liquefied sites during earthquakes. Therefore, this study could also be extended to investigate the potential influence of fine fraction of silty sand mixture on the critical state line and its instability behaviour.
Abstract
In sand constitutive models, it is of cardinal importance to consider a state parameter to distinguish the real dilatancy for cohesionless soils (sand), which is different from cohesive soils (clay). Thus, one of the key issues in simulating the sand behaviour is the better representation and parameter calibration of critical state line (CSL) for estimating contraction in loose state and dilatancy in dense state, respectively. For this purpose, a new exponential form for CSL with two model constants a and has been presented in the literature. This paper provides a valuable insight into the two model constants, controlling the shape of the critical state line by simulating a uniform quartz reference sand (Hostun RF) in loose and dense states under undrained triaxial conditions. It can be concluded that the liquefaction behaviour in loose state is fundamentally affected by even a minor variation in model constant , but insensitive to model constant . Moreover, the linear fitting calibration of CSL recommended in the literature is complicated in consideration of the non-unified critical state line. Thus, the maximum void ratio in the natural state could be considered as a comparison basis on which to evaluate the liquefaction potential as an alternative. The numerical results showed good agreement with real experimental data. However, in dense state, the dilatant behaviour of sand was found to be mainly controlled by model parameter . In addition, the influence of a non-unified critical state under various confining pressures on the determination of should not be neglected. With the correction of , the numerical results were found to be consistent with the experimental data concerning Hostun RF sand.
1. Introduction
Unlike metal materials, the shear strength of natural silica sand is controlled by internal frictions. Subjected to a relatively low loading, the destruction of sand specimens is caused by relative sand particle movements, instead of particle crushing. Especially during an earthquake, much of the severe damage of geotechnical structures can be attributed to sand liquefaction, which results in large land deformations due to positive excess pore water pressure. Therefore, a better constitutive modelling of sand on various states should consider both dilatant and liquefaction behaviours. In the triaxial stress–strain space, the dilatancy is commonly described as the incremental ratio of the plastic volumetric strain to that of the deviatoric strain: , where , , superscript ‘p’ stands for plastic and overdot stands for increment. On the basis of the experimental results of clayey soils, with the assumption of incremental plastic energy in the Cam-Clay model, Roscoe and Schofield [1] proposed , where represents stress ratio. Later, Roscoe and Burland [2] modified the dilatancy law in order to ensure that the direction of strain flux is horizontal while . However, Verdugo and Ishihara [3], and Li and Dafalias [4] pointed out that the above equations for cohesive soils does not adapt to cohesionless soils because is expressed as a unique function of stress ratio with a constant material parameter in both the above versions. A state parameter containing both the effect of void ratio and confining pressure should be carefully taken into account in the dilatancy law for sand. The simplification of the former leads to multiple sets of model parameters because the same sands in loose and dense states are treated as totally different materials. Numerous experimental results show that the stress–strain response of sand is largely dependent on the relative density and effective confining pressure. For this purpose, a dimensionless scalar was introduced by Been and Jefferies [5], which estimates the distance between the current and critical void ratios under the same effective confining pressure, . Thus, the sand contracts in loose state while , and the sand dilates in dense state while . To avoid the counting problem of positive and negative signs, some researchers propose using the ratio of the current and critical void ratios instead of the difference measured in plan.
One of the fundamental issues in sand constitutive modelling is the precise representation of critical state line in terms of the effective confining pressure . In general, plotting these lines of cohesionless sand in plan makes the expression algebraically more difficult. Firstly, the real experimental data [6,7] revealed that the critical state line from very loose to loose states falls within a spindle instead of a simple line. The simplification to a straight line leads to inaccurate calculations of sand instability behaviour. Secondly, the unification of the critical state of the same sand specimen under different confining pressures is still under discussion. Attempts have been made—Li et al. [8] found that these lines are almost straight in the plan, instead of the conventional plan. More recently, Luo and Zhang [9] proposed a new exponential form of the critical state by using the following equation with a positive and a negative constant , respectively:
The comparison presented in the literature between numerical simulations and experimental results in triaxial space indicates that the above equation is adequate for describing the dilatancy in the high density and effective confining pressure range. Nevertheless, the influence of the two mentioned parameters on liquefaction behaviour is still unclear. Therefore, the emphasis of this paper is to evaluate the influence of model constants on exponential-form critical line. In addition, special attention is paid to investigating the effect of the non-unified critical state on the determination of model parameters. The description of the model [9] used in this paper is briefly given in the next section, followed by a detailed synthesis of the effect of the models parameters on critical state.
2. Model Description
In this section, all formulas are described in triaxial conditions, where and . Generally speaking, sand deformation could be caused by grain sliding and sand crushing. However, within the scope of the present work, it is supposed that the rupture of sand specimens is solely caused by the relative displacement between soil grains. Under this assumption, the yield criterion surface appears as an open wedge with -axis in the
In the framework of elasto-plasticity theory and the range of small deformations and rotations, the mechanical behaviour of sand could be divided into elastic and plastic parts, namely:
In the elastic part, the shear modulus is expressed by the following empirical equation [4,10]:
where is the current void ratio, and is the atmospheric pressure for normalization (). Note that the unit of the elastic shear modulus is given by the unit of mean effective stress , which causes to be a dimensionless model constant. On the basis of elasticity theory, the bulk modulus is equal to
where is the Poisson’s ratio, which is considered constant and independent of effective confining pressure and the density index.
By applying the loading index [11], the plastic deviatoric strain increment can be expressed as
where and is the plastic hardening modulus. As mentioned earlier, the key issue of describing the deformation of sand is the implantation of the state parameter into the dilatancy law [9]:
where is a model dimensionless constant, and is the stress ratio at critical state. Then the deviatoric and volumetric strain increment can be composed as follows:
Here, it is of great importance to recall that the flow rule used in this study is non-associated, as the flux of plastic strain is directly defined by the dilatancy equation. Meanwhile, the flux of plastic strain is controlled by model constant parameter n. State parameter is implanted into plastic hardening modulus [9,12]:
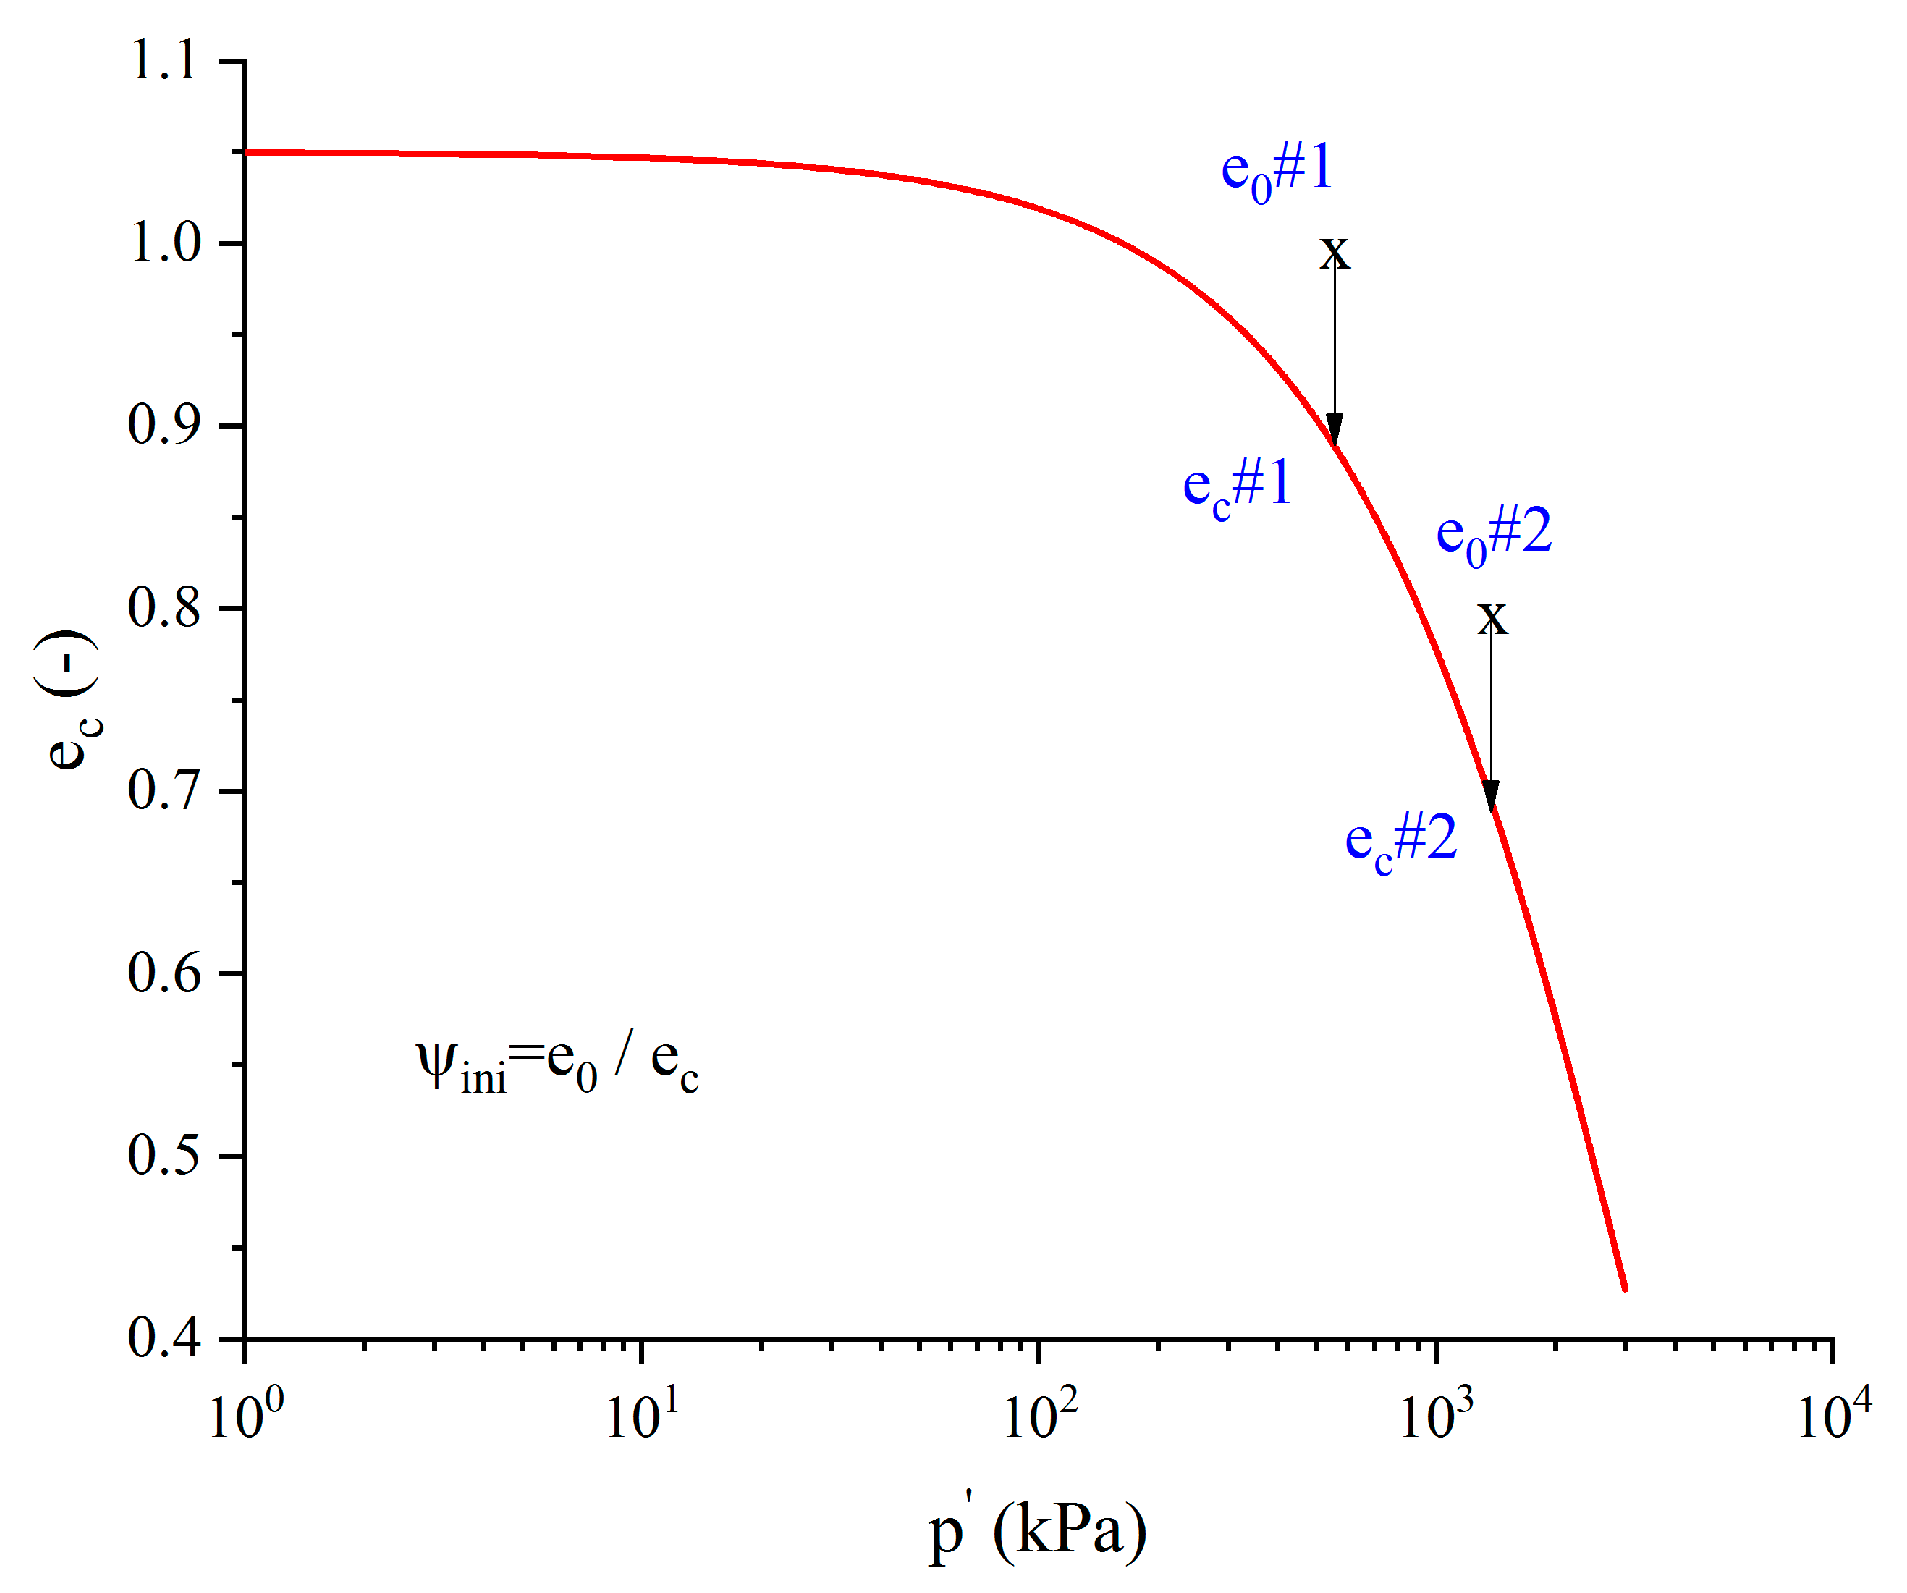
where is the elastic shear modulus at the current state. Note that the initial state parameter values , under different density index and confining pressures are possible to them to be the same (see Figure 1). Thus, a dimensionless model parameter standing for the effect of initial void ratio is needed in Equation (11) in order to compensate this error, and it reads:
where are model dimensionless parameters and is the initial void ratio.
It is worth noting that the plastic hardening modulus has the following special values:
- , at the beginning of the test;
- , in achievement of the critical state.
From Equations (11) and (12), it can be seen that the hardening or softening behaviour is determined by the sign of . Sand is initially in a dense state when , which results in and sand response is hardening. Sand is initially in a loose state when . Its response is hardening with and softening with . Thus, the introduction of state parameter in the plastic modulus succeeds in distinguishing the hardening and softening response of sand. Finally, the relationship between the stress and strain increments can be established in a matrix form as:
where is equal to .
3. Effect of Model Constant on Critical State
3.1. Liquefaction Behaviour in Loose State
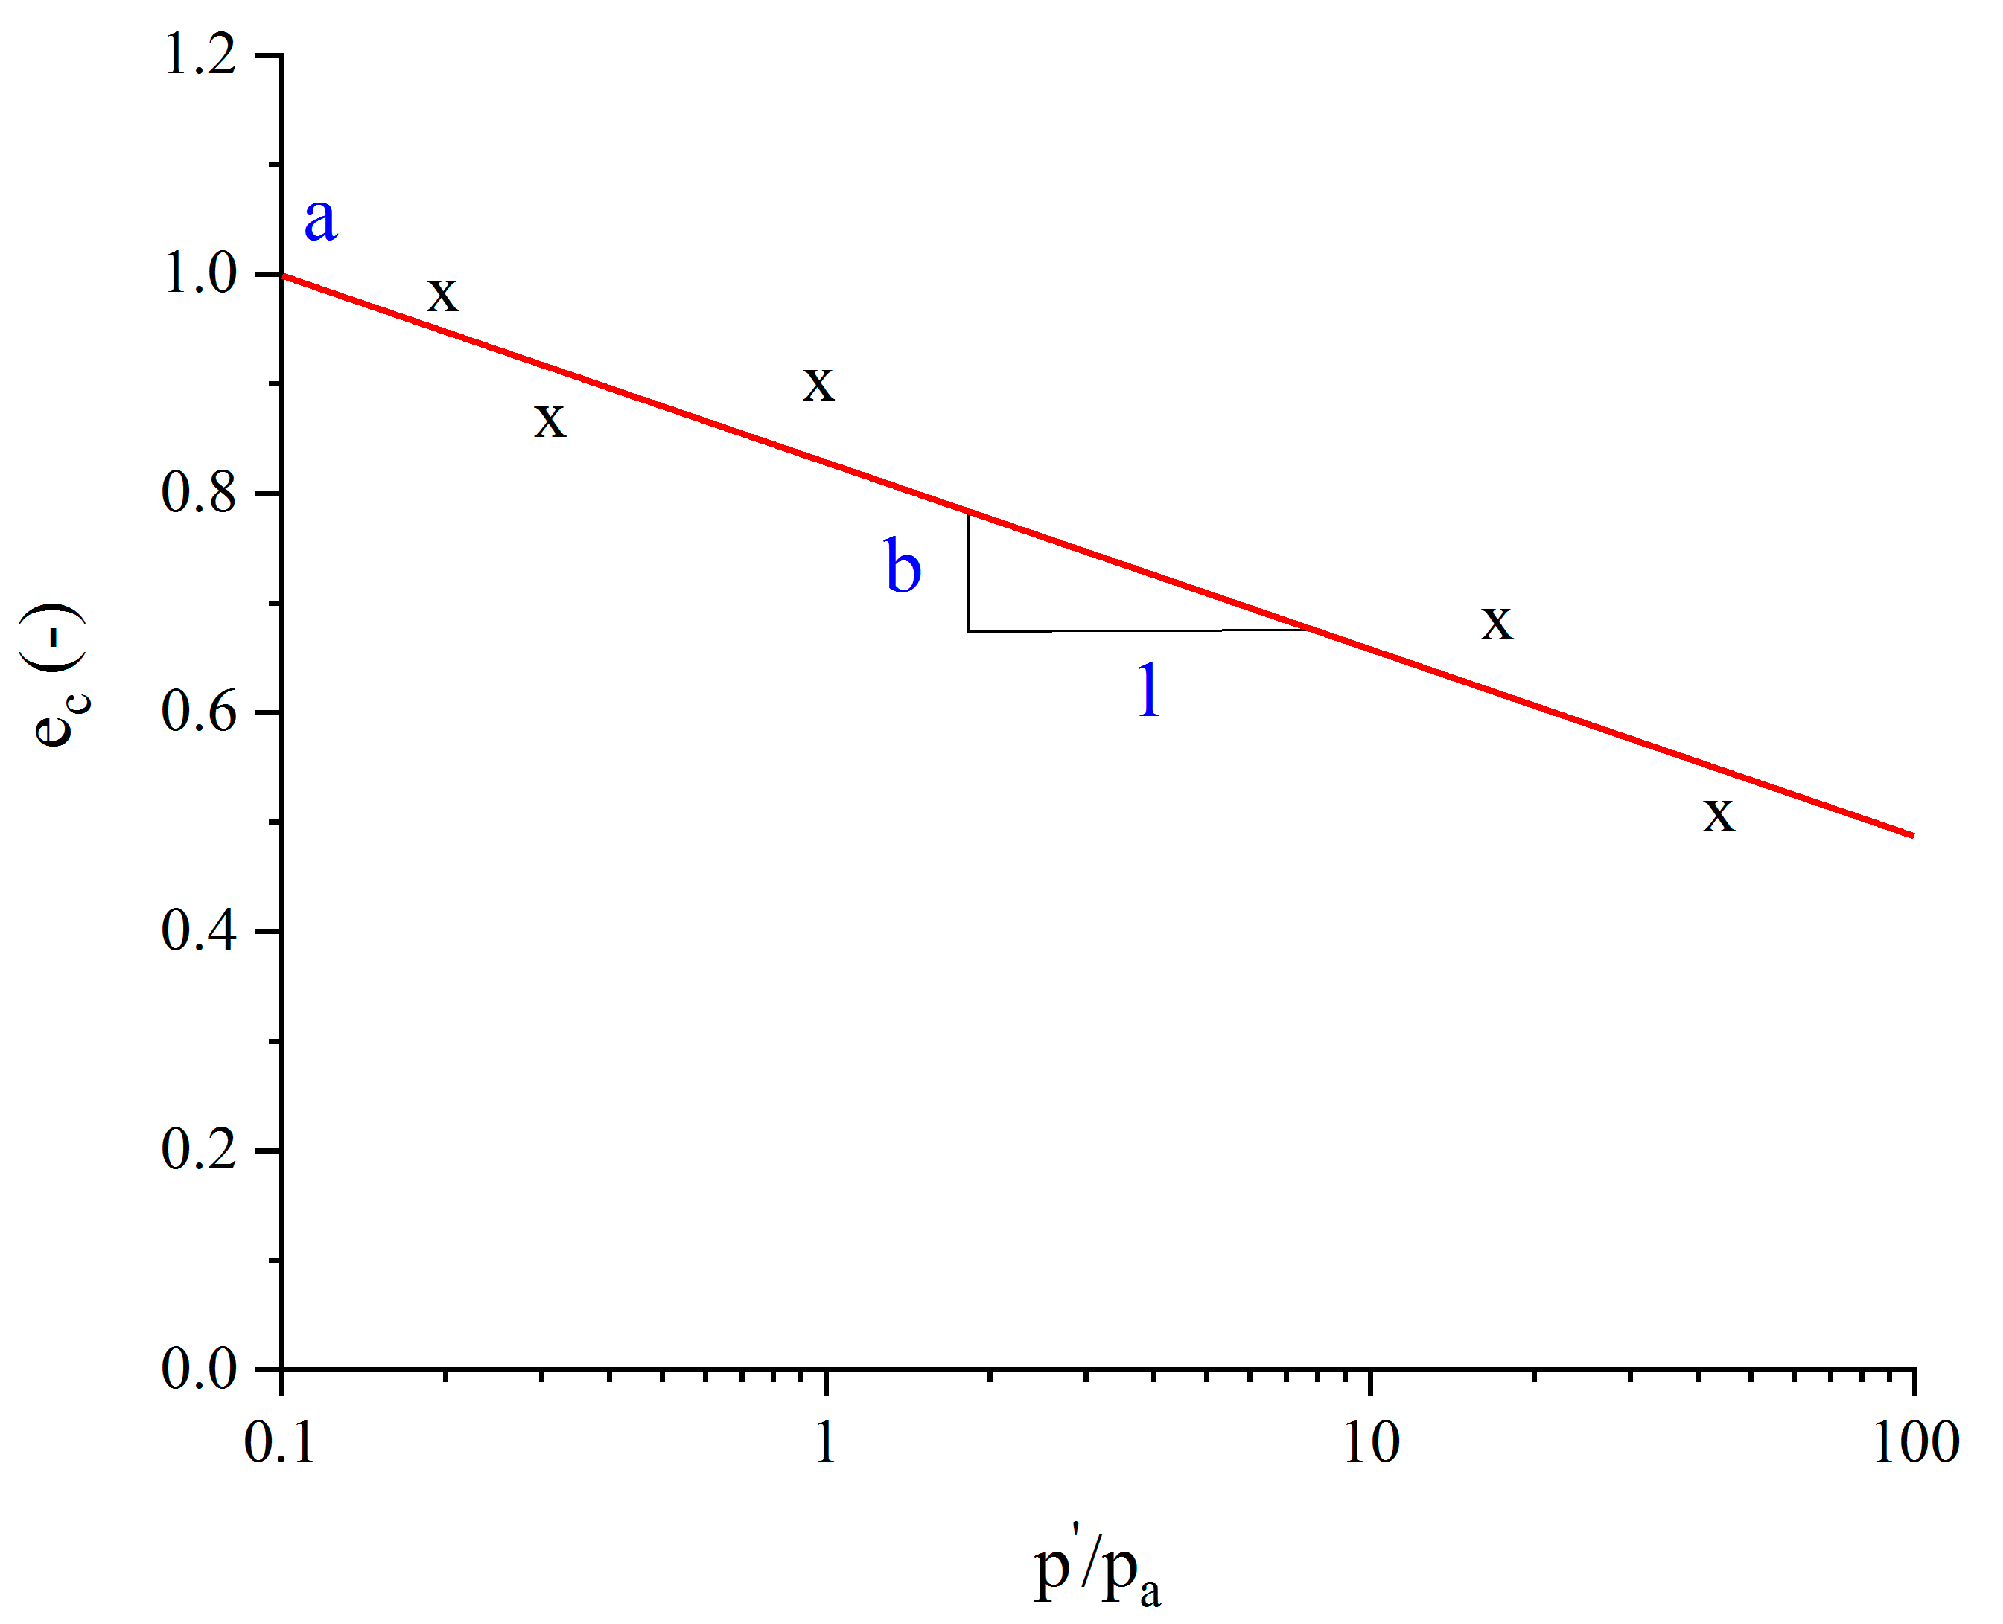
The recommended identification method of model constants and is shown in Figure 2 [9,13]. Several critical state points need to be plotted and fitted in the space to a straight line where is the interception value and is the slope of this line.
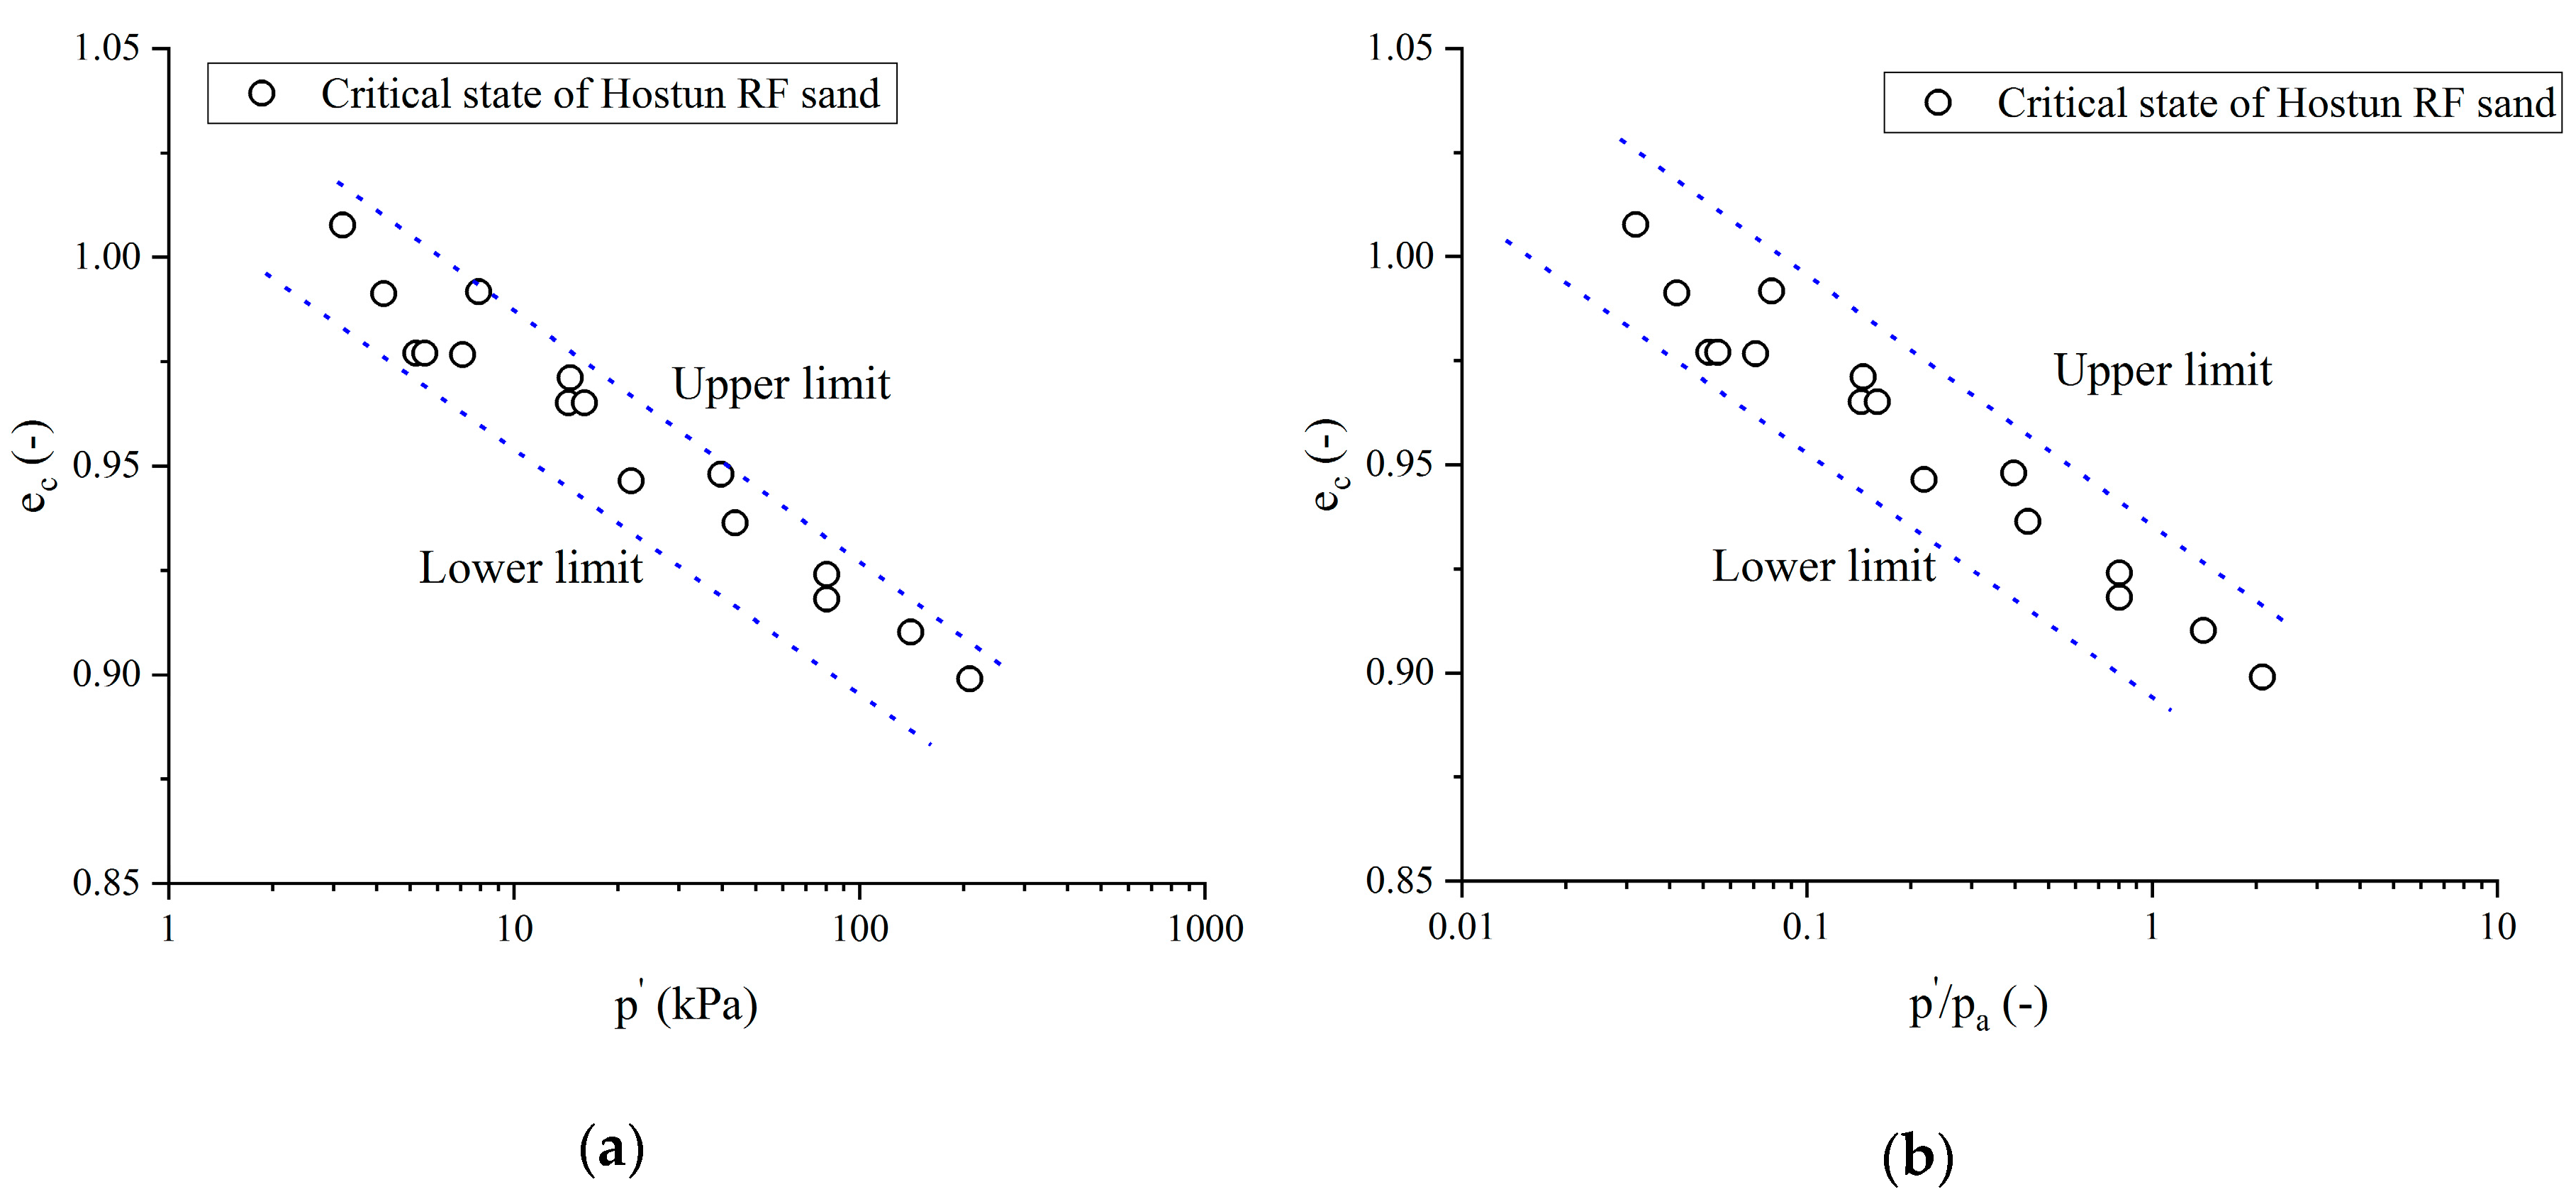
The critical state of Hostun RF sand from very loose () to loose () state is shown in Figure 3. It can be observed that the unification of final state could not be seriously achieved. The simplification of the linear fitting is only a rough hypothesis and the determination of the model parameter is in general sophisticated.
Thus, a parametric study of was carried out by simulating a specimen of density indices equal to 0.00 with different values of under an undrained triaxial condition. The material constants according to their functions in separate columns are given in Table 1. One should also note that all parameters listed in Table 1 were dimensionless.
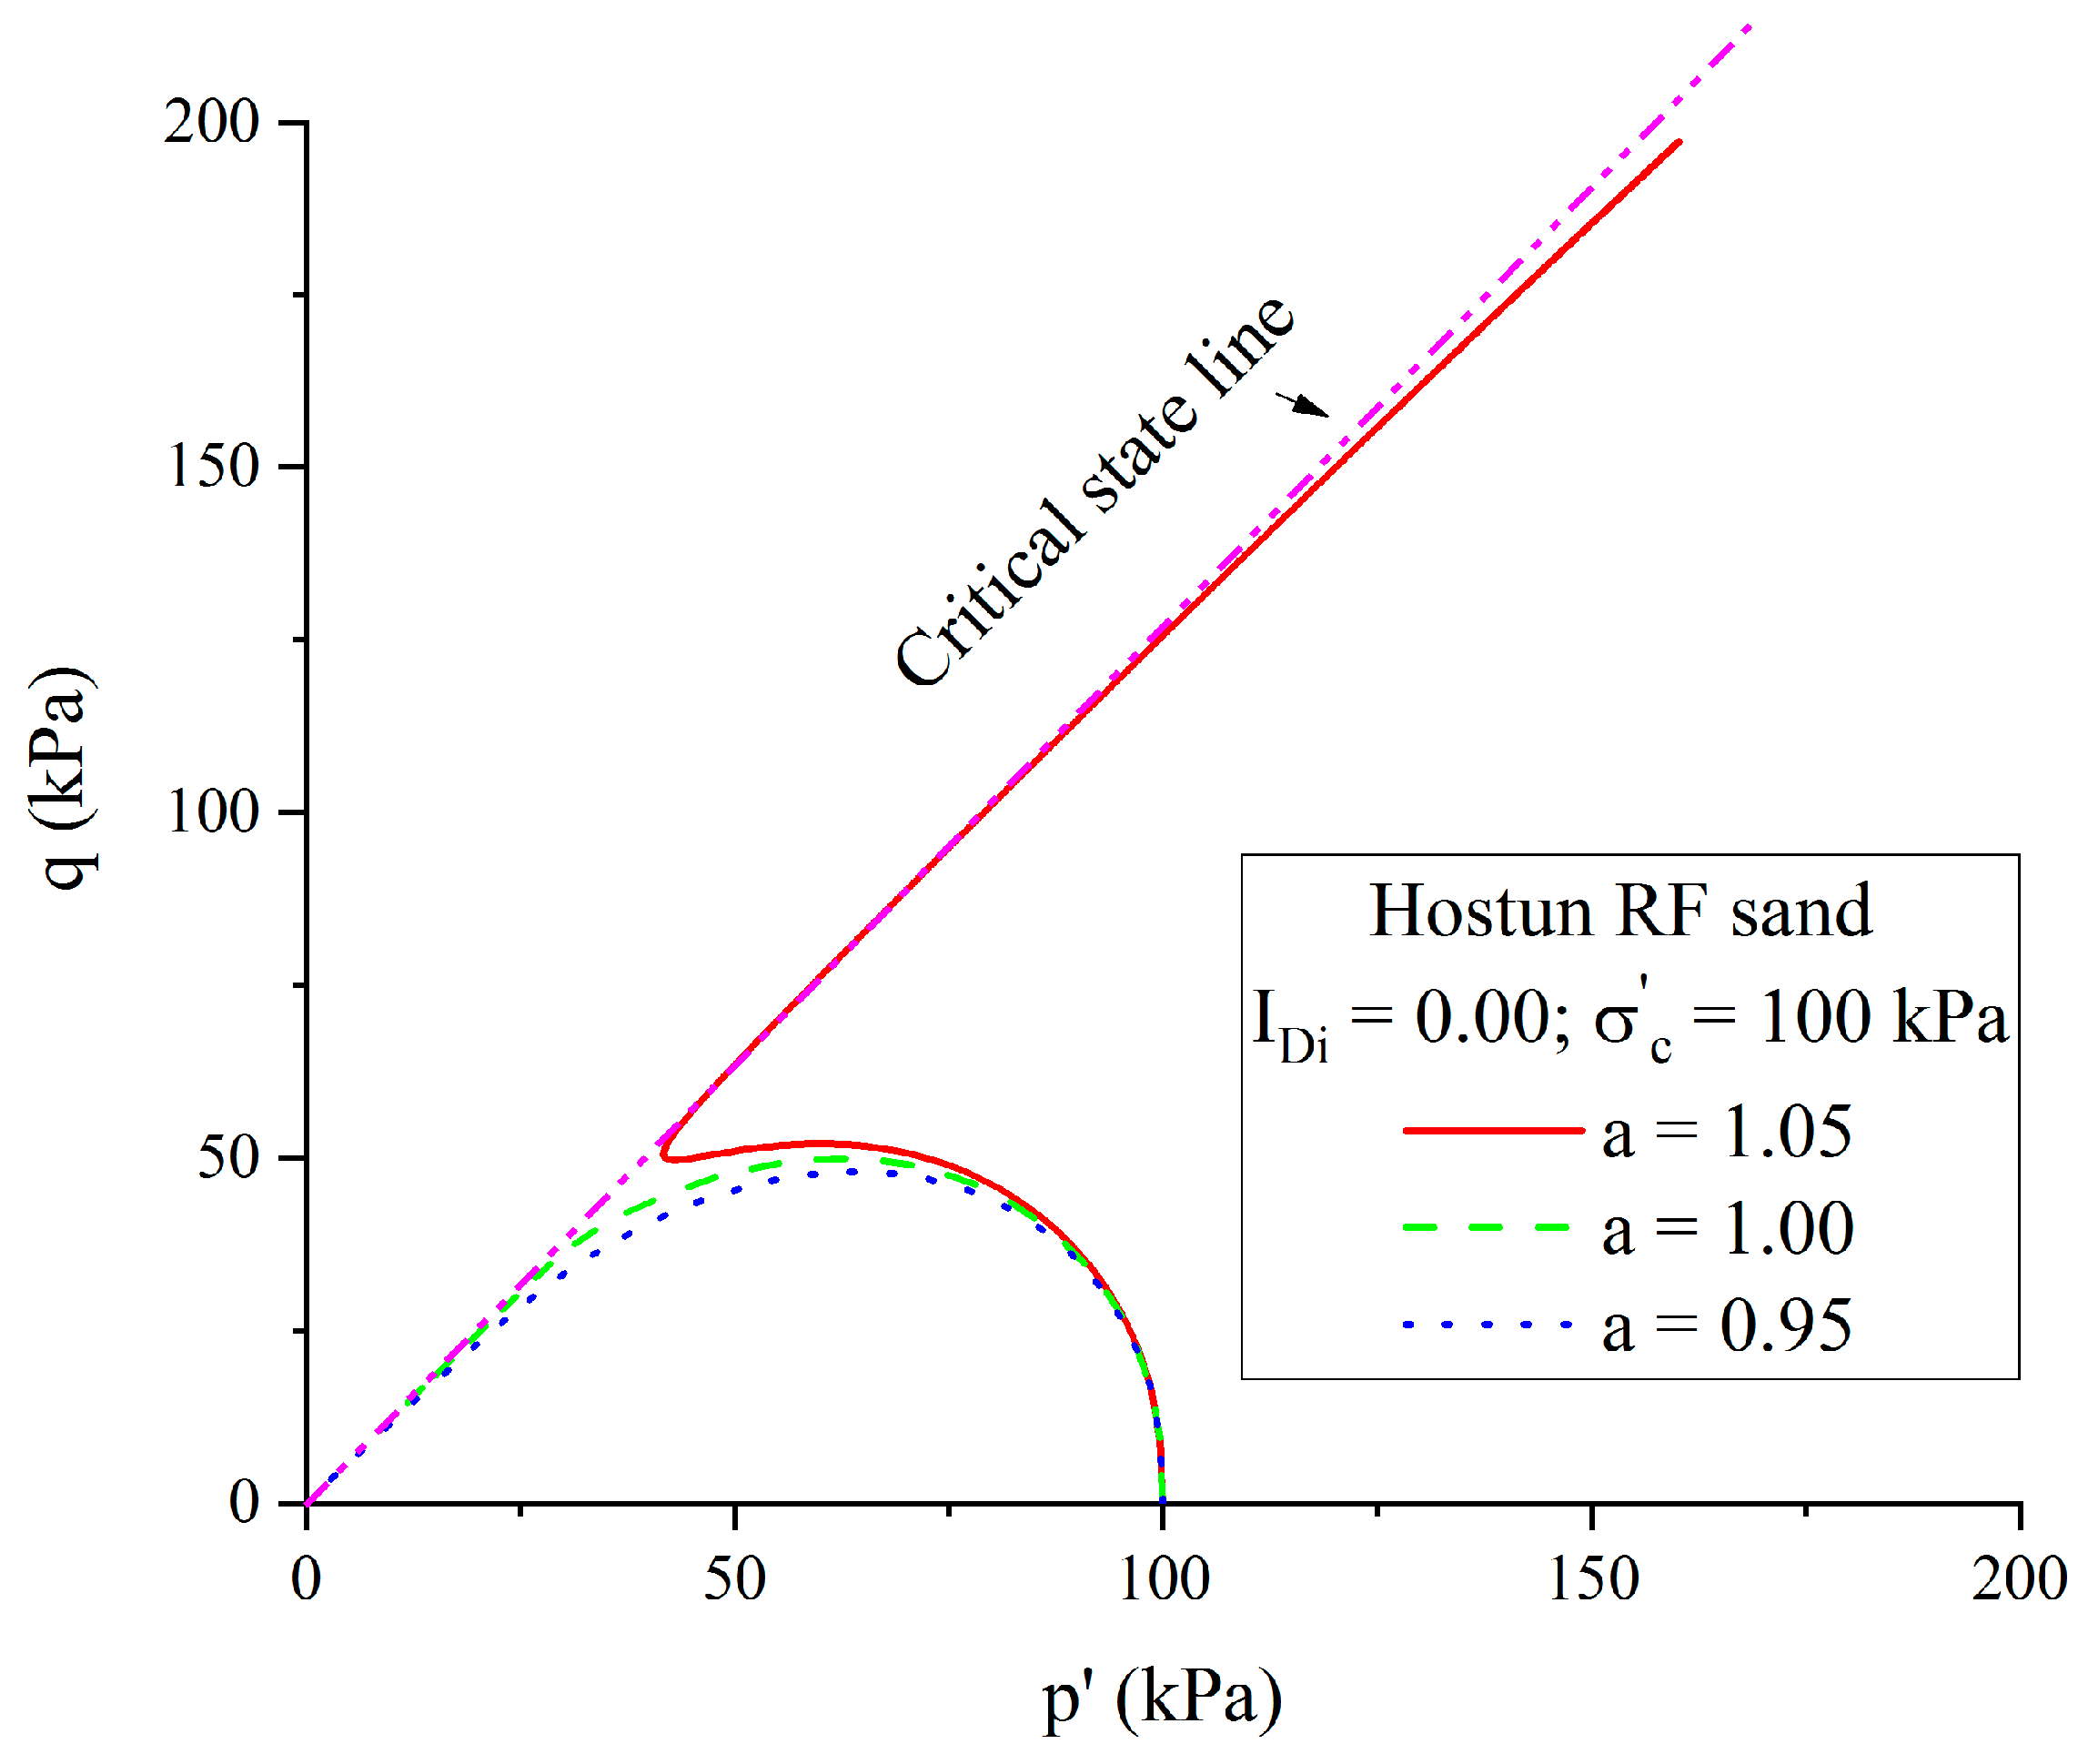
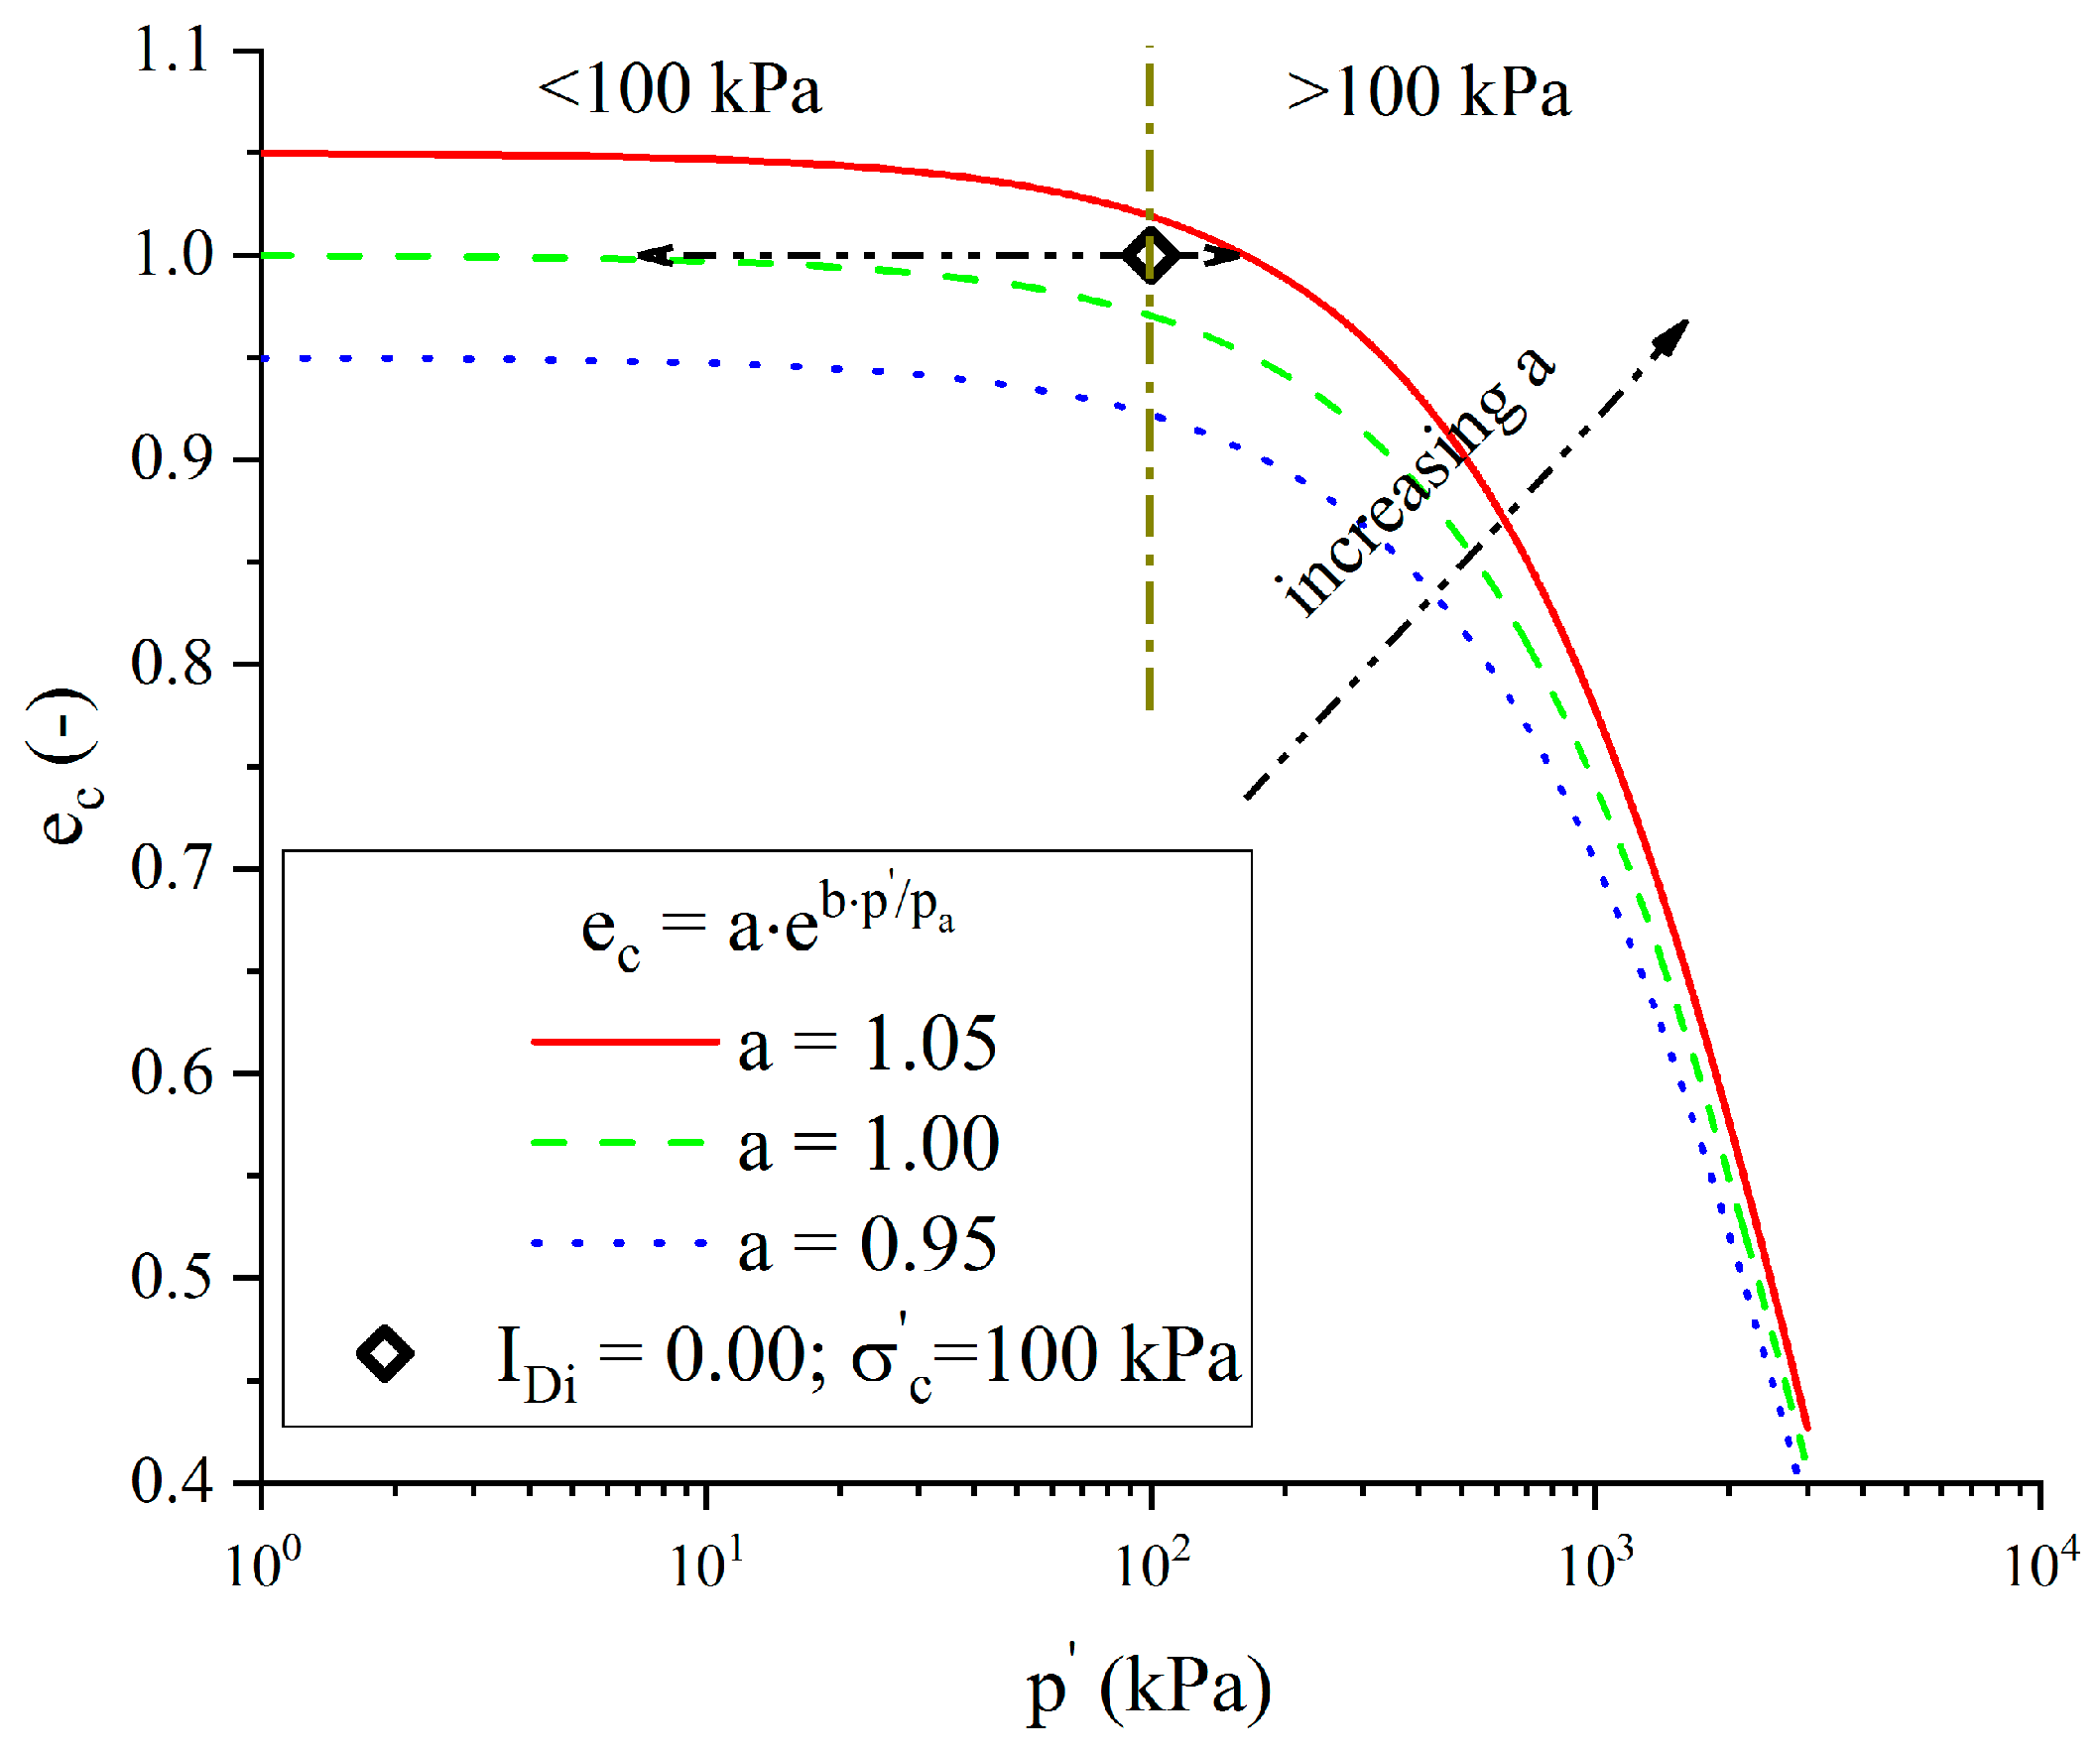
In Figure 4, it is clear that the drop of deviator stress and the static liquefaction phenomenon became increasingly important with the decrease in . Dilatant behaviour was observed for , whereas very contractive behaviour was observed for , which meant that the result in loose state depended, to a large extent, on the value of . The critical state line in terms of effective confining pressure is plotted in Figure 5 and the initial state of the simulated case is represented by a black rhombus point. For , the initial state was clearly below the critical state, which caused state parameter to be greater than 1 during all calculations. However, for the case of , the initial states were both over the critical state, resulting in the state parameter being lower than 1.
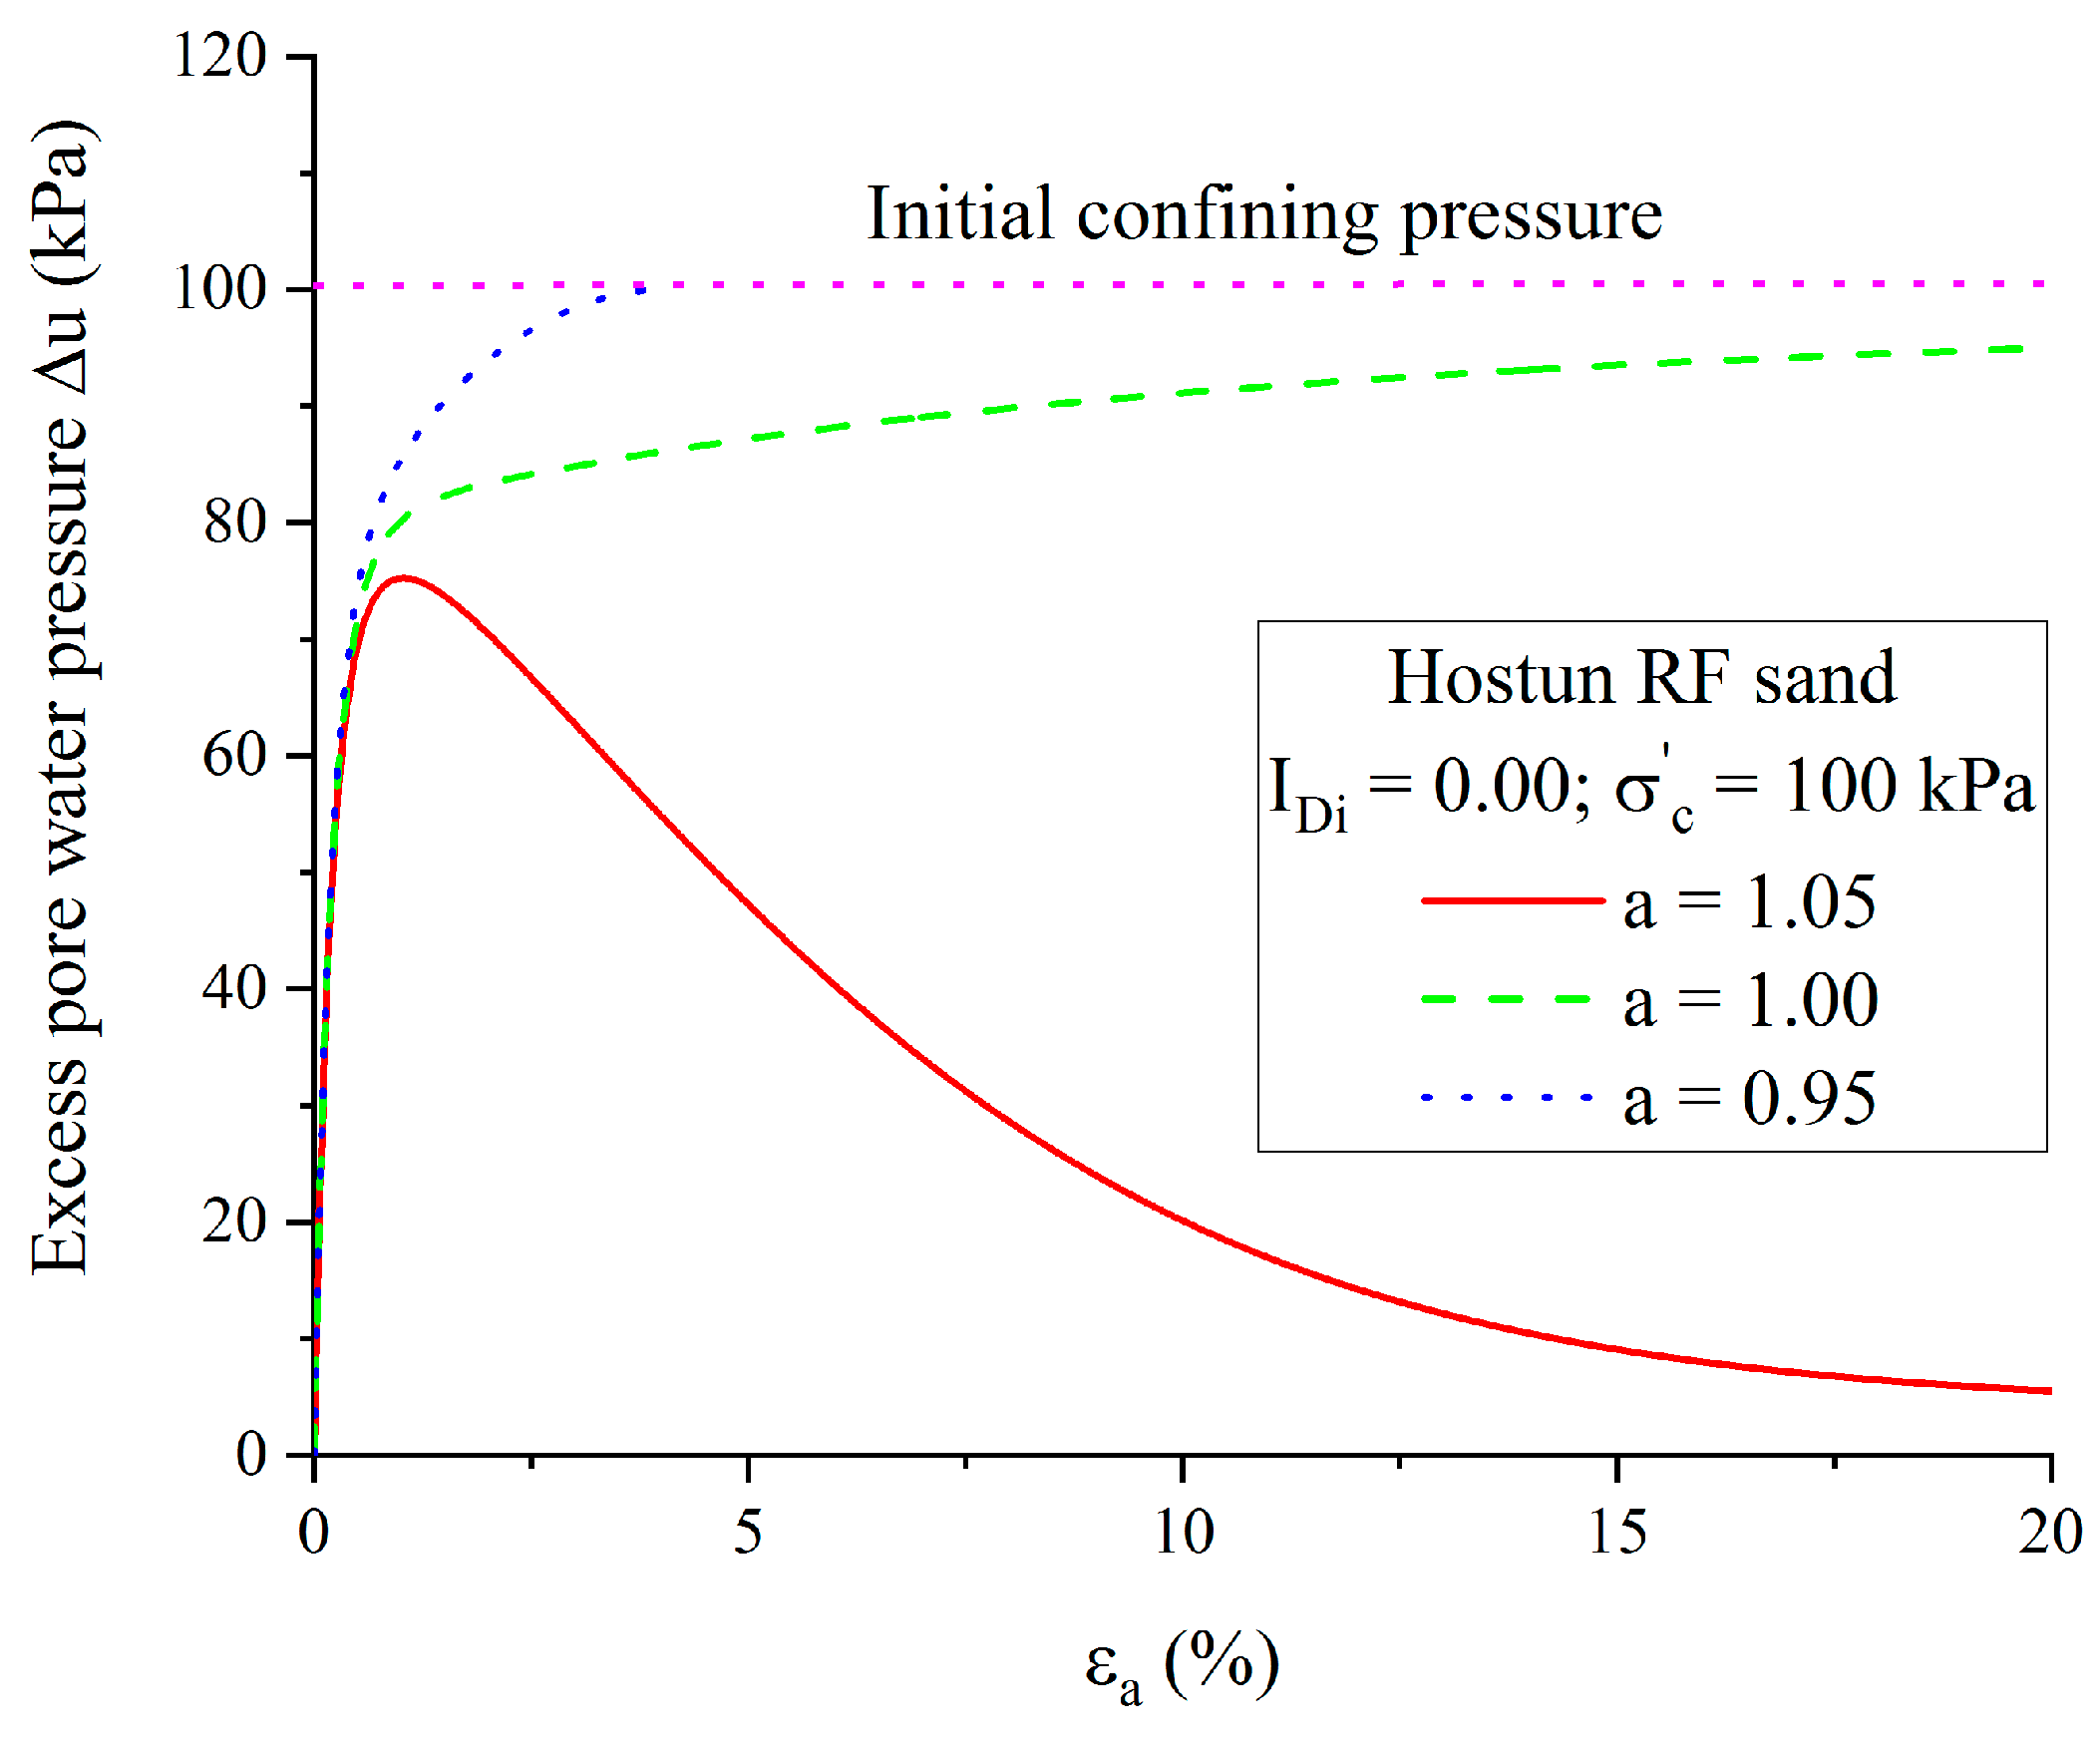
Therefore, a very contractive behaviour could be expected, which is consistent with the generation of excess pore water pressure, as shown in Figure 6. All the above findings suggest that the value of is the fundamental point to successfully simulate the liquefaction behaviour of very loose sand.
According to Figure 5, the form of critical state defined by Equation (1) can be separated into two parts. Firstly, it was almost constant before 100 kPa. Then, this line decreased significantly with the increase of . The interception value can be obtained by the following equation:
Within the range of 100 kPa, increased slowly with the decrease in and achieved its ultima value , while . Equation (15) gives the physical sense of the model constant , which represents the possible maximum void ratio of sand without any confining pressure. In a study associated with liquefaction, it is also reasonable to consider the maximum void ratio as a comparison basis for evaluating the contractive behaviour. Thus, the substitution of model constant by a sand property is recommended by the authors.
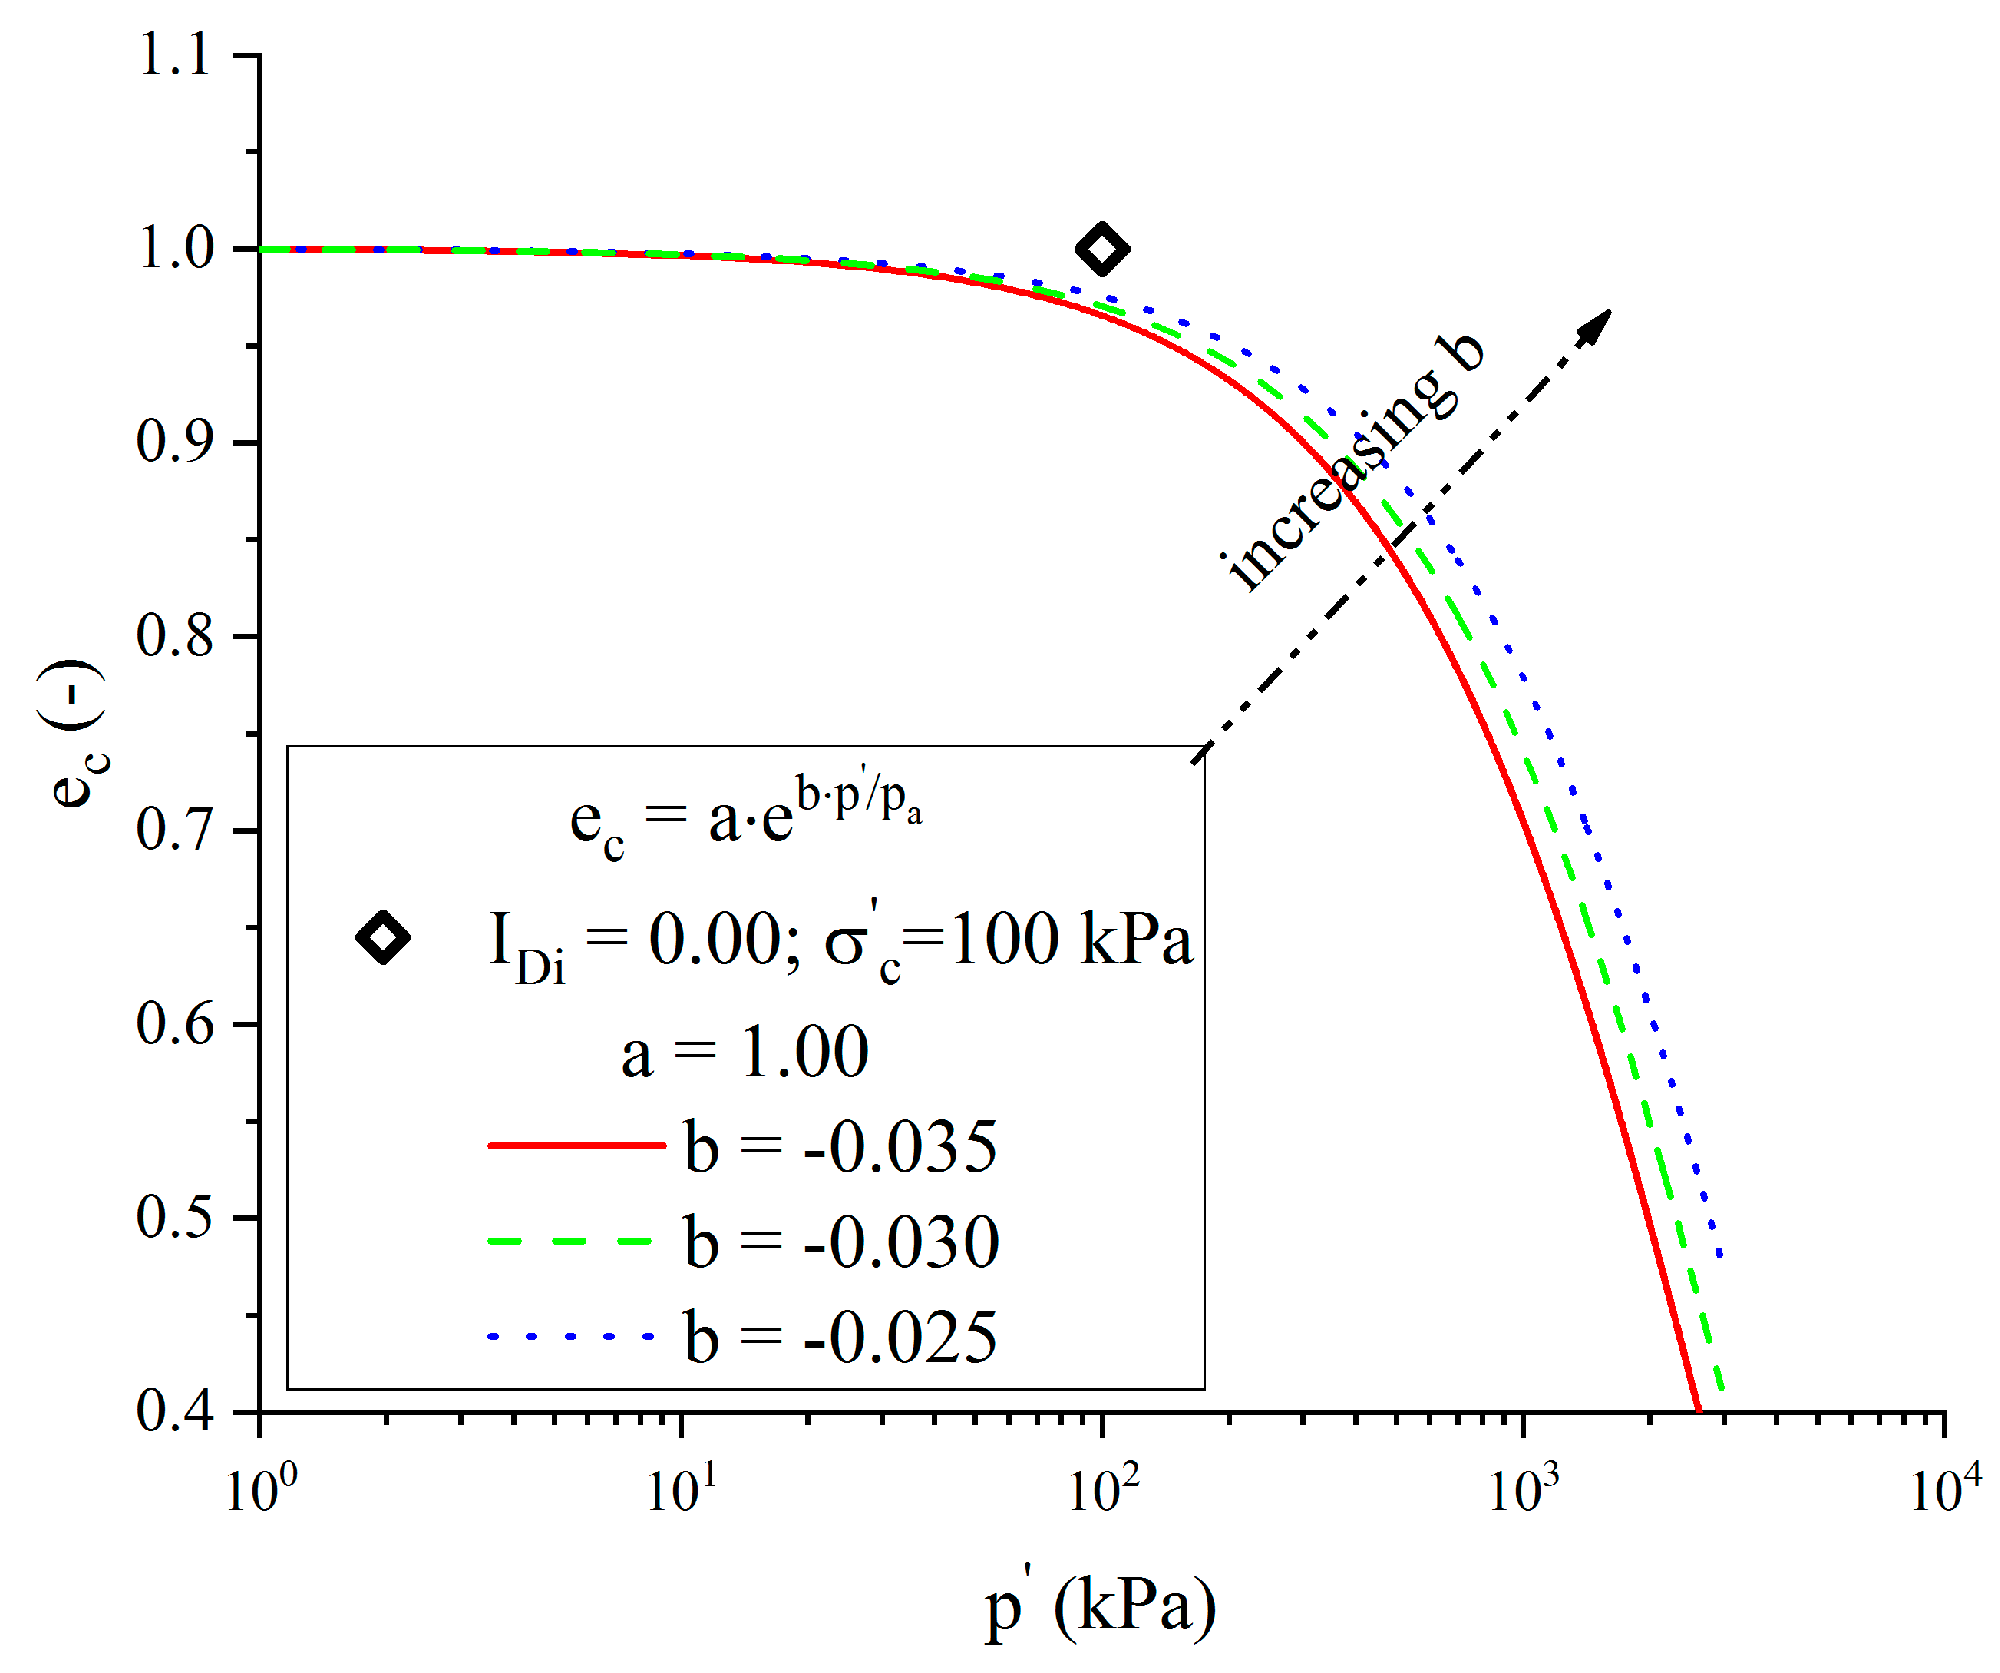
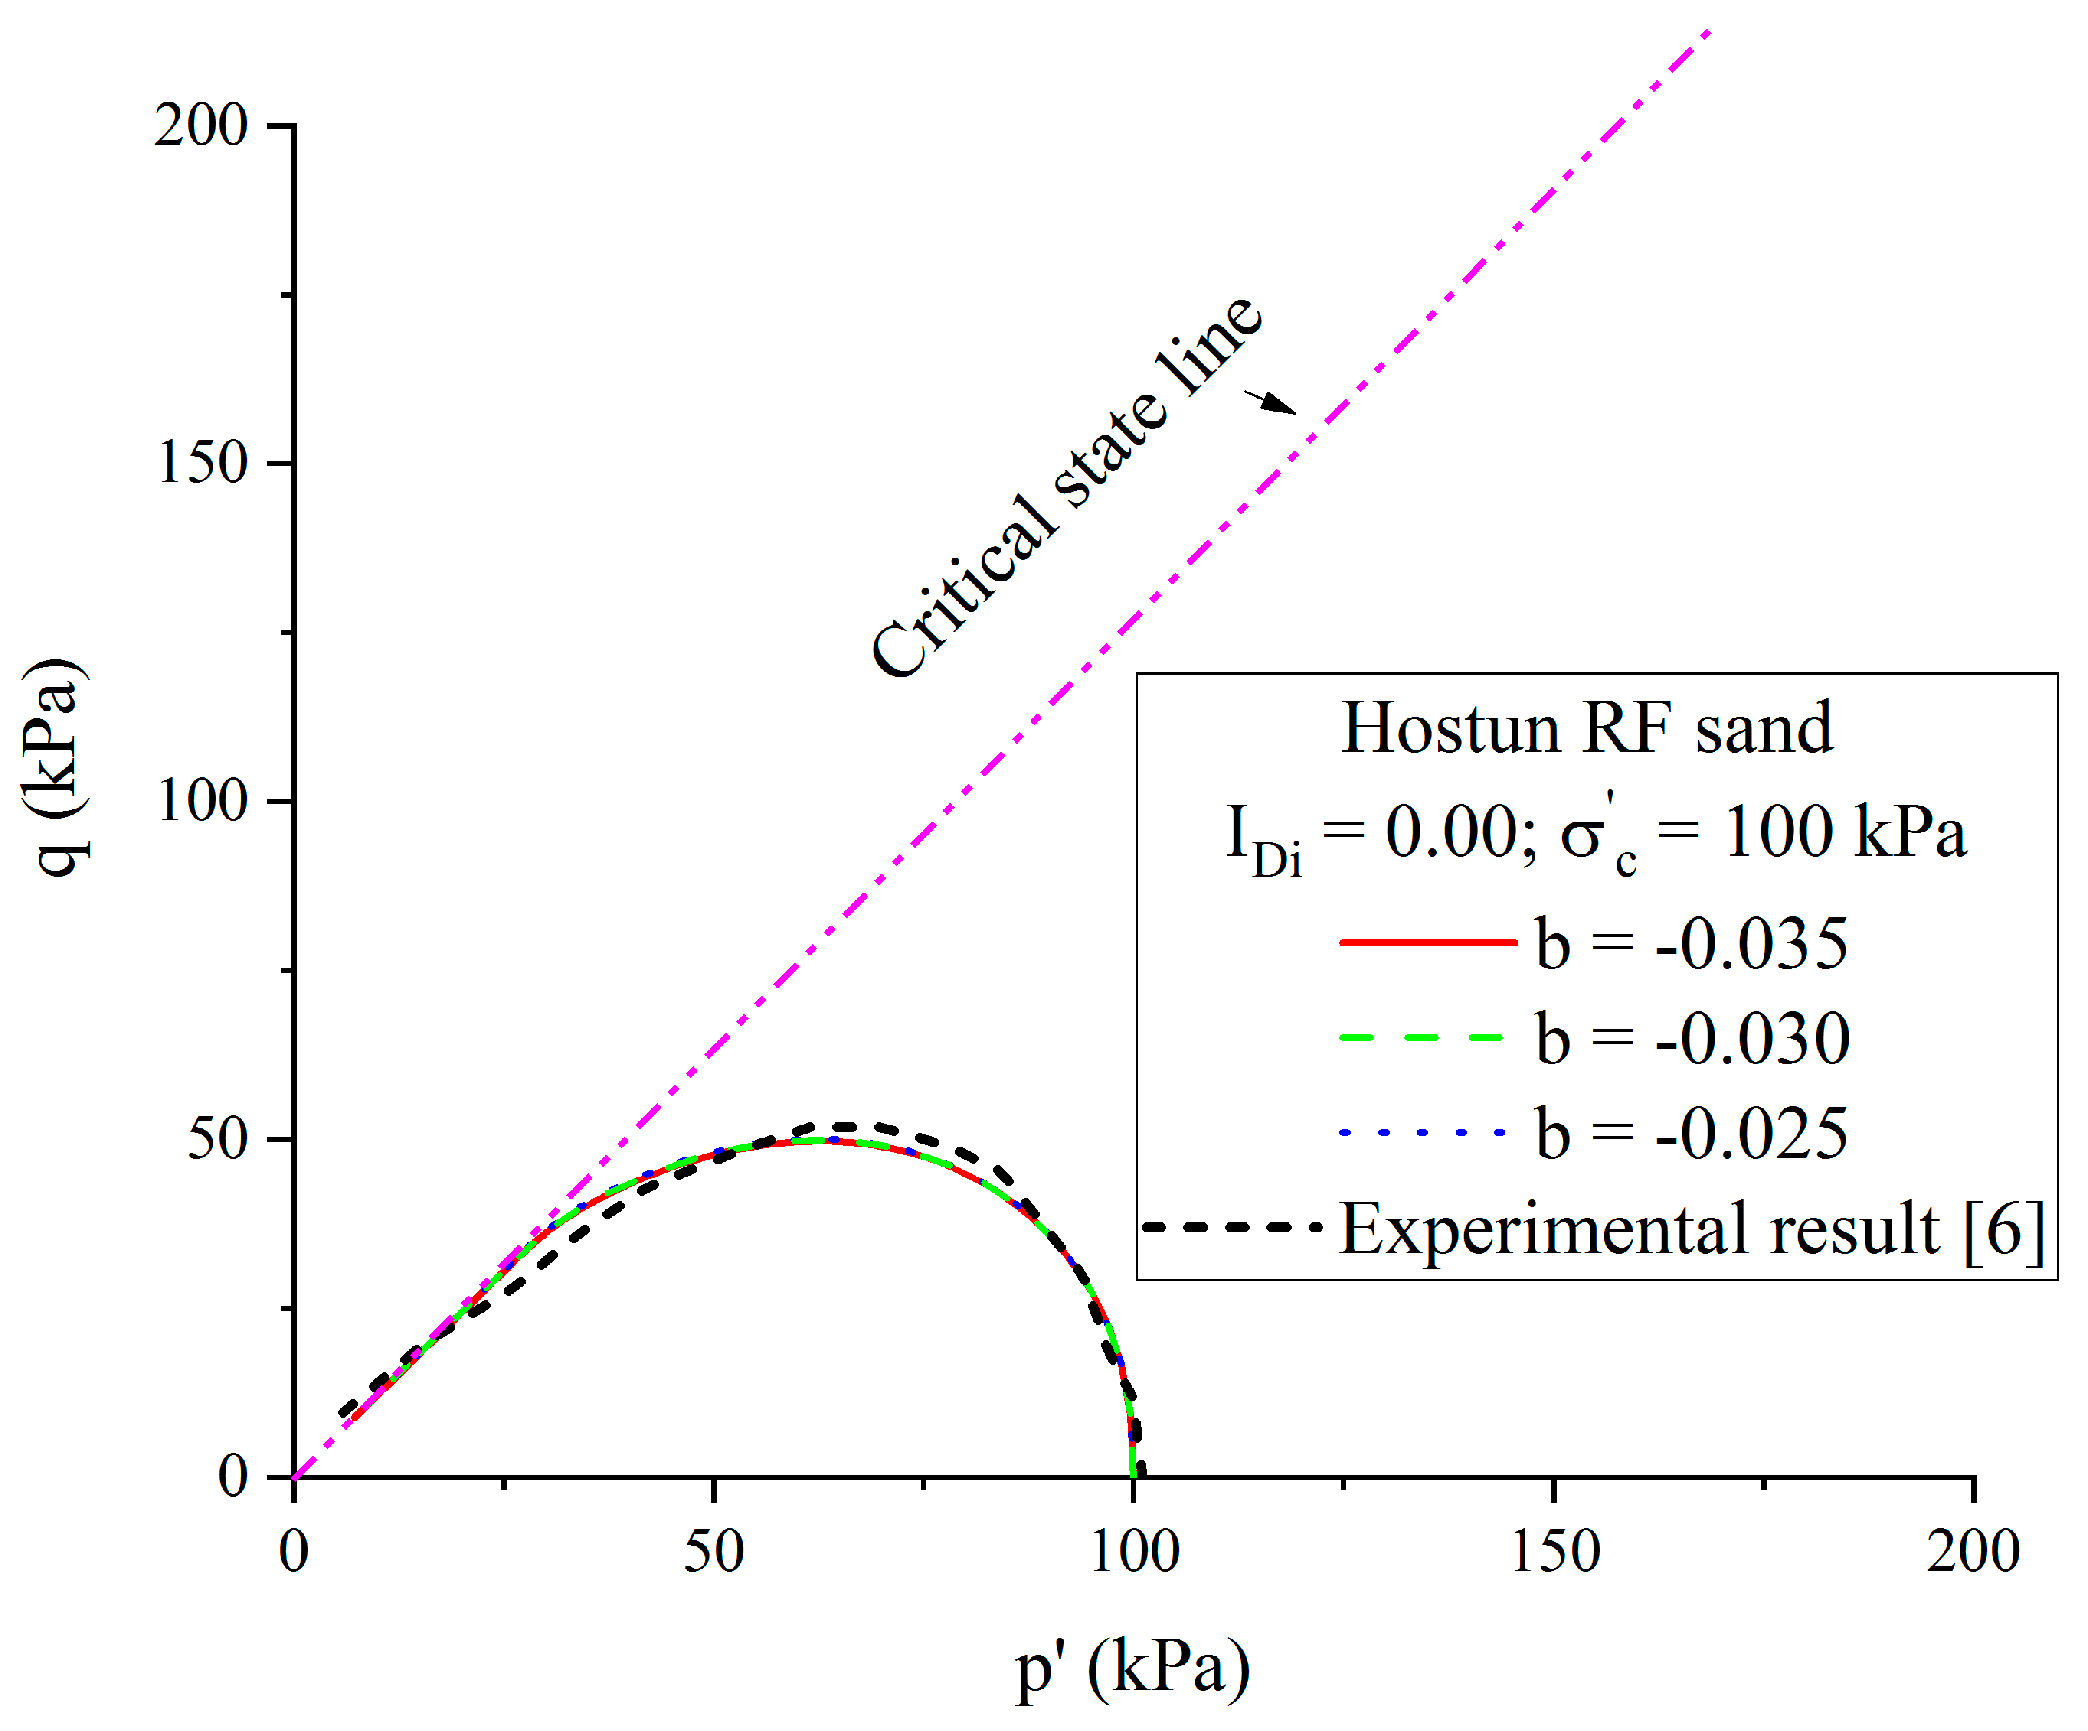
The variation of critical state in terms of model constant is plotted in Figure 7. In the range of effective confining pressure greater than 100 kPa, the form of critical state was mainly controlled by model parameter and the critical state line decreased sharply by reducing the value of . However, it seemed that the variation in did not remarkably affect the state parameter for very low density index. Thus, the influence of model constant on liquefaction behaviour was then studied. By altering from −0.035 to −0.025, the effective stress paths were almost coincident (Figure 8), except for minor differences at high-strain level.
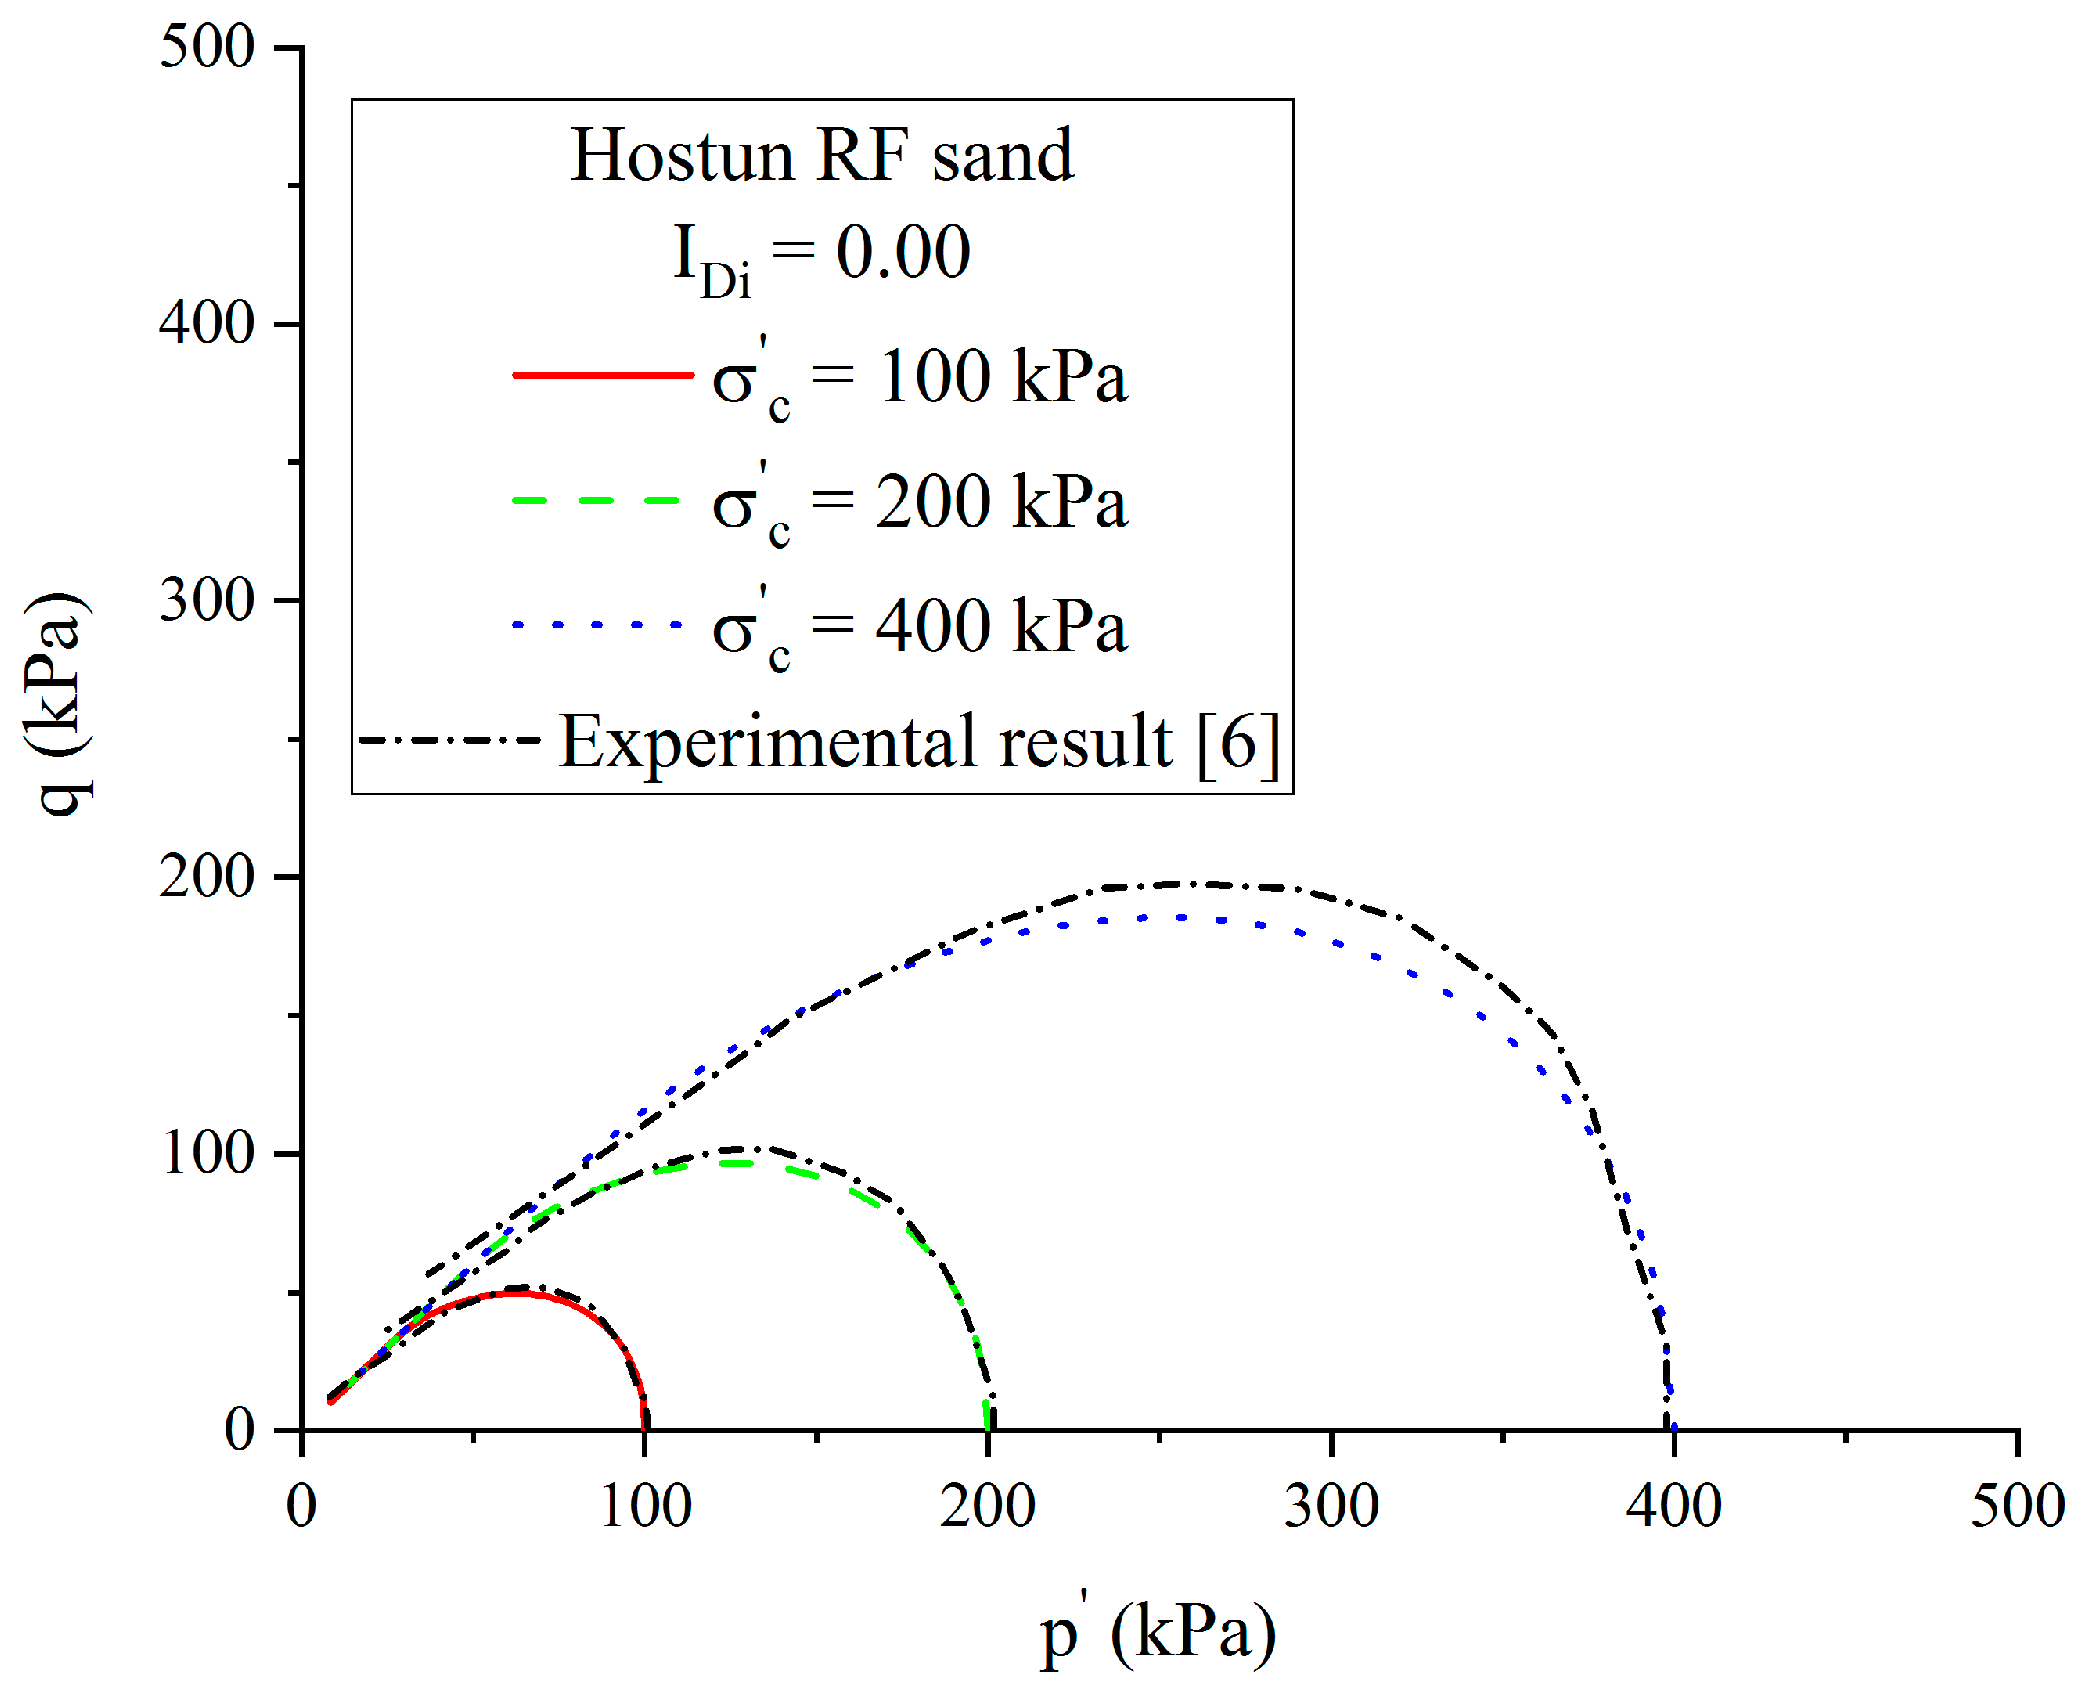
For ascertaining the predominant effect of the model constant , numerical simulations under confining pressures of 200 and 400 kPa were performed by considering . It can be seen that there was a good agreement (Figure 9) between the experimental and numerical results. The model performance on liquefaction behaviour in very loose state was re-confirmed.
3.2. Dilatant Behaviour in Dense State
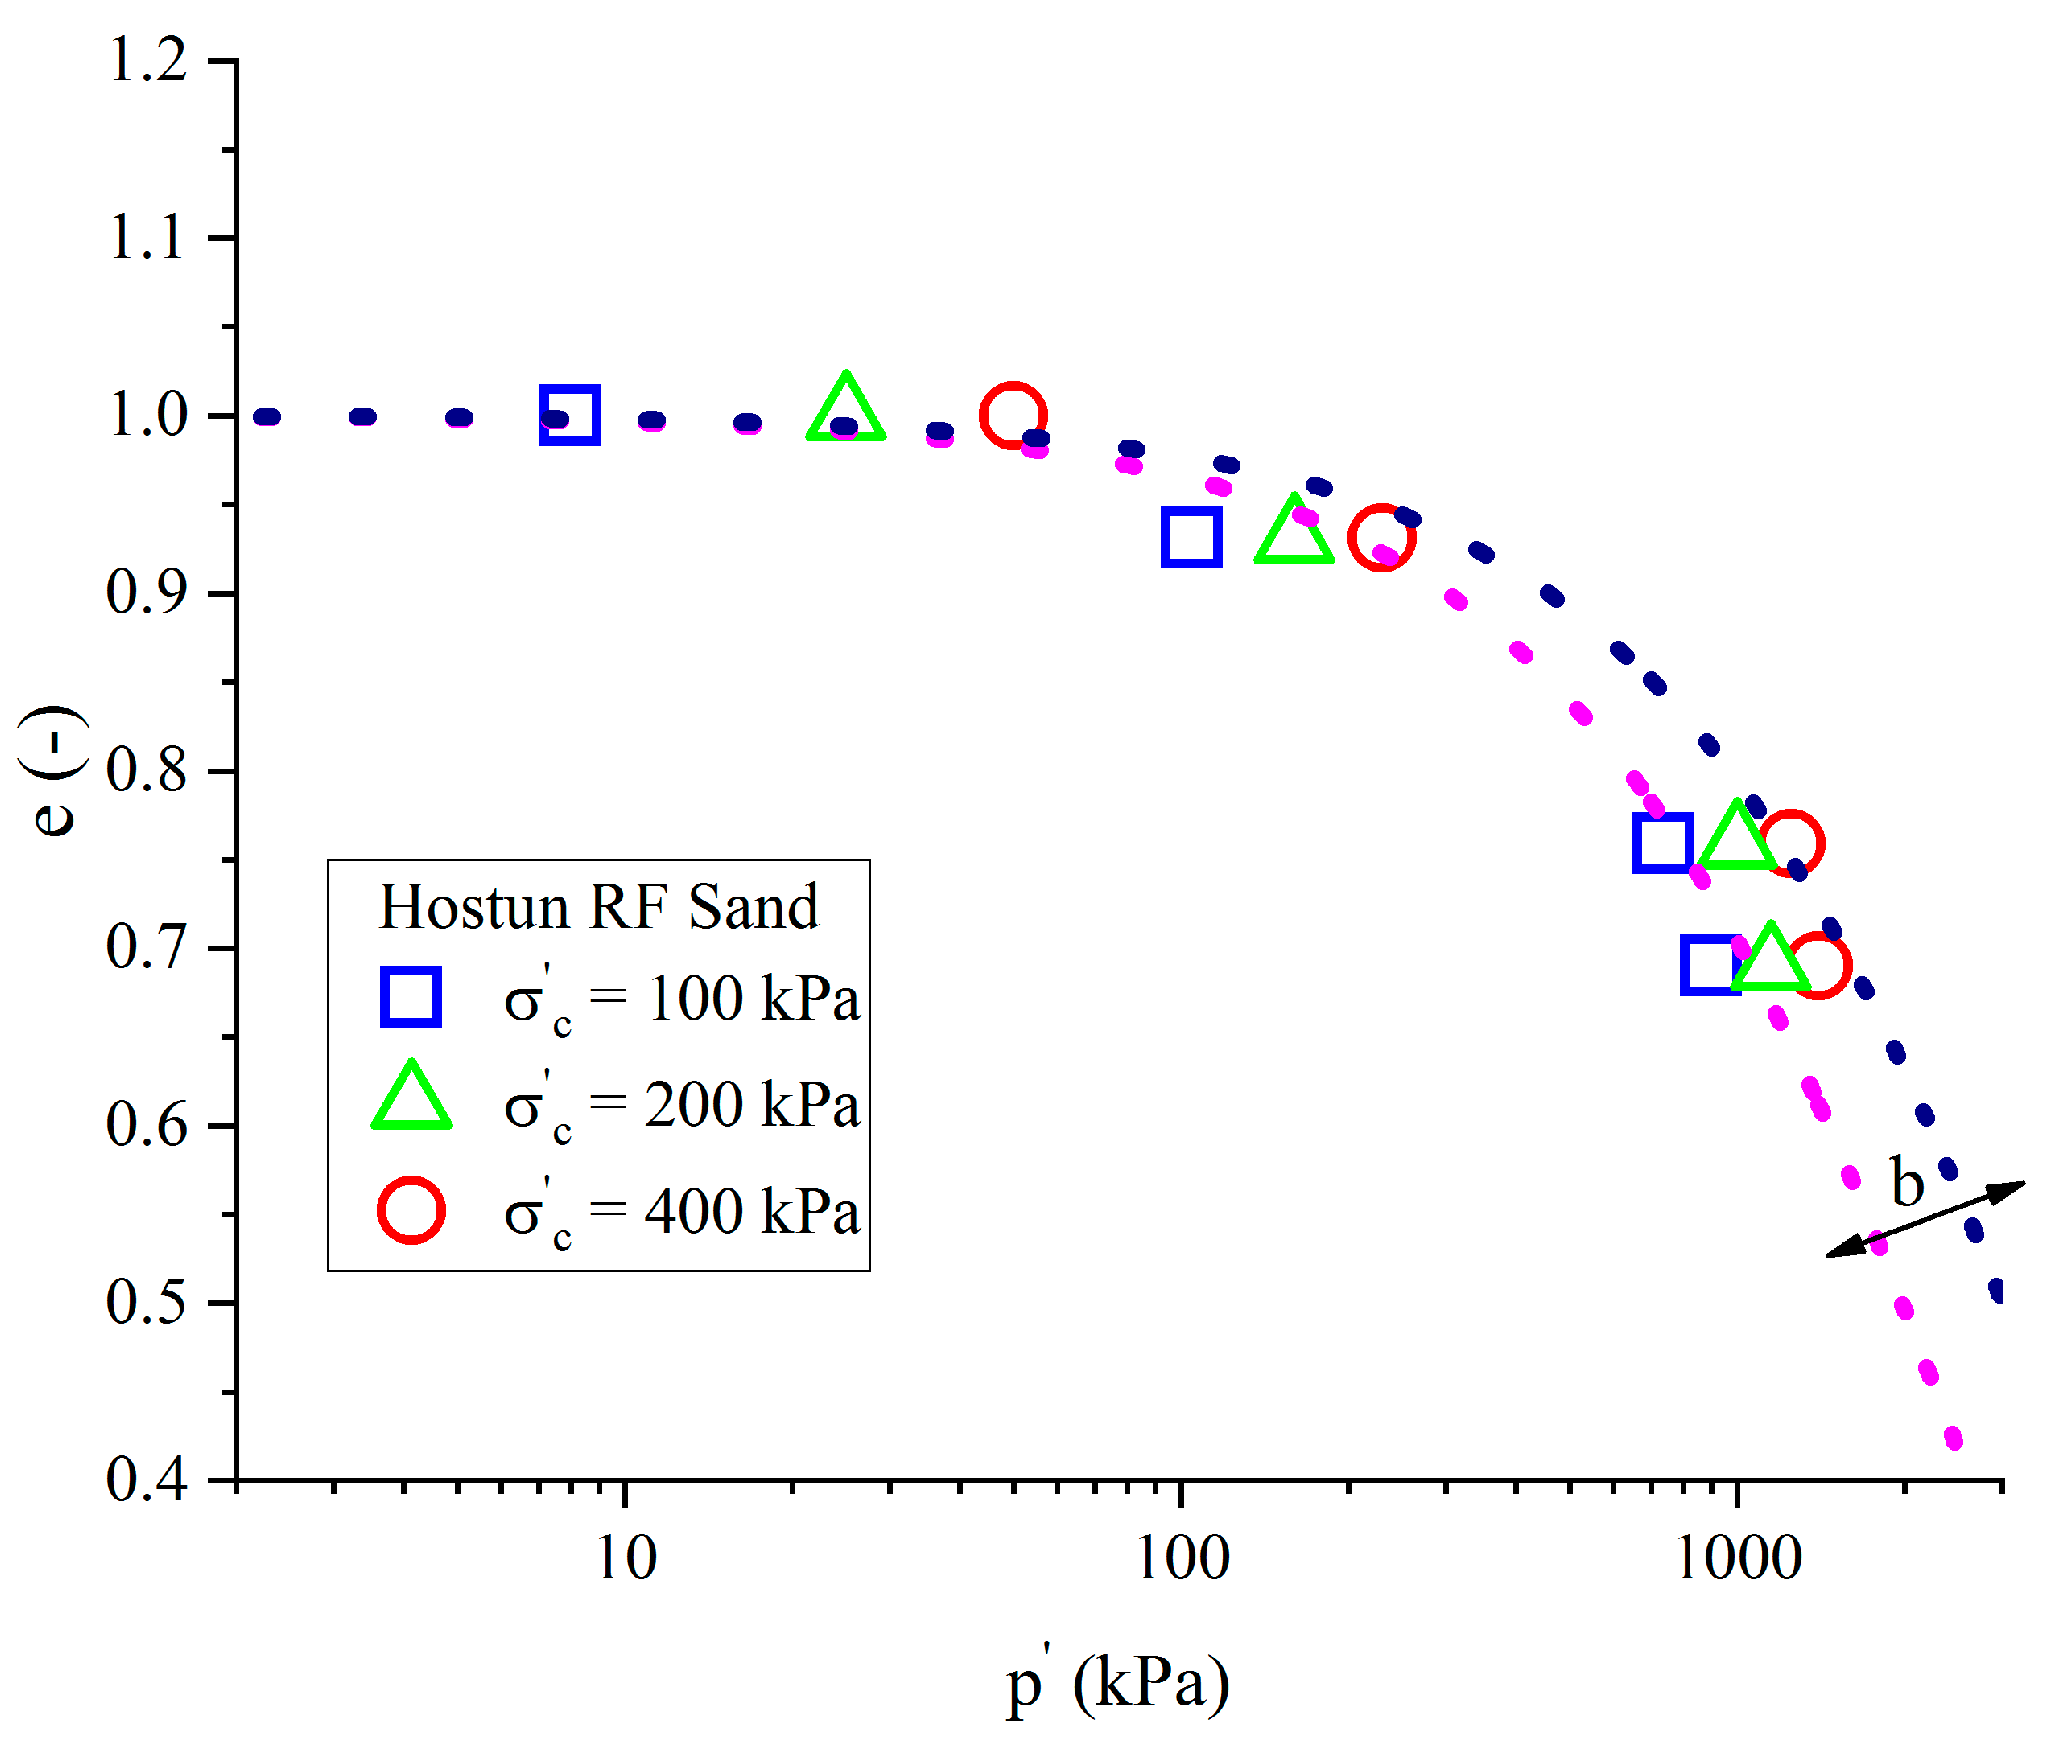
As mentioned earlier, the unification of critical state under various confining pressures is still under discussion. According to Figure 10, it appears that the critical mean effective stress increased with the increase in initial confining pressure for all density indexes.
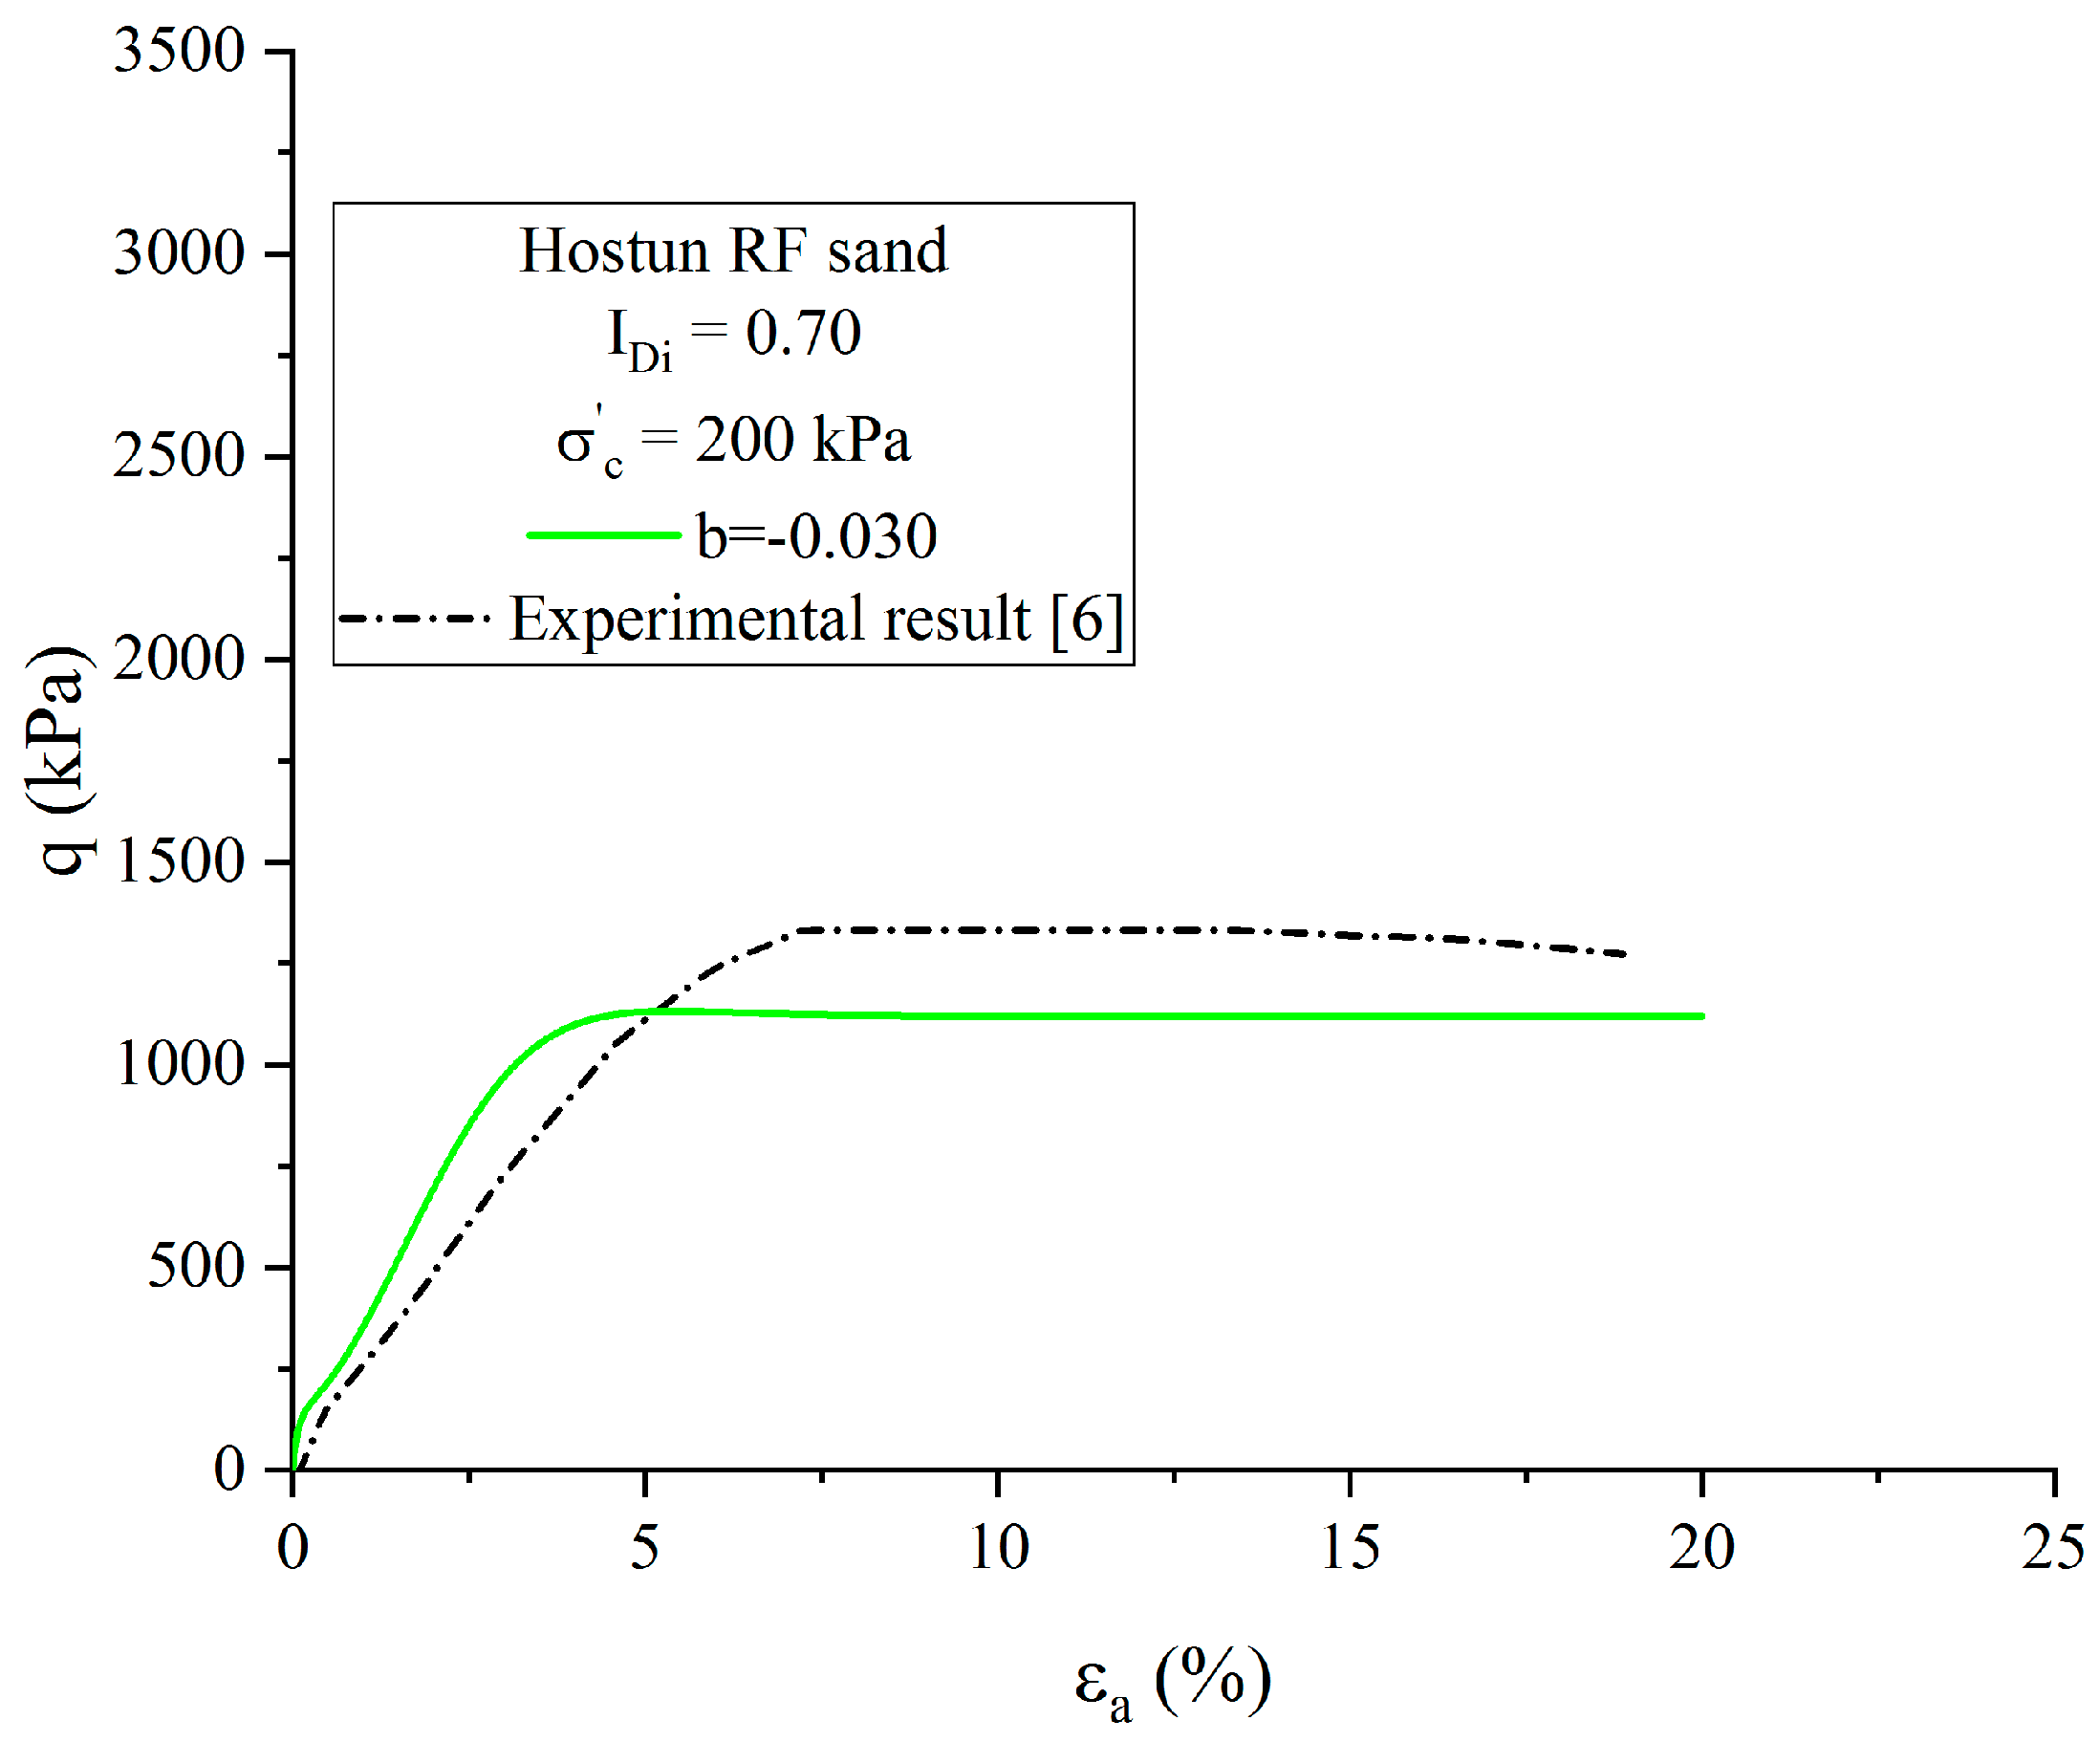
It was analysed in the last section that the performance of numerical results in loose and very loose states were insensitive to variation in model parameter due to the fact that their initial density indexes were almost located in the first part of proposed critical state line, which was mainly determined by model constant . However, for dense specimens whose initial states fell totally within the second part of the proposed critical line, the determination of model constant played a very important role instead of the model constant . A case of density index of 0.70 under confining pressure equal to 200 kPa was investigated by keeping model parameter constant. The stress–strain curve is shown in Figure 11, and it is clear that the result is not ideal because the state parameter was over-estimated.
Therefore, it seems better to suppose that model parameter is a function of initial confining pressure instead of a model constant, where is determined by original model parameter identification method [9,13]. For a well-studied sand, the variable model parameter can be directly determined by fitting the critical state line for different confining pressures. For a sand less-investigated, the authors recommend the following equation:
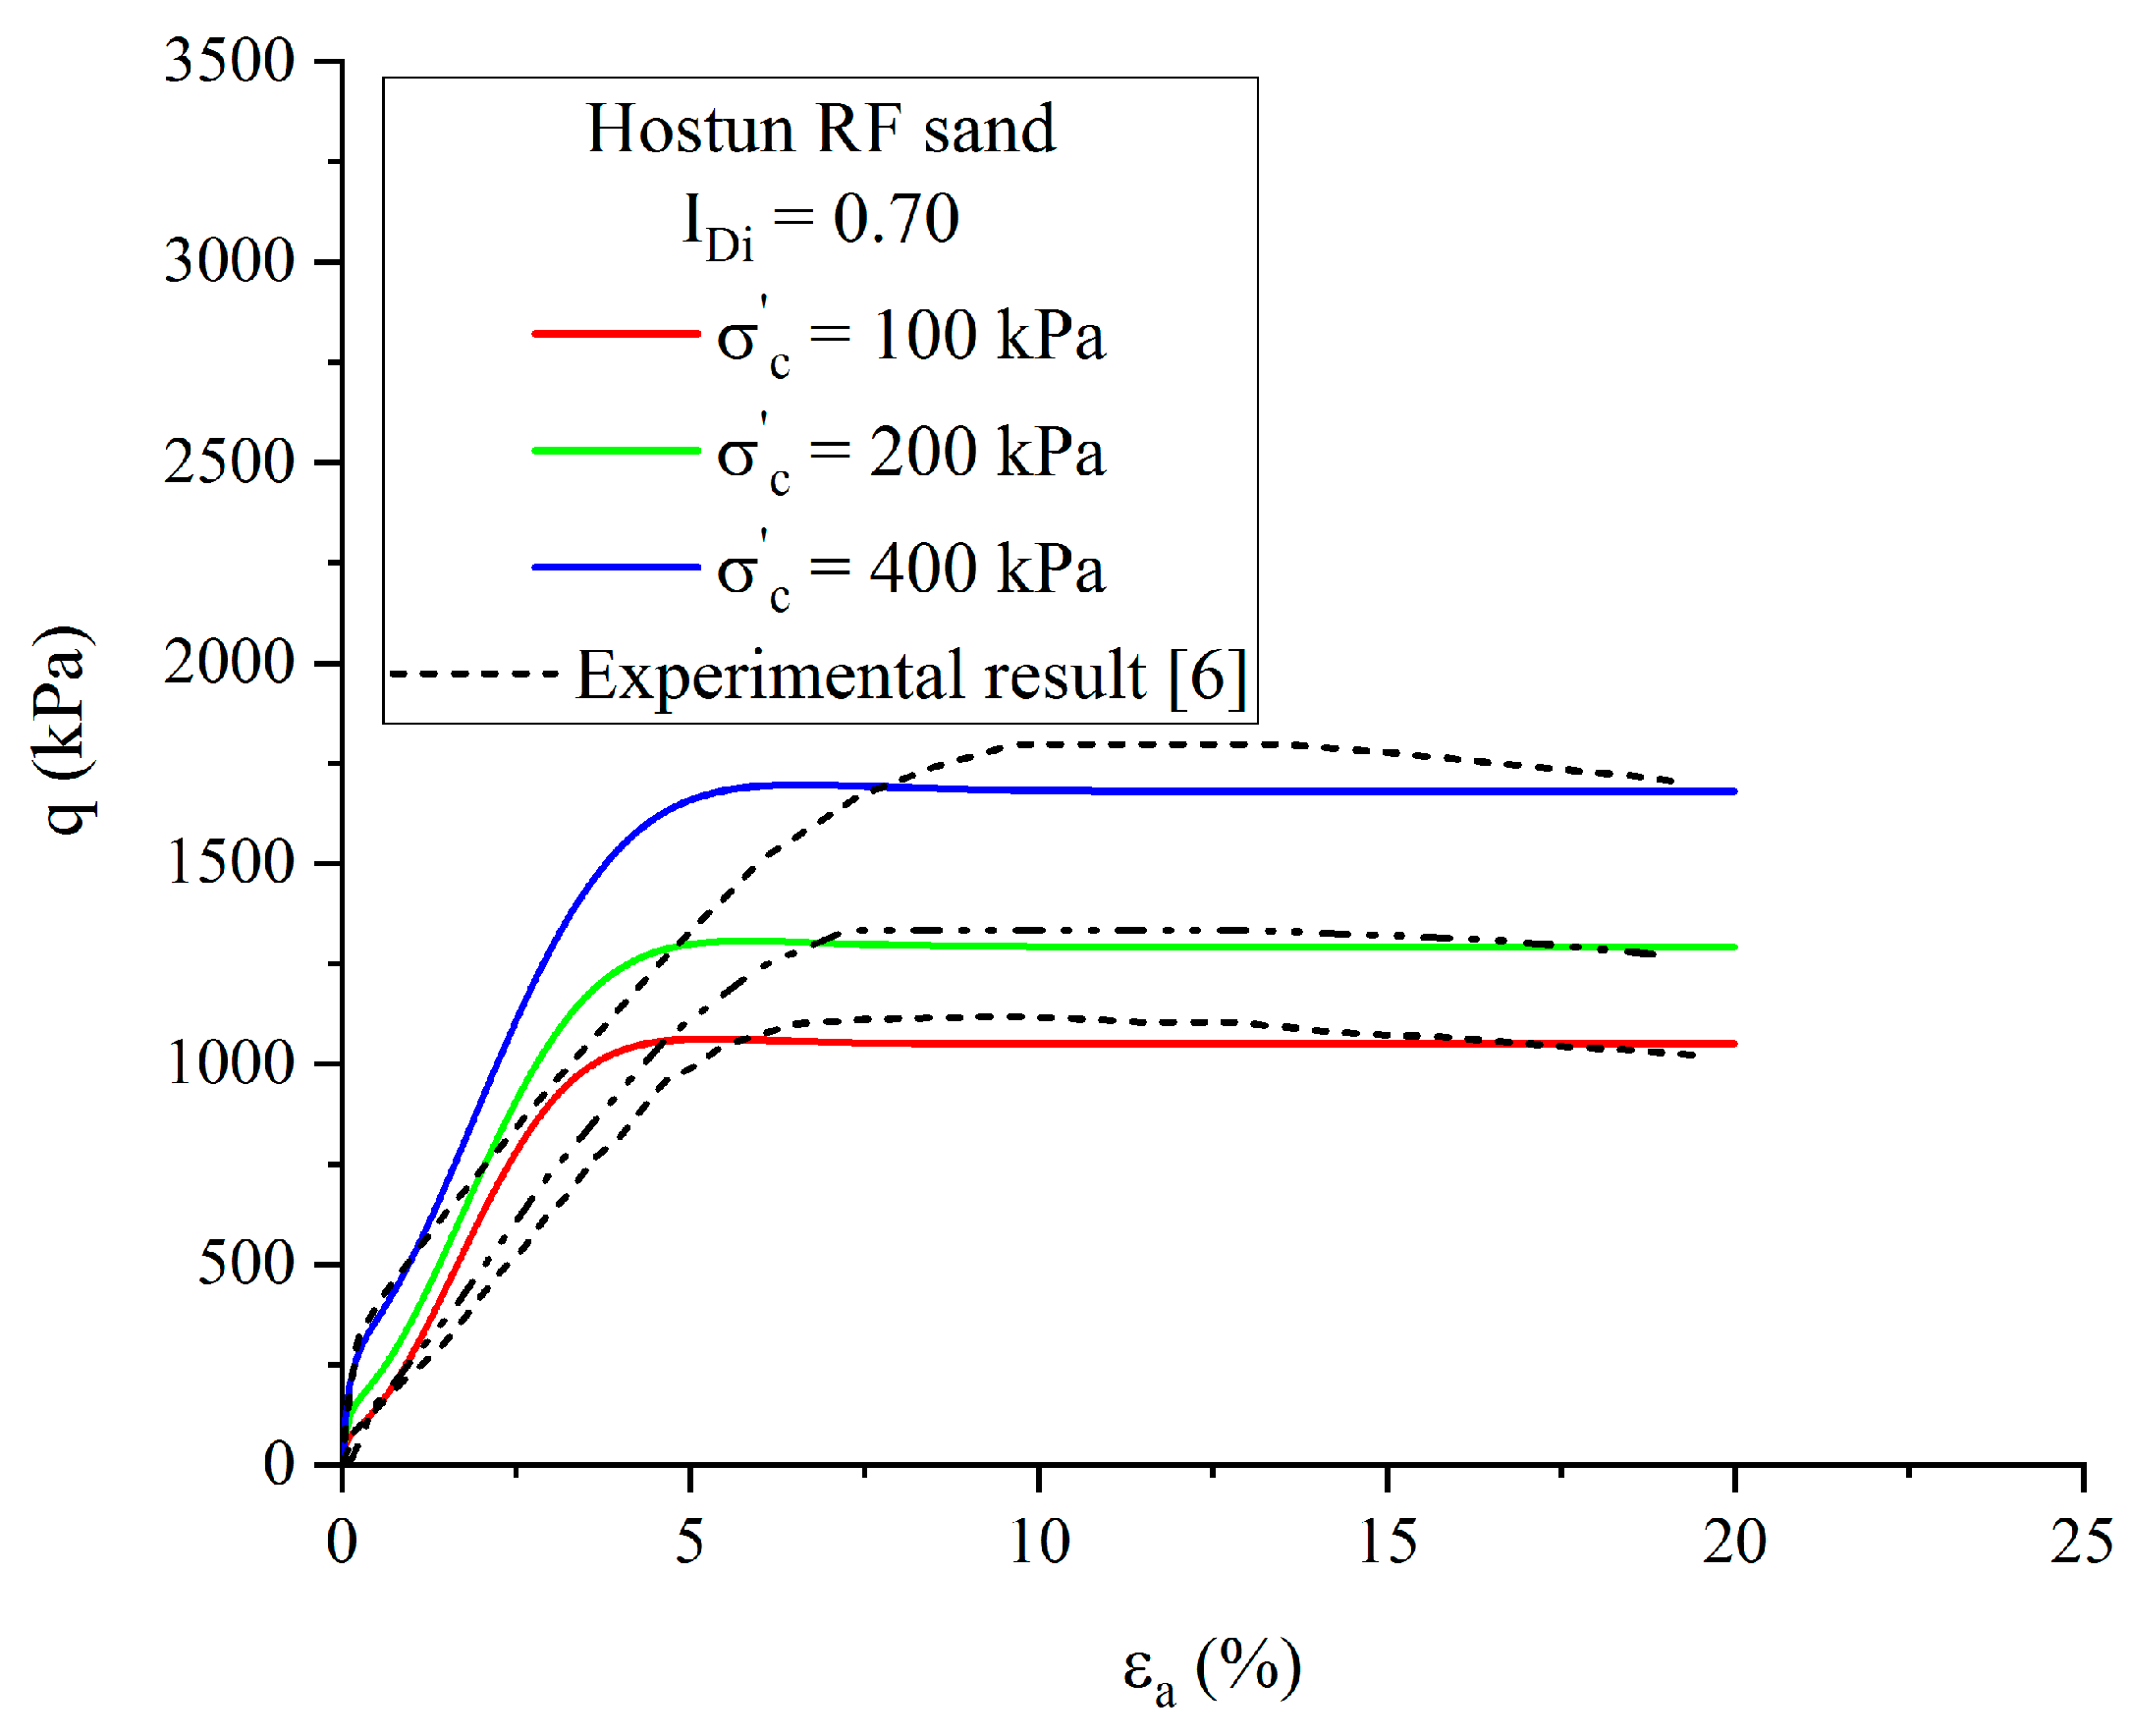
Figure 12 shows that with the correction of model parameter , the model was capable of correctly simulating a case for dense sand specimens. Some small differences can be attributed to the observation that deformation of dense sand was not homogenous and that the expansion of the sample’s section was significant.
4. Disussion
The presented model works well for cohesionless soil because it is able to imitate the possible contractive and dilatant behaviour of sand by incorporating the state parameter into its framework. However, the effect of isotropic consolidation on soil response is neglected. Moreover, the yield criterion is proposed under a ‘strong’ assumption that the sand particle is incompressible during shearing. However, particle breakage is inevitable, especially near the shear band. Thus, the necessity of a -controlling cap into model yield criterion is under discussion. On the basis of real measurements of Hostun RF sand, the authors proposed a correction formula of model parameter in order to capture the influence of confining pressure on the critical state of tested sands. However, more investigations are still needed to verify whether it could be suitable for other sands.
5. Conclusions
The present work presents a parameter evaluation of two model constants based on the exponential form of critical state line. Undrained triaxial tests of clean Hostun RF sand were simulated. Special attention was paid to studying the model performance on sand liquefaction and dilatant behaviours. The principal findings were as follows:
- Model constant had a predominant effect in loose state because it had a clear physical meaning. The substitution of by is recommended, and the numerical results were consistent with the real experimental data. Moreover, in loose state, model constant did not play an important role.
- In dense state, the influence of initial confining pressure on critical state cannot be neglected and should be corrected with the initial confining pressure. An empirical equation is proposed on the basis of Hostun RF clean sand.
Author Contributions
Conceptualization, Z.Z.; methodology, Z.Z. and W.C.; software and experiment, Z.Z.; visualization, Z.Z.; validation, W.C.; writing—original draft, Z.Z.; review and editing, W.C. All authors have read and agreed to the published version of the manuscript.
Funding
This research received no external funding.
Acknowledgments
The first author acknowledges the support of the geotechnical laboratory of Ecole des Ponts, ParisTech, and the help provided by Li.
Conflicts of Interest
The authors declare no conflict of interest.
Notation
| d | dilatancy |
| e | void ratio |
| εv | volumetric strain |
| εq | shear strain |
| f | yield surface |
| state parameter | |
| G | shear modulus |
| IDi | density index |
| K | elastic bulk modulus |
| Kp | plastic hardening modulus |
| M | stress ratio at critical state |
| L | loading index |
| ν | Poisson’s ratio |
| p’ | mean effective stress |
| pa | atmospheric pressure |
| σc’ | isotropic confining pressure |
| η | stress ratio |
References
- Roscoe, K.H.; Schofield, A.N. Mechanical behaviour of an idealized ‘wet’ clay. In Proceedings of the European Conference on Soil Mechanics and Geotechnical Engineering, Wiesbaden, Germany, 15–18 October 1963; pp. 47–54. [Google Scholar]
- Roscoe, K.; Burland, J.B. On the generalized stress-strain behaviour of wet clay. Eng. Plast. 1968, 535–609. [Google Scholar] [CrossRef]
- Verdugo, R.; Ishihara, K. The steady state of sandy soils. Soils Found. 1996, 36, 81–91. [Google Scholar] [CrossRef] [Green Version]
- Li, X.S.; Dafalias, Y.F. Dilatancy for cohesionless soils. Geotechnique 2000, 50, 449–460. [Google Scholar] [CrossRef]
- Been, K.; Jefferies, M.G. A state parameter for sands. Geotechnique 1985, 35, 99–112. [Google Scholar] [CrossRef]
- Benahmed, N. Comportement Mécanique d’un Sable Sous Cisaillement Monotone et Cyclique: Application aux Phénomènes de Liquéfacton et de Mobilité Cyclique. Ph.D. Thesis, de l’Ecole Des Ponts et Chaussées, Paris, France, 2001. (In French). [Google Scholar]
- Jardi, L. Study of the Influence of Fines Particles on the Properties of Liquefaction of Sands. Ph.D. Thesis, de l’Ecole Des Ponts et Chaussées, Paris, France, 2018. [Google Scholar]
- Li, X.S.; Wang, Y. Linear representation of steady-state line for sand. J. Geotech. Geoenviron. Eng. 1998, 124, 1215–1217. [Google Scholar] [CrossRef]
- Luo, G.; Zhang, J.M. Sand constitutive model considering physical state changes. J. Hydraul. Eng. 2004, 26–31. (In Chinese) [Google Scholar] [CrossRef]
- Richart, F.E.; Hall, J.R.; Woods, R.D. Vibrations of Soils and Foundations; Prentice-Hall: Englewood Cliffs, NJ, USA, 1970. [Google Scholar]
- Dafalias, Y.F. An anisotropic critical state soil plasticity model. Mech. Res. Commun. 1986, 13, 341–347. [Google Scholar] [CrossRef]
- Wang, Z.L.; Dafalias, Y.F.; Shen, C.K. Bounding surface hypoplasticity model for sand. J. Eng. Mech. 1990, 116, 983–1001. [Google Scholar] [CrossRef]
- Chi, M.J.; Zhao, C.G.; Li, X.J. Research on constitutive model for dilatant sand. Rock Soil Mech. 2008, 29, 2. (In Chinese) [Google Scholar] [CrossRef]
Figure 1.
Initial state parameter for two different initial density indexes .


Figure 3.
Critical state of Hostun RF sand from very loose to loose states on (a) and (b) plan [6].
Figure 3.
Critical state of Hostun RF sand from very loose to loose states on (a) and (b) plan [6].

Figure 4.
Influence of parameter a on effective stress path of Hostun RF sand under a confining pressure of 100 kPa and density index of 0.00.
Figure 4.
Influence of parameter a on effective stress path of Hostun RF sand under a confining pressure of 100 kPa and density index of 0.00.

Figure 5.
Variation of critical state line in plan with model constant a.

Figure 6.
Generation of excess pore water pressure with three values of a.

Figure 7.
Variation in critical state line in plan with model constant b.

Figure 8.
Influence of parameter b on effective stress path of Hostun RF sand under a confining pressure of 100 kPa and density index of 0.00.
Figure 8.
Influence of parameter b on effective stress path of Hostun RF sand under a confining pressure of 100 kPa and density index of 0.00.

Figure 9.
Effective stress path of Hostun RF sand on very loose state under various confining pressures.
Figure 9.
Effective stress path of Hostun RF sand on very loose state under various confining pressures.

Figure 10.
Critical state of Hostun RF sand under various confining pressures equal to 100, 200, and 400 kPa [6].
Figure 10.
Critical state of Hostun RF sand under various confining pressures equal to 100, 200, and 400 kPa [6].

Figure 11.
Stress–strain curve of Hostun RF sand on dense state under a confining pressure of 200 kPa.
Figure 11.
Stress–strain curve of Hostun RF sand on dense state under a confining pressure of 200 kPa.

Figure 12.
Comparison of stress–strain curve of Hostun RF sand on dense state under confining pressures of 100, 200, and 400 kPa.
Figure 12.
Comparison of stress–strain curve of Hostun RF sand on dense state under confining pressures of 100, 200, and 400 kPa.


Table 1.
Model parameters and physical properties of Hostun RF sand.
| Elastic Parameters | Critical State Parameters | Dilatancy Parameters | Hardening Parameters | Sand Property |
|---|---|---|---|---|
| = 176 | M = 1.22 | n = 0.42 | α = 0.63 | = 1 |
| ν = 0.176 | = −0.030 a = 1.00 | - | β = −2.5 | = 0.656 |
© 2020 by the authors. Licensee MDPI, Basel, Switzerland. This article is an open access article distributed under the terms and conditions of the Creative Commons Attribution (CC BY) license (http://creativecommons.org/licenses/by/4.0/).
Share and Cite
MDPI and ACS Style
Zhu, Z.; Cheng, W. Parameter Evaluation of Exponential-Form Critical State Line of a State-Dependent Sand Constitutive Model. Appl. Sci. 2020, 10, 328. https://0-doi-org.brum.beds.ac.uk/10.3390/app10010328
AMA Style
Zhu Z, Cheng W. Parameter Evaluation of Exponential-Form Critical State Line of a State-Dependent Sand Constitutive Model. Applied Sciences. 2020; 10(1):328. https://0-doi-org.brum.beds.ac.uk/10.3390/app10010328
Chicago/Turabian StyleZhu, Zhehao, and Wei Cheng. 2020. "Parameter Evaluation of Exponential-Form Critical State Line of a State-Dependent Sand Constitutive Model" Applied Sciences 10, no. 1: 328. https://0-doi-org.brum.beds.ac.uk/10.3390/app10010328
Note that from the first issue of 2016, this journal uses article numbers instead of page numbers. See further details here.