The Influence of the Expansive Grout on Theoretical Bandwidth for the Measurement of Strain Waves by Borehole Tensor Strainmeters

Abstract
:1. Introduction
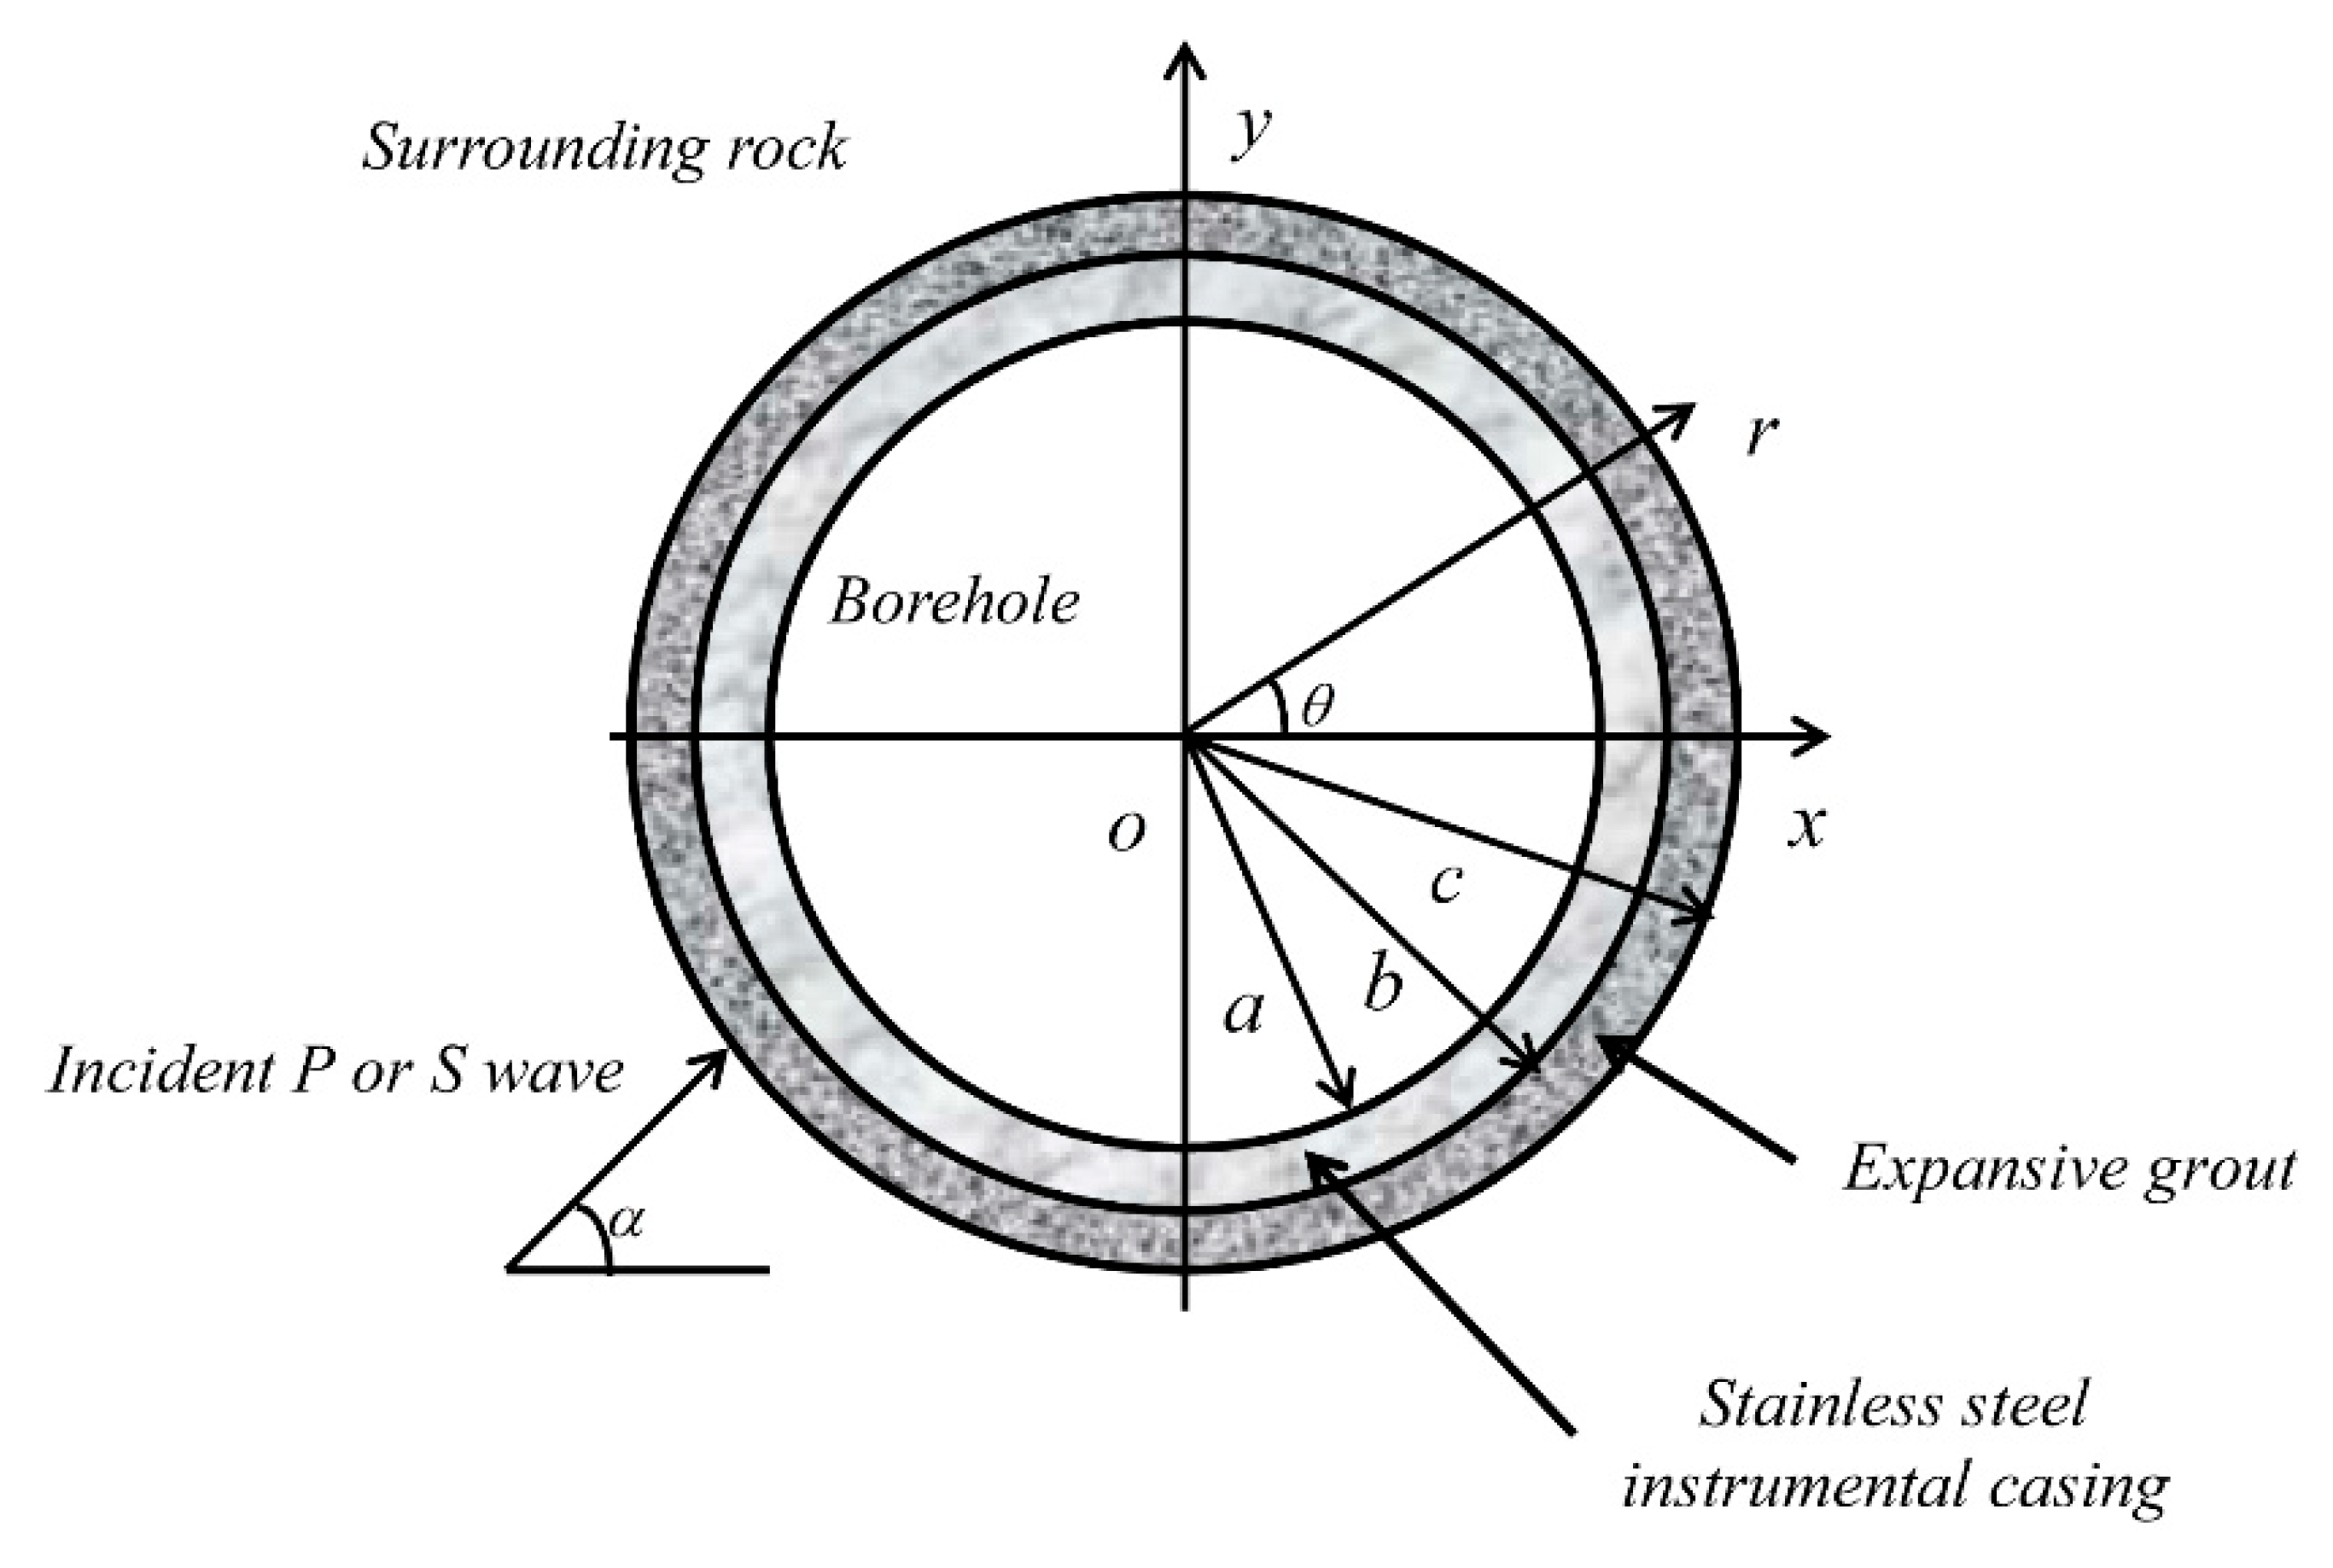
2. The Model of Incident Elastic Wave Scattering by a Two-Ring Borehole
3. Results and Discussions
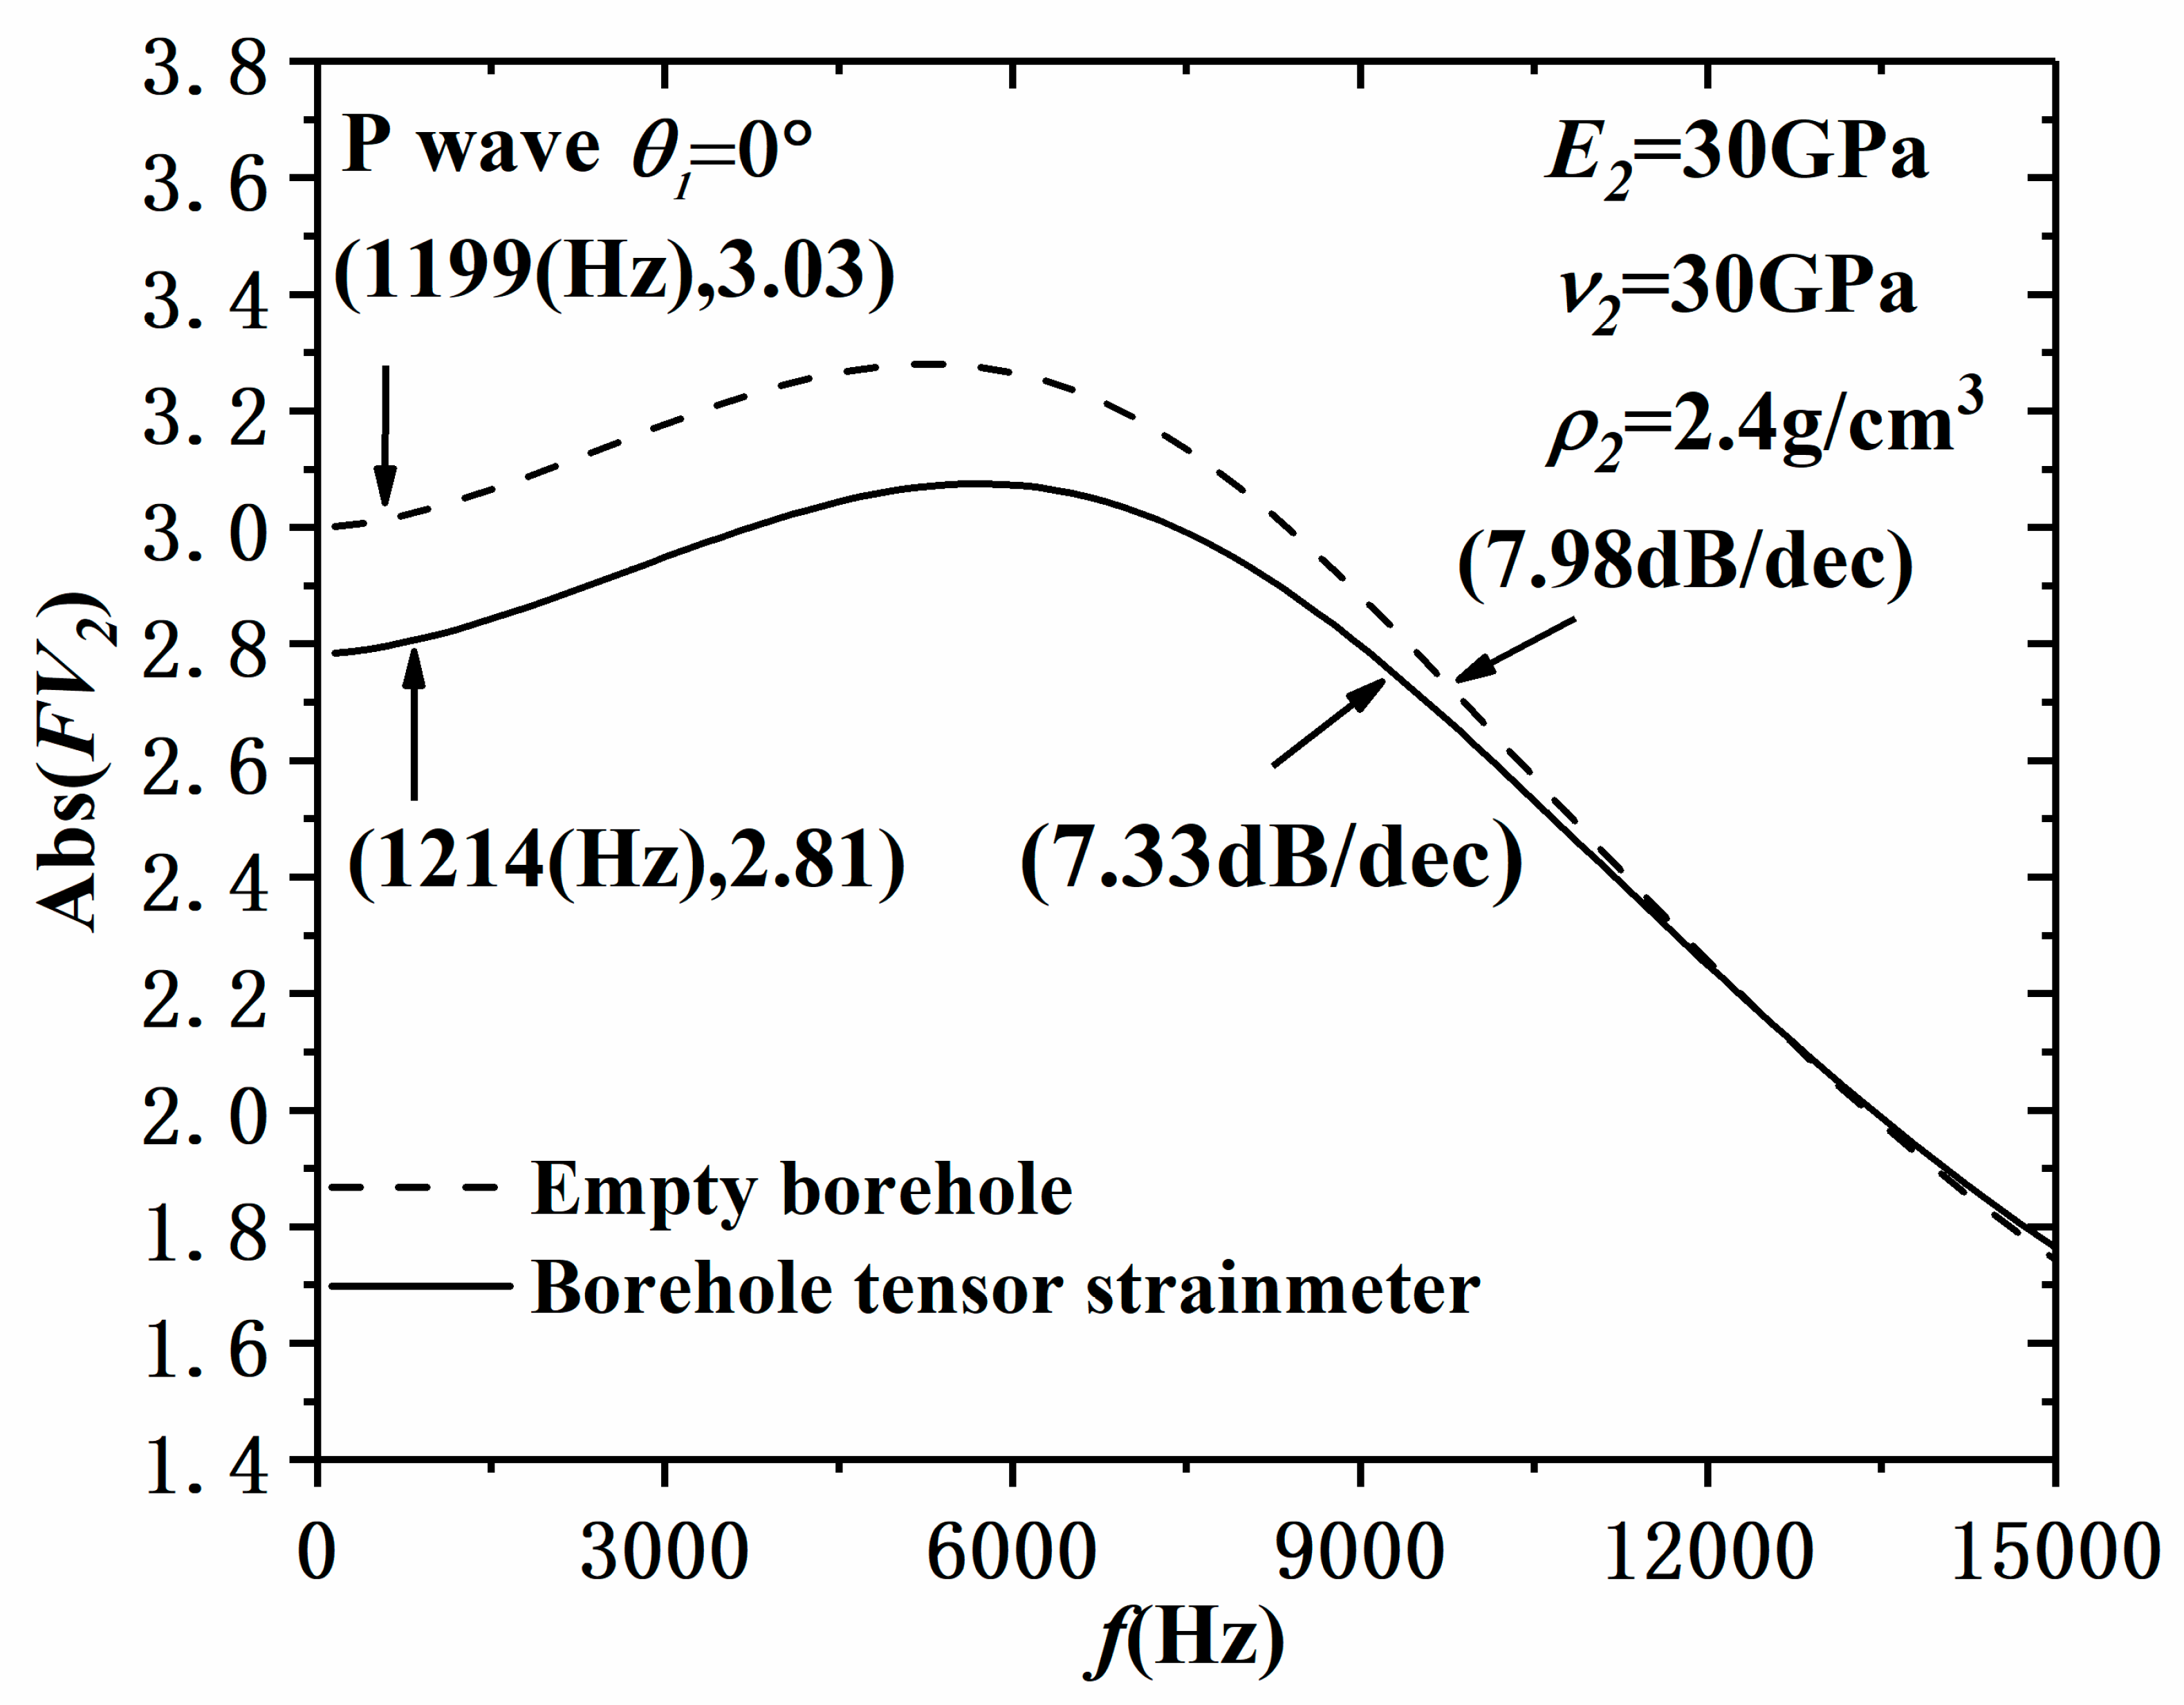
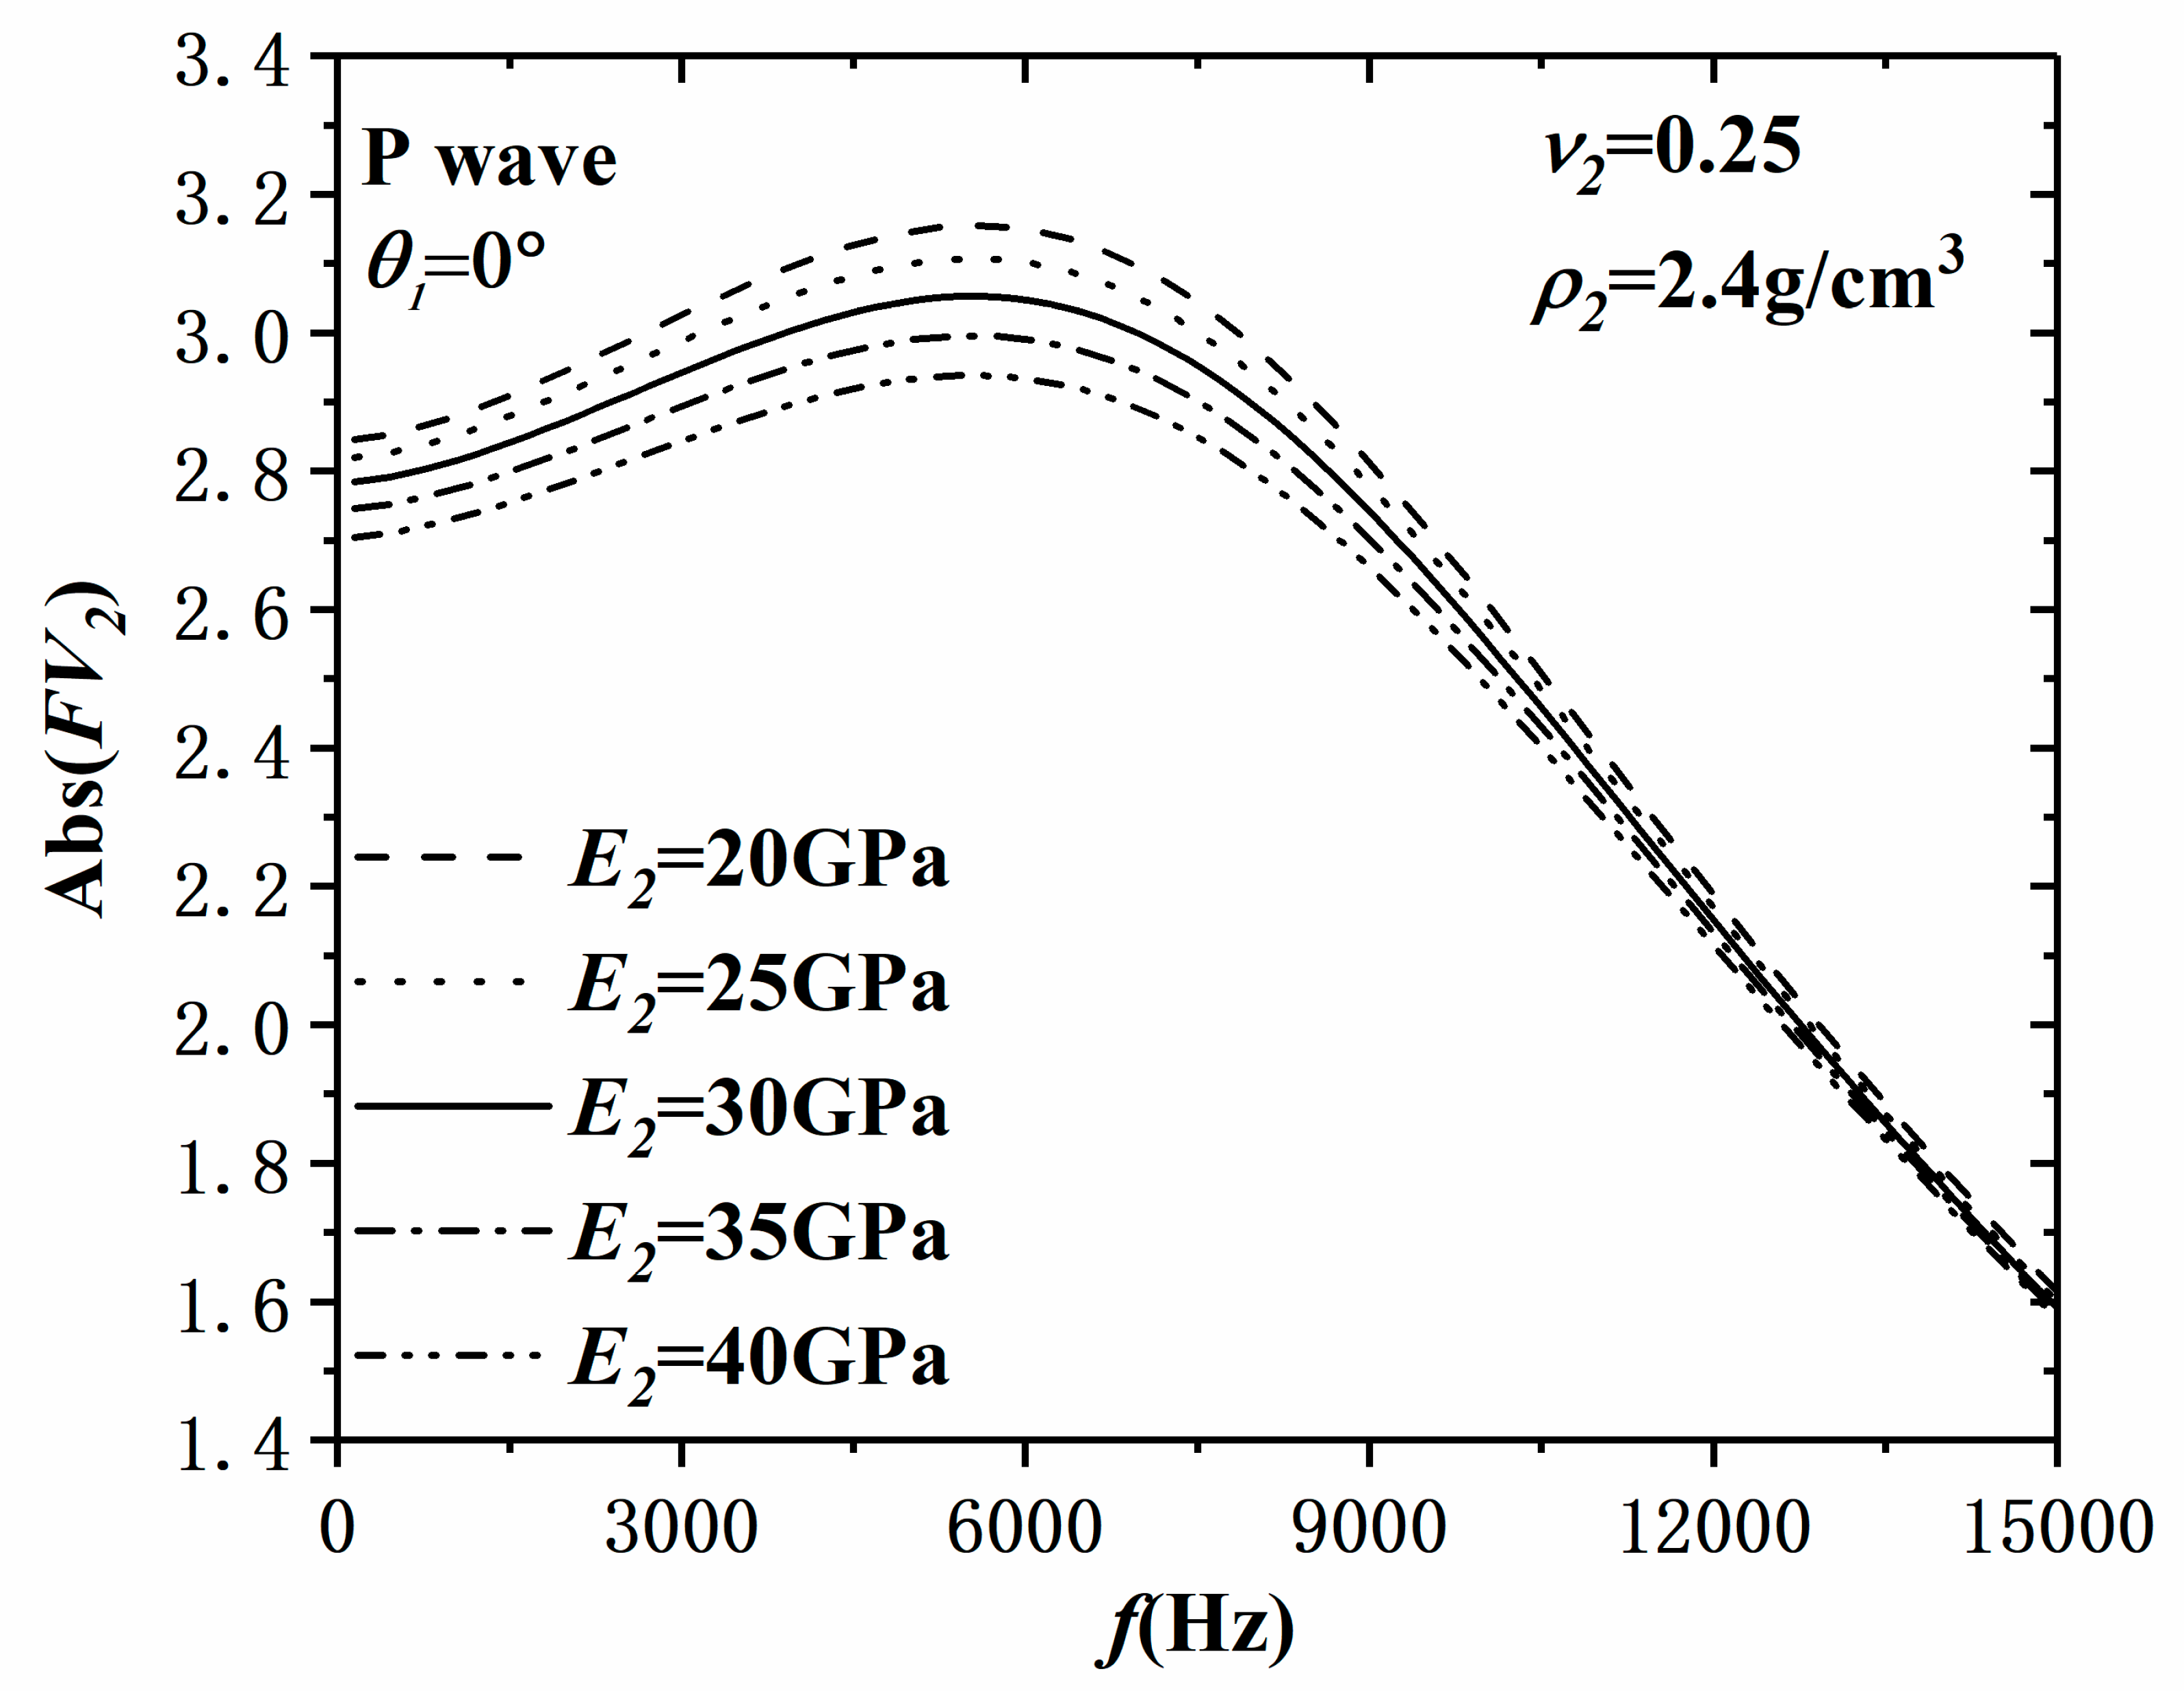
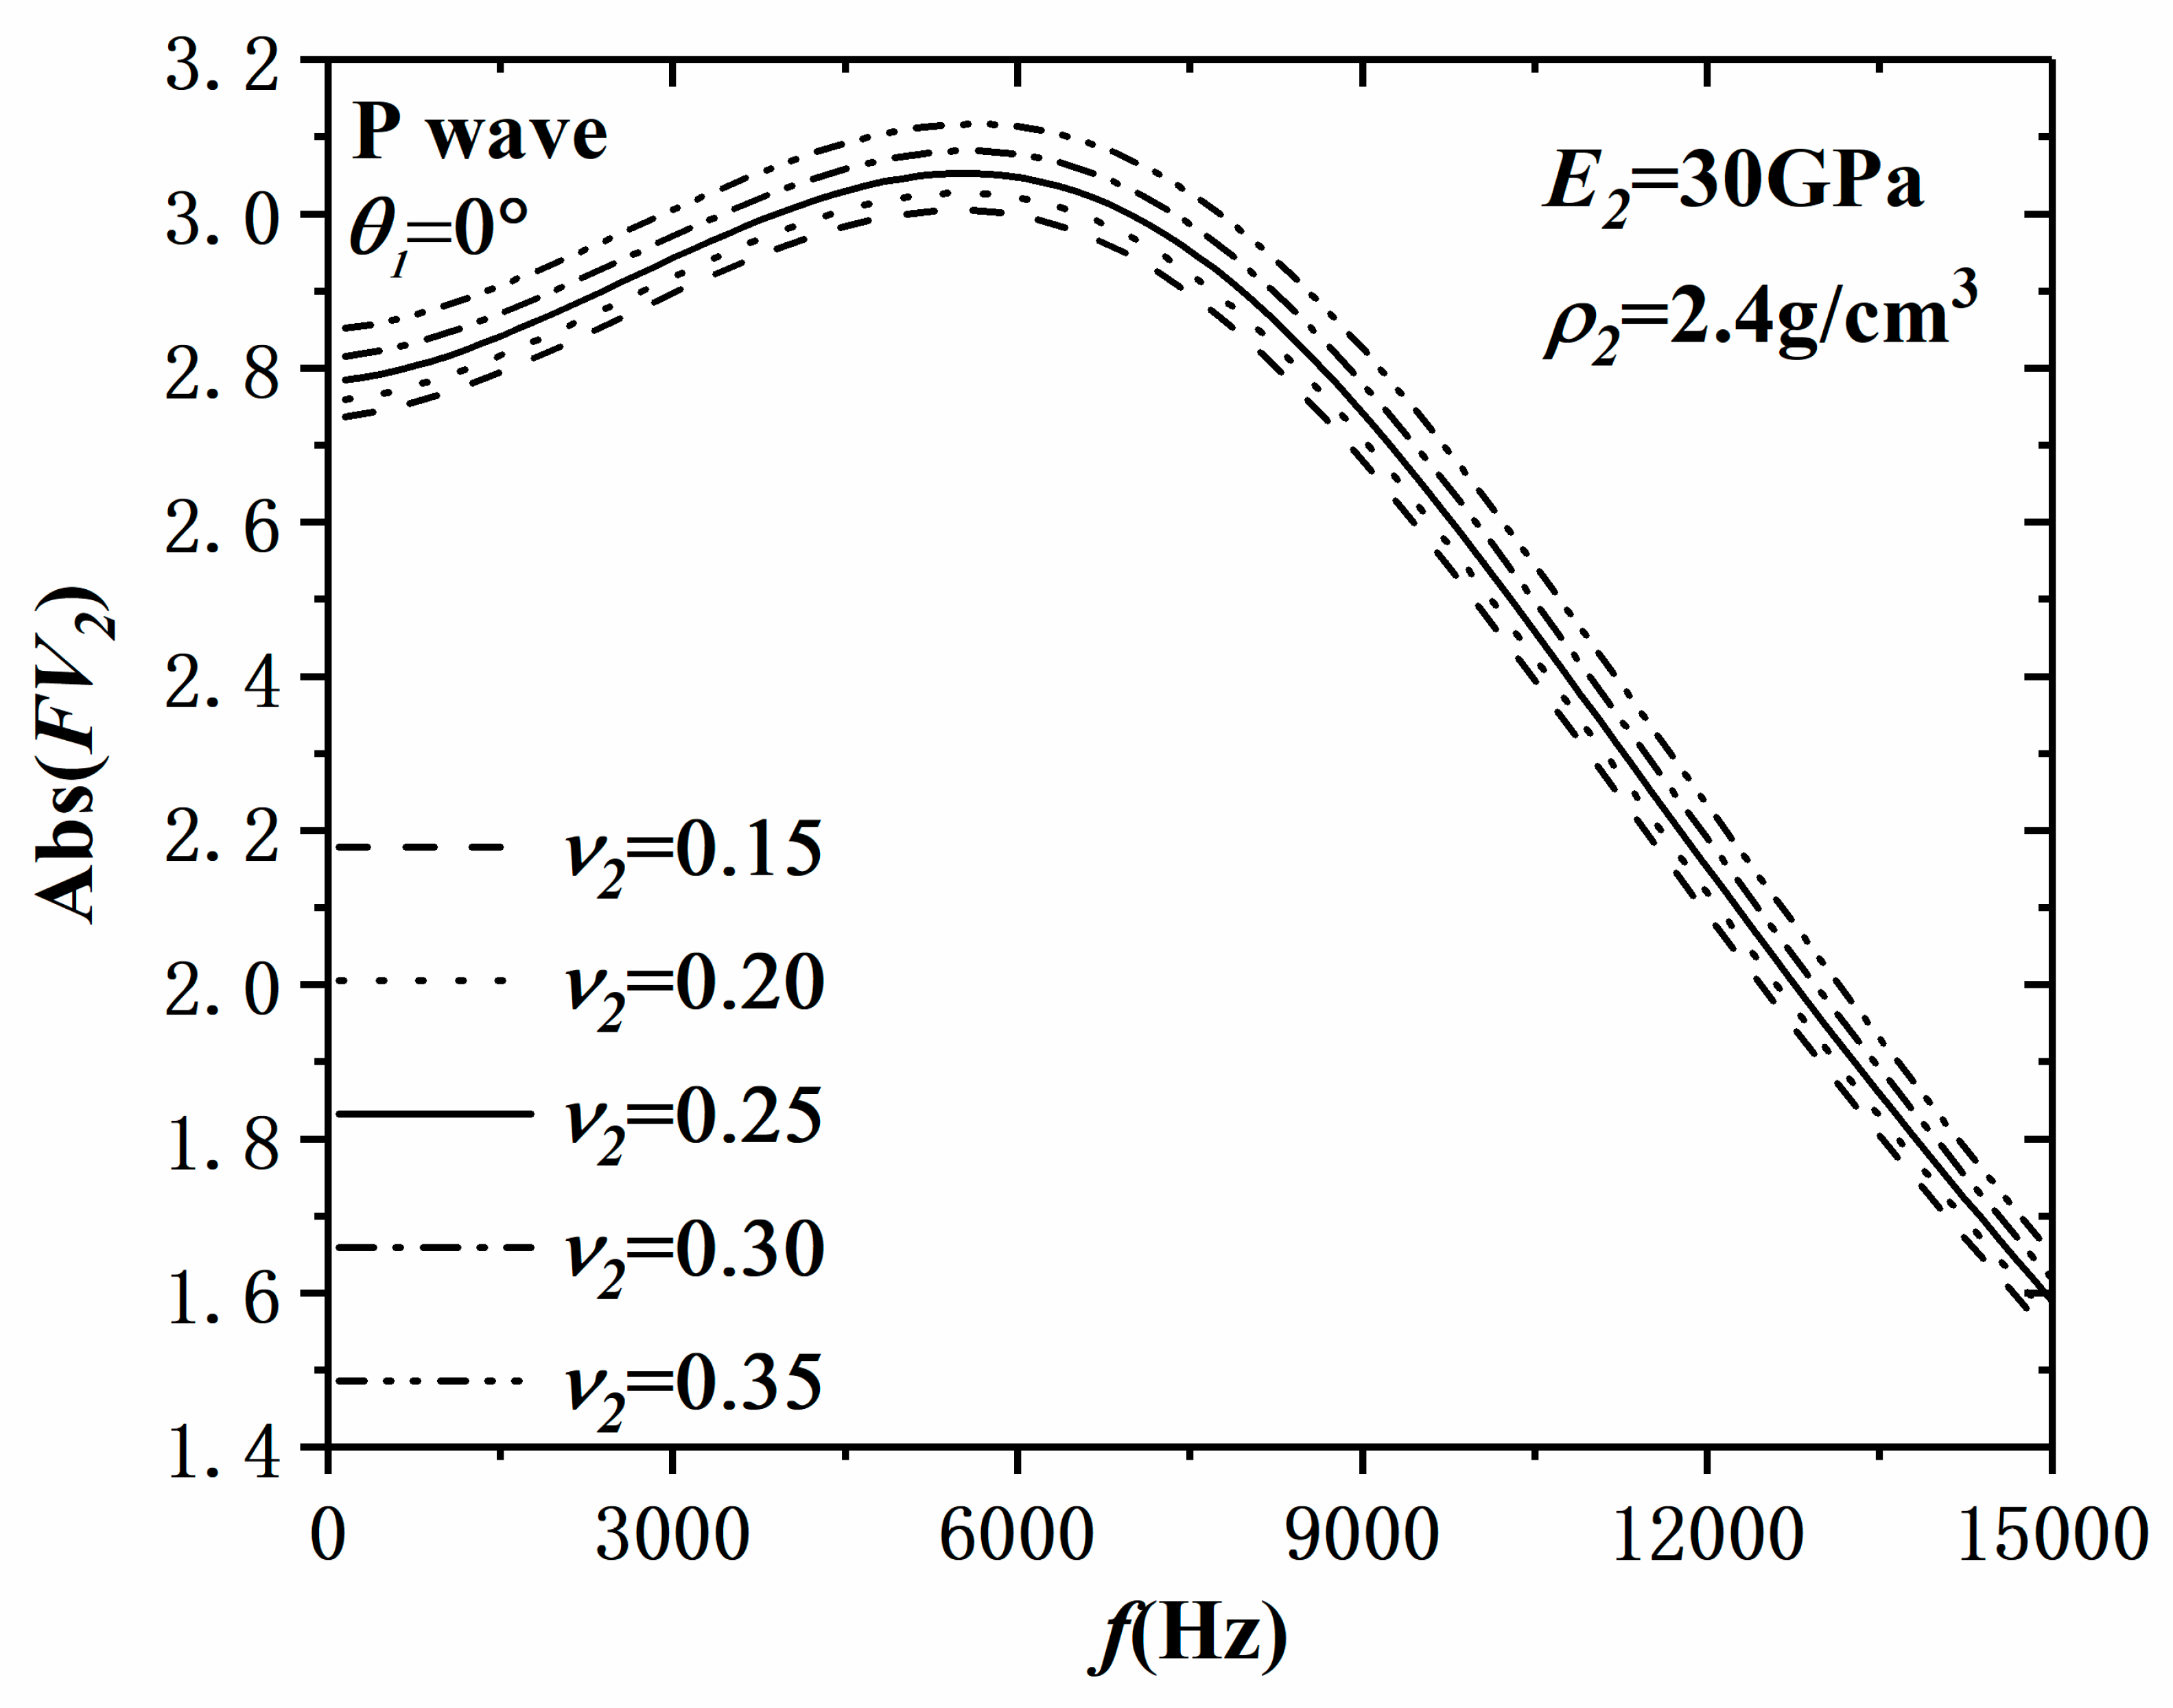
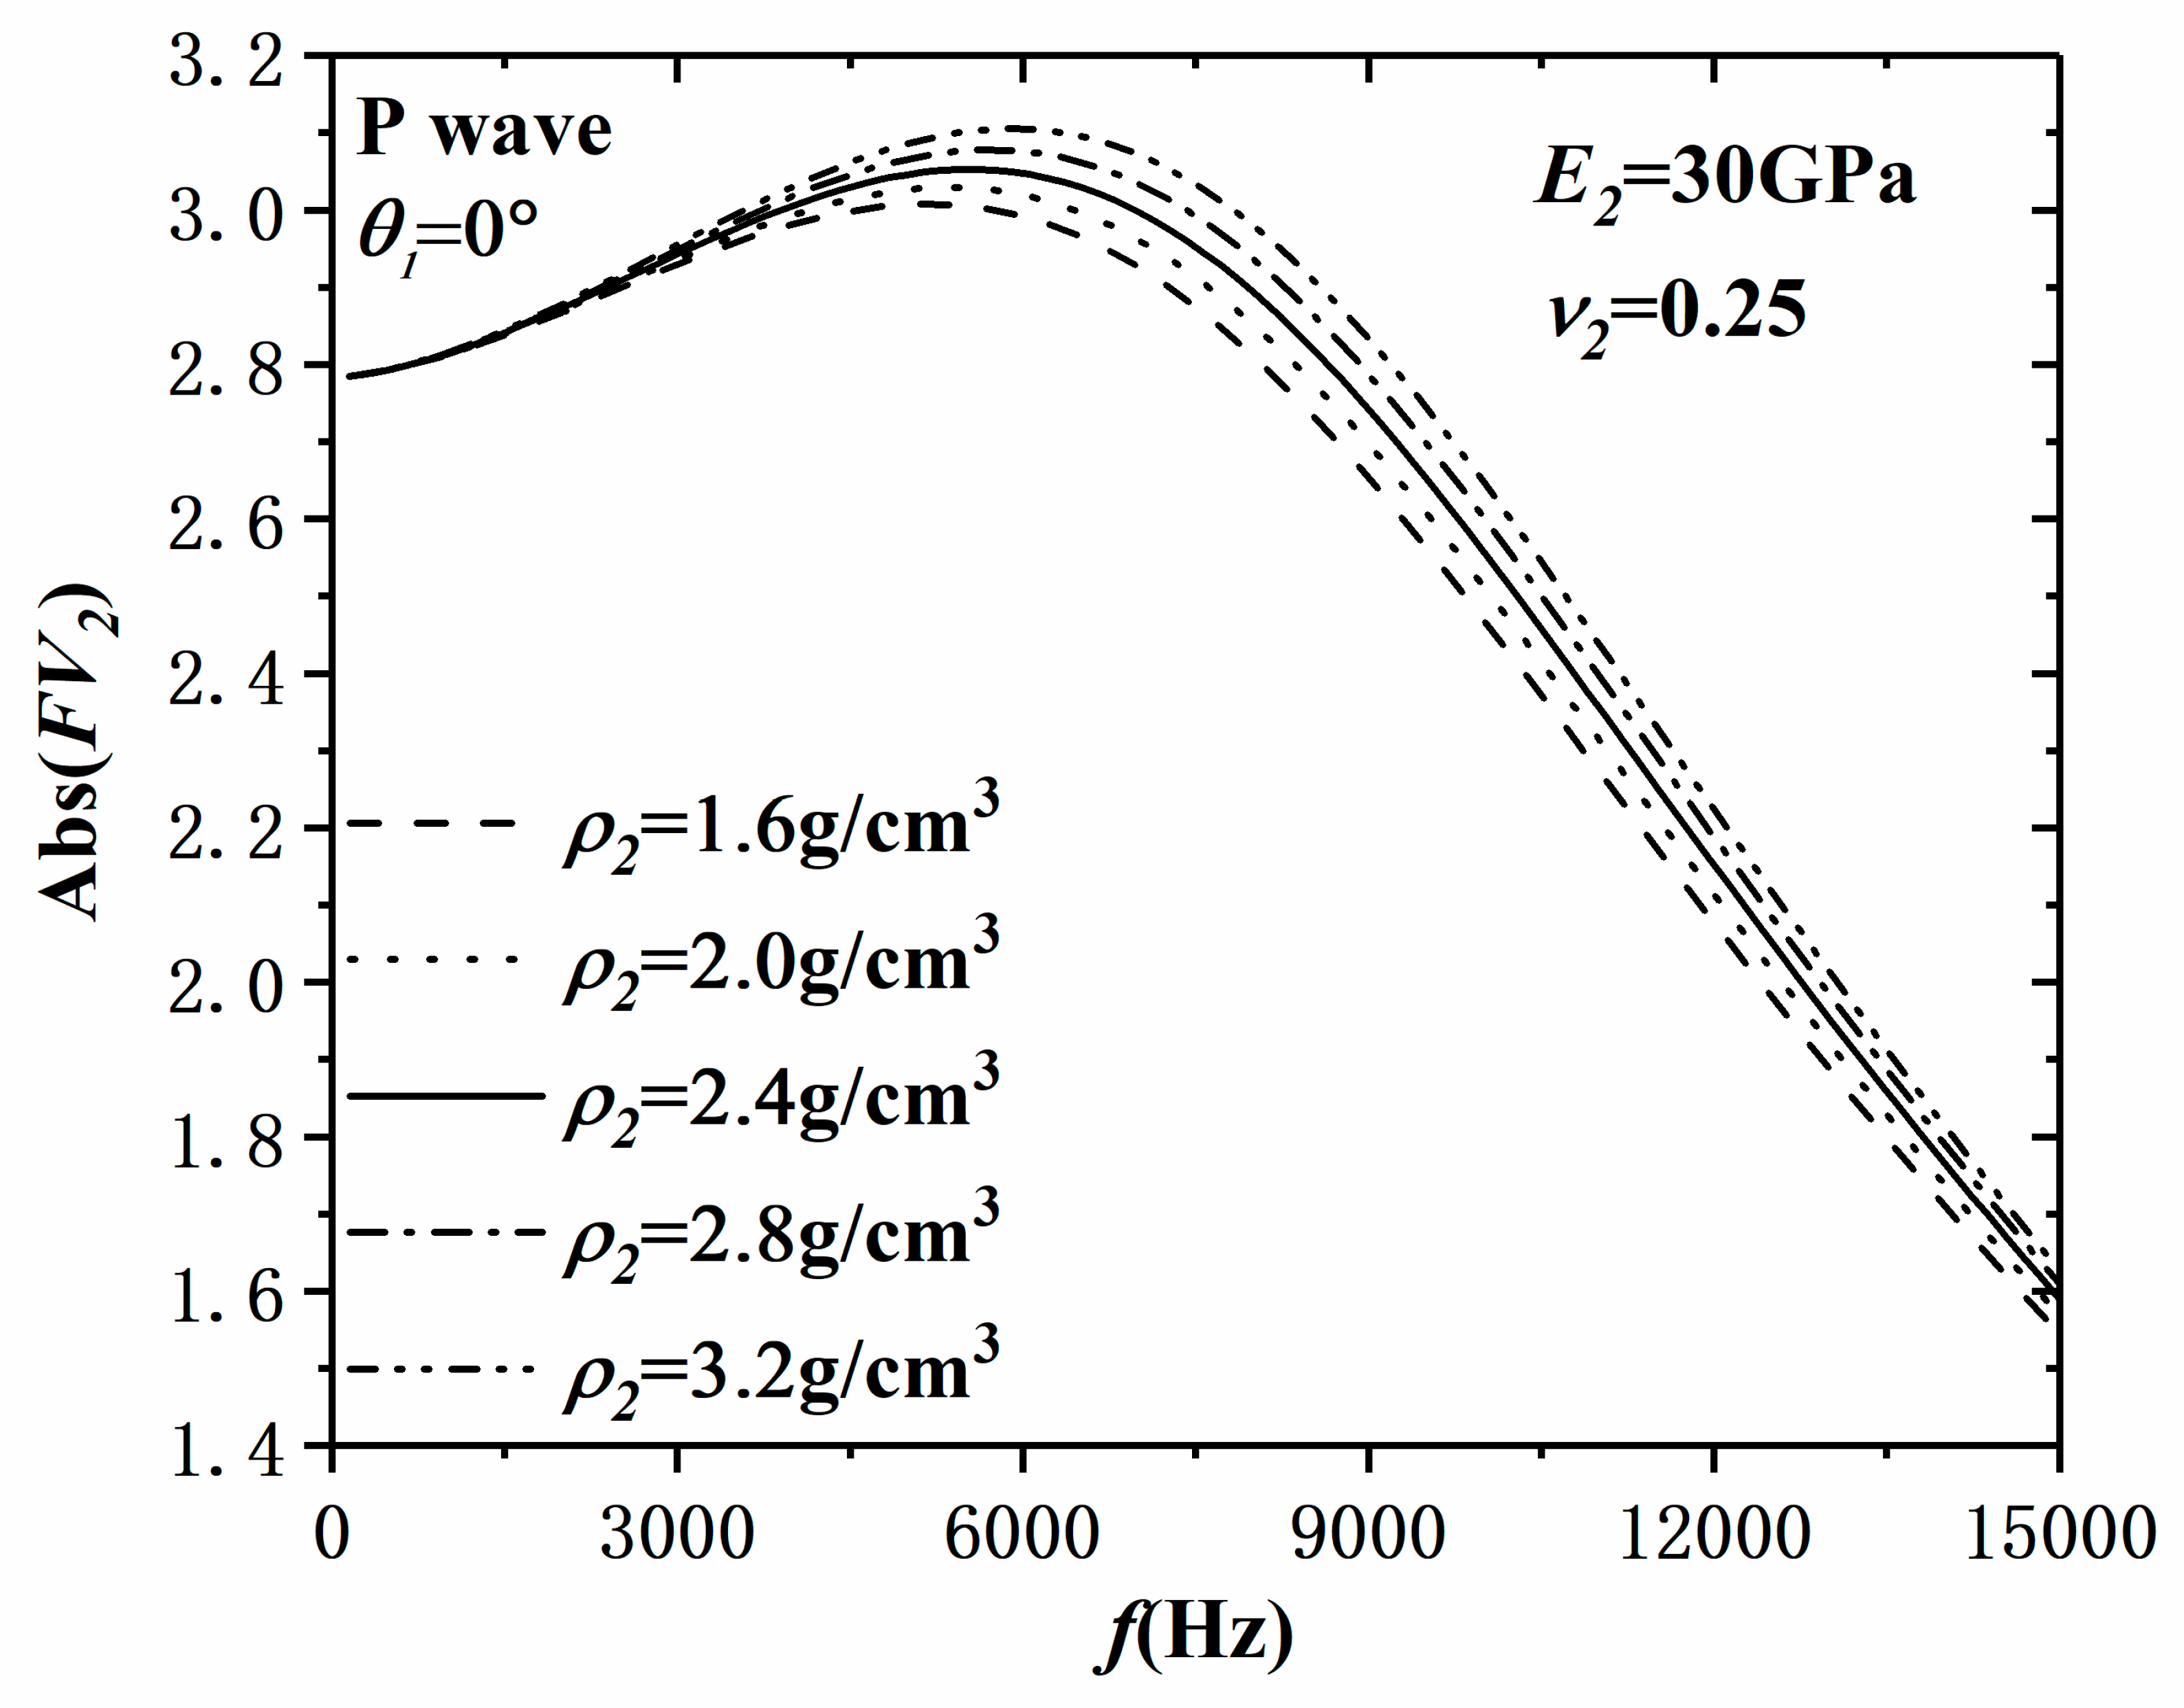
3.1. Incident P Wave
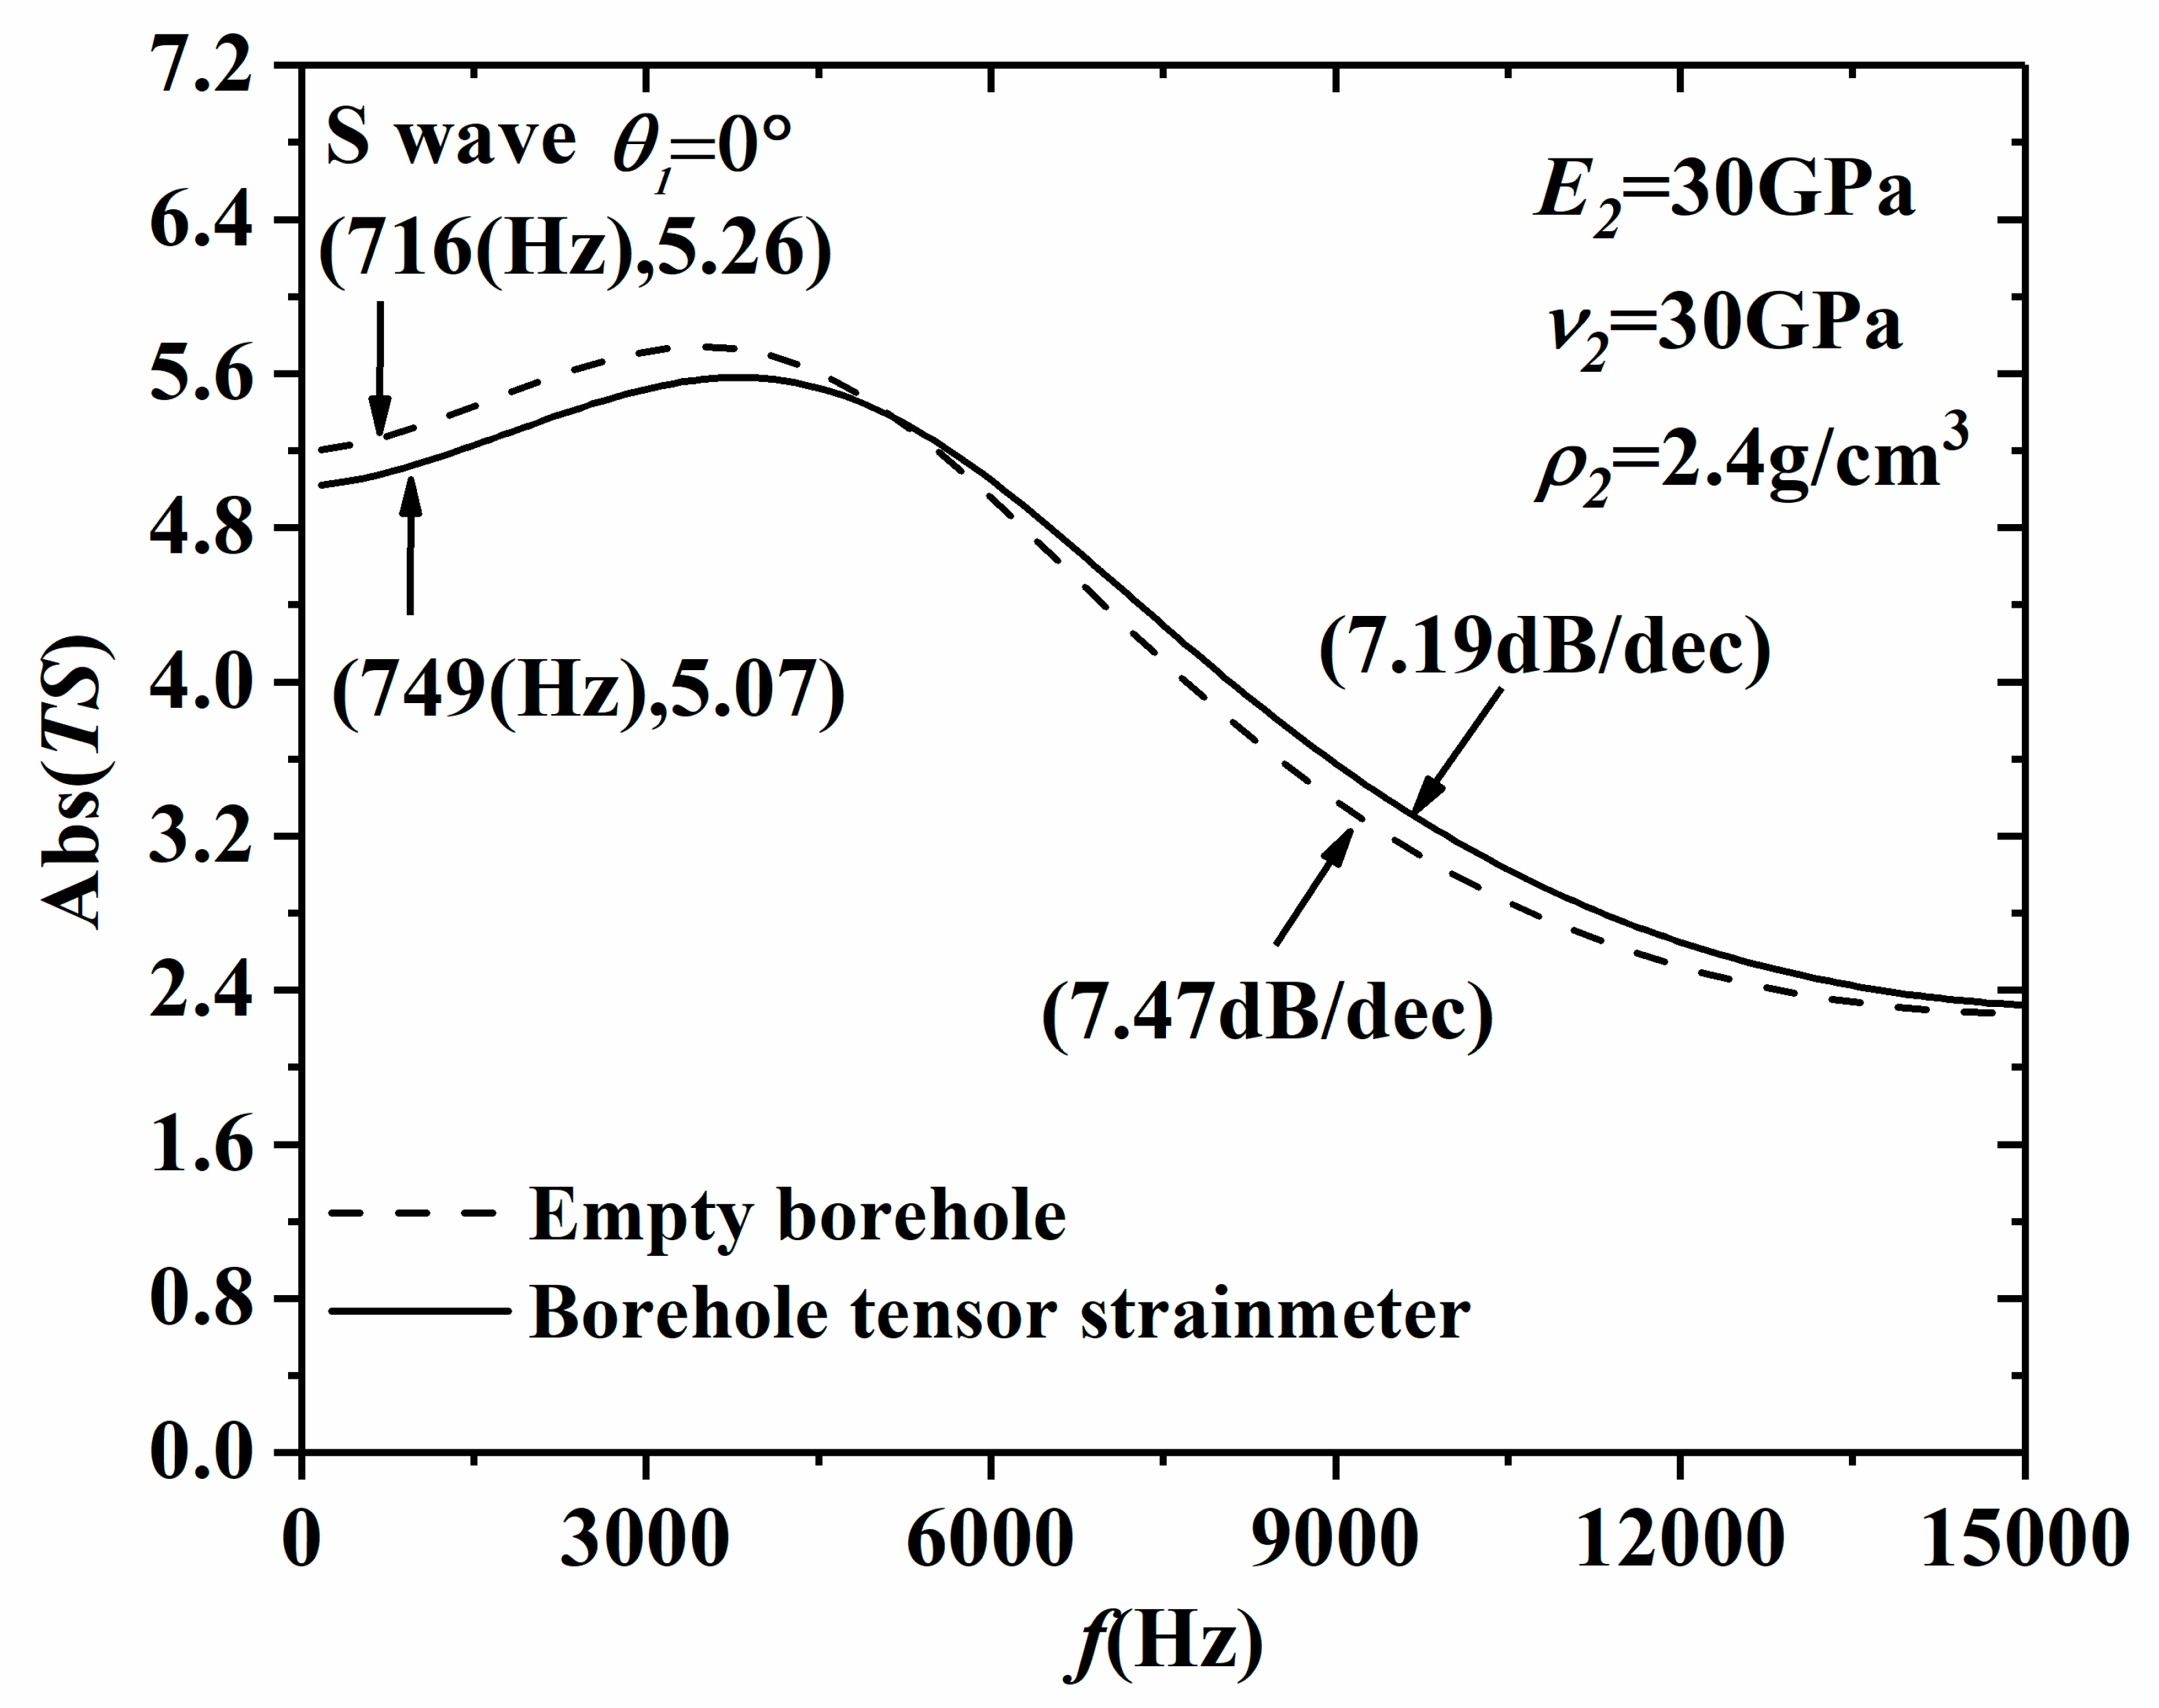
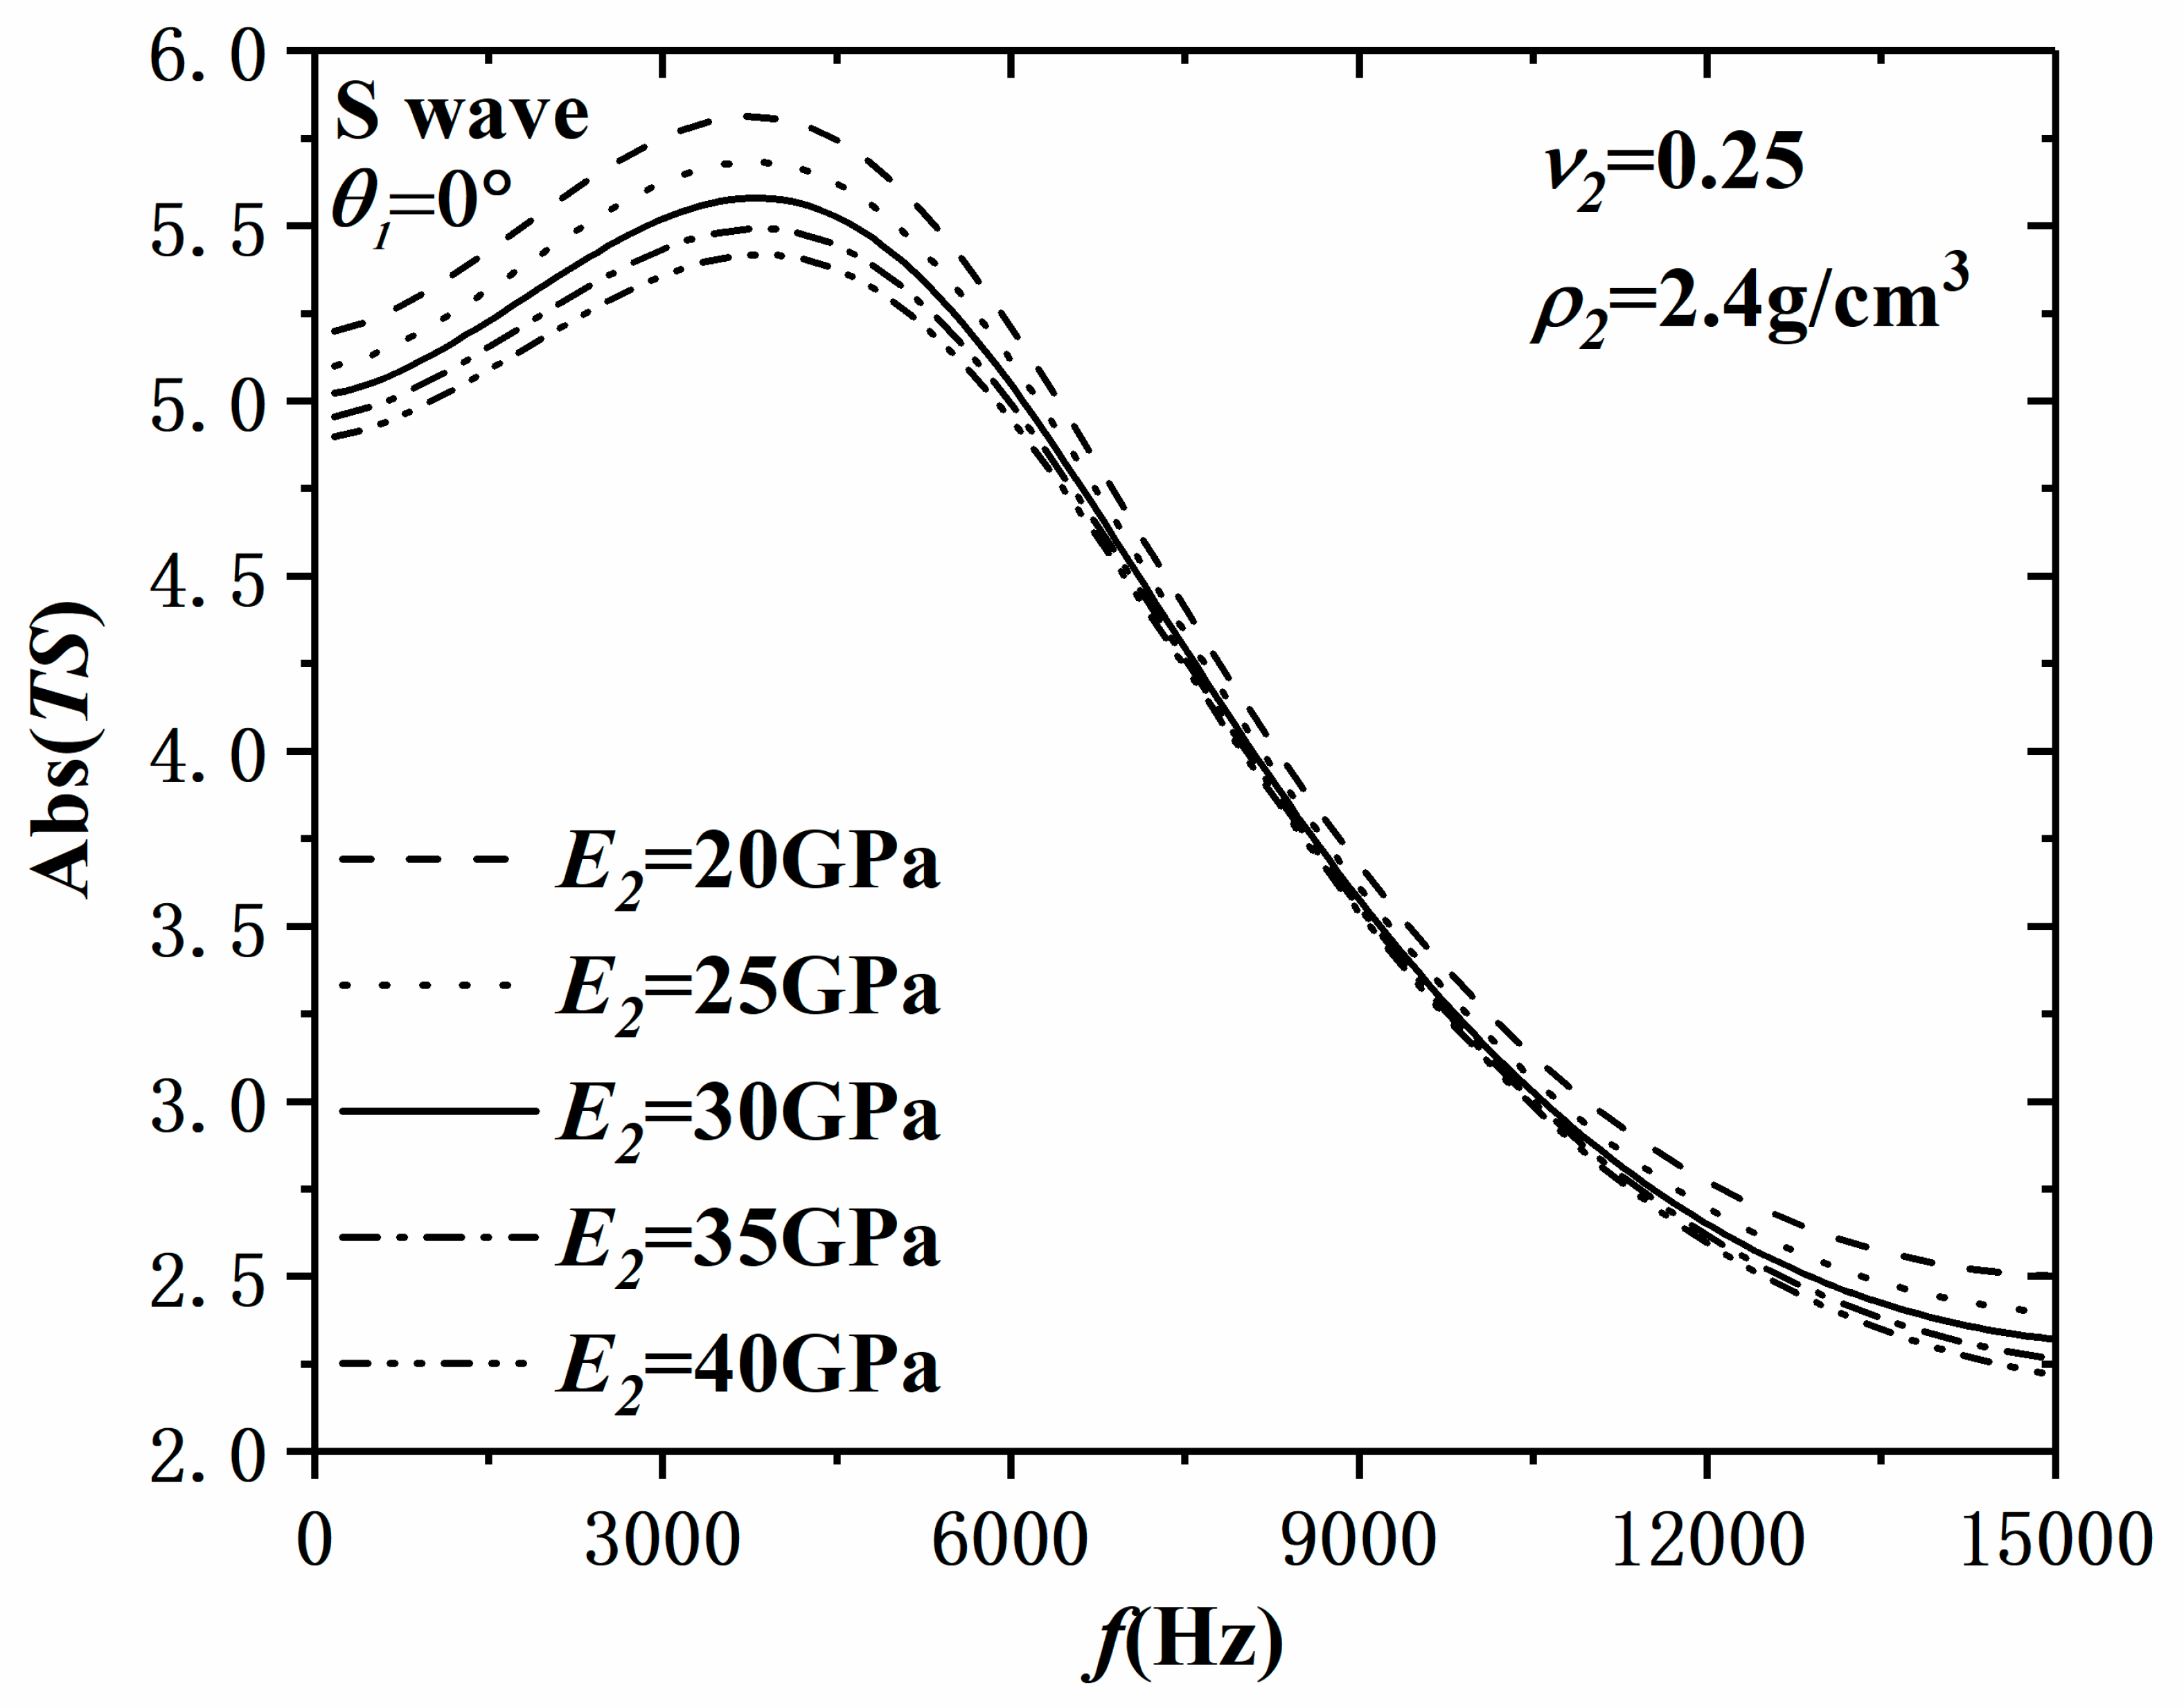
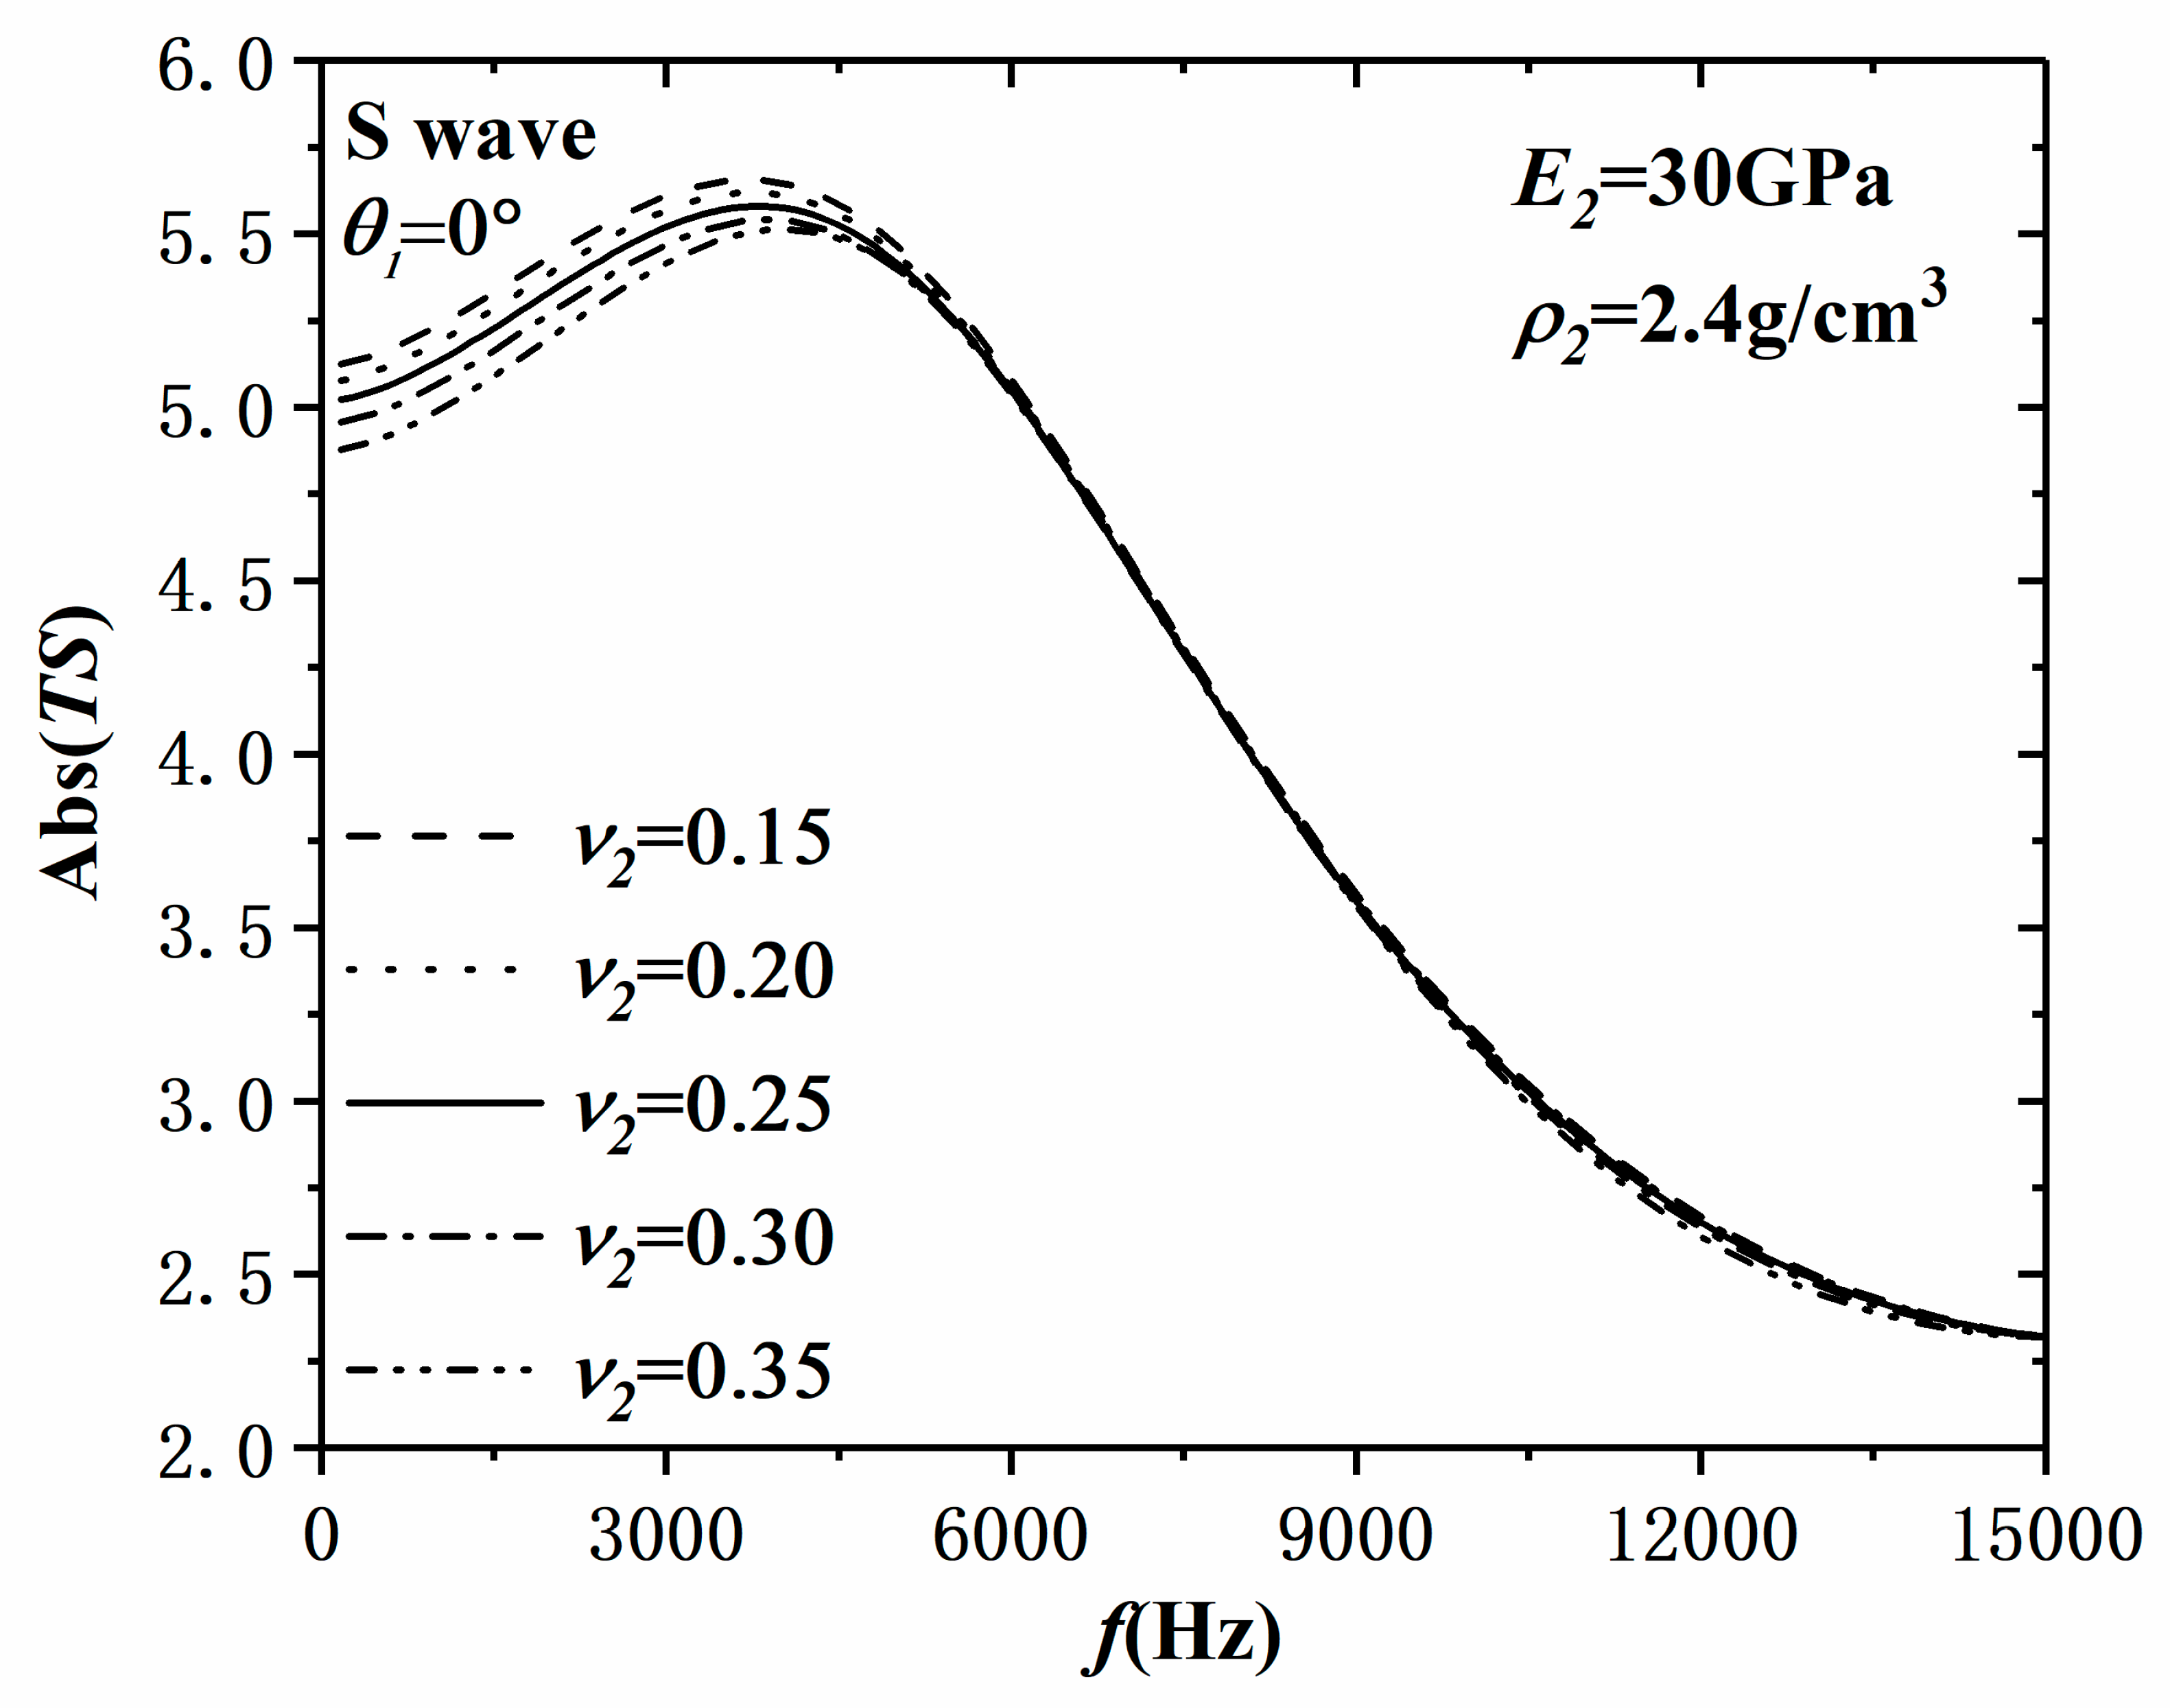
3.2. Incident S Wave
4. Discussions
5. Conclusions
Author Contributions
Funding
Acknowledgments
Conflicts of Interest
References
- Linde, A.T.; Agustsson, K.; Sacks, I.S.; Stefansson, R. Mechanism of the 1991 eruption of Hekla from continuous borehole strain monitoring. Nature 1993, 365, 737–740. [Google Scholar] [CrossRef]
- Gladwin, M.T.; Gwyther, R.L.; Hart, R.H.G.; Breckenridge, K.S. Measurements of the strain field associated with episodic creep events on the San Andreas fault at San Juan Bautista, California. J. Geophys. Res. Solid Earth 1994, 99, 4559–4565. [Google Scholar] [CrossRef]
- Linde, A.T.; Gladwin, M.T.; Johnston, M.J.S.; Gwyther, R.L.; Bilham, R.G. A slow earthquake sequence on the San Andreas fault. Nature 1996, 383, 65–68. [Google Scholar] [CrossRef]
- Langbein, J.; Gwyther, R.L.; Hart, R.H.G.; Gladwin, M.T. Slip-rate increase at Parkfield in 1993 detected by high-precision EDM and borehole tensor strainmeters. Geophys. Res. Lett. 1999, 26, 2529–2532. [Google Scholar] [CrossRef]
- Ouyang, Z.X.; Zhang, H.X.; Fu, Z.Z.; Gou, B.; Jiang, W.L. Abnormal phenomena recorded by several earthquake precursor observation instruments before the M(s) 8.0 Wenchuan, Sichuan earthquake. Acta Geol. Sin. Engl. Ed. 2009, 83, 834–844. [Google Scholar] [CrossRef]
- Smith, E.F.; Gomberg, J. A search in strainmeter data for slow slip associated with triggered and ambient tremor near Parkfield, California. J. Geophys. Res. Solid Earth 2009, 114, B00A14. [Google Scholar] [CrossRef] [Green Version]
- Hawthorne, J.C.; Rubin, A.M. Tidal modulation of slow slip in Cascadia. J. Geophys. Res. Solid Earth 2010, 115, B09406. [Google Scholar] [CrossRef]
- Agnew, D.C.; Wyatt, F.K. Dynamic strains at regional and teleseismic distances. Bull. Seismol. Soc. Am. 2014, 104, 1846–1859. [Google Scholar] [CrossRef]
- Barbour, A.J.; Crowell, B.W. Dynamic strains for earthquake source characterization. Seismol. Res. Lett. 2017, 88, 354–370. [Google Scholar] [CrossRef]
- Chi, S.L. Trial results of YRY-2 shallow borehole strainmeter at eight observation sites in North China. Earthq. Sci. 1993, 6, 731–737. [Google Scholar] [CrossRef]
- Gladwin, M.T. High-precision multi-component borehole deformation montoring. Rev. Sci. Instrum. 1984, 55, 2011–2016. [Google Scholar] [CrossRef]
- Gladwin, M.T.; Hart, R. Design parameters for borehole strain instrumentation. Pure Appl. Geophys. 1985, 123, 59–80. [Google Scholar] [CrossRef]
- John, L. Computer algorithm for analyzing and processing borehole strainmeter data. Comput. Geosci. 2010, 36, 611–619. [Google Scholar] [CrossRef]
- Langbein, J. Effect of error in theoretical earth tide on calibration of borehole strainmeters. Geophys. Res. Lett. 2010, 37, L21303. [Google Scholar] [CrossRef]
- Roeloffs, E. Tidal calibration of Plate Boundary Observatory borehole strainmeters: Roles of vertical and shear coupling. J. Geophys. Res. Solid Earth 2010, 115, B06405. [Google Scholar] [CrossRef]
- Hodgkinson, K.; Langbein, J.; Henderson, B.; Mencin, D.; Borsa, A. Tidal calibration of plate boundary observatory borehole strainmeters. J. Geophys. Res. Solid Earth 2013, 118, 447–458. [Google Scholar] [CrossRef]
- Langbein, J. Borehole strainmeter measurements spanning the 2014 Mw6.0 South Napa earthquake, California: The effect from instrument calibration. J. Geophys. Res. Solid Earth 2015, 120, 7190–7202. [Google Scholar] [CrossRef] [Green Version]
- Chi, S.L. China’s component borehole strainmeter network. Earthq. Sci. 2009, 6, 579–587. [Google Scholar] [CrossRef] [Green Version]
- Li, H.L.; Li, H. Status and Developments of Borehole Strain Observation in China. Acta Geol. Sin. 2010, 84, 895–900. [Google Scholar]
- Sato, T.; Harrison, J.C. Local effects on tidal strain measurements at Esashi, Japan. Geophys. J. Int. 1990, 102, 513–526. [Google Scholar] [CrossRef] [Green Version]
- Hart, R.H.G.; Gladwin, M.T.; Gwyther, R.L.; Agnew, D.C.; Wyatt, F.K. Tidal calibration of borehole strain meters: Removing the effects of small-scale inhomogeneity. J. Geophys. Res. Solid Earth 1996, 101, 25553–25571. [Google Scholar] [CrossRef]
- Sacks, I.S.; Snoke, J.A.; Evans, R.; King, G.; Beavan, J. Single-site phase velocity measurement. Geophys. J. R. Astron. Soc. 1976, 46, 253–258. [Google Scholar] [CrossRef] [Green Version]
- Barbour, A.J.; Agnew, D.C. Detection of seismic signals using seismometers and strainmeters. Bull. Seismol. Soc. Am. 2012, 102, 2484–2490. [Google Scholar] [CrossRef]
- Qiu, Z.H.; Chi, S.L.; Wang, Z.M.; Carpenter, S.; Tang, L.; Guo, Y.P.; Yang, G. The strain seismograms of P- and S-waves of a local event recorded by four-gauge borehole strainmeter. Earthq. Sci. 2015, 28, 209–214. [Google Scholar] [CrossRef] [Green Version]
- Currenti, G.; Zuccarello, L.; Bonaccorso, A.; Sicali, A. Borehole Volumetric Strainmeter Calibration From a Nearby Seismic Broadband Array at Etna Volcano. J. Geophys. Res. Solid Earth 2017, 122, 7729–7738. [Google Scholar] [CrossRef]
- Ishii, M.; Park, S. Near-surface compressional and shear wave speeds constrained by body-wave polarization analysis. Geophys. J. Int. 2018, 213, 1559–1571. [Google Scholar] [CrossRef]
- Zhang, K.; Tian, J.; Hu, Z. Theoretical frequency response bandwidth of empty borehole for the measurement of strain waves in borehole tensor strainmeters. Bull. Seismol. Soc. Am. 2019, 109, 2459–2469. [Google Scholar] [CrossRef]
- Pao, Y.-H.; Mow, C.-C. Diffraction of Elastic Waves and Dynamics Stress Concentrations; Crane Russak: New York, NY, USA, 1971. [Google Scholar]
- Cheng, D.X. Mechanical Design Handbook; Chemical Industry Press: Beijing, China, 2004. [Google Scholar]


| θ1(°) | E2 = 30 GPa, ν2 = 0.25, ρ2 = 2.4 g/cm3 | ||||||
|---|---|---|---|---|---|---|---|
| Zero Frequency Gain | Peak Value | f for Peak Value | Roll-off dB/dec | 1% Bandwidth | f for 1% Bandwidth | ||
| FV2 | 0 | 2.78 (3.00) | 3.05 (3.26) | 5543 (5121) | 7.33 (7.98) | 2.81 (3.03) | 1214 (1199) |
| 15 | 2.78 (3.00) | 3.06 (3.27) | 5598 (5173) | 6.95 (7.54) | 2.81 (3.03) | 1207 (1194) | |
| 30 | 2.78 (3.00) | 3.08 (3.28) | 5709 (5278) | 6.23 (6.71) | 2.81 (3.03) | 1194 (1185) | |
| 45 | 2.78 (3.00) | 3.09 (3.29) | 5765 (5331) | 5.89 (6.32) | 2.81 (3.03) | 1188 (1180) | |
| 60 | 2.78 (3.00) | 3.08 (3.28) | 5709 (5278) | 6.23 (6.71) | 2.81 (3.03) | 1194 (1185) | |
| 75 | 2.78 (3.00) | 3.06 (3.27) | 5598 (5173) | 6.95 (7.54) | 2.81 (3.03) | 1207 (1194) | |
| 90 | 2.78 (3.00) | 3.05 (3.26) | 5543 (5121) | 7.33 (7.98) | 2.81 (3.03) | 1214 (1199) | |
| FS | 0 | 2.90 (3.00) | 3.33 (3.33) | 3885 (3533) | 8.33 (8.42) | 2.95 (3.04) | 926 (905) |
| 15 | 2.51 (2.60) | 2.89 (2.88) | 3885 (3533) | 8.35 (8.43) | 2.53 (2.63) | 926 (905) | |
| 30 | 1.45 (1.50) | 1.67 (1.66) | 3885 (3533) | 8.40 (8.45) | 1.46 (1.53) | 926 (905) | |
| 45 | 0 (0) | 0 (0) | 0 (0) | 0 (0) | 0 (0) | 0 (0) | |
| 60 | 1.45 (1.50) | 1.67 (1.66) | 3885 (3533) | 8.30 (8.45) | 1.46 (1.52) | 926 (905) | |
| 75 | 2.51 (2.60) | 2.88 (2.88) | 3885 (3533) | 8.32 (8.43) | 2.54 (2.63) | 926 (905) | |
| 90 | 2.90 (3.00) | 3.33 (3.33) | 3885 (3533) | 8.33 (8.42) | 2.93 (3.04) | 926 (905) | |
| FV4 | 0 | 2.78 (3.00) | 3.07 (3.27) | 5654 (5226) | 6.59 (7.12) | 2.81 (3.03) | 1200 (1189) |
| 15 | 2.78 (3.00) | 3.07 (3.27) | 5654 (5226) | 6.59 (7.12) | 2.81 (3.03) | 1200 (1189) | |
| 30 | 2.78 (3.00) | 3.07 (3.27) | 5654 (5226) | 6.59 (7.12) | 2.81 (3.03) | 1200 (1189) | |
| 45 | 2.78 (3.00) | 3.07(3.27) | 5654 (5226) | 6.59 (7.12) | 2.81 (3.03) | 1200 (1189) | |
| 60 | 2.78 (3.00) | 3.07 (3.27) | 5654 (5226) | 6.59 (7.12) | 2.81 (3.03) | 1200 (1189) | |
| 75 | 2.78 (3.00) | 3.07 (3.27) | 5654 (5226) | 6.59 (7.12) | 2.81 (3.03) | 1200 (1189) | |
| 90 | 2.78 (3.00) | 3.07 (3.27) | 5654 (5226) | 6.59 (7.12) | 2.81 (3.03) | 1200 (1189) | |
| TV | 0 | 4.18 (4.50) | 4.60 (4.91) | 5654 (5226) | 6.59 (7.12) | 4.22 (4.55) | 1200 (1189) |
| 15 | 4.18 (4.50) | 4.60(4.91) | 5654 (5226) | 6.59 (7.11) | 4.22 (4.55) | 1200 (1189) | |
| 30 | 4.18 (4.50) | 4.60 (4.91) | 5654 (5226) | 6.59 (7.12) | 4.22 (4.55) | 1200 (1189) | |
| 45 | 4.18 (4.50) | 4.60 (4.91) | 5654 (5226) | 6.59 (7.13) | 4.22 (4.55) | 1200 (1189) | |
| 60 | 4.18 (4.50) | 4.60 (4.91) | 5654 (5226) | 6.59 (7.12) | 4.22 (4.55) | 1200 (1189) | |
| 75 | 4.18 (4.50) | 4.60 (4.91) | 5654 (5226) | 6.59 (7.11) | 4.22 (4.55) | 1200 (1189) | |
| 90 | 4.18 (4.50) | 4.60 (4.91) | 5654 (5226) | 6.59 (7.12) | 4.22 (4.55) | 1200 (1189) | |
| TS | 0 | 0 (0) | 0 (0) | 0 (0) | 0 (0) | 0 (0) | 0 (0) |
| 15 | 1.26 (1.30) | 1.45 (1.44) | 3605 (3578) | 6.91 (6.79) | 1.27 (1.32) | 919 (901) | |
| 30 | 2.17 (2.25) | 2.51 (2.50) | 3884 (3559) | 7.49 (7.44) | 2.20 (2.28) | 922 (903) | |
| 45 | 2.51 (2.60) | 2.89 (2.88) | 3856 (3533) | 8.33 (8.43) | 2.54 (2.63) | 926 (905) | |
| 60 | 2.17 (2.25) | 2.51 (2.49) | 3884 (3507) | 7.49 (9.56) | 2.20 (2.28) | 931 (908) | |
| 75 | 1.26 (1.30) | 1.45 (1.44) | 3605 (3488) | 6.91 (10.48) | 1.27 (1.32) | 934 (909) | |
| 90 | 0 (0) | 0 (0) | 0 (0) | 0 (0) | 0 (0) | 0 (0) | |
| θ1(°) | E2 = 30 GPa, ν2 = 0.25, ρ2 = 2.4 g/cm3 | ||||
|---|---|---|---|---|---|
| Zero Frequency Gain | Peak Value (E2-) E2 (E2+) | f for Peak Value (E2-) E2 (E2+) | abs(max) E2-(E2+) | ||
| FV2 | 0 | (2.85) 2.78 (2.70) | (3.15) 3.05 (2.94) | (5571) 5543 (5529) | 0.102 (0.115) |
| 15 | (2.85) 2.78 (2.70) | (3.16) 3.06 (2.95) | (5622) 5598 (5590) | 0.103 (0.115) | |
| 30 | (2.85) 2.78 (2.70) | (3.18) 3.08 (2.96) | (5724) 5709 (5712) | 0.104 (0.116) | |
| 45 | (2.85) 2.78 (2.70) | (3.19) 3.09 (2.97) | (5776) 5765 (5774) | 0.104 (0.116) | |
| 60 | (2.85) 2.78 (2.70) | (3.18) 3.08 (2.96) | (5274) 5709 (5712) | 0.104 (0.116) | |
| 75 | (2.85) 2.78 (2.70) | (3.16) 3.06 (2.95) | (5622) 5598 (5590) | 0.103 (0.115) | |
| 90 | (2.85) 2.78 (2.70) | (3.15) 3.05 (2.94) | (5571) 5543 (5529) | 0.102 (0.115) | |
| FS | 0 | (3.00) 2.90 (2.83) | (3.37) 3.23 (3.13) | (3823) 3855 (3897) | 0.137 (0.096) |
| 15 | (2.60) 2.51 (2.45) | (2.92) 2.80 (2.71) | (3823) 3855 (3897) | 0.119 (0.084) | |
| 30 | (1.50) 1.45 (1.41) | (1.68) 1.62 (1.57) | (3823) 3855 (3896) | 0.068 (0.048) | |
| 45 | (0) 0 (0) | (0) 0 (0) | (0) 0 (0) | (0) 0 (0) | |
| 60 | (1.50) 1.45 (1.41) | (1.68) 1.62 (1.57) | (3823) 3855 (3897) | 0.068 (0.048) | |
| 75 | (2.60) 2.51 (2.45) | (2.92) 2.80 (2.71) | (3823) 3855 (3897) | 0.119 (0.084) | |
| 90 | (3.00) 2.90 (2.83) | (3.17) 3.23 (3.13) | (3823) 3855 (3897) | 0.137 (0.096) | |
| FV4 | 0 | (2.85) 2.78 (2.70) | (3.17) 3.07 (2.95) | (5673) 5654 (5651) | 0.103 (0.115) |
| 15 | (2.85) 2 78 (2.70) | (3.17) 3.07 (2.95) | (5673) 5654 (5651) | 0.103 (0.115) | |
| 30 | (2.85) 2. 78 (2.70) | (3.17) 3.07 (2.95) | (5673) 5654 (5651) | 0.103 (0.115) | |
| 45 | (2.85) 2. 78 (2.70) | (3.17) 3.07 (2.95) | (5673) 5654 (5651) | 0.103 (0.115) | |
| 60 | (2.85) 2. 78 (2.70) | (3.17) 3.07 (2.95) | (5673) 5654 (5651) | 0.103 (0.115) | |
| 75 | (2.85) 2. 78 (2.70) | (3.17) 3.07 (2.95) | (5673) 5654 (5651) | 0.103 (0.115) | |
| 90 | (2.85) 2. 78 (2.70) | (3.17) 3.07 (2.95) | (5673) 5654 (5651) | 0.103 (0.115) | |
| TV | 0 | (4.27) 4.18 (4.18) | (4.76) 4.60 (4.43) | (5673) 5654 (5651) | 0.155 (0.173) |
| 15 | (4.27) 4.18 (4.18) | (4.76) 4.60 (4.43) | (5673) 5654 (5651) | 0.155 (0.173) | |
| 30 | (4.27) 4.18 (4.06) | (4.76) 4.60 (4.43) | (5673) 5654 (5651) | 0.155 (0.173) | |
| 45 | (4.27) 4.18 (4.06) | (4.76) 4.60 (4.43) | (5673) 5654 (5651) | 0.155 (0.173) | |
| 60 | (4.27) 4.18 (4.06) | (4.76) 4.60 (4.43) | (5673) 5654 (5651) | 0.155 (0.173) | |
| 75 | (4.27) 4.18 (4.06) | (4.76) 4.60 (4.43) | (5673) 5654 (5651) | 0.155 (0.173) | |
| 90 | (4.27) 4.18 (4.06) | (4.76) 4.60 (4.43) | (5673) 5654 (5651) | 0.155 (0.173) | |
| TS | 0 | (0) 0 (0) | (0) 0 (0) | (0) 0 (0) | (0) 0 (0) |
| 15 | (1.30) 1.26 (1.22) | (1.46) 1.40 (1.36) | (3870) 3905 (3950) | 0.060 (0.042) | |
| 30 | (2.25) 2.17 (2.12) | (2.53) 2.43 (2.36) | (3850) 3884 (3927) | 0.103 (0.073) | |
| 45 | (2.60) 2.51 (2.45) | (2.92) 2.80 (2.71) | (3823) 3855 (3897) | 0.119 (0.084) | |
| 60 | (2.25) 2.17 (2.12) | (2.52) 2.43 (2.35) | (3796) 3826 (3866) | 0.102 (0.072) | |
| 75 | (1.30) 1.25 (1.22) | (1.45) 1.40 (1.35) | (3777) 3806 (3844) | 0.059 (0.042) | |
| 90 | (0) 0 (0) | (0) 0 (0) | (0) 0 (0) | (0) 0 (0) | |
| θ1(°) | E2 = 30 GPa, ν2 = 0.25, ρ2 = 2.4 g/cm3 | ||||
|---|---|---|---|---|---|
| Zero Frequency Gain | Peak Value (ν2-) ν2 (ν2+) | f for Peak Value (ν2-) ν2 (ν2+) | abs(max) ν2-(ν2+) | ||
| FV2 | 0 | (2.74) 2.78 (2.85) | (3.00) 3.05 (2.94) | (5484) 5543 (5619) | 0.064 (0.087) |
| 15 | (2.74) 2.78 (2.85) | (3.01) 3.06 (2.95) | (5537) 5598 (5678) | 0.064 (0.087) | |
| 30 | (2.74) 2.78 (2.85) | (3.03) 3.08 (2.96) | (5645) 5709 (5794) | 0.064 (0.087) | |
| 45 | (2.74) 2.78 (2.85) | (3.03) 3.09 (2.97) | (5699) 5765 (5853) | 0.064 (0.087) | |
| 60 | (2.74) 2.78 (2.85) | (3.03) 3.08 (2.96) | (5645) 5709 (5794) | 0.064 (0.087) | |
| 75 | (2.74) 2.78 (2.85) | (3.01) 3.0 6(2.95) | (5537) 5598 (5678) | 0.064 (0.087) | |
| 90 | (2.74) 2.78 (2.85) | (3.00) 3.05 (2.94) | (5484) 5543 (5619) | 0.064 (0.087) | |
| FS | 0 | (2.96) 2.90 (2.81) | (3.30) 3.23 (3.13) | (3882) 3855 (3818) | 0.075 (0.106) |
| 15 | (2.56) 2.51 (2.44) | (2.86) 2.80 (2.71) | (3882) 3855 (3817) | 0.065 (0.091) | |
| 30 | (1.48) 1.45 (1.41) | (1.65) 1.62( 1.57) | (3881) 3855 (3818) | 0.038 (0.053) | |
| 45 | (0) 0 (0) | (0) 0 (0) | (0) 0 (0) | (0) 0 (0) | |
| 60 | (1.48) 1.45 (1.41) | (1.65) 1.62 (1.57) | (3882) 3855 (3818) | 0.038 (0.053) | |
| 75 | (2.56) 2.51 (2.44) | (2.86) 2.80 (2.71) | (3881) 3855 (3818) | 0.065 (0.091) | |
| 90 | (2.96) 2.90 (2.81) | (3.30) 3.23 (3.13) | (3882) 3855 (3818) | 0.075 (0.106) | |
| FV4 | 0 | (2.74) 2.78 (2.85) | (3.02) 3.07 (2.95) | (5591) 5654 (5736) | 0.064 (0.087) |
| 15 | (2.74) 2.78 (2.85) | (3.02) 3.07 (2.95) | (5591) 5654 (5736) | 0.064 (0.087) | |
| 30 | (2.74) 2.78 (2.85) | (3.02) 3.07 (2.95) | (5591) 5654 (5736) | 0.064 (0.087) | |
| 45 | (2.74) 2.78(2.85) | (3.02) 3.07 (2.95) | (5591) 5654 (5736) | 0.064 (0.087) | |
| 60 | (2.74) 2.78 (2.85) | (3.02) 3.07 (2.95) | (5591) 5654 (5736) | 0.064 (0.087) | |
| 75 | (2.74) 2.78 (2.85) | (3.02) 3.07 (2.95) | (5591) 5654 (5736) | 0.064 (0.087) | |
| 90 | (2.74) 2.78 (2.85) | (3.02) 3.07 (2.95) | (5591) 5654 (5736) | 0.064 (0.087) | |
| TV | 0 | (4.11) 4.18 (4.28) | (4.53) 4.60 (4.43) | (5591) 5654 (5736) | 0.096 (0.130) |
| 15 | (4.11) 4.18 (4.28) | (4.53) 4.60 (4.43) | (5591) 5654 (5736) | 0.096 (0.130) | |
| 30 | (4.11) 4.18 (4.28) | (4.53) 4.60 (4.43) | (5591) 5654 (5736) | 0.096 (0.130) | |
| 45 | (4.11) 4.18 (4.28) | (4.53) 4.60 (4.43) | (5591) 5654 (5736) | 0.096 (0.130) | |
| 60 | (4.11) 4.18 (4.28) | (4.53) 4.60 (4.43) | (5591) 5654 (5736) | 0.096 (0.130) | |
| 75 | (4.11) 4.18 (4.28) | (4.53) 4.60 (4.43) | (5591) 5654 (5736) | 0.096 (0.130)) | |
| 90 | (4.11) 4.18 (4.28) | (4.53) 4.60 (4.43) | (5591) 5654 (5736) | 0.096 (0.130) | |
| TS | 0 | (0 )0 (0) | (0) 0 (0) | (0) 0 (0) | (0) 0 (0) |
| 15 | (1.28) 1.26 (1.22) | (1.44) 1.40 (1.36) | (3930) 3905 (3869) | 0.033 (0.046) | |
| 30 | (2.22) 2.17 (2.11) | (2.48) 2.43 (2.36) | (3910) 3884 (3848) | 0.057 (0.079) | |
| 45 | (2.56) 2.51 (2.44) | (2.86) 2.80 (2.71) | (3882) 3855 (3817) | 0.065 (0.091) | |
| 60 | (2.22) 2.17 (2.11) | (2.47) 2.43 (2.35) | (3854) 3826 (3848) | 0.056 (0.079) | |
| 75 | (1.28) 1.25 (1.22) | (1.43) 1.40 (1.35) | (3833) 3806 (3869) | 0.033 (0.046) | |
| 90 | (0) 0 (0) | (0) 0 (0) | (0) 0 (0) | (0) 0 (0) | |
| θ1(°) | E2 = 30 GPa, ν2 = 0.25, ρ2 = 2.4 g/cm3 | ||||
|---|---|---|---|---|---|
| Zero Frequency Gain | Peak Value (ρ2-) ρ2 (ρ2+) | f for Peak Value (ρ2-) ρ2 (ρ2+) | abs(max) ρ2-(ρ2+) | ||
| FV2 | 0 | (2.78) 2.78 (2.78) | (3.01) 3.05 (3.11) | (5174) 5543 (5906) | 0.089 (0.092) |
| 15 | (2.78) 2.78 (2.78) | (3.01) 3.06 (3.11) | (5230) 5598 (5959) | 0.089 (0.092) | |
| 30 | (2.78) 2.78 (2.78) | (3.03) 3.08 (3.13) | (5342) 5709 (6067) | 0.089 (0.092) | |
| 45 | (2.78) 2.78 (2.78) | (3.03) 3.09 (3.14) | (5399) 5765 (6121) | 0.089 (0.092) | |
| 60 | (2.78) 2.78 (2.78) | (3.03) 3.08 (3.13) | (5342) 5709 (6067) | 0.089 (0.092) | |
| 75 | (2.78) 2.78 (2.78) | (3.01) 3.06 (3.11) | (5230) 5598 (5959) | 0.089 (0.092) | |
| 90 | (2.78) 2.78 (2.78) | (3.01) 3.05 (3.11) | (5174) 5543 (5906) | 0.089 (0.092) | |
| FS | 0 | (2.90) 2.90 (2.90) | (3.19) 3.23 (3.28) | (3659) 3855 (4046) | 0.079 (0.081) |
| 15 | (2.51) 2.51 (2.51) | (2.76) 2.80 (2.84) | (3659) 3855 (4046) | 0.069 (0.070) | |
| 30 | (1.46) 1.45 (1.45) | (1.59) 1.62 (1.64) | (3659) 3855 (4046) | 0.040 (0.041) | |
| 45 | (0) 0 (0) | (0) 0 (0) | (0) 0 (0) | (0) 0 (0) | |
| 60 | (1.44) 1.45 (1.45) | (1.59) 1.62 (1.64) | (3659) 3855 (4046) | 0.040 (0.041) | |
| 75 | (2.51) 2.51 (2.51) | (2.76) 2.80 (2.84) | (3659) 3855 (4046) | 0.069 (0.070) | |
| 90 | (2.90) 2.90 (2.90) | (3.19) 3.23 (3.28) | (3659) 3855 (4046) | 0.079 (0.081) | |
| FV4 | 0 | (2.78) 2.78 (2.78) | (3.02) 3.07 (3.12) | (5286) 5654 (6013) | 0.089 (0.092) |
| 15 | (2.78) 2.78 (2.78) | (3.02) 3.07 (3.12) | (5286) 5654 (6013) | 0.089 (0.092) | |
| 30 | (2.78) 2.78 (2.78) | (3.02) 3.07 (3.12) | (5286) 5654 (6013) | 0.089 (0.092) | |
| 45 | (2.78) 2.78 (2.78) | (3.02) 3.07 (3.12) | (5286) 5654 (6013) | 0.089 (0.092) | |
| 60 | (2.78) 2.78 (2.78) | (3.02) 3.07 (3.12) | (5286) 5654 (6013) | 0.089 (0.092) | |
| 75 | (2.78) 2.78 (2.78) | (3.02) 3.07 (3.12) | (5286) 5654 (6013) | 0.089 (0.092) | |
| 90 | (2.78) 2.78 (2.78) | (3.02) 3.07 (3.12) | (5286) 5654 (6013) | 0.089 (0.092) | |
| TV | 0 | (4.18) 4.18 (4.18) | (4.53) 4.60 (4.68) | (5286) 5654 (6014) | 0.096 (0.130) |
| 15 | (4.18) 4.18 (4.18) | (4.53) 4.60 (4.68) | (5286) 5654 (6013) | 0.096 (0.130) | |
| 30 | (4.18) 4.18 (4.06) | (4.53) 4.60 (4.68) | (5286) 5654 (6013) | 0.096 (0.130) | |
| 45 | (4.18) 4.18 (4.06) | (4.53) 4.60 (4.68) | (5286) 5654 (6013) | 0.096 (0.130) | |
| 60 | (4.18) 4.18 (4.06) | (4.53) 4.60 (4.68) | (5286) 5654 (6014) | 0.096 (0.130) | |
| 75 | (4.18) 4.18 (4.06) | (4.53) 4.60 (4.68) | (5286) 5654 (6013) | 0.096 (0.130)) | |
| 90 | (4.18) 4.18 (4.06) | (4.53) 4.60 (4.68) | (5286) 5654 (6013) | 0.096( 0.130) | |
| TS | 0 | (0) 0 (0) | (0) 0 (0) | (0) 0 (0) | (0) 0 (0) |
| 15 | (1.25) 1.26 (1.26) | (1.38) 1.40 (1.43) | (3710) 3905 (4094) | 0.034 (0.035) | |
| 30 | (2.17) 2.17 (2.17) | (2.39) 2.43 (2.47) | (3688) 3884 (4074) | 0.059 (0.061) | |
| 45 | (2.51) 2.51 (2.51) | (2.76) 2.80 (2.84) | (3659) 3855 (4046) | 0.069 (0.070) | |
| 60 | (2.18) 2.17 (2.17) | (2.38) 2.43 (2.46) | (3629) 3826 (4019) | 0.060 (0.061) | |
| 75 | (1.26) 1.25 (1.25) | (1.37) 1.40 (1.42) | (3608) 3806 (3998) | 0.034 (0.035) | |
| 90 | (0)0(0) | (0) 0 (0) | (0) 0 (0) | (0) 0 (0) | |
| θ1(°) | E2 = 30 GPa, ν2 = 0.25, ρ2 = 2.4 g/cm3 | ||||||
|---|---|---|---|---|---|---|---|
| Zero Frequency Gain | Peak Value | f for Peak Value | Roll-off dB/dec | 1% Bandwidth | f for 1% Bandwidth | ||
| FS | 0 | 0 (0) | 0 (0) | 0 (0) | 0 (0) | 0 (0) | 0 (0) |
| 15 | 2.90 (3.00) | 3.20 (3.29) | 3718 (3400) | 7.75 (8.26) | 2.93 (3.03) | 748 (723) | |
| 30 | 5.02 (5.20) | 5.55 (5.71) | 3718 (3399) | 7.79 (8.28) | 5.07 (5.25) | 748 (723) | |
| 45 | 5.80 (6.00) | 6.40 (6.59) | 3718 (3399) | 7.81 (8.30) | 5.86 (6.07) | 748 (723) | |
| 60 | 5.02 (5.20) | 5.55 (5.71) | 3718 (3399) | 7.80 (8.28) | 5.07 (5.25) | 748 (723) | |
| 75 | 2.90 (3.00) | 3.20 (3.29) | 3718 (3400) | 7.79 (8.26) | 2.93 (3.03) | 747 (723) | |
| 90 | (0) | 0 (0) | 0 (0) | 0 (0) | 0 (0) | 0 (0) | |
| TS | 0 | 5.02 (5.20) | 5.58 (5.74) | 3801 (3476) | 7.19 (7.47) | 5.07 (5.26) | 749 (716) |
| 15 | 4.35 (4.50) | 4.82 (4.96) | 3766 (3443) | 7.45 (7.81) | 4.39 (4.55) | 748 (719) | |
| 30 | 2.51 (2.60) | 2.76 (2.84) | 3635 (3323) | 8.42 (9.13) | 2.5 4(2.63) | 747 (730) | |
| 45 | 0 (0) | 0 (0) | 0 (0) | 0 (0) | 0 (0) | 0 (0) | |
| 60 | 2.51 (2.60) | 2.79 (2.87) | 3801 (3476) | 7.17 (7.47) | 2.54 (2.63) | 749 (716) | |
| 75 | 4.35 (4.50) | 4.79 (4.93) | 3670 (3355) | 8.14 (8.77) | 4.39 (4.55) | 748 (727) | |
| 90 | 5.02 (5.20) | 5.51 (5.67) | 3635 (3323) | 8.40 (9.13) | 5.07 (5.25) | 747 (730) | |
| θ1(°) | E2 = 30 GPa, ν2 = 0.25, ρ2 = 2.4 g/cm3 | ||||
|---|---|---|---|---|---|
| Zero Frequency Gain | Peak Value (E2-)E2( E2+) | f for Max (E2-)E2( E2+) | abs(max) E2-( E2+) | ||
| FS | 0 | (0) 0 (0) | (0) 0 (0) | (0) 0 (0) | 0 (0) |
| 15 | (3.00) 2.90 (2.83) | (3.34) 3.20 (3.11) | (3687) 3718 (3760) | 0.468 (0.339) | |
| 30 | (5.20) 5.02 (4.90) | (5.78) 5.55 (5.38) | (3687) 3718 (3759) | 0.811 (0.586) | |
| 45 | (6.00) 5.80 (5.66) | (6.67) 6.40 (6.22) | (3687) 3718 (3759) | 0.963 (0.677) | |
| 60 | (5.20) 5.02 (4.90) | (5.78) 5.55 (5.38) | (3687) 3718 (3759) | 0.811 (0.568) | |
| 75 | (3.00) 2.90 (2.83) | (3.34) 3.20 (3.11) | (3687) 3718 (3759) | 0.468 (0.339) | |
| 90 | (0) 0 (0) | (0) 0 (0) | (0) 0 (0) | 0 (0) | |
| TS | 0 | (5.20) 5.02 (4.90) | (5.81) 5.58 (5.42) | (3765) 3801 (3849) | 0.811 (0.586) |
| 15 | (4.50) 4.35 (4.24) | (5.02) 4.82 (4.68) | (3731) 3766 (3811) | 0.702 (0.508) | |
| 30 | (2.60) 2.51 (2.45) | (2.87) 2.76 (2.68) | (3609) 3635 (3670) | 0.405 (0.293) | |
| 45 | (0) 0 (0) | (0) 0 (0) | (0) 0 (0) | 0 (0) | |
| 60 | (2.60) 2.51 (2.45) | (2.91) 2.79 (2.71) | (3765) 3801 (3849) | 0.405 (0.293) | |
| 75 | (4.50) 4.35 (4.24) | (4.99) 4.79 (4.65) | (3642) 3670 (3708) | 0.702 (0.508) | |
| 90 | (5.20) 5.02 (4.90) | (5.74) 5.51 (5.35) | (3610) 3635 (3670) | 0.811 (0.586) | |
| θ1(°) | E2 = 30 GPa, ν2 = 0.25, ρ2 = 2.4 g/cm3 | ||||
|---|---|---|---|---|---|
| Zero Frequency Gain | Peak Value (ν2-) ν2 (ν2+) | f for Max (ν2-) ν2 (ν2+) | abs(max) ν2-(ν2+) | ||
| FS | 0 | (0) 0 (0) | (0) 0 (0) | (0) 0 (0) | 0 (0) |
| 15 | (2.96) 2.90 (2.82) | (3.25) 3.20 (3.16) | (3624) 3718 (3938) | 0.192 (0.185) | |
| 30 | (5.12) 5.02 (4.88) | (5.62) 5.55 (5.48) | (3624) 3718 (3937) | 0.332 (0.321) | |
| 45 | (5.92) 5.80 (5.63) | (6.49) 6.40 (6.32) | (3624) 3718 (3937) | 0.384 (0.370) | |
| 60 | (5.12) 5.02 (4.88) | (5.62) 5.55 (5.48) | (3624) 3718 (3937) | 0.332 (0.321) | |
| 75 | (2.96) 2.90 (2.82) | (3.25) 3.20 (3.16) | (3623) 3718 (3937) | 0.192 (0.185) | |
| 90 | (0) 0 (0) | (0) 0 (0) | (0) 0 (0) | 0 (0) | |
| TS | 0 | (5.12) 5.02 (4.88) | (5.66) 5.58 (5.51) | (3707) 3801 (4020) | 0.332 (0.321) |
| 15 | (4.44) 4.35 (4.22) | (4.89) 4.82 (4.76) | (3671) 3766 (3890) | 0.288 (0.278) | |
| 30 | (2.56) 2.51 (2.44) | (2.80) 2.76 (2.72) | (3542) 3635 (3855) | 0.166 (0.160) | |
| 45 | (0) 0 (0) | (0) 0 (0) | (0) 0 (0) | 0 (0) | |
| 60 | (2.56) 2.51 (2.44) | (2.83 )2.79 (2.76) | (3707) 3801 (4020) | 0.166 (0.160) | |
| 75 | (4.44) 4.35 (4.22) | (4.85) 4.79 (4.72) | (3576) 3670 (3890) | 0.288 (0.278) | |
| 90 | (5.12) 5.02 (4.88) | (5.59) 5.51 (5.44) | (3541) 3635 (3855) | 0.332 (0.321) | |
| θ1(°) | E2 = 30 GPa, ν2 = 0.25, ρ2 = 2.4 g/cm3 | ||||
|---|---|---|---|---|---|
| Zero Frequency Gain | Peak Value (ρ2-) ρ2 (ρ2+) | f for Max (ρ2-) ρ2 (ρ2+) | abs(max) ρ2-(ρ2+) | ||
| FS | 0 | (0) 0 (0) | (0) 0 (0) | (0) 0 (0) | 0 (0) |
| 15 | (2.90) 2.90 (2.90) | (3.16) 3.20 (3.25) | (3526) 3718 (3906) | 0.075 (0.077) | |
| 30 | (5.02) 5.02 (5.02) | (5.47) 5.55 (5.63) | (3526) 3718 (3906) | 0.130 (0.134) | |
| 45 | (5.80) 5.80 (5.80) | (6.32) 6.40 (6.50) | (3525) 3718 (3906) | 0.151 (0.154) | |
| 60 | (5.02) 5.02 (5.02) | (5.47) 5.55 (5.63) | (3525) 3718 (3906) | 0.130 (0.134) | |
| 75 | (2.90) 2.90 (2.90) | (3.16) 3.2 0(3.25) | (3525) 3718 (3905) | 0.075 (0.077) | |
| 90 | (0) 0 (0) | (0) 0 (0) | (0) 0 (0) | 0 (0) | |
| TS | 0 | (5.02) 5.02 (5.02) | (5.58) 5.58 (5.66) | (3801) 3801 (3986) | 0.130 (0.133) |
| 15 | (4.35) 4.35 (4.35) | (4.82) 4.82 (4.89) | (3766) 3766 (3952) | 0.113 (0.116) | |
| 30 | (2.51) 2.51 (2.51) | (2.76) 2.76 (2.80) | (3635) 3635 (3826) | 0.065 (0.067) | |
| 45 | (0) 0 (0) | (0) 0 (0) | (0) 0 (0) | 0 (0) | |
| 60 | (2.51) 2.51 (2.51) | (2.79) 2.79 (2.83) | (3801) 3801 (3986) | 0.065 (0.067) | |
| 75 | (4.35) 4.35 (4.35) | (4.79) 4.79 (4.85) | (3670) 3670 (3860) | 0.113 (0.116) | |
| 90 | (5.02) 5.02 (5.02) | (5.51) 5.51 (5.59) | (3635) 3635 (3826) | 0.131 (0.134) | |
| Wave Types | Bandwidth of Gauge Combinations | E2 (20 GPa~40 GPa) | ν2 (0.15~0.35) | ρ2 (1.6 g/cm3~3.2 g/cm3) |
|---|---|---|---|---|
| P wave | 1% bandwidth of FV2(Hz) | 923~1029 | 1019~1068 | 796~912 |
| 1% bandwidth of FS(Hz) | 619~649 | 708~715 | 643~705 | |
| 1% bandwidth of FV4(Hz) | 916~1018 | 1008~1056 | 797~907 | |
| 1% bandwidth of TV(Hz) | 916~1018 | 1008~1056 | 979~907 | |
| 1% bandwidth of TS(Hz) | 689~732 | 808~713 | 641~705 | |
| S wave | 1% bandwidth of FS(Hz) | 599~605 | 691~701 | 515~586 |
| 1% bandwidth of TS(Hz) | 599~606 | 641~703 | 517~586 |
© 2020 by the authors. Licensee MDPI, Basel, Switzerland. This article is an open access article distributed under the terms and conditions of the Creative Commons Attribution (CC BY) license (http://creativecommons.org/licenses/by/4.0/).
Share and Cite
Zhang, K.; Tian, J.; Hu, Z. The Influence of the Expansive Grout on Theoretical Bandwidth for the Measurement of Strain Waves by Borehole Tensor Strainmeters. Appl. Sci. 2020, 10, 3199. https://0-doi-org.brum.beds.ac.uk/10.3390/app10093199
Zhang K, Tian J, Hu Z. The Influence of the Expansive Grout on Theoretical Bandwidth for the Measurement of Strain Waves by Borehole Tensor Strainmeters. Applied Sciences. 2020; 10(9):3199. https://0-doi-org.brum.beds.ac.uk/10.3390/app10093199
Chicago/Turabian StyleZhang, Kanghua, Jiayong Tian, and Zhifei Hu. 2020. "The Influence of the Expansive Grout on Theoretical Bandwidth for the Measurement of Strain Waves by Borehole Tensor Strainmeters" Applied Sciences 10, no. 9: 3199. https://0-doi-org.brum.beds.ac.uk/10.3390/app10093199