Resazurin-Based Assay for Quantifying Living Cells during Alkaline Phosphatase (ALP) Release

Sensing & Separation Group, Tyndall National Institute, School of Chemistry and life Science Interface, University College Cork, T12R5CP Cork, Ireland
*
Author to whom correspondence should be addressed.
Appl. Sci. 2020, 10(11), 3840; https://0-doi-org.brum.beds.ac.uk/10.3390/app10113840
Submission received: 31 March 2020
/
Revised: 5 May 2020
/
Accepted: 29 May 2020
/
Published: 31 May 2020
(This article belongs to the Section Applied Biosciences and Bioengineering)
Abstract
:Alkaline phosphatase (ALP) is an important reporter gene in the gene expression system, therefore monitoring cellular behavior including cell viability during ALP release is of significance. This assay produced a quantitative resazurin-based assay for cell viability in embryonic and cancer cells during alkaline phosphatase (ALP) release. A post-confluence culture method was applied to induce ALP in the cells of Balb/c 3T3, A549, MCF-7, and Ht-29. The density of each cell type was optimized using the standard cell culture assay. The main parameters affecting the results of resazurin involve the concentration of resazurin, incubation time, and cell number. The redox reaction, in which resazurin is reduced by the cells, was measured by fluorescence at 544 nm and 590 nm. The obtained data were compared with the hemocytometer assay. ALP release was determined using the optical active substrate p-nitrophenyl phosphate and colorimetric assay.
1. Introduction
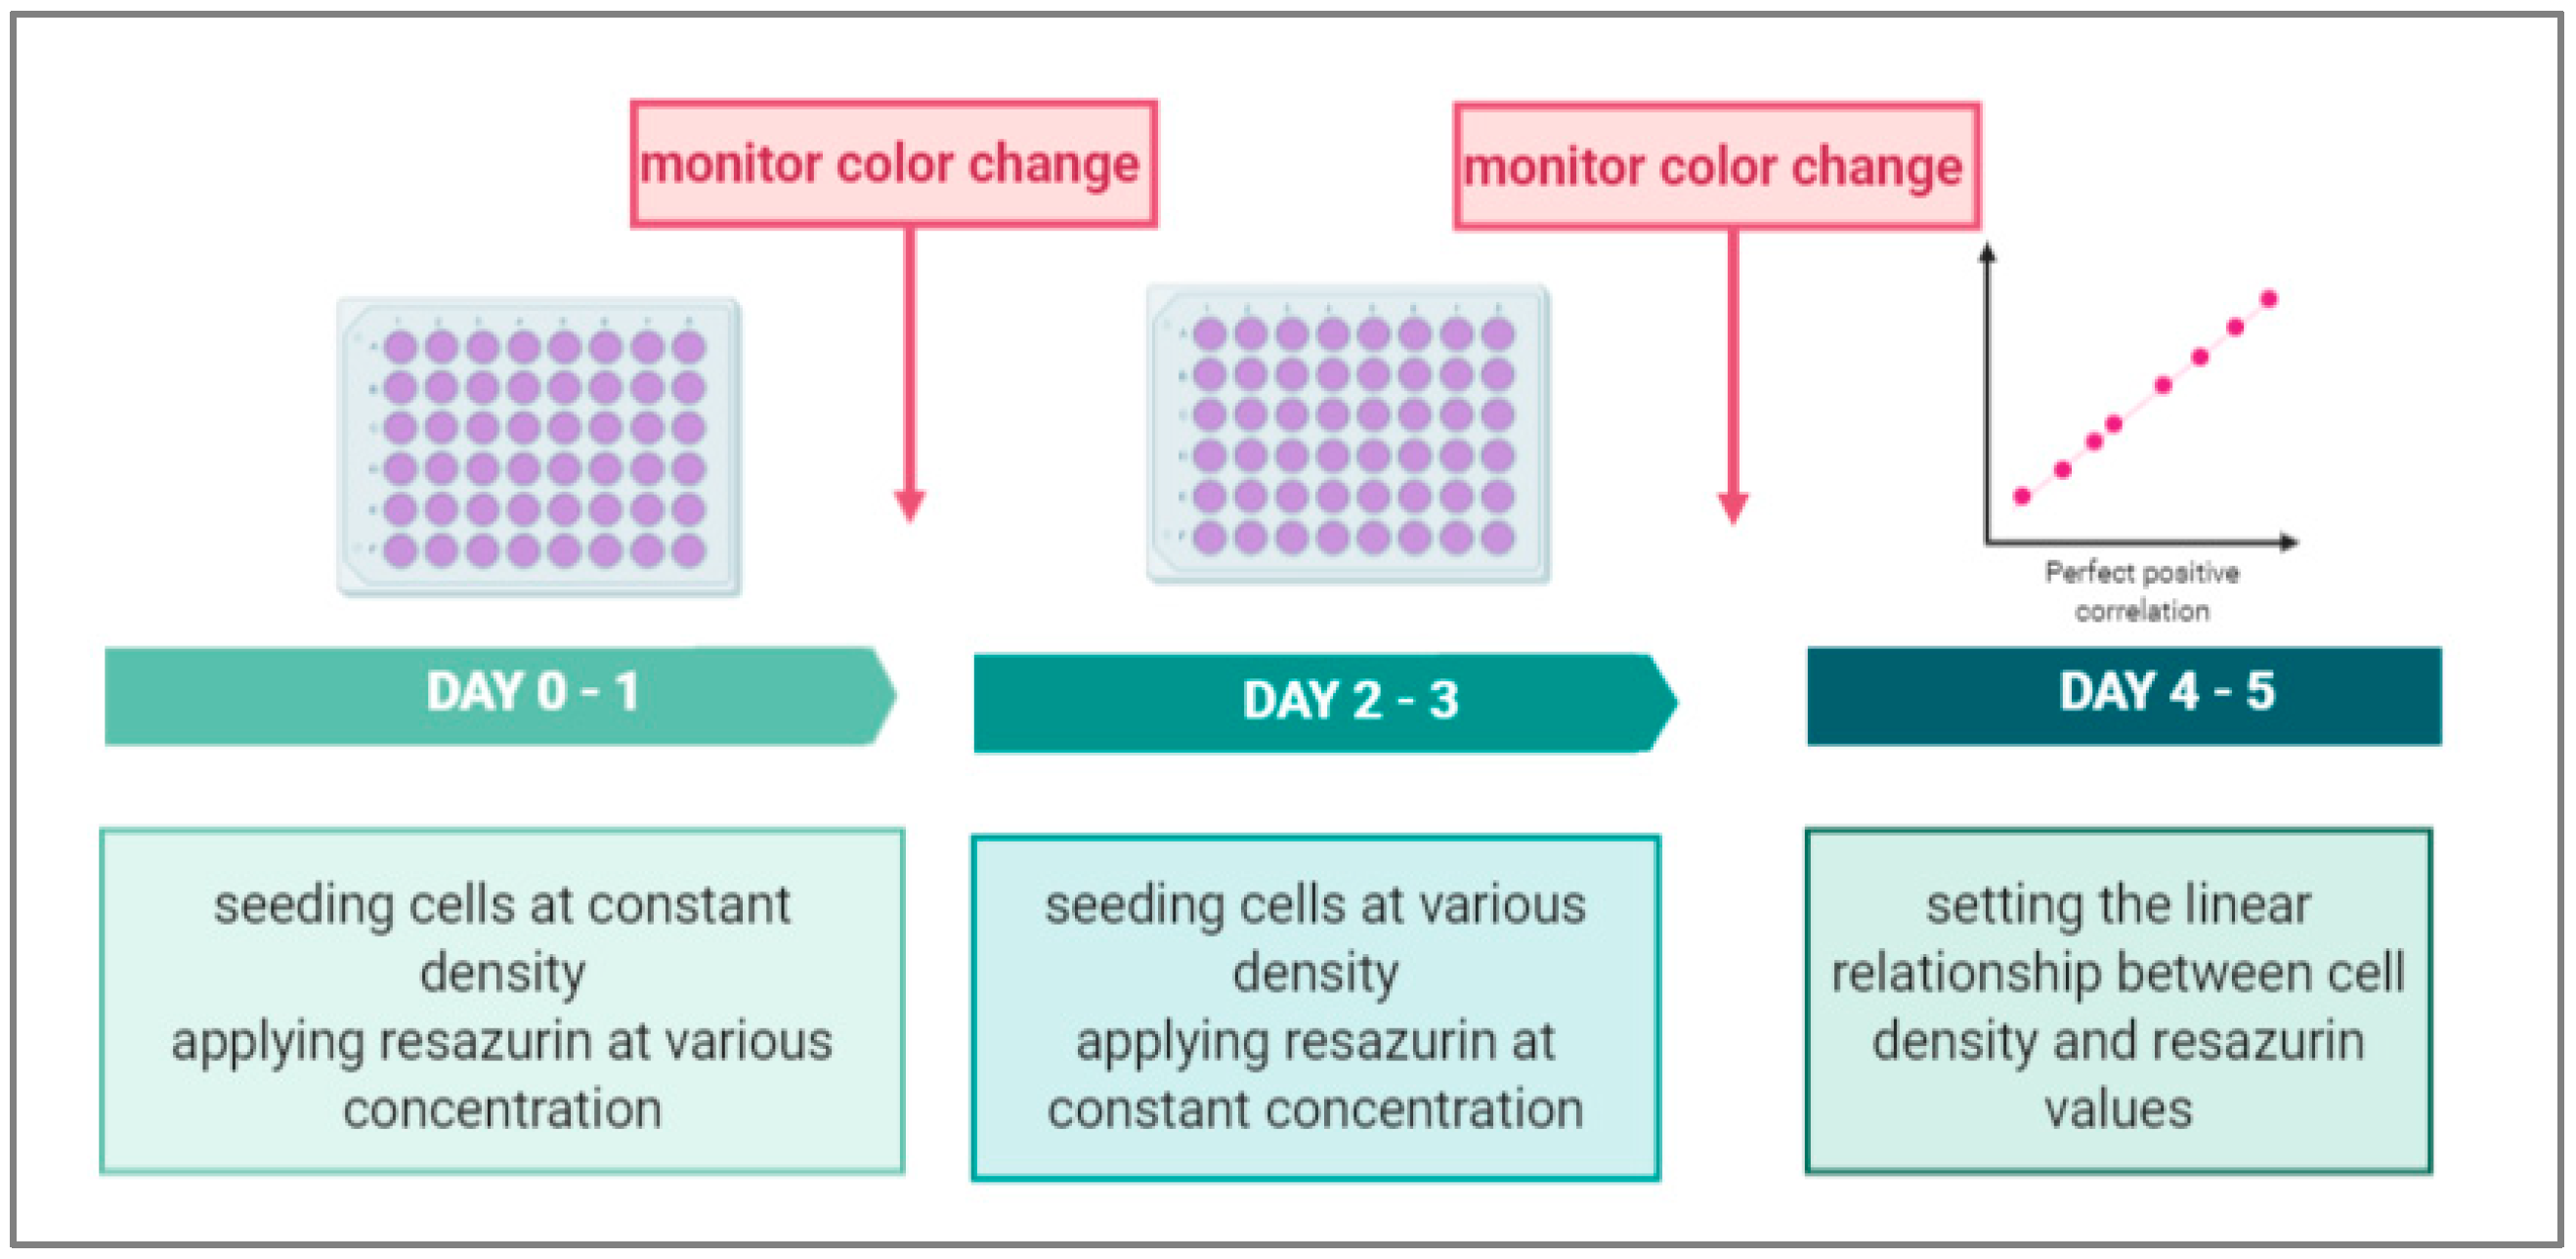
Biomedical studies use cell adhesion approaches in their applications (e.g., on sensors or on lab-on-a-chip [1,2]). Simplifying the determination of cell viability on these applications is important. The common membrane integrity assay [3] that is used widely requires cell lysis and results in an endpoint assay [4]. Metabolic based assays are simple, cheap, and are a one-step assay, thereby avoiding the limitations of the above-mentioned assay. Numerous dyes can be used to reflect metabolic activity through redox reactions in live cell membranes. One of these dyes is resazurin, which under constant experimental conditions, can provide a stable rate of fluorescence intensity and quantify cell numbers [5,6,7]. Resazurin can be defined as a cell permeable redox indicator that helps in tracking the number of viable cells. Physiological buffers can absorb resazurin, resulting in a deep blue solution. Viable cells have active metabolisms and can therefore convert resazurin into a pink fluorescent solution [8]. Figure 1 shows a schematic of an optimization protocol for quantifying cell number by the resazurin assay. Different concentrations of resazurin are added to the culture medium of incubated cells. At various time intervals, the redox reaction, in which resazurin is reduced by the cells, is measured by fluorescence readings at 544 nm and 590 nm. The optimal concentration of rezaurin versus particular cell type is used at different cell numbers to facilitate the relationship between the fluorescent signal and the cell number at constant time. Resazurin is more sensitive and allows multiple assays compared to other dyes [9].
Several reports have shown the optimization of resazurin reduction assays [10] for cytotoxic agents, antifungal agents, antibacterial agents, the identification of parasites, and the drug sensibility of parasites for large-scale screenings, biofilm, and for cell expansion in matrix scaffolds using bacteria [11,12] fungi and yeast [13,14,15], parasites [16,17], and human cells [15,18]. To the best of our knowledge, this is the first paper that discusses cell viability during cancer biomarker release using a resazurin-based assay. Alkaline phosphatase, which is the early biomarker of many cancers, is correlated with cell proliferation, differentiation, and apoptosis [19,20,21,22,23,24,25], and, therefore, is important in cell-based biosensors [26]. Cell viability was determined for cancer biomarkers using membrane integrity [27], flow cytometry [28], and phase-contrast microscope images [29]. The aim of this paper was to provide simple and reproducible methods for quantifying cell number during ALP release from different cell types. The cancer cell lines including MCF-7, A549, and Ht-29 are used as models of the top three cancers diagnosed worldwide: lung (13%), breast (11%), and colon (10%), respectively [30]. In addition, Balb/c 3T3, which is an embryonic cell line, is used as it is more sensitive to contact inhibition of cell division than cancer cell lines. The ALP level is investigated using optical methods, and the cell number is verified using the hemocytometer assay.
2. Methodology
2.1. Reagents
Mouse embryo fibroblast cells (Balb/c 3T3 Line), breast carcinoma epithelial cells (MCF-7 line), lung carcinoma epithelial cells (A-549 line), colon carcinoma epithelial cells (Ht-29 line) purchased from (ATCC, the UK). 70% ethanol, and nanopure water provided from (Grade 18 MΩ, Tyndall National Institute, UCC). Newborn calf serum (NBCS), fetal bovine serum (FBS), Dulbecco’s modified Eagle’s medium (DMEM), minimum essential medium Eagle (MEME), and McCoy’s 5A Medium, Hank’s balanced salt solution (HBSS), Trypsin/EDTA solution, resazurin, Virkon®, magnesium chloride (MgCl2), sodium chloride (NaCl), diethanolamine (DEA), Triton X-100, and para-nitrophenol phosphate (p-NPP), and calf intestinal phosphatase (ALP) purchased from (Sigma, Ireland).
2.2. Instrumentation
Cell culture hood (Esco Airstream® Class II), 5% CO2 incubator (Incusafe Panasonic), water bath 37 °C (Fisherbarnd), centrifugation (universal 320 Hittch zentrifugen and Eppendorf 5415D Centrifuge) were used. An inverted microscope and camera (Olympus), fluorescent plate readers (Spectra Max Gemini), absorbance plate reader (Diasource ELISA Reader), hemocytometer slide (Reichert Bright-Line), glass cover slips (menzel-gläser) and cell counter, pipettes (Rainin Pipet-X) and micropipettes (Gilson Pipetman®), pipette tips (Greiner Bio-One), pipettors (5 mL, 10 mL, and 25 mL), cell culture vessels (75T flasks, 1.5 mL, 15 mL, 50mL centrifuge tubes, 96- and 48-well plates), and syringes 45 nm filters (Sigma, Ireland) were also used.
2.3. Cell Culture
The cancer cell lines used during this project were stored in liquid nitrogen prior to being cultured. To begin cell growth, they were removed from storage and quickly defrosted (less than a minute). The entire contents (1 mL) of the cryogenic vial were then pipetted into a 15mL-tube that contained 9 mL of pre-warmed complete media (Table 1). The tube was centrifuged to dispose of dimethyl sulfoxide, which was present in the supernatant. The cells were re-suspended in 5 mL complete media and placed in a T75 flask that already contained 35 mL of completed media in order to reach a volume of 40 mL. The flask was incubated in the incubator at 37 °C and 5% CO2 to reach 70% confluence.
The cells were sub-cultured at least three times before optimization began. Briefly, the subculture procedure was achieved by removing old media via a sterile plastic pipette, followed by two washes with pre-warmed HBSS. A total of 4 mL of trypsin was then added, and the flask was incubated for 5–8 min to allow the cells to detach. Then, 6 mL of complete media was added to inactivate the trypsin. The cell suspension was placed in a clean 15 mL centrifuge tube, and the cells were centrifuged for 5 min at 1000 rpm. The supernatant was removed, and the cell pellets were re-suspended in 5 mL of fresh media. The desired cell number was seeded in a 48-well plate, and the final volume of media was added. All experiments were applied in a 48-well plate.
2.4. Determining the Optimal Concentration of Resazurin
Each cell line required a certain concentration of resazurin to ensure viability. Resazurin was dissolved in HBSS to a final concentration of 2 mM to make a stock solution. The stock solution was filtered using a syringe with 0.45 nm pores. To make an intermediate standard, the stock solution was diluted once more in complete media at 10% giving 200 μM. Two-fold serial dilutions were then made, starting with 200 μM. This was then added to cells that were previously seeded in triplicate at the same density (250 × 103 cell/mL). The plates were incubated with the various concentrations of resazurin at a final volume of 0.5 mL for 24 h. The fluorescent signal was then recorded at 544 excitation and 590 nm emission wavelengths using the fluorescent plate reader.
2.5. Determining the Optimal Time of Incubation with Resazurin
Concentrations of 350 × 103 cell/mL were prepared and diluted in 2-fold using the complete media of each cell line. The dilutions were seeded in 48-well plates and incubated at 37 °C for 24 h to allow for attachment. Old media were replaced by the optimal concentration of resazurin in the case of each cell line. The plates were incubated and monitored after two hours and then continuously over a 24-h period. The fluorescent signal was taken at different times at 544 excitation and 590 nm emission wavelengths using the fluorescent plate reader.
2.6. Determining the Calibration Curve of Resazurin and Cell Numbers
Resazurin is a metabolic-based assay that reflects cell viability. In order to make it an assay that measured the cell number, 2-fold serial dilutions of the cell number starting from 250 × 103 cell/mL were seeded in triplicate, and complete media were added for a final volume of 0.5 mL. Cells were incubated for 12 h to allow the cells to attach and avoid duplicating. Old media were replaced by the optimal concentration of resazurin in the case of each cell line. Four hours later, the fluorescent signal was recorded at 544 excitation and 590 nm emission wavelengths using the fluorescent plate reader. The theoretical calibration curves were made from a cell concentration of (4–60 × 103 cell/mL). The resulting linear equation was used to estimate the fluorescent signal for the cell concentration applied in this assay.
2.7. Determining the Optimal Density of Cell Lines
The target density for this paper was identified as when cells proliferated for at least four days and then reached contact-inhibited growth. This was where the target analyte started to express. Five concentrations of cells were prepared (350, 160, 80, 40, 20 × 103 cell/mL). The final volume of complete media was 0.5 mL. The cells were incubated at 37 °C and monitored daily for five days. Old media were changed every two days to keep cells healthy and with sufficient nutrients. On day 1, resazurin was added to cells in plate 1, and four hours later, the fluorescence signal was recorded. The process was continued for the other plates until day 5.
2.8. Determining Cell Number Based Resazurin Assay
The optimal density of each cell line was seeded in triplicate, and cell growth was assessed at 24-h intervals over five days. Old media were changed every two days to keep cells healthy and with sufficient nutrients. To determine the daily fluorescent signal, media were replaced by the optimal concentration of resazurin in the case of each cell line. Four hours after this, the fluorescent signal was recorded. The linear equation of the obtained calibration curve was used to quantify the cell number daily over five days.
2.9. Microscope Images
Images of cell-confluence were taken at 24-h intervals over five days using the inverted microscope and camera. Due to the presence of phenol red, which interferes with the light of microscopes, cells were washed twice with HBSS. Images were then taken from the center of the wells.
2.10. Hemocytometer Assay
Cell viability was also determined using the hemocytometer assay for the optimal density. As previously noted, cells were seeded in triplicate, and cell growth was assessed at 24-h intervals over five days. The old media were changed every two days to keep cells healthy and with sufficient nutrients. After the washing and trypsinization processes, harvested cell pellets were re-suspended in complete media, a coverslip was used to cover the two counting chambers, and then a drop of the solution was inserted, allowing the solution to spread gently. Under the microscope, nine squares were observed to be accounting cells. Accounting cells had to be averaged and multiplied by the three demotions of the hemacytometer, where the width and height equaled 1 mm, and the depth equaled 0.1 mm to get a final concentration of cell per mL using the following equation:
where C is the final concentration of cell numbers per mL and n is the average of cell numbers counted from each square.
2.11. Cell Viability at Post-Confluence Culture
Cells can be differentiated using post-confluence culture to ensure ALP release, which makes the determination of the cell viability of cells at post confluence culture important. Cells were seeded in 48-well plates at a concentration of 40 × 103 cells/mL for the following cells: Balb/c 3T3, A549, and MCF-7, and at a concentration of 80 × 103 cells/mL for the Ht-29 cells. Cells had the media changed every two day to keep them healthy and with sufficient nutrients. After they achieved their exponential growth and met the 95–100% confluence (Day 4), the cells were maintained in growth media for a further two days. Old media were replaced by the optimal concentration of resazurin in the case of each cell line for the fourth, fifth, and sixth days. Cells were incubated with resazurin for four hours. Vehicle control of each cell was prepared by adding two drops of Virkon® in the complete media for 24 h the night before the assay. A reszurin control was added to media with no cells. The fluorescence signal was recorded for each day.
2.12. Alkaline Phosphatase Release from Cells at Post-Confluence Culture
To induce ALP and allow real-time monitoring, cells were differentiated using post-confluence culture. Cells were seeded in 48-well plates at a concentration of 40 × 103 cells/mL for the following cells: Balb/c 3T3, A549, and MCF-7, and at a concentration of 80 × 103 cells/mL for the Ht-29 cells. Cells had the media changed every two days to keep them healthy and with sufficient nutrients. After they reached their exponential growth and met the 95–100% confluence (Day 4), the cells were maintained in growth media for a further two days. Cells were washed twice with HBSS in each target day. The ALP assay buffer at pH 9.5 was added in the presence of 0.8 mM MgCl2 and 50 mM NaCl, 0.1% Triton X-100, and 8 mM pNPP and 0 mM pNPP as a blank for each cell line. Vehicle control of each cell was prepared by adding two drops of Virkon® in the complete media for 24 h the night before the assay. Cells were then incubated in the specified buffers for 30 min. For the standard curve, a commercial ALP had its concentration varied from 1.5 U/L to 1500 U/L. A Lineweaver–Burk model was plotted between the absorbance values and ALP concentrations to obtain the linear equation. Measurements were applied to the 96-well plate in triplicate, and absorbance was taken at 405 nm using the spectrophotometer at a final volume of 150 μL.
2.13. Data Analysis
Single factor of analysis of variance (ANOVA), MS Excel, and Origin were used in order to analyze the results of the experiments and to ensure the limitation of errors. Results were displayed as mean +/− SD. There were: n = 3 was replicated for each condition in each individual experiment and the displayed data represent the mean of at least three independent experiments. The coefficient of variation % and p-values and Z-factor were considered.
3. Results and Discussion
3.1. Determining the Optimal Concentration of Resazurin
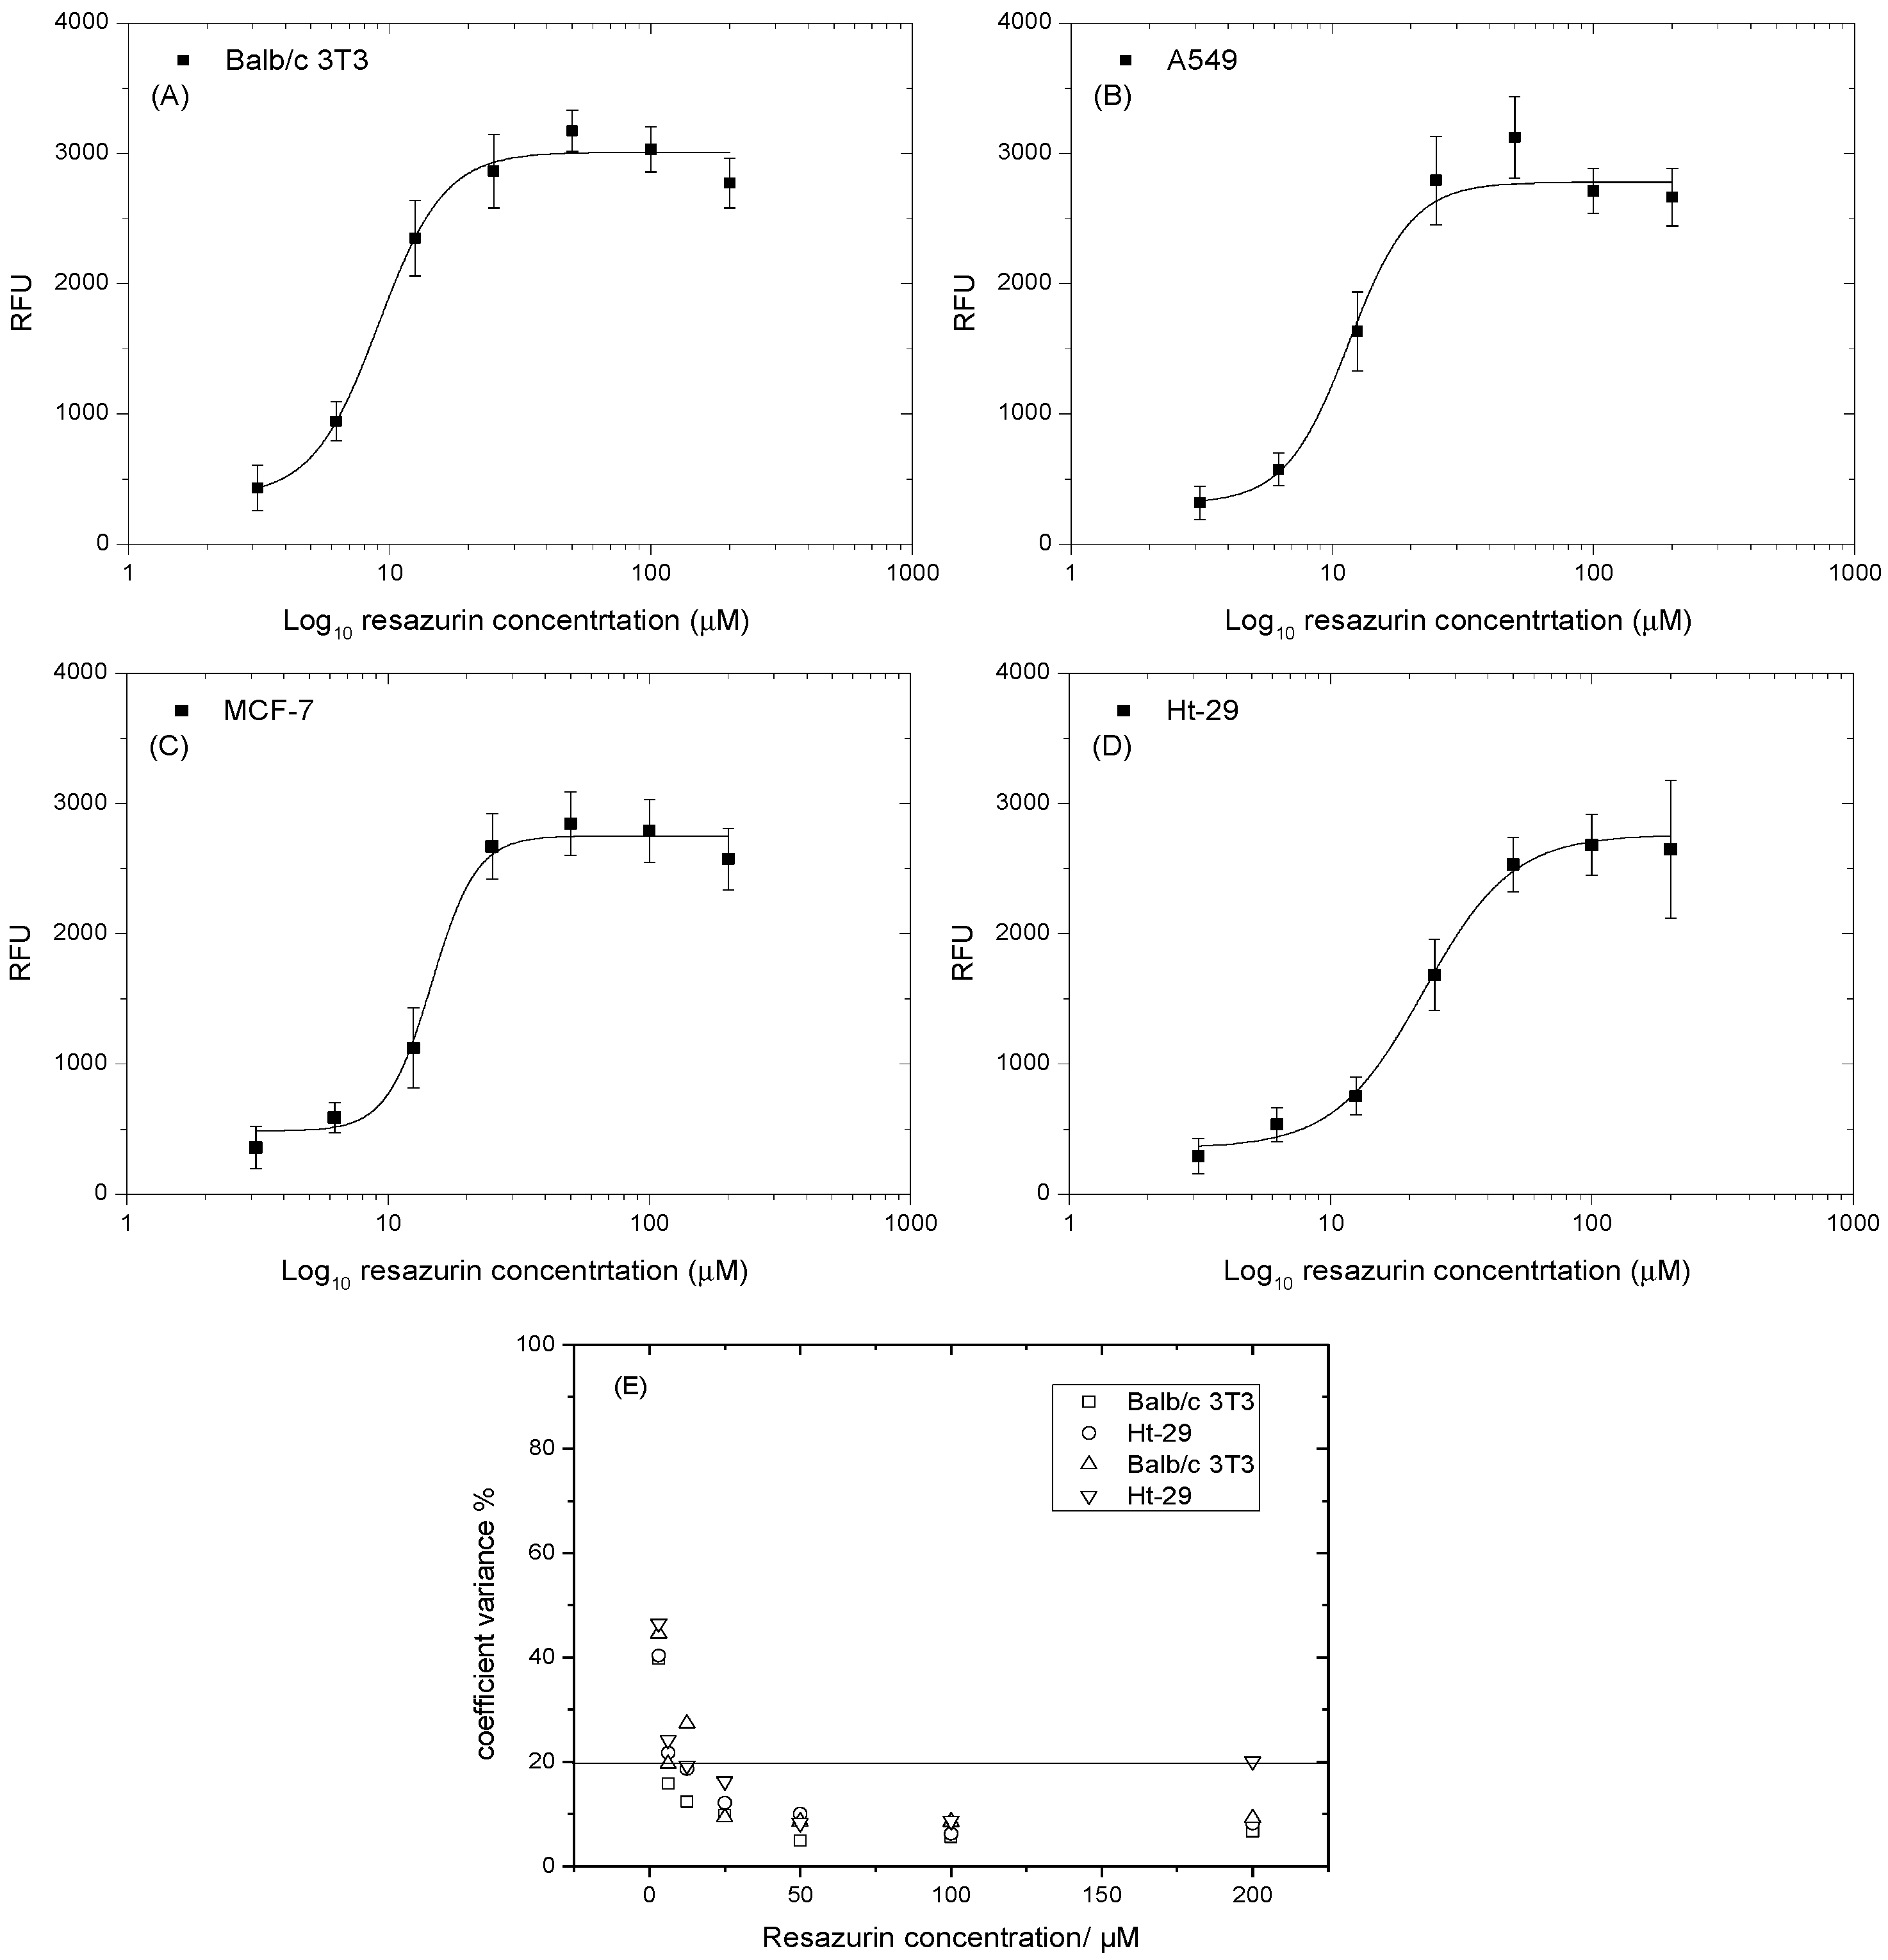
Metabolic activity may differ between cells, which makes optimizing the concentration of resazurin important. Cells were plated in 48-well plates and incubated for 24 h to allow for attachment. Different concentrations of resazurin were added, starting with the highest possible concentration that would not be toxic to cells (~200 μM). This was then serially diluted to 1:2 to produce a range of μM/well. All measurements were done with 24-h incubation times. Figure 2A–D shows that the resazurin reduction rate was positively proportional to the resazurin concentration. However, this gradual increase was limited by the highest concentration, where, after the optimal concentration, the rate of resazurin reduction decreased. Figure 2A–C illustrates the highest reduction rate at 50 μM and then shows an inverse relationship. Figure 2D shows the highest reduction rate at 100 μM, while 200 μM exhibited a high deviation. This data indicate that the optimal concentration of Balb/c3T3, A549, and MCF-7 was 50 μM, and that of the Ht-29 cell was 100 μM. Figure 2E shows the coefficient variance of the analysis data at various resazurin concentrations. At the lowest recorded concentrations of resazurin, the relative variability exceeded 20%. The CV% then fell and reached its lowest level at 100 μM. However, at higher concentrations, this trend reversed and CV% started to increase. These findings indicate that resazurin at a high concentration may be destructive to cells [31].
3.2. Determining the Optimal Time of Incubation with Resazurin
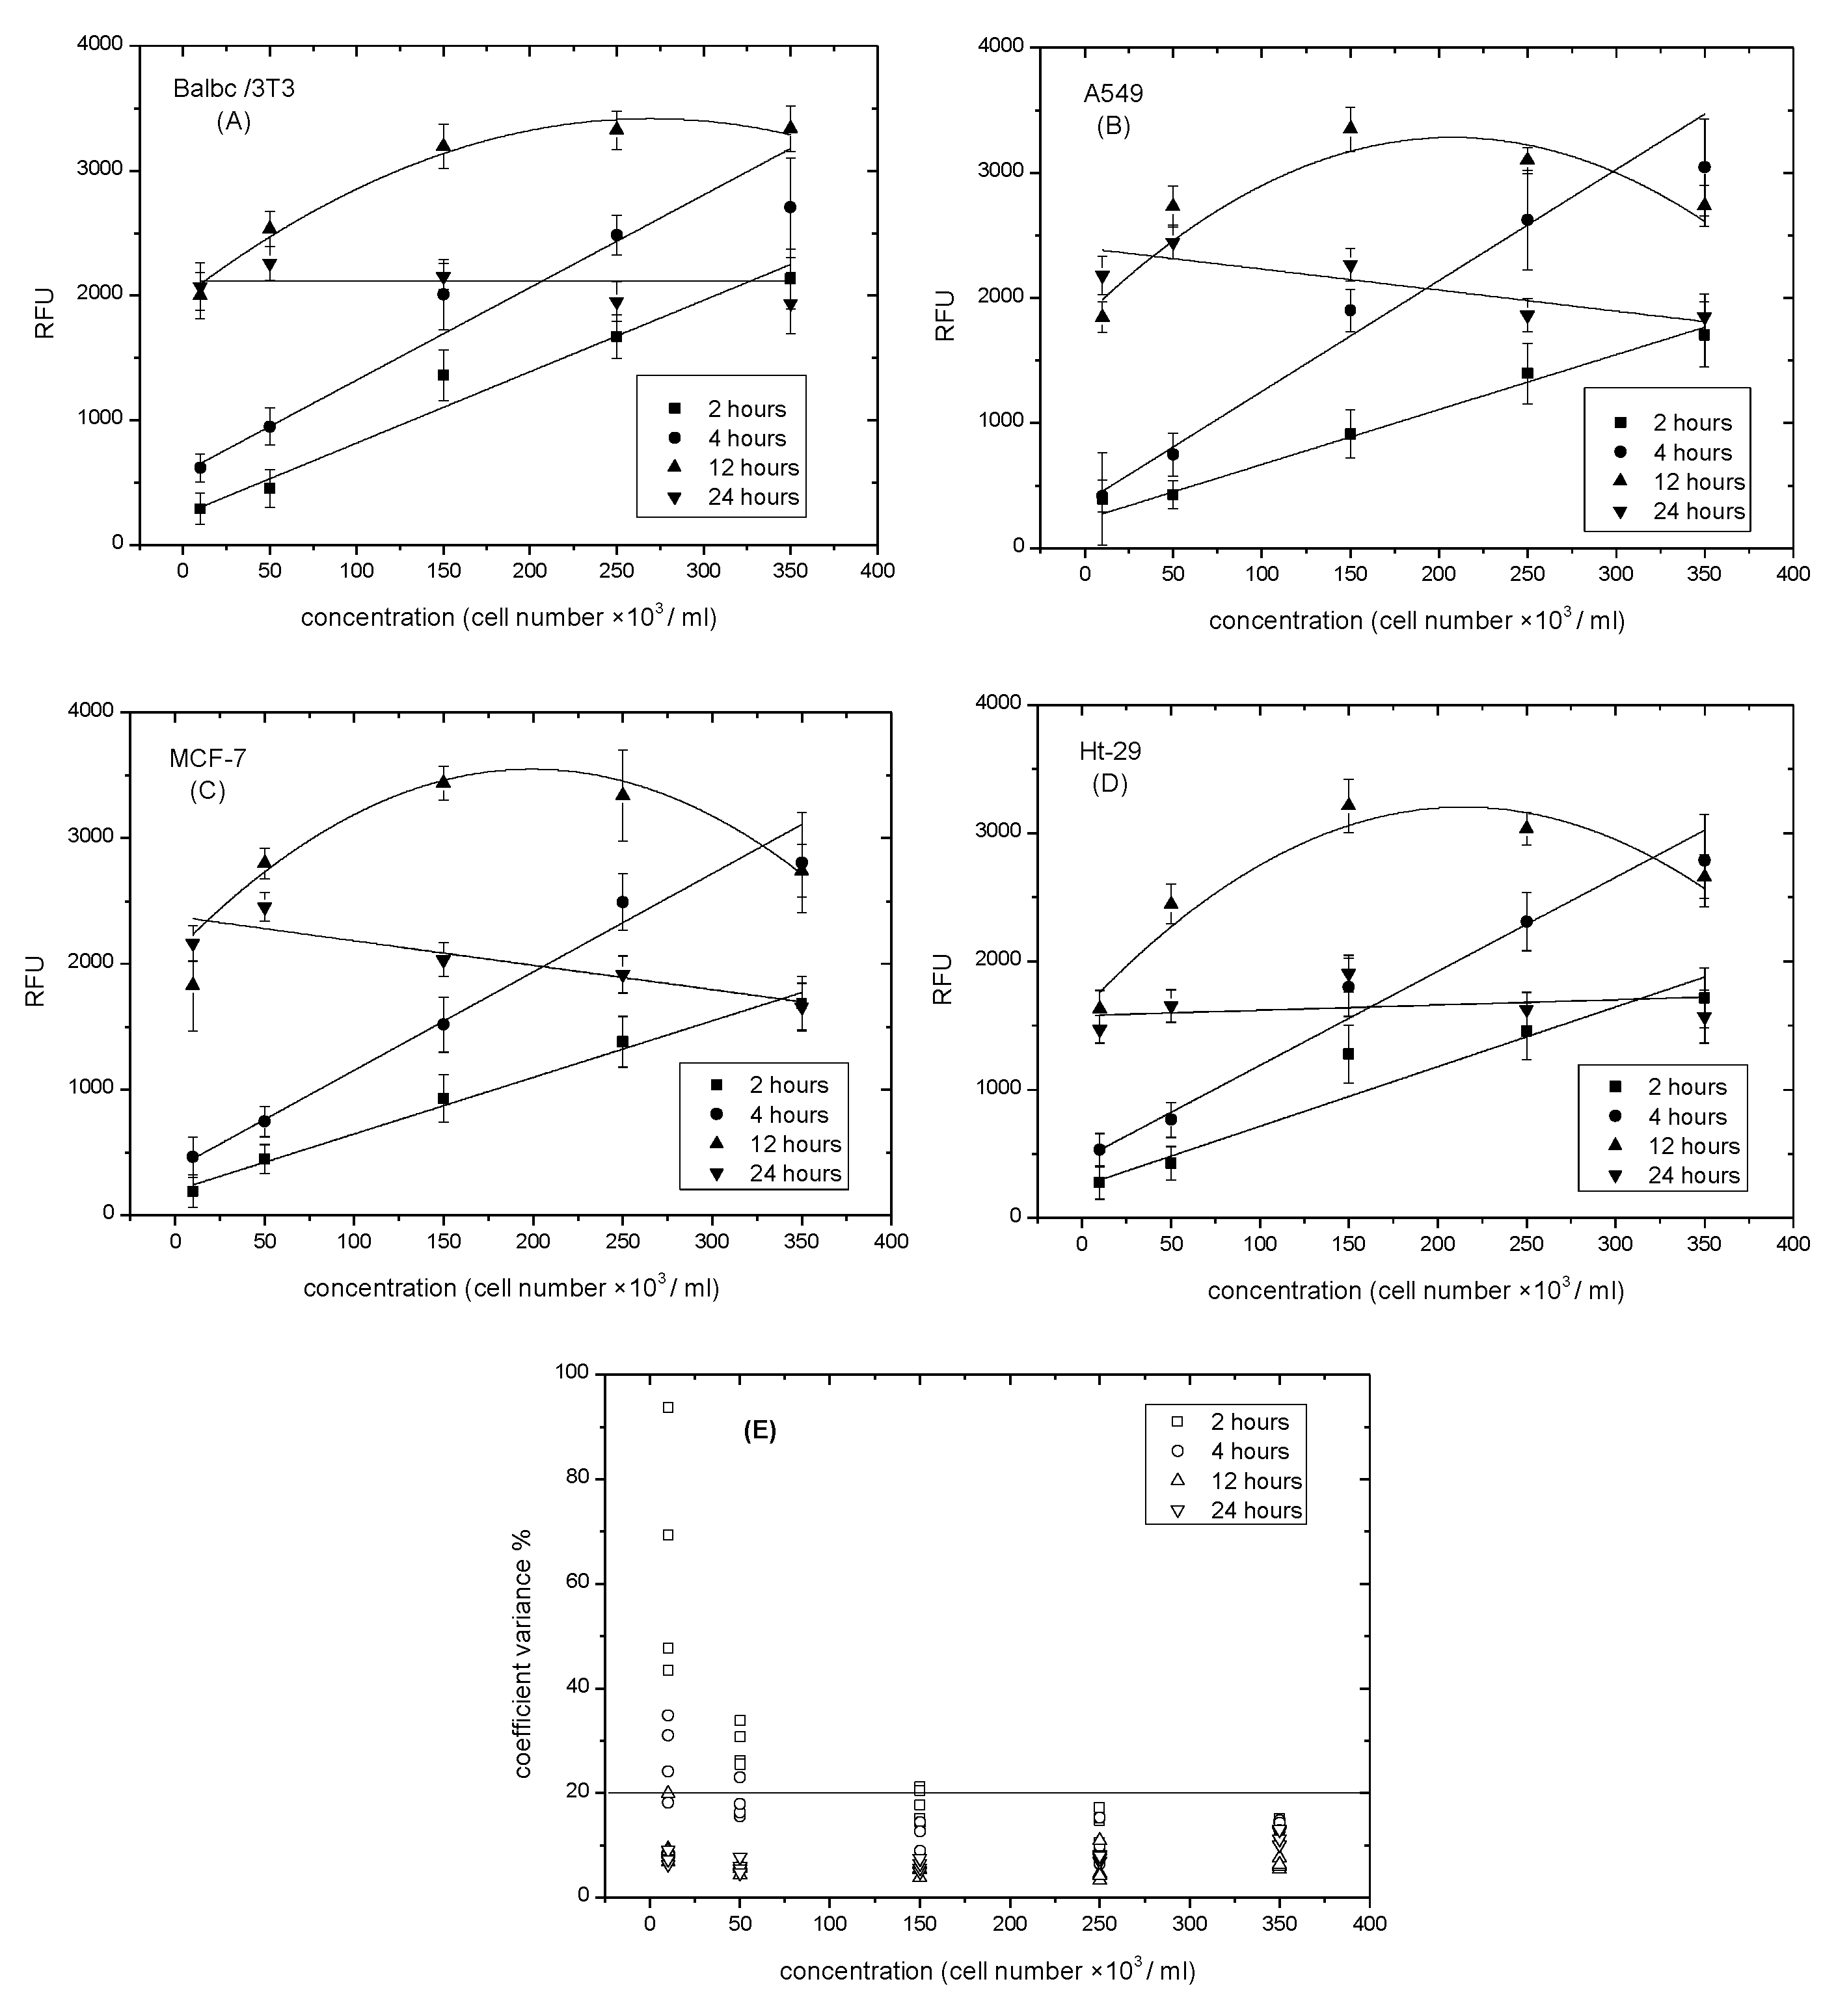
It is important to determine the resazurin incubation time, because resazurin reduction is affected by time and cell density. Cells were plated at the highest saturation density (~3 × 10⁵ cell/mL), then serially diluted in a ratio of 1:2 to produce the range of cell density/well. After 24 h, the attached cells were incubated with a set volume of resazurin working solution for 2, 4, 12, or 24 h in order to cover all the recommended times (1–24 h). Figure 3A–D shows that the number of cells was strongly correlated with the values of resazurin reduction. This correlation was linear from two to four hours, but it started to lose linearity when the incubation time increased from 12 to 24 h. Linearity after two hours was positively proportional to cell densities, but it still demonstrated a low slope, which may underestimate cell numbers. A 4-h incubation time proved to be a preferable incubation time. The slope at the 4–h incubation time was almost two times higher than that of the 2-h incubation time. The occurrence of high density may form hydroresorufin faster. This high density was avoided in this research study. A 12-h incubation time showed an increase at low density, and then the rate of resazurin reduction started to decline by (~1 × 10⁵ cell/mL). This incubation time was avoided to reduce errors for the rest of the investigation where proliferation needed to be detected. After 24 h, the incubation time levelled, since the lowest density had the same rate as the highest, making the 24 h suitable when time parameters were not recommended. Coefficient variance (CV%) was highly reproducible in the non-linearity assays, although it was high at low densities of cells. Figure 3E shows that CV% exceeded a range of 20% at the lowest density of cells in the linear assays. It appears that four hours is the optimal time recommended. This is in agreement with Hamalainen–Laanaya’s contributions [32], which state that the cell density should be finely tuned in order to prevent the over-reduction of resazurin and ensure the applicability of the resazurin assay.
3.3. Determining the Standard Curve of Resazurin and Cell Numbers
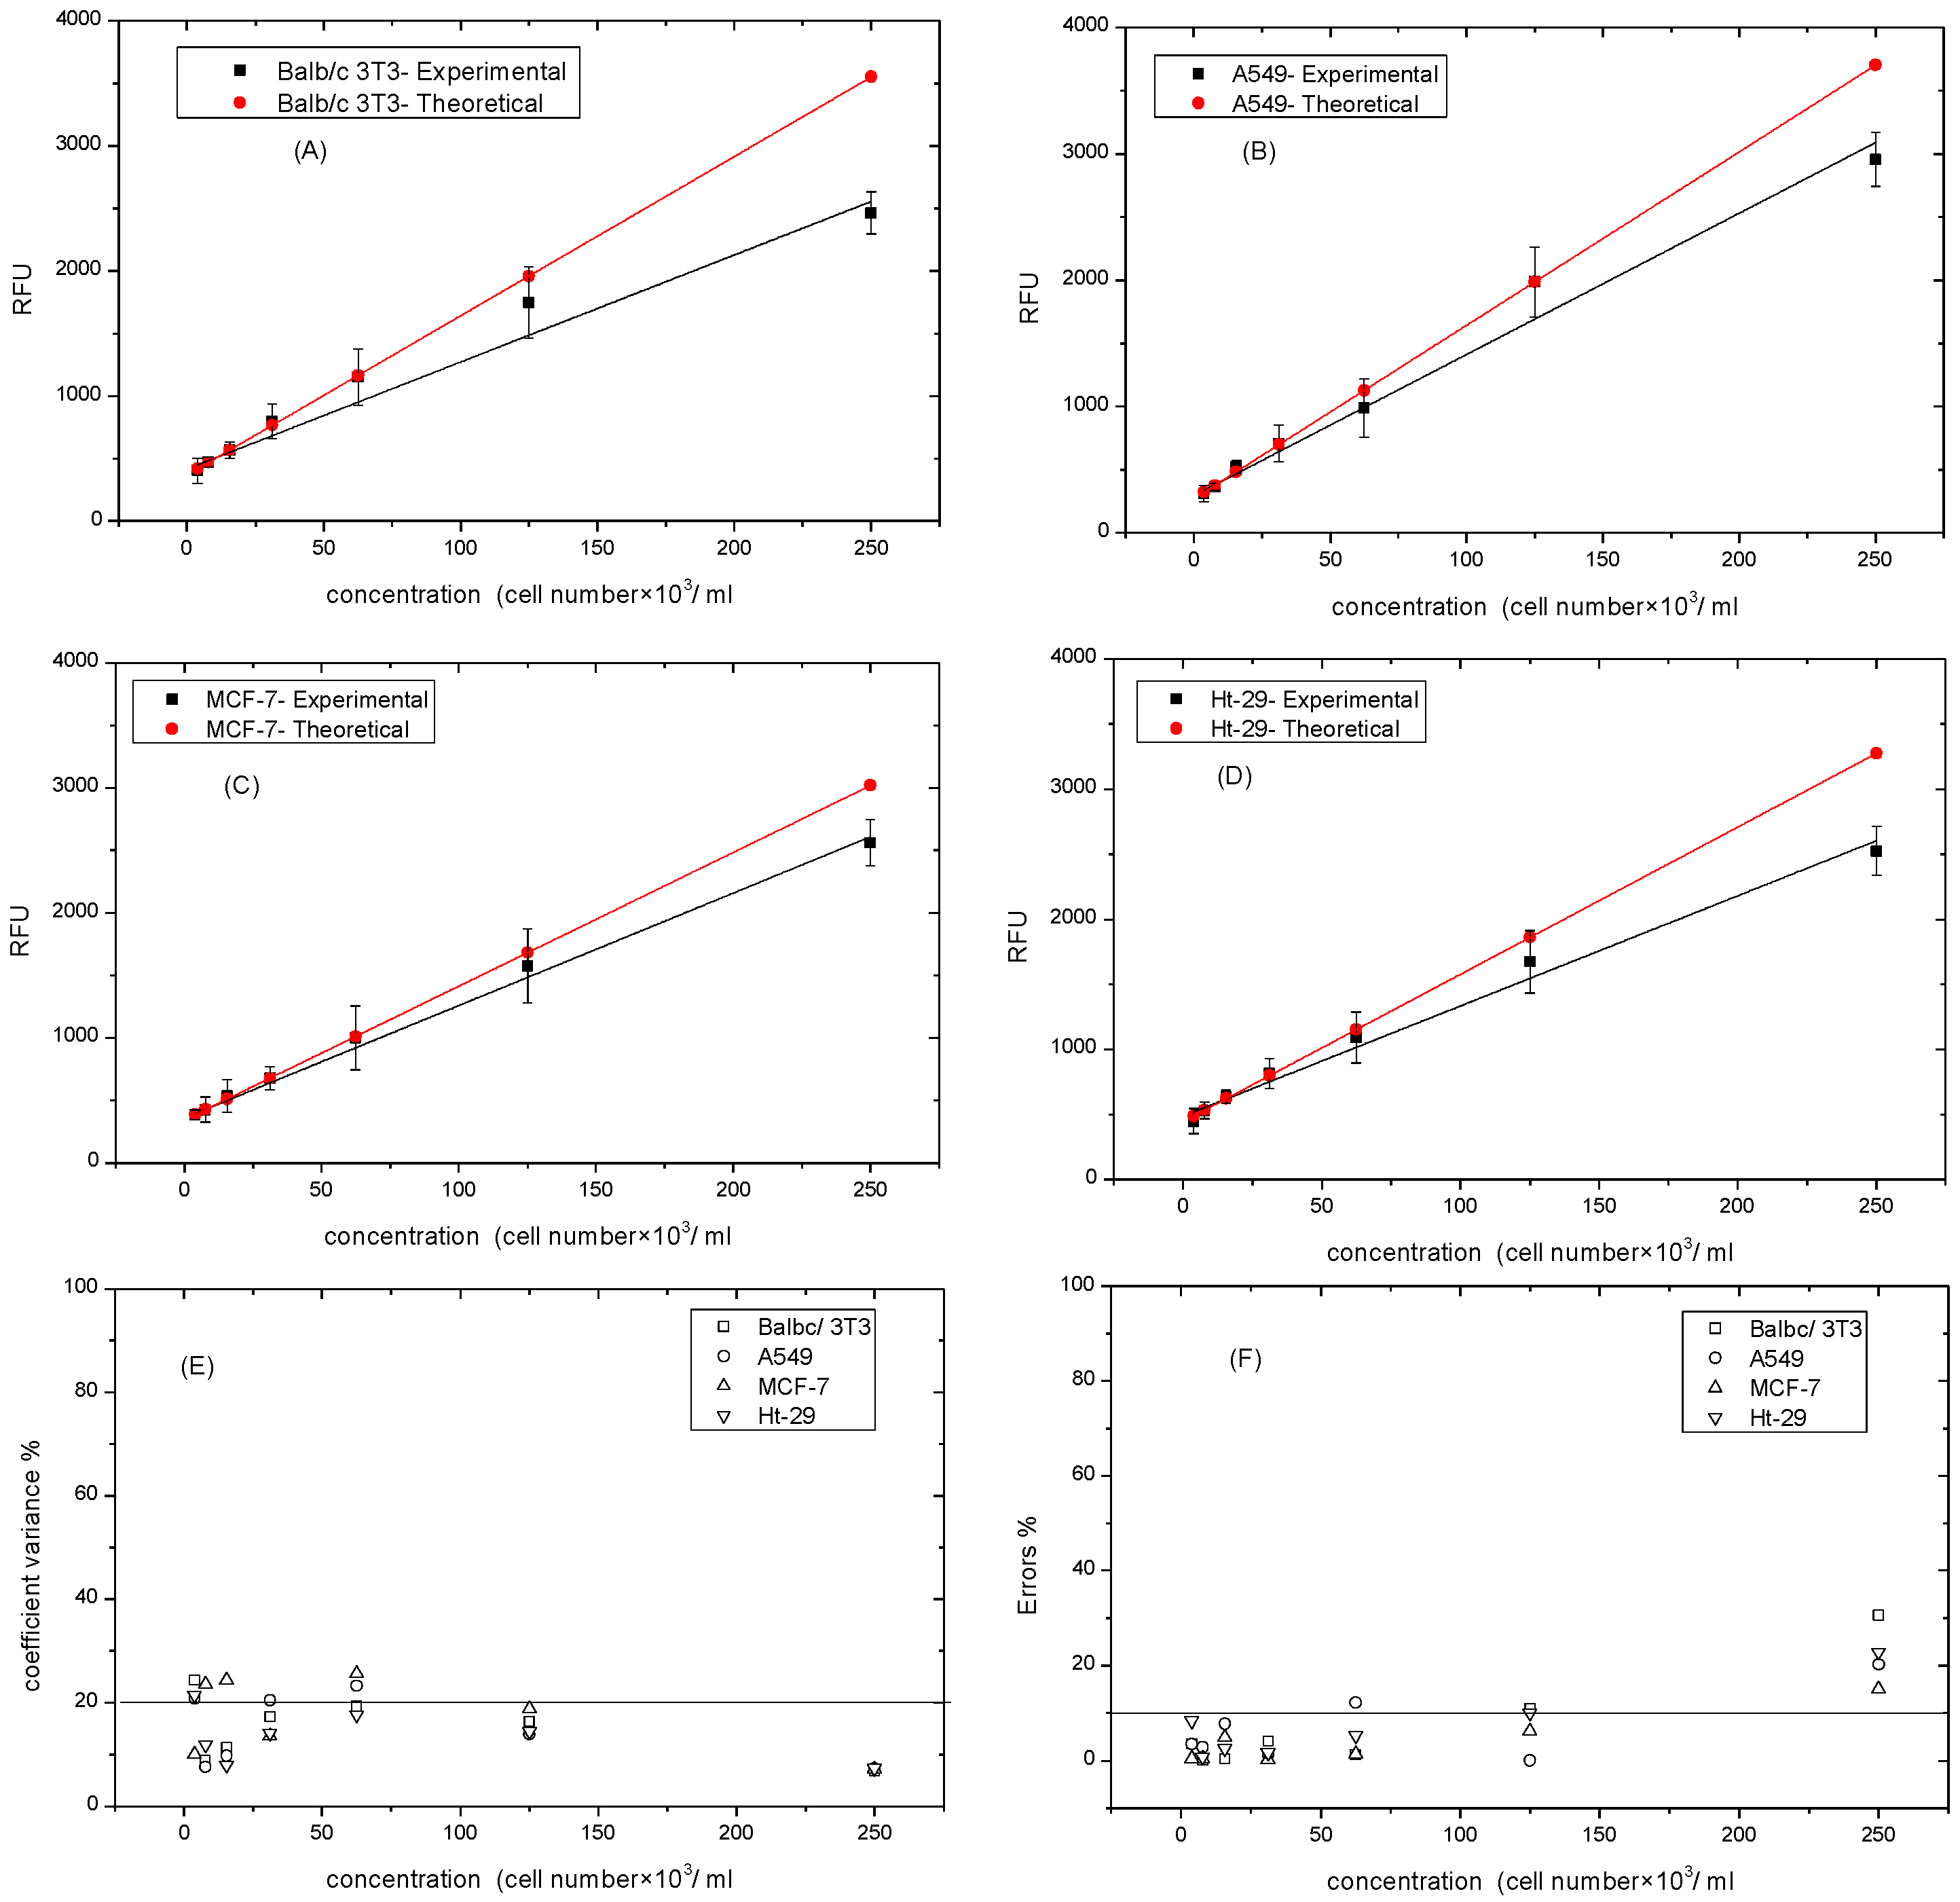
Cell numbers can be quantified by the calibration curves of resazurin reduction. The calibration curve of each cell line was generated by plating the cells lines (Balb/c 3T3, A549, MCF-7, and Ht-29) at the same initial density (~250 × 103 cell/mL), then serially diluting in a ratio of 1:2 to produce a range of cell density/well. Eight hours later, and before dividing, resazurin solution was added according to the optimal concentration and incubated for four hours. Figure 4A–D shows the experimental and theoretical calibration curves produced by acceptable data over the concentration range of (~4–250 × 103 cell/mL) of the four cell lines. In comparison with the theoretical calibration curves, which were calculated using the linear equation of cells ranging from (4–60 × 103)cell/mL, the experimental curves of the four cell lines displayed an exponential shape at the high concentration with adjusted R-squared of 0.97, 0.97, 0.99, and 0.98 for the cells of Balb/c 3T3, A549, MCF-7 and Ht-29, respectively [33]. The shape was most clear in the Balb/c 3T3 cell lines, where cells reached the inhibitive growth point, and least clear in the MCF-7 cell lines. This saturating trend might result in different cell sizes. For example, the MCF-7 size was 5–7 μm in diameter [34], this then limited the cell attachment to the plate surface. Therefore, the differences between the two curves, theoretical and experimental, were determined for each dilution ratio. Figure 4F illustrates the significant data of cell number (~4–250 × 103 cell/mL), which were less than 10% for all cell lines. However, at the range of (125–250 × 103 cell/mL), the percentage of errors barely exceeded 10% for all cell lines. Notably, the repeatability of results can be interpreted in Figure 4E. The relative variability of the lowest recorded cell numbers barely exceeded 20%, while at high cell numbers, the CV% was the lowest.
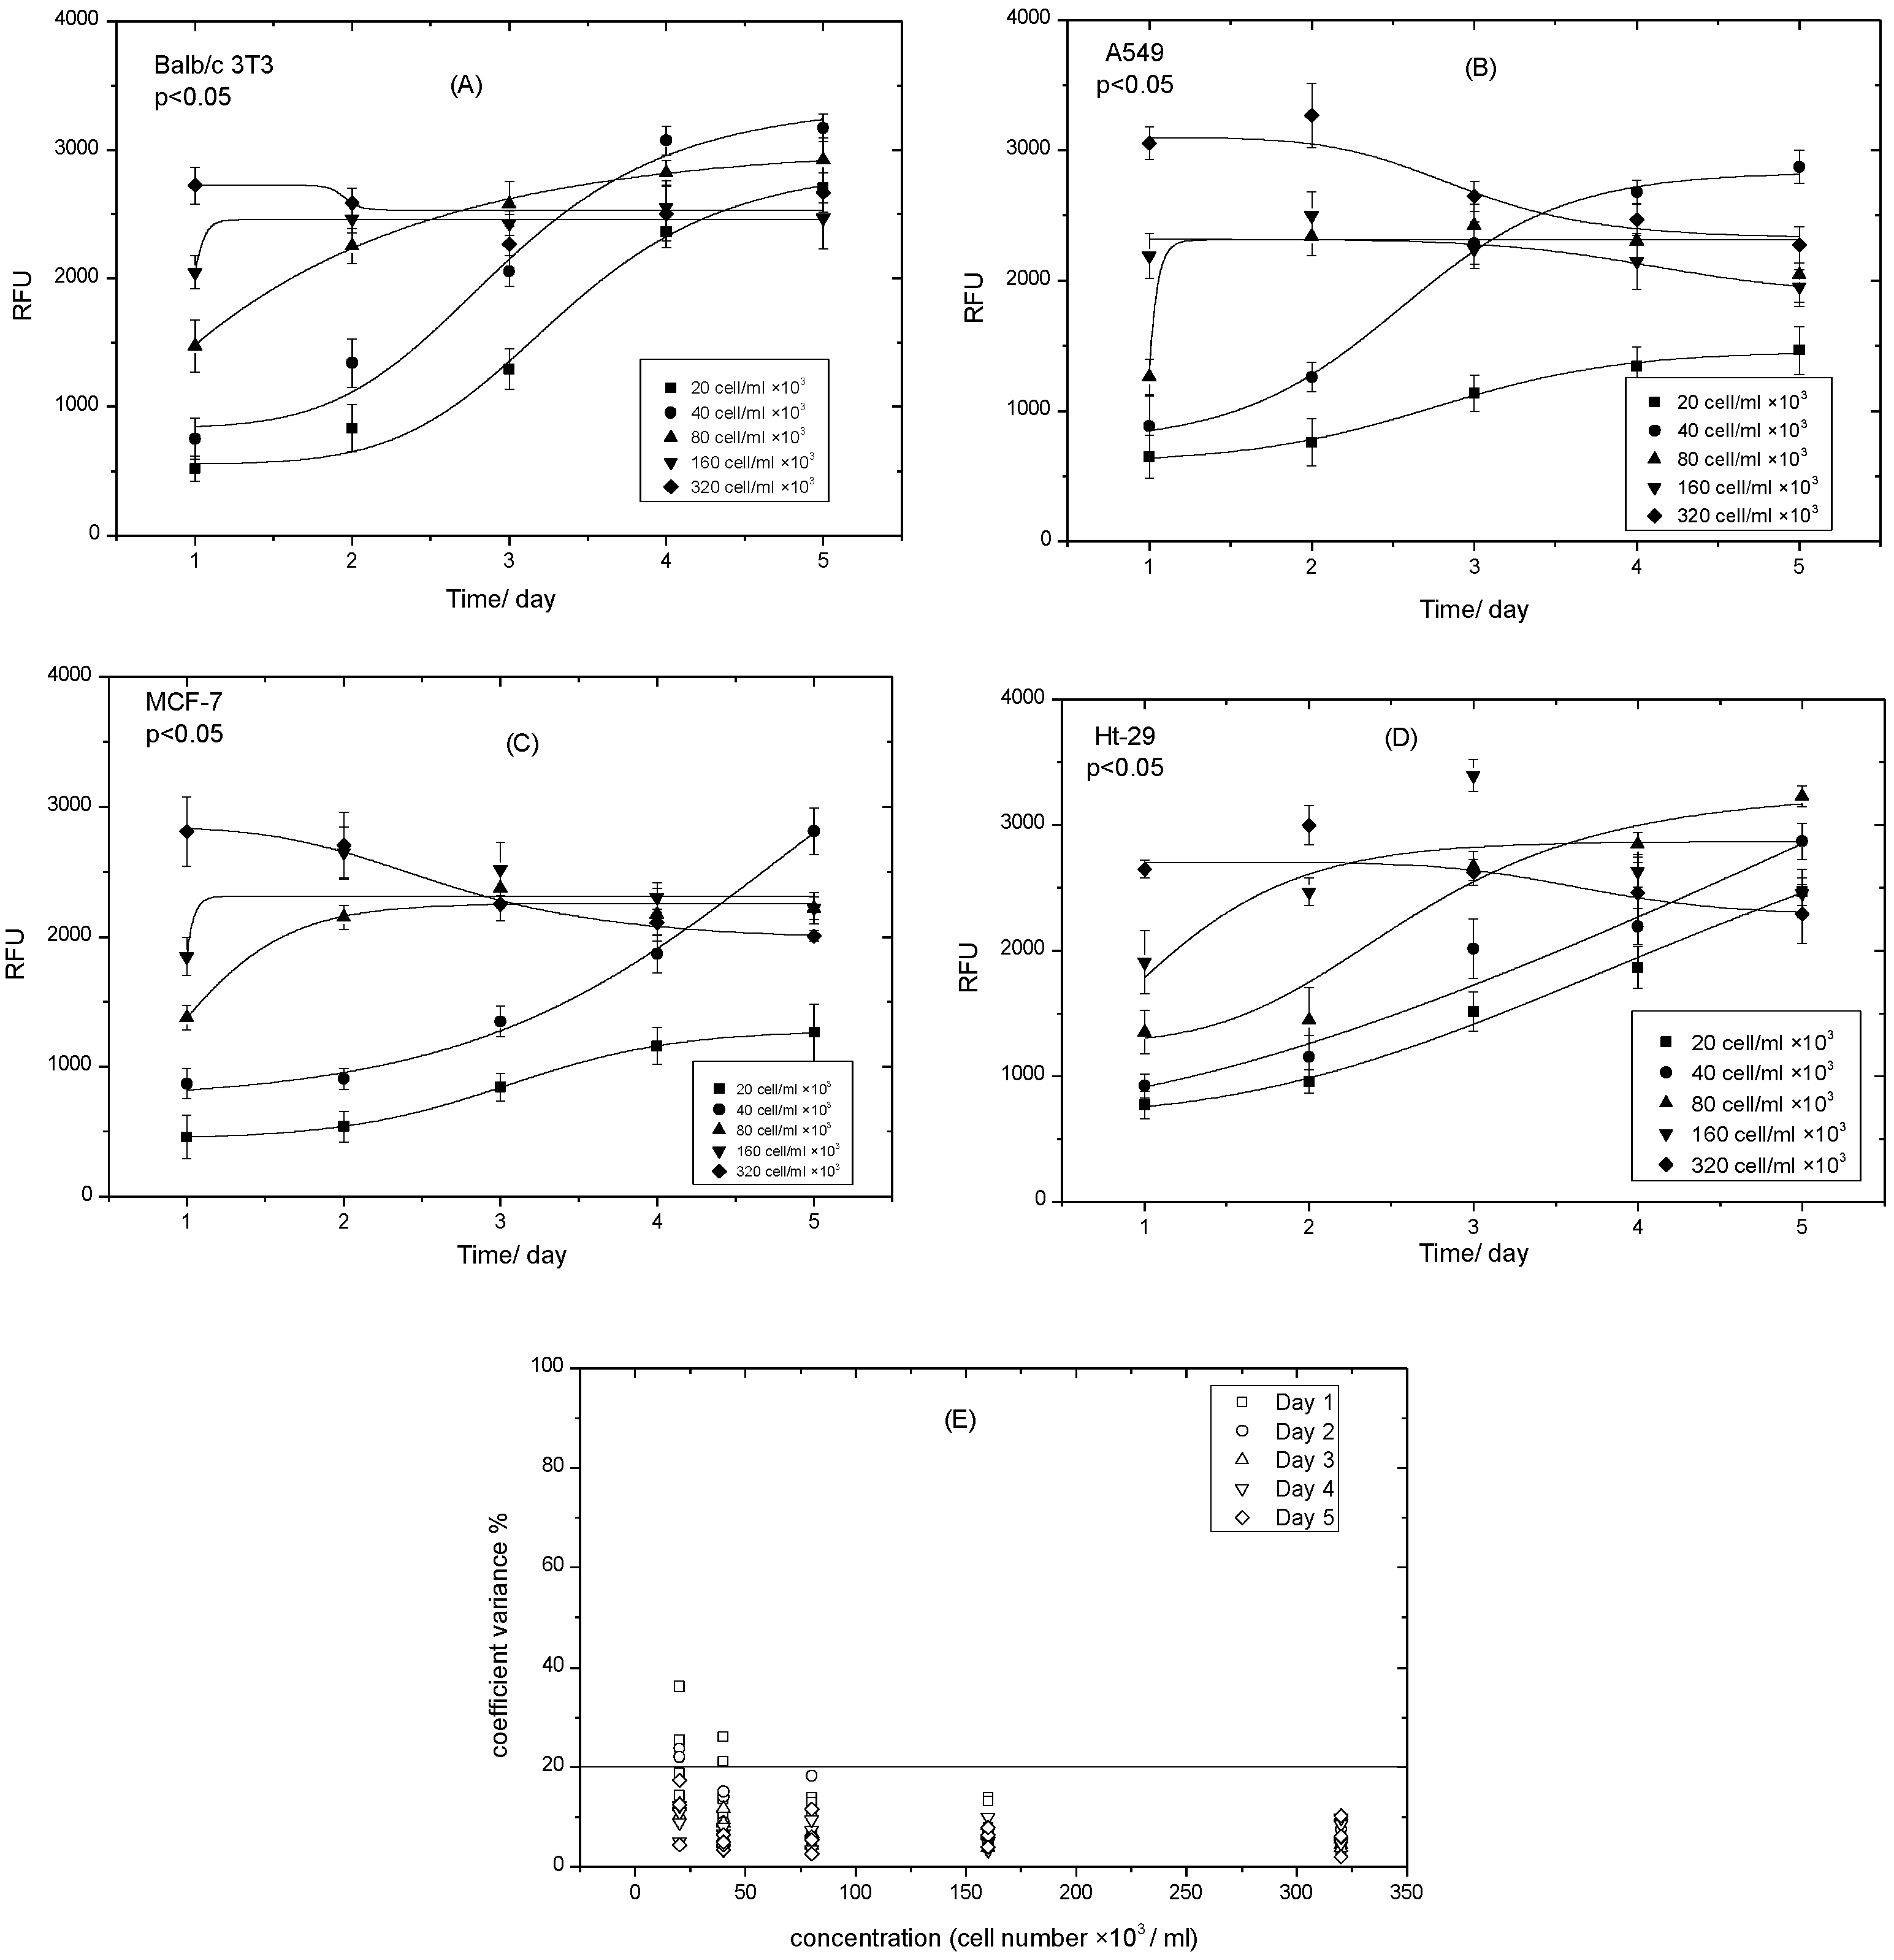
3.4. Determining the Optimal Density of Cell Lines
There are several stages in the life cycle of mammalian cells. In one of these stages, hormones, protein, enzymes, etc. are produced. To allow the expression of these products, cellular functions such as adhesion, proliferation, migration, or apoptosis are usually investigated [9,10]. Cells were plated at an initial density of (320 × 103 cell/mL) and then serially diluted in a ratio of 1:2 to produce the range of cell density/well. This was done to make the cells simultaneously reach contact-inhibited growth. Cell growth was monitored over five days and resazurin reduction was recorded. Figure 5A–D shows the growth curves of the four cell lines at the five different densities. Low density with an s-shape expressed logistic growth, whereas high density failed to exhibit an s-shape and levelled out from day 1. Balb/c 3T3 cell lines displayed an s-shape at 20–40 × 103 cells/mL, but for the higher densities, 80–320 × 103 cell/mL showed approximately level density, although 80 × 103 cell/mL exhibited a little growth at day 1, which means that 40 × 103 cell/mL is the optimal density of the Balb/c 3T3 cell lines (Figure 5A). The A549 cell lines behaved the same as the previous cell line, but the s-shape of the lowest density 20 × 103 cell/mL was quite unclear. From Figure 5B, it is clear that 40 × 103 cell/mL is the optimal density (Figure 5B). Like the Balb/c 3T3 cell lines, the A549 cell lines at the higher densities ranged from 80–320 × 103 cell/mL and levelled by day 1. Figure 5C shows that the MCF-7 cell lines displayed an s-shape of 20 × 103 cell/mL, but at a very low reduction rate of resazurin (~1000 nm). The 40 × 103 cell/mL sample demonstrated a J-shape, which began to level by day 5. The higher densities, ranging from 160–320 × 103 cell/mL, did not show any growth behavior. This meant that 40 × 103 cell/mL was the optimal density. Ht-29 behaved quite differently to the other cell lines, where at low densities 20–40 × 103 cell/mL, it showed a j-shape (Figure 5D), whereas at 80 × 103 cell/mL, it showed an s-shape, which makes it the optimal density. Like the other cells, the Ht-29 cell lines at the higher density ranged from 160–320 × 103 cell/mL and levelled on day 1 and then started to decrease. The CV% of all five days was less than 20% on day 1, and on day 2, cell numbers barely exceeded 20%. This was probably because of the lag phase and the ability of cells to divide and adjust themselves in the new environment. This investigation facilitated the determination of the optimal density of each cell line and makes it applicable for this research study, where the expression of ALP versus cell viability was investigated [35,36].
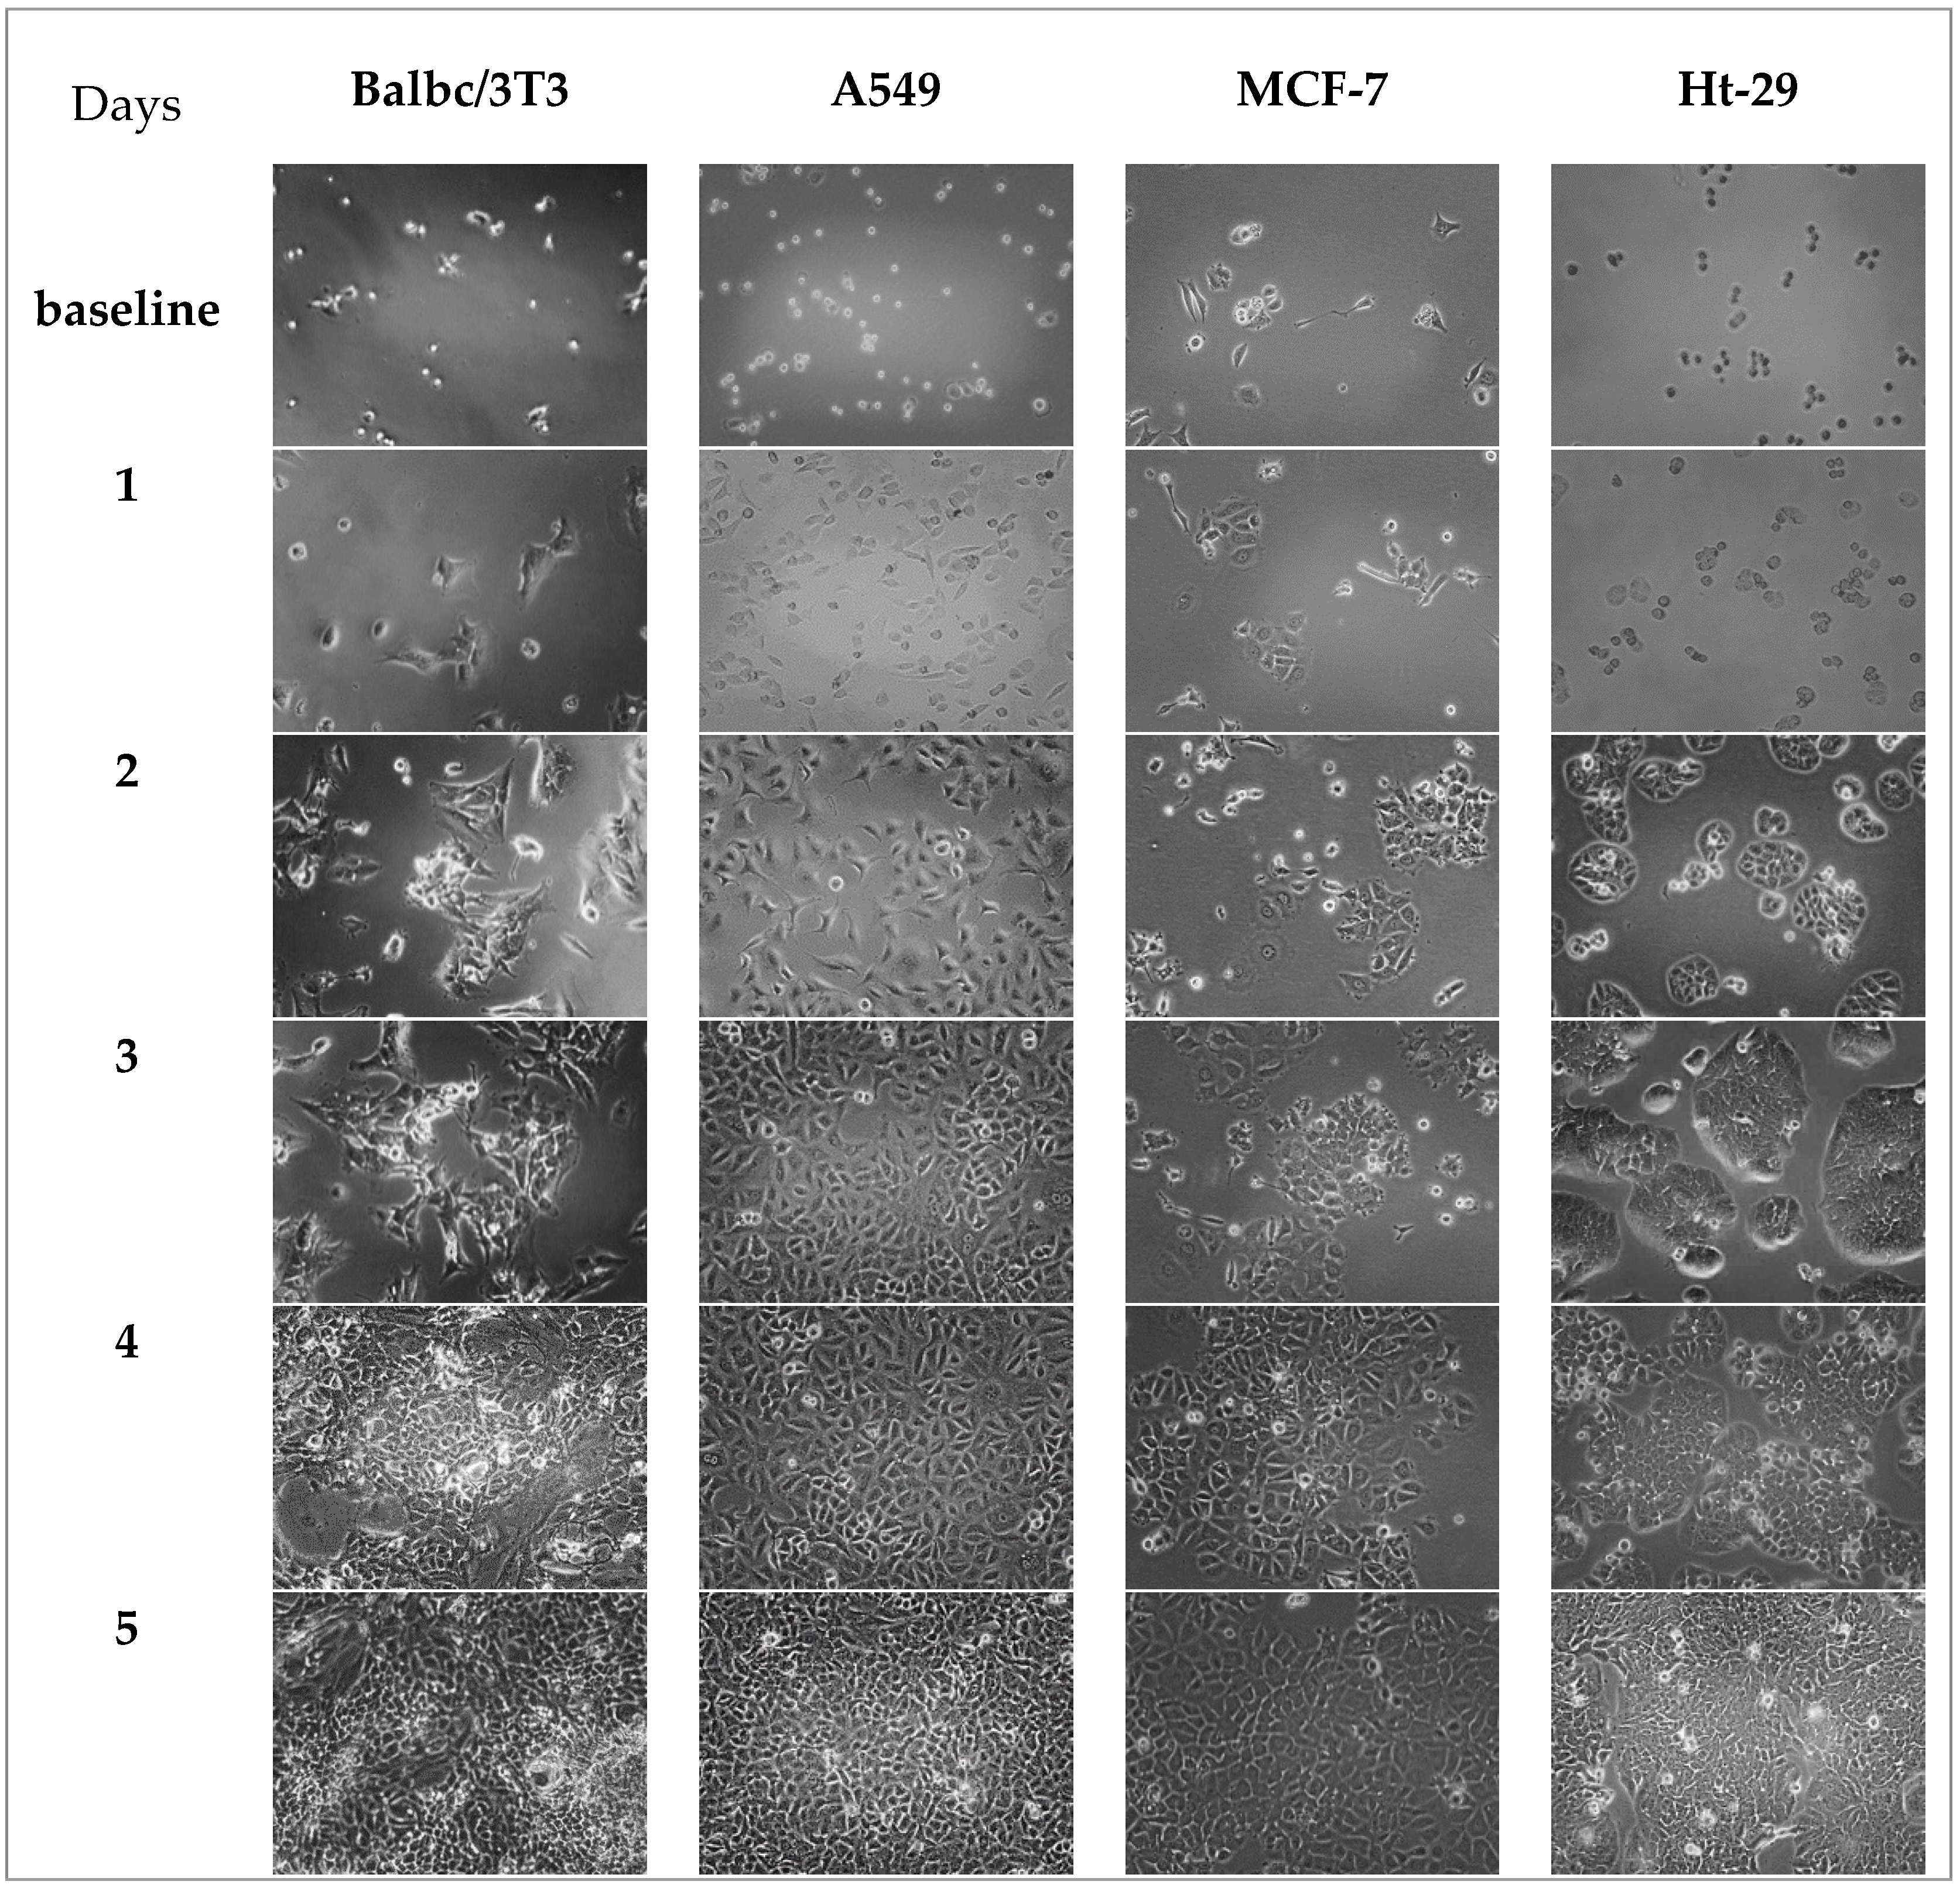
3.5. Microscope Images
The determination of cell shape per day is important in order to know the state of the cells when the experiment begins and when sampling starts simultaneously. The optimal density of each cell obtained from the previous experiment was seeded and monitored over five days. It is obvious from Figure 6, in the baseline, that the cells behaved differently. The Balb/c 3T3 and MCF-7 cells attached quickly and started to flatten. A549 and Ht-29 cells had a rounder shape, which means that they needed a longer time to attach. Balb/c 3T3 cells showed constant division from day 1 to day 3 and 80–100% confluence by days 4 and 5. This probably means that cells reached the inhibitive growth contact quickly by day 4, and that there was no working area left for more division. This result met the resazurin reduction findings in Figure 5A. A549 cells started to flatten by day 1, had a spindle shape by day 2, and then had sudden doubling, which explains the results found in Figure 4B. By days 4 and 5, cells seemed to have no space to divide, so they shrank and started to proliferate, as these kinds of cells rarely form multilayers. MCF-7 cells, on the other hand, showed a longer lag phase and slowly divided from day 1 to day 3. Cells barely reached almost 70% confluence by day 4 and had space to confluence in day 5. These findings explain the j-shape displayed in Figure 4C and ensured that no multilayer had formed. Ht-29 cells started to flatten in day 1 and then had confluence from day 2 to day 4. Likewise, for Balb/c 3T3 and A549 cells, Ht-29 cells had no space to double. Ht-29 cells seem to have their extracellular matrix spread out and cover the area in day 3. This extracellular matrix reduced when cells reached confluence in days 4 and 5. Another microscope or dyes might be used to display this division.
3.6. Determining Cell Number and Comparison to Hemocytometer Assay
The cell culture growth curve represents the number of live cells over a period of time and covering the four phases [37]. In the first two growth phases, cells are more likely to be consistent, while in the stationary phase, cells may be more differentiated. Morphology may become polarized, and has more spreading for the extracellular matrix. Therefore, determination of the viability of cells in using quantitative analysis was required. Resazurin reduction of each cell obtained from the previous experiment was used to estimate viable cells using the linear equation obtained by the calibration curve. For comparison, the number of cells was also compared to manual accounting using the hemocytometer assay. Figure 7 shows the comparison of the estimating cell number and accounted cell number. Estimating cell number had the same trend as the resazurin reduction assay previously described in Figure 5. In contrast, the results given by the hemocytometer displayed slight differences. However, both assays displayed the growth curve. Values of the estimated cell numbers in the Balb/c 3T3 and Ht-29 cells were higher than those manually accounted in all phases. A549 cells also had higher estimated values in all phases except for in the stationary phase. On the other hand, MCF-7 demonstrated a different trend, as it showed a J-shape in the estimated cells and an s-shape in the accounted cells. However, the difference between these values on the day of control was high in the Ht-29 cells (84.96 × 10³ cells/mL) and MCF-7 cells (70.51 × 10³ cells/mL) compared to the difference in Balb/c 3T3 (58.18 × 10³ cells/mL) and A549 cells (11.13 × 10³ cells/mL). Overall, the growth curves given by the hemocytometer were sharper than the estimated ones. Notably, manual accounting had multiple steps, which increased the chance of losing cells, whereas cell number given by the resazurin assays were estimated theoretically based on a calibration curve, where the possibility of losing cells during assays was low.
3.7. Cell Viability at Post-Confluence Culture
The cell viability of cells at post-confluence culture was detected. Table 2 illustrates the fluorescent signal of resazurin produced during the fourth, fifth, and sixth days for each cell line as well as vehicle control and resazurin control. It is obvious from the data that there was a decrease in cell viability for all of the cells from day 4 to day 6. There was a significant difference between the data of cell viability of day 5 and day 6 compared to that of day 4; but MCF-7 cells in day 5 showed no significant difference (p > 0.05) to the control value (day 4). This was probably because there was 70% confluence in day 4 (shown in Figure 6), which allowed more proliferation. The cells of Balb/c 3T3 and A549 displayed z-factor values between 0.5 and 1 for each culture day compared to the control (day 4). It is quite noticeable that the cells of Balbc/3T3 and A549 are more unlikely to form multilayers when reaching the contact-inhibited growth point. MCF-7 cells showed a quality assay in day 6, whereas Ht-29 cells illustrated a z-factor less than 0.5 for all the post-confluence culture compared to the control value. That was possible because of the high standard deviation (SD) for all the values in the three days. Notably, the z-factor value mostly depended on the SD. The cell viability of the vehicle controls of the cells of Balb/c 3T3 and MCF-7 was 10.2% and 8.3%, respectively, while those of the cells of A549 and Ht-29 were 18.6% and 18.2%, respectively. Drops of Virkon® may need to be increased for the MCF-7 and HT-29 cells to make dead cells.
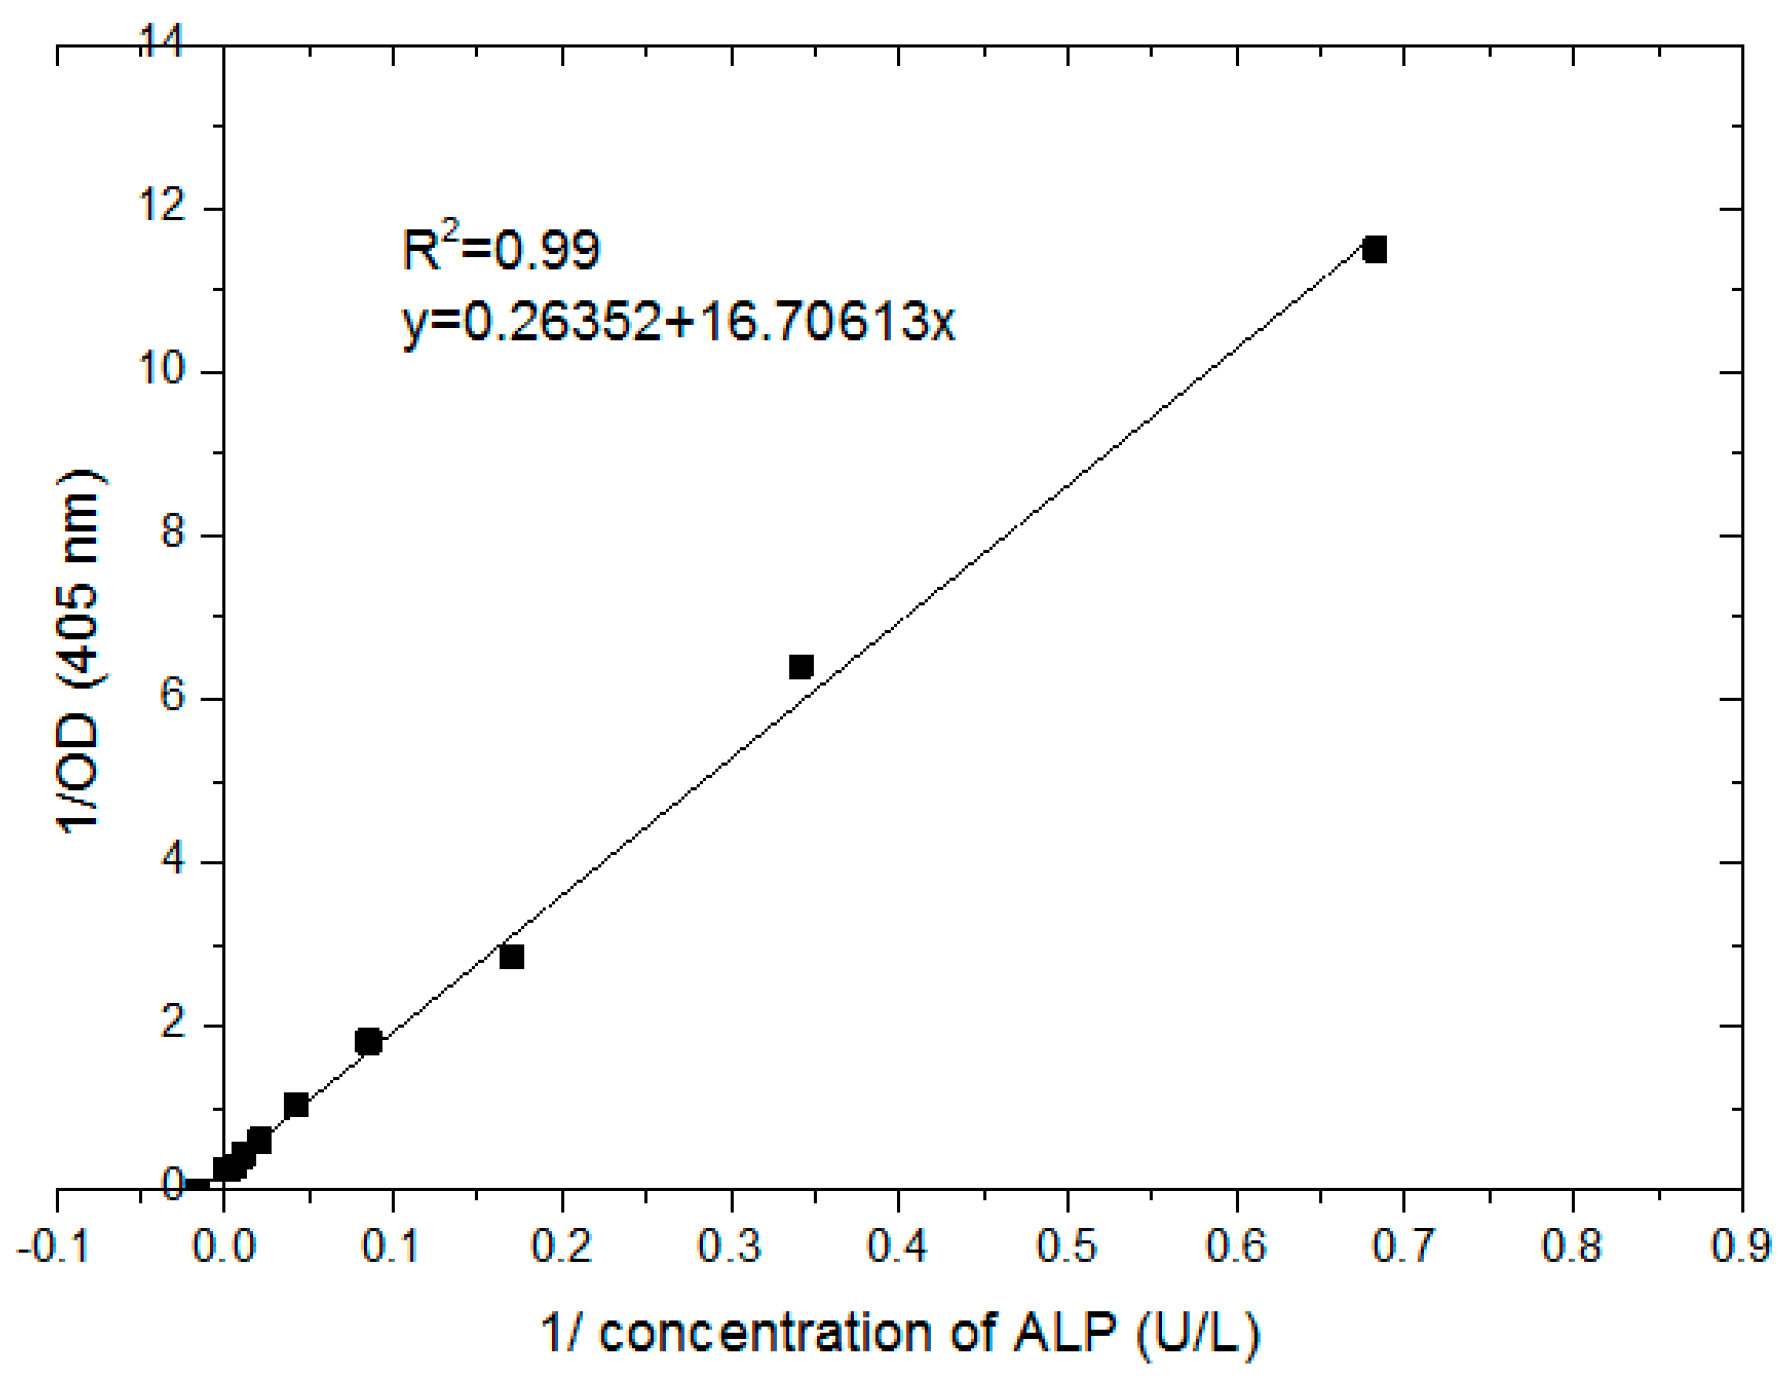
3.8. Alkaline Phosphatase Release from Cells at Post-Confluence Culture
The standard curve of ALP was applied in order to convert absorbance values to an enzyme unit (e.g., U/L). Figure 8 shows that the absorbance values of ALP concentration ranged from (1.5–1500 U/L). This was plotted using the Lineweaver–Burk model with good linear regression of R2 of 0.99 and linear equation obtained using Origin software. Monitoring of ALP release from Balb/c 3T3 cells, A549 cells, MCF-7 cells, and HT-29 cells was conducted. ALP was induced by differentiation using post-confluence culture. Cells were cultured for two more days after reaching 95–100% confluence on day 4. Table 3 summarizes the results of ALP release in the target days for each cell with the vehicle control (VC) and the blank. It is obvious that the ALP release increased gradually from day 4 to day 6. This rise was shown from all cells. Furthermore, the data of post-confluence culture (day 5 and day 6) were compared to the control (data of day 4) using an unpaired t-test. There was a significant difference between the data of ALP release from day 5 and day 6 compared to that released from day 4. Balb/c 3T3 cells had an average level of ALP of 7.24 U/L on day 4 and the value increased on day 5 and day 6 (8.67 U/L and 11.67 U/L, respectively). The value of lung cancer cells exhibited a sharp increment from day 4 to day 6, which was 10.12 U/L, 12.21 U/L, and 19.60 U/L. The breast cancer cells showed slight incensement from the fourth day to the sixth day, and that was 7.97 U/L, 9.51 U/L, and 10.19 U/L, respectively. The colon cancer cell had the highest release value of ALP (19.62 U/L) at confluence day compared to the others and also for the post-confluence day 5 and day 6 of 23.68 U/L and 27.22 U/L, respectively. Vehicle control of all cells showed less values. The cells of Balbc/3T3 and A549 had 2.75 U/L and 2.84 U/L, respectively, whereas the MCF-7 and Ht-29 cells had 3.44 U/L and 4.27 U/L, respectively, all of which represented significant differences when compared to the control. The buffer blank of all data was very low as no substrate was added to the assay.
4. Conclusions
ALP determination requires the real-time monitoring of cell behavior. Various cellular phenotypes are related to gene expression, which helps to understand emerging diseases including cancers. Several previous studies have shown the relationship between ALP and cell viability [38,39]. However, those studies were conducted under the standard cell culture assay. Function endpoints of those assays are labor-intensive, time-consuming, require detachment of cells, and thus hinder real-time assays and multiplex assays. Quantitative resazurin assays of cell viability have been proposed as a rapid and inexpensive method to evaluate the viability of cells during the release of ALP, which can further be used to verify studies of cell adhesion applications such as cell-based biosensors.
The main parameters affecting the results obtained from the resazurin assay include the concentration of resazurin, incubation time, and cell number. The optimal incubation time of resazurin reduction was four hours for all cells. High incubation time is more likely to reduce resorufin and form non-detectable products. The research also focused on different cells, one embryonic fibroblast cell line Balb/c3T3, and three epithelial cancer cell lines, A549, MCF-7, and Ht-29. These cells have different metabolic activities, which were noticed in this study. Ht-29 cells showed the highest activity and had 100 μM as an optimal concentration of resazurin, whereas the others had 50 μM.
Optimal density corresponding to the working area is very important in cell adhesion approaches. This enhances the detection of cell viability alongside the release of ALP, which may detect intracellular processes. Cells need to be proliferated for at least four days to release detectable ALP. This time can be further increased if a study is focusing on differentiation where optimizing density is required. Special attention is drawn to the morphology of cells, which was monitored and compared to the resazurin assay. The cells showed logistic growth curves where the four phases were obvious. Cells that had a longer lag phase had less confluence (about 70–80%, like MCF-7 cells). In comparison, others, which had a smaller lag phase, had a gradual log phase and thus had almost 95–100% confluence by day 4. Cell growth is also influenced by the surrounding environment (e.g., media type, serum). The recommended type of media and serum were used according to the supplier’s recommendations.
Cell viability of cells at post-confluence culture was determined and data were compared statistically using mean, standard deviation, p-value, and z-factor. The data of embryonic cells, lung cancer cells, and colon cancer cells displayed significant differences in post-confluence culture compared to the control (day 4). Similarly, breast cancer cells showed a p-value < 0.05 in day 6 and p > 0.05 in day 5 compared to the control. The cell viability of vehicle controls of the cells Balb/c 3T3, A549, MCF-7, and Ht-29 were 10.2%, 18.6%, 8.3%, and 18.2%, respectively. ALP release was increased gradually from day 4 to day 6. An increase of ALP release was shown from all cells during the three days. The levels of ALP during day 4, day 5, and day 6 from the Balb/c 3T3 cells were 7.24 U/L, 8.67 U/L, and 11.67 U/L, respectively; those from the A549 cells were 10.12 U/L, 12.21 U/L, and 19.60 U/L, respectively; those from the MCF-7 cells were 7.97 U/L, 9.51 U/L, and 10.19 U/L, respectively; and those from Ht-29 were 19.62 U/L, 23.68 U/L, and 27.22 U/L, respectively. Moreover, there was a significant difference between the data of ALP release from day 5 and day 6 compared to that released from day 4.
The main aim of this study was achieved by providing convenient and reliable samples of living cells for sensitively and continuously assaying using resazurin-based measurements, which made it easier for optimizing the methodologies for ALP release.
Author Contributions
Contributions: supervision, E.M.; writing—original draft preparation, T.B. All authors have read and agreed to the published version of the manuscript.
Funding
This research was funded by the Ministry of Higher Education of Saudi Arabia.
Acknowledgments
The authors would like to acknowledge the financial support of the Ministry of Higher Education of Saudi Arabia.
Conflicts of Interest
The authors declare that there are no conflicts of interest.
References
- Khalili, A.A.; Ahmad, M.R. A Review of Cell Adhesion Studies for Biomedical and Biological Applications. Int. J. Mol. Sci. 2015, 16, 18149–18184. [Google Scholar] [CrossRef] [Green Version]
- Koev, S.T.; Dykstra, P.H.; Luo, X.; Rubloff, G.W.; Bentley, W.E.; Payne, G.F.; Ghodssi, R. Chitosan: An integrative biomaterial for lab-on-a-chip devices. Lab Chip 2010, 1, 326–342. [Google Scholar] [CrossRef] [PubMed]
- Lukić, M.; Šimec, N.; Zatezalo, V.; Jurenec, S.; Radić-Krišto, D. Exclusion of Trypan blue exclusion test for CD34+cell viability determination: P007. Bone Marrow Transplant. 2017, 52, S126–S127. [Google Scholar]
- Menyhárt, O.; Harami-Papp, H.; Sukumar, S.; Schäfer, R.; Magnani, L.; de Barrios, O.; Győrffy, B. Guidelines for the selection of functional assays to evaluate the hallmarks of cancer. BBA Rev. Cancer 2016, 1866, 300–319. [Google Scholar] [CrossRef] [PubMed] [Green Version]
- Uzarski, J.S.; Bijonowski, B.M.; Wang, B.; Ward, H.H.; Wandinger-Ness, A.; Miller, W.M.; Wertheim, J.A. Dual-Purpose Bioreactors to Monitor Noninvasive Physical and Biochemical Markers of Kidney and Liver Scaffold Recellularization. Tissue Eng. Part C Methods 2015, 21, 132–1043. [Google Scholar] [CrossRef] [Green Version]
- Ren, X.; Tapias, L.F.; Jank, B.J.; Mathisen, D.J.; Lanuti, M.; Ott, H.C. Ex vivo non-invasive assessment of cell viability and proliferation in bio-engineered whole organ constructs. Biomaterials 2015, 52, 103–112. [Google Scholar] [CrossRef] [Green Version]
- Tapias, L.F.; Gilpin, S.E.; Ren, X.; Wei, L.; Fuchs, B.C.; Tanabe, K.K.; Lanuti, M.; Ott, H.C. Assessment of Proliferation and Cytotoxicity in a Biomimetic Three-Dimensional Model of Lung Cancer. Ann. Thorac. Surg. 2015, 100, 414–421. [Google Scholar] [CrossRef]
- Ansar Ahmed, S.; Gogal, R.M.; Walsh, J.E. A new rapid and simple non-radioactive assay to monitor and determine the proliferation of lymphocytes: An alternative to [3H] thymidine incorporation assay. J. Immunol. Methods 1994, 170, 211–224. [Google Scholar] [CrossRef]
- O’Brien, J.; Wilson, I.; Orton, T.; Pognan, F. Investigation of the Alamar Blue (resazurin) fluorescent dye for the assessment of mammalian cell cytotoxicity. Eur. J. Biochem. 2000, 267, 5421–5426. [Google Scholar] [CrossRef]
- Shum, D.; Radu, C.; Kim, E.; Cajuste, M.; Shao, Y.; Seshan, V.E.; Djaballah, H. A high density assay format for the detection of novel cytotoxic agents in large chemical libraries. J. Enzym. Inhib. Med. Chem. 2008, 23, 931–945. [Google Scholar] [CrossRef] [Green Version]
- Kim, H.J.; Jang, S. Optimization of a resazurin-based microplate assay for large-scale compound screenings against Klebsiella pneumoniae. 3 Biotech 2018, 8, 1–6. [Google Scholar] [CrossRef] [PubMed]
- Van den Driessche, F.; Rigole, P.; Brackman, G.; Coenye, T. Optimization of resazurin-based viability staining for quantification of microbial biofilms. J. Microbiol. Methods 2014, 98, 31–34. [Google Scholar] [CrossRef] [PubMed]
- Chadha, S.; Kale, S. Simple fluorescence-based high throughput cell viability assay for filamentous fungi. Lett. Appl. Microbiol. 2015, 61, 238–244. [Google Scholar] [CrossRef] [PubMed]
- Goughenour, K.D.; Balada-Llasat, J.-M.; Rappleye, C.A. Quantitative microplate-based growth assay for determination of antifungal susceptibility of histoplasma capsulatum yeasts. J. Clin. Microbiol. 2015, 53, 3286–3295. [Google Scholar] [CrossRef] [PubMed] [Green Version]
- Moreau, K.; Surand, J.; Le Dantec, A.; Mosrin-Huaman, C.; Legrand, A.; Rahmouni, A. Recombinant yeast and human cells as screening tools to search for antibacterial agents targeting the transcription termination factor Rho. J. Antibiot. 2018, 71, 447–455. [Google Scholar] [CrossRef] [PubMed] [Green Version]
- Bowling, T.; Mercer, L.; Don, R.; Jacobs, R.; Nare, B. Application of a resazurin-based high-throughput screening assay for the identification and progression of new treatments for human African trypanosomiasis. Int. J. Parasitol. Drugs Drug Resist. 2012, 2, 262–270. [Google Scholar] [CrossRef] [Green Version]
- Rolón, M.; Vega, C.; Escario, J.A.; Gómez-Barrio, A. Development of resazurin microtiter assay for drug sensibility testing of Trypanosoma cruzi epimastigotes. Parasitol. Res. 2006, 99, 103–107. [Google Scholar] [CrossRef]
- Uzarski, J.S.; DiVito, M.D.; Wertheim, J.A.; Miller, W.M. Essential design considerations for the resazurin reduction assay to noninvasively quantify cell expansion within perfused extracellular matrix scaffolds. Biomaterials 2017, 129, 163–175. [Google Scholar] [CrossRef]
- Latner, A.L.; Skillen, A.W. Isoenzymes in Biology and Medicine; Academic Press Inc.: London, UK, 1968. [Google Scholar]
- Sharma, U.; Pal, D.; Prasad, R. Alkaline Phosphatase: An Overview. Indian J. Clin. Biochem. 2014, 29, 269–278. [Google Scholar] [CrossRef] [Green Version]
- Acton, Q.A. Transforming Growth Factors—Advances in Research and Application; Scholarly Editions: 2013. Available online: https://books.google.td/books?id=dARP4d1Io3wC (accessed on 12 April 2019).
- Herz, F.; Halwer, A.S.M.; Bogart, L.H. Alkaline phosphatase in HT-29, a human colon cancer cell line: Influence of sodium butyrate and hyperosmolality. Arch. Biochem. Biophys. 1981, 210, 581–591. [Google Scholar] [CrossRef]
- Tsai, L.-C.; Hung, M.-W.; Chen, Y.-H.; Su, W.-C.; Chang, G.-G.; Chang, T.-C. Expression and regulation of alkaline phosphatases in human breast cancer MCF-7 cells. Eur. J. Biochem. 2000, 267, 1330–1339. [Google Scholar] [CrossRef] [PubMed]
- Hui, M.; Hu, M.; Tenenbaum, H.C. Changes in cell adhesion and cell proliferation are associated with expression of tissue non-specific alkaline phosphatase. Cell Tissue Res. 1993, 274, 429–437. [Google Scholar] [CrossRef] [PubMed]
- Guerreiro, S.; Monteiro, R.; Martins, M.J.; Calhau, C.; Azevedo, I.; Soares, R. Distinct modulation of alkaline phosphatase isoenzymes by 17beta-estradiol and xanthohumol in breast cancer MCF-7 cells. Clin. Biochem. 2007, 40, 268. [Google Scholar] [CrossRef] [PubMed]
- Alberts, B.; Lewis, J.A. Molecular Biology of the Cell, 4th ed.; Studying Gene Expression and Function; Garland Science: New York, NY, USA, 2002. [Google Scholar]
- Yang, T.-T.; Sinai, P.; Kain, S.R. An Acid Phosphatase Assay for Quantifying the Growth of Adherent and Nonadherent Cells. Anal. Biochem. 1996, 241, 103–108. [Google Scholar] [CrossRef] [PubMed]
- Friedrich, J.; Eder, W.; Castaneda, J.; Doss, M.; Huber, E.; Ebner, R.; Kunz-Schughart, L.A. A reliable tool to determine cell viability in complex 3-D culture: The acid phosphatase assay. J. Biomol. Screen. 2007, 12, 925–937. [Google Scholar] [CrossRef] [PubMed] [Green Version]
- Ivanov, D.P.; Parker, T.L.; Walker, D.A.; Alexander, C.; Ashford, M.B.; Gellert, P.R.; Garnett, M.C. Multiplexing spheroid volume, resazurin and acid phosphatase viability assays for high-throughput screening of tumour spheroids and stem cell neurospheres. PLoS ONE 2014, 9, e103817. [Google Scholar] [CrossRef] [Green Version]
- Joanne, K.; Itano, J.B.; Conde, F.; Saria, M. Core Curriculum for Oncology Nursing, 5th ed.; Elsevier Inc.: Amsterdam, The Netherlands, 2016. [Google Scholar]
- Pace, R.T.; Burg, K.J.L. Toxic effects of resazurin on cell cultures. Cytotechnology 2015, 67, 13–17. [Google Scholar] [CrossRef] [Green Version]
- Hamalainen-Laanaya, H.K.; Orloff, M.S. Analysis of cell viability using time-dependent increase in fluorescence intensity. Anal. Biochem. 2012, 429, 32–38. [Google Scholar] [CrossRef]
- Zheng, F.; Wang, S.; Hou, W.; Xiao, Y.; Liu, P.; Shi, X.; Shen, M. Comparative study of resazurin reduction and MTT assays for cytocompatibility evaluation of nanofibrous materials. Anal. Methods 2019, 11, 483–489. [Google Scholar] [CrossRef]
- Adams, D.L.; Zhu, P.; Makarova, O.V.; Martin, S.S.; Charpentier, M.; Chumsri, S.; Li, S.; Amstutz, P.; Tang, C.-M. The systematic study of circulating tumor cell isolation using lithographic microfilters. Rsc Adv. 2014, 4, 4334–4342. [Google Scholar] [CrossRef]
- Majeska, R.J.; Rodan, G.A. The Effect of 1,25(OH)2D3 on Alkaline-Phosphatase In Osteoblastic Osteo-Sarcoma Cells. J. Biol. Chem. 1982, 257, 3362–3365. [Google Scholar] [PubMed]
- Castrén, E.; Sillat, T.; Oja, S.; Noro, A.; Laitinen, A.; Konttinen, Y.T.; Lehenkari, P.; Hukkanen, M.; Korhonen, M. Osteogenic differentiation of mesenchymal stromal cells in two-dimensional and three-dimensional cultures without animal serum. Stem Cell Res. Ther. 2015, 6, 167. [Google Scholar] [CrossRef] [PubMed] [Green Version]
- Xiao, J.; Zhang, Y.; Wang, J.; Yu, W.; Wang, W.; Ma, X. Monitoring of Cell Viability and Proliferation in Hydrogel-Encapsulated System by Resazurin Assay. Appl. Biochem. Biotechnol. 2010, 162, 1996–2007. [Google Scholar] [CrossRef] [PubMed]
- Kang, J.; Martins, A.M. The strong correlation between alkaline phosphatase activity and cell viability. Cell Biol. Int. 2008, 32, 163–164. [Google Scholar] [CrossRef] [PubMed]
- Akcakaya, H.; Aroymak, A.; Gokce, S. A quantitative colorimetric method of measuring alkaline phosphatase activity in eukaryotic cell membranes. Cell Biol. Int. 2007, 31, 186–190. [Google Scholar] [CrossRef] [PubMed]
Figure 1.
Generalized scheme representing an optimization protocol of a resazurin-based assay for the determination of cancer cell numbers.
Figure 1.
Generalized scheme representing an optimization protocol of a resazurin-based assay for the determination of cancer cell numbers.

Figure 2.
Optimization of the concentration of resazurin at various cell lines. (A) Balbc/3T3 cell lines; (B) A549 cell lines; (C) MCF-7 cell lines; (D) Ht-29 cell lines; (E) coefficient variance % of resazurin concentration of vs cells numbers. Data are expressed as the mean ± SD of measurements of three independent experiments.

Figure 3.
Effect of incubation time on fluorescence intensity measured during resazurin reduction. (A) Balbc/3T3 cell lines; (B) A549 cell lines; (C) MCF-7 cell lines; (D) Ht-29 cell lines; (E) Coefficient variance % of incubation time vs. cells numbers. Data are expressed as the mean ± SD of the measurements of three independent experiments.

Figure 4.
Experimental and theoretical standard curves of resazurin at various cell lines. (A) Balbc/3T3 cell lines; (B) A549 cell lines; (C) MCF-7 cell lines; (D) Ht-29 cell lines; (E) Coefficient variance % of experimental curves vs. cells numbers. (F) Errors % of theoretical and experimental curves vs. cell number. Data are expressed as mean ± SD of measurements of three independent experiments.

Figure 5.
Logistic growth curves of the different cell densities at various cell lines over five days. (A) Balbc/3T3 cell lines; (B) A549 cell lines; (C) MCF-7 cell lines; (D) Ht-29 cell lines; (E) coefficient variance % of growth curves vs. cells numbers. Data are expressed as the mean ± SD of measurements of three independent experiments.

Figure 6.
Microscope images of the four cells over five days.

Figure 7.
Logistic growth curves of (A) Balbc/3T3 cell lines; (B) A549 cell lines; (C) MCF-7 cell lines; and (D) Ht-29 cell lines, over five days. (◻) estimated cell number using linear equation of standard curve and, (⚪) accounted cell number using hemocytometer; all compared versus incubation time over five days. Data are expressed as the mean ± SD of measurements of three independent experiments.

Figure 8.
The standard curve of the absorbance values vs. alkaline phosphatase (ALP) concentration ranging from 1.5–1500 U/L was fitted by the Lineweaver–Burk model with R2 = 0.99.
Figure 8.
The standard curve of the absorbance values vs. alkaline phosphatase (ALP) concentration ranging from 1.5–1500 U/L was fitted by the Lineweaver–Burk model with R2 = 0.99.


Table 1.
The media and serum of each cell line used for cell culture.
| Cell Lines | Balb/c 3T3 | A549 | MCF-7 | Ht-29 | |
|---|---|---|---|---|---|
| Complete media | Media | DMEM | DMEM | MEME | McCoy’s 5A |
| 10 % Serum | NBCS | FBS | |||
Completed media represent the addition of 10% of serum to the media suitable for each cell line, according to the manufacturer’s recommendations.
Table 2.
Summary of the resazurin data of each cell line versus the target days at post-confluence.
| Balb/c 3T3 | A549 | MCF-7 | Ht-29 | |
|---|---|---|---|---|
| Day 4 | 3091.61 ± 28.74 | 2784.46 ± 43.35 | (1887.34 ± 5.36) | (2980.70 ± 44.51) |
| Day 5 | 2513.44 ± 7.77 *§ | (1952.29 ± 0.82) *§ | (1787.48 ± 35.99) | (2655.06 ± 34.07) * |
| Day 6 | 1872.74 ± 6.72 *§ | (1415.29 ± 44.35) *§ | (1407.01 ± 66.13) *§ | (2512.21 ± 48.32) * |
| VC | (412.6 ± 9.9) *§ | (597.6 ± 23.3) *§ | (237.8 ± 3.1) *§ | (623.8 ± 4.5) *§ |
| RC | (97.2 ± 6.3) *§ | (78.7 ± 0.9) *§ | (80.5 ± 0.3) *§ | (82.7 ± 0.7) *§ |
The data of the cell viability assay-based resazurin was applied for the cells at post-confluence culture. Data are expressed as mean ± SD of the measurements of three independent experiments. VC (vehicle control,) and RC (resazurin control). Data compared to the control (data of day 4), * (p-value < 0.05 is a significant difference), § (1 > Z-factor > 0.5 is excellent assay).
Table 3.
Summary of ALP release from each cell line versus target days at post-confluence culture.
| Quantity of ALP Release (U/L) in Each Day | |||||
|---|---|---|---|---|---|
| Day 4 | Day 5 | Day 6 | VC | Blank | |
| Balb/c 3T3 | * | * | * | * | |
| A549 | * | * | * | * | |
| MCF-7 | * | * | * | * | |
| Ht-29 | * | * | * | * | |
After exposing cells to the corresponding optimal substrate concentration of pNPP, absorbance 405 detection was converted to unit per liter using the equation in Figure 8. The obtained data were expressed as the mean ± SD of measurements of three independent experiments with VC (vehicle control) that had dead cells, and the blank with no cells and no substrate. p-value of post-confluence culture compared to the control (data of day 4), * p < 0.05 is significantly different.
© 2020 by the authors. Licensee MDPI, Basel, Switzerland. This article is an open access article distributed under the terms and conditions of the Creative Commons Attribution (CC BY) license (http://creativecommons.org/licenses/by/4.0/).
Share and Cite
MDPI and ACS Style
Balbaied, T.; Moore, E. Resazurin-Based Assay for Quantifying Living Cells during Alkaline Phosphatase (ALP) Release. Appl. Sci. 2020, 10, 3840. https://0-doi-org.brum.beds.ac.uk/10.3390/app10113840
AMA Style
Balbaied T, Moore E. Resazurin-Based Assay for Quantifying Living Cells during Alkaline Phosphatase (ALP) Release. Applied Sciences. 2020; 10(11):3840. https://0-doi-org.brum.beds.ac.uk/10.3390/app10113840
Chicago/Turabian StyleBalbaied, Thanih, and Eric Moore. 2020. "Resazurin-Based Assay for Quantifying Living Cells during Alkaline Phosphatase (ALP) Release" Applied Sciences 10, no. 11: 3840. https://0-doi-org.brum.beds.ac.uk/10.3390/app10113840
Note that from the first issue of 2016, this journal uses article numbers instead of page numbers. See further details here.