Cycling Biomechanics and Its Relationship to Performance


1
IRISSE Lab (EA 4075)-117, University of La Réunion, Rue du Général Ailleret, 97430 le Tampon, France
2
Bruno Watier, LAAS-CNRS-7, Av du Colonel Roche, 31400 Toulouse, France
*
Author to whom correspondence should be addressed.
Appl. Sci. 2020, 10(12), 4112; https://0-doi-org.brum.beds.ac.uk/10.3390/app10124112
Submission received: 7 May 2020
/
Revised: 6 June 2020
/
Accepted: 8 June 2020
/
Published: 15 June 2020
(This article belongs to the Special Issue Applied Biomechanics in Sport, Rehabilitation and Ergonomy)
Abstract
:Featured Application
This review could help researchers, trainers and cyclists to better understand the complex link between classic biomechanical variables and cycling performance. Thus, it could assist professional and amateur cyclists in extracting relevant information from the laboratory assessments and attaining better performances.
Abstract
State-of-the-art biomechanical laboratories provide a range of tools that allow precise measurements of kinematic, kinetic, motor and physiologic characteristics. Force sensors, motion capture devices and electromyographic recording measure the forces exerted at the pedal, saddle, and handlebar and the joint torques created by muscle activity. These techniques make it possible to obtain a detailed biomechanical analysis of cycling movements. However, despite the reasonable accuracy of such measures, cycling performance remains difficult to fully explain. There is an increasing demand by professionals and amateurs for various biomechanical assessment services. Most of the difficulties in understanding the link between biomechanics and performance arise because of the constraints imposed by the bicycle, human physiology and musculo-skeletal system. Recent studies have also pointed out the importance of evaluating not only output parameters, such as power output, but also intrinsic factors, such as the cyclist coordination. In this narrative review, we present various techniques allowing the assessment of a cyclist at a biomechanical level, together with elements of interpretation, and we show that it is not easy to determine whether a certain technique is optimal or not.
1. Introduction
Cycling performance is dependent on the optimization of physiological, psychological and biomechanical parameters [1]. Several reviews already exist regarding physiologic or psychological performance parameters [2,3,4], and there is a need for a better understanding of the biomechanical parameters. There is also an increasing demand by professionals and amateurs for various biomechanical assessment services on the optimization of cyclist technique, which indicates a great interested in these measurements. However, the interpretation of these measurements is not always straightforward.
In this review, the term technique refers to input, that is, the cyclist’s coordination, how forces are applied on pedals or how multiple muscles are coordinated with each other. The term performance refers to output, that is, the total power output or the time spent to travel a certain distance. The inputs are the result of the motor commands which directly or indirectly manipulate the degrees of freedom of the system. Here the degrees of freedom are defined in a broad sense as variables that influence motor output, such as muscle forces, muscle activations and joint angles. What is called the cyclist technique represents the spatiotemporal arrangement of the different degrees of freedom. The output that we call performance is a complex function of the inputs due to the complexity of muscle mechanics, the number of segments put in motion, or the limitations of our central nervous system in coordinating the degrees of freedom.
The links between technique and performance are poorly understood. One reason for this is the redundancy of the musculo-skeletal system [5], that is, several combinations of degrees of freedom can produce the same output in cycling. For example, the same power output can be achieved using different joint torque combinations at the hip, knee, ankle, and upper limbs, or using either the seated or standing position. The power output depends on the time course of the forces applied on the pedal, and these forces may be oriented in very different ways while producing the same torque output. Different positions, by changing saddle height or using different orientation of the trunk, could also lead to a similar output power [6].
Additionally, various constraints can either limit the number of degrees of freedom available or make the relation between technique and performance more complex. For example, when a cyclist is in a seated position, the pelvis is relatively fixed and each foot is constrained to follow a circle, limiting the range of joint positions available (e.g., in this position one cannot fully extend the knee much and the knee joint cannot be flexed without changing the other joint angles). As a second example, a clear link exists between the forces at the crank and the power that the cyclist produces (i.e., only the forces orthogonal to the crank arm produce power) [7]. However, even experienced cyclists do not use pure orthogonal (effective) forces [8]. One reason is that some of these forces are non-muscular (e.g., gravity [9]) and depend little on how muscles are coordinated. Producing pure orthogonal forces is also hardly compatible with the maximization of the power output (see the section on crank power-output below). The presence of or the need to prevent acute or overuse injuries might also influence the technique and limit the effectiveness of the forces applied to the pedals. It has been shown, for example, that the output from the central nervous system is decreased in the presence of pain [10] and that movement kinematics can be altered by previous injuries [11]. In other words, human neurophysiology and biomechanics impose constraints that need to be understood and measured if possible to determine how to achieve the best performance.
Thus, the aim of this narrative review is to describe how to obtain full-body mechanical and muscular information about cyclist technique and how the technique is related to cycling performance. The measurements presented are mostly obtained from laboratory measurements. The laboratory offers the opportunity to precisely control the environment and the exercising conditions, and it is generally associated with more complete measures compared with the field. Racing bicycles and laboratory ergometers present some differences in terms of mobility (i.e., side-to-side leaning) or mechanical properties (e.g., flywheel inertia, compliance). Therefore, the techniques used with one or the other device may also differ [12]. The diverse environmental factors present in the field (e.g., terrain unevenness, wind speeds) may also affect the cycling performances [13,14]. Despite these limitations, laboratory testing has been proven to provide accurate modeling and evaluation of the cycling performance and may even allow for the prediction of competition scenarios [6,15,16].
2. Crank Power-Output
A bicycle can be viewed as a device that converts the work produced at the crank by the cyclist into kinetic energy (, with m the mass of the bicycle plus cyclist and v the velocity of the bike). Thus, maximizing performance requires increasing the kinetic energy of the system (cyclist plus bicycle) and, consequently, the crank power over time. Maximal crank power and the ability to maintain a high power output over time are the primary performance parameters to assess in cyclists [17,18]. It can be noted that forward acceleration is reduced for greater mass of the bike and cyclist and for greater resistances (aerodynamic forces, rolling friction and gravity during uphill cycling), but these later points will not be discussed in this paper.
At each instant, the crank power output (in Watt) represents the power developed by the two pedals which are computed for each pedal using the scalar product (dot product) between the vector force applied at the pedal (N) and the pedal velocity (m/s). Crank power can be computed equivalently using the scalar product between the torque vector at the crank (N·m) and its angular velocity (rad/s). Thus, only the forces applied orthogonally to the crank arm, named the effective forces, generate power. The other forces directions are not effective, and they might cost energy metabolically [19]. Moreover, effective forces can be in the direction of the movement (i.e., positive), increasing the total power output, or in the opposite direction (i.e., negative), decreasing the total power output.
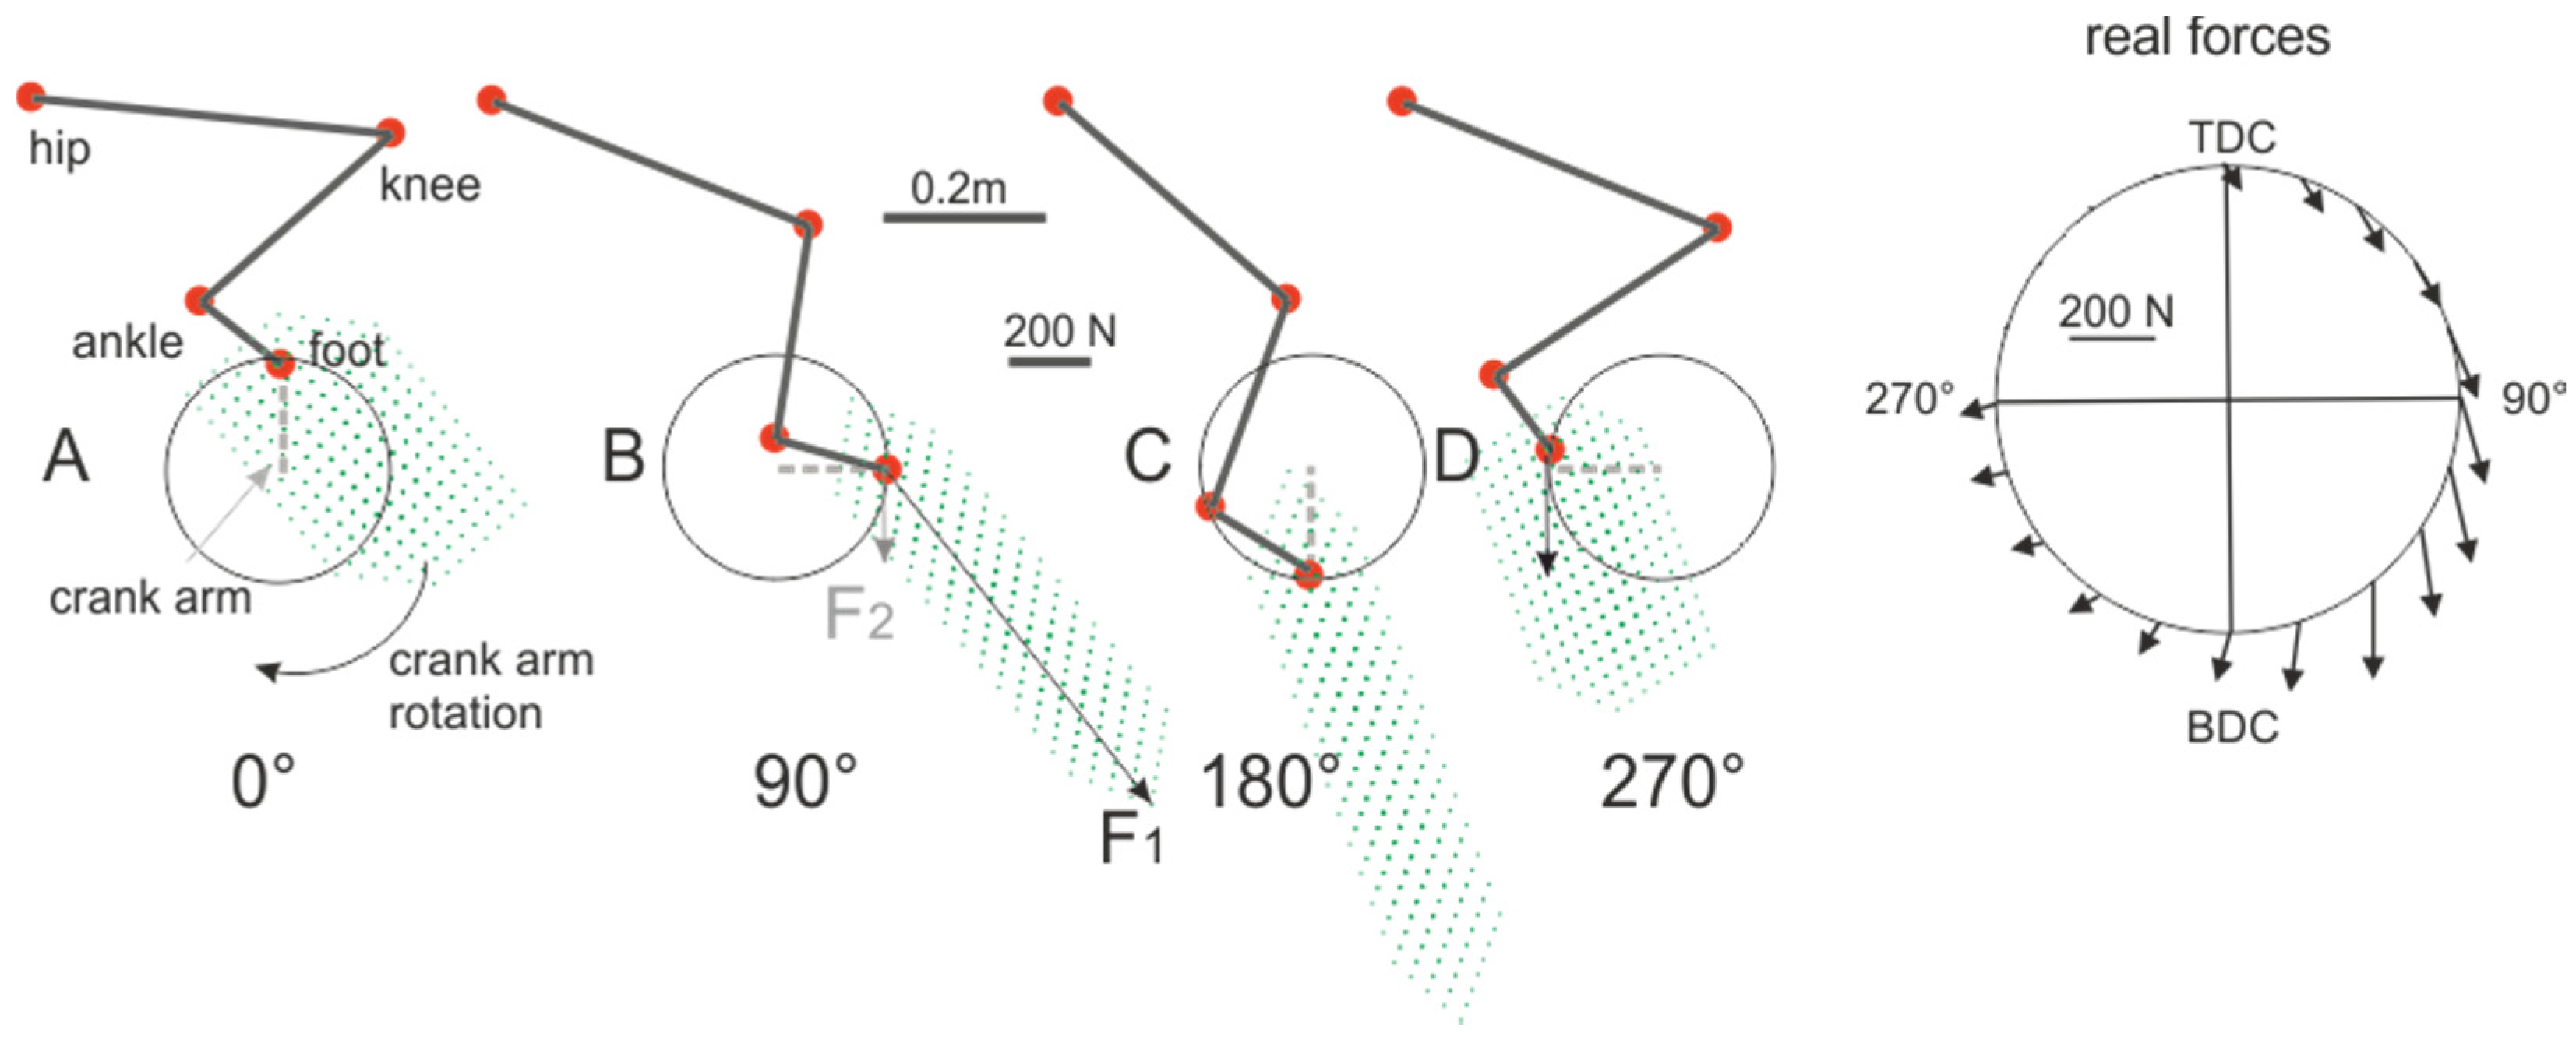
The efficacy of the pattern of force application is assessed by analyses of the pedal forces [20,21,22]. A classic measure is the ratio between the orthogonal force and the total force applied on the pedal, named the mechanical effectiveness (ME, [23]). When averaged over one cycle, ME is in the range of 0.15 to 0.8 [7,24], with 1 indicating that only effective forces are created throughout the cycle. Previous studies showed that ME can be improved with practice [20,25,26,27], notably by pulling on the pedal during the upstroke to compensate for the weight of the leg [28]. However, this resulted in more complex muscle activity patterns [27] and additional energy expenditure [29]. A previous study suggested that gross efficiency (the ratio between mechanical work and metabolic energy expenditure) could be improved as well with more practice (i.e., >15 min) [25]. Therefore, the relation between ME and cycling performance is still unclear, and further studies are needed to clarify this topic [30]. Using a simple static mechanical analysis using the maximal torque capabilities of the hip, knee and ankle joints, it can be shown that maximizing the power-output without producing ineffective forces is unlikely to be feasible (Figure 1). In order to produce this figure we used the relation to identify the feasible forces that could be generated given the joint moments at the hip, knee and ankle [31,32]. In this relation, is a 2-by-1 pedal forces vector, is a 2-by-3 Jacobian matrix relating the variations in hip, knee and ankle joint angles and the variations in foot tip positions, and is a 3-by-1 joint torques vector. The symbol T represents matrix transposition. In this model we neglected the changes in joint moment due to joint position and joint angular velocity and also gravity and inertial effects. The joint torques and kinematics were obtained from Watier et al. [33]. the length of the thigh, leg and foot were 0.45 m, 0.38 m and 0.15 m, respectively. Figure 1 provides an illustration of the possible and limited force directions and amplitudes for different joint configurations during cycling. It shows that the forces that would provide the maximum effective force necessarily produce an ineffective force component (i.e., the force F1 in Figure 1). In other words, the joint configuration constrains the direction of force application on the pedal. Thus, even if ME can be improved it would be counter-productive to try to achieve a ME of 1 in a case where power-production should be maximized (e.g., sprints). ME might nevertheless be an important parameter when the goal is to sustain a high-level of power-output without fatigue [21,29].
The study of the positive and negative effective forces and torques over one cycle might provide alternative indicators of the cyclist technique [24]. For example, Garcia-Lopez et al. [22] showed a positive correlation between the level of practice and the proportion of positive effective torques, and a negative correlation between the level of practice and the magnitude of the negative effective torques. These results suggest that elite cyclists generate more positive effective torques during the downstroke and pull on the pedal during the recovery phase to limit negative effective torques.
In conclusion, the maximal crank power output and the ability to maintain high power over time are the primary performance parameters in cycling. The mechanical efficiency appears as a controversial measure of cyclist technique and deserves further study [30]. Conversely, the positive and negative parts of the effective torques at the crank level might be simpler measures of the cyclist technique.
3. Joint Torque
Crank power is the result of the powers developed at each joint (ankle, knee and hip) and the power transferred across the hip joint from the upper-body [34]. Joint power is the scalar product of joint torque (N·m) and joint angular velocity (rad/s). Angular velocity is computed by the derivation of the position of the segments, which is obtained directly from a system of cameras (e.g., Vicon, OptiTrack) or using inertial measurement units, whereas joint torque is estimated using inverse dynamic procedures [35]. An example of torque profile at the crank axis, the hip, the knee and the ankle computed at maximal power is provided in Figure 2. Note that joint torque and power can also be assessed for individual joint using isokinetic devices (e.g., Biodex, Contrex [33]). Joint torque represents an estimation of the net muscular efforts around the joints. The imprecision is due to approximate anthropometric tables (segment mass and inertia) and approximate kinematics of the segments (e.g., soft tissue artefact influence). Moreover, joint torque is the result of the actions produced by composite structures combining the activity of several agonist and antagonist muscles crossing a joint and the action of passive tissues such as ligaments or the joint capsule. Despite these methodologic approximations, joint torques and joint power are the usual way in which the work generated by the muscles is quantified and the techniques used by cyclists are compared.
Joint power is generally used to assess the contribution of the different joints to the crank power output. Previous studies showed that this distribution is approximately 40%, 40%, 15% and 5% for the hip, knee, ankle and trunk/upper limbs (hip transfer), respectively [36], but it varies with the target power, pedaling rate or position [36,37]. This distribution is meaningful because crank power is the sum of the joint powers and of the power transferred across the hip when these variables are integrated over an entire cycle (for a time-to-time analysis, the kinetic energy of the system must be taken into account). The distribution of joint powers can be studied for the purpose of identifying which joint contribution is most affected by a modified position or by fatigue, for example [34,37]. Martin et al. (2009) [34] showed that ankle power decreased more rapidly than hip and knee power during a maximal cycling trial of 30 s, suggesting that the muscles crossing the ankle joint might require specific attention when a cyclist is training for sprint events.
There is a less direct relationship between joint torque and crank power output. It is worth noting that joint torques are not necessarily maximized when cycling at maximal power [33], in part because such maximization would not necessarily create forces in the proper direction at the level of the pedal. Indeed, the distribution of joint torque at a given time is directly related to the pedal force direction (i.e., in static conditions, equation detailed above). Joint torque distribution varies slightly with fatigue (for the ankle joint [38]) and more importantly with pedaling frequency and crank-power output (for the knee and hip joints) [39]. As a consequence, these changes should be related to changes in the index of mechanical effectiveness [7,40]. However, the relation between force direction and joint torque distribution is made more complex due to the gravitational and inertial effects on the pedal forces, which also vary notably with pedaling frequency and power output [9,41]. Given that the forces at the pedal can have different directions, it is clear that several combinations of joint torques can produce the same power-output. Because joint torque is related to muscular forces, it can be used to compute cost functions to obtain global measures of the effort associated with the use of a specific technique (i.e., a specific organization of the torques across time and joints). A cost function is a mathematical quantity generally calculated from several variables and used to get a single value representing the cost of the movement [42,43,44]. Gonzalez and Hull [42] were among the first to propose choosing the technique-cycling position and cadence-based on the minimization of the joint torques produced at the knee and hip joints. As an example, a moment-based cost function can be computed as follows [44]:
with , , and the mean values over a full crank cycle of the three-dimensional ankle, knee, and hip joint moments, respectively. represents the Euclidian norm of the vector. Using this cost-function it has been possible to define the power-output at which the standing position should be chosen over the seated position [44,45] (i.e., when comparing the cost of the two techniques over a wide range of powers there is a clear point or a clear power-output, at which the standing position becomes the optimal position). Cost functions have been suggested to be useful to define individualized bike settings for cyclists or to monitor the effects of training, fatigue and rehabilitation, for example [46], but further investigations are needed.
4. Seat and Handlebar Forces and the Role of the Upper Arms
The mechanical actions of muscles are transmitted to the bicycle at different points of interaction (i.e., the handlebars, pedals and seat), and they can be measured using appropriate force sensors (Figure 3). The forces applied at the seat and handlebars do not produce power directly, but they are interesting to study as part of a whole-body cycling technique. It is worth noting that handlebar force sensors together with motion capture technologies allow the study of the torques and powers at the wrist, elbow and shoulder using inverse dynamics.
The seat forces are the result of the weight of the upper body, the action of the arms and the reaction of the leg forces through the hip joints [47]. When the forces produced by the legs increase the reaction forces at the hip joint (upward forces) also increase and the seat reaction forces tend to decrease. Cyclists compensate for these forces by pulling on the handlebars and the pedals until they reach a point (~500 N on the pedal; Figure 3) at which they tend to adopt the standing position [46,47]. Moreover, cycling requires the alternation of right and left leg forces at the crank, which, even during seated cycling, create destabilizing motions of the trunk that must be absorbed by the arms [48,49]. Therefore, the forces developed by the upper limbs play significant roles during cycling and might be associated non negligible energy costs [50,51]. Thus, it is important to quantify these forces, to determine, for example, if fatigue could occur at this level and decrease the performance.
Previous studies asked whether the upper limbs could transfer energy to the lower limbs via the hips. It has been shown that the power developed by the upper limbs is no more than approximately 3% to 5% of the crank power output [36,52]. Their contribution is therefore very modest. Nonetheless, their role is important during high-intensity cycling and should not be underestimated because the power output noticeably decreases when upward forces on the handlebar cannot be produced (−10% to −20%) [53]. It has been suggested that upper limb muscles do not necessarily produce power, but instead facilitate the reaching of the highest power outputs by providing stable support for the leg actions [54]. However, it is not clear whether an improvement in the coordination of upper and lower limbs might improve the performance or not. These elements suggest that hand positioning may have a significant influence in the context of maximal power production. A previous study suggested, for example, that positioning the hands on the upper bar of the handlebar can improve the maximal power output during starting conditions [55]. The effect of hand positioning has also been studied in the context of whole-upper body positioning. Studies have shown that using the upright, dropped and aerodynamic postures or different trunk angles altered muscle activation levels at both the lower and upper limb muscles and also altered the index of efficiency [56,57,58,59], suggesting that the lower limb joint torque distribution was influenced by upper body postures.
In conclusion, there is now evidence showing the importance of the trunk and upper limb biomechanics, which are more and more integrated into biomechanical models [60]. Their actions are essential to reach the maximal power output, and upper body positioning has a non-negligible effect on performance.
5. Electromyography
Muscle electrical activity is measured using electromyography (EMG, Figure 4A,B). EMG patterns of the main upper and lower limb muscles involved in cycling are illustrated in Figure 4C,D. The amplitude of the EMG signal has a monotonic relationship with the number of muscle fibers activated [61], and it is therefore a good indicator of the intensity of a contraction. However, EMG signal analysis and interpretation are generally complex and require a certain expertise to understand [62] (see also the SENIAM recommendations).
The EMG signal is mostly used to characterize muscle coordination or the intensity of muscle activations, which are useful for comparing the technique associated with different conditions such as different positions on the bicycle (Figure 4C,D). Coordination refers to the relative level of activation of different muscles and their relative timing, and it is thought to represent a critical determinant of mechanical efficiency and power output during cycling [63,64].
EMG patterns, as well as kinematic patterns, are less variable and more consistent across cycles in experts than in novice cyclists [65,66], showing that the variability of muscle coordination could be an indicator of expertise. Similarly, the level of antagonist muscle co-activation could be an indicator of the efficiency of a cyclist’s technique [67]. Antagonist muscle co-activation refers to the activation of an antagonist of a movement (e.g., the gastrocnemius muscles; cf. Figure 4) during the action of its agonist (the tibalis anterior muscle), and it is often computed as a ratio of antagonist-to-agonist EMG signal amplitude (in percentage of the maximal activity). Minimizing antagonist co-activation could be a solution to maximizing performance because if the antagonist muscle is unable to fully relax during its agonist action, it creates a resistance that interferes with the movement. Actually, the level of antagonist co-activation between knee flexors (biceps femoris muscle) and extensors (rectus femoris and the vastus muscles) has been shown to be lower in cyclists than triathletes. This level was associated with better cycling economy in cyclists [67], suggesting that reducing the antagonist co-activation level can improve cycling efficiency. The level of antagonist co-activation is also less between ankle flexors (the tibialis anterior muscle) and extensors (the gastrocnemius muscles in particular) in experts compared with novices [66]. However, no previous studies clearly correlated the cycling performance with the level of antagonist co-activation, and it is worth it to mention that antagonist co-activation is always present in highly trained cyclists [8,68]. Actually, the notion of antagonist is fundamentally ambiguous when considering bi-articular muscles. Bi-articular muscles such as the rectus femoris, biceps femoris, semi-tendinosus and gasttrocnemius muscles (cf. Figure 4) create opposite torques at two different joints. For example, the biceps femoris muscle, which is activated with the knee extensors (the vastus muscle) around the top dead center, creates a flexion torque at the knee and an extension torque at the hip. This results in a torque at the intermediate limb (i.e., the thigh in this example) that depends on the difference between the moment arms of the muscles at the two joints [69], and this difference may actually favor lower limb extension. Therefore, when considering bi-articular muscles, the presence of antagonist co-activation is not necessarily a sign of poor coordination in cycling.
The EMG, as well as torque measurements, gives an indirect measure of the muscular forces. However, it has the advantage of being related solely to the muscle that is recorded. This particularity allows us to obtain information from agonist and antagonist muscle activity, for example, which is not possible using joint torque measurements. The EMG signal also appears to bear a relation to metabolic power [64]. However, compared with metabolic power, the EMG signals provide higher temporal resolution than the estimates obtained through gas exchange. For these reasons, the EMG-based cost functions, computed as the sum or weighted sum of the EMG signals of several muscles, have been used to assess the cost of cycling. EMG-based cost functions have been used, for example, to identify the optimal cadence at a given power output [70,71] or the optimal power output at which the standing position should be adopted [44]. By dividing the power-output by the cost-function a measure similar in essence to mechanical efficiency can also be attained [46,71]. Therefore, cost-function measures can be performed using either an EMG or joint torque estimation [44], and they may be particularly useful for optimizing a cyclist’s technique. To the best of our knowledge no other studies have tested whether these cost functions could be used as feedback to improve the cycling technique.
In conclusion, the EMG is a simple and relatively precise measurement of cyclist technique. It provides a way to estimate the amount of energy spent and amount of muscle stress. However, even if there is evidence of changes in muscle coordination with expertise, defining an optimal level of muscle coordination is not straightforward, especially when considering the activity of bi-articular muscles.
6. Measures of Muscle Fatigue
Fatigue can be defined as a reduction in muscle force or power that occurs with exercise [72]. It corresponds (1) to a reduced ability to maximally activate the muscles and as a feeling of tiredness and exhaustion (central aspect, factors above the neuromuscular junction), and (2) to the deterioration of the muscle functions (peripheral aspect, factors below the neuromuscular junction). A decrease in maximal power output during short sprints is therefore a simple test to assess both the central and peripheral aspects of fatigue during cycling [25]. Conversely, the subjective perception of fatigue, as evaluated by analog scales (e.g., Borg scale of perceived exertion), is a simple means of assessing the central aspect of fatigue.
Central fatigue can also be evaluated using the twitch-interpolation technique, which consists of stimulating the nerve supplying the muscles during a voluntary contraction and comparing the gain in force associated with the stimulation [73]. Peripheral muscle fatigue is in general evaluated by the change in muscle force elicited by electrical stimulation of the muscle itself, using surface electrodes, or by the stimulation of its motor nerve [72]. However, these methods require specific equipment in order to be performed immediately after dynamic cycling tests [73]. It must be stressed also that during complex movements, coordination is a non-negligible factor in performance. Central fatigue might alter the ability to properly execute the technique, which would decrease the performance, although the muscle force per se might not be affected.
EMG has been used to assess neuromuscular fatigue by analyzing the change in the mean or median frequency of the spectrum of the EMG signal. The spectrum of the EMG signal refers to its frequency content obtained after a Fourier decomposition of the signal. Mean or median frequencies generally decrease with fatiguing contractions because of the slowing of the action potentials at the surface of the muscle membrane (sarcolemma). However, such an analysis of the surface EMG during fatiguing dynamic contractions has strong limitations (e.g., movement of the electrodes, non-stationarity of the signal) [62] and should be interpreted with caution.
An increase in EMG signal amplitude has also been used as an indicator of fatigue. Amplitude of the EMG signal increases with fatigue at a constant and non-maximal power output [74]. This increase is attributed to the progressive recruitment of additional motor units and/or to changes in the properties of the sarcolemma. In both cases, this indicates the presence of muscular fatigue. However, in order to confirm that the increase in EMG is linked solely to muscle fatigue and not to changes in technique, it is important to ascertain that movement kinematics were not altered and that no form of compensation occurred, which is difficult to achieve in most cases.
In conclusion, fatigue can be assessed easily by measuring a reduction in performance during maximal efforts or using analog scales. However, using such assessments the origin of the decrease in performance remains unknown, as it may originate from changes in muscle coordination, an inability to fully activate the muscles or altered muscle functions. Finally, the use of the EMG signal is not recommended for the analysis of muscle fatigue.
7. Measures of Muscle Mechanical Performance
Intrinsic muscle mechanical properties are critical determinants of any motor performance. Characterizing in vivo muscle mechanics is possible in a laboratory environment using isokinetic devices (e.g., Contrex, Biodex) or adapted set-ups using force sensors, myo-meter devices, electrical stimulators and/or kinematic measurements. Classic mechanical properties include musculo-tendinous stiffness, force-length relationships, force-velocity relationships and rate of force development during voluntary contraction or muscle activation dynamics (i.e., electromechanical delay, force development and relaxation times) [75,76,77]. These measures are generally performed for groups of muscles, such as the knee extensors or ankle plantarflexors, rather than for individual muscles. These measures are essential for diagnosis and for understanding basic science of movement. However, the relation between individual joint performance and whole-body performance is not strong [33,75,78,79]. Kordi et al. (2017) [78] found that at best, isolated maximal joint moments can account for approximately 47% of the variance in peak power output in recreational cyclists (for the knee joint). This lack of correlation might reflect the need to coordinate the multiple joints and/or the limitation associated with isolated joint torque evaluations [80]. In agreement with the former hypothesis, muscle activation and joint torque during maximal cycling exercises are often less than during maximal voluntary contractions performed for each joint separately [33,79], suggesting that the pedaling movement imposes certain constraints on the organization of the joint torque and muscle activity. In agreement with the latter hypothesis, the peak power output has been found to be better correlated with muscle volume (i.e., r2 = 0.67) [81] than with maximal joint moments (r2 = 0.47) [78], suggesting that isolated joint torque measurements do not provide a good estimate of the maximal capacity of the muscles. As a consequence, measurements performed directly on a bike or a cycling ergometer are in general more representative of the actual cycling performance [78].
By changing the position of the seat (e.g., seat tube angle, seat height), angle of the trunk or length of the crank, the segment configuration changes, making the lower-limb muscles work at different portions of their force-length relationships. Positioning is known to affect cycling performance [1], suggesting that force-length characteristics significantly influence the pedaling performance. For example, an upright position of the trunk appears to be an advantage in terms of peak crank torque and global efficiency, although its advantage decreases with increasing velocity in the field, because of aerodynamic resistances [59,82]. Optimal positioning can also be determined as the one the minimize a certain cost function based on the VO2, joint moment or EMG measures [42,44,83].
Contraction velocity has major effects on muscle mechanics and energy expenditure. During cycling, the muscle contraction velocity is related to the pedal velocity, which depends on the crank length and pedaling frequency [84]. A classic characterization of muscle performance in cycling relies on the relationship between cadence and crank power. This relation derives from Hill’s well known force-velocity relationship for a single muscle [85] (i.e., when the contraction velocity increases, the maximal force that a muscle can produce decreases and eventually reaches zero at its maximal contraction velocity). Therefore, the muscle power (force × velocity) is maximal at an optimal contraction velocity. An easy way to perform this test while cycling is to fix the resistive load at different intensities and measure the maximal pedaling rate during short sprints [52]. The result is a linear relationship between the angular velocity (rad/s) and the torque (N·m), which can be used to compute the power output. The relation between angular velocity and power has an inverted U shape with a single maximum [52]. The cadence at which maximum power is reached is typically above 90–110 RPM (Figure 2) and depends on individual characteristics. More precisely, it is lower for individuals with a high percentage of slow-twitch fibers [86]. It is also important to note that (1) the cadence that maximizes the crank power output increases with the intensity of the muscle contraction, which is likely due to the orderly recruitment of the motor units [70], and (2) that in terms of energy consumption (i.e., gross efficiency) the optimal cadence is typically lower than 100 RPM (i.e., 60–70 RPM) [86]. The increase in muscle contraction velocity when increasing cadence also reduces the duration of the cycles, so that they reach less than 600 ms above 100 RPM. The time needed for a muscle to contract and then relax can be greater than 300 ms [76], that is, greater than half of a one cycle duration. This means that the forces generated by muscles activated during the downstroke could not be fully relaxed during the upstroke and may interfere with movement, and this could partly explain the decrease in power-output at the highest pedaling frequencies [37]. As a consequence, the choice of an optimal cadence is not straightforward and depends on the nature and intensity of the task [87].
In conclusion, although intrinsic muscle mechanical properties are critical determinant of cycling performance, their evaluation at the single joint level bears only a modest relationship to the actual cycling performance. The cadence at which power-output is maximized and the maximal power-output itself represent essential information for cyclists interested in sprint performances. These measures provide an indirect assessment of the muscle mechanical performances.
8. Conclusions
Assessing the performance and technique of a cyclist is relatively straightforward in a laboratory environment, and it is now well established that whole-body mechanical and electrophysiologic studies are necessary to strengthen our understanding of cycling performance. Miniaturization of EMG sensors or force sensors embodied in the pedals, seat and/or handlebars now allow researchers to perform complete and accurate assessments of cyclist technique and performance. However, it must be emphasized that most biomechanical parameters are difficult to interpret directly in terms of performance because several constraints or conditions need to be taken into account, such as muscle mechanics, fatigue, discomfort, history of injuries, cyclist morphology and nature of the effort (e.g., sprint, endurance). Therefore, it is not easy to establish whether an individual cyclist’s technique is optimal or not. Thus, the relationship of cycling performance to biomechanics is a developing field of research in which many questions remain to be answered.
Author Contributions
Conceptualization, B.W. and N.A.T.; methodology, B.W. and N.A.T.; resources, B.W. and N.A.T.; writing—original draft preparation, N.A.T. and B.W.; writing—review and editing, B.W. and N.A.T.; visualization, N.A.T.; supervision, B.W.; project administration, B.W.; funding acquisition, N.A.T. and B.W. All authors have read and agreed to the published version of the manuscript.
Funding
This research received no external funding.
Acknowledgments
The authors would like to thank A. Costes for its research in cycling biomechanics.
Conflicts of Interest
The authors declare no conflict of interest.
References
- Swart, J.; Holliday, W. Cycling Biomechanics Optimization-the (R) Evolution of Bicycle Fitting. Curr. Sports Med. Rep. 2019, 18, 490–496. [Google Scholar] [CrossRef] [PubMed]
- Capostagno, B.; Lambert, M.I.; Lamberts, R.P. A Systematic Review of Submaximal Cycle Tests to Predict, Monitor, and Optimize Cycling Performance. Int. J. Sports Physiol. Perform. 2016, 11, 707–714. [Google Scholar] [CrossRef] [PubMed]
- Joyner, M.J.; Coyle, E.F. Endurance exercise performance: The physiology of champions. J. Physiol. 2008, 586, 35–44. [Google Scholar] [CrossRef] [PubMed]
- Spindler, D.J.; Allen, M.S.; Vella, S.A.; Swann, C. The psychology of elite cycling: A systematic review. J. Sports Sci. 2018, 36, 1943–1954. [Google Scholar] [CrossRef] [PubMed]
- Bernstein, N.A. The Coordination and Regulation of Movements; Pergamon Press: New York, NY, USA, 1967. [Google Scholar]
- Merkes, P.F.J.; Menaspa, P.; Abbiss, C.R. Power output, cadence, and torque are similar between the forward standing and traditional sprint cycling positions. Scand. J. Med. Sci. Sports 2020, 30, 64–73. [Google Scholar] [CrossRef] [PubMed]
- Patterson, R.P.; Moreno, M.I. Bicycle pedalling forces as a function of pedalling rate and power output. Med. Sci. Sports Exerc. 1990, 22, 512–516. [Google Scholar] [CrossRef]
- Hug, F.; Drouet, J.M.; Champoux, Y.; Couturier, A.; Dorel, S. Interindividual variability of electromyographic patterns and pedal force profiles in trained cyclists. Eur. J. Appl. Physiol. 2008, 104, 667–678. [Google Scholar] [CrossRef]
- Kautz, S.A.; Hull, M.L. A theoretical basis for interpreting the force applied to the pedal in cycling. J. Biomech. 1993, 26, 155–165. [Google Scholar] [CrossRef]
- Salomoni, S.; Tucker, K.; Hug, F.; McPhee, M.; Hodges, P. Reduced Maximal Force during Acute Anterior Knee Pain Is Associated with Deficits in Voluntary Muscle Activation. PLoS ONE 2016, 11, e0161487. [Google Scholar] [CrossRef] [Green Version]
- Bailey, M.P.; Maillardet, F.J.; Messenger, N. Kinematics of cycling in relation to anterior knee pain and patellar tendinitis. J. Sports Sci. 2003, 21, 649–657. [Google Scholar] [CrossRef]
- Bertucci, W.; Grappe, F.; Groslambert, A. Laboratory versus outdoor cycling conditions: Differences in pedaling biomechanics. J. Appl. Biomech. 2007, 23, 87–92. [Google Scholar] [CrossRef] [PubMed] [Green Version]
- Fintelman, D.M.; Sterling, M.; Hemida, H.; Li, F.X. Effect of different aerodynamic time trial cycling positions on muscle activation and crank torque. Scand. J. Med. Sci. Sports 2016, 26, 528–534. [Google Scholar] [CrossRef] [PubMed]
- Arpinar-Avsar, P.; Birlik, G.; Sezgin, O.C.; Soylu, A.R. The effects of surface-induced loads on forearm muscle activity during steering a bicycle. J. Sports Sci. Med. 2013, 12, 512–520. [Google Scholar]
- Gardner, A.S.; Martin, J.C.; Martin, D.T.; Barras, M.; Jenkins, D.G. Maximal torque- and power-pedaling rate relationships for elite sprint cyclists in laboratory and field tests. Eur. J. Appl. Physiol. 2007, 101, 287–292. [Google Scholar] [CrossRef] [PubMed]
- Nimmerichter, A.; Williams, C.; Bachl, N.; Eston, R. Evaluation of a field test to assess performance in elite cyclists. Int. J. Sports Med. 2010, 31, 160–166. [Google Scholar] [CrossRef]
- Hawley, J.A.; Noakes, T.D. Peak power output predicts maximal oxygen uptake and performance time in trained cyclists. Eur. J. Appl. Physiol. Occup. Physiol. 1992, 65, 79–83. [Google Scholar] [CrossRef]
- Bentley, D.J.; McNaughton, L.R.; Thompson, D.; Vleck, V.E.; Batterham, A.M. Peak power output, the lactate threshold, and time trial performance in cyclists. Med. Sci. Sports Exerc. 2001, 33, 2077–2081. [Google Scholar] [CrossRef]
- Zameziati, K.; Mornieux, G.; Rouffet, D.; Belli, A. Relationship between the increase of effectiveness indexes and the increase of muscular efficiency with cycling power. Eur. J. Appl. Physiol. 2006, 96, 274–281. [Google Scholar] [CrossRef]
- Davis, R.R.; Hull, M.L. Measurement of pedal loading in bicycling: II. Analysis and results. J. Biomech. 1981, 14, 857–872. [Google Scholar] [CrossRef]
- Sanderson, D.J.; Black, A. The effect of prolonged cycling on pedal forces. J. Sports Sci. 2003, 21, 191–199. [Google Scholar] [CrossRef]
- Garcia-Lopez, J.; Diez-Leal, S.; Ogueta-Alday, A.; Larrazabal, J.; Rodriguez-Marroyo, J.A. Differences in pedalling technique between road cyclists of different competitive levels. J. Sports Sci. 2016, 34, 1619–1626. [Google Scholar] [CrossRef] [PubMed] [Green Version]
- Ericson, M.O.; Nisell, R. Efficiency of pedal forces during ergometer cycling. Int. J. Sports Med. 1988, 9, 118–122. [Google Scholar] [CrossRef] [PubMed]
- Sanderson, D.J.; Hennig, E.M.; Black, A.H. The influence of cadence and power output on force application and in-shoe pressure distribution during cycling by competitive and recreational cyclists. J. Sports Sci. 2000, 18, 173–181. [Google Scholar] [CrossRef] [PubMed]
- Theurel, J.; Crepin, M.; Foissac, M.; Temprado, J.J. Effects of different pedalling techniques on muscle fatigue and mechanical efficiency during prolonged cycling. Scand. J. Med. Sci. Sports 2012, 22, 714–721. [Google Scholar] [CrossRef]
- Davis, B.L.; Vaughan, C.L. Phasic behavior of EMG signals during gait: Use of multivariate statistics. J. Electromyogr. Kinesiol. 1993, 3, 51–60. [Google Scholar] [CrossRef]
- De Marchis, C.; Schmid, M.; Bibbo, D.; Castronovo, A.M.; D’Alessio, T.; Conforto, S. Feedback of mechanical effectiveness induces adaptations in motor modules during cycling. Front. Comput. Neurosci. 2013, 7, 35. [Google Scholar] [CrossRef] [Green Version]
- Mornieux, G.; Gollhofer, A.; Stapelfeldt, B. Muscle coordination while pulling up during cycling. Int. J. Sports Med. 2010, 31, 843–846. [Google Scholar] [CrossRef]
- Korff, T.; Romer, L.M.; Mayhew, I.; Martin, J.C. Effect of pedaling technique on mechanical effectiveness and efficiency in cyclists. Med. Sci. Sports Exerc. 2007, 39, 991–995. [Google Scholar] [CrossRef] [Green Version]
- Bini, R.; Hume, P.; Croft, J.L.; Kilding, A. Pedal Force Effectiveness in Cycling: A Review of Constraints and Training Effects. J. Sci. Cycl. 2013, 2, 11–24. [Google Scholar]
- Kutch, J.J.; Valero-Cuevas, F.J. Muscle redundancy does not imply robustness to muscle dysfunction. J. Biomech. 2011, 44, 1264–1270. [Google Scholar] [CrossRef] [Green Version]
- Valero-Cuevas, F.J. A mathematical approach to the mechanical capabilities of limbs and fingers. Adv. Exp. Med. Biol. 2009, 629, 619–633. [Google Scholar] [CrossRef] [PubMed] [Green Version]
- Watier, B.; Costes, A.; Moretto, P. An Inverse Dynamic Study Suggests That Cyclists Marginally Use Hip Joint Torque at Maximal Power. In Proceedings of the Congress of the International Society of Biomechanics 2013, Natal, Brazil, 4–9 August 2013; Available online: https://media.isbweb.org/images/conferences/isb-congresses/2013/oral/sb-cycling.04.pdf (accessed on 8 May 2020).
- Martin, J.C.; Brown, N.A. Joint-specific power production and fatigue during maximal cycling. J. Biomech. 2009, 42, 474–479. [Google Scholar] [CrossRef] [PubMed]
- Zatsiorsky, V.M.; Zaciorskij, V.M. Kinetics of Human Motion; Human Kinetics: Champaign, IL, USA, 2002. [Google Scholar]
- Elmer, S.J.; Barratt, P.R.; Korff, T.; Martin, J.C. Joint-specific power production during submaximal and maximal cycling. Med. Sci. Sports Exerc. 2011, 43, 1940–1947. [Google Scholar] [CrossRef] [PubMed] [Green Version]
- McDaniel, J.; Behjani, N.S.; Elmer, S.J.; Brown, N.A.; Martin, J.C. Joint-specific power-pedaling rate relationships during maximal cycling. J. Appl. Biomech. 2014, 30, 423–430. [Google Scholar] [CrossRef]
- Bini, R.R.; Diefenthaeler, F.; Mota, C.B. Fatigue effects on the coordinative pattern during cycling: Kinetics and kinematics evaluation. J. Electromyogr. Kinesiol. 2010, 20, 102–107. [Google Scholar] [CrossRef]
- Mornieux, G.; Guenette, J.A.; Sheel, A.W.; Sanderson, D.J. Influence of cadence, power output and hypoxia on the joint moment distribution during cycling. Eur. J. Appl. Physiol. 2007, 102, 11–18. [Google Scholar] [CrossRef]
- Sanderson, D.J. The influence of cadence and power output on the biomechanics of force application during steady-rate cycling in competitive and recreational cyclists. J. Sports Sci. 1991, 9, 191–203. [Google Scholar] [CrossRef]
- Neptune, R.R.; Herzog, W. The association between negative muscle work and pedaling rate. J. Biomech. 1999, 32, 1021–1026. [Google Scholar] [CrossRef] [Green Version]
- Gonzalez, H.; Hull, M.L. Multivariable optimization of cycling biomechanics. J. Biomech. 1989, 22, 1151–1161. [Google Scholar] [CrossRef]
- Marsh, A.P.; Martin, P.E.; Sanderson, D.J. Is a joint moment-based cost function associated with preferred cycling cadence? J. Biomech. 2000, 33, 173–180. [Google Scholar] [CrossRef]
- Costes, A.; Turpin, N.A.; Villeger, D.; Moretto, P.; Watier, B. Spontaneous change from seated to standing cycling position with increasing power is associated with a minimization of cost functions. J. Sports Sci. 2018, 36, 907–913. [Google Scholar] [CrossRef] [PubMed]
- Watier, B.; Costes, A.; Turpin, N.A. Modification of the spontaneous seat-to-stand transition in cycling with bodyweight and cadence variations. J. Biomech. 2017, 63, 61–66. [Google Scholar] [CrossRef]
- Turpin, N.A.; Costes, A.; Moretto, P.; Watier, B. Can muscle coordination explain the advantage of using the standing position during intense cycling? J. Sci. Med. Sport 2017, 20, 611–616. [Google Scholar] [CrossRef] [PubMed]
- Costes, A.; Turpin, N.A.; Villeger, D.; Moretto, P.; Watier, B. A reduction of the saddle vertical force triggers the sit-stand transition in cycling. J. Biomech. 2015, 48, 2998–3003. [Google Scholar] [CrossRef] [Green Version]
- Soden, P.D.; Adeyefa, B.A. Forces applied to a bicycle during normal cycling. J. Biomech. 1979, 12, 527–541. [Google Scholar] [CrossRef]
- Turpin, N.A.; Costes, A.; Moretto, P.; Watier, B. Upper limb and trunk muscle activity patterns during seated and standing cycling. J. Sports Sci. 2017, 35, 557–564. [Google Scholar] [CrossRef] [PubMed]
- Pedersen, P.K.; Sorensen, J.B.; Jensen, K.; Johansen, L.; Levin, K. Muscle fiber type distribution and nonlinear VO2-power output relationship in cycling. Med. Sci. Sports Exerc. 2002, 34, 655–661. [Google Scholar] [CrossRef]
- McDaniel, J.; Subudhi, A.; Martin, J.C. Torso stabilization reduces the metabolic cost of producing cycling power. Can. J. Appl. Physiol. 2005, 30, 433–441. [Google Scholar] [CrossRef]
- Costes, A.; Turpin, N.A.; Villeger, D.; Moretto, P.; Watier, B. Influence of Position and Power Output on Upper Limb Kinetics in Cycling. J. Appl. Biomech. 2016, 32, 140–149. [Google Scholar] [CrossRef]
- Baker, J.S.; Davies, B. Additional considerations and recommendations for the quantification of hand-grip strength in the measurement of leg power during high-intensity cycle ergometry. Res. Sports Med. 2009, 17, 145–155. [Google Scholar] [CrossRef]
- Dore, E.; Baker, J.S.; Jammes, A.; Graham, M.; New, K.; Van Praagh, E. Upper body contribution during leg cycling peak power in teenage boys and girls. Res. Sports Med. 2006, 14, 245–257. [Google Scholar] [CrossRef] [PubMed]
- Padulo, J.; Laffaye, G.; Bertucci, W.; Chaouachi, A.; Viggiano, D. Optimisation of starting conditions in track cycling. Sport Sci. Health 2014, 10, 189–198. [Google Scholar] [CrossRef]
- Dorel, S.; Couturier, A.; Hug, F. Influence of different racing positions on mechanical and electromyographic patterns during pedalling. Scand. J. Med. Sci. Sports 2009, 19, 44–54. [Google Scholar] [CrossRef] [PubMed] [Green Version]
- Savelberg, H.H.; Van de Port, I.G.; Willems, P.J. Body configuration in cycling affects muscle recruitment and movement pattern. J. Appl. Biomech. 2003, 19, 310–324. [Google Scholar] [CrossRef] [Green Version]
- Duc, S.; Bertucci, W.; Pernin, J.N.; Grappe, F. Muscular activity during uphill cycling: Effect of slope, posture, hand grip position and constrained bicycle lateral sways. J. Electromyogr. Kinesiol. 2008, 18, 116–127. [Google Scholar] [CrossRef] [PubMed]
- Fintelman, D.M.; Sterling, M.; Hemida, H.; Li, F.X. Optimal cycling time trial position models: Aerodynamics versus power output and metabolic energy. J. Biomech. 2014, 47, 1894–1898. [Google Scholar] [CrossRef] [PubMed]
- Jansen, C.; McPhee, J. Predictive dynamic simulation of Olympic track cycling standing start using direct collocation optimal control. Multibody Syst. Dyn. 2020, 49, 53–70. [Google Scholar] [CrossRef]
- Milner-Brown, H.S.; Stein, R.B. The relation between the surface electromyogram and muscular force. J. Physiol. 1975, 246, 549–569. [Google Scholar] [CrossRef]
- Farina, D. Interpretation of the surface electromyogram in dynamic contractions. Exerc. Sport Sci. Rev. 2006, 34, 121–127. [Google Scholar] [CrossRef]
- Blake, O.M.; Champoux, Y.; Wakeling, J.M. Muscle coordination patterns for efficient cycling. Med. Sci. Sports Exerc. 2012, 44, 926–938. [Google Scholar] [CrossRef]
- Blake, O.M.; Wakeling, J.M. Estimating changes in metabolic power from EMG. Springerplus 2013, 2, 229. [Google Scholar] [CrossRef] [PubMed] [Green Version]
- Chapman, A.; Vicenzino, B.; Blanch, P.; Hodges, P. Do differences in muscle recruitment between novice and elite cyclists reflect different movement patterns or less skilled muscle recruitment? J. Sci. Med. Sport 2009, 12, 31–34. [Google Scholar] [CrossRef] [PubMed]
- Chapman, A.R.; Vicenzino, B.; Blanch, P.; Hodges, P.W. Patterns of leg muscle recruitment vary between novice and highly trained cyclists. J. Electromyogr. Kinesiol. 2008, 18, 359–371. [Google Scholar] [CrossRef] [PubMed]
- Candotti, C.T.; Loss, J.F.; Bagatini, D.; Soares, D.P.; da Rocha, E.K.; de Oliveira, A.R.; Guimaraes, A.C. Cocontraction and economy of triathletes and cyclists at different cadences during cycling motion. J. Electromyogr. Kinesiol. 2009, 19, 915–921. [Google Scholar] [CrossRef]
- Chapman, A.R.; Vicenzino, B.; Blanch, P.; Knox, J.J.; Hodges, P.W. Leg muscle recruitment in highly trained cyclists. J. Sports Sci. 2006, 24, 115–124. [Google Scholar] [CrossRef]
- Zatsiorsky, V.M.; Latash, M.L. What Is a Joint Torque for Joints Spanned by Multiarticular Muscles? J. Appl. Biomech. 1993, 9, 333–336. [Google Scholar] [CrossRef]
- MacIntosh, B.R.; Neptune, R.R.; Horton, J.F. Cadence, power, and muscle activation in cycle ergometry. Med. Sci. Sports Exerc. 2000, 32, 1281–1287. [Google Scholar] [CrossRef] [PubMed] [Green Version]
- Blake, O.M.; Wakeling, J.M. Muscle coordination limits efficiency and power output of human limb movement under a wide range of mechanical demands. J. Neurophysiol. 2015, 114, 3283–3295. [Google Scholar] [CrossRef] [Green Version]
- Gandevia, S.C. Spinal and supraspinal factors in human muscle fatigue. Physiol. Rev. 2001, 81, 1725–1789. [Google Scholar] [CrossRef]
- Doyle-Baker, D.; Temesi, J.; Medysky, M.E.; Holash, R.J.; Millet, G.Y. An Innovative Ergometer to Measure Neuromuscular Fatigue Immediately after Cycling. Med. Sci. Sports Exerc. 2018, 50, 375–387. [Google Scholar] [CrossRef] [PubMed]
- Turpin, N.A.; Guevel, A.; Durand, S.; Hug, F. Fatigue-related adaptations in muscle coordination during a cyclic exercise in humans. J. Exp. Biol. 2011, 214, 3305–3314. [Google Scholar] [CrossRef] [PubMed] [Green Version]
- Driss, T.; Lambertz, D.; Rouis, M.; Vandewalle, H. Influence of musculo-tendinous stiffness of the plantar ankle flexor muscles upon maximal power output on a cycle ergometre. Eur. J. Appl. Physiol. 2012, 112, 3721–3728. [Google Scholar] [CrossRef] [PubMed]
- Vandervoort, A.A.; McComas, A.J. A comparison of the contractile properties of the human gastrocnemius and soleus muscles. Eur. J. Appl. Physiol. Occup. Physiol. 1983, 51, 435–440. [Google Scholar] [CrossRef]
- Lepers, R.; Hausswirth, C.; Maffiuletti, N.; Brisswalter, J.; van Hoecke, J. Evidence of neuromuscular fatigue after prolonged cycling exercise. Med. Sci. Sports Exerc. 2000, 32, 1880–1886. [Google Scholar] [CrossRef] [PubMed]
- Kordi, M.; Goodall, S.; Barratt, P.; Rowley, N.; Leeder, J.; Howatson, G. Relation between Peak Power Output in Sprint Cycling and Maximum Voluntary Isometric Torque Production. J. Electromyogr. Kinesiol. 2017, 35, 95–99. [Google Scholar] [CrossRef] [PubMed]
- Dorel, S.; Guilhem, G.; Couturier, A.; Hug, F. Adjustment of muscle coordination during an all-out sprint cycling task. Med. Sci. Sports Exerc. 2012, 44, 2154–2164. [Google Scholar] [CrossRef] [PubMed] [Green Version]
- Turpin, N.A.; Costes, A.; Villeger, D.; Watier, B. Selective muscle contraction during plantarflexion is incompatible with maximal voluntary torque assessment. Eur. J. Appl. Physiol. 2014, 114, 1667–1677. [Google Scholar] [CrossRef] [Green Version]
- Kordi, M.; Folland, J.; Goodall, S.; Haralabidis, N.; Maden-Wilkinson, T.; Sarika Patel, T.; Leeder, J.; Barratt, P.; Howatson, G. Mechanical and morphological determinants of peak power output in elite cyclists. Scand. J. Med. Sci. Sports 2020, 30, 227–237. [Google Scholar] [CrossRef]
- Ashe, M.C.; Scroop, G.C.; Frisken, P.I.; Amery, C.A.; Wilkins, M.A.; Khan, K.M. Body position affects performance in untrained cyclists. Br. J. Sports Med. 2003, 37, 441–444. [Google Scholar] [CrossRef] [Green Version]
- Heil, D.P.; Derrick, T.R.; Whittlesey, S. The relationship between preferred and optimal positioning during submaximal cycle ergometry. Eur. J. Appl. Physiol. Occup. Physiol. 1997, 75, 160–165. [Google Scholar] [CrossRef]
- Barratt, P.R.; Martin, J.C.; Elmer, S.J.; Korff, T. Effects of Pedal Speed and Crank Length on Pedaling Mechanics during Submaximal Cycling. Med. Sci. Sports Exerc. 2016, 48, 705–713. [Google Scholar] [CrossRef] [PubMed] [Green Version]
- Hill, A.V. The heat of shortening and the dynamic constants of muscle. Proc. R. Soc. Lond. Ser. B-Biol. Sci. 1983, 126, 136–195. [Google Scholar]
- Hansen, E.A.; Andersen, J.L.; Nielsen, J.S.; Sjogaard, G. Muscle fibre type, efficiency, and mechanical optima affect freely chosen pedal rate during cycling. Acta Physiol. Scand. 2002, 176, 185–194. [Google Scholar] [CrossRef] [PubMed]
- Ansley, L.; Cangley, P. Determinants of “optimal” cadence during cycling. Eur. J. Sport Sci. 2009, 9, 61–85. [Google Scholar] [CrossRef]
Figure 1.
Set of feasible forces at different joint configurations. The figure represents different configurations of the lower limb during the cycle, that is, at 0°, 90°, 180° and 270° of the crank arm angle, respectively. The dotted areas represent the feasible static force vectors at the foot level, given the joint configurations and the maximal torque of each joint. Two examples of feasible force vectors (F1 and F2) are drawn in (B). F2 is purely orthogonal to the crank arm (ME = 1), whereas F1 is directed more forwardly (ME < 1). However, F1 will provide a greater orthogonal component than F2, showing that maximizing effectiveness is not necessarily the best option to maximize performance. At 270°, a negative effective force is illustrated (ME < 0). The details of the method used to define the feasible force vector sets can be found in Valero-Cuevas [32] and Kutch and Valero-Cuevas [31]; see text also. On the right, illustration of real forces vectors. BDC: bottom dead center; ME: mechanical effectiveness; TDC: Top Dead Center.

Figure 2.
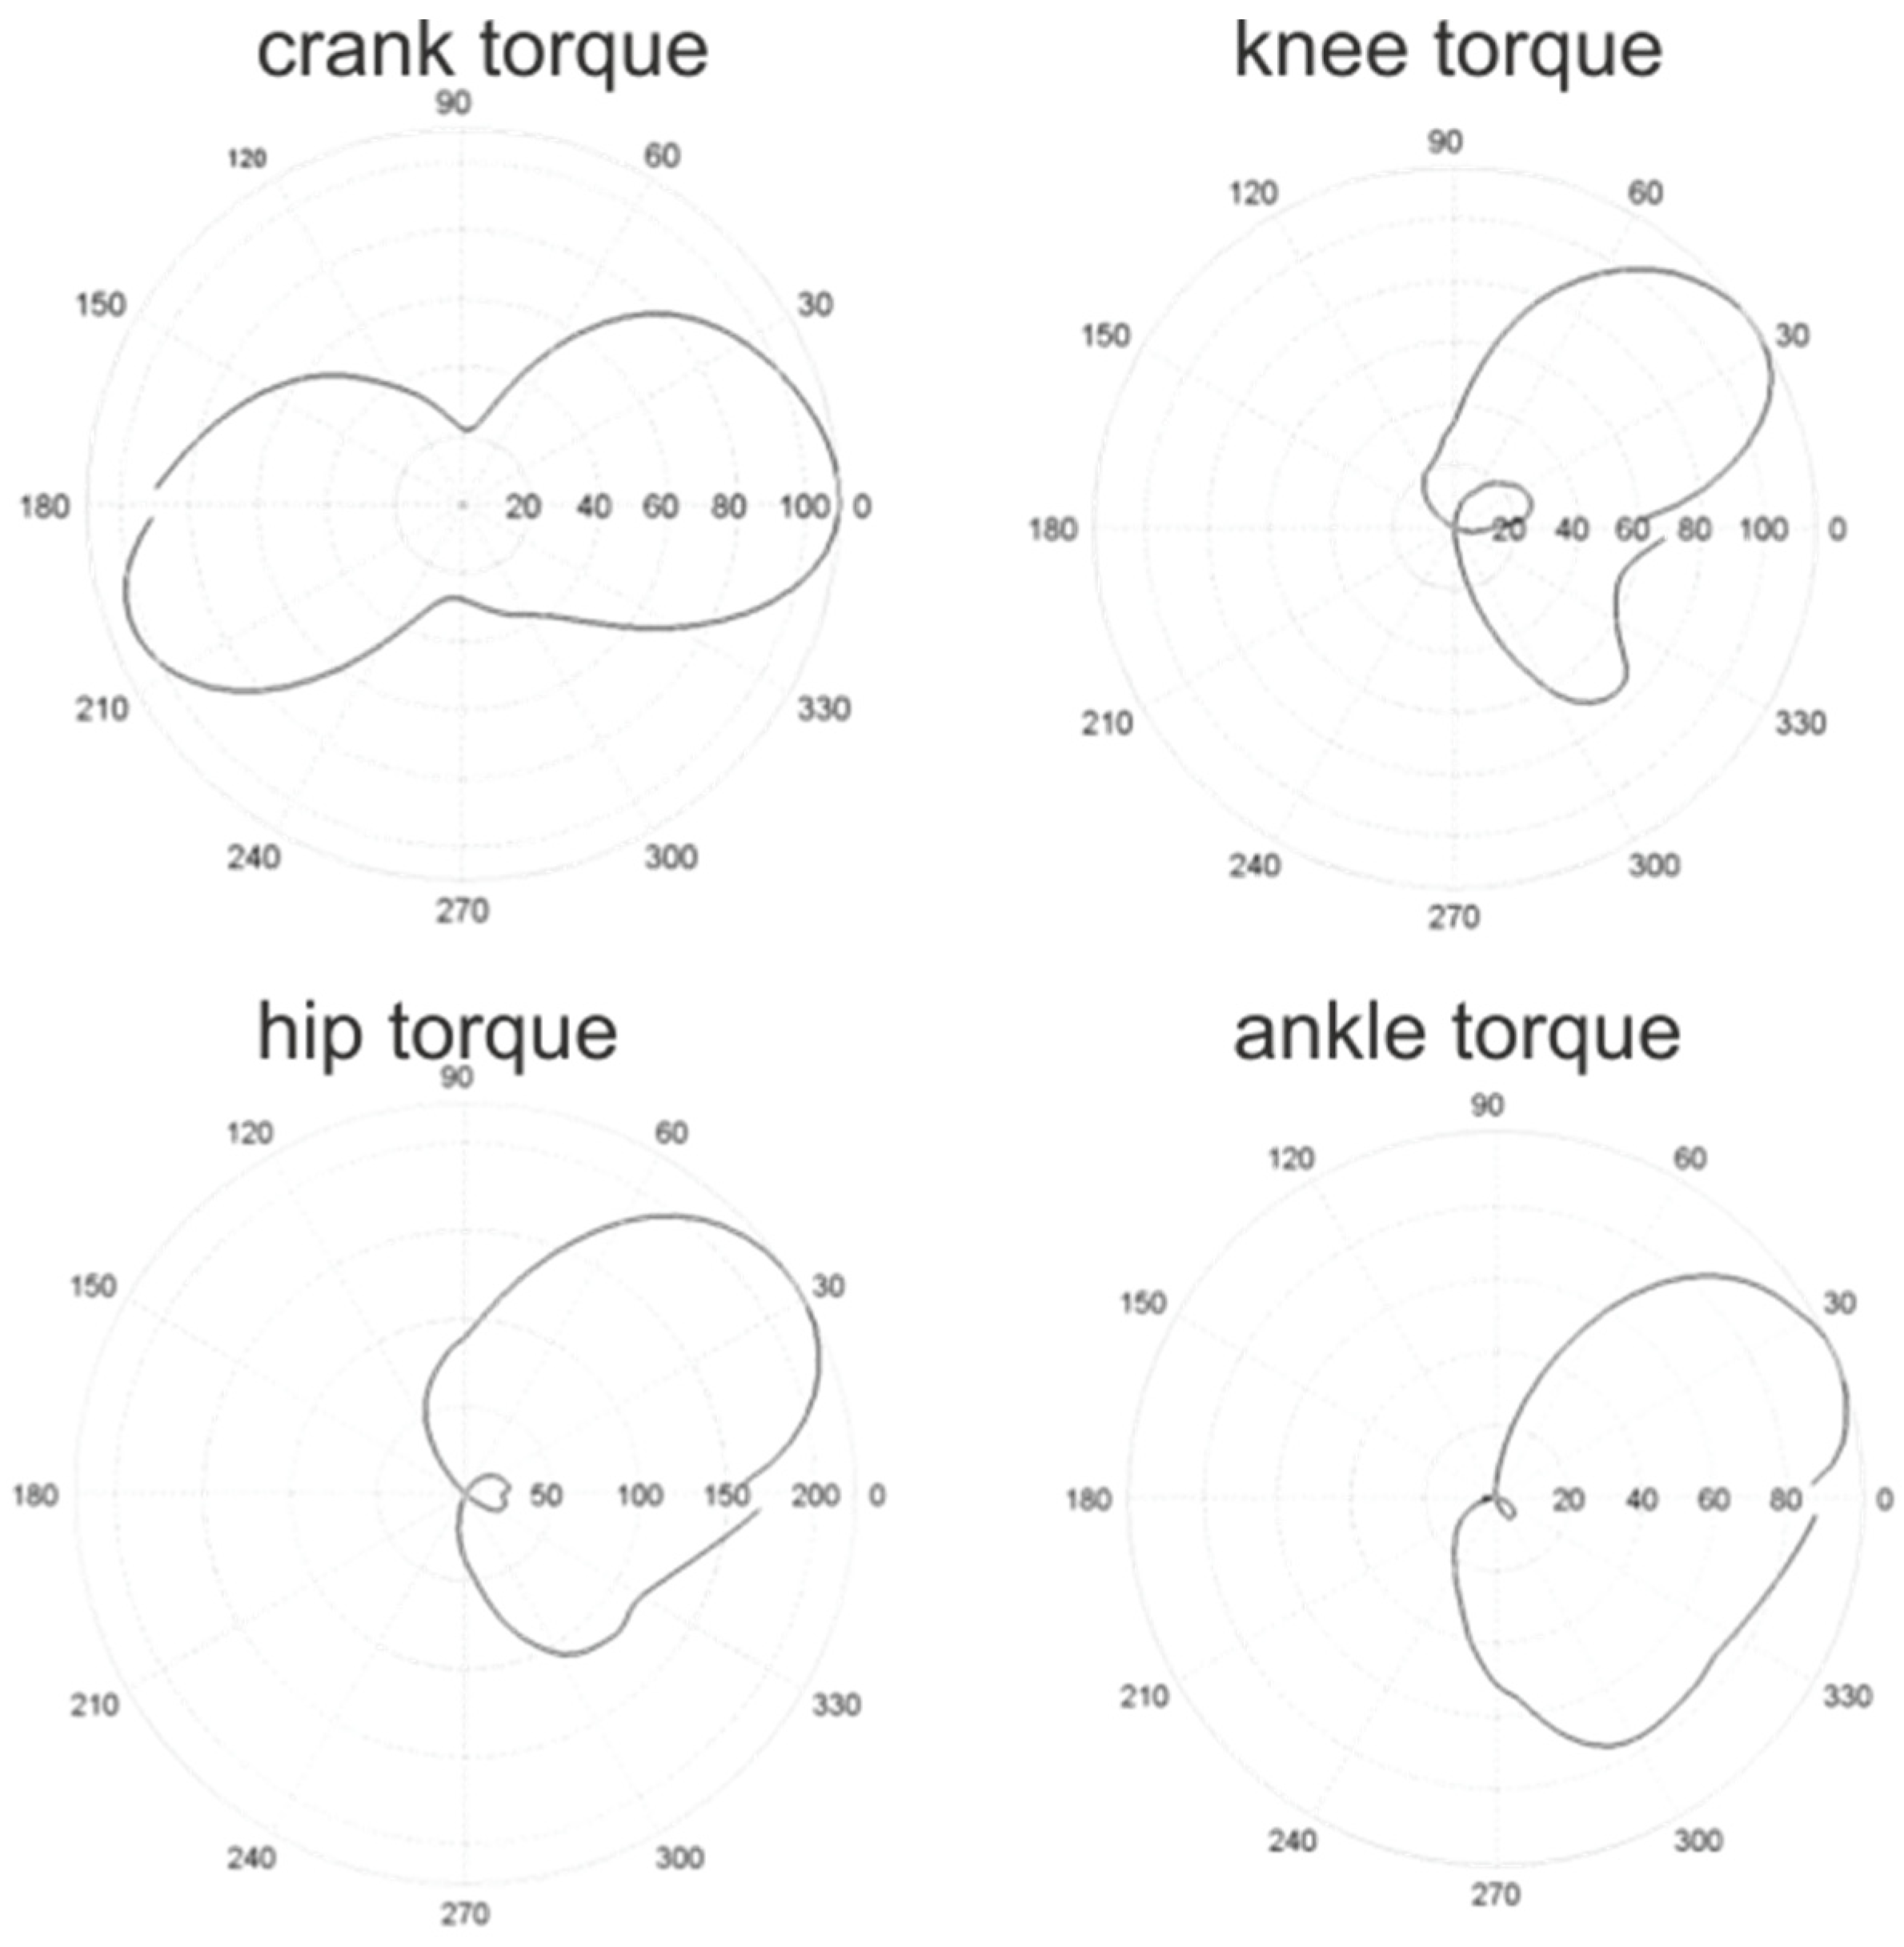
Torque profiles. Polar representation of the torque (N·m) exerted at the crank axis and at the knee, hip and ankle joints computed using the inverse dynamics procedure. Figures have been adapted from Watier et al. (2013) [33]. For this experience, nine triathletes developed a maximal power of 594 ± 100 W at a cadence of 108 ± 9 RPM and a mean crank torque of 53.1 ± 10 N·m. For each joint, the maximum torque was developed during the downstroke. During the upstroke, there was a sign inversion of the torque at each joint of the lower limbs, meaning that subjects pulled on the clipless pedals. When normalized to body mass, the maximum extension torque at the ankle was 1.14 ± 0.27 N·m/kg in extension and 0.18 ± 0.09 N·m/kg in flexion. At the knee, the maximum torque was 2.89 ± 0.70 N·m/kg in extension and 0.67 ± 0.28 N·m/kg in flexion. At the hip, it reached 1.48 ± 0.45 N·m/kg in extension and 0.50 ± 0.14 N·m/kg in flexion. The angular position represents the right crank position which rotates clockwise. The label 90° corresponds to the pedal in the upper position, and the label 270° to the pedal in the lower position.
Figure 2.
Torque profiles. Polar representation of the torque (N·m) exerted at the crank axis and at the knee, hip and ankle joints computed using the inverse dynamics procedure. Figures have been adapted from Watier et al. (2013) [33]. For this experience, nine triathletes developed a maximal power of 594 ± 100 W at a cadence of 108 ± 9 RPM and a mean crank torque of 53.1 ± 10 N·m. For each joint, the maximum torque was developed during the downstroke. During the upstroke, there was a sign inversion of the torque at each joint of the lower limbs, meaning that subjects pulled on the clipless pedals. When normalized to body mass, the maximum extension torque at the ankle was 1.14 ± 0.27 N·m/kg in extension and 0.18 ± 0.09 N·m/kg in flexion. At the knee, the maximum torque was 2.89 ± 0.70 N·m/kg in extension and 0.67 ± 0.28 N·m/kg in flexion. At the hip, it reached 1.48 ± 0.45 N·m/kg in extension and 0.50 ± 0.14 N·m/kg in flexion. The angular position represents the right crank position which rotates clockwise. The label 90° corresponds to the pedal in the upper position, and the label 270° to the pedal in the lower position.

Figure 3.
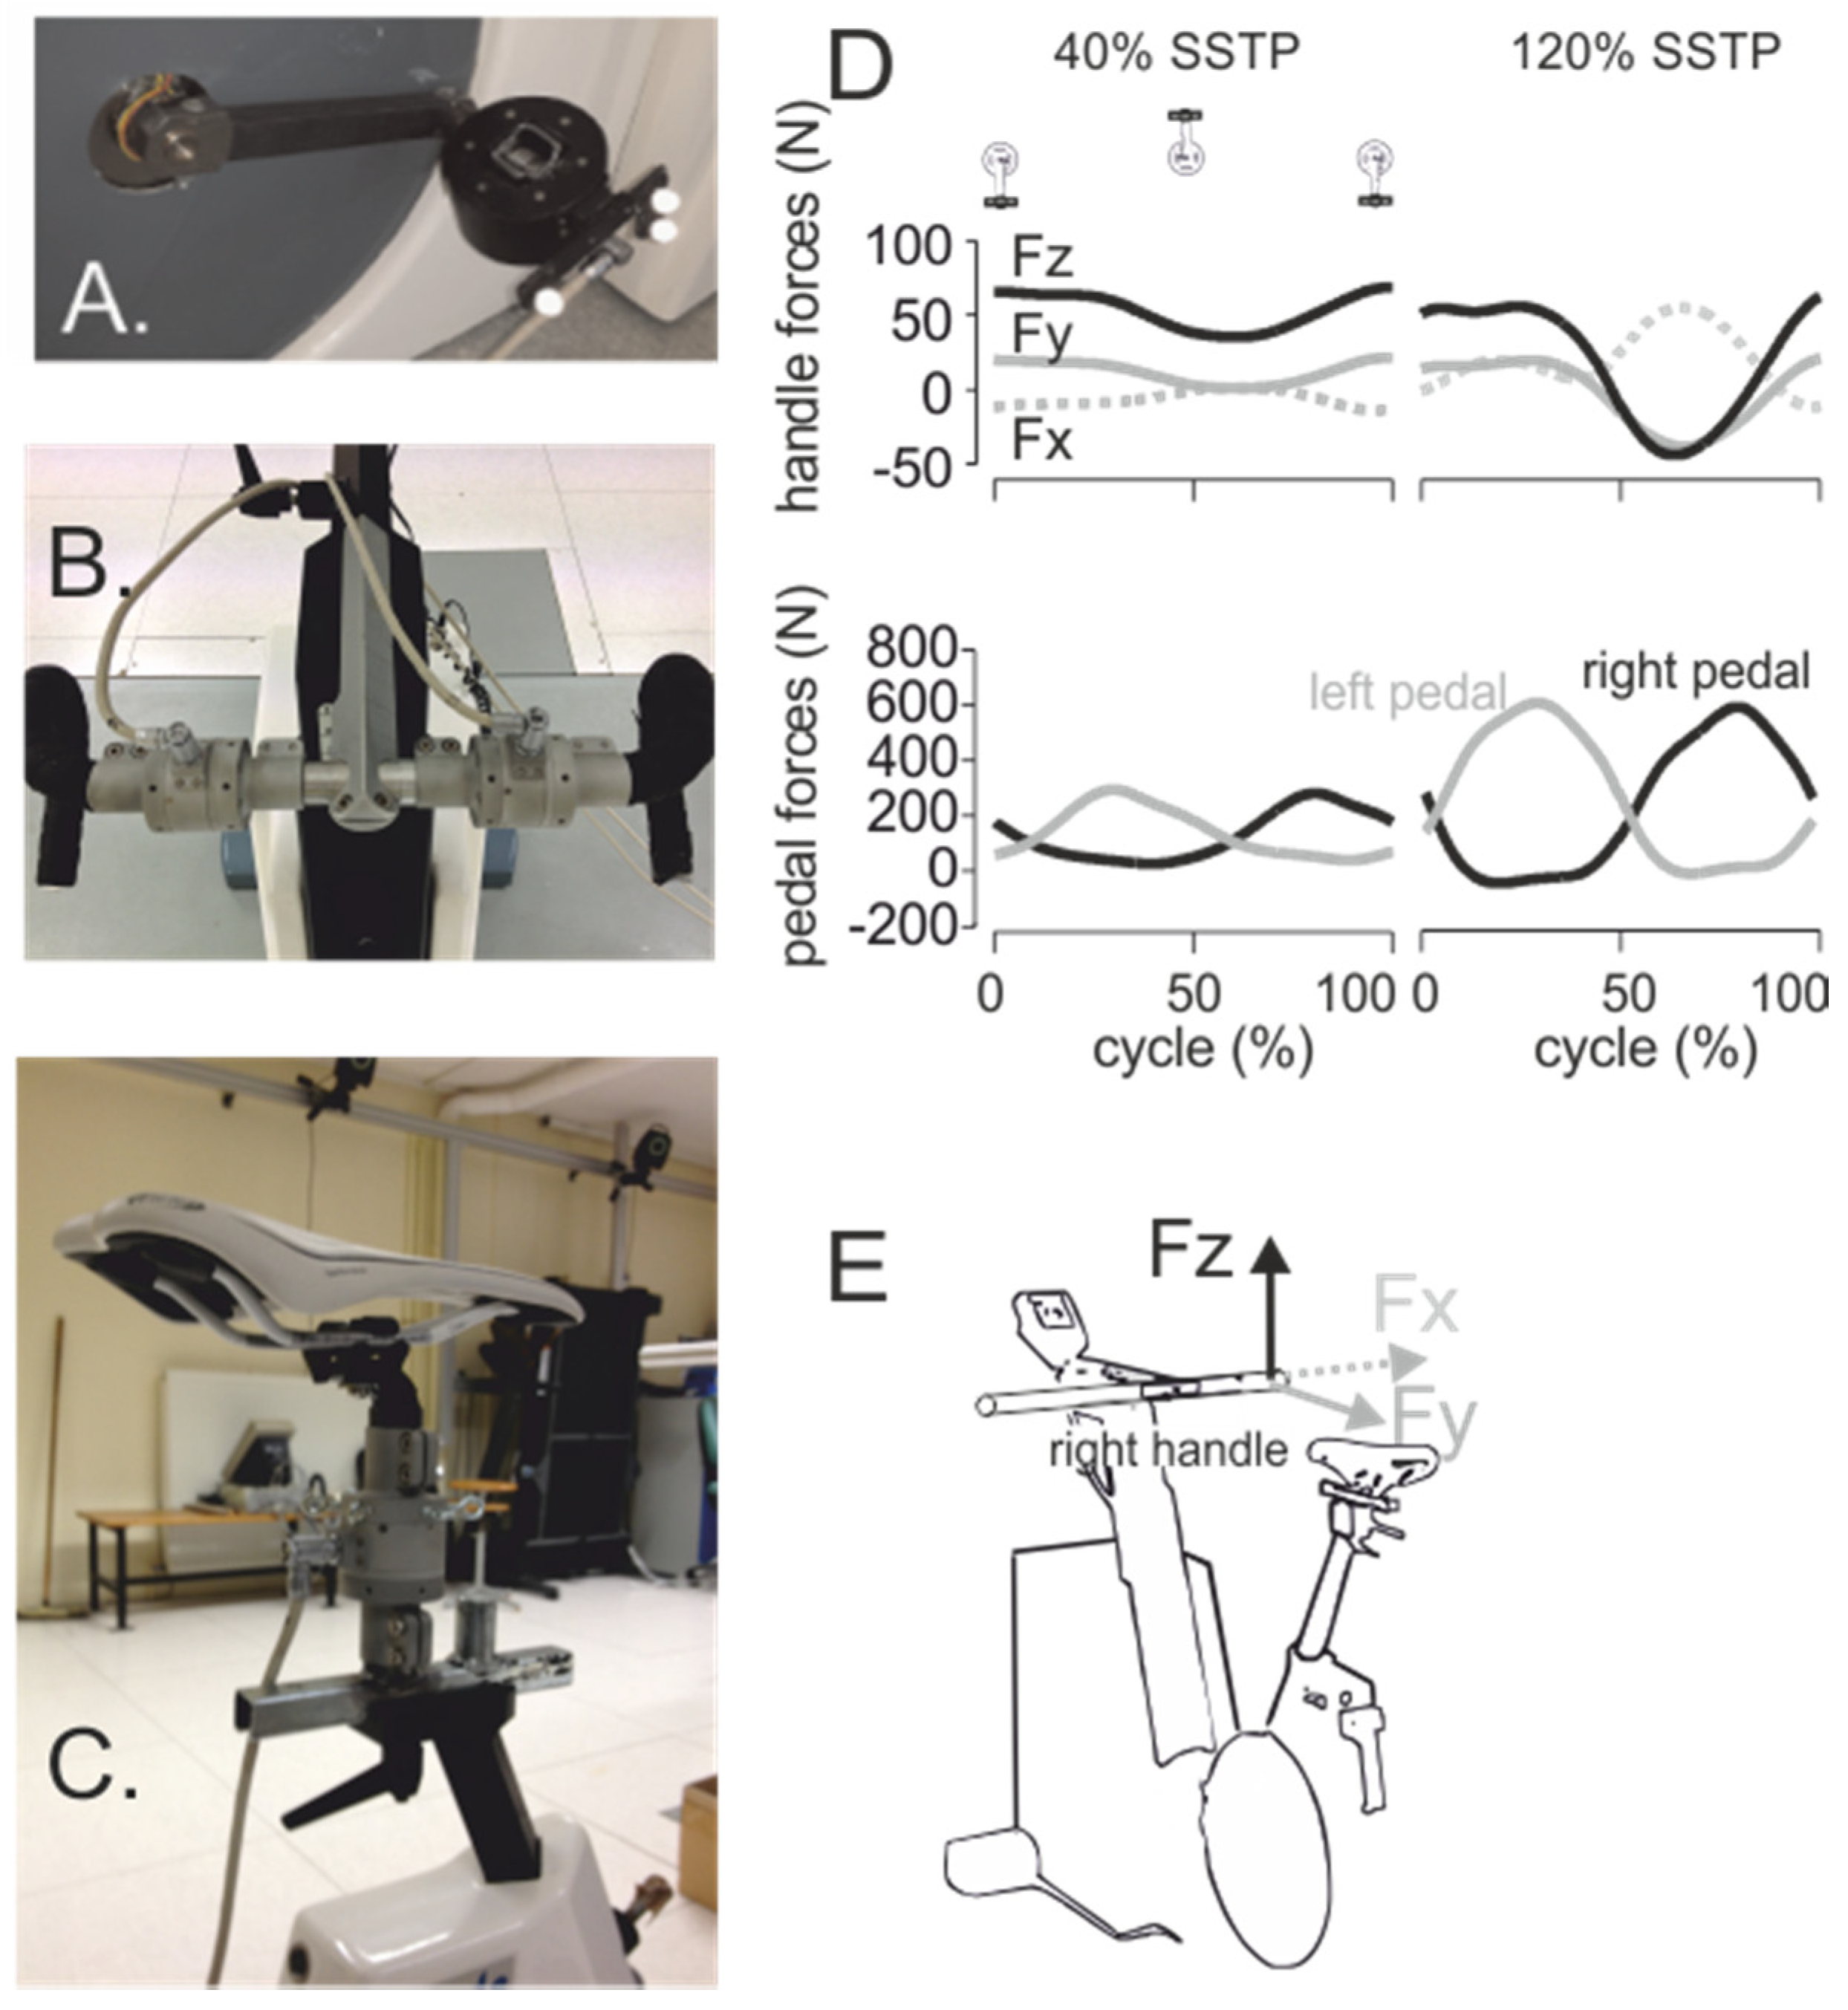
Force sensors. Panels (A–C) show force sensors at the pedal, handlebar and saddle. These were designed by Sensix, Poitiers, France. The sensors allow the measurement of forces and moments in three dimensions at the three points of interaction between the ergometer and the cyclist. Panel (D) shows the forces produced at the right handlebar and the pedals when pedaling in a seated position at two intensities: 40% of the seat-to-stand transition power (SSTP) and 120% of the SSTP, which represent approximately 200 W and 600 W, respectively (at 90 RPM). Note the decrease in the Fz component during the right downstroke, which goes from positive (pushing) to negative (pulling) between 40% and 120% SSTP. Panel E provides the direction of the handle forces in Three dimensions.
Figure 3.
Force sensors. Panels (A–C) show force sensors at the pedal, handlebar and saddle. These were designed by Sensix, Poitiers, France. The sensors allow the measurement of forces and moments in three dimensions at the three points of interaction between the ergometer and the cyclist. Panel (D) shows the forces produced at the right handlebar and the pedals when pedaling in a seated position at two intensities: 40% of the seat-to-stand transition power (SSTP) and 120% of the SSTP, which represent approximately 200 W and 600 W, respectively (at 90 RPM). Note the decrease in the Fz component during the right downstroke, which goes from positive (pushing) to negative (pulling) between 40% and 120% SSTP. Panel E provides the direction of the handle forces in Three dimensions.

Figure 4.
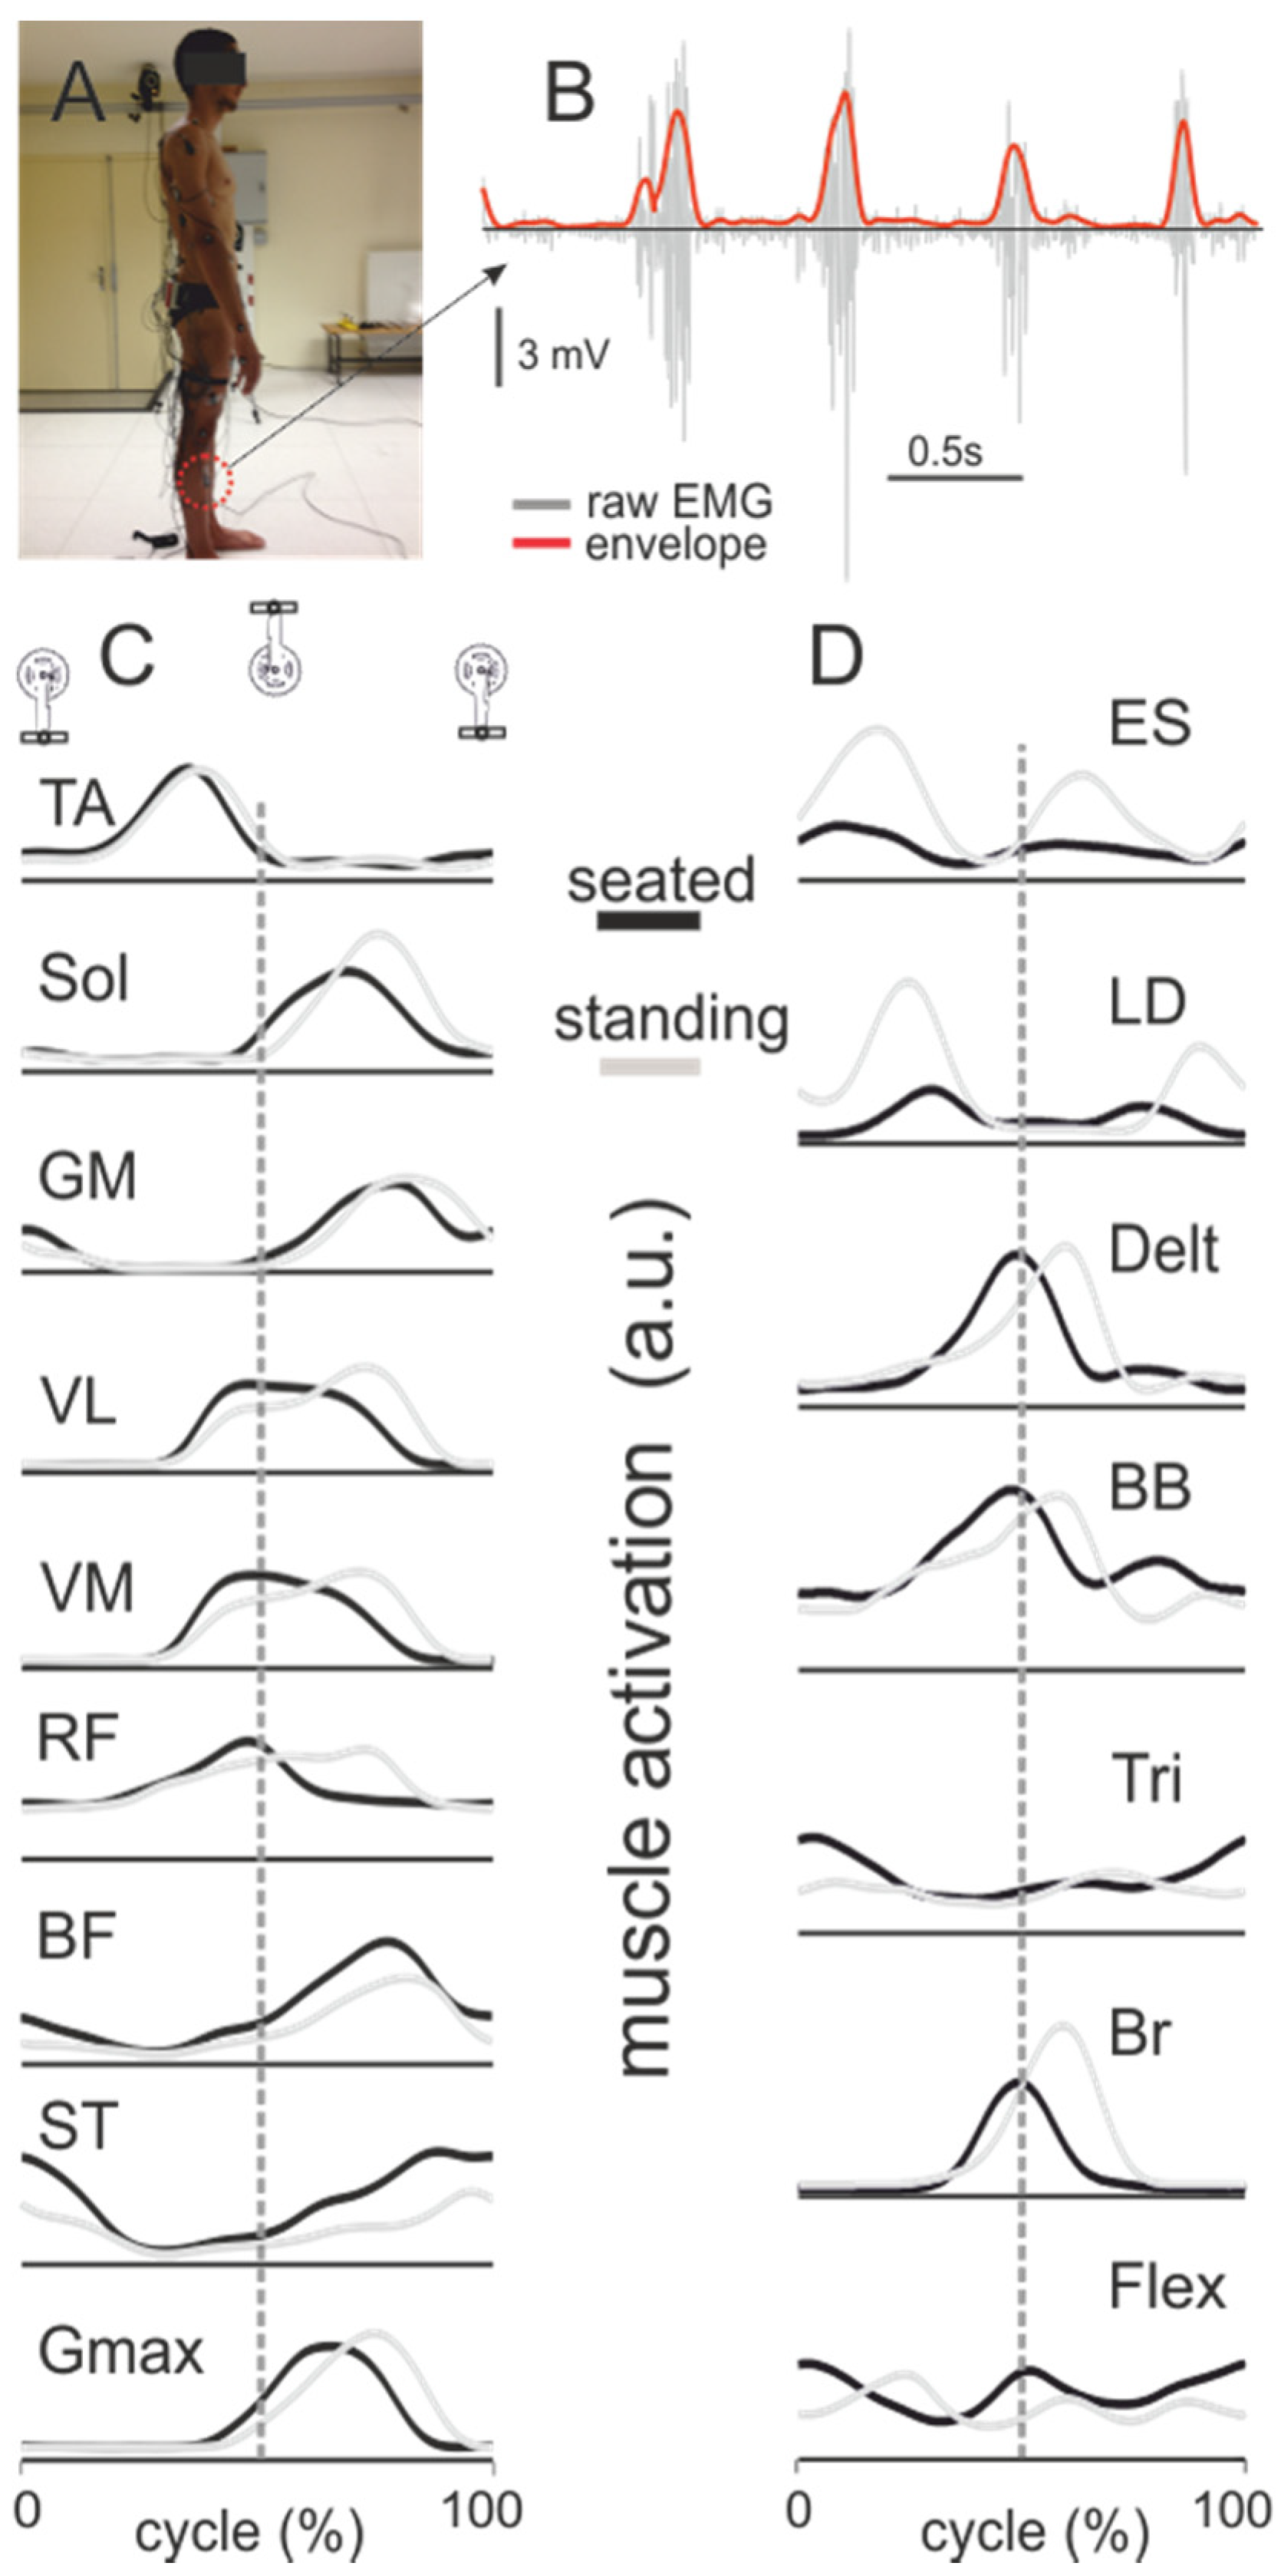
Electromyography (EMG). (A). Illustration of a cyclist equipped with a set of electrodes and markers before the cycling tests. The red circle indicates the position of the electrode located on the tibialis anterior muscle. (B). Unprocessed EMG signal in gray (raw EMG) superimposed with its envelope in red (integrated EMG). Envelope of the EMG signal for the lower limb (C) and upper limb (D) muscles when cycling at approximately 500 W (90 RPM) in the seated and standing positions. Data are the average of approximately 15 cycles. EMG analysis allows one to compare the timing and magnitude of the muscle activations between different conditions (here, seated and standing cycling). BB, biceps brachialis; BF, biceps femoris; Br, brachioradialis; Delt, anterior part of deltoideus; ES, erector spinae L4 to L5 level; Flex, flexor digitorum; GM, gastrocnemius medialis; Gmax, gluteus maximus; LD, latissimus dorsi; RF, rectus femoris; Sol, soleus; ST, semitendinosus; TA, tibialis anterior; Tri, triceps lateralis; VL, vastus lateralis; VM, vastus medialis.
Figure 4.
Electromyography (EMG). (A). Illustration of a cyclist equipped with a set of electrodes and markers before the cycling tests. The red circle indicates the position of the electrode located on the tibialis anterior muscle. (B). Unprocessed EMG signal in gray (raw EMG) superimposed with its envelope in red (integrated EMG). Envelope of the EMG signal for the lower limb (C) and upper limb (D) muscles when cycling at approximately 500 W (90 RPM) in the seated and standing positions. Data are the average of approximately 15 cycles. EMG analysis allows one to compare the timing and magnitude of the muscle activations between different conditions (here, seated and standing cycling). BB, biceps brachialis; BF, biceps femoris; Br, brachioradialis; Delt, anterior part of deltoideus; ES, erector spinae L4 to L5 level; Flex, flexor digitorum; GM, gastrocnemius medialis; Gmax, gluteus maximus; LD, latissimus dorsi; RF, rectus femoris; Sol, soleus; ST, semitendinosus; TA, tibialis anterior; Tri, triceps lateralis; VL, vastus lateralis; VM, vastus medialis.

© 2020 by the authors. Licensee MDPI, Basel, Switzerland. This article is an open access article distributed under the terms and conditions of the Creative Commons Attribution (CC BY) license (http://creativecommons.org/licenses/by/4.0/).
Share and Cite
MDPI and ACS Style
Turpin, N.A.; Watier, B. Cycling Biomechanics and Its Relationship to Performance. Appl. Sci. 2020, 10, 4112. https://0-doi-org.brum.beds.ac.uk/10.3390/app10124112
AMA Style
Turpin NA, Watier B. Cycling Biomechanics and Its Relationship to Performance. Applied Sciences. 2020; 10(12):4112. https://0-doi-org.brum.beds.ac.uk/10.3390/app10124112
Chicago/Turabian StyleTurpin, Nicolas A., and Bruno Watier. 2020. "Cycling Biomechanics and Its Relationship to Performance" Applied Sciences 10, no. 12: 4112. https://0-doi-org.brum.beds.ac.uk/10.3390/app10124112
Note that from the first issue of 2016, this journal uses article numbers instead of page numbers. See further details here.