Remediation of a Petroleum Hydrocarbon-Contaminated Site by Soil Vapor Extraction: A Full-Scale Case Study

 ,
,  ,
, 
 and
and
Abstract
:1. Introduction
2. Materials and Methods
2.1. Background Information
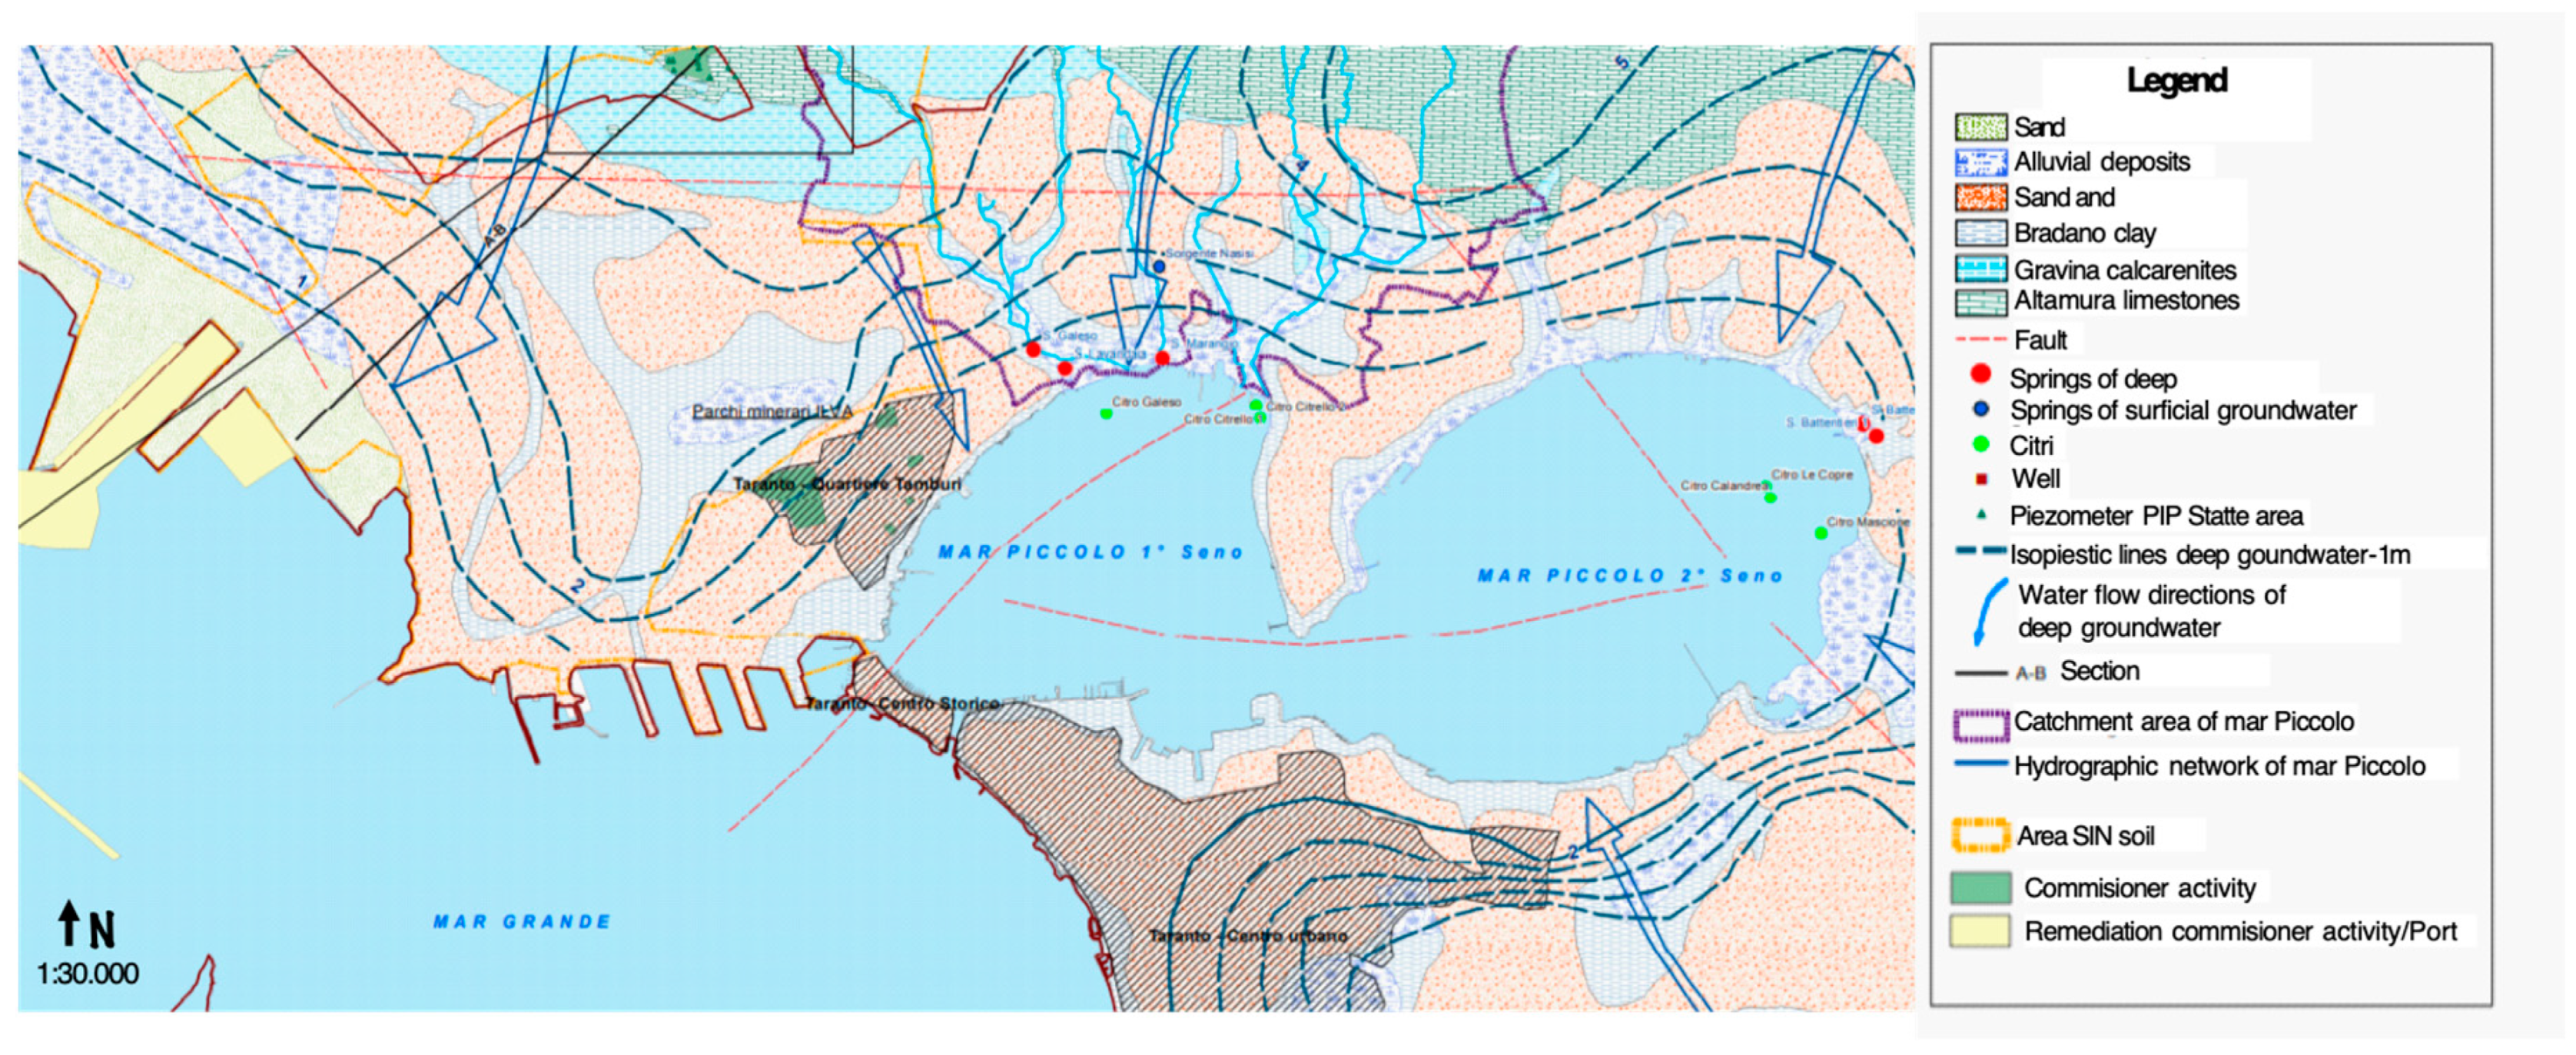
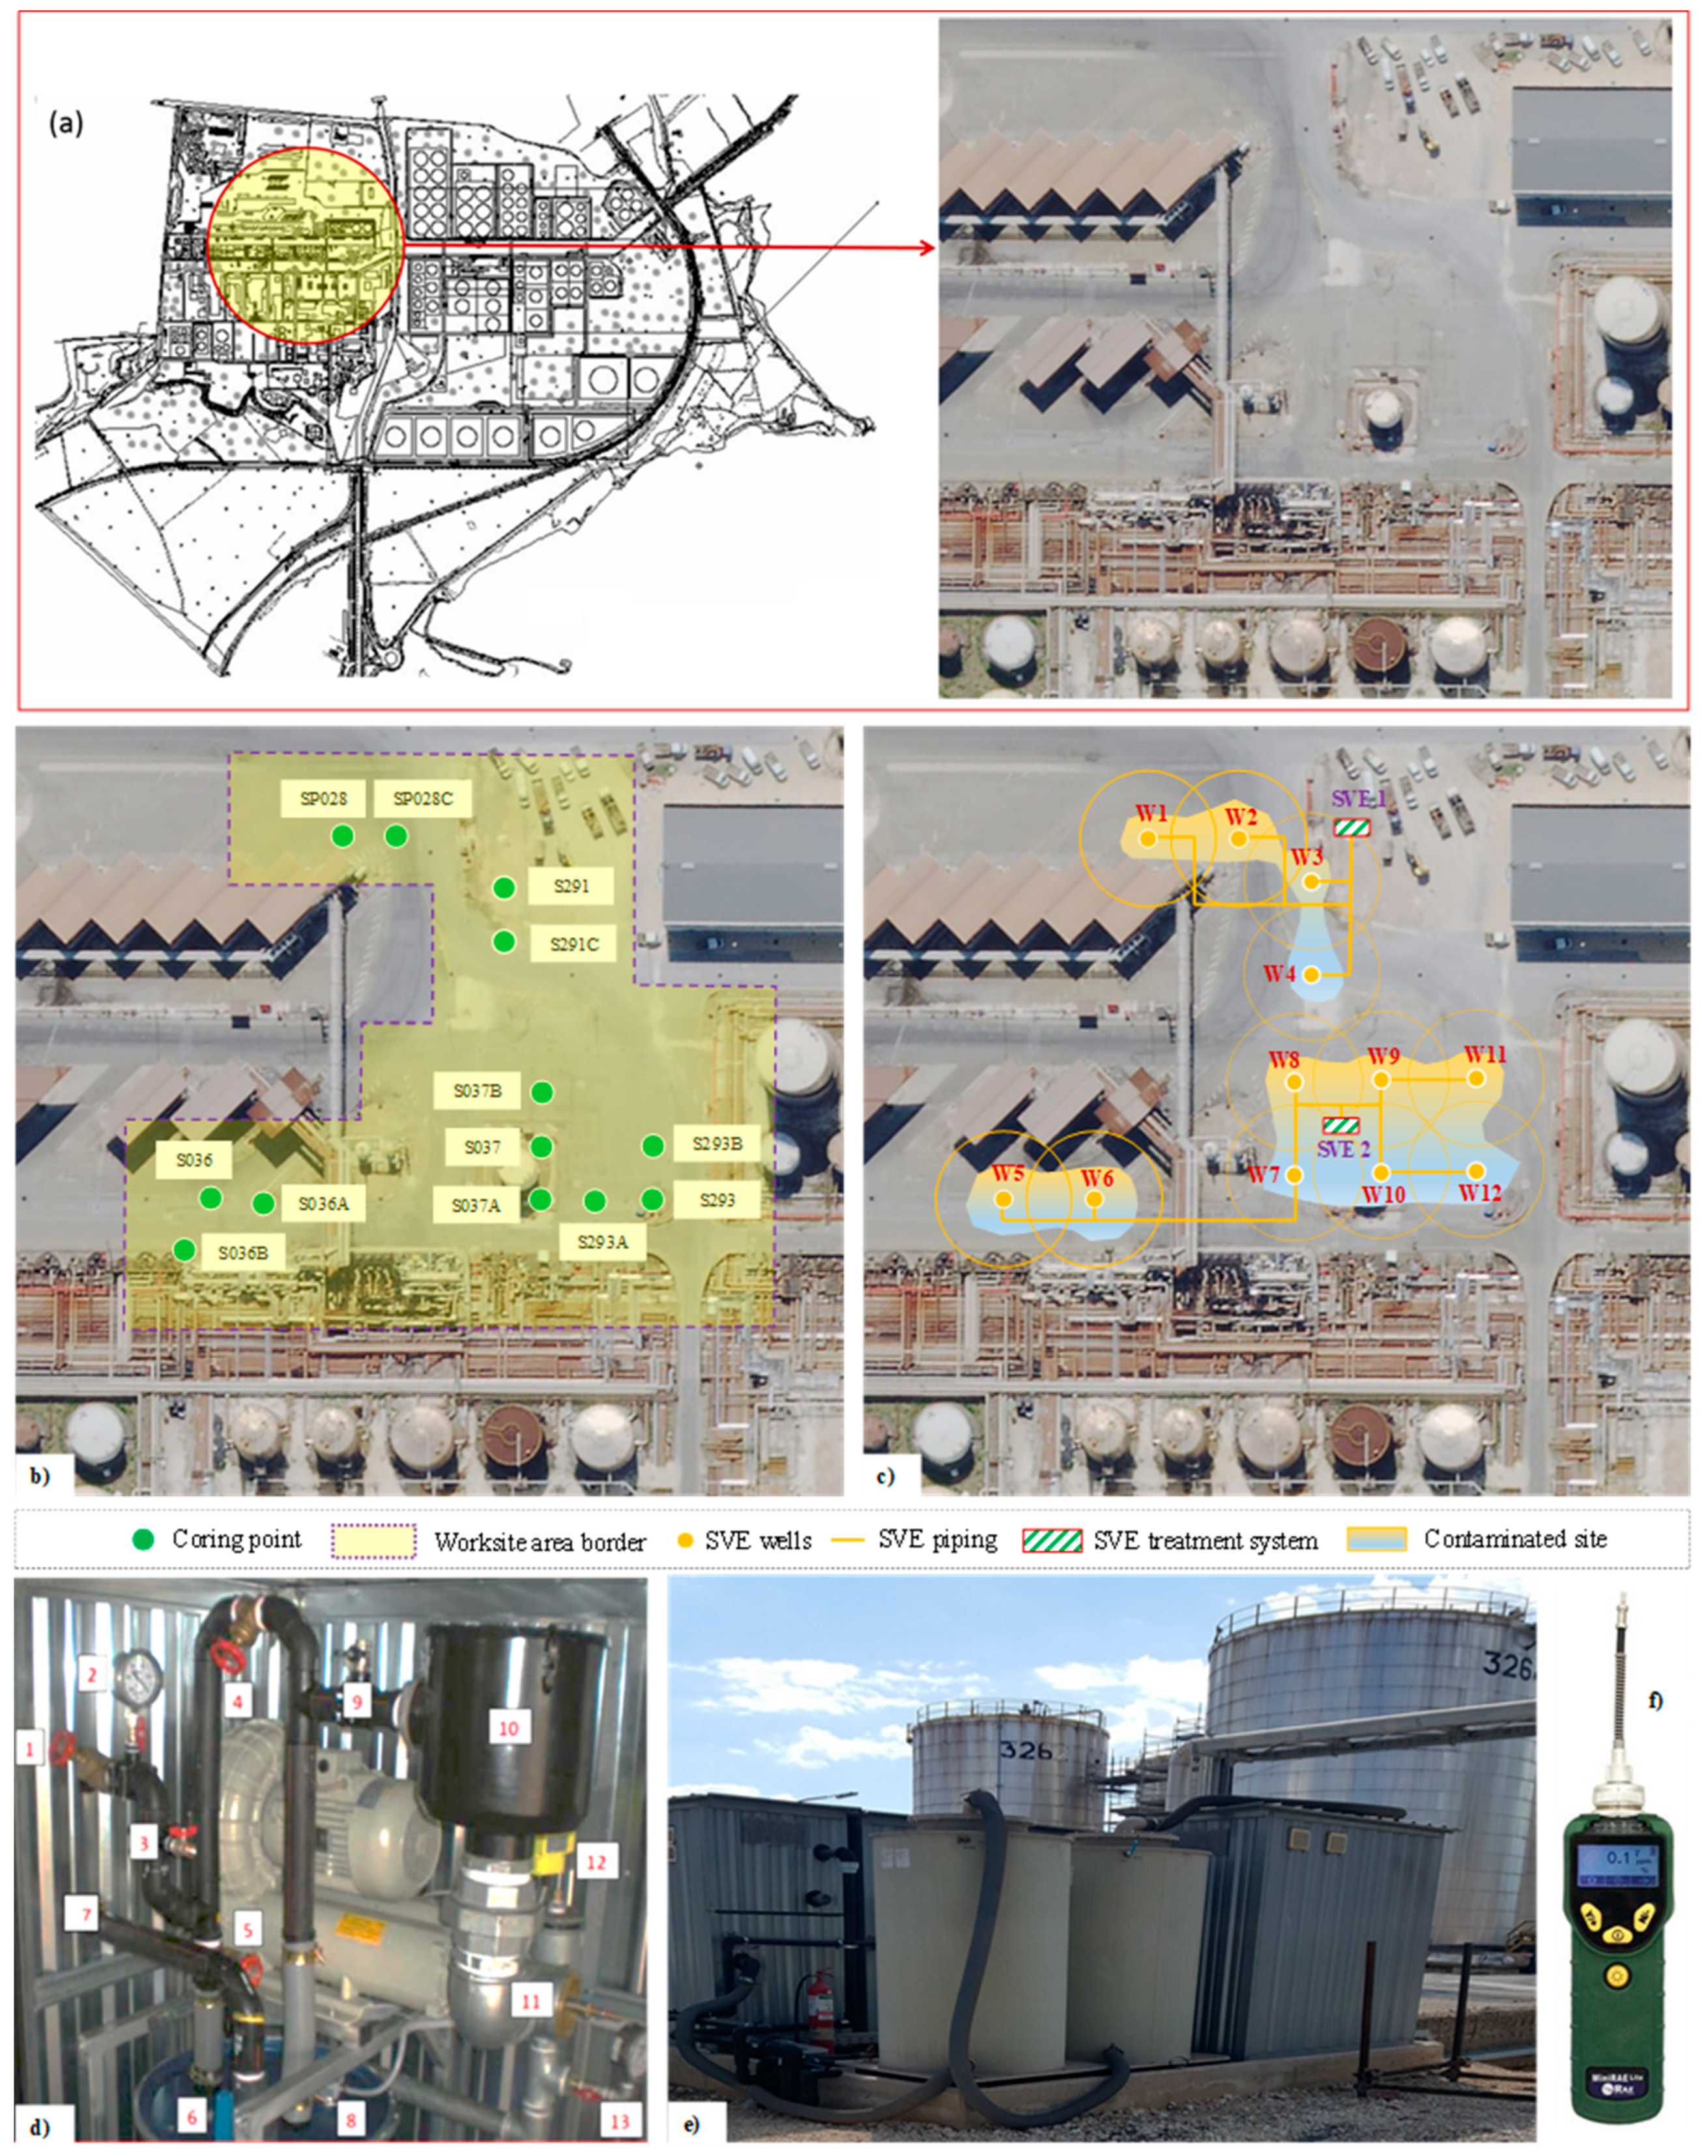
2.1.1. Site Description
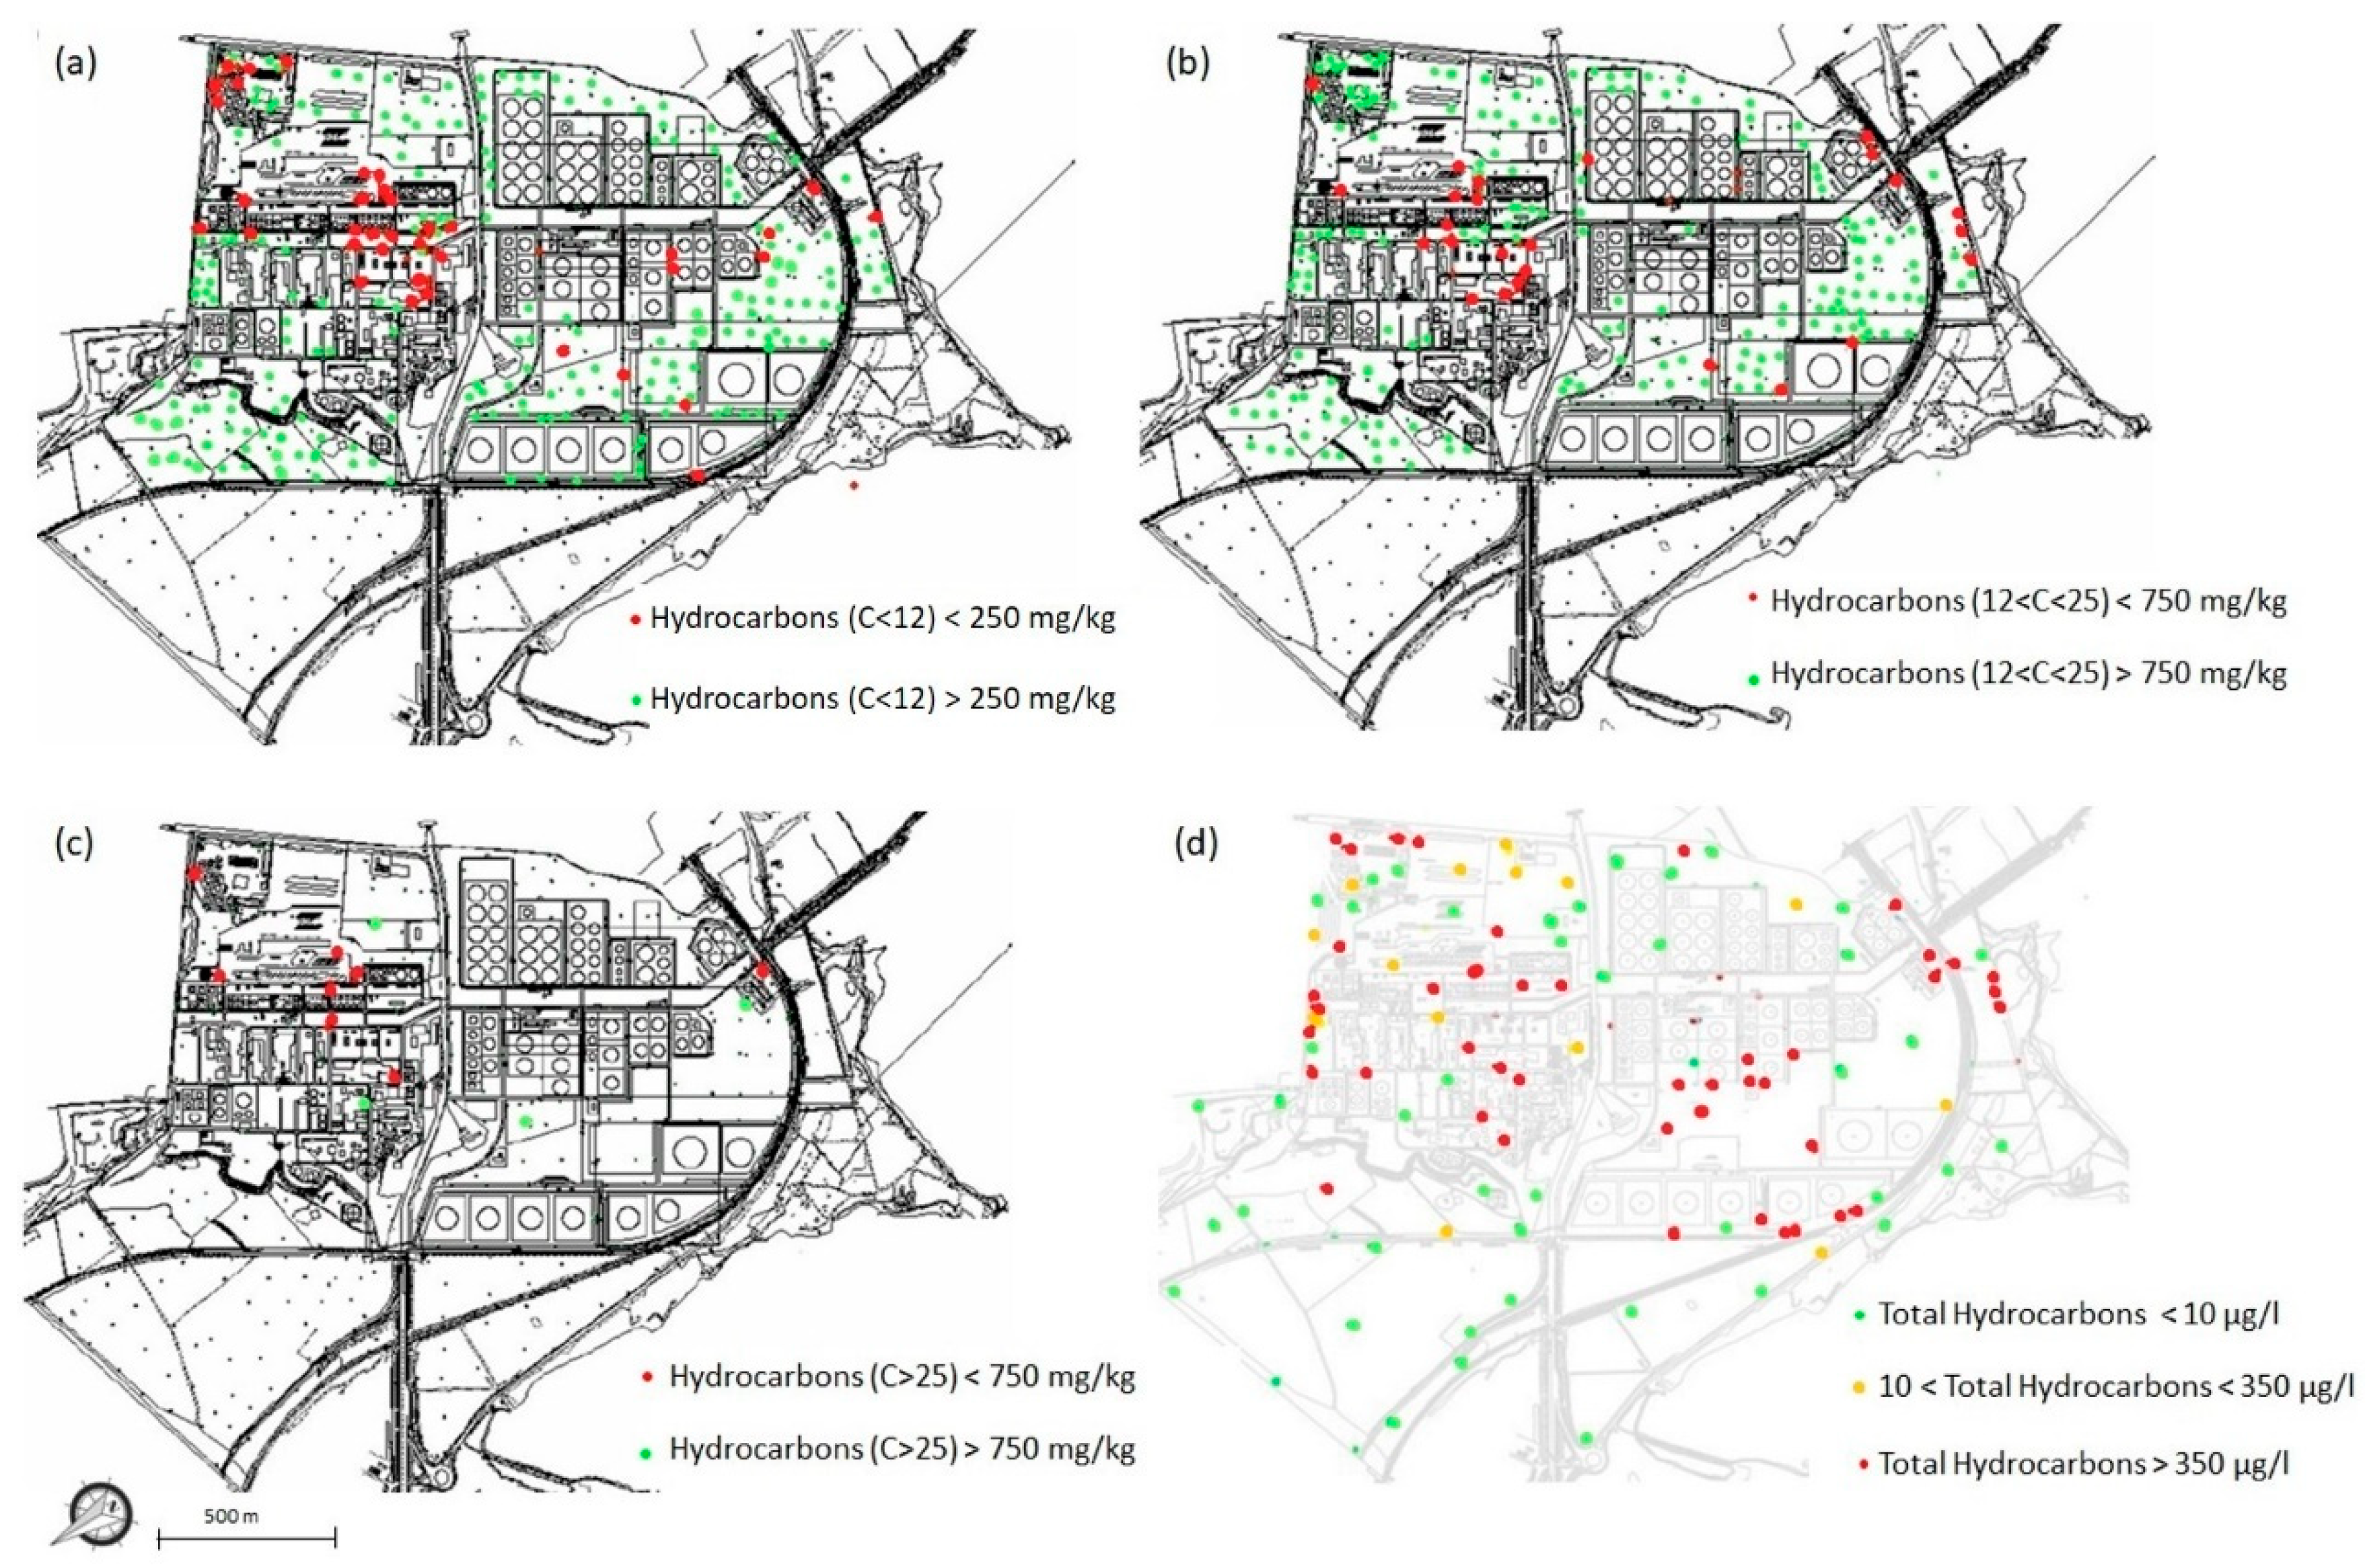
2.1.2. Previous Environmental Investigations
2.1.3. Remediation Plan
2.2. Full-Scale SVE System
- 12 extraction wells of SVE to a maximum depth of 3 m from the ground level with a slotted section between 1.3 and 3 m;
- 4 activated carbon vessels to treat the VOCs pumped out.
3. Results
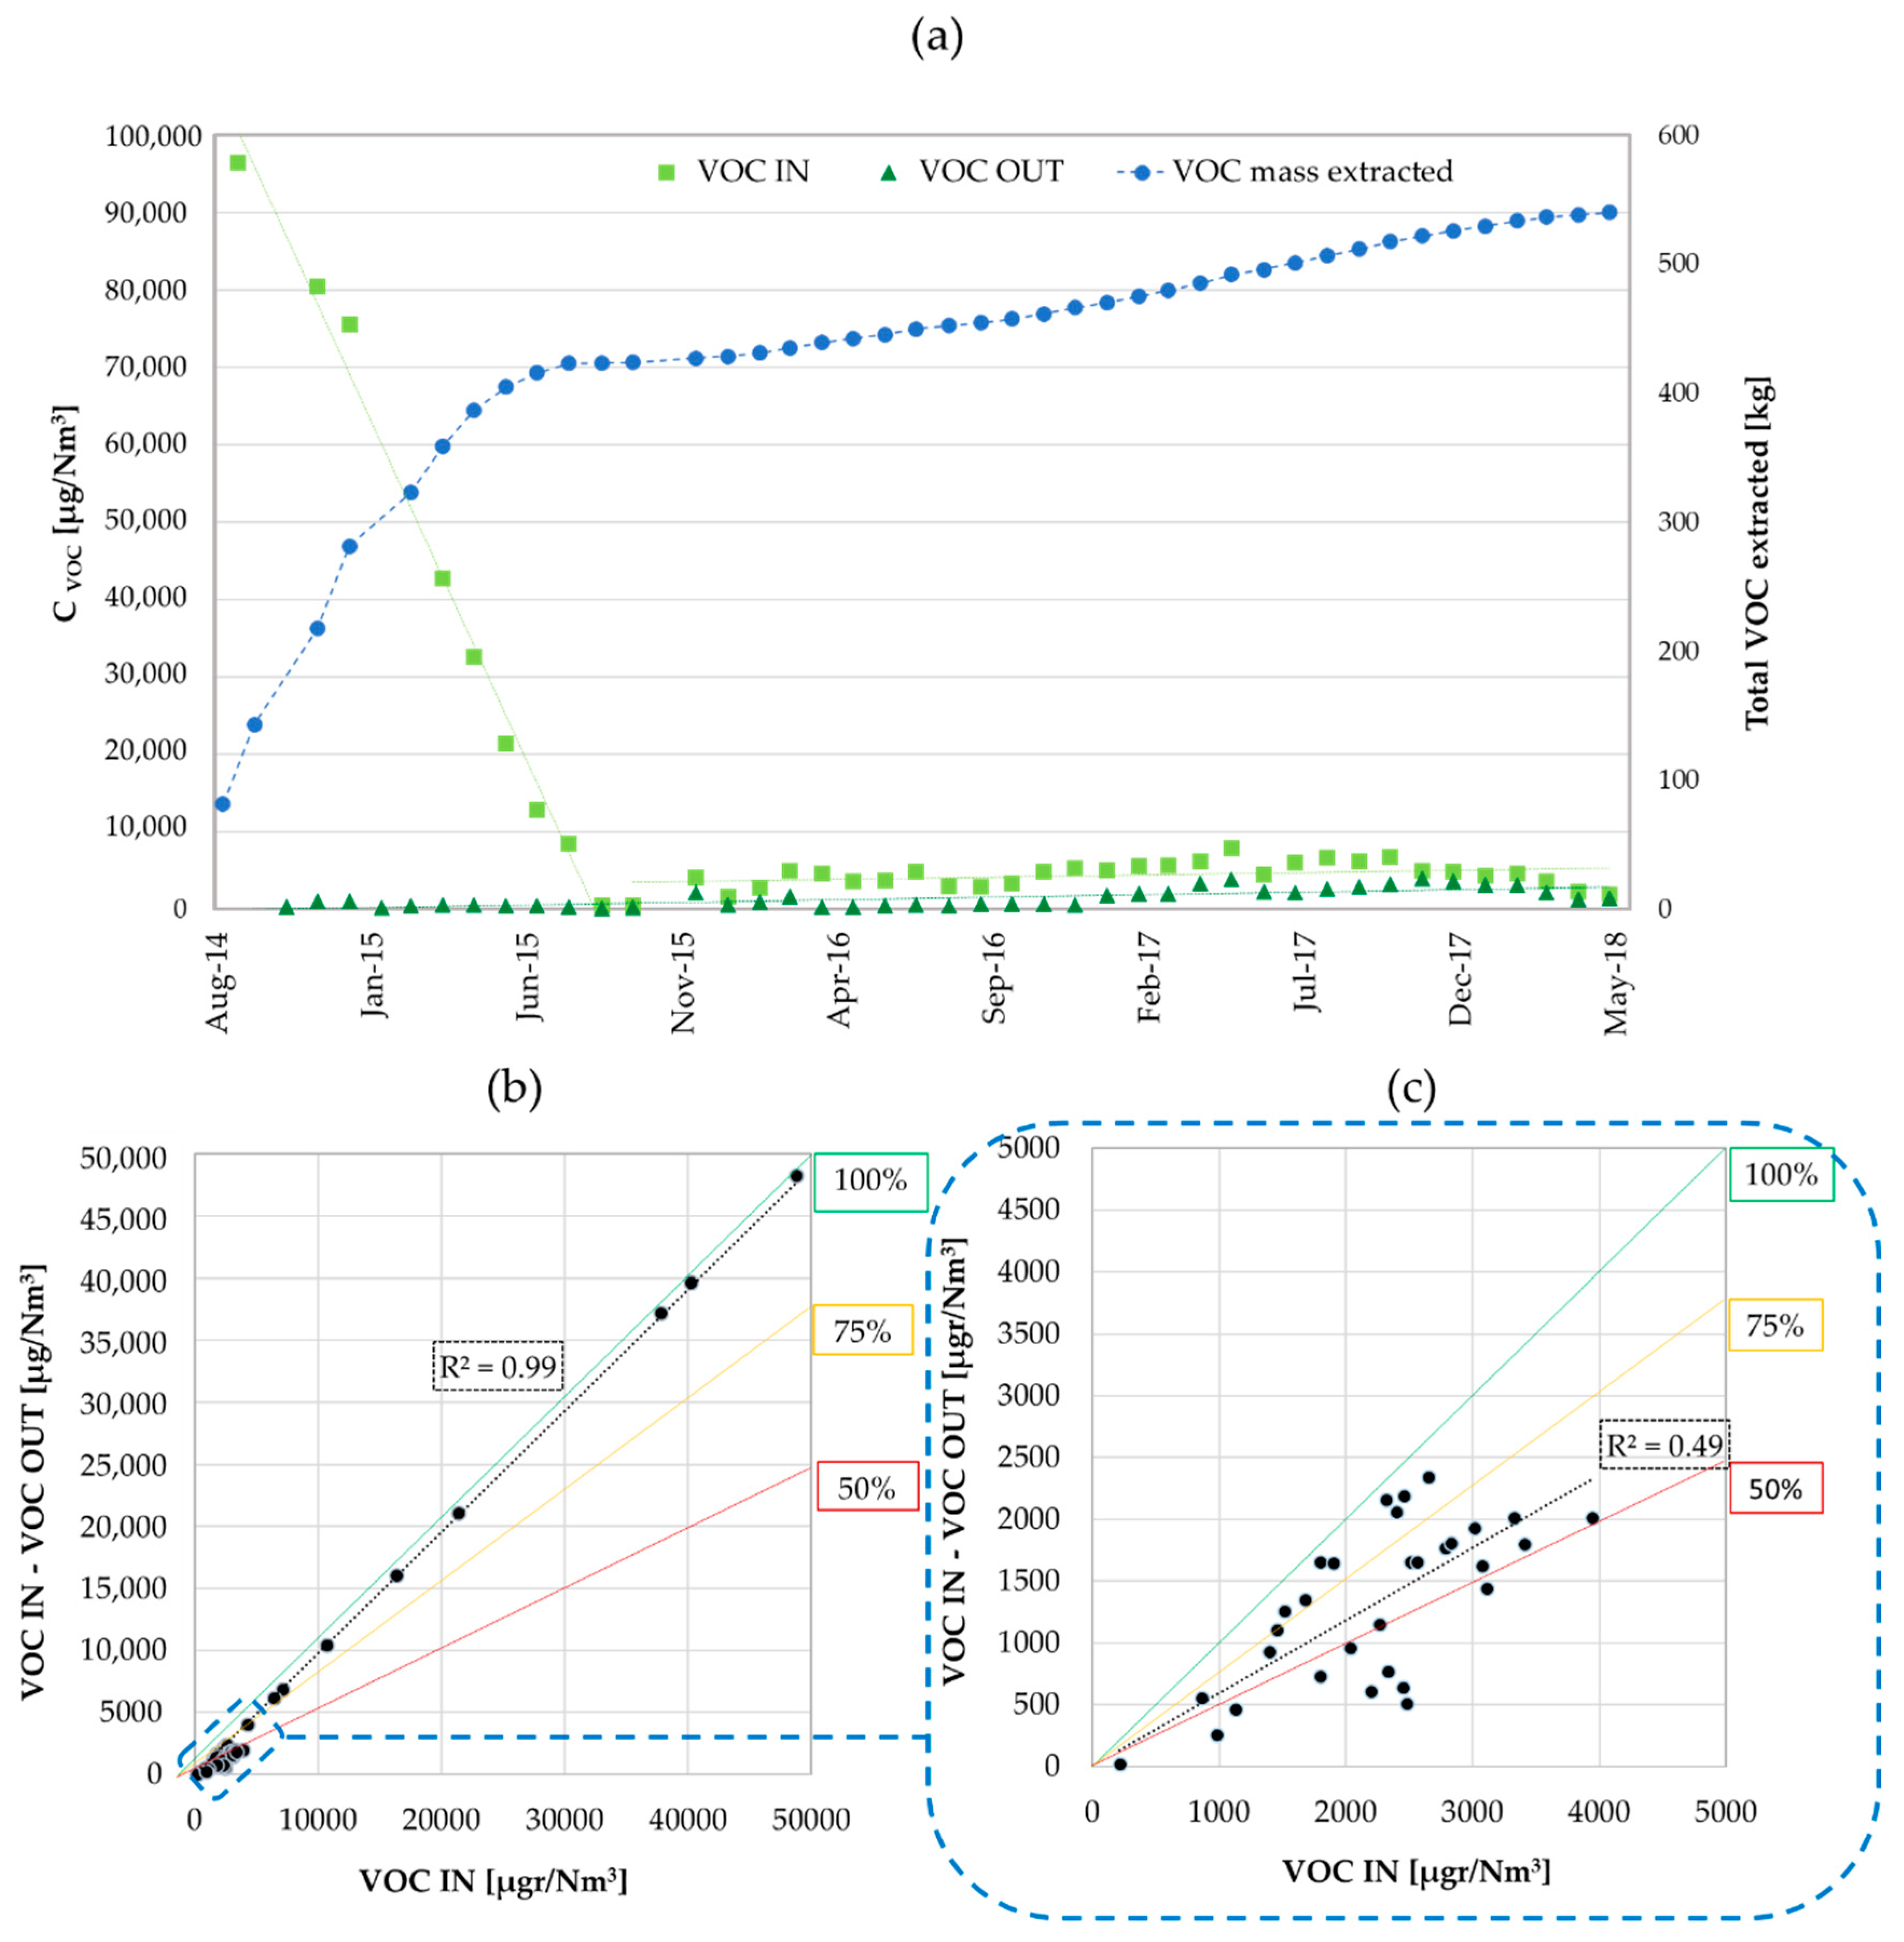
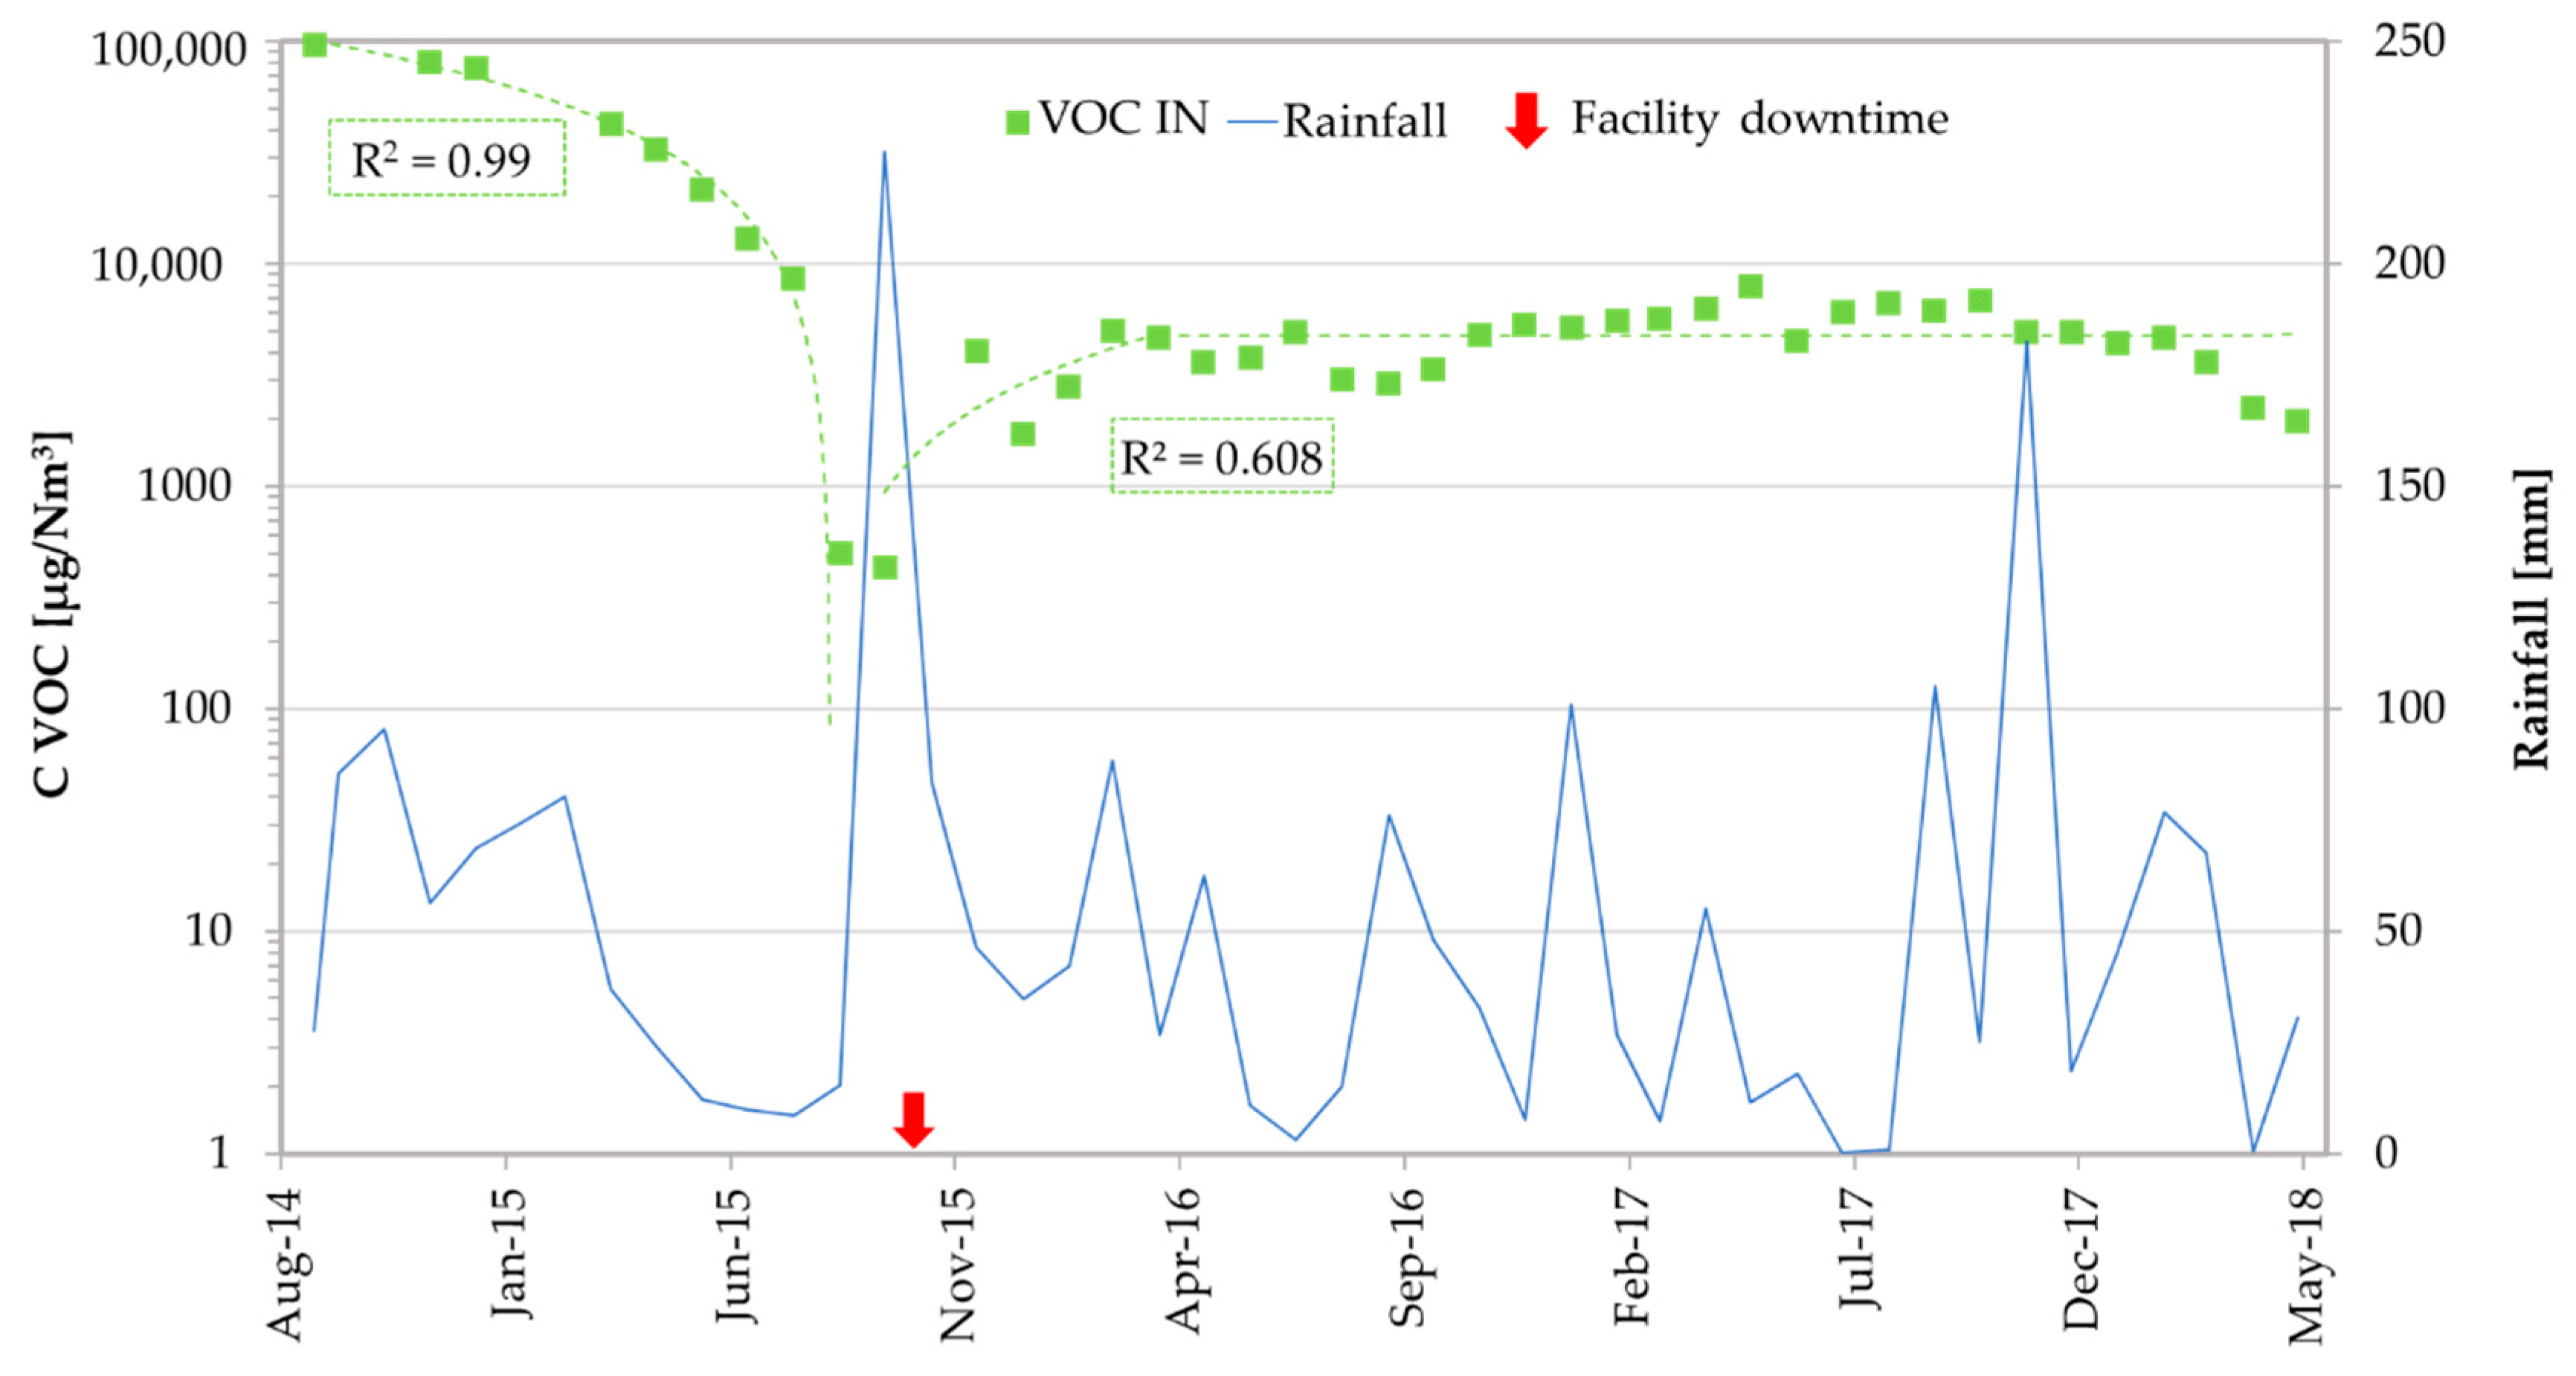
3.1. Air Monitoring
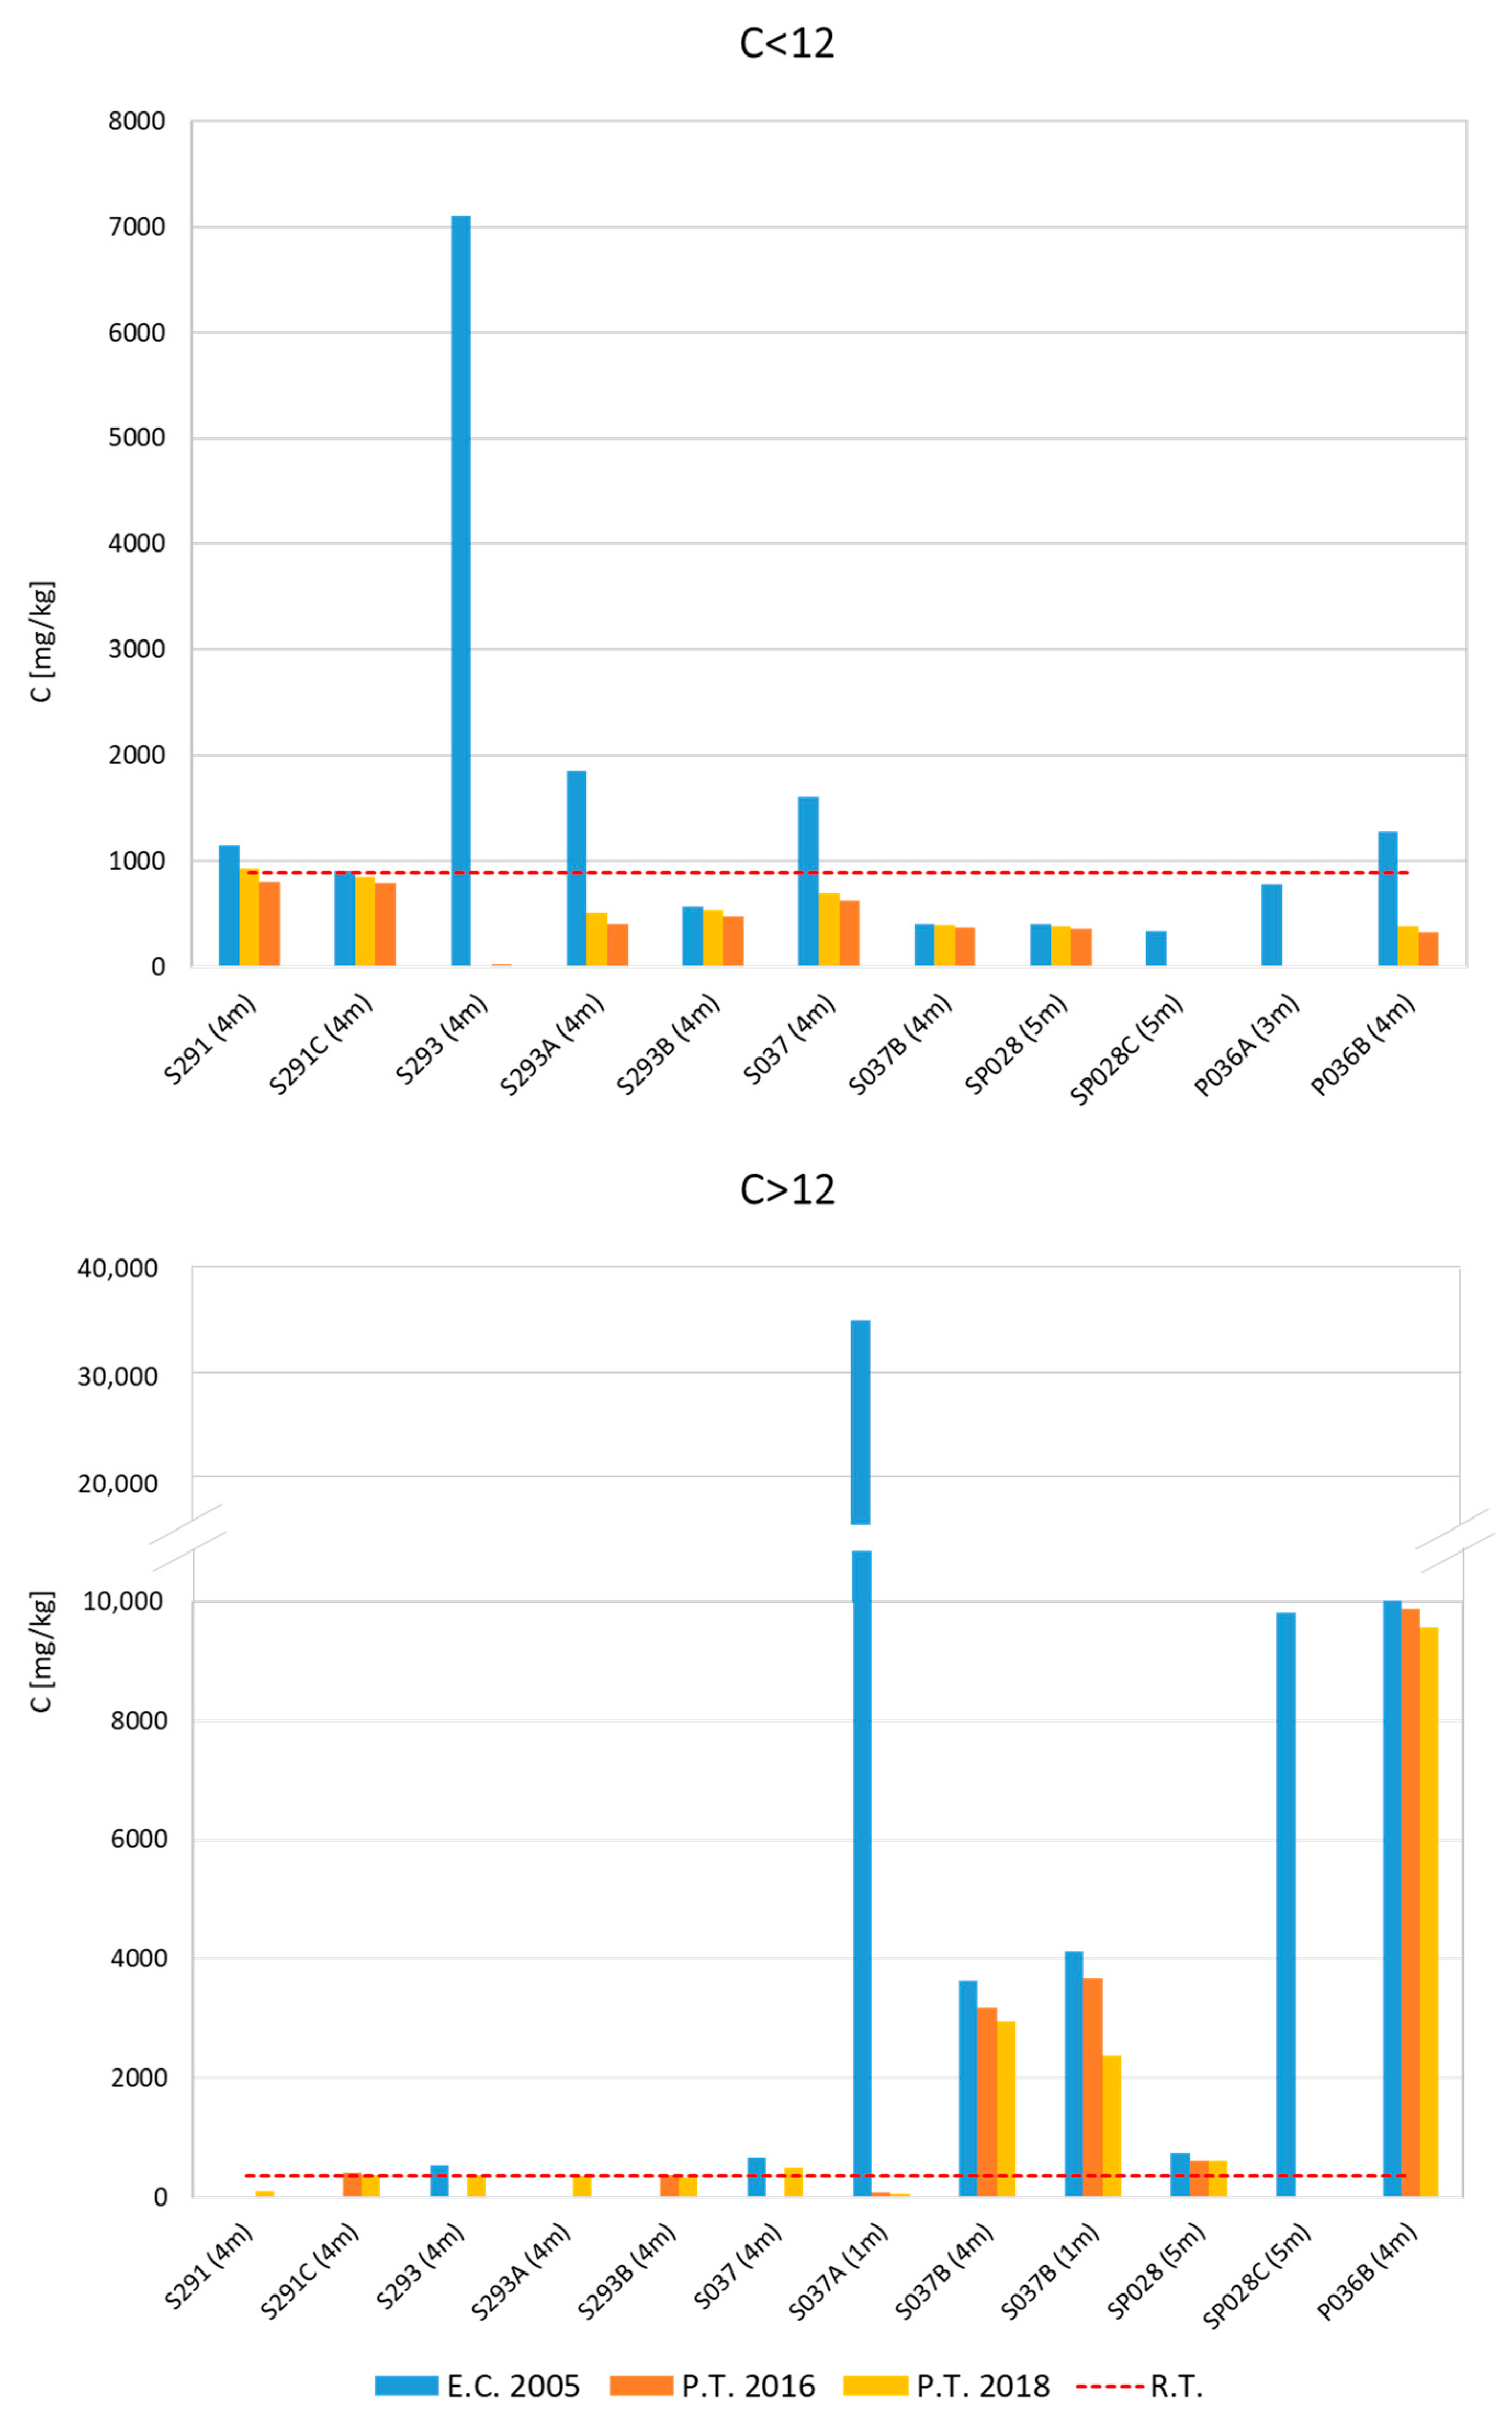
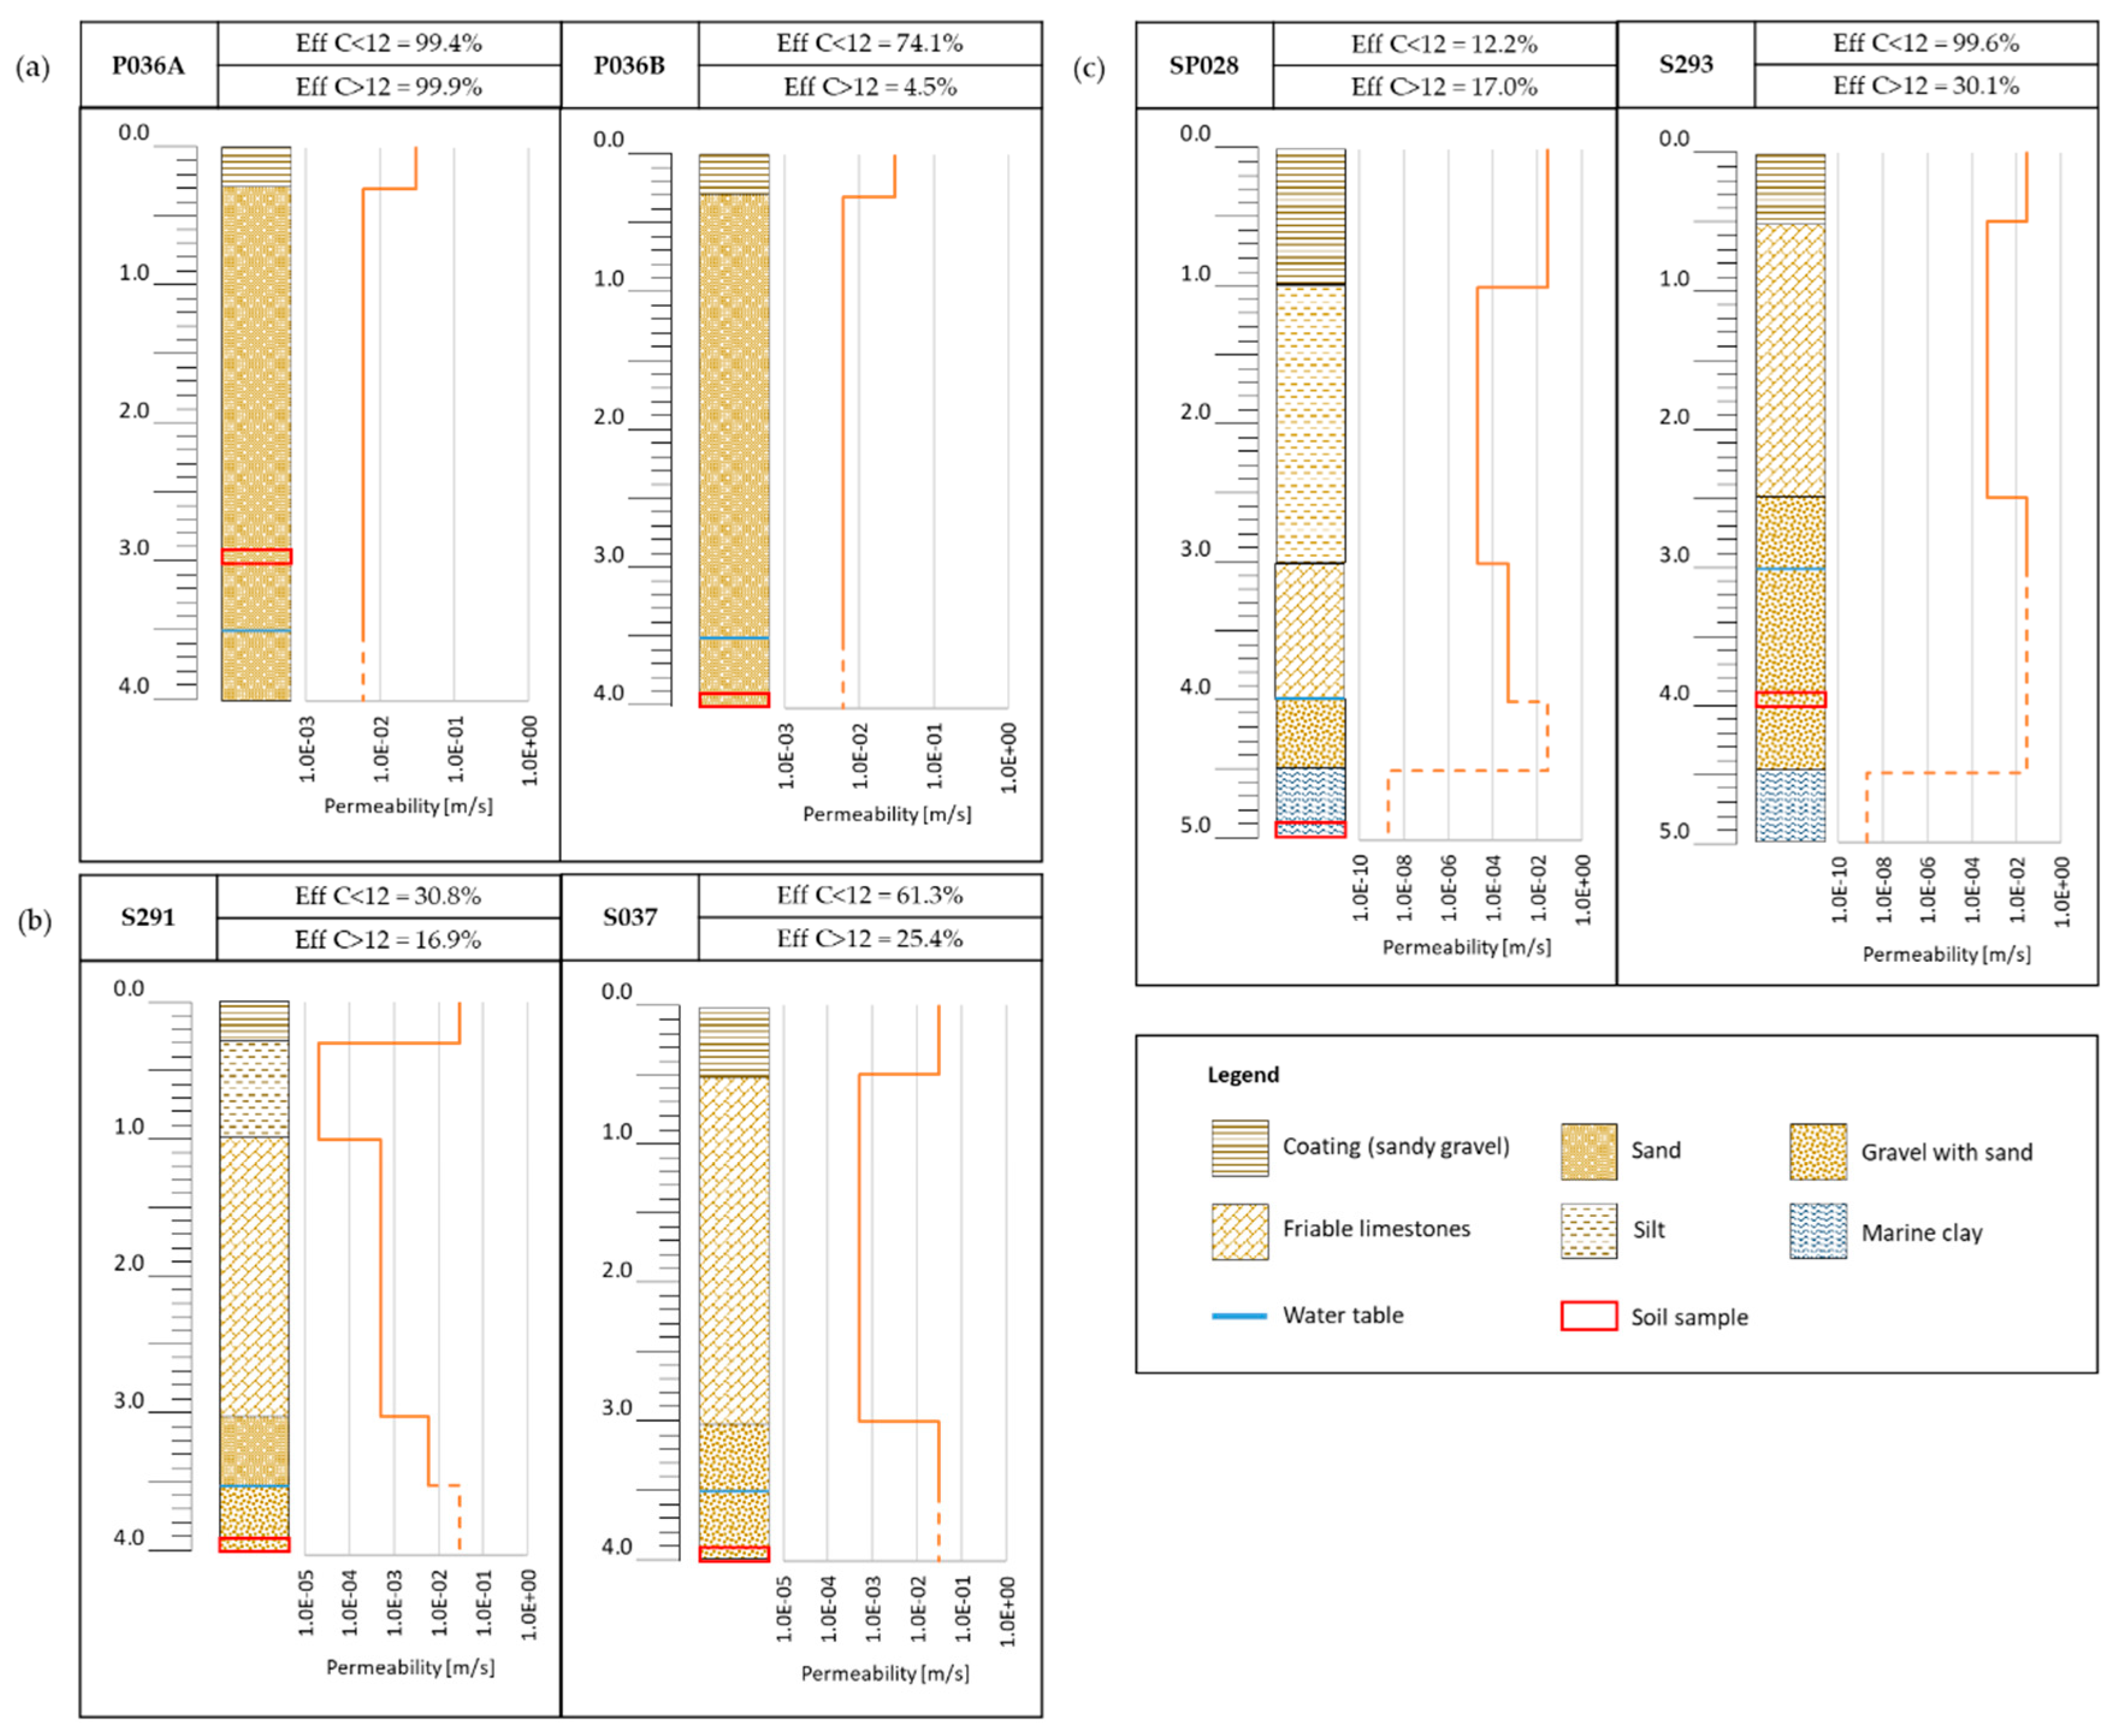
3.2. Coring Survey
4. Data Interpretation and Future Implications
5. Conclusions
- Soil texture affects air rate and vapor movement through the ground and, subsequently, the total VOC removal. The higher the soil permeability is, the more effective the SVE system is. The presence of low permeability layers overlying zones of higher permeability reduces the global effectiveness of the remediation system; however, in low permeable sediments, the removal rate reached values of efficiency >12%.
- The SVE remediation system was effective at reducing VOCs in the vadose zone with a total final efficiency equal to 73%. The remediation targets were reached within four working years for all light hydrocarbons, highlighting how SVE is more effective with smaller and lighter organic compounds. Six samples showed concentrations still higher than the remediation target for heavy hydrocarbons and, thus, an extension of the treatment was planned for 24 months more.
- During the first year of SVE operations, over 420 kg of VOCs were extracted, corresponding to approximately 80% of the total mass extracted (540 kg) in four years of treatment.
- To evaluate the SVE performance for completion or transition to another technology, a full rebounding test may be performed.
Author Contributions
Funding
Acknowledgments
Conflicts of Interest
References
- Nadim, F.; Hoag, G.E.; Liu, S.; Carley, R.J.; Zack, P. Detection and remediation of soil and aquifer systems contaminated with petroleum products: An overview. J. Pet. Sci. Eng. 2000, 26, 169–178. [Google Scholar] [CrossRef]
- Ogidi, O.I.; Njoku, O.C. A Review on the Possibilities of the Application of Bioremediation Methods in the Oil Spill Clean-Up of Ogoni Land. Int. J. Biol. Sci. Technol. 2017, 9, 48. [Google Scholar]
- Anderson, M.A. Influence of Surfactants on Vapor-Liquid Partitioning. Environ. Sci. Technol. 1992, 26, 2186–2191. [Google Scholar] [CrossRef]
- de Gisi, S.; Notarnicola, M. Waste minimization in the remediation of contaminated sites: Using the oil belt skimmer technology for the removal of heavy hydrocarbons from groundwater. Environ. Sci. Pollut. Res. 2016, 23, 24092–24106. [Google Scholar] [CrossRef]
- Lofrano, G.; Libralato, G.; Minetto, D.; de Gisi, S.; Todaro, F.; Conte, B.; Notarnicola, M. In situ remediation of contaminated marinesediment: An overview. Environ. Sci. Pollut. Res. 2017, 24, 5189–5206. [Google Scholar] [CrossRef] [Green Version]
- Bortone, I.; Labianca, C.; Todaro, F.; de Gisi, S.; Coulon, F.; Notarnicola, M. Experimental investigations and numerical modelling of in-situ reactive caps for PAH contaminated marine sediments. J. Hazard. Mater. 2020, 387, 121724. [Google Scholar] [CrossRef]
- Zhan, H.; Park, E. Vapor flow to horizontal wells in unsaturated zones. Soil Sci. Soc. Am. J. 2002, 66, 710–721. [Google Scholar] [CrossRef]
- Khan, F.I.; Husain, T.; Hejazi, R. An overview and analysis of site remediation technologies. J. Environ. Manag. 2004, 71, 95–122. [Google Scholar] [CrossRef]
- Hinchee, R.E.; Dahlen, P.R.; Johnson, P.C.; Burris, D.R. 1, 4-dioxane soil remediation using enhanced soil vapor extraction: I. Field demonstration. Groundw. Monit. Remediat. 2018, 38, 40–48. [Google Scholar] [CrossRef]
- Albergaria, J.T.; Alvim-Ferraz, M.d.M.; Delerue-Matos, C. Soil vapor extraction in sandy soils: Influence of airflow rate. Chemosphere 2008, 73, 1557–1561. [Google Scholar] [CrossRef] [Green Version]
- Kirtland, B.C.; Aelion, C.M. Petroleum mass removal from low permeability sediment using air sparging/soil vapor extraction: Impact of continuous or pulsed operation. J. Contam. Hydrol. 2000, 41, 367–383. [Google Scholar] [CrossRef]
- Halmemies, S.; Gröndahl, S.; Arffman, M.; Nenonen, K.; Tuhkanen, T. Vacuum extraction based response equipment for recovery of fresh fuel spills from soil. J. Hazard. Mater. 2003, 97, 127–143. [Google Scholar] [CrossRef]
- Barnes, D.L. Estimation of operation time for soil vapor extraction systems. J. Environ. Eng. 2003, 129, 873–878. [Google Scholar] [CrossRef] [Green Version]
- Albergaria, J.T.; Alvim-Ferraz, M.d.C.M.; Delerue-Matos, C. Remediation of sandy soils contaminated with hydrocarbons and halogenated hydrocarbons by soil vapour extraction. J. Environ. Manag. 2012, 104, 195–201. [Google Scholar] [CrossRef] [Green Version]
- Qin, C.-Y.; Zhao, Y.-s.; Zheng, W.; Li, Y.-s. Study on influencing factors on removal of chlorobenzene from unsaturated zone by soil vapor extraction. J. Hazard. Mater. 2010, 176, 294–299. [Google Scholar] [CrossRef]
- Behar, H.R.; Snyder, E.E.; Marczak, S.; Salazar, L.J.; Rappe, B.; Fordham, G.F.; Shaoping, P.C.; Strobridge, D.M.; Birdsell, K.H.; Miller, T.A.; et al. An investigation of plume response to soil vapor extraction and hypothetical drum failure. Vadose Zone J. 2019, 18. [Google Scholar] [CrossRef]
- Kao, C.M.; Chen, S.C.; Liu, J.K.; Wu, M.J. Evaluation of TCDD biodegradability under different redox conditions. Chemosphere 2001, 44, 1447–1454. [Google Scholar] [CrossRef]
- Barakat, E.A.; Zytner, R.G. Three dimensional bioventing model. In Proceedings of the COMSOL Multiphysics User’s Conference, Boston, MA, USA, 23–25 October 2005. [Google Scholar]
- Lee, J.Y.; Lee, C.H.; Lee, K.K.; Choi, S.I. Evaluation of soil vapor extraction and bioventing for a petroleum-contaminated shallow aquifer in korea. Soil Sediment Contam. 2001, 10, 439–458. [Google Scholar] [CrossRef]
- Ministerial Decree 10/01/2000, Perimetrazione del sito di Interesse Nazionale di Taranto. GU Serie Generale n.45 del 24-02-2000, Italy. 2000.
- Eni Taranto. Available online: https://www.eni.com/docs/en_IT/enicom/publications-archive/publications/brochures-booklets/countries/eni_Taranto_ENG.pdf (accessed on 24 November 2019).
- Cardellicchio, N.; Buccolieri, A.; Giandomenico, S.; Lerario, V.L.; Lopez, L.; Pizzulli, F. Distribution and occurence of polycyclic aromatic hydrocarbons (PAHs) in sediments from the Mar Grande and Gulf of Taranto (Ionian Sea, Southern Italy). Ann. Chim. J. Anal. Environ. Cult. Herit. Chem. 2006, 96, 51–64. [Google Scholar] [CrossRef]
- Labianca, C.; De Gisi, S.; Notarnicola, M. Assessing the correlation between contamination sources and environmental quality of marine sediments using multivariate analysis. Environ. Eng. Manag. J. 2018, 17, 2391–2399. [Google Scholar] [CrossRef]
- Stamnes, R.; Blanchard, J. Engineering Forum Issue Paper : Soil Vapor Extraction Implementation Experiences; USEPA: Washington, DC, USA, 1997. [Google Scholar]
- Morgan, P.; Atlas, R.M. Hydrocarbon degradation in soils and methods for soil biotreatment. Crit. Rev. Biotechnol. 1989, 8, 305–333. [Google Scholar] [CrossRef] [PubMed]
- Calabrese, A.; Massarelli, C.; Uricchio, V.F.; Campanale, C. Safeguarding drinking water: Use and quality of water, case study of tarante province. Procedia Eng. 2014, 89, 232–238. [Google Scholar] [CrossRef] [Green Version]
- Cotecchia, V.; Grassi, D.; Polemio, M. Carbonate aquifers in Apulia and seawater intrusion. G. Geol. Appl. 2005, 1, 219–231. [Google Scholar]
- Regulation Containing Criteria, Procedures and Procedures for the Safety, Reclamation and Environmental Restoration of Polluted Sites" Issued in Implementation of Legislative Decree no. 22/97 (Ronchi Decree). Ministerial Decree DM 471/1999, Italy. 1999.
- Johnson, P.C.; Kemblowski, M.W.; Colthart, J.D. Quantitative analysis for the cleanup of hydrocarbon-contaminated soils by in-situ venting. Groundwater 1990, 28, 413–429. [Google Scholar] [CrossRef]
- U.S. EPA. Method 8015C (SW-846): Nonhalogenated Organics Using GC/FID, Revision 4; U.S. EPA: Washington, DC, USA, 2003. [Google Scholar]
- Afolabi, L.A.; Omonijo, A.G.; Aderibigbe, A.T. Effects of rainfall patterns on soil moisture, soil temperature and plant growth in humid forest zone Nigeria. Amer.-Eurasian J. Sustain. Agric. 2009, 3, 413–417. [Google Scholar]
- Nobre, M.M.; Nobre, R.C. Soil vapor extraction of chlorinated solvents at an industrial site in Brazil. J. Hazard. Mater. 2004, 110, 119–127. [Google Scholar] [CrossRef]
- USEPA. In situ Soil Vapor Extraction; Office of Solid Waste and Emergency Response, US Environmental Protection Agency: Washington, DC, USA, 1996. [Google Scholar]
- USEPA. Soil Vapor Extraction (SVE); Office of the Underground Storage Tank, US Environmental Protection Agency: Washington, DC, USA, 1998; Publication # EPA 510-B-95-007. [Google Scholar]
- Collazos, O.M.; Bowders, J.J.; Bouazza, A. Laboratory evaluation of prefabricated vertical drains for use in soil vapour extraction systems. Proc. Inst. Civ. Eng. -Ground Improv. 2003, 7, 103–110. [Google Scholar] [CrossRef]
- Brusseau, M.L.; Mainhagu, J.; Morrison, C.; Carroll, K.C. The vapor-phase multi-stage CMD test for characterizing contaminant mass discharge associated with VOC sources in the vadose zone: Application to three sites in different lifecycle stages of SVE operations. J. Contam. Hydrol. 2015, 179, 55–64. [Google Scholar] [CrossRef] [Green Version]
- Glascoe, B.L.G.; Wright, S.J.; Abriola, L.M. Modeling the influence of heat/moisture exchange during bioventing. J. Environ. Eng. 1999, 125, 1093–1102. [Google Scholar] [CrossRef]


| Units | RL | S291 | S291C | S293 | S293A | S293B | S037 | S037A | |
|---|---|---|---|---|---|---|---|---|---|
| Sampling Depth | m | - | 4 | 4 | 4 | 4 | 4 | 4 | 1 |
| Humidity at 105 °C | % | - | 32.5 | 21.2 | 8.2 | 17.2 | 12.6 | 15.2 | 5.2 |
| Residues at 105 °C | % | - | 67.5 | 78.8 | 91.8 | 82.8 | 87.4 | 84.8 | 94.4 |
| Fraction < 2 mm | % | - | 92.6 | 93.9 | 67.7 | 94.3 | 68.3 | 71 | - |
| C>12 | mg/kg | 750 | 119.4 | 445.2 | 525 | 404.4 | 406.5 | 658 | 34,177 |
| C<12 | mg/kg | 250 | 1156 | 908 | 7108 | 1855 | 569 | 1608 | <0.1 |
| Benzene | mg/kg | 2 | <0.005 | 0.226 | 0.524 | 7.63 | 1.64 | 1.82 | <0.001 |
| Ethylbenzene | mg/kg | 50 | <0.005 | 7.59 | 11.3 | 62 | 6.73 | 19.9 | <0.001 |
| Xylene | mg/kg | 50 | <0.005 | 12.1 | <0.005 | 184 | 16 | 95.4 | <0.001 |
| Units | RL | S037B | S037B | SP028 | SP028C | P036 | P036A | P036B | |
| Sampling depth | m | - | 4 | 1 | 5 | 5 | 1 | 3 | 4 |
| Humidity at 105 °C | % | - | 17.6 | 6.3 | 21.1 | 17.1 | 14 | 18.2 | 20.8 |
| Residues at 105 °C | % | - | 82.4 | 93.7 | 78.9 | 82.9 | 86 | 81.8 | 79.2 |
| Fraction < 2 mm | % | - | - | - | 85.8 | - | 89.8 | - | - |
| C>12 | mg/kg | 750 | 3642 | 4128 | 749 | 9812 | 0.2 | 52 | 10,026 |
| C<12 | mg/kg | 250 | 408 | <0.1 | 410 | 333 | <0.1 | 785 | 1276 |
| Benzene | mg/kg | 2 | 1.37 | <0.001 | <0.001 | <0.001 | <0.001 | <0.001 | <0.001 |
| Ethylbenzene | mg/kg | 50 | 24.4 | <0.001 | <0.001 | <0.001 | <0.001 | <0.001 | <0.001 |
| Xylene | mg/kg | 50 | 99.8 | <0.001 | <0.001 | <0.001 | <0.001 | <0.001 | <0.001 |
| Core Sample n. | Sampling Depth (m) | C<12 | C>12 | ||||
|---|---|---|---|---|---|---|---|
| RT = 891 mg/kg | RT = 365 mg/kg | ||||||
| EC 2005 (mg/kg) | PT 2018 (mg/kg) | Efficiency (%) | EC 2005 (mg/kg) | PT 2018 (mg/kg) | Efficiency (%) | ||
| S291 | 4 | 1156 | 800 | 30.8 | 119.4 | 99.2 | 16.9 |
| S291C | 4 | 908 | 786 | 13.4 | 445.2 | 362 | 18.7 |
| S293 | 4 | 7108 | 25 | 99.6 | 525 | 367 | 30.1 |
| S293A | 4 | 1855 | 412 | 77.8 | 404.4 | 350 | 13.5 |
| S293B | 4 | 569 | 478 | 16.0 | 406.5 | 335 | 17.6 |
| S037 | 4 | 1608 | 623 | 61.3 | 658 | 491 | 25.4 |
| S037A | 1 | <0.1 | - | - | 34,177 | 50 | 99.9 |
| S037B | 1 | <0.1 | - | - | 4128 | 2381 | 42.3 |
| S037B | 4 | 408 | 366 | 10.3 | 3642 | 2953 | 18.9 |
| SP028 | 5 | 410 | 360 | 12.2 | 749 | 622 | 17.0 |
| SP028C | 5 | 333 | 15 | 95.5 | 9812 | <5 | 99.9 |
| P036A | 3 | 785 | <5 | 99.4 | 52 | <5 | 99.9 |
| P036B | 4 | 1276 | 330 | 74.1 | 10,026 | 9572 | 4.5 |
| Total | - | 16,416 | 4195 | 74.4 | 65,096 | 17,582 | 72.4 |
© 2020 by the authors. Licensee MDPI, Basel, Switzerland. This article is an open access article distributed under the terms and conditions of the Creative Commons Attribution (CC BY) license (http://creativecommons.org/licenses/by/4.0/).
Share and Cite
Labianca, C.; De Gisi, S.; Picardi, F.; Todaro, F.; Notarnicola, M. Remediation of a Petroleum Hydrocarbon-Contaminated Site by Soil Vapor Extraction: A Full-Scale Case Study. Appl. Sci. 2020, 10, 4261. https://0-doi-org.brum.beds.ac.uk/10.3390/app10124261
Labianca C, De Gisi S, Picardi F, Todaro F, Notarnicola M. Remediation of a Petroleum Hydrocarbon-Contaminated Site by Soil Vapor Extraction: A Full-Scale Case Study. Applied Sciences. 2020; 10(12):4261. https://0-doi-org.brum.beds.ac.uk/10.3390/app10124261
Chicago/Turabian StyleLabianca, Claudia, Sabino De Gisi, Francesco Picardi, Francesco Todaro, and Michele Notarnicola. 2020. "Remediation of a Petroleum Hydrocarbon-Contaminated Site by Soil Vapor Extraction: A Full-Scale Case Study" Applied Sciences 10, no. 12: 4261. https://0-doi-org.brum.beds.ac.uk/10.3390/app10124261