Impact of Inulin Addition on Properties of Natural Yogurt


1
Institute of Food Sciences, Department of Food Technology and Assessment, Division of Fat and Oils and Food Concentrates Technology, Warsaw University of Life Sciences (WULS-SGGW), Nowoursynowska 159c St., 02-776 Warsaw, Poland
2
Faculty of Chemical Engineering and Commodity Science, Kazimierz Pulaski University of Technology and Humanities, Chrobrego st, 27, 26-600 Radom, Poland
*
Author to whom correspondence should be addressed.
Appl. Sci. 2020, 10(12), 4317; https://0-doi-org.brum.beds.ac.uk/10.3390/app10124317
Submission received: 3 June 2020
/
Revised: 18 June 2020
/
Accepted: 19 June 2020
/
Published: 23 June 2020
(This article belongs to the Special Issue Functional Fermented Food Products)
Abstract
:Featured Application
Stirred yogurts with high prebiotic content can be used as a healthier alternative to natural yoghurts offered on the food market.
Abstract
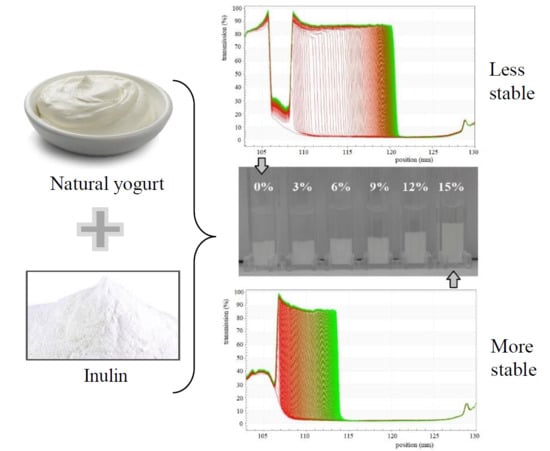
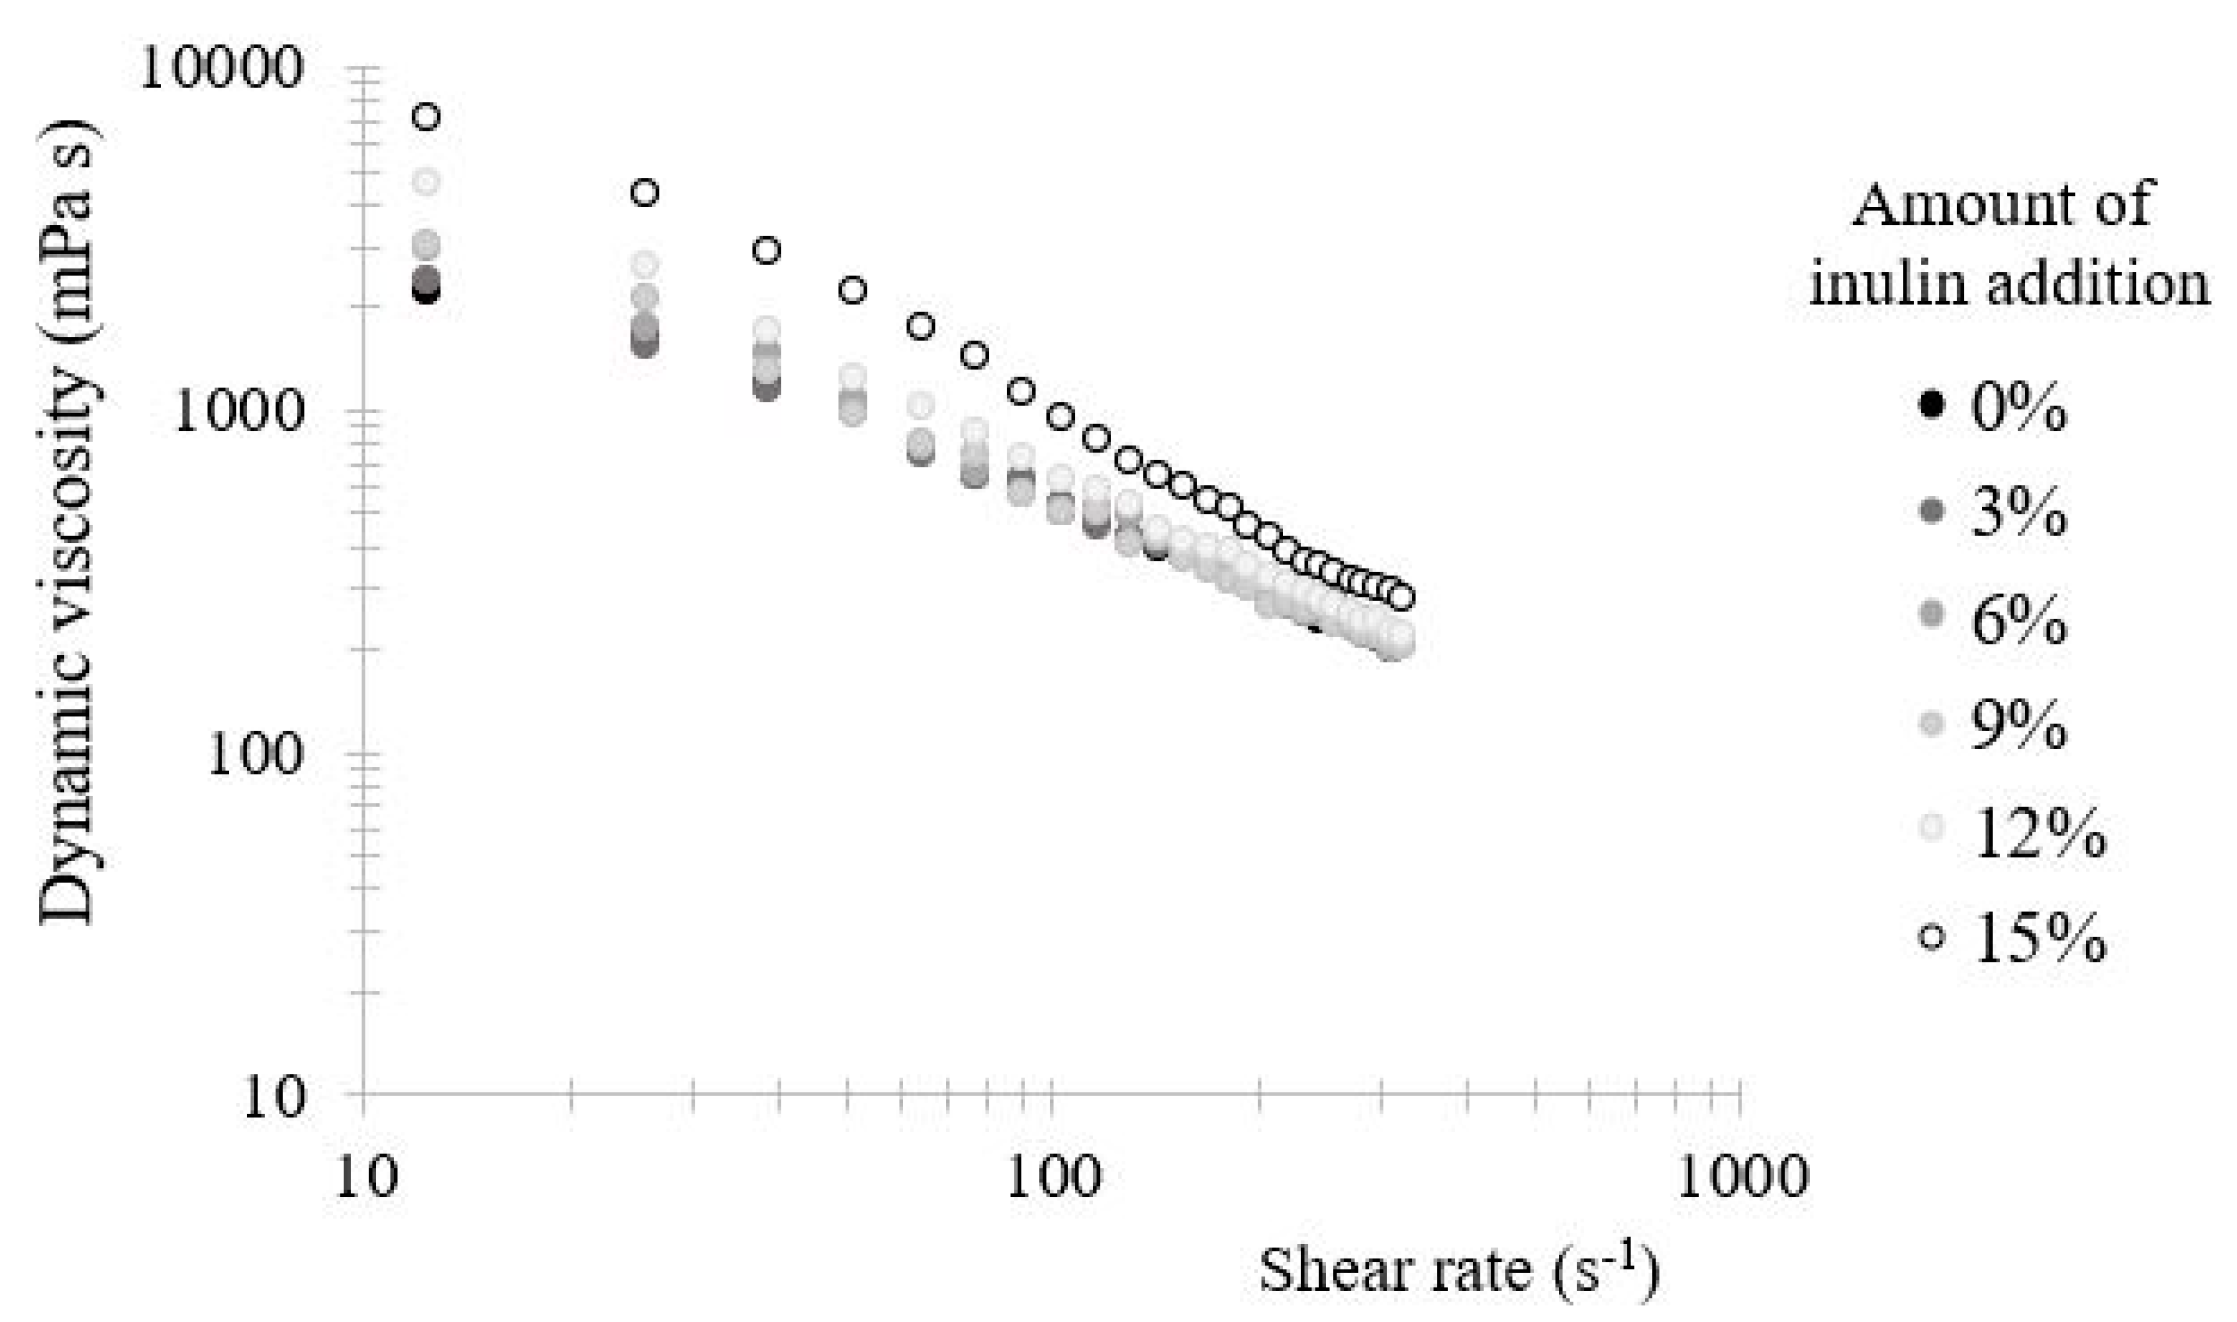
The influence of the amount of inulin addition (3%, 6%, 9%, 12% or 15% w/w) on the physicochemical properties of natural yogurt was analyzed. The acidity (titration; pH), texture parameters (penetration test), viscosity curves (rotational rheometer), microrheology (macroscopic viscosity index, MVI; elasticity index, EI; solid-liquid balance—SLB; multi-speckle diffusing-wave spectroscopy, MS-DWS) and physical stability (syneresis; LUMiSizer test) of yogurts were investigated. All samples were non-Newtonian pseudoplastic liquids. The sample with 15% inulin content presented an approx. 4% higher pH value (4.34), 3-fold greater MVI and almost 5-fold higher penetration force, compared to the control sample (0% of inulin). In turn, the use of inulin addition in the range of 3–15% w/w resulted in a reduction of syneresis (p < 0.05). A linear decrease in the values of instability indexes and sedimentation velocities was noted in the function of inulin content increase (LUMiSizer test). The application of inulin (in the range of 3–15% w/w) as a functional additive to yogurts significantly contributed to enhancement of their physical stability. Summing up, the possibility of obtaining natural yogurts with a high content of this prebiotic has been demonstrated, thus such products can be classified as functional foods and a health claim can be put on the label.
1. Introduction
The increase in consumer interest and awareness in the area of proper nutrition is constantly being observed. Functional food, which includes foods with nutrition and health claims, is becoming increasingly popular [1,2]. Considering the health claims, a relationship between food and health is required, supported by scientific and clinical research [3]. Functional food contains a component with a positive effect on health or eliminates a component with a negative effect. Its composition also includes bioactive substances, e.g., dietary fiber [4]. Inulin deserves special attention. It is classified as soluble fiber because it is not hydrolyzed in the human digestive tract, and it presents prebiotic properties. Moreover, inulin has various functional properties, among others demonstrating good gelability. One of the most important is its fat mimetic property, which is successfully used in the production of mayonnaise, margarine, yogurts and sponge cakes [5,6,7]. The incorporation of this fiber into the food composition (at least 3 g/100 g portions) allows the product to be labeled with a nutrition claim, and when it provides a 12 g dose per day a health claim can be used [1,8].
Yogurts are oil-in-water emulsion systems in which the fat phase is oil and the water phase is a solution of proteins, carbohydrates and mineral salts [9]. They are made from fresh milk and/or after reconstitution using the bacteria Lactobacillus bulgaricus and Streptococcus thermophilus, with the possible participation of additional food ingredients and allowed additional substances [10]. Originally, the production of fermented dairy products was a way to preserve the nutrients of milk. It has been proven that consumption of these products provides a number of health benefits due to live cultures of lactic bacteria (probiotics) [11,12]. The inclusion of various additives in the fermented milk product composition may increase their nutritional and health value [6,10,13,14], and also changes their rheological and textural properties [11]. The application of 1–2% inulin addition to skimmed cow’s milk enables the production of yogurt with acceptable quality and characteristics comparable to yogurt obtained from full-fat cow’s milk [6].
According to the increase in yogurt consumption [15], it is important to seek new opportunities to expand their offers to consumers and to develop products enriched with health substances at various stages of production, as well as in gastronomy or home conditions. The use of fiber as a food additive modifies its physical properties [11] and therefore it is valid to investigation the rheological properties and stability of the obtained systems using modern techniques. This paper attempts to use the multi-speckle diffusing-wave spectroscopy (MS-DWS) method (Rheolaser Maste, Toulouse, France) and the centrifugal separation analysis (CSA) method (LUMiSizer, Berlin, Germany) to identify and evaluate the intensity of physical changes in natural yogurt with the addition of a prebiotic. The purpose of the study was to assess the influence of the addition of inulin as a functional substance on the properties of natural yogurt.
2. Materials and Methods
The study materials were 6 systems based on natural yogurt (Zott Poland, Sp. z o.o.) containing 3.1% fat, with the addition of Orafti® GR (BENEO-Orafti SA, Oreye, Belgium) granulated inulin powder (~92% inulin, ~10% sweetness level, DP ≥ 10) at levels of 0%, 3%, 6%, 9%, 12% and 15% w/w. Natural yogurt was purchased at the local supermarket.
Inulin was gradually incorporated into yogurt (at 20 ± 2 °C), which was mixed using a Phoenix RSM 10-HP magnetic stirrer (Phoenix Instrument GmbH, Garbsen, Germany) for 10 min at 400 rpm. Samples were stored at 6 ± 1°C for 24 h to stabilize the systems. Before the measurements were taken, the samples were allowed to establish room temperature (20 ± 2 °C).
2.1. Total and Active Acidity (pH)
The total acidity of stirred yogurt was determined by titration. Approx. 10 g of sample was titrated with 0.1 M NaOH using phenolphthalein as indicator. Total acidity was expressed in Soxhlet–Henkel degrees (°SH), which was converted to lactic acid content (1 °SH = 0.0225 g lactic acid) expressed in mg acid per 100 g of yogurt [16]. Active acidity (pH) was measured using a Mettler Toledo MP220 pH meter (Mettler-Toledo Sp. z o.o., Warsaw, Poland) equipped with a glass calomel composite electrode. The arithmetic mean of the triplicate results was calculated.
2.2. Microrheological Characteristics—MS-DWS Method
The microreological properties of systems were examined using the MS-DWS (multi-speckle diffusing-wave spectroscopy) dynamic light scattering technique with a Rheolaser Master device (Formulaction, Toulouse, France). Calculations were made using the RheoSoft software. Light source beams (laser) concentrated in one field on a constant height of the measuring vial. The rate of change in the mobility of the particles in the sample was calculated by means of the decorrelation function, i.e., the difference between the light intensity of the corresponding pixels (speckles). Based on the decorrelation curve, the mean square displacement (MSD) was determined, which depends on the area (nm2) covered by the particles at the given decorrelation time. Samples of yogurt were placed in 20 mL vials immediately after their preparation and were tested for 24 h to determine MSD and elasticity index (EI) curves while the systems were stabilizing. In addition, the “quick characterization” test (at 20 ± 1 °C, for 10 min) of samples stored for 24 h at 6 ± 1 °C was performed using the same device. The following rheological parameters of yogurts were determined: macroscopic viscosity index (MVI) (slope nm−2), elasticity index (EI) (nm−2) and solid-liquid balance (SLB) (plateau nm2). The MVI corresponds to the viscosity (in Pa s) at zero shear, while the EI is directly proportional to the modulus of elasticity G’ (in Pa), and the SLB to the value of tangent δ, i.e., the ratio G’/G’’ (0.5 < SLB < 1—liquid behavior dominates; 0 < SLB < 0.5—solid (gel) behavior dominates; SLB = 0.5—liquid and solid parts are equal) [17,18]. Measurements were made in triplicate for each sample.
2.3. Viscosity Curves
A viscosity test was carried out at increasing (every 10 s−1) shear rate (from 10 to 250 s−1) using a Brookfield DV3T rotational viscometer (Brookfield Engineering Laboratories., Inc., Middleboro, USA). The samples were tested using a cylindrical adapter and a DIN-86 spindle (at 20 ± 1 °C). Viscosity curves were determined, then the linear relation between dynamic viscosity (mPas) and shear rate (s−1) was presented using a double logarithmic scale. Measurements were made three times for each sample. The final result was the arithmetic mean of the obtained values.
2.4. Texture
The texture features of yogurts were determined in a penetration test using a Texture Analyser TA.XT plus (Stable Micro Systems, London, UK). A flat cylindrical probe 25 mm in diameter (P/25P) was used, moving at a constant speed of 1 mm/s to a depth of 9 mm. Each sample was 40 g of yogurt in a 50 mL glass beaker (diameter 42 mm). The maximum strength (N) and the minimum strength (N) were measured, which determine the hardness and stickiness of yogurt, respectively. The test was carried out in six replicates at 23 ± 1°C.
2.5. Degree of Syneresis
The degree of syneresis was determined by the centrifugal method using an MPW-352 centrifuge (Med. Instruments, Warsaw, Poland). Samples were centrifuged in 10 mL graduated tubes at 4000 rpm for 10 min (at 20 ± 1 °C). After centrifugation, the amount of separated whey was taken from the tube and compared to the volume of yogurt before centrifugation. The measurement was made in triplicate for each variant. The degree of syneresis is presented in weight percent as the arithmetic mean of the results [16].
2.6. Physical Stability—CSA Method
The changes in stirred yogurt stability were investigated using space- and time-resolved extinction profiles (STEP) technology. The LUMiSizer 612 dispersion analyser (LUM GmbH, Berlin, Germany) enables simultaneous centrifugation of samples and measurement of the light intensity transmitted over their entire height. Recording of light intensity profiles as a function of time and position of the sample (“fingerprints”) and computations were executed using the SEPView software. The LUMiSizer test was carried out 24 h after systems preparation and establishing a constant temperature of samples in room conditions (20 ± 2 °C). Samples were centrifuged in 0.5 mL tubes at 4000 rpm at 20 ± 1 °C for 50 min. Transmission profiles were recorded every 3 s, with a light ratio of 1.0 and a wavelength of 870 nm. Migration and particle size alterations cause variations in transmitted/backscattered light intensity, affecting the evolution of recorded curves. Based on the transmission profiles, the values of instability indexes and sedimentation velocities in the spin field were calculated, and the phenomena of destabilization of dispersion systems were identified. The test was carried out three times for each variant.
2.7. Statistical Analysis
As part of statistical analysis of the study results the one-way analysis of variance (ANOVA) was performed, using Fisher’s test and Duncan’s test. Cluster analysis was carried out to classify the tested samples (objects) according to the average values of specific parameters (variables). For this purpose, the agglomeration method (object classification method), Euclidean distance (distance between objects), Ward method (principle of object/cluster binding) and the Baker and Hubert index (determinant of the number of clusters) were used. The mean parameter values and coefficients of variation for each cluster were calculated. Statistica 13.3 software (TIBCO Software Inc., Palo Alto, CA, USA) was used.
3. Results and Discussion
3.1. Acidity
The sensory quality, rheological properties and health values of natural yogurts as fermented products are often associated with their acidity. It depends on technological factors, type and quality of raw materials, recipe composition or storage conditions. Therefore, acidity is a measure of the production process correctness, as well as an important indicator in research on reformulation of this type of product, including yogurts [16,19]. In accordance with the Polish standard PN-A-86061:2002 [20], typical yogurt should contain at least 0.6% lactic acid.
The average lactic acid content in the tested samples ranged from 0.88% to 1.06% (Table 1). Along with an increase in the amount of inulin addition, total acidity decreased (Figure 1), and thus the pH value was enhanced (Table 1). The control sample (0% inulin) was not significantly different from the sample with 3% inulin concentration, both in terms of total and active acidity (pH). The total acidity of the sample with 15% inulin content was about 17% lower, and the pH was about 4% higher, compared to yogurt without the addition of inulin. Similarly, in studies of Cais-Sokolińska et al. [21] the effect of additives on the acidity of fermented products has been demonstrated. The authors studied natural yogurts (2% fat content) with the addition of cereal products. Yogurts containing groats at the level of 10% immediately after production were characterized by 7.4% (buckwheat), 11.1% (oat groat) and 34.4% (barley groat) lower acidity, compared to yogurt without an additive. In turn, Najgebauer-Lejko et al. [22] did not indicate statistically significant differences between pH values for plain yogurt and yogurt with carrot, pumpkin, broccoli or red pepper (pH: 4.63–4.70).
It was found that the application of the inulin addition caused changes in total and active acidity of natural yogurt, at the level that would not disqualify any of the samples. According to Jankowska and Reps [23], consumers prefer natural yogurts with a pH in the range of 4.2–4.5. A lower acidity of samples with inulin 24 h after their preparation was inevitable, as the systems were "diluted", and adaptation and growth of lactic acid bacteria cells require adequate time. According to the subject literature, the increase in acidity occurs with the passage of storage time as a result of intensified lactic acid production by lactic bacteria with the presence of a prebiotic. Cais-Sokolińska et al. [21] proved an increase in acidity over time in studies on natural yogurt containing 2% fat content, with an addition of various cereal products.
3.2. Rheological and Textural Characteristics
The rheological parameters of the product are closely related to the shaping of its macroscopic features, e.g., consistency or physical stability, which depend on the mechanical properties and structure at the microscopic level. Therefore, their determination is necessary for creating the qualitative characteristics of the food product. The technique of dynamic light scattering enables non-contact and non-destructive analysis as a function of time, based on the movement and interactions between system molecules [17,18]. Passive methods of microrheology analysis that allow non-invasive tracking of diffusive motion of molecules are particularly useful in studies of heterogeneity of food systems. In combination with other techniques, they can provide detailed characteristics of food products, both at the stage of their production and distribution or use [24].
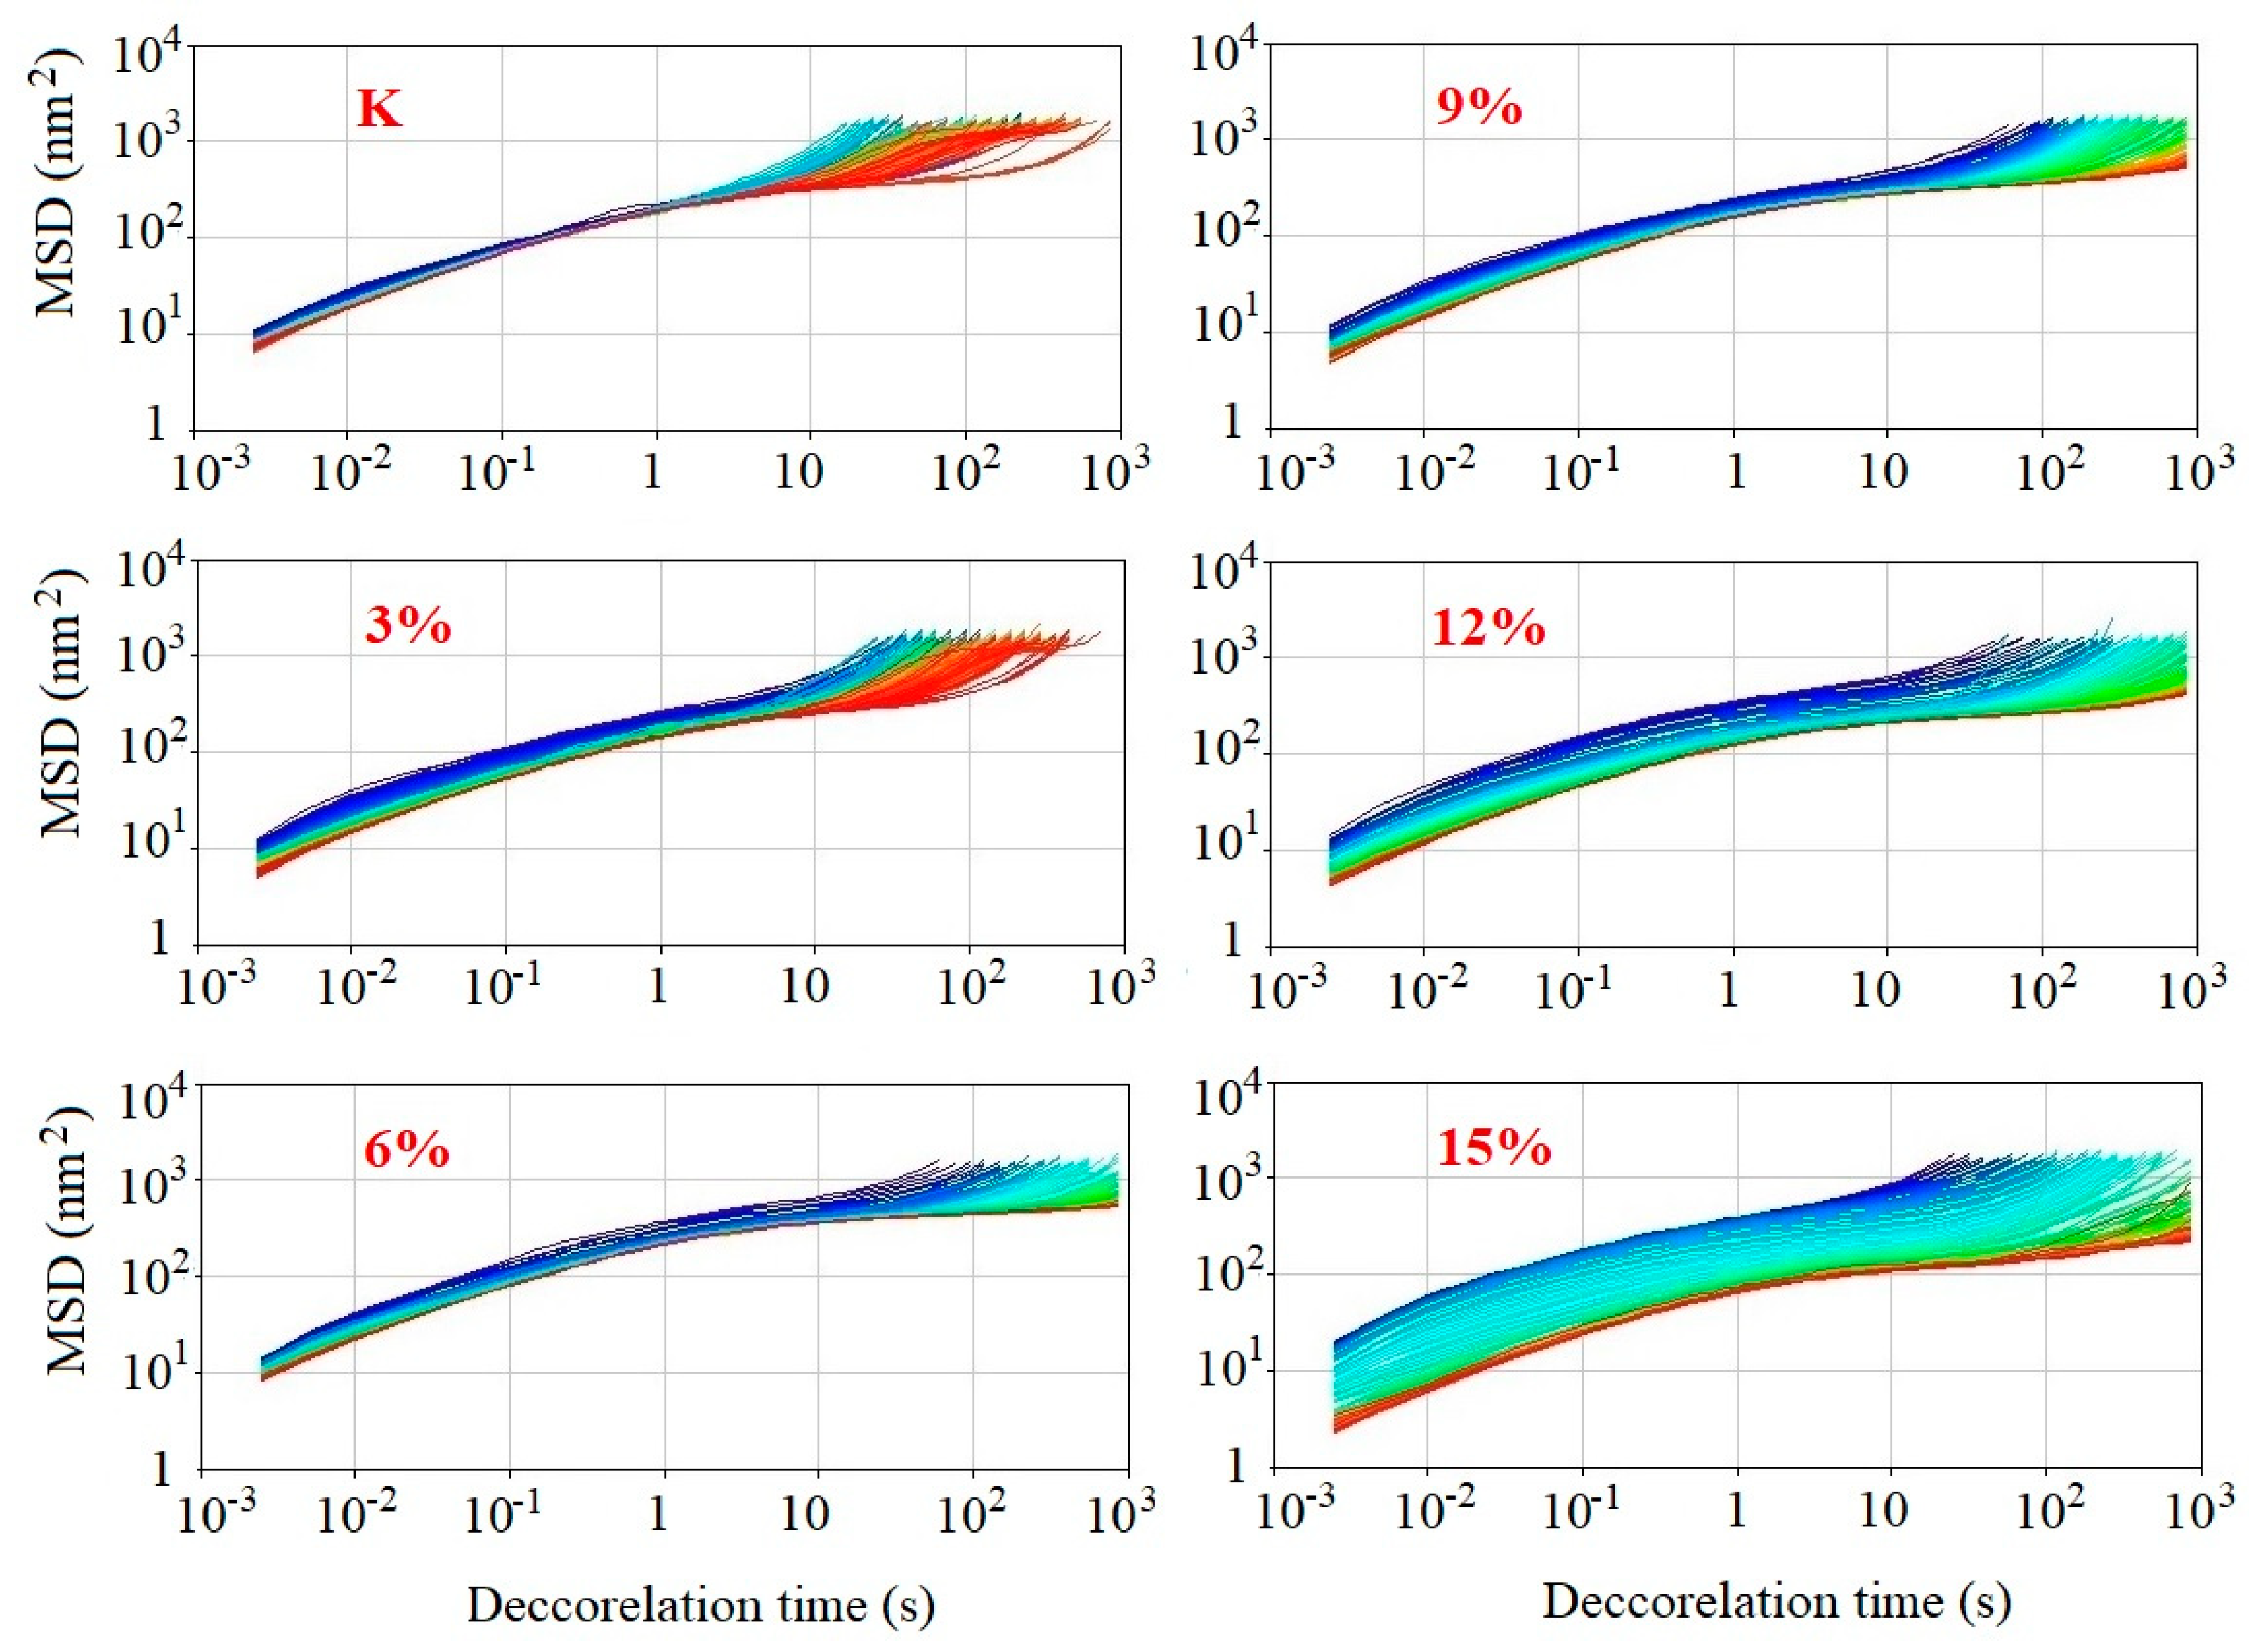
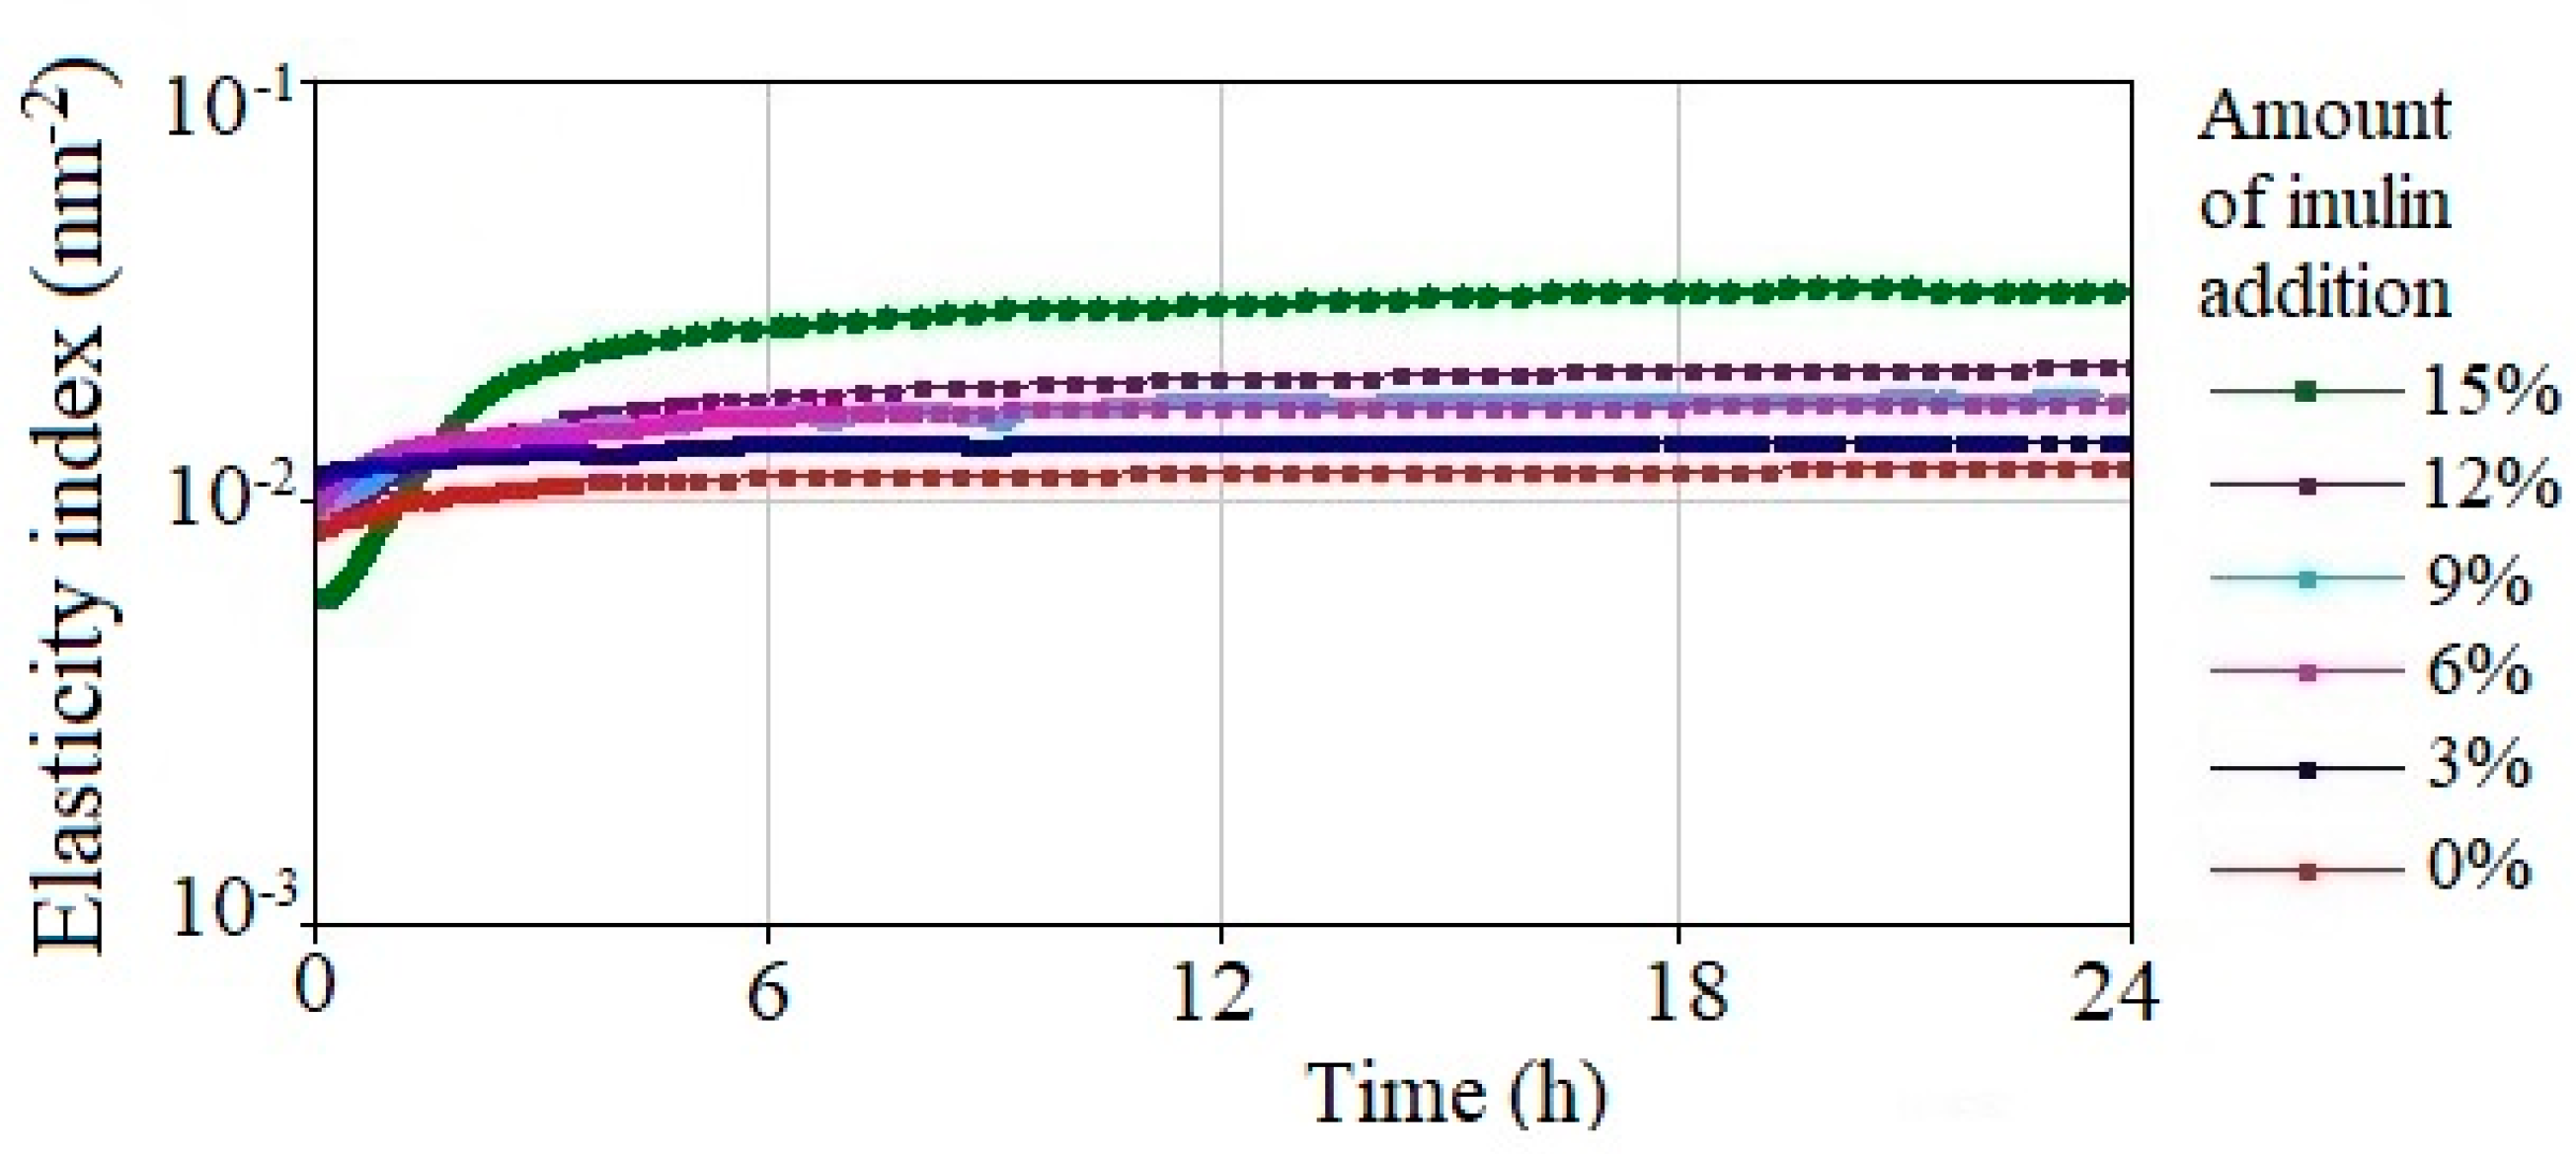
Microrheological properties of samples were analyzed during 24 h stabilization at 20 ± 1 °C. The MSD (mean square displacement) curves as a function of decorrelation time were obtained. Based on the position of the first curve and the last curve, a decrease in MSD level over time was noted, which indicated a reduction in mobility of molecules in the systems. The shape of the MSD curve evolved with the passage of time, and it was characterized by an increasingly visible non-linear course and a shift in the longer time of decorrelation (Figure 2). Moreover, a clear accretion in the EI value was observed up to approx. four hours of measurement, especially for samples with 6%, 9%, 12% or 15% prebiotic content. Subsequently, these changes progressed slightly and it can be assumed that after 12 h the EI values for all samples were at a relatively constant level (Figure 3). Both MSD curves and EI curves show that the thickening (3%) and/or gelling (6%, 9%, 12%, 15%) process of stirred yogurts was initiated by inulin addition. Therefore, a significant relationship between inulin concentration and viscoelastic properties of yogurts was demonstrated. As the amount of inulin addition increased, their elasticity and viscosity were enhanced. This effect was most noticeable in the case of the sample with the highest inulin content, i.e., at the level of 15% w/w. Other research also presents that the formation of the gel and its rheological properties depend on the inulin concentration, temperature and mixing intensity during preparation. Increasing inulin concentration, heating to approx. 70–80 °C and/or mixing of the system promote the gelling properties of inulin. However, it is possible to obtain the gels at lower temperatures. Such a process is slightly more intense with a higher inulin content [25,26].
Rohart et al. [27] used the MS-DWS method to evaluate the acid-induced gelation of skimmed milk. At neutral pH conditions, a uniform linear increase in MSD was observed during decorrelation, which could be attributed to liquid-like behavior. With the acidification of the milk, the MSD level decreased and the profile formed into a characteristic "plateau" in a longer period of decorrelation. Thus, the progressing gelation process was demonstrated. Similar results were obtained by Surber et al. [28], who observed that the gel properties of milk depend on the exopolysaccharide used, based on EI curves as a function of time.
The microrheological attributes of yogurts stored for 24 h at 6 °C were determined, using the MS-DWS method. Figure 4 and Figure 5 show the correlation of EI, MVI and SLB parameters to the inulin content. An exponential increase in the value of EI or MVI as a function of the increase in the concentration of this prebiotic was noted (R2 > 0.90). Yogurts with 12% and 15% inulin content demonstrated approx. 2- and 3-fold higher EI and MVI values, respectively, than natural yogurt (p < 0.05). The SLB value was not changed appreciably by the amount of inulin added—for the control sample it was approx. 0.524 nm2, and for yogurt with 15% inulin content approx. 0.502 nm2 (Figure 5). All stirred yogurts were characterized by SLB values higher than 0.5 and lower than 1.0, which means that the liquid phase dominates in these systems. Similar relationships were obtained by Arango et al. [25], who used inulin (0%, 3% or 6% w/w) as a fat replacement in a blend of reconstituted milk, which was subjected to rennet coagulation (at 32 °C). Samples with inulin had a higher elasticity modulus than the sample without inulin. However, the insertion of inulin into the mixture in an amount of 3% or 6% did not have a significant impact on the value of tangent δ (G’/G’’). In turn, Dabija et al. [29] assessed the effect of enriching yogurt in various fiber preparations (from peas, oats, wheat or inulin) at 1%, 1.5%, 2.0% or 2.5% w/w. Increasing the inulin concentration from 1% to 2.5% resulted in a 2-fold higher elasticity modulus, while tan δ did not change significantly.
It has been demonstrated that as the shear rate increases, the dynamic viscosity of yogurt decreases, as shown at a double logarithmic scale. All samples tested, regardless of the amount of additives prebiotic addition, were non-Newtonian (shear thinning) fluids. In general, the viscosity of yogurt increased with the higher inulin content, which was particularly evident at lower shear rates (Figure 6). Another slight relationship was proved by Codina et al. [30], who added quinoa flour to the recipe of yogurt (0.2%, 0.6%, 1.0%, 1.4% or 2.0% wt/vt). It has been shown that a quantity of additive exceeding 1.0% caused a deterioration of yogurt quality. The sample containing 0.6% quinoa flour was considered the best. It was characterized by the highest viscosity, the lowest degree of syneresis and good porosity of the protein network.
Other studies have also investigated that the type and concentration of the substance, enriching the composition of the product, have an influence on its integrity and durability. Dietary fiber preparations are effective structure-forming additives in dairy products [21,31,32].
Texture analysis indicated that the inclusion of inulin into natural yogurt caused an increase of its firmness and stickiness. Stirred yogurt with a 3% inulin concentration did not have differing textural parameters from the control sample (p > 0.05). A further increase in fiber concentration in the system caused a significant increase in the cohesion of the yogurt structure. These results also confirm the emulsion stabilizing effect of inulin. Samples with 12% and 15% inulin content were characterized by 3- and 5-fold higher values of firmness and stickiness, respectively, compared to yogurt without addition (Figure 7). Therefore, the use of inulin as a functional additive to natural yogurts can not only improve their nutritional value, but also their physical stability.
Raju and Pal [32] presented a statistically significant reduction in the firmness of the high-calorie Misti Dahi yogurt (an ethnic delicacy from eastern India)—FFMD (i.e., fiber fortified misti dahi), due to the application of fiber preparations (soy, oat, inulin) in the amount of 1.5 g per 100 mL sample. Yogurt with oat fiber was characterized by the lowest value of this parameter—approx. 15% lower than the firmness of control yogurt. Inulin levels (3–15% w/w) had no significant effects on stickiness of samples.
3.3. Physical Stability
From a thermodynamic point of view, oil-in-water food emulsions are unstable systems and susceptible to various factors causing destabilization mechanisms [33]. Traditional methods for testing the physical stability of the emulsions, e.g., “aging” (gravitational), centrifugal (centrifugal force), thermal (usually high temperature) and combinations thereof, are based on visual assessment and/or numerical expression of results. They do not allow detection and tracking of changes occurring during the analysis. It is possible with the application of modern methods based on the technique of scattering and light transmission through the sample, including the CSA method (centrifugal separation analysis) using the LUMiSizer dispersion analyser [34,35].
Concerning yogurts and other dairy products, an important feature of product quality is the intensity of syneresis occurring [19,27,36].
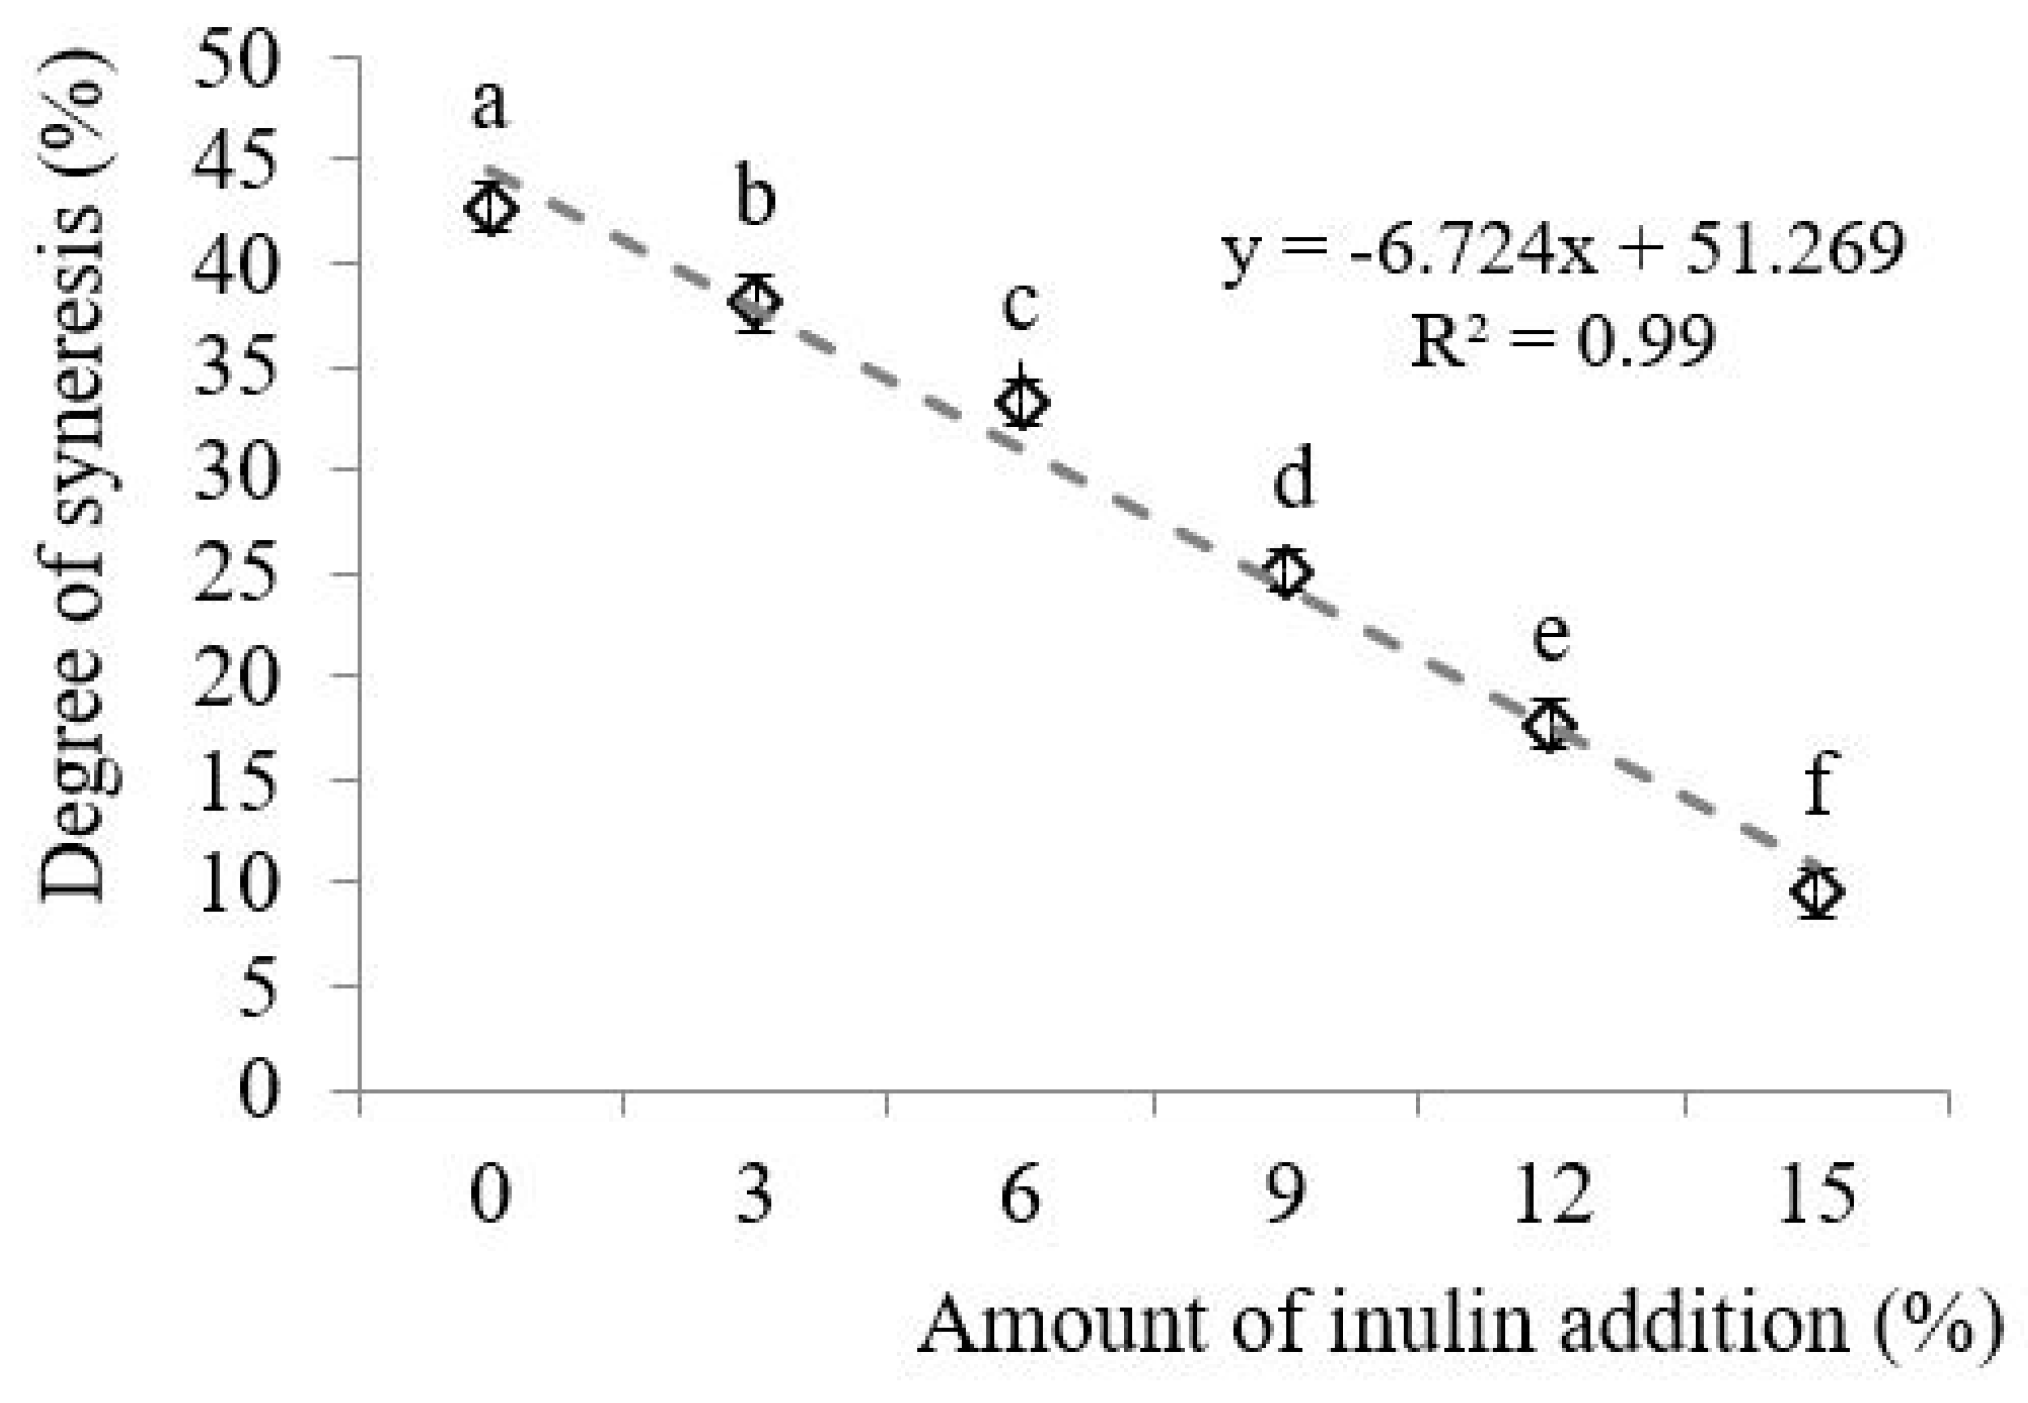
The incorporation of even the smallest amount of inulin (3% w/w) to natural yogurt resulted in a statistically significant reduction of quantity of whey secreted during centrifugation (4000 rpm, 10 min). Dabija et al. [29] claimed a similar tendency. The highest degree of syneresis (42.7%) was found in control yogurt (without inulin). Larger amounts of the additive caused a further decrease in the value of this parameter (samples with 9% and 12% inulin showed the reduction by 17.6 and 25.0 percentage points, respectively). Moreover, stirred yogurt containing 15% of prebiotic presented 4.5-fold lower degree of syneresis, as against the control sample (Figure 8). A very strong correlation was found between the amount of inulin and the degree of syneresis—R2 = 0.99 (Figure 8). Other scientists have also reported on the beneficial impacts of various additives on the stability of yogurts, e.g., pea fiber and concentrated whey (CW) from buffalo cheddar cheese [29,37]. Dabija et al. [29] pointed out that the most stable sample turned out to be a yogurt with 1.5% pea fiber (38.86% syneresis). Rashid et al. [37] also determined that influence of concentrated whey (CW) content (from buffalo cheddar cheese) in buffalo milk yogurt composition on degree of its syneresis was varied. Yogurts containing 5% and 10% CW caused reduction of this indicator by approx. 15%, compared to the yogurt without the addition. However, the sample with 30% CW was characterized by over two times higher syneresis (approx. 17.1%).
Regarding results of the LUMiSizer test, similarly to centrifugal test, a linear decline in stirred yogurt instability was observed with the increase in the concentration of inulin: y= −0.07x + 0.6327. Yogurts with 6% and 9% prebiotic showed lower instability indexes than the control sample (0.537)—approx. 17.5% and 35.6%, respectively. In the case of yogurt with the highest content of the preparation (15% w/w), this difference was double—the value of the instability index equals 0.185 (Figure 9). Additionally, the evolution of the light transmission profiles (“fingerprints”) shows that sedimentation phenomenon occurred in each of the samples—i.e., the migration of particles to the bottom of the tube (right side of the graph, Figure 10) leading to clarification of the upper part of the sample, and thus a higher intensity of transmitted light. It was noted that yogurt without the inulin was characterized by slightly larger differences between subsequent transmission profiles, which may indicate aggregation of particles. The sedimentation phenomenon was weakened with increasing inulin concentration, inducing the appearance of lower average particle migration rates (p < 0.05). The sedimentation velocity of particles in control yogurt was 7.46 µm/s, whereas in the sample with 6% addition of inulin it was 5.79 µm/s. The addition of inulin at a level of 15% decelerated a destabilization by approx. 76%, in comparison to yogurt without prebiotic (Figure 9 and Figure 10).
Olsen [34], using the dispersion analyser LUMiSizer, indicated that high-fat yogurts (9.4–10% fat) were subjected to the creaming phenomenon (fat droplet flotation). In low-fat yogurts (0.1–3.8% fat) sedimentation mainly occurred. The less fat in the system, the greater is the probability of consolidation of the particle network—this is visible in the chart as larger gaps between two consecutive recorded curves. The presence of fiber in the sample reduced values of its instability index and average sedimentation velocity.
Kizzie-Hayford [38] undertook research on yogurt-like products based on (milk-like) liquid from tiger nuts (Cyperus esculentus L.), TNM (i.e., ‘tiger nuts milk’), with various additives (sodium caseinate, whey protein, carboxymethyl cellulose (CMC), guar gum or xanthan gum). Using the LUMiSizer analytical centrifuge, it was found that TNM-only protein enrichment did not contribute to a decline in the intensity of the creaming process and instability index values. The accretion of the creaming layer followed with an increase in sodium caseinate concentration. The use of hydrocolloids has effectively reduced the occurrence of this phenomenon, and therefore contributed to the increase in the overall stability of the systems, due to the increase in viscosity and stabilizing properties of polysaccharides.
3.4. Cluster Analysis
A multidimensional statistical analysis (cluster analysis) was carried out to divide groups of stirred yogurts (objects) similar in terms of selected parameters: total acidity, pH, EI, MVI, firmness, stickiness, degree of syneresis, instability index and sedimentation velocity. Three groups (clusters) of products were obtained, the binding distance was: y = 8.3803 (Figure 11). Yogurt with 15% inulin content was assigned to cluster 1, which was characterized by, among others, the lowest acidity (approx. 39 °SH), highest viscosity (MVI = 7.074 10−2 nm−2), firmness (0.997 N) and the lowest values of syneresis degree (9.5%) and instability index (0.185). Cluster 2 included yogurts with 0%, 3% or 6% inulin addition, showing the highest average acidity (approx. 4.60), the lowest elasticity (approx. 1.380 10−2 nm−2), stickiness value (approx. 1.20 N), and the greatest average degree of syneresis (approx. 38%) and sedimentation velocity (approx. 6.66 µm/s). Cluster 3 yogurts with 9% or 12% inulin concentration showed average values of determined parameters between cluster 1 and cluster 2. Variability coefficients of parameters within clusters present a large variation (>20%) in cluster 3 for medium firmness (39.4%), stickiness (21.6%), and degree of syneresis (24.5%).
4. Conclusions
The incorporation of inulin in amounts of 3%, 6%, 9%, 12% or 15% w/w to the composition of natural yogurt showed statistically significant modification of its properties (acidity, rheological properties and stability indicators). It was observed that, in total, with the increase in contribution of this prebiotic, acidity decreased; firmnness, stickiness, viscosity and elasticity increased; syneresis was reduced and the sedimentation phenomenon was limited. Modern MS-DWS (Rheolaser) and CSA (LUMiSizer) methods have proven effective in determining the microrheology and physical stability of fermented dairy products with a functional additive. It has been found that stirred yogurts with a high prebiotic content (from 3% to 15%) can be obtained, and it is possible to classify them as functional foods with a health claim on the label. Aforementioned benefits are related to the fact that a high concentration of this dietary fiber in the diet can help maintain the proper functioning of the digestive system.
Author Contributions
Conceptualization, A.Ż., I.S.; methodology, I.S.; formal analysis, data curation, I.S.; writing—original draft preparation, I.S.; writing—review and editing, A.Ż., M.K.; visualization, I.S.; super funding acquisition, A.Ż. All authors have read and agreed to the published version of the manuscript.
Funding
Our research was funded by the Warsaw University of Life Sciences (WULS-SGGW).
Conflicts of Interest
The authors do not declare conflict of interest.
References
- Regulation (EC) No 1924/2006 of the European Parliament and of the Council of 20 December 2006 on Nutrition and Health Claims Made on Foods. Official Journal of the European Union L 404/9. Available online: https://eur-lex.europa.eu/legal-content/en/ALL/?uri=CELEX%3A32006R1924 (accessed on 20 May 2020).
- Żbikowska, A.; Kozłowska, M.; Półtorak, A.; Kowalska, M.; Rutkowska, J.; Kupiec, M. Effect of addition of plant extracts on the durability and sensory properties of oat flake cookies. J. Therm. Anal. Calorim. 2018, 134, 1101–1111. [Google Scholar] [CrossRef] [Green Version]
- Martirosyan, D.M.; Singh, J. A new definition of functional food by FFC: What makes a new definition unique? Funct. Foods Health Dis. 2015, 5, 209–223. [Google Scholar] [CrossRef]
- Homayouni, A.; Azizi, A.; Javadi, M.; Mahdipour, S.; Ejtahed, H. Factors influencing probiotic survival in ice cream: A review. Int. J. Dairy Sci. 2012, 7, 1–10. [Google Scholar] [CrossRef]
- Cieślik, E.; Gębusia, A. Functional Foods with Fructans Added. Food Sci. Technol. Qual. 2011, 2, 27–37. (In Polish) [Google Scholar]
- Khodear, M.M.; Zayan, A.F.; Tammam, A.A.; Mohran, M.A. Influence of Adding Inulin as a Fat Replacer on the Characteristics of Yogurt. J. Food Dairy Sci. 2018, 9, 13–17. [Google Scholar] [CrossRef]
- Żbikowska, A.; Marciniak-Łukasiak, K.; Kowalska, M.; Onacik-Gür, S. Multivariate study of inulin addition on the quality of sponge cakes. Pol. J. Food Nutr. Sci. 2017, 67, 201–210. [Google Scholar] [CrossRef]
- Scientific Opinion. Scientific Opinion on the Substantiation of a Health Claim Related to “Native Chicory Inulin” and Maintenance of Normal Defecation by Increasing Stool Frequency Pursuant to Article 13.5 of Regulation (EC) No 1924/2006. Available online: https://0-efsa-onlinelibrary-wiley-com.brum.beds.ac.uk/doi/abs/10.2903/j.efsa.2015.3951 (accessed on 20 May 2020).
- Dołhańczuk-Śródka, A.; Nabrdalik, M.; Maślak, N.; Wąsiewicz, N.; Ziembik, Z. The rheological properties of natural yogurt. In Proceedings of the ECOpole’14 Conference, Jarnoltówek, Poland, 18 October 2014; Wacławek, M., Bratychak, M., Mazur, S., Eds.; Ecological Chemistry and Engineering Society: Opole, Poland, 2015; pp. 193–200. [Google Scholar]
- Mukhekar, A.; Desale, R.J.; Bhosale, S. Effect on sensory and microbial properties of yogurt fortified with Aloe vera. J. Pharm. Innov. 2018, 7, 146–148. [Google Scholar]
- Reeta, K.S.; Ankita, J.; Ramadevi, N. Fortification of Yogurt with Health-Promoting Additives. Res. Rev. Food Dairy Technol. 2015, 3, 9–17. [Google Scholar]
- Tomovska, J.; Gjorgievski, N.; Makarijoski, B. Examination of pH, Titratable Acidity and Antioxidant Activity in Fermented Milk. J. Mater. Sci. Eng. A 2016, 6, 11–12, 326–333. [Google Scholar] [CrossRef] [Green Version]
- Hadi, H.; Hadi, E.M.; Gholamreza, M.; Amin, H.M. Scientific and Technical Aspects of Yogurt Fortification: A Review. Food Sci. Hum. Wellness 2015, 4, 1–8. [Google Scholar] [CrossRef] [Green Version]
- Szajnar, K.; Znamirowska, A.; Kalicka, D.; Kuźniar, P. Fortification of yogurts with various magnesium compounds. J. Elem. 2017, 22, 559–568. [Google Scholar] [CrossRef]
- Corrieu, G.; Beal, C. Yogurt: The Product and its Manufacture. In The Encyclopedia of Food and Health; Caballero, B., Finglas, P., Toldrá, F., Eds.; Oxford Academic Press: Oxford, UK, 2016; Volume 5, pp. 617–624. [Google Scholar]
- Wichrowska, D.; Wojdyła, T. Sensory and physicochemical evaluation of selected natural and ecological yogurts. Chem. Eng. Equip. 2014, 53, 421–423. (In Polish) [Google Scholar]
- Tisserand, C.; Brunel, R. Micro-Rheology using Multi-Speckle DWS with video camera Application to rheological properties. In Proceedings of the 19th French Congress of Mechanics, Marseille, France, 24 August 2009. [Google Scholar]
- Tisserand, C.; Kotzev, A.; Fleury, M.; Brunel, R.; Bru, P.; Meunier, G. Non-contact measurement of viscoelastic properties of biopolymers. NSTI-Nanotechnol. 2011, 1, 36–40. [Google Scholar]
- Glibowski, P.; Sołowiej, B.; Nastaj, M.; Rajca, M. Rheological and texture properties of fermented beverage mimetics based on inulin and whey. In Technological Shaping of Food Quality; Wójciak, K.M., Dolatowski, Z.J., Eds.; PTTŻ Scientific Publisher: Kraków, Poland, 2015; pp. 59–68. (In Polish) [Google Scholar]
- Polish Standard. PN-A-86061:2002 Milk and Milk Products. Fermented Milk (In Polish). Available online: http://normy.ekoinfonet.pl/komitety.php?komitet=KT%2035,%20Mleka%20i%20Przetwor%EF%BF%BDw%20Mlecznych&kat=Mleko%20i%20przetwory%20mleczne (accessed on 20 May 2020).
- Cais-Sokolińska, D.; Danków, R.; Pikul, J. The dynamics of changes in the acidity of yogurt with the addition of cereal products during refrigerated storage. Sci. Nat. Technol. 2009, 3, 1–7. (In Polish) [Google Scholar]
- Najgebauer-Lejko, D.; Grega, T.; Tabaszewska, M. Yogurts with addition of selected vegetables: Acidity, antioxidant properties and sensory quality. Acta Sci. Pol. Technol. Aliment. 2014, 13, 35–42. [Google Scholar] [CrossRef] [Green Version]
- Jankowska, A.; Reps, A. Factors affecting the shelf-life of yogurt during storage. Pol. Dairy J. 2013, 11, 2–5. (In Polish) [Google Scholar]
- Yang, N.; Lv, R.; Jia, J.; Nishinari, K.; Fang, Y. Application of Microrheology in Food Science. Annu. Rev. Food Sci. Technol. 2017, 8, 493–521. [Google Scholar] [CrossRef]
- Arango, O.; Trujillo, A.J.; Castillo, M. Influence of fat replacement by inulin on rheological properties, kinetics of rennet milk coagulation, and syneresis of milk gels. J. Dairy Sci. 2013, 96, 1984–1996. [Google Scholar] [CrossRef] [Green Version]
- Glibowski, P.; Pikus, S. Amorphous and crystal inulin behavior in a water environment. Carbohydr. Polym. 2011, 83, 635–639. [Google Scholar] [CrossRef]
- Rohart, A.; Michon, C.; Confiac, J.; Bosc, V. Evaluation of ready-to-use SMLS and DWS devices to study acid-induced milk gel changes and syneresis. Dairy Sci. Technol. 2016, 96, 459–475. [Google Scholar] [CrossRef] [Green Version]
- Surber, G.; Mende, S.; Jaros, D.; Rohm, H. Clustering of Streptococcus thermophilus Strains to Establish a Relation between Exopolysaccharide Characteristics and Gel Properties of Acidified Milk. Foods 2019, 8, 146. [Google Scholar] [CrossRef] [PubMed] [Green Version]
- Dabija, A.; Codină, G.G.; Gâtlan, A.M.; Rusu, L. Quality assessment of yogurt enriched with different types of fibers. CYTA-J. Food 2018, 16, 859–867. [Google Scholar] [CrossRef] [Green Version]
- Codină, G.G.; Franciuc, S.G.; Mironeasa, S. Rheological characteristics and microstructure of milk yogurt as influenced by quinoa flour addition. J. Food Qual. 2016, 39, 559–566. [Google Scholar] [CrossRef]
- De Souza, O.; Ricardo, P.; Perego, P.; De Oliveira, M.N.; Converti, A. Effect of inulin as prebiotic and synbiotic interactions between probiotics to improve fermented milk firmness. J. Food Eng. 2011, 107, 36–40. [Google Scholar] [CrossRef]
- Raju, P.N.; Pal, D. Effect of dietary fibers on physico-chemical, sensory and textural properties of Misti Dahi. J. Food Sci. Technol. 2014, 51, 3124–3133. [Google Scholar] [CrossRef] [Green Version]
- McClements, D.J. Emulsion stability. In Food Emulsions: Principles, Practices, and Techniques, 3rd ed.; CRC Press: Boca Raton, FL, USA, 2015; pp. 289–373. [Google Scholar]
- Olsen, B. Yogurt Quality with Fiber Addition. In Proceedings of the Cultured Dairy Products Conference, London, UK, 22 May 2007; International Dairy Products Association, Tate & Lyle: London, UK, 2008. [Google Scholar]
- Szymańska, I.; Żbikowska, A.; Marciniak-Łukasiak, K. Effect of addition of a marine algae (Chlorella protothecoides) protein preparation on stability of model emulsion systems. J. Dispers. Sci. Technol. 2020, 41, 699–707. [Google Scholar] [CrossRef]
- Guénard-Lampron, V.; St-Gelais, D.; Villeneuve, S.; Turgeon, S.L. Individual and sequential effects of stirring, smoothing, and cooling on the rheological properties of nonfat yogurts stirred with a technical scale unit. J. Dairy Sci. 2019, 102, 190–201. [Google Scholar] [CrossRef] [Green Version]
- Rashid, A.A.; Huma, N.; Saeed, S.; Shahzad, K.; Ahmad, I.; Ahmad, I.; Nawaz, S.; Imran, M. Characterization and Development of Yogurt from Concentrated Whey. Int. J. Food Eng. 2019, 3, 1–7. [Google Scholar] [CrossRef] [Green Version]
- Kizzie-Hayford, N. Development of Strategies for the Successful Production of Yogurt-Like Products from Tiger Nut (Cyperus esculentus L.) Milk. Ph.D. Thesis, Technische Universität Dresden, Winneba, Ghana, 2 March 2017. [Google Scholar]
Figure 1.
Total acidity (°SH) of yogurts with 0%, 3%, 6%, 9%, 12% or 15% w/w inulin addition (a, b, c…—various letters for average values mean statistically significant differences, p < 0.05).
Figure 1.
Total acidity (°SH) of yogurts with 0%, 3%, 6%, 9%, 12% or 15% w/w inulin addition (a, b, c…—various letters for average values mean statistically significant differences, p < 0.05).

Figure 2.
Mean square displacement (MSD) curves of yogurts with 0%, 3%, 6%, 9%, 12% or 15% w/w inulin addition during 24 h stabilization at 20 °C (first curve—at the top of profile, last curve—at the bottom of profile).
Figure 2.
Mean square displacement (MSD) curves of yogurts with 0%, 3%, 6%, 9%, 12% or 15% w/w inulin addition during 24 h stabilization at 20 °C (first curve—at the top of profile, last curve—at the bottom of profile).

Figure 3.
Elasticity indexes (EI) of yogurts with 0%, 3%, 6%, 9%, 12% or 15% w/w inulin addition during 24 h stabilization at 20 °C.
Figure 3.
Elasticity indexes (EI) of yogurts with 0%, 3%, 6%, 9%, 12% or 15% w/w inulin addition during 24 h stabilization at 20 °C.

Figure 4.
Elasticity indexes (EIs) and macroscopic viscosity indexes (MVIs) of yogurts with 0%, 3%, 6%, 9%, 12% or 15% w/w inulin addition (a, b, c…—various letters for average values mean statistically significant differences, p < 0.05).
Figure 4.
Elasticity indexes (EIs) and macroscopic viscosity indexes (MVIs) of yogurts with 0%, 3%, 6%, 9%, 12% or 15% w/w inulin addition (a, b, c…—various letters for average values mean statistically significant differences, p < 0.05).

Figure 5.
Solid-liquid balance (SLB) of yogurts with 0%, 3%, 6%, 9%, 12% or 15% w/w inulin addition (a, b, c…—various letters for average values mean statistically significant differences, p < 0.05).
Figure 5.
Solid-liquid balance (SLB) of yogurts with 0%, 3%, 6%, 9%, 12% or 15% w/w inulin addition (a, b, c…—various letters for average values mean statistically significant differences, p < 0.05).

Figure 6.
Viscosity curves of yogurts with 0%, 3%, 6%, 9%, 12% or 15% w/w inulin addition.

Figure 7.
Firmness (maximum force) and stickiness (minimum force) of yogurts with 0%, 3%, 6%, 9%, 12% or 15% w/w inulin addition (a, b, c…—various letters for average values mean statistically significant differences, p < 0.05).
Figure 7.
Firmness (maximum force) and stickiness (minimum force) of yogurts with 0%, 3%, 6%, 9%, 12% or 15% w/w inulin addition (a, b, c…—various letters for average values mean statistically significant differences, p < 0.05).

Figure 8.
Degree of syneresis of yogurts with 0%, 3%, 6%, 9%, 12% or 15% w/w inulin addition measured using centrifugal method (a, b, c…—various letters for average values mean statistically significant differences, p < 0.05).
Figure 8.
Degree of syneresis of yogurts with 0%, 3%, 6%, 9%, 12% or 15% w/w inulin addition measured using centrifugal method (a, b, c…—various letters for average values mean statistically significant differences, p < 0.05).

Figure 9.
Instability indexes and sedimentation velocity of particles values (position in 120–130 mm) of yogurts with 0%, 3%, 6%, 9%, 12% or 15% w/w inulin addition measured using CSA method—LUMiSizer test (a, b, c…—various letters for average values mean statistically significant differences, p < 0.05).

Figure 10.
Transmission profiles (“fingerprints”) on the example of yogurts containing 0% or 15% w/w inulin addition—the LUMiSizer test.
Figure 10.
Transmission profiles (“fingerprints”) on the example of yogurts containing 0% or 15% w/w inulin addition—the LUMiSizer test.

Figure 11.
Tree diagram as a result of cluster analysis using the Ward method.


Table 1.
Average lactic acid content and pH values of yogurts with 0%, 3%, 6%, 9%, 12% or 15% w/w inulin addition.
Table 1.
Average lactic acid content and pH values of yogurts with 0%, 3%, 6%, 9%, 12% or 15% w/w inulin addition.
| Amount of Inulin Addition (%, w/w) | Lactic Acid Content (g/100 g) | pH (-) |
|---|---|---|
| 0 | 1.06 ± 0.02 a | 4.19 ± 0.01 a |
| 3 | 1.05 ± 0.02 a | 4.21 ± 0.01 a |
| 6 | 1.00 ± 0.02 b | 4.24 ± 0.01 b |
| 9 | 0.98 ± 0.02 b,c | 4.26 ± 0.01b |
| 12 | 0.94 ± 0.02 c | 4.29 ± 0.01 c |
| 15 | 0.88 ± 0.02 d | 4.34 ± 0.01 d |
a, b, c…—various letters for average values mean statistically significant differences (p < 0.05).
© 2020 by the authors. Licensee MDPI, Basel, Switzerland. This article is an open access article distributed under the terms and conditions of the Creative Commons Attribution (CC BY) license (http://creativecommons.org/licenses/by/4.0/).
Share and Cite
MDPI and ACS Style
Żbikowska, A.; Szymańska, I.; Kowalska, M. Impact of Inulin Addition on Properties of Natural Yogurt. Appl. Sci. 2020, 10, 4317. https://0-doi-org.brum.beds.ac.uk/10.3390/app10124317
AMA Style
Żbikowska A, Szymańska I, Kowalska M. Impact of Inulin Addition on Properties of Natural Yogurt. Applied Sciences. 2020; 10(12):4317. https://0-doi-org.brum.beds.ac.uk/10.3390/app10124317
Chicago/Turabian StyleŻbikowska, Anna, Iwona Szymańska, and Małgorzata Kowalska. 2020. "Impact of Inulin Addition on Properties of Natural Yogurt" Applied Sciences 10, no. 12: 4317. https://0-doi-org.brum.beds.ac.uk/10.3390/app10124317
Note that from the first issue of 2016, this journal uses article numbers instead of page numbers. See further details here.