Article

Chemical Composition and Light Absorption of PM2.5 Observed at Two Sites near a Busy Road during Summer and Winter

1
Department of Environment and Energy Engineering, Chonnam National University, 77 Yongbong-ro, Gwangju 61186, Korea
2
Department of Environmental Engineering, Mokpo National University, 1666 Yeongsan-ro, Cheonggye-myeon, Muan-gum, Jeollanamdo 58554, Korea
*
Author to whom correspondence should be addressed.
Submission received: 26 June 2020 / Revised: 13 July 2020 / Accepted: 14 July 2020 / Published: 15 July 2020
(This article belongs to the Special Issue Air Pollution II)

Abstract

:
To examine the difference in the major chemical composition of fine particulate matter (PM2.5) between two roadway sites, 24 h integrated PM2.5 samples were simultaneously collected both 15 m (Buk-Ku District Office (BKO) site) and 150 m (Chonnam National University campus (CNU) site) away from busy roads during the summer and winter periods; these samples were taken to determine the concentrations of organic and elemental carbon (OC and EC), water-soluble organic carbon (WSOC), and water-soluble inorganic species. In addition, the real-time aerosol light absorption coefficients (Abs) were measured using a dual-spot seven-wavelength aethalometer at the CNU site to evaluate the influence of traffic and biomass burning (BB) emissions on the concentrations of organic aerosol particles. The hourly NO2 concentration was also observed at an air pollution monitoring network that is about 2 km away from the CNU site. During summer, 24 h PM2.5 concentrations (PM2.5 episode) which exceeded the Korean PM2.5 standard (35 μg/m3) were linked to increases in organic matter (OM) and SO42− concentrations that accounted for on average 35–41% and 26–30%, respectively, of the PM2.5 at the two sites. The increased SO42− concentration was most likely attributable to the inflow of long-range transported aerosols, rather than local production, as demonstrated by both the MODIS (Moderate Resolution Imaging Spectroradiometer) images and transport pathways of air masses reaching the sites. On the other hand, the OM, WSOC, and EC concentrations were directly attributable to traffic emissions at the sampling sites, as supported by the tight correlation between the OC and EC. A small difference between the absorption Ångström exponent (AAE) values calculated at wavelengths of 370–950 nm (AAE370–950nm) and 370–520 nm (AAE370–520nm), and the poor correlation of absorption coefficient by brown carbon (BrC) at 370 nm (AbsBrC370nm) with K+ (R2 = 0.00) also suggest a significant contribution of traffic emissions to OM. However, the wintertime PM2.5 episode was strongly related to the enhanced OM and NO3 concentrations, which contributed 26–28% and 22–23% of the PM2.5 concentration, respectively. It is interesting to note that there were two distinct OC/EC ratios in winter: a lower OC/EC (~3.0), which indicates a significant contribution of traffic emissions to the OC and EC, and a higher OC/EC (~6.5), which suggests an additional influence of BB emissions as well as traffic emissions at the sites. Strong correlations between the OC and EC (R2 = 0.72–0.83) and the enhanced AAE370–520nm values compared to the AAE370–950nm support that BB emissions were also an important contributor to the wintertime OM concentrations as well as traffic emissions at the two sites. A good correlation between the gaseous NO2 and NO3 and meteorological conditions (e.g., low wind speed and high relative humidity) suggest that the heterogeneous oxidation of NO2 on moist particles could be an important contributor to wintertime particulate NO3 formation at the sites. The OC concentrations during summer and winter were higher at the BKO site, with a higher traffic flow and a shorter distance from the roadway than at the CNU site. However, there were slight differences in the concentrations of secondary inorganic species (NO3, SO42−, and NH4+) between the sites during summer and winter.

1. Introduction

Carbonaceous aerosols, which are a major component of fine particulate matter (PM2.5) in urban atmospheres, influence air quality and visibility impairment and also affect adverse human health [1,2,3,4,5,6]. Carbonaceous components are typically classified into organic and elemental carbon (OC and EC). OC is produced from not only primary emission sources (primary OC), but also from the atmospheric transformation processes of volatile organic species in the air (secondary OC). Organic aerosols (OAs) generally scatter incoming solar radiation, but a certain type of OA, brown carbon (BrC), absorbs radiation in near-ultraviolet (UV) wavelengths [7]. BrC aerosols exhibit a strong spectral dependence, with increasing absorption in the near UV range and weak absorption at infrared wavelengths. On the other hand, EC is directly emitted in the particle phase from incomplete combustion of fossil and biomass fuels [4,6,8]. EC strongly absorbs solar radiation, with weak spectral dependence [7]. Due to the importance of OC and EC in the atmosphere, information about the carbonaceous components of PM2.5, such as concentrations, emission sources, absorption properties, etc., is essential to examining the causes of pollution, identifying their sources, estimating their source contributions, and better understanding the factors related to global climate change [6,9,10,11,12,13].
Another important species that significantly contributes to PM2.5 is water-soluble inorganic components, such as NO3, SO42−, and NH4+. Secondary NO3 and SO42− are formed through gas-phase oxidation and the heterogeneous reactions of gaseous NO2 and SO2 [14]. In urban environments, where vehicle emissions are important, haze pollution that leads to increases in the PM2.5 concentration is directly linked to increases in the concentration of secondary inorganic components as well as carbonaceous particles [15,16,17,18,19,20,21,22,23,24,25,26]. Moreover, meteorological conditions, such as low wind speed, high relative humidity (RH), high surface pressure, and shallow boundary layers, play an important role in increasing PM2.5 pollution [26,27,28,29,30,31,32,33,34]. The characteristics of PM2.5 pollution vary with the season, location, and weather conditions [2,12,15,24,26,27,33,34]. For example, during summer, when the formation of oxidants such as OH⋅, O3, and H2O2 is strongly activated, the secondary formation of particulate SO42 accelerates, resulting in high PM2.5 pollution [15,26,35]. Secondary OAs (SOAs) also contribute to high PM2.5 formation in the summertime [2,15]. On the other hand, during winter, when meteorological conditions such as air stagnation and high RH often occur, both the accumulation of primary particle pollutants (e.g., carbonaceous particles) and enhanced formation of secondary ionic species through the heterogeneous oxidation of SO2, NO2, and NH3 play important roles in the formation of haze pollution [21,25,26,27,28,32,36,37,38,39]. Therefore, since the major chemical composition of PM2.5, and thus PM pollution, change greatly with the season and location, the seasonal causes of high PM2.5 episodes need to be explored.
Traffic emissions from the roadside are a significant part of urban pollution and are an important contributor of volatile organic compounds, nitrogen oxides, and carbonaceous particles in urban environments, contributing significantly to increases in the PM2.5 concentration. Carbonaceous particles are especially crucial causes of PM2.5 concentration increases in the vicinity of a roadway; measuring them is vital to estimating the contribution of traffic emission sources to PM2.5 [10,11,12,13,40]. Previous studies have indicated that the relative concentrations of CO, black carbon, and particle number decrease exponentially as the distance from a freeway increases and track well with traffic density, but vary with the fraction of vehicle types (gasoline vs. diesel engine) and diesel engine displacement [41,42]. In addition, a study conducted at a busy roadway found no statistically significant differences in the horizontal profile of particle number concentration at distances of up to 200 m downwind from the road [43]. On the contrary, when the winds blew directly from the road, the concentrations of fine and ultrafine particles decreased to about half of their maximum at a distance of 100–150 m from the road [44]. However, those studies focused on the number concentrations of ultrafine and fine particles, not the PM concentration and the carbonaceous and secondary inorganic species that contribute to it. Additionally, studies examining the influence of distance downwind from heavily trafficked roads on the concentrations of carbonaceous particles and secondary inorganic species in PM2.5 in the vicinity of roadways are very limited [42,45]. This study aims to investigate the differences in the carbonaceous and secondary ionic component concentrations at two sites near busy roads during the summer and winter in order to examine the emission sources of carbonaceous aerosols and to examine the factors driving high PM2.5 pollution.

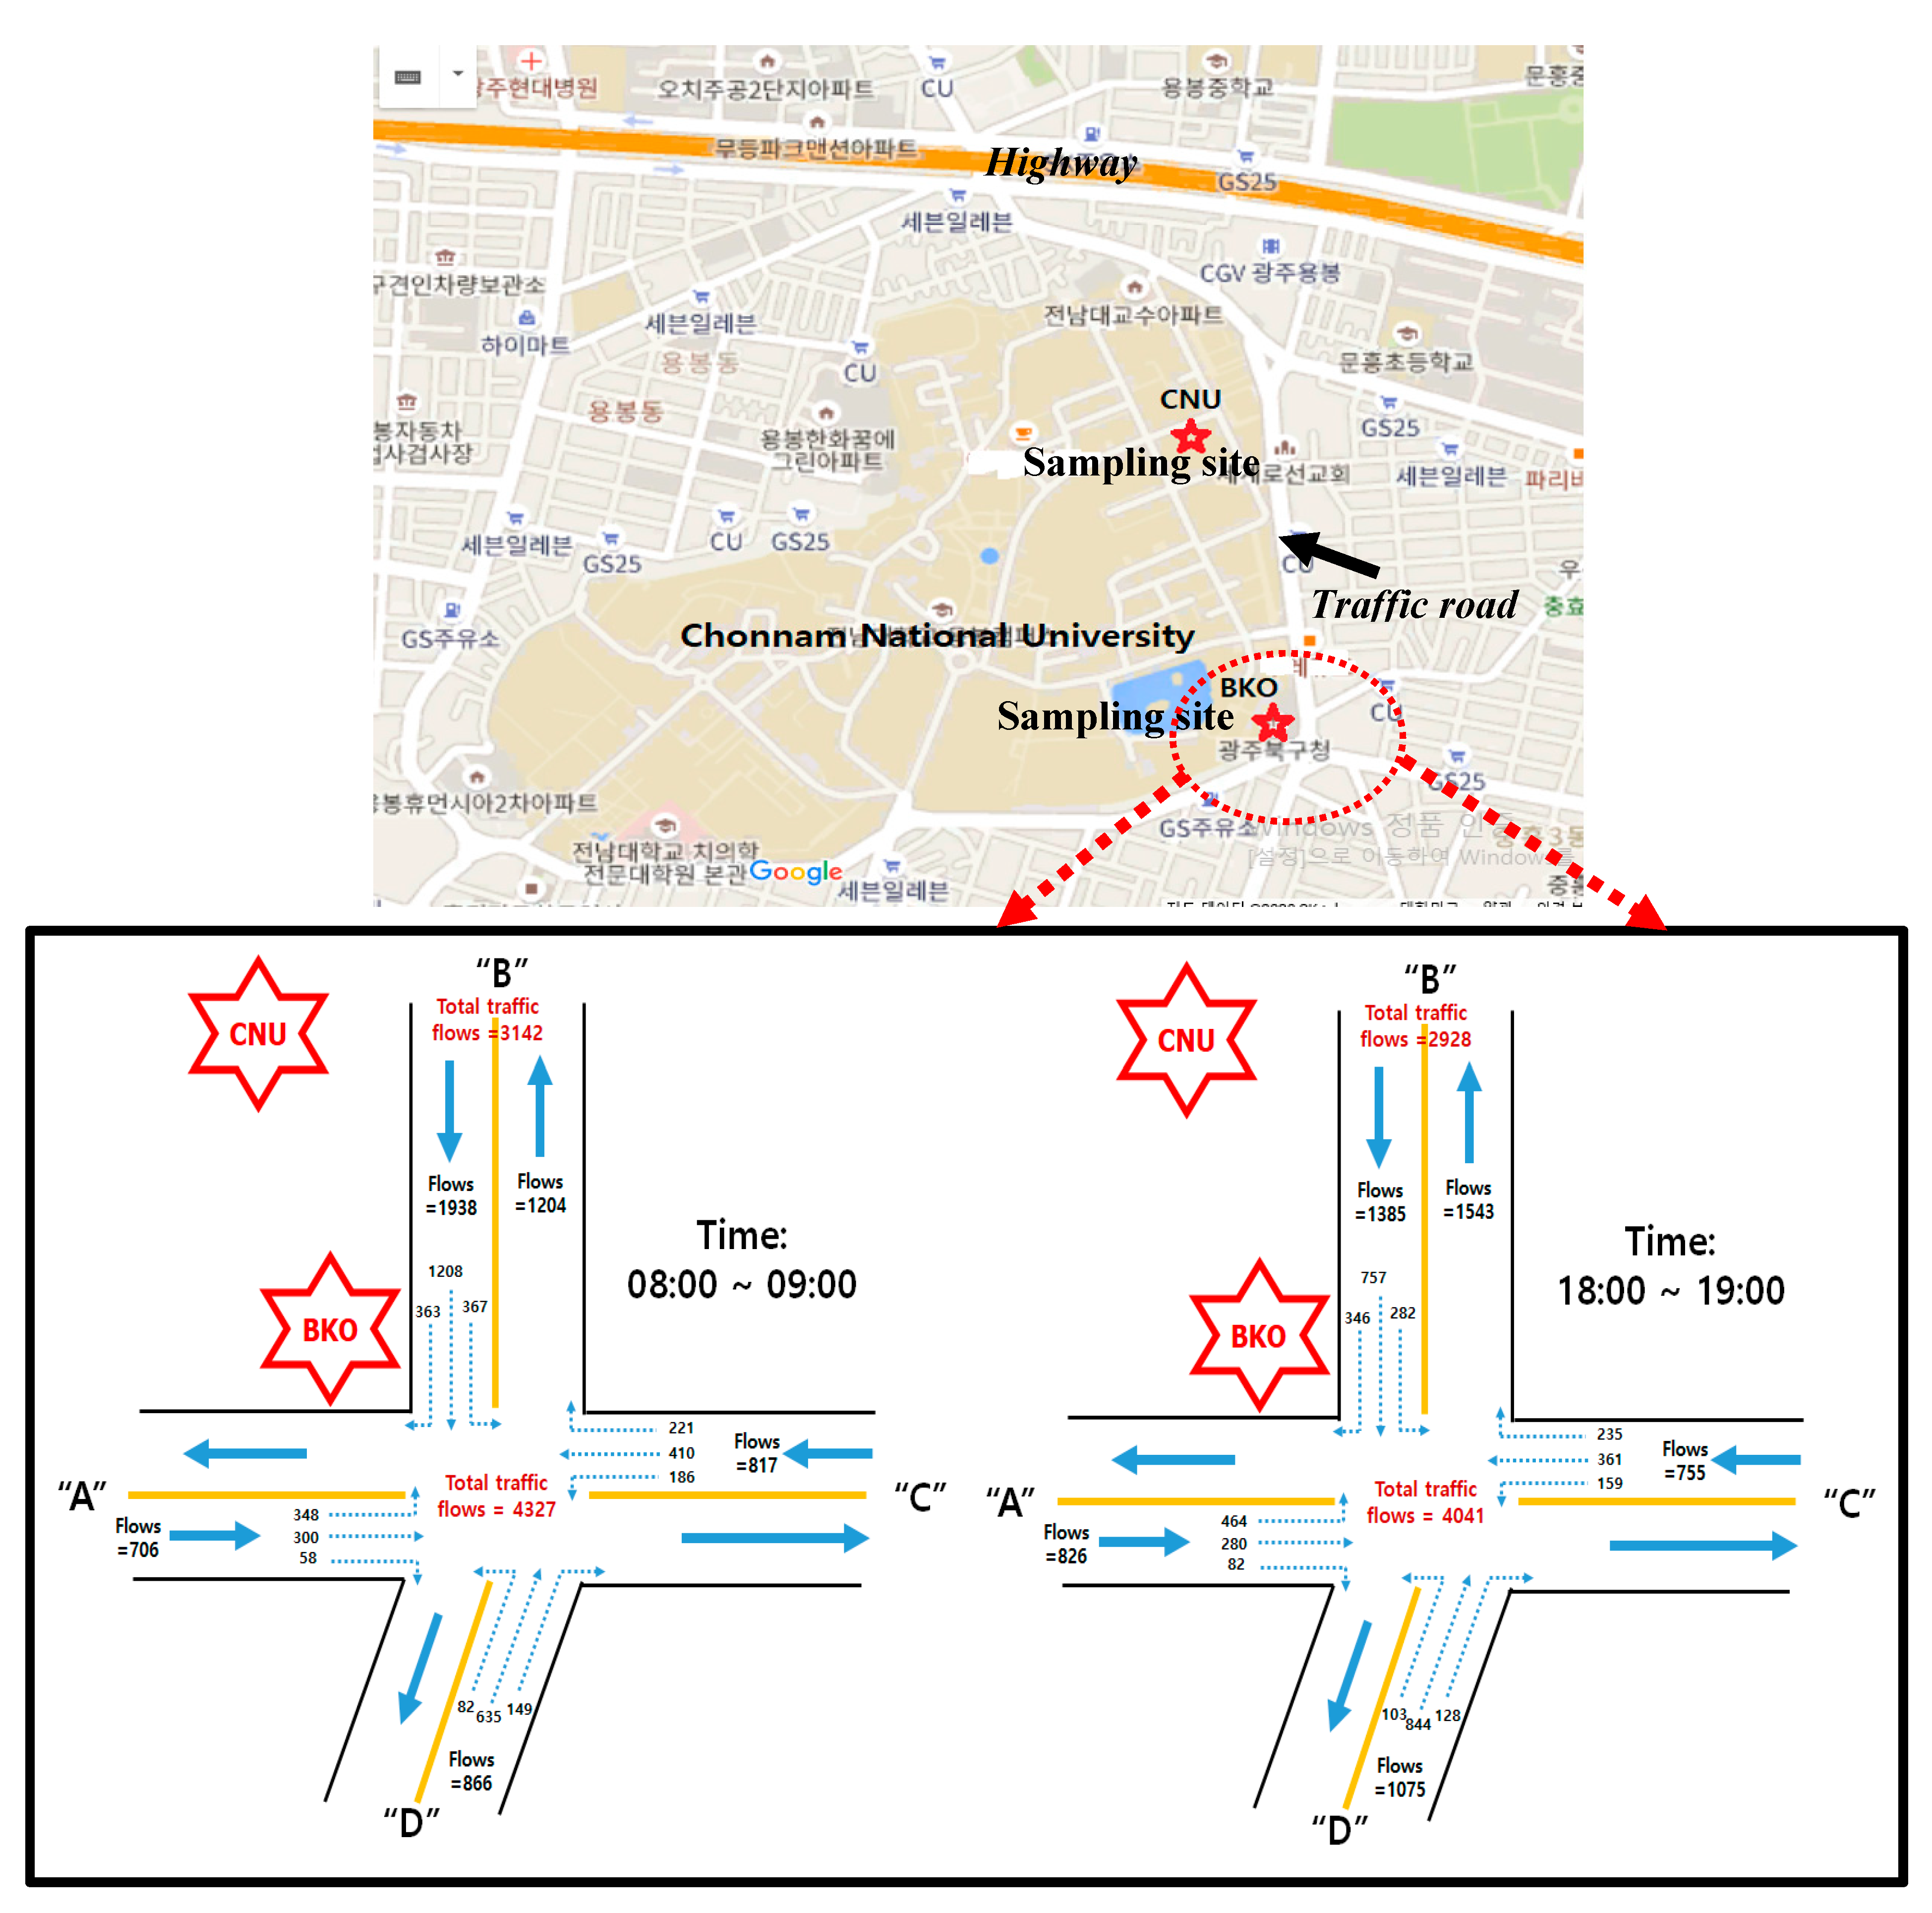
2. Experimental Methods

2.1. Measurement of 24 h Integrated PM2.5 and Aerosol Light Absorptions

The 24 h integrated PM2.5 samples were simultaneously collected at two urban sites in Gwangju, Korea (Figure 1), both of which are close to busy roads, during intensive observation periods in the summer and winter. Gwangju is situated in the southern part of Korea and has a population of approximately 1.5 million people and an area of 501.4 km2. It is reported that motor vehicle sources account for about 80% of the total air pollution emissions in the city, and both the local and continental air pollution could influence the Gwangju metropolitan area, depending on the airflow patterns [10,11,12,13]. One site is located on the rooftop of a three-story building in the Buk-Ku District Office (BKO site, 35.17N, 126.91E, 54.3 m above mean sea level) and is approximately 15 m away from the nearest roads. Surrounding the BKO sampling site, there are four main roads with a high concentration of cars, trucks, and buses, especially during rush hour. The other site is on the rooftop of a three-story engineering building on Chonnam National University campus (CNU site, 35.18N, 126.91E, 54.3 m above mean sea level); this site is approximately 150 m away from a busy road and 0.7 km south of a highway. The distance between the two sampling sites is about 500 m. The Gwangju regional meteorological agency and an air pollution monitoring station are located at approximately 2.0 km west and east of the BKO site, respectively (see Figure 1). The hourly CO and NO2 concentrations used in this study were observed at the height of approximately 10 m at the air monitoring station. The measurement periods covered 10 August~13 September 2015 (summer) and 7 December 2015~17 January 2016 (winter). The aerosol measurements started at 9:00 AM and lasted approximately 24 h.
Figure 1 (lower part) shows the total traffic density around the BKO site at 08:00–09:00 and 18:00–19:00. The hourly traffic volume was investigated in October 2015 by Gwangju Metropolitan City [46]. The daily total traffic volume at the BKO site (# vehicles/day) was about 62,600. The hourly total traffic flow (# of vehicles/h) at the BKO site was 4327 at 08:00 and 4041 at 18:00. The CNU site had about 73% of the total traffic volume seen at the BKO site at the same times. Figure 2a illustrates the diurnal patterns of the total traffic density at the CNU and BKO sites. Additionally, the hourly traffic densities of passenger cars (gasoline vs. diesel) and diesel-powered vehicles at BKO are shown in Figure 2b,c. Light-duty gasoline and diesel-powered vehicles (<seven passengers) contributed 43% and 23% of the total traffic flow, respectively. Medium-duty diesel vehicles (with 8–15 passengers) and heavy-duty diesel buses accounted for 3.8% and 4.3% of the total flow. Diesel trucks, including light-duty (<2.5 tons), medium-duty (2.5–8.5 tons), and heavy-duty (>8.5 tons) trucks, accounted for 9.2% of the total vehicles. Altogether, the diesel-powered vehicles comprised approximately 40% of the total traffic flow.
Aerosol samples were collected on a pre-baked (500 °C for 24 h) quartz-fiber filter (47 mm, Pall flex Tissue quartz 2500QAT-UP) using a low-volume PM2.5 cyclone inlet sampler (URG-2000-30EH, URG Corporation) operated at 16.7 L/min. A carbon-impregnated diffusion denuder (Sunset Lab, OR) was placed downstream of the cyclone inlet system to minimize positive artifacts by the adsorption of semi-volatile organics onto the quartz-fiber filter during sampling. The collected filter samples were used to determine the amounts of organic and elemental carbon (OC and EC), water-soluble OC (WSOC), and eight water-soluble inorganic constituents. Field blank filters were also collected at each site to correct for background contamination.
Real-time aerosol light absorption coefficients were observed only at the CNU site every 1 min using a dual-spot seven-wavelength (370, 470, 520, 590, 660, 880, and 950 nm) aethalometer (AE33, Aerosol d.o.o., Slovenia) equipped with a PM2.5 inlet impactor operated at a flow rate of 5 L/min. The wavelength-dependent mass absorption cross-sections used to calculate the BC concentration were 18.47, 14.54, 13.14, 11.58, 10.35, 7.77, and 7.19 m2 g−1 for 370, 470, 520, 590, 660, 880, and 950 nm, respectively. Detailed descriptions of the aerosol light absorption measurement methods were published previously [40,47]. In this study, the wavelength-dependent BrC absorption (AbsBrC,λ) was calculated by subtracting the BC absorption (AbsBC,λ) from the total aerosol absorption (Absabs,λ) [48]. Additionally, the wavelength-dependent BC absorption at wavelengths of <880 nm was estimated by assuming that most of the total aerosol absorption at 880 and 950 nm is associated with BC [48,49]. Figure 3 shows the diurnal cycles of aerosol absorption coefficients at 370 and 880 nm during summer and winter at the CNU site. The aerosol absorption coefficients at 370 and 880 nm during both summer and winter exhibited clear diurnal patterns; there were two peaks, corresponding to the morning and evening rush hours, of which the morning peak was stronger, which is fairly consistent with the trends in hourly traffic volume. The higher absorption coefficient at 370 nm was due to an increased contribution of light absorbing organic aerosols at lower wavelengths.

2.2. Determination of Carbonaceous and Water-Soluble Inorganic Species Concentrations

The quartz-fiber filters were weighed by a microbalance with a 1 µg sensitivity (Sartorius CP2P-F) before and after the sample collection to determine the mass of collected PM2.5. Before weighing, the filters were conditioned for 24 h in a desiccator maintained at a relative humidity of 40% and a temperature of 20 °C. All the filters were stored at −18 °C prior to sampling and until analysis.
A 1.5 or 3.0 cm2 section of the quartz-fiber filter was used to analyze the OC and EC using the NIOSH 5040 thermal-optical transmittance standard protocol [50]. Details of the carbon speciation have been well documented in previous publications [12,51]. The OC and EC measurements had precisions of 4.0% and 7.3%, respectively. The remaining quartz filter was extracted by sonication in 30 mL of ultrapure distilled de-ionized water for 60 min to analyze the WSOC concentration using a total organic carbon analyzer (TOC, Sievers 5310C, USA). A 0.45µm syringe membrane filter was used to filter the extracts in order to remove insoluble particles before analyzing the WSOC. The extracts that remained after the WSOC analysis were used to analyze the amounts of eight ionic species—chloride (Cl), nitrate (NO3), sulfate (SO42−), sodium (Na+), potassium (K+), calcium (Ca2+), magnesium (Mg2+), and ammonium (NH4+)—by ion chromatography (IC). In this study, an IC Metrohm model 861 system with a suppressor was used to detect anions with a Metrohm Metrosep A Supp-5, 4 × 150 mm column; the same system was used without the suppressor to analyze cations with a Metrohm Metrosep C4, 4 × 150 mm column. Solutions of 3.2 mM sodium carbonate in 1.0 mM sodium bicarbonate and 1.7 mM nitric acid in 0.7 mM dipicolinic acid were used to elute the samples for anion IC and cation IC, respectively. The eluent flow rates were constantly at 0.7 mL/min for the anions and 1.0 mL/min for the cations. Details concerning the measurement of WSOC and ionic species can be found in our previous publications [12,51,52]. Triplicate analyses for the WSOC measurements showed a precision of <5%.

3. Results and Discussion

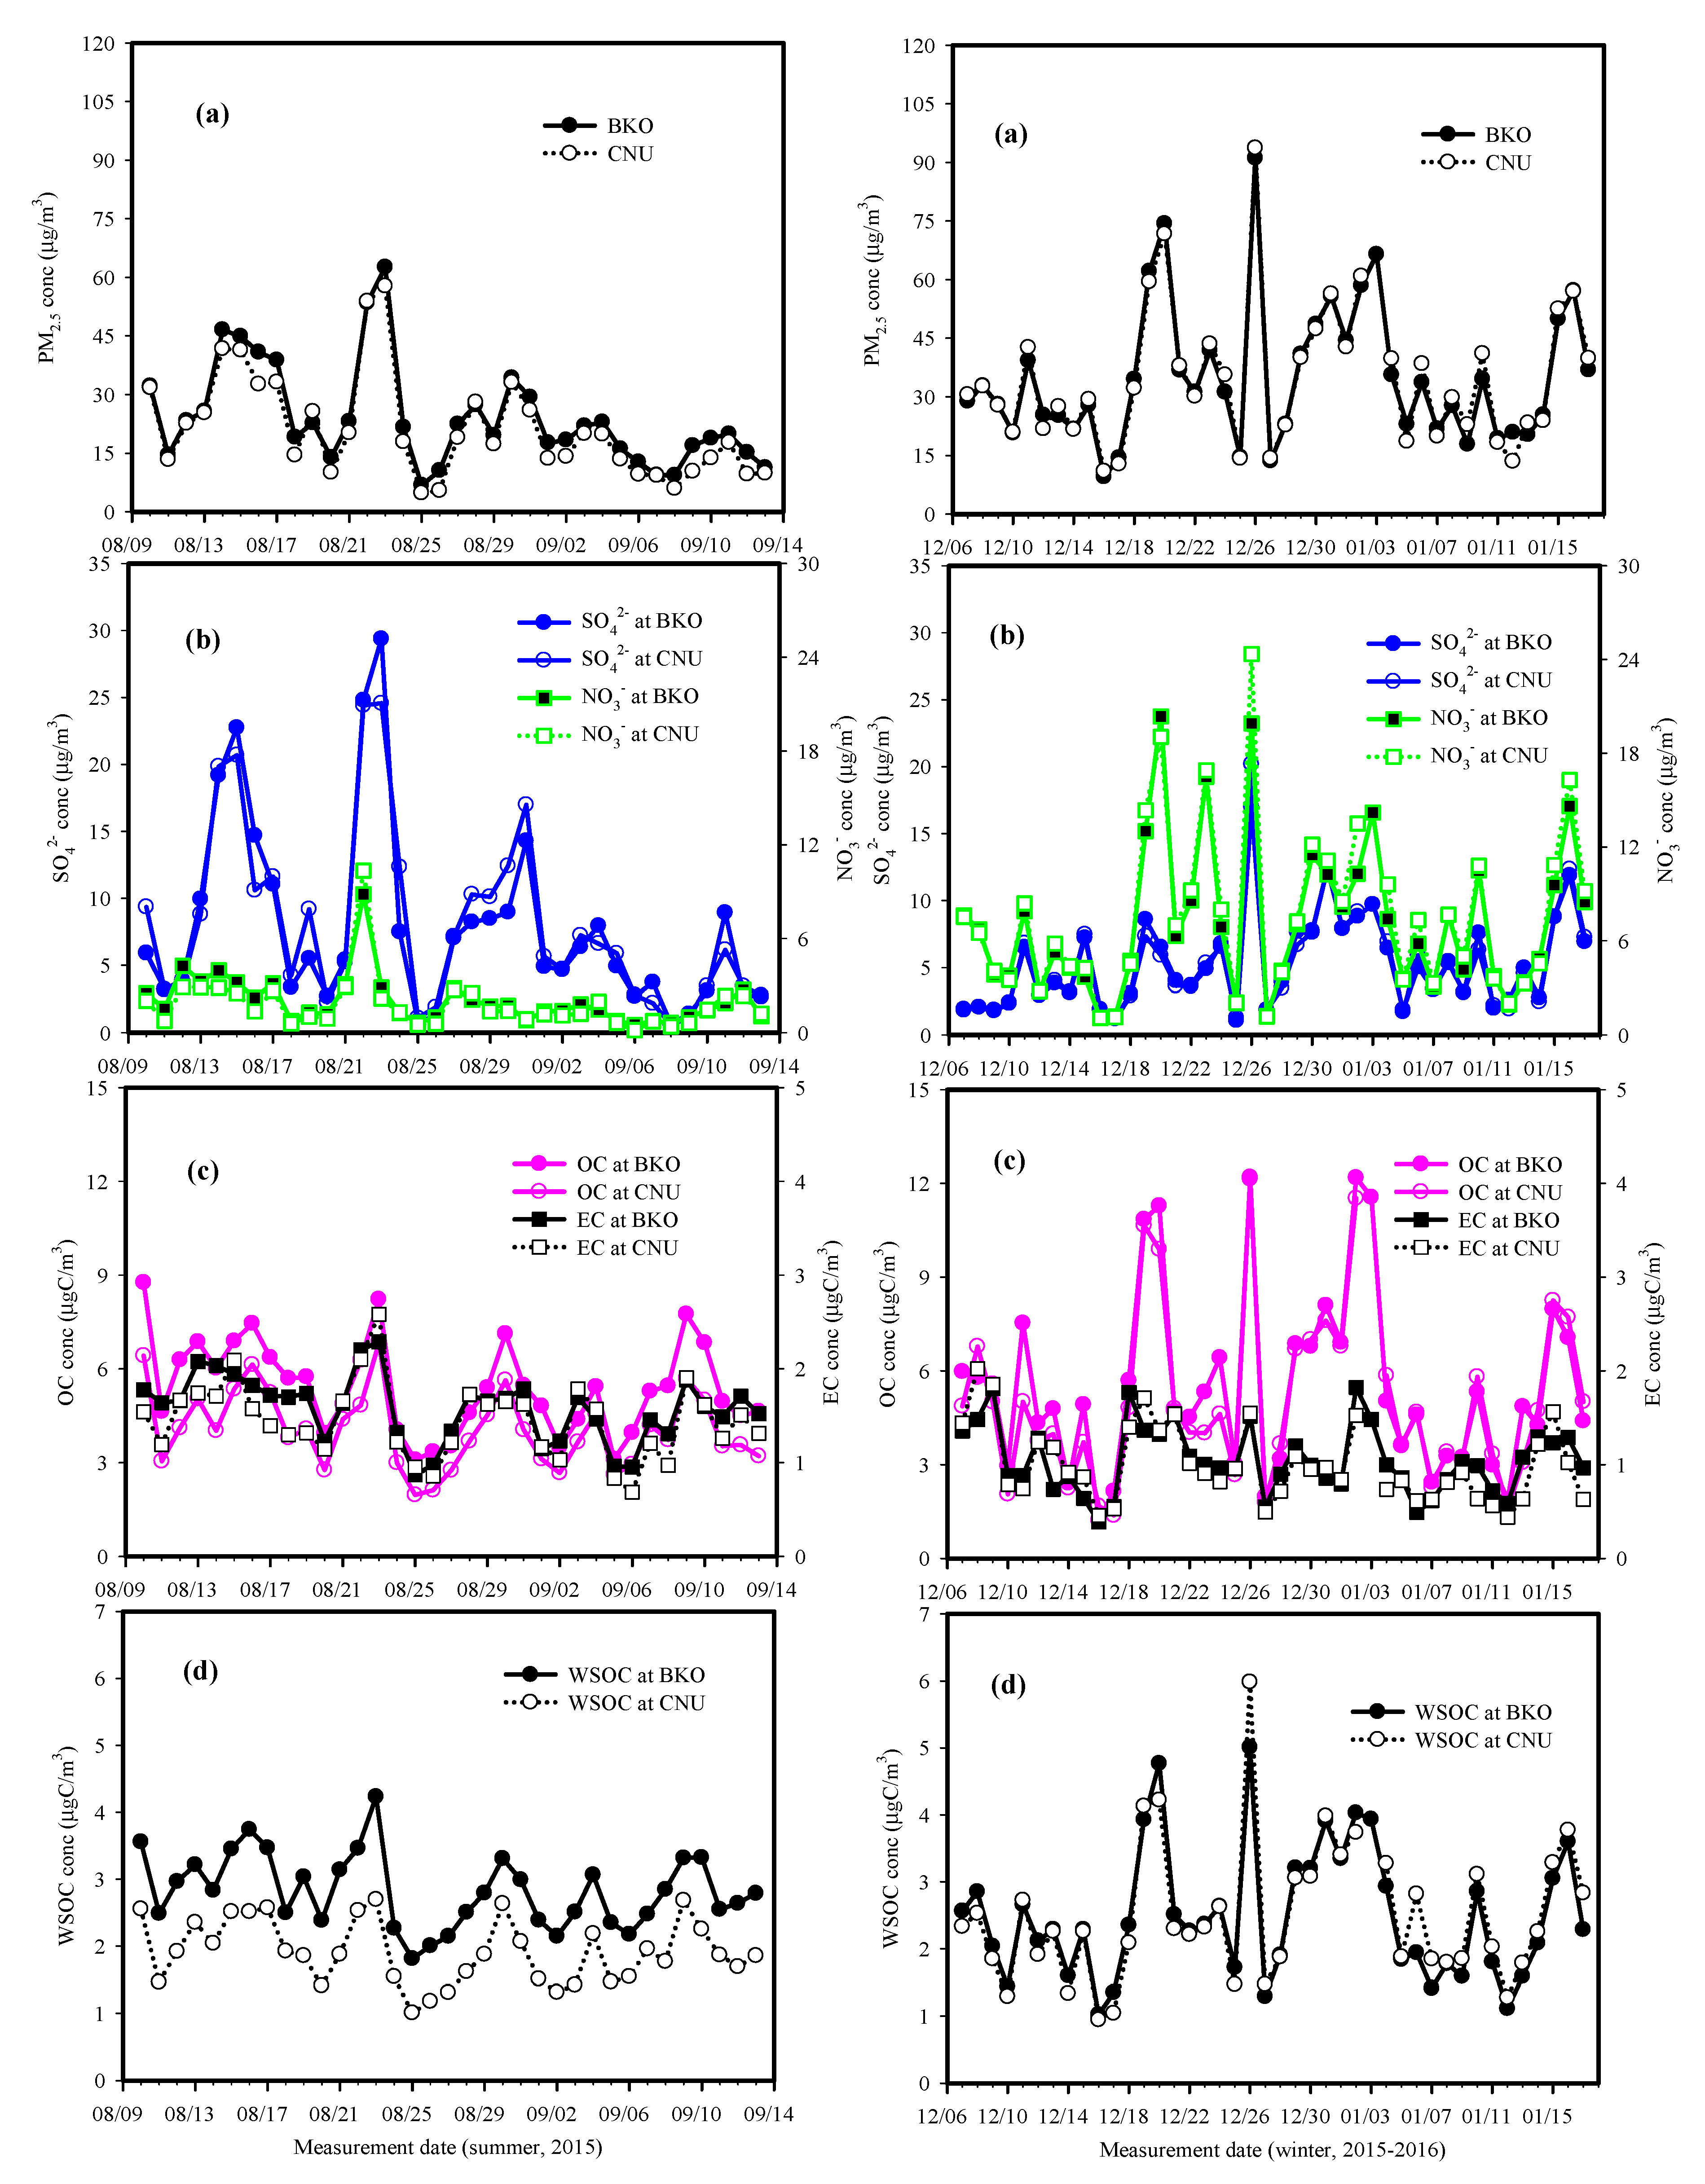
3.1. General Characteristics of PM2.5 and Its Chemical Components

The concentrations of the 24 h average PM2.5, SO42−, NO3, OC, EC, and WSOC during the summer and winter at the CNU and BKO sites are summarized in Table 1. In addition, their temporal profiles are presented in Figure 4. The temporal variations in the 24 h average ambient temperature, relative humidity (RH), and wind speed (WS), which were observed at Gwangju regional meteorological agency approximately 2 km away from our sampling sites, are illustrated in Figure 5. The 24 h average temperature, WS, and RH values were, respectively, 24 (14–28) °C, 1.4 (0.7–2.8) m/s, and 80 (58–96)% during the summer, and 4 (−2–11) °C, 1.3 (0.4–2.4) m/s, and 70 (40–96)% during the winter. The general meteorological conditions during the summer and winter included rather low winds and high RH, causing an accumulation of PM2.5 and enhanced secondary formation, as shown in Figure 4. Due to the short distance between the two measurement sites (~0.5 km), the concentrations of PM2.5 and its major chemical components showed similar trends, with higher concentrations in the winter, as shown in Figure 4. As shown in Table 1 and Figure 4, the PM2.5, NO3, and OC concentrations were observed to be higher in the winter than in the summer at both sites, with enhanced concentrations of NO3 and OC in the winter owing to less favorable air dispersion and low ambient temperatures (Figure 5). Moreover, increased fossil fuel consumption for domestic heating and biomass burning (BB) emissions could greatly contribute to the high OC levels in winter [11,12]. On the contrary, the SO42− concentration was higher in the summer than in the winter due to the stronger photochemical activity and a greater influence of long-range transported SO42−, which is discussed further below. However, the average concentrations of the secondary inorganic species NO3, SO42−, and NH4+ were similar between the two sites during the summer and winter. The difference in the major chemical composition of PM2.5 between the two sites is attributable to organic carbon aerosols. A detailed discussion of this observation is provided in Section 3.3. As shown in Figure 4, the daily OC concentrations during the summer and winter were higher at BKO, where higher total traffic volumes were observed and the distance from the roadway was lower (~15 m) than at CNU, but there was no noticeable difference between the sites in winter. This may be due to a greater influence of other emission sources (e.g., biomass burning) during winter, along with traffic emissions from the roads. Contrary to our expectations, the EC concentration was higher in the summer than in the winter at both sites, but little difference in the EC concentration was found between the two sites. This may be due to an increased volume of diesel-powered vehicles travelling near the BKO and CNU sites in summer.

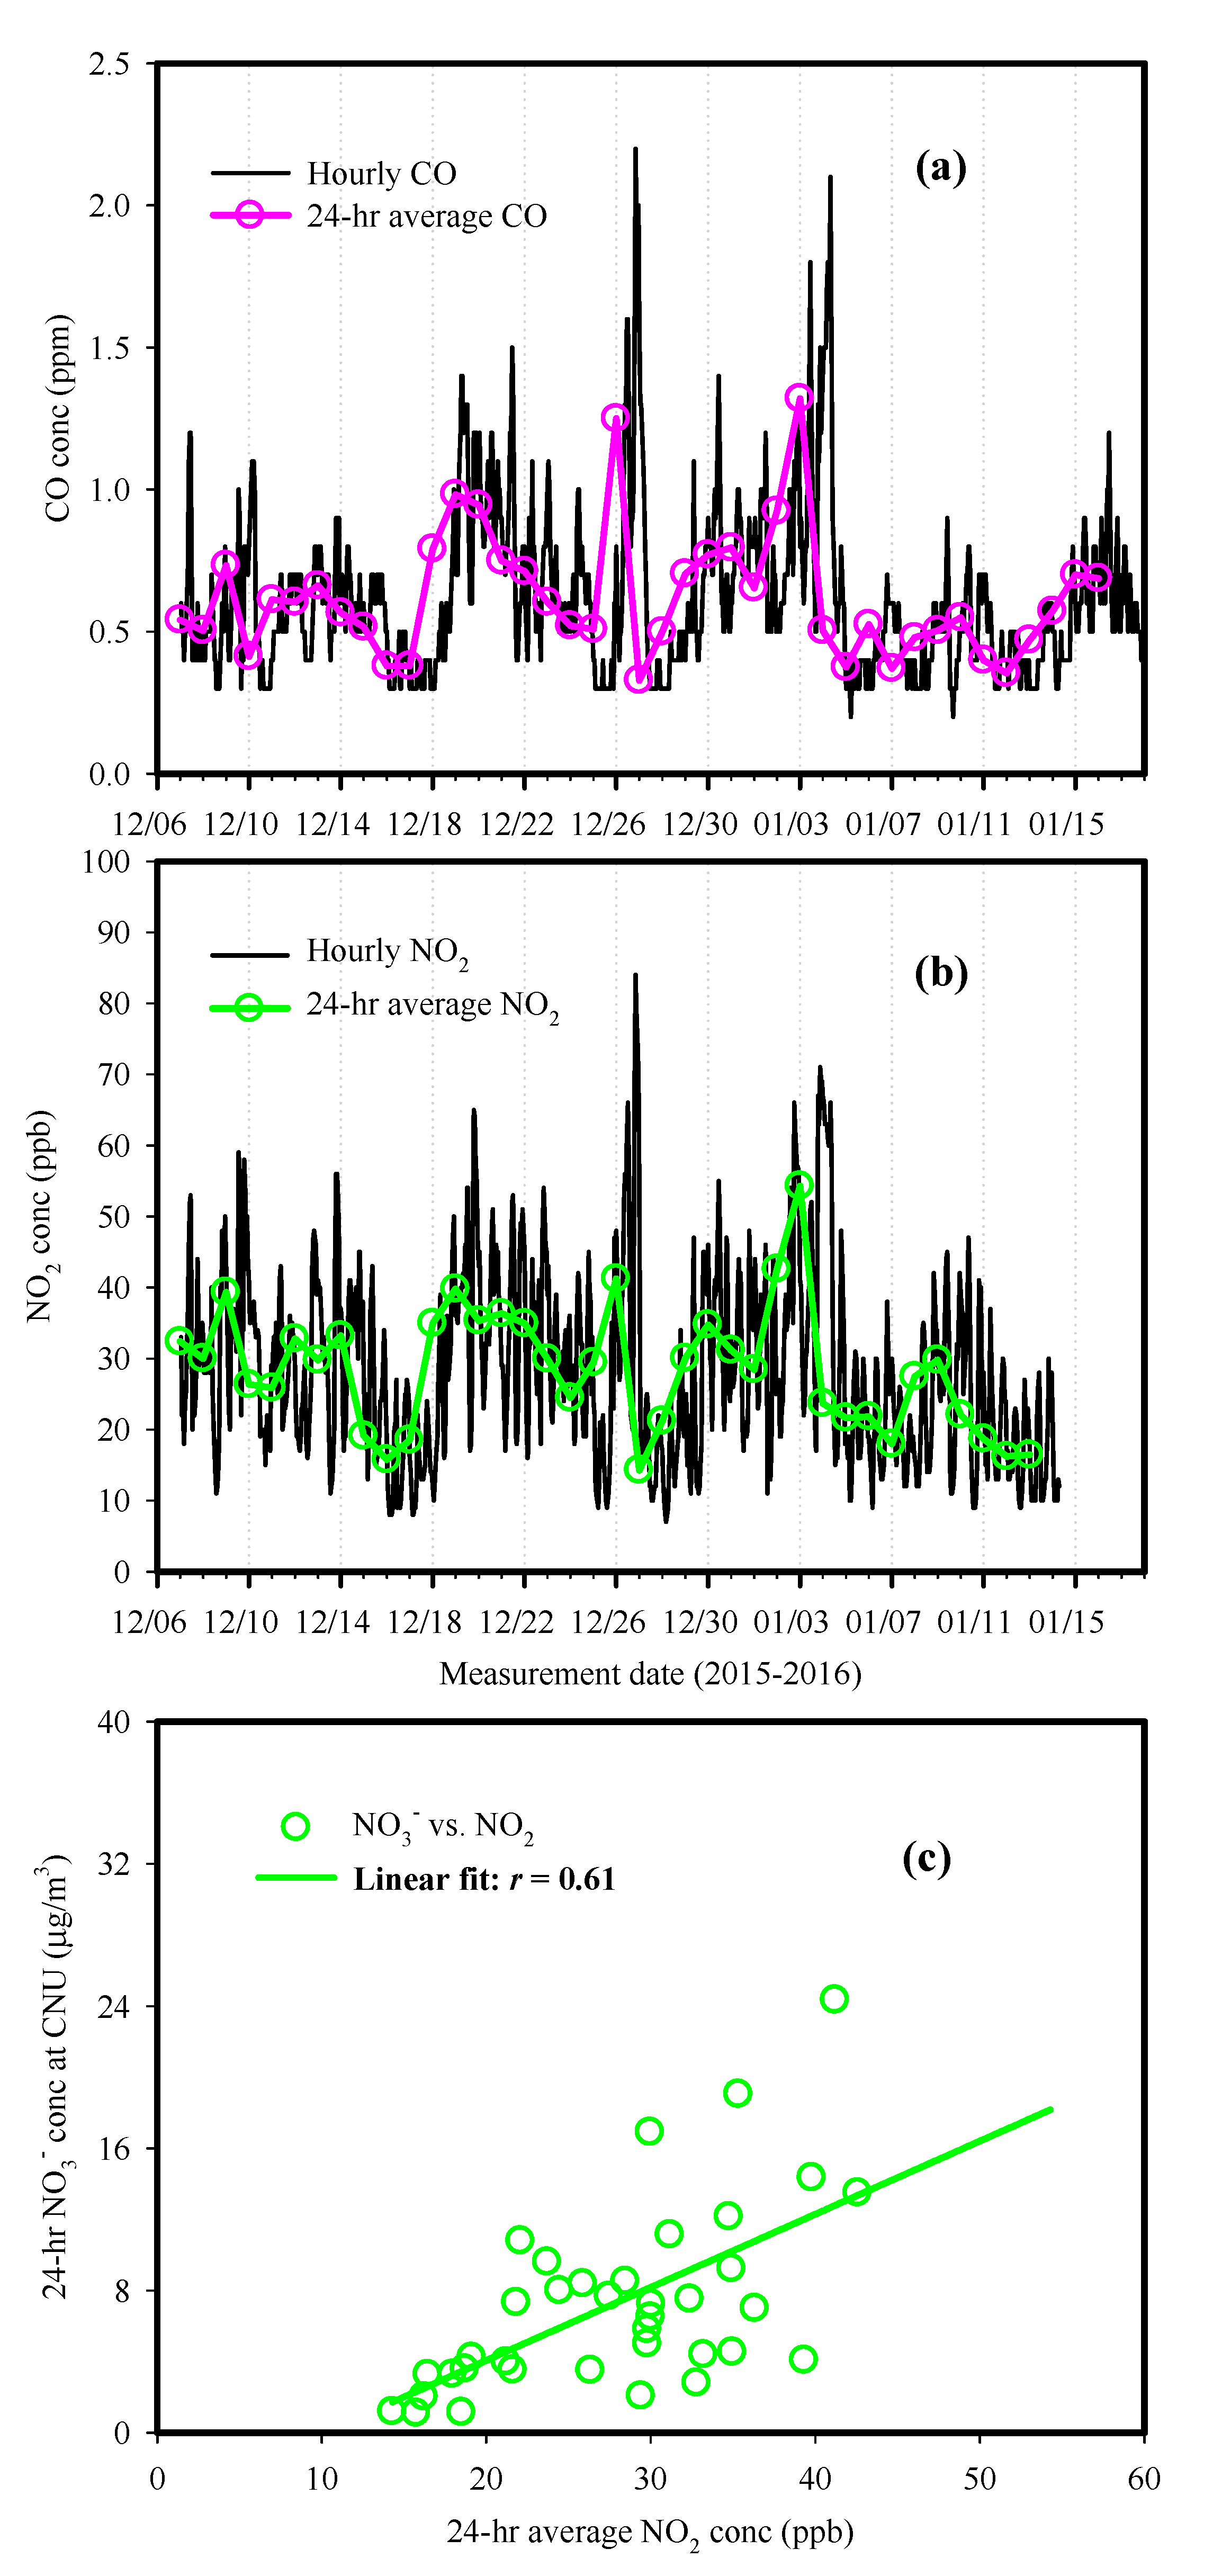
3.2. Possible Sources of Secondary Inorganic Species

During the summer, the total concentrations of secondary inorganic species (∑SIS = SO42+ NO3 + NH4+) were almost the same at the two sites (see Table 1), but their contribution to the PM2.5 was a little higher at the CNU site (mean: 45.0%, range: 11.1–74.0%) than at the BKO site (mean: 41.1%, range: 8.4–71.7%). Among the SIS, SO42 was the most significant contributor to the PM2.5, constituting 29.6% (5.4–47.5%) and 25.7% (4.3–50.6%) of the PM2.5 at the CNU and BKO sites, respectively. During winter, the concentrations of the t∑SIS and NO3 and their contributions to the PM2.5 increased at both the sites compared to those seen during summer, but the contribution of SO42 decreased. The average contributions of the ∑SIS, NO3, and SO42 concentrations to PM2.5 were, respectively, 51.3% (28.5–73.1%), 23.2% (9.4–44.1%), and 16.6% (6.9–28.9%) at CNU, and 50.2% (24.3–76.0%), 22.3% (9.3–44.7%), and 17.1% (7.2–29.4%) at BKO.
Previous studies indicated that the NO3/SO42 ratio can be used as an indicator of mobile versus stationary emission sources [27,28,53,54,55]. A higher NO3/SO42 ratio indicates a greater effect of mobile sources than stationary sources. In this study, the NO3/SO42− at the BKO site varied from 0.06 to 1.09 (mean: 0.38) in summer and from 0.51 to 3.99 (mean: 1.47) in winter. At the CNU site, the ratio was in the range of 0.05–0.79 (mean: 0.29) and 0.57–4.06 (mean: 1.55) in the summer and winter, respectively. The relatively low NO3/SO42− ratio in summer at both sites suggests a greater influence of stationary sources than mobile sources [54]. However, the high NO3/SO42− ratio, which ranges between 2 and 5, observed in Los Angeles, USA, indicates a significant contribution of mobile sources in downtown LA [53]. Considering that there are no major emission sources of SO2, such as coal- and oil-fired power plants and industrial facilities, around the sampling sites or in Gwangju metropolitan city, it is probable that the particulate SO42− observed at the sites during the summer originated primarily from atmospheric processing during the long-range transportation of air pollutants from other areas, rather than the local production of SO42− from SO2. However, it should be considered that the high O3 and high RH conditions during the summer may have increased the gas-phase homogeneous and/or aqueous phase reactions of SO2 to produce SO42− particles at both sites. Our previous studies conducted in Gwangju also demonstrated a significant influence of long-range transported aerosols on the elevated SO42− concentrations [11,12,24,27,28]. A detailed explanation of this issue is given below in Section 3.4.
Unlike the low ratio seen in the summer, the high NO3/SO42− ratios at both sites in the winter demonstrate the important role of vehicles in the secondary formation of particulate NO3 from gaseous NO2. Even though the photochemical activity accelerated in the summer, low NO3 concentrations occurred because most NO3 particles were found in the gas phase as nitric acid due to the higher temperature. In order to examine the influence of the local production of NO3 from gaseous NO2 from traffic emissions during winter, the relationship of NO2 with NO3 at the CNU site was investigated; the results are presented in Figure 6c. The temporal profiles of CO and NO2 are also plotted in Figure 6a,b, respectively. The hourly CO and NO2 concentrations were observed at an urban air monitoring station approximately 2.0 km from the sampling site. Since there was a great deal of missing data on NO2 at the station during summer, we did not perform a regression analysis between the summertime NO2 and NO3. The hourly CO was strongly correlated with NO2, with a correlation coefficient of 0.88, implying that both arose from traffic emissions. During the winter, the particulate NO3 observed at the CNU site showed a good correlation with the gaseous NO2 (R2 = 0.38, p < 0.01) (Figure 6c), indicating that locally produced NO2 played a role in the formation of secondary NO3 particles. A positive correlation between the 24 h average NO2 (at an air pollution monitoring station) and NO3 at the CNU site, high RH, and low WS during winter suggest that heterogeneous reactions were an important process of the wintertime particulate NO3 formation. It was previously demonstrated that a high RH and low wind conditions are favorable for converting NO2 into NO3 through aqueous-phase or heterogeneous oxidation [33,34,35,36,37,38,39,40,41,42,43,44,45,46,47,48,49,50,51,52,53,54,55]. A similar result was obtained at the BKO site.

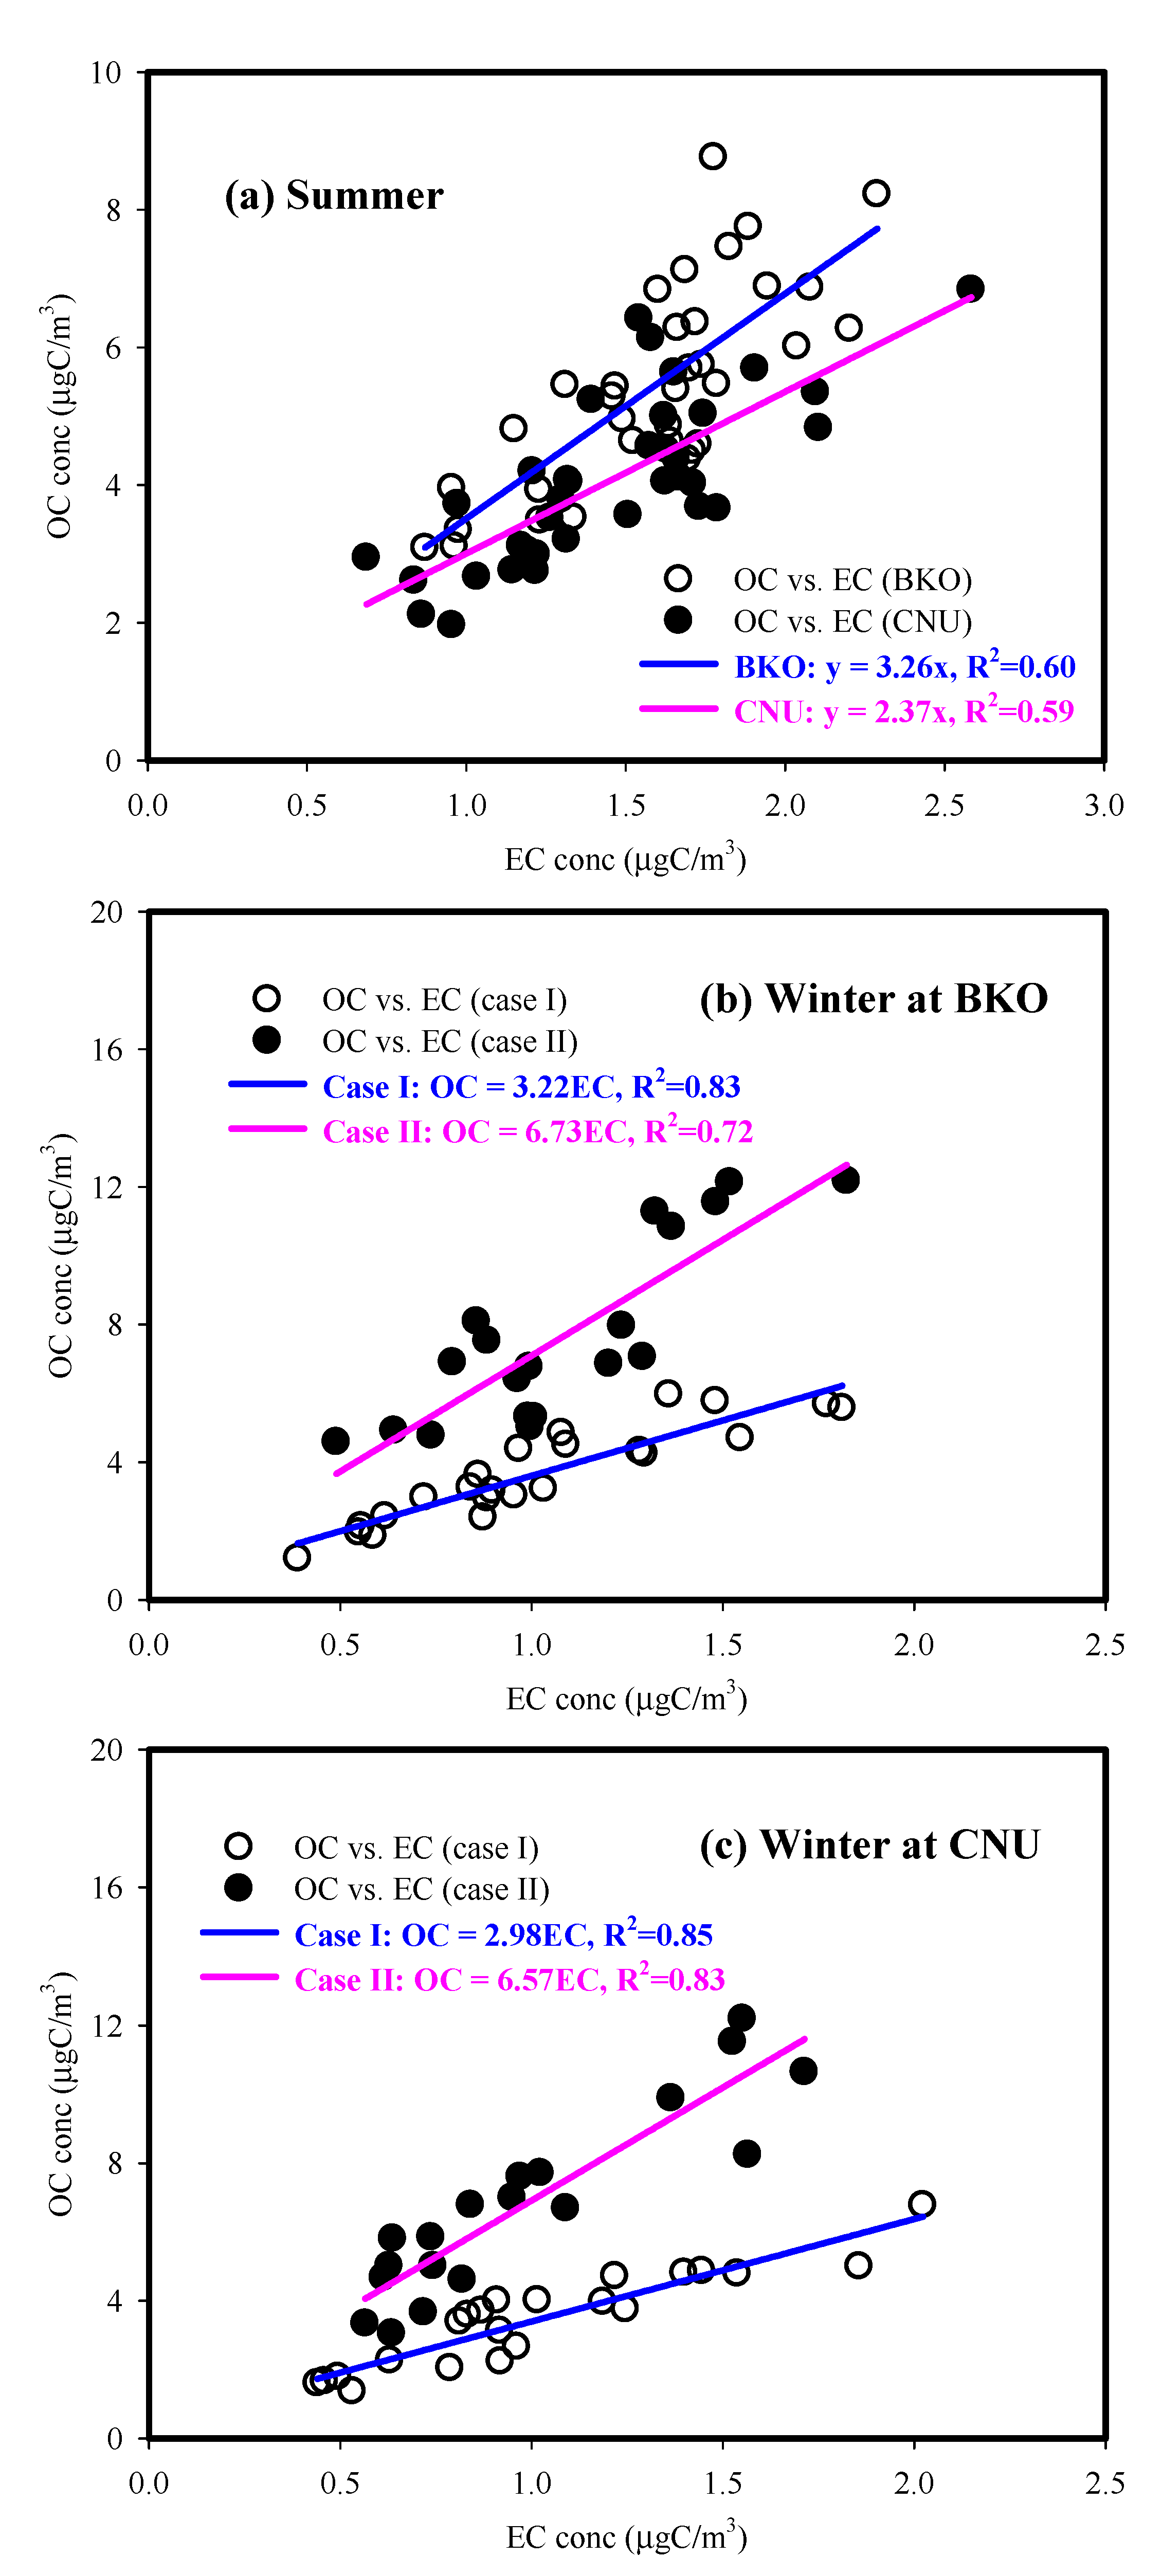
3.3. Characteristics of Carbonaceous Components

As shown in Table 1 and Figure 4, the OC concentration was higher in the winter than in the summer at both sites due to the increased consumption of fossil fuels for domestic heating and increased BB emissions. Slightly higher OC concentrations were observed at the BKO site, which is closer to the roadway, during both the summer and winter. However, comparable OC levels were observed at both the sites during winter. For the EC concentration, there was also little difference between the BKO and CNU sites during both seasons. Our measurements showed no notable increases in the concentrations of carbonaceous components strongly associated with traffic emissions at the site that was closer to the roadway. During the summer, the contribution of OM (organic mass, 1.8×OC) to the PM2.5 was approximately 6.0% higher at the BKO site (41.3%, 18.3–70.0%) than at the CNU site (34.5%, 14.1–66.7%), but EC had similar contributions at both sites (6.8% at CNU vs. 6.7% at BKO). The OM contributions during winter decreased due to an increased contribution of ∑SIS concentrations, especially NO3. The average contributions of the OM concentration to the PM2.5 during the winter were 26.1% (16.6–37.3%) at CNU, and 28.3% (16.1–43.0%) at BKO. In this study, the OM concentration was calculated by multiplying the OC concentration by 1.8 in both the summer and winter. Generally, a conversion factor of 1.6 is applied in urban atmospheres [56]. However, an OM factor of 1.8 was used in this study to reflect the impact of the photochemistry in summer and the BB emissions in winter. The influence of the BB emissions on the chemical composition of aerosol particles is discussed below.
Figure 7 shows the relationships between the OC and EC concentrations at both sites during the summer and winter. During the summer, a regression analysis showed slopes of 3.3 and 2.4 and R2 values of 0.60 and 0.59 at the BKO and CNU sites, respectively. High R2 values (0.59–0.60) indicate that the OC and EC levels at both sites were associated with common sources—e.g., traffic emissions. It is not entirely clear, but the higher OC/EC slope at the BKO site was likely attributable to more enhanced SOA formation rather than additional primary sources of OC. During the winter, there were two distinct regression slopes between the OC and EC, but little difference in their slopes was found between the two sites. The winter period, representing the lower OC/EC slope, was classified as the case I period, and the higher slope was designated the case II period. For the case I period, lower slopes of 3.0–3.2 likely indicate the influence of traffic emissions on the OC and EC concentrations. On the other hand, the higher slopes of 6.6–6.7 for case II suggest the additional influence of BB emissions (e.g., wood burning) as well as traffic emissions and fossil fuel emissions for heating. In addition to traffic emissions, the influence of the other combustion emissions supports the comparable OC concentrations measured during the winter at the CNU and BKO sites.
To estimate the primary and secondary OC (POC and SOC) during the summer and winter, the primary EC tracer method was applied in this study. Many previous studies have used the minimum OC/EC ratio to estimate the contribution of the POC and SOC to the OC [2,6,10,11,57]. The OC/EC ratio was generally used to identify the sources of carbonaceous components [2,6,10,58,59]. A low OC/EC ratio of less than 2–3 [6] represents the predominance of sources from fossil fuels and vehicle emissions, while a high OC/EC ratio, as seen in this study during the winter, suggests the impact of other sources (e.g., BB and SOA formation) as well as primary traffic emissions. In this study, the primary OC/EC ratio was calculated as the lowest 10% of OC/EC ratios from all the OC-EC data measured at the two sites for each season [2,10,11,60]. The primary OC/EC ratio was 2.3 during the summer, and 3.0 and 5.3 for the case I and II winter periods. The higher primary OC/EC ratio during the case I winter period vs. the summer was likely due to the impact of the BB emissions during the winter period I. During summer, the average estimated POC and SOC concentrations were 3.7 (2.0–5.3) and 1.7 (0.4–4.6) μgC/m3 at the BKO site, contributing 69% (47~90%) and 31% (10~53%) to the OC concentration, respectively, and 3.3 (1.6–6.0) and 0.7 (0.0–2.8) μgC/m3 at the CNU site, contributing 84% (54~100%) and 16% (0~46%) to the OC concentration, respectively. The contribution of SOC to the total OC was approximately two-fold greater at BKO than at CNU. Typically, a higher SOC contribution was found for the periods when the PM2.5 pollution episodes occurred at both sites, along with a low wind speed, high temperature, and strong photochemical oxidation. For the entire winter period (case I + case II), the POC and SOC concentrations were estimated to be 4.3 (1.2–9.7) and 1.2 (0.0–4.2) μgC/m3 at the BKO site, accounting for 81% and 19% of the total OC, respectively, and 4.0 (1.3–9.1) and 1.0 (0.0–3.9) μgC/m3 at the CNU site, accounting for 82% and 18% of the total OC, respectively. The results revealed that the primary combustion emissions (e.g., traffic in summer vs. traffic + BB emissions in winter) were major contributors to the OC near roadways during both the summer and winter.
Similar to the summertime OC pattern, the WSOC concentrations during the summer were observed to be higher at BKO than at CNU, resulting in higher WSOC/OC and WSOC/EC ratios at BKO (0.42 and 1.82) than at CNU (0.38 and 1.36). In this study, however, a higher WSOC/OC was observed in the winter than in the summer, possibly due to the contribution of BB emissions to the wintertime WSOC, as discussed above. Previous studies have shown that the WSOC/OC in ambient air varies with the study location and season [6,10,11,40,52,61,62,63]. For example, the WSOC/OC ratios measured at Mt. Abu, India [6]; Hong Kong, China [64]; and an urban site in Tokyo [62] were higher in the winter than in the summer. On the other hand, higher ratios were found in the summer than in the winter at the same CNU site in different measurement periods [10,52]. The WSOC/OC ratios measured during the summer and winter were comparable to those from our previous studies conducted at the CNU site [11,40,52]. WSOC in ambient air can be used as a proxy for SOA formation [65,66]. In addition, biomass burning is an important primary source of WSOC [67,68,69,70], as well as traffic emissions [10,11,13,40,71] and shipping activity [72,73].
To examine the influence of sources on the WSOC observed during the summer and winter at the CNU site, we performed a regression analysis of the WSOC with the EC, K+, POC, and SOC. During the summer, the WSOC showed moderate-to-good correlations with the EC (R2 = 0.52), K+ (R2 = 0.38), POC (R2 = 0.58), and SOC (R2 = 0.37), suggesting that primary combustion emissions such as those from traffic were a main contributor to the summertime WSOC concentration. This also suggests some influence of SOA formation on the WSOC concentration during the summer. However, the WSOC during the winter was strongly correlated with the K+ (R2 = 0.86), POC (R2 = 0.69), and SOC (R2 = 0.71), with a weak correlation with the primary EC (R2 = 0.18). These results reveal that the wintertime WSOC was strongly associated with primary traffic and biomass burning emissions and SOA formation. A strong relationship (R2 = 0.79) between the WSOC and NO3 further supports the contribution of SOA formation to WSOC. The correlations revealed a large influence of BB on carbonaceous components in the winter and a modest effect during the summer.

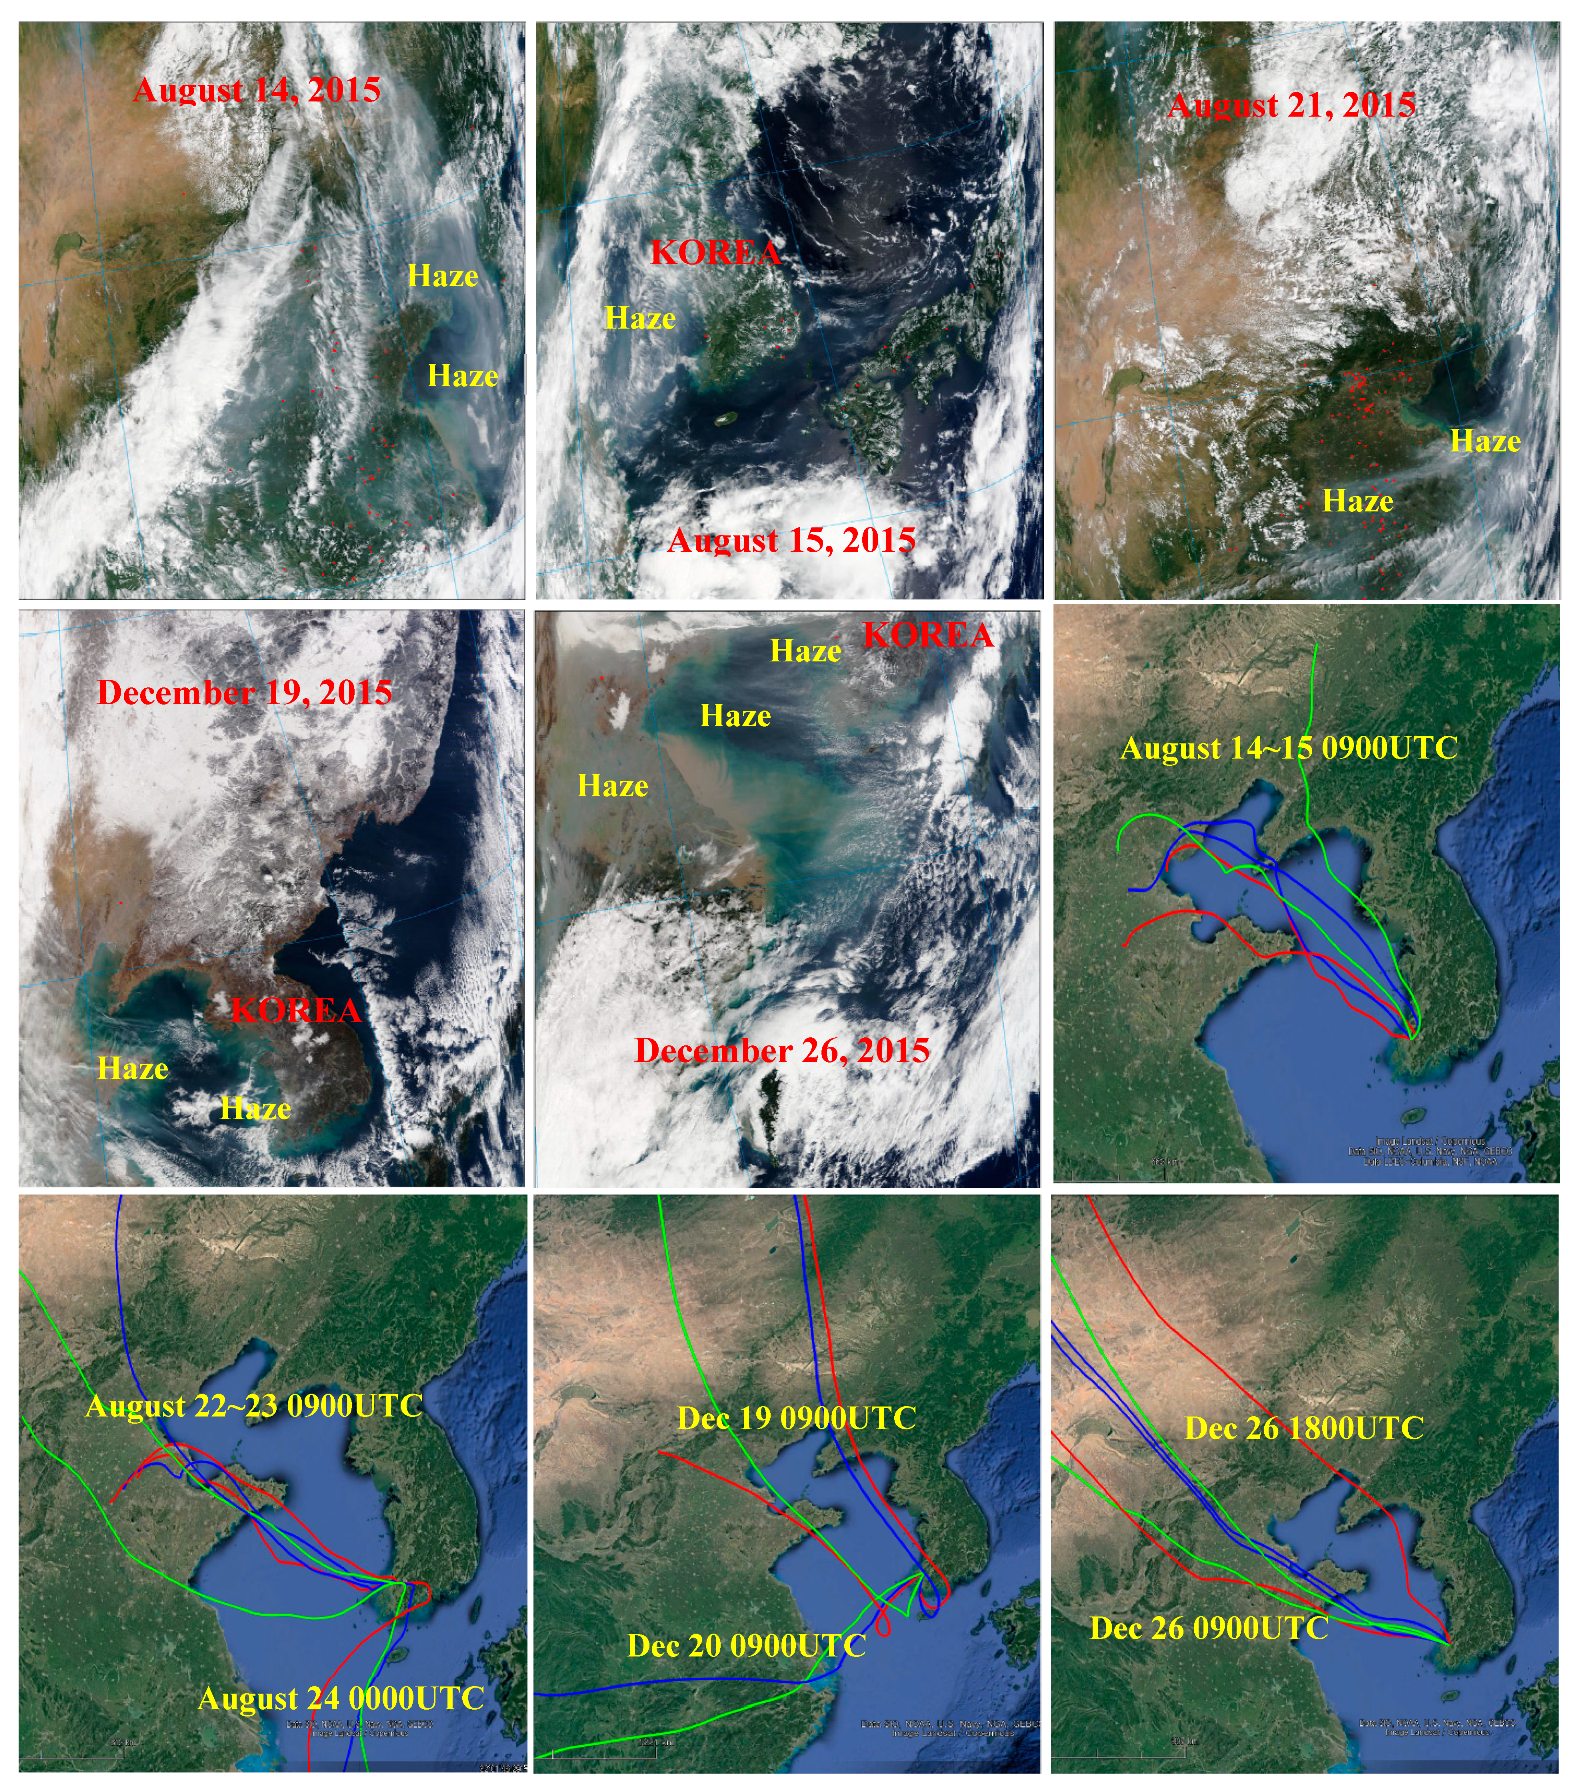
3.4. Characteristics of Pollution Episodes during Summer and Winter

The PM2.5 at the BKO and CNU sites exceeded the 24 h Korean PM2.5 standard (35 μg/m3) seven and five times, respectively, during the summer. More such episodes occurred during the winter, with 16 and 20 events at the BKO and CNU sites, respectively, accounting for 38% and 48% of all measurements. As shown in Table 1 and Figure 4, these PM2.5 episodes during the summer were associated with a highly enriched SO42− concentration with local and/or regional haze pollutants from China [11,12,28]. Our previous studies indicated that high PM2.5 pollution episodes during the summer in Gwangju were strongly associated with highly elevated concentrations of SO42−, which was regionally transported from polluted regions in China, rather than local production [10,12,74]. During the summer pollution episodes, the SO42− and SIS contributions increased, but the OM contribution decreased. For the period from August 14 to 16, the average contributions of ∑SIS, SO42−, and OM to the PM2.5 were 66.7%, 47.1%, and 19.5% at the CNU site, and 62.2%, 42.6%, and 27.9% at the BKO site. During the pollution episode observed on August 22–23, the ∑SIS, SO42−, and OM concentrations contributed 67.7%, 43.6%, and 21.0% to the PM2.5 at BKO and 66.8%, 41.0%, and 17.7% to the PM2.5 at CNU. The wind speed and RH were 1.0–1.2 m/s and 75–81% on August 14–16, and 0.9–1.1% and 81–89% on August 22–23, respectively. A high daytime O3 (which is not shown here), high temperature, and low daytime RH values are likely important factors in the photochemical formation of SO42− aerosols. Moreover, high RH and low WS conditions could cause the local production of secondary SO42− particles through aqueous-phase oxidation in fog and cloud and the heterogeneous oxidation of SO2 on aerosol surfaces. The afternoon O3 levels and meteorological conditions during the summertime PM2.5 episodes imply that the gas-phase and aqueous-phase SO42− chemistry was, to some extent, one possible factor leading to the local SO42− formation. However, during the winter pollution episodes, the ∑SIS and NO3 contributions increased compared to those on non-polluted days, but the SO42− and OM contributions were typical for the sampling periods. The average ∑SIS, NO3, SO42−, and OM contributions were 56.8% (40.2–72.5%), 25.7% (19.4–44.7%), 19.0% (10.0–25.3%), and 27.4% (21.4–37.5%) at BKO, and 59.0% (41.1–73.1%), 27.4% (20.5–44.1%), 19.8% (10.8–25.0%), and 25.4% (16.6–34.0%) at CNU, respectively. The 24 h average ambient temperature and WS and RH values during the winter episodes were in the range of 1.5–7.8 °C, 0.4–1.4 m/s, and 62–88%, respectively. Notably, on December 20 and 26, when the PM2.5 values were 73 and 93 µg/m3, the WS and RH were 0.4 m/s and 88% on December 20 and 1.2 m/s and 67% on December 26.
In order to identify the influence of either long-range transport or local pollution on the PM2.5 pollution episodes during the summer and winter intensive measurement periods, MODIS (Moderate Resolution Imaging Spectroradiometer) images (http://lance-modis.eosdis.nasa.gov/cgi-bin/imagery/realtime.cgi) around the Korean peninsula and the transport pathways of air masses that reached the sampling site (CNU, 35.18N, 126.91E) were examined. Figure 8 shows the MODIS images for the summer episodes (14, 15, and 21 August) and winter episodes (December 19 and 26), and the transport pathways of the air masses for 14–15 August, 22–24 August, 19–20 December, and 26 December, when the concentrations of PM2.5 and its OC and secondary inorganic species were highly enhanced. The 72 h backward trajectories of air masses arriving at the site were calculated with the HYSPLIT (Hybrid Single-Particle Lagrangian Integrated Trajectory) model [75] for the heights of 500, 1000, and 1500 m above ground level at 0900 UTC on each day. The MODIS images taken on those days show layers of haze lingering over regions of eastern China and just west (over the Yellow Sea) of the Korean peninsula. Additionally, the air masses for the pollution periods passed over layers of haze distributed in eastern China and the Yellow Sea prior to reaching the sampling site. As a result, the MODIS images and the backward trajectories of air masses support the notion that the pollution episodes that occurred at the site during the summer and winter periods were largely affected by regionally transported haze pollution. Therefore, we conclude that increases in the PM2.5 during summer were greatly affected by long-range transported SO42−, while the PM2.5 increases during the winter were associated with local pollution as well as the regional transport of aerosols.

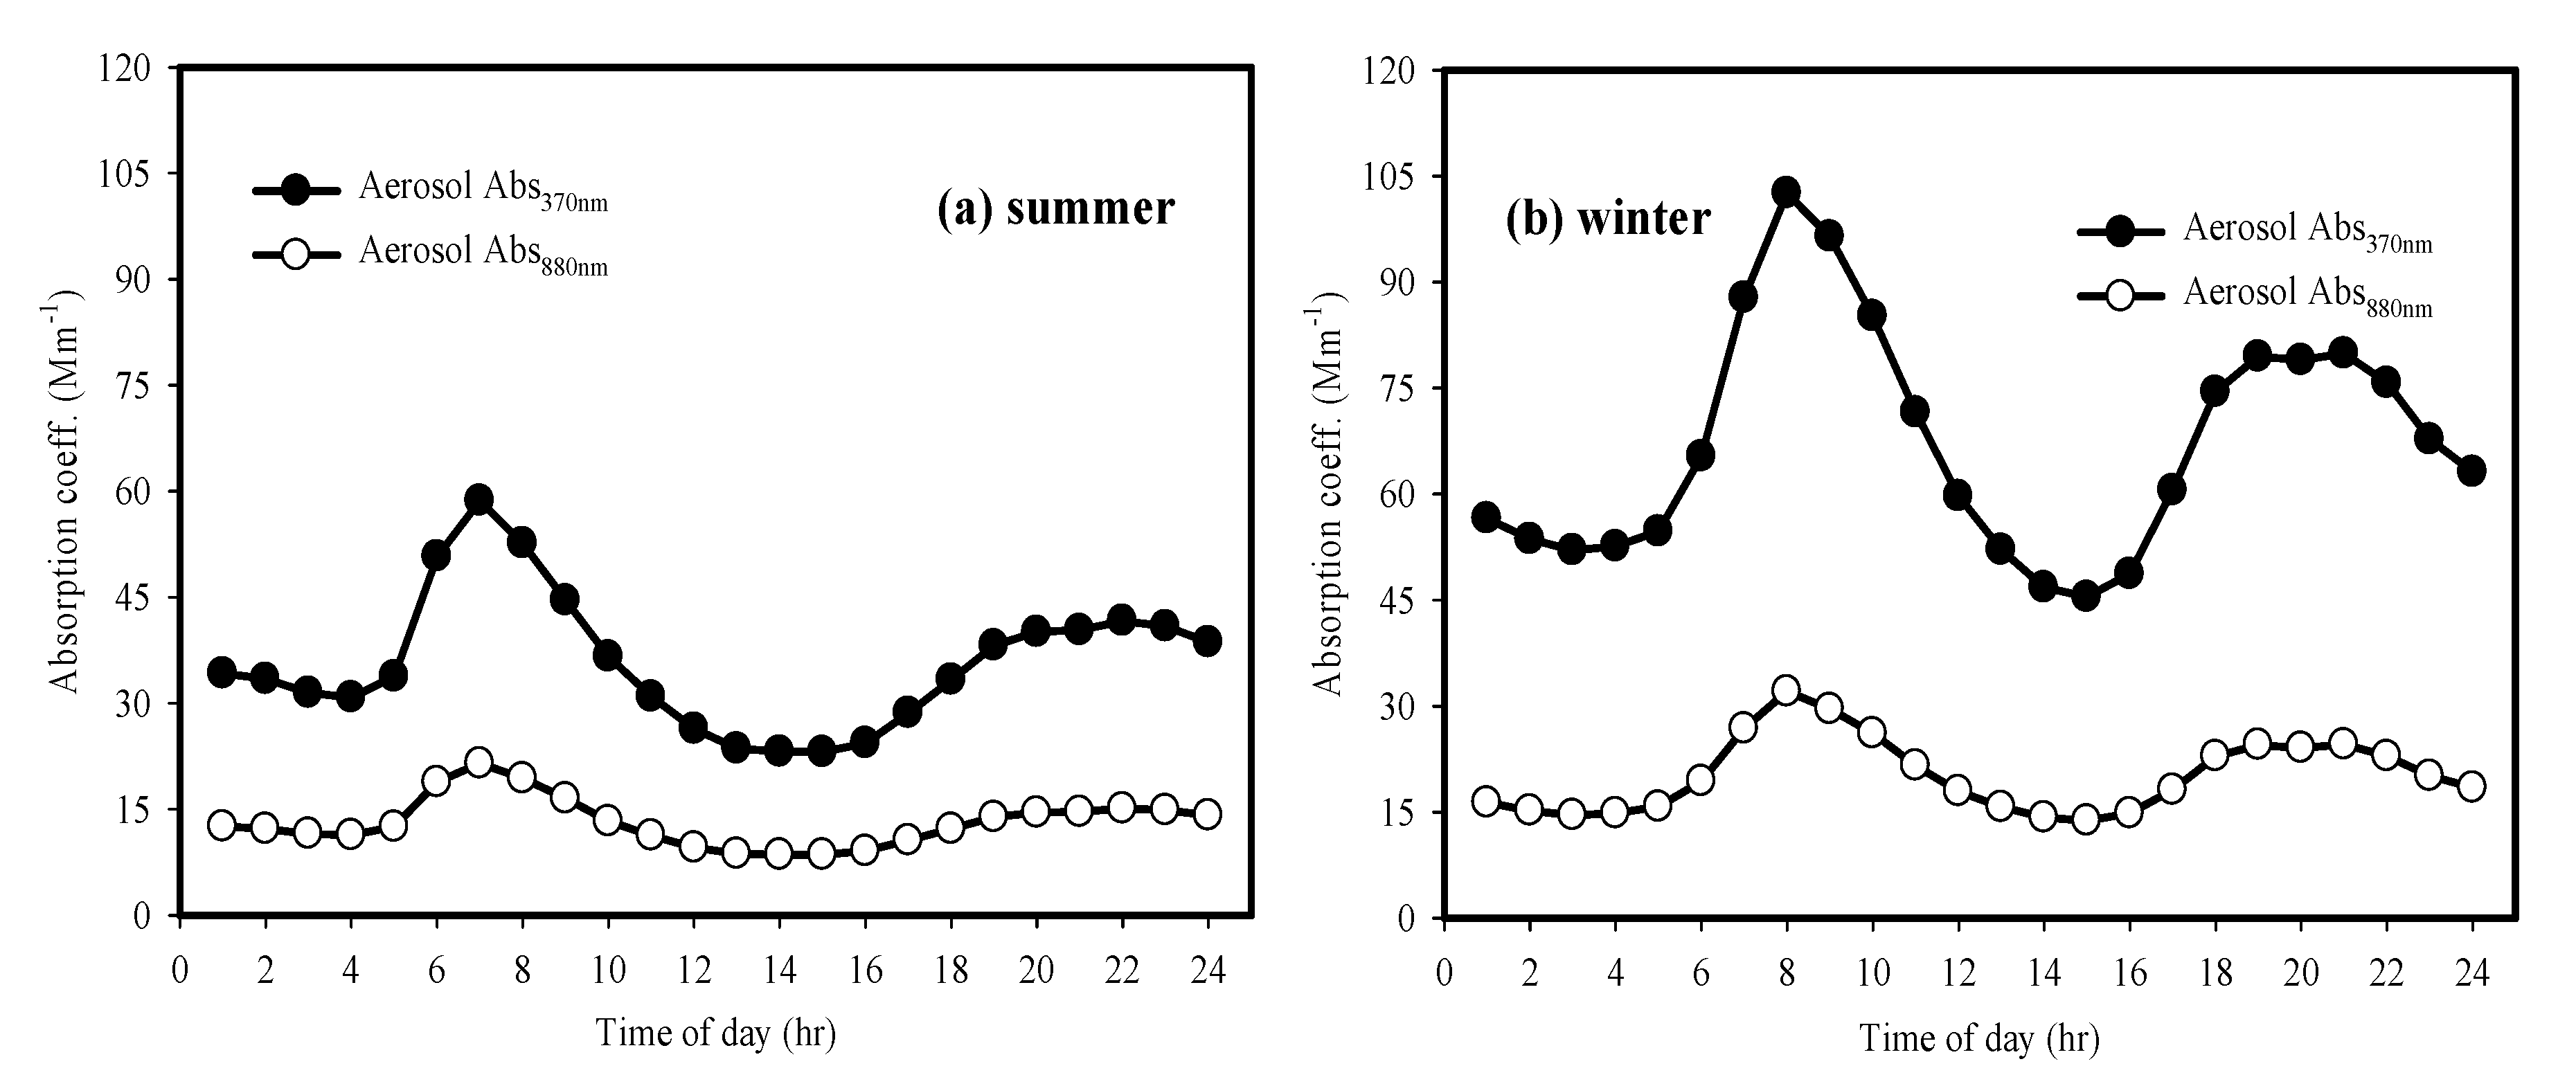
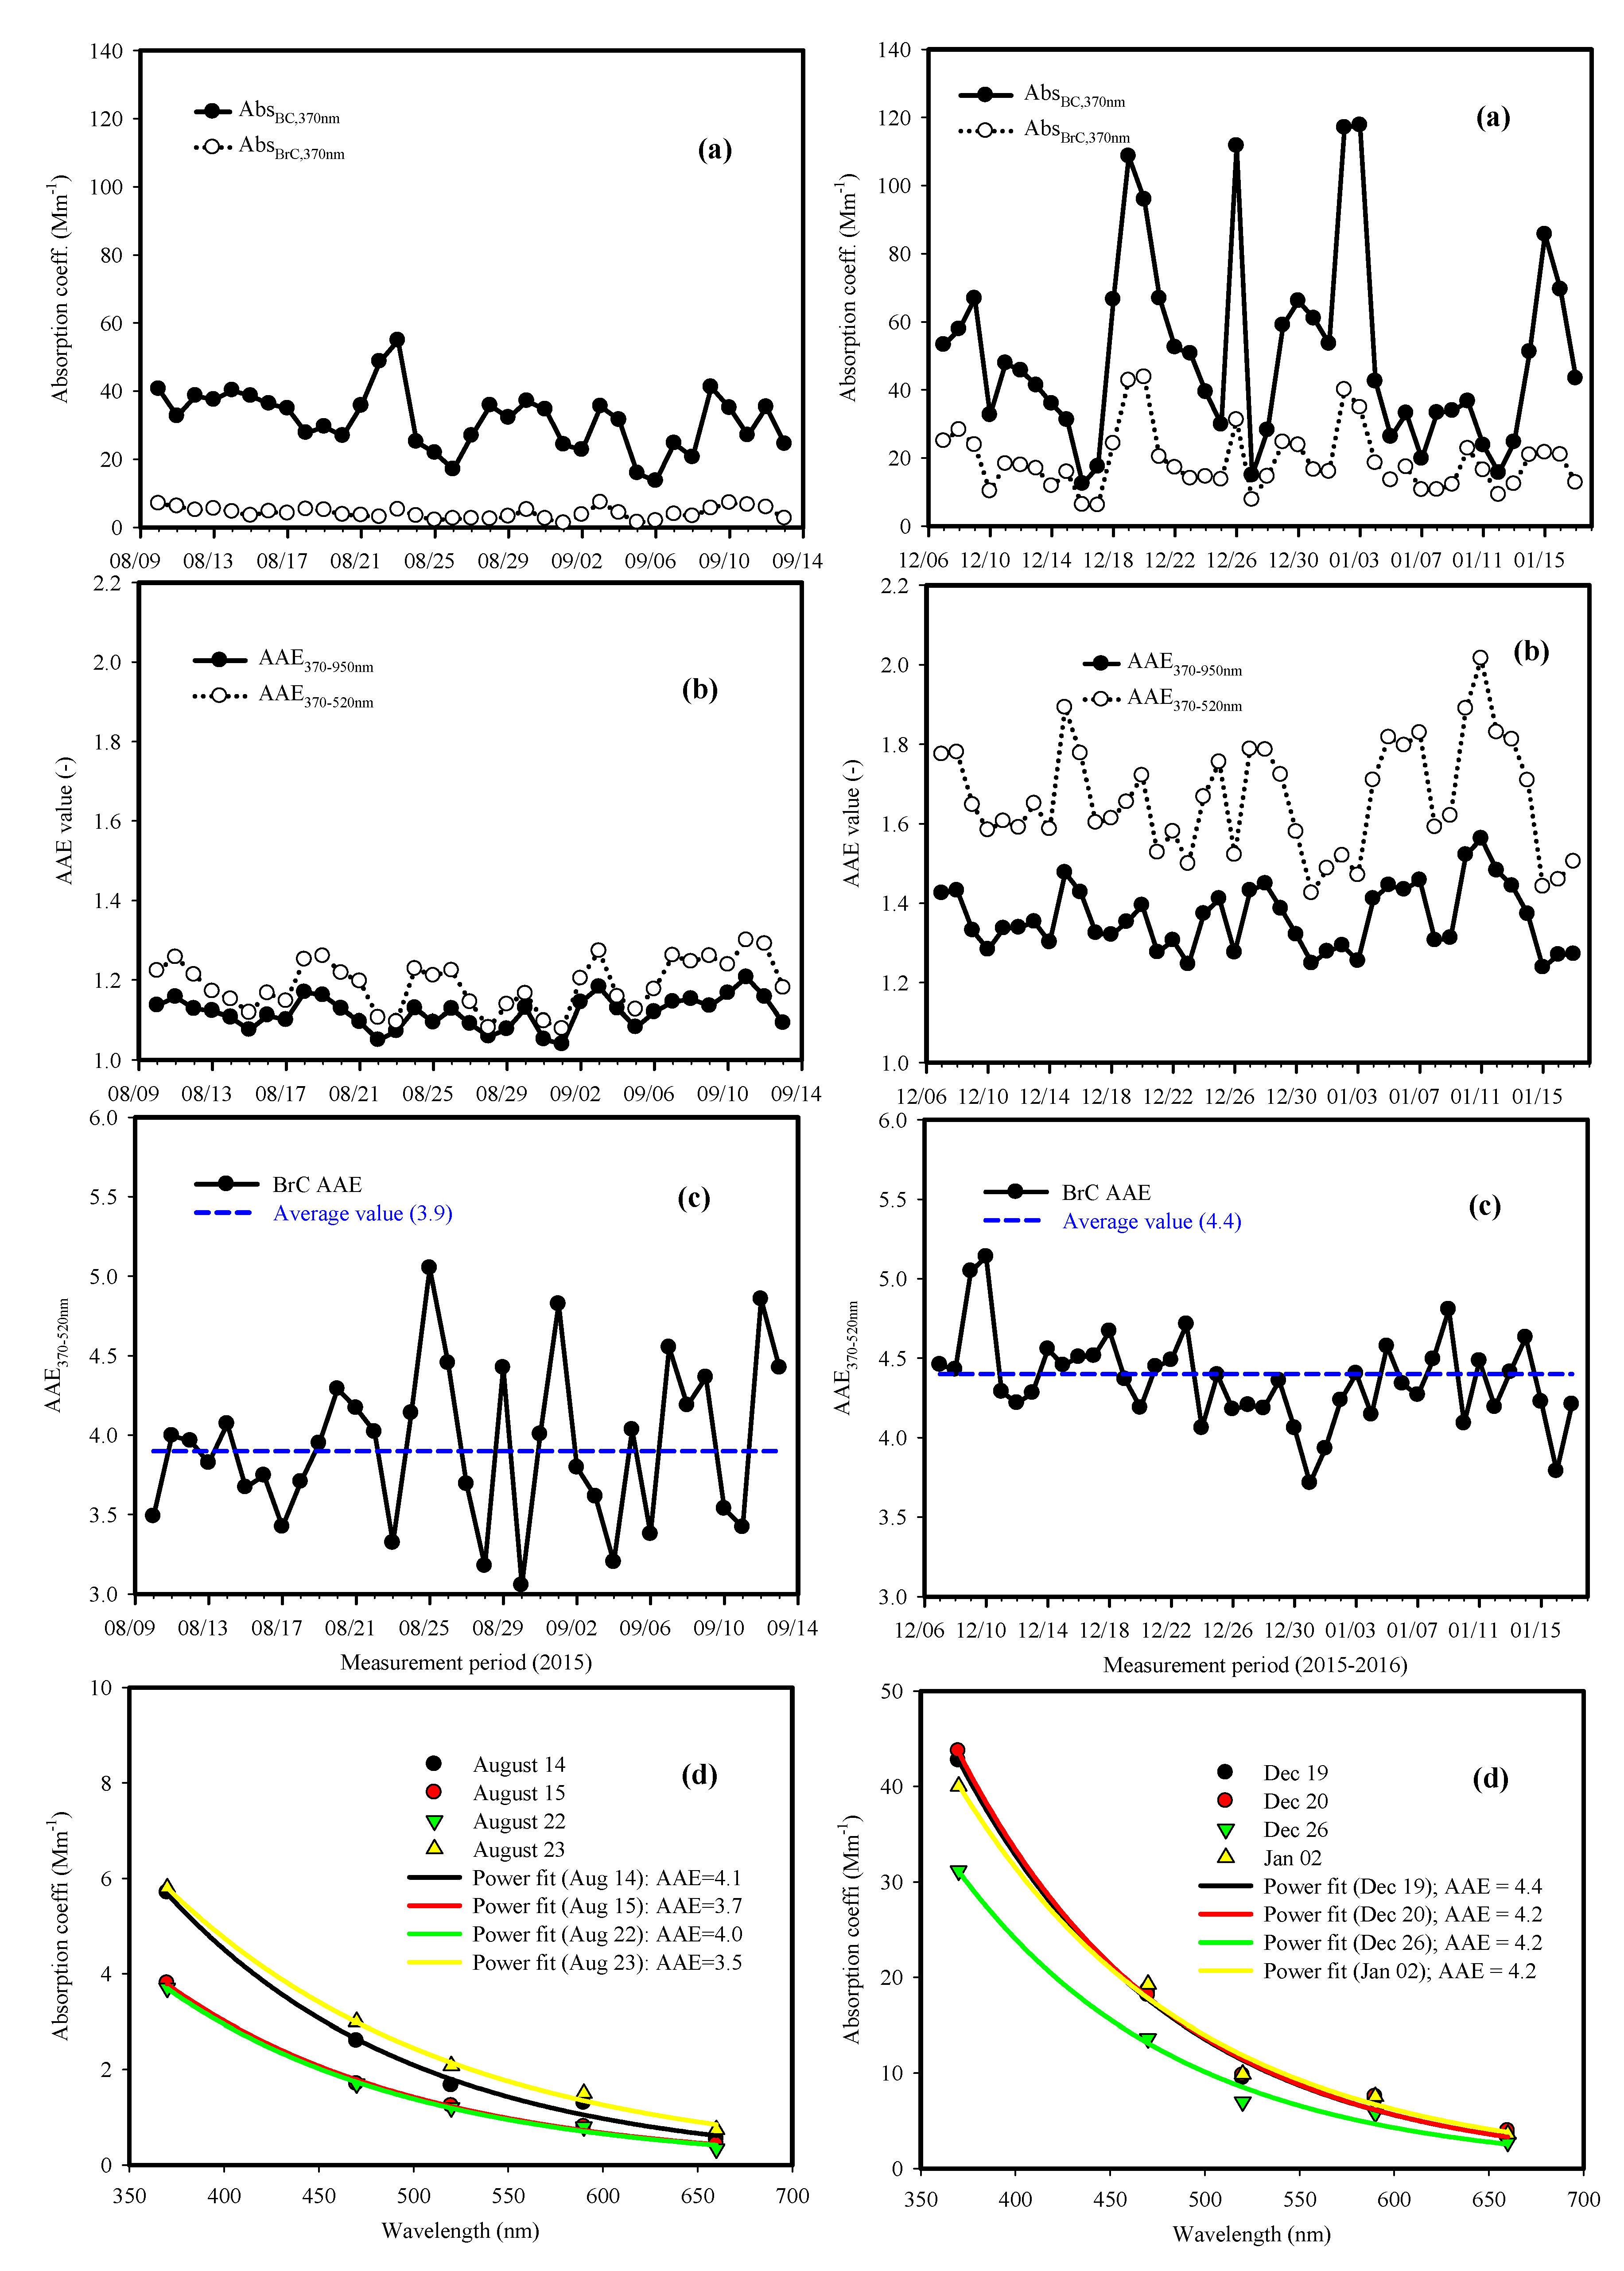
3.5. Optical Properties of Brown Light Absorbing Carbon at the CNU Site

Generally, it is known that fresh BC particles from vehicle emissions have aerosol absorption Ångström exponent (AAE) values close to 1.0, whereas light-absorbing organic aerosols (OAs) from fresh BB emissions have AAE values of approximately 2.0 or greater [7,49,70,76,77]. It has also been shown that these values vary with the biomass type and burning temperature [49,77,78]. It is well known that BC absorption exhibits a weak spectral dependence, but BrC shows a strong spectral dependence, with greater absorption in the near UV region [7]. Figure 9a shows the daily temporal profiles of absorption coefficients of BC (AbsBC,370nm) and BrC (AbsBrC,370nm) at 370 nm derived from the total aerosol absorption in the summer and winter at CNU. Figure 9b,c also represent the temporal variations in the AAE370–950nm and AAE370–520nm values and the BrC AAE values estimated in the wavelength ranges of 370–660 nm, respectively. AAE370–950nm and AAE370–520nm can be used to separate the aerosol absorption at IR wavelengths from that at near UV wavelengths. During the summer, the 24 h average AbsBC,370nm values (32 ± 9, 14–55 Mm−1) were greater than AbsBrC,370nm (4 ± 2, 1–7 Mm−1). The very low contribution of AbsBrC,370nm suggests that most aerosol absorption in the UV range during summer came from the BC absorption. However, the wintertime AbsBrC,370nm values (19 ± 9, 6–44 Mm−1) were significantly elevated compared to the summertime AbsBrC,370nm values. Moreover, the AbsBC,370nm (51 ± 28, 12–118 Mm−1) was considerably enhanced. The contribution of light absorption by BrC to the total aerosol absorption at 370 nm was 11% ± 3% (5–18%) during the summer and 29% ± 5% (21–41%) during the winter. The significant difference in AbsBrC,370nm between the summer and winter indicates an increased contribution of light-absorbing OA absorption to the total aerosol absorption during the winter. This enhanced light absorption by aerosols at shorter wavelengths (AbsBrC,370nm) during the winter indicates the presence of light-absorbing organic aerosols.
The average AAE370–950nm and AAE370–520nm values, which were calculated by performing a linear regression fit between ln(Absλ) and ln(λ) in the wavelength ranges of 370–950 nm and 370–520 nm, respectively, were 1.1 ± 0.0 (1.0–1.2) and 1.2 ± 0.1 (1.1–1.3) in the summer and 1.4 ± 0.1 (1.2–1.6) and 1.7 ± 0.1 (1.4–2.0) in the winter, respectively. As shown in Figure 9b, there was no significant difference between the aerosol AAE370–950nm and AAE370–520nm values during the summer, which also indicates that the light absorption by aerosol particles resulted mostly from BC aerosols. On the other hand, the enhanced AAE370–520nm values observed during the winter support a significant contribution of brown carbon absorption to the total aerosol absorption, indicating that the contribution of BB emissions at the site is greater in the winter.
Figure 9c shows the temporal change in AAE370–660 values for light-absorbing BrC during the summer and winter. The BrC AAE370–660nm values were calculated for the wavelengths of 370–660 nm by assuming BC AAE values of 1.0. Over the study period, a greater variation in the BrC AAE values was seen during the summer than during the winter. The average BrC AAE370–660 values were 3.9 ± 0.5 (3.1–5.1) during the summer and 4.4 ± 0.3 (3.7–5.1) during the winter (Table 1). The lower AAE values for BrC during the summer were due to a greater contribution of water-insoluble OAs, probably emitted from vehicles, to total aerosol absorption, rather than from water-soluble OAs. Many previous studies indicated that BB emissions have typical BrC AAE values of 6–8 due to a greater impact of water-soluble OC fractions [49,68,69,70,77,79]. Generally, previous studies reported that the AAE values of BrC-containing aerosols were lower than those of water-extracted BrC due to the contribution of the water-insoluble OC (WIOC) fraction [52,71,78]. Moreover, the WIOC fractions contribute more absorption than WSOC to the total light absorption [71] and are likely made up of high-molecular-weight PAHs emitted from the combustion of biomass materials and fossil fuels [71,78]. As shown in Figure 9d, the estimated BrC light absorption clearly exhibited a strong spectral dependence in the summer and winter pollution episodes, but there was stronger absorption by BrC aerosols at shorter wavelengths during the winter. The spectral dependence of BrC absorption showed an exponentially increasing tendency with decreasing wavelength.
It is well known that BrC particles containing water-soluble and insoluble fractions are emitted from the incomplete combustion of biomass materials [7,49,68,69,77] and fossil fuels (e.g., vehicle and ship emissions) [51,71,72,73,78] and produced in the atmosphere through a variety of chemical reactions involving volatile organic gases [80,81]. To elucidate the driving forces contributing to BrC light absorption, the relationships of AbsBrC,370nm with K+, OC, WSOC, WIOC, and SOC were examined. During summer, the highest correlation was obtained between the AbsBrC and WIOC (R2 = 0.26, p < 0.01), followed by the correlation between the AbsBrC and WSOC (R2 = 0.16). However, no relationship was found between the AbsBrC, BB tracer (K+, R2 = 0.00), and SOC (R2 = 0.10). Furthermore, a good correlation between the EC and WIOC was found (R2 = 0.58), implying that the WIOC and EC had similar sources—e.g., traffic emissions [11,40,51,52,71]. As described above, the moderate corrections of the WSOC with EC and POC and the good relationship between the AbsBrC,370nm and WIOC support the notion that brown light absorbing carbon from traffic emissions was an important contributor to the aerosol light absorption during the summer. However, the AbsBrC during the winter had strong-to-good correlations with the WIOC (R2 = 0.83), POC (R2 = 0.79), WSOC (R2 = 0.53), K+ (R2 = 0.38), and SOC (R2 = 0.32). These correlations indicate that the water-insoluble organic compounds from traffic emissions were an important contributor to the BrC absorption during the summer, while during the winter, various sources such as primary traffic, BB emissions, and SOA contribute to the light absorption by BrC aerosols.

4. Summary and Conclusions

The 24 h integrated filter-based measurements of the ambient PM2.5 were simultaneously made at two sites near roadways during the summer (10 August through 13 September, 2015) and winter (7 December 2015 through 17 January 2016) to investigate differences in the major chemical composition of the PM2.5 at the sites and to uncover important driving components and formation processes (local vs. regional) that lead to seasonal PM2.5 pollution episodes. The two sampling sites were located at distances of 15 (BKO site) and 150 m (CNU site) from busy roads. Aerosol light absorption coefficients with a time resolution of 1 min were also observed using a multi-wavelength aethalometer at the CNU site to verify the influence of emission sources (traffic vs. biomass burning) on the concentrations of fine organic aerosols measured during the two seasons.
The differences in the major chemical composition of the PM2.5 between the two sites arose from organic carbon aerosols. The OC concentrations during the summer and winter were observed to be higher at the BKO site, which was subject to a higher traffic density (27% higher) and shorter distance from the roadway than the CNU site, but no noticeable difference was found between the sites during the winter, which is attributable to the significant contributions of other sources (e.g., BB emissions) to the organic aerosol concentration.
During the summer, the high PM2.5 episodes exceeding the 24 h Korean PM2.5 standard were directly linked to the elevated OM and SO42− concentrations, which contributed 35–41% and 26–30% of the PM2.5 at the two sites. A tight correlation between the OC and EC, a negligible correlation between the brown carbon absorption at 370 nm (AbsBrC370nm) and K+ (R2 = 0.00), and little difference between the AAE370–950nm (1.1) and AAE370–520nm (1.2) values suggest that the carbonaceous aerosols observed during the summer at the two sites were greatly affected by primary traffic emissions. The summertime WSOC concentration was attributable to primary combustion emissions (e.g., traffics), with some influence of SOA formation. However, the SOC concentration, as estimated using a primary EC tracer method, accounted for 31% of the OC concentration at the BKO site, closer to the roadway, and 16% at the CNU site, further from the roadway. The importance of SO42− to the summertime PM2.5 pollution was attributed to the long-range transportation of aerosols from polluted regions of China rather than local production, as evidenced by both the MODIS images and the transport pathways of the air masses that reached the sites. The wintertime PM2.5 episodes, however, were associated with increases in the OM and NO3 concentrations, accounting for on average 26~28% (BKO site) and 22~23% (CNU site) of the PM2.5 concentration. A good correlation between the gaseous NO2 and NO3, along with weather conditions such as a low wind speed and high relative humidity, suggest that the wintertime particulate NO3 was caused by local production through the heterogeneous oxidation of NO2 on moist particles at the sites rather than the regional transport of aerosol particles. One interesting feature that was observed was the existence of two distinct slopes in the plots of OC vs. EC concentration in winter; one is associated with a significant contribution of traffic emissions, providing a lower OC/EC ratio (~3.0), while the other is strongly linked to BB and traffic emissions, resulting in a higher OC/EC ratio (~6.5). This was supported by the strong correlations between the OC and EC, the enhanced AAE370–520nm values, and an increased contribution of light-absorbing BrC particles to the total aerosol absorption. The wintertime WSOC was strongly associated with primary traffic and biomass burning emissions and SOA formation. The higher WSOC/OC values (0.49–0.54) during the winter also support the influence of BB emissions on the WSOC concentration. This was evidenced by the strong relationships of AbsBrC370nm with the WSOC and K+ and a substantial increase in the values of AAE370–520nm (1.4–2.0) during winter, which is an indicator of light-absorbing brown carbon particles that are linked to BB emissions.

Author Contributions

Conceptualization, S.P. and S.Y.C.; Data curation, S.P. and H.D.T.H.; Formal analysis, S.P. and H.D.T.H.; Funding acquisition, S.P.; Investigation, S.P., H.D.T.H. and M.-S.B.; Methodology, S.P. and H.D.T.H.; Project administration, S.P. and S.Y.C.; Resources, S.P., H.D.T.H. and M.-S.B.; Software, M.-S.B.; Supervision, S.P. and S.Y.C.; Validation, H.D.T.H. and M.-S.B.; Visualization, S.P.; Writing—original draft, S.P. and H.D.T.H.; Writing—review and editing, S.P. All authors have read and agreed to the published version of the manuscript.

Funding

This research was supported in part by the Basic Science Research Programs through the National Research Foundation of Korea (NRF) funded by the Ministry of Education (MOE) (NRF-2020R1I1A3A04036617), and in part by the Technology Development Program to Solve Climate Changes (2019M1A2A2103953) through NRF, both funded by the Ministry of Science and ICT.

Conflicts of Interest

The authors declare no conflict of interest.

References

  1. Cao, J.J.; Lee, S.C.; Ho, K.F.; Zhang, X.Y.; Zou, S.C.; Fung, K.; Chow, J.C.; Watson, J.G. Characteristics of carbonaceous aerosol in Pearl River Delta Region, China during 2001 winter period. Atmos. Environ. 2003, 37, 1451–1460. [Google Scholar] [CrossRef]
  2. Park, S.S.; Harrison, D.; Pancras, J.P.; Ondov, J. Time resolved elemental and organic carbon measurements at the Baltimore Supersite in 2002. J. Geophys. Res. Atmos. 2005, 110, D07S06. [Google Scholar] [CrossRef] [Green Version]
  3. Fuzzi, S.; Andreae, M.O.; Huebert, B.J.; Kulmala, M.; Bond, T.C.; Boy, M.; Doherty, S.J.; Guenther, A.; Kanakidou, M.; Kawamura, K.; et al. Critical assessment of the current state of scientific knowledge, terminology, and research needs concerning the role of organic aerosols in the atmosphere, climate, and global change. Atmos. Chem. Phys. 2006, 6, 2017–2038. [Google Scholar] [CrossRef] [Green Version]
  4. Polidori, A.; Turpin, B.J.; Lim, H.J.; Cabada, J.C.; Subramanian, R.; Pandis, S.N.; Robinson, A.L. Local and regional secondary organic aerosol: Insights from a year of semi-continuous carbon measurements at Pittsburgh. Aerosol Sci. Technol. 2006, 40, 861–872. [Google Scholar] [CrossRef]
  5. Ramanathan, V.; Carmichael, G. Global and regional climate changes due to black carbon. Nat. Geosci. 2008, 1, 221–227. [Google Scholar] [CrossRef]
  6. Kumar, A.; Ramb, K.; Ojhac, N. Variations in carbonaceous species at a high-altitude site in western India: Role of synoptic scale transport. Atmos. Environ. 2016, 125, 371–382. [Google Scholar] [CrossRef]
  7. Laskin, A.; Laskin, J.; Nizkorodov, S.A. Chemistry of atmospheric brown carbon. Chem. Rev. 2015, 115, 4335–4382. [Google Scholar] [CrossRef] [Green Version]
  8. Zhao, M.; Qiao, T.; Huang, Z.; Zhu, M.; Xu, W.; Xiu, G.; Tao, J.; Lee, S. Comparison of ionic and carbonaceous compositions of PM 2.5 in 2009 and 2012 in Shanghai, China. Sci. Total Environ. 2015, 536, 695–703. [Google Scholar] [CrossRef]
  9. Novakov, T.; Menon, S.; Kirchstetter, T.W.; Koch, D.; Hansen, J.E. Aerosol organic carbon to black carbon ratios: Analysis of published data and implications for climate forcing. J. Geophys. Res. 2005, 110, D21205. [Google Scholar] [CrossRef]
  10. Park, S.S.; Cho, S.Y. Tracking sources and behaviors of water-soluble organic carbon in fine particulate matter measured at an urban site in Korea. Atmos. Environ. 2011, 45, 60–72. [Google Scholar] [CrossRef]
  11. Park, S.S.; Schauer, J.J.; Cho, S.Y. Sources and their contribution to two water-soluble organic carbon fractions at a roadway site. Atmos. Environ. 2013, 77, 348–357. [Google Scholar] [CrossRef]
  12. Park, S.S.; Cho, S.Y.; Bae, M.S. Source identification of water-soluble organic aerosols at a roadway site using positive matrix factorization analysis. Sci. Total Environ. 2015, 533, 410–421. [Google Scholar] [CrossRef]
  13. Park, S.S.; Lee, K.H. Characterization and sources of black carbon in PM2.5 at a site close to a roadway in Gwangju, Korea, during winter. Environ. Sci. Process. Impacts 2015, 17, 1794–1805. [Google Scholar] [CrossRef]
  14. Seinfeld, J.H.; Pandis, S.N. Atmospheric Chemistry and Physics: From Air Pollution to Climate Change, 2nd ed.; John Wiley & Sons, Inc.: New York, NY, USA, 2006. [Google Scholar]
  15. Park, S.S.; Kleissl, J.; Harrison, D.; Kumar, V.; Nair, N.P.; Adam, M.; Ondov, J.; Parlange, M. Characteristics of PM2.5 episodes revealed by semi-continuous measurements at the Baltimore Supersite at Ponca St. Aerosol Sci. Technol. 2006, 40, 845–860. [Google Scholar] [CrossRef] [Green Version]
  16. Cao, J.J.; Shen, Z.X.; Chow, J.C.; Watson, J.G.; Lee, S.C.; Tie, X.X.; Ho, K.F.; Wang, G.H.; Han, Y.M. Winter and summer PM2.5 chemical compositions in fourteen Chinese Cities. J. Air Waste Manag. Assoc. 2012, 62, 1214–1226. [Google Scholar] [CrossRef] [PubMed]
  17. Zhang, T.; Cao, J.J.; Tie, X.X.; Shen, Z.X.; Liu, S.X.; Ding, H.; Han, Y.M.; Wang, G.H.; Ho, K.F.; Qiang, J.; et al. Water-soluble ions in atmospheric aerosols measured in Xi’an, China: Seasonal variations and sources. Atmos. Res. 2011, 102, 110–119. [Google Scholar] [CrossRef]
  18. Zhang, R.; Jing, J.; Tao, J.; Hsu, S.C.; Wang, G.; Cao, J.; Lee, C.S.L.; Zhu, L.; Chen, Z.; Zhao, Y.; et al. Chemical characterization and source apportionment of PM2.5 in Beijing: Seasonal perspective. Atmos. Chem. Phys. 2013, 13, 7053–7074. [Google Scholar] [CrossRef] [Green Version]
  19. Zhang, J.K.; Sun, Y.; Liu, Z.R.; Ji, D.S.; Hu, B.; Liu, Q.; Wang, Y.S. Characterization of submicron aerosols during a month of serious pollution in Beijing, 2013. Atmos. Chem. Phys. 2014, 14, 2887–2903. [Google Scholar] [CrossRef] [Green Version]
  20. He, H.; Wang, Y.S.; Ma, Q.X.; Ma, J.Z.; Chu, B.W.; Ji, D.S.; Tang, G.Q.; Liu, C.; Zhang, H.X.; Hao, J.M. Mineral dust and NOx promote the conversion of SO2 to sulfate in heavy pollution days. Sci. Rep. 2014, 4, 4172. [Google Scholar] [CrossRef]
  21. Guo, S.; Hu, M.; Zamora, M.L.; Peng, J.F.; Shang, D.J.; Zheng, J.; Fu, Z.F.; Wu, Z.J.; Shao, M.; Zeng, L.M.; et al. Elucidating severe urban haze formation in China. Proc. Natl. Acad. Sci. USA 2014, 111, 17373–17378. [Google Scholar] [CrossRef] [Green Version]
  22. Ji, D.S.; Li, L.; Wang, Y.S.; Zhang, J.K.; Cheng, M.T.; Sun, Y.; Liu, Z.R.; Wang, L.L.; Tang, G.Q.; Hu, B.; et al. The heaviest particulate air-pollution episodes occurred in northern China in January, 2013: Insights gained from observation. Atmos. Environ. 2014, 92, 546–556. [Google Scholar] [CrossRef]
  23. Sun, Y.L.; Jiang, Q.; Wang, Z.F.; Yin, Y. Investigation of the sources and evolution processes of severe haze pollution in Beijing in January 2013. J. Geophys. Res. 2014, 119, 420–425. [Google Scholar] [CrossRef]
  24. Yu, G.H.; Cho, S.Y.; Bae, M.S.; Lee, K.H.; Park, S.S. Investigation of PM2.5 pollution episodes in Gwangju. J. Korean Soc. Atmos. Environ. 2015, 31, 269–286, (In Korean with English abstract). [Google Scholar] [CrossRef] [Green Version]
  25. Liu, Y.C.; Wu, Z.; Wang, Y.; Xiao, Y.; Gu, F.; Zheng, J.; Tan, T.; Shang, D.; Wu, Y.; Zeng, L.; et al. Submicrometer particles are in the liquid state during heavy haze episodes in the urban atmosphere of Beijing, China. Environ. Sci. Technol. Lett. 2017, 4, 427–432. [Google Scholar] [CrossRef]
  26. Yu, G.-H.; Park, S.S.; Park, J.S.; Park, S.M.; Song, I.H.; Oh, J.; Shin, H.J.; Lee, M.D.; Lim, H.B.; Kim, H.W.; et al. Pollution characteristics of PM2.5 observed during winter and summer in Baengryeongdo and Seoul. J. Korean Soc. Atmos. Environ. 2018, 34, 38–55, (In Korean with English abstract). [Google Scholar] [CrossRef]
  27. Park, S.S.; Jung, S.A.; Gong, B.J.; Cho, S.Y.; Lee, S.J. Characteristics of PM2.5 haze episodes revealed by highly time-resolved measurements at an air pollution monitoring Supersite in Korea. Aerosol Air Qual. Res. 2013, 13, 957–976. [Google Scholar] [CrossRef]
  28. Park, S.S.; Kim, S.J.; Gong, B.J.; Cho, S.Y.; Kim, J.C.; Lee, S.J. Investigation on a haze episode of fine particulate matter using semi-continuous chemical composition data. J. Korean Soc. Atmos. Environ. 2013, 29, 642–655, (In Korean with English abstract). [Google Scholar] [CrossRef] [Green Version]
  29. Sun, Y.; Wang, Z.; Fu, P.; Jiang, Q.; Yang, T.; Li, J.; Ge, X. The impact of relative humidity on aerosol composition and evolution processes during wintertime in Beijing, China. Atmos. Environ. 2013, 77, 927–934. [Google Scholar] [CrossRef]
  30. Wang, H.; Xu, J.; Zhang, M.; Yang, Y.; Shen, X.; Wang, Y.; Chen, D.; Guo, J. A study of the meteorological causes of a prolonged and severe haze episode in January 2013 over central eastern China. Atmos. Environ. 2014, 98, 146–157. [Google Scholar] [CrossRef]
  31. Wang, J.D.; Wang, S.X.; Jiang, J.K.; Ding, A.J.; Zheng, M.; Zhao, B.; Wong, D.C.; Zhou, W.; Zheng, G.; Wang, L. Impact of aerosol-meteorology interactions on fine particle pollution during China’s severe haze episode in January 2013. Environ. Res. Lett. 2014, 9, 094002. [Google Scholar] [CrossRef]
  32. Ma, J.; Chu, B.; Liu, J.; Liu, Y.; Zhang, H.; He, H. NOx promotion of SO2 conversion to sulfate: An important mechanism for the occurrence of heavy haze during winter in Beijing. Environ. Pollut. 2018, 233, 662–669. [Google Scholar] [CrossRef]
  33. Yu, G.H.; Park, S.S.; Jung, S.A.; Jo, M.R.; Lim, Y.J.; Shin, H.J.; Lee, S.B.; Ghim, Y.S. Investigation on Characteristics of high PM2.5 pollution occurred during October 2015 in Gwangju. J. Korean Soc. Atmos. Environ. 2018, 34, 567–587, (In Korean with English abstract). [Google Scholar] [CrossRef]
  34. Yu, G.H.; Lee, B.J.; Park, S.S.; Jung, S.A.; Jo, M.R.; Lim, Y.J.; Kim, S. A case study of severe PM2.5 event in the Gwangju urban area during February 2014. J. Korean Soc. Atmos. Environ. 2019, 35, 195–213, (In Korean with English abstract). [Google Scholar] [CrossRef]
  35. Saxena, M.; Sharma, A.; Sen, A.; Saxena, P.; Saraswati, P.; Mandal, T.K.; Sharma, S.K.; Sharma, C. Water soluble inorganic species of PM10 and PM2.5 at an urban site of Delhi, India: Seasonal variability and sources. Atmos. Res. 2017, 184, 112–125. [Google Scholar] [CrossRef]
  36. Zhao, P.S.; Dong, F.; He, D.; Zhao, X.J.; Zhang, X.L.; Zhang, W.Z.; Yao, Q.; Liu, H.Y. Characteristics of concentrations and chemical compositions for PM2.5 in the region of Beijing, Tianjin, and Hebei, China. Atmos. Chem. Phys. 2013, 13, 4631–4644. [Google Scholar] [CrossRef] [Green Version]
  37. Tian, S.L.; Pan, Y.P.; Wang, Y.S. Size-resolved source apportionment of particulate matter in urban Beijing during haze and non-haze episodes. Atmos. Chem. Phys. 2016, 16, 1–19. [Google Scholar] [CrossRef] [Green Version]
  38. Wang, G.; Zhang, R.; Gomez, M.E.; Yang, L.; Levy Zamora, M.; Hu, M.; Lin, Y.; Peng, J.; Guo, S.; Meng, J.; et al. Persistent sulfate formation from London Fog to Chinese haze. Proc. Natl. Acad. Sci. USA 2016, 113, 13630–13635. [Google Scholar] [CrossRef] [PubMed] [Green Version]
  39. Zhang, R.; Sun, X.; Shi, A.; Huang, Y.; Yan, J.; Nie, T.; Yan, X.; Li, X. Secondary inorganic aerosols formation during haze episodes at an urban site in Beijing, China. Atmos. Environ. 2018, 177, 275–282. [Google Scholar] [CrossRef]
  40. Park, S.S.; Son, S.C. Relationship between carbonaceous components and aerosol light absorption during winter at an urban site of Gwangju, Korea. Atmos. Res. 2017, 185, 73–83. [Google Scholar] [CrossRef]
  41. Zhu, Y.; Hinds, W.C. Concentration and size distribution of ultrafine particles near a major highway. J. Air Waste Manag. Assoc. 2002, 52, 1032–1042. [Google Scholar] [CrossRef]
  42. Zhu, Y.; Hinds, W.C.; Kim, S.; Shen, S.; Sioutas, C. Study of ultrafine particles near a major highway with heavy-duty diesel traffic. Atmos. Environ. 2002, 36, 4323–4335. [Google Scholar] [CrossRef]
  43. Morawska, L.; Tomas, S.; Gilbert, D.; Greenaway, C.; Rijnders, E. A study of the horizontal and vertical profile of submicrometer particles in relation to a busy road. Atmos. Environ. 1999, 33, 1261–1274. [Google Scholar] [CrossRef]
  44. Hitchins, J.; Morawska, L.; Wolff, R.; Gilbert, D. Concentrations of submicrometre particles from vehicle emissions near a major road. Atmos. Environ. 2000, 34, 51–59. [Google Scholar] [CrossRef] [Green Version]
  45. Ghim, Y.S.; Won, S.R.; Choi, Y.; Chang, Y.S.; Jin, H.C.; Kim, Y.P.; Kang, C.H. Concentration variations in primary and secondary particulate matter near a major road in Korea. Asian J. Atmos. Environ. 2016, 10, 32–41. [Google Scholar] [CrossRef] [Green Version]
  46. Gwangju Metropolitan City. A Report of Basic Survey on the Volume Traffic in Gwangju in 2015; Gwangju City: Gwangju, Korea, 2016. [Google Scholar]
  47. Drinovec, L.; Močnik, G.; Zotter, P.; Prévôt, A.S.H.; Ruckstuhl, C.; Coz, E.; Rupakheti, M.; Sciare, J.; Müller, T.; Wiedensohler, A.; et al. The “dualspot” Aethalometer: An improved measurement of aerosol black carbon with real-time loading compensation. Atmos. Meas. Tech. 2015, 8, 1965–1979. [Google Scholar] [CrossRef] [Green Version]
  48. Martinsson, J.; Eriksson, A.C.; Elbæk Nielsen, I.; Berg Malmborg, V.; Ahlberg, E.; Andersen, C.; Lindgren, R.; Nyström, R.; Nordin, E.Z.; Brune, W.H.; et al. Impacts of combustion conditions and photochemical processing on the light absorption of biomass combustion aerosol. Environ. Sci. Technol. 2015, 49, 14663–14671. [Google Scholar] [CrossRef]
  49. Park, S.; Yu, G.H.; Bae, M.S. Effects of combustion condition and biomass type on the light absorption of fine organic aerosols from fresh biomass burning emissions over Korea. Environ. Pollut. 2020, 265, 114841. [Google Scholar] [CrossRef]
  50. NIOSH. Method 5040 issue 1: Elemental carbon (diesel exhaust). In NIOSH Manual of Analytical Methods, 4th ed.; National Institute of Occupational Safety and Health: Cincinnati, OH, USA, 1996. [Google Scholar]
  51. Park, S.; Yu, G.H.; Lee, S. Optical absorption characteristics of brown carbon aerosols during the KORUS-AQ campaign at an urban site. Atmos. Res. 2018, 203, 16–27. [Google Scholar] [CrossRef]
  52. Park, S.; Son, S.C.; Lee, S. Characterization, sources, and light absorption of fine organic aerosols during summer and winter at an urban site. Atmos. Res. 2018, 213, 370–380. [Google Scholar] [CrossRef]
  53. Kim, B.M.; Teffera, S.; Zeldin, M.D. Characterization of PM25 and PM10 in the South Coast Air Basin of Southern California: Part 1—Spatial variations. J. Air Waste Manag. Assoc. 2000, 50, 2034–2044. [Google Scholar] [CrossRef]
  54. Yao, X.; Chan, C.K.; Fang, M.; Cadle, S.; Chan, T.; Mulawa, P.; He, K.; Ye, B. The water-soluble ionic composition of PM 2.5 in Shanghai and Beijing, China. Atmos. Environ. 2002, 36, 4223–4234. [Google Scholar] [CrossRef]
  55. Cho, S.Y.; Park, S.S. Resolving sources of water-soluble organic carbon in fine particulate matter measured during winter at an urban site. Environ. Sci. Process. Impacts 2013, 15, 524–534. [Google Scholar] [CrossRef] [PubMed]
  56. Turpin, B.J.; Lim, H.J. Species Contributions to PM2.5 mass concentrations: Revisiting common assumptions for estimating organic mass. Aerosol Sci. Technol. 2001, 35, 602–610. [Google Scholar] [CrossRef]
  57. Cao, J.; Lee, S.C.; Ho, K.F.; Zou, S.C.; Fung, K.; Li, Y.; Watson, J.G.; Chow, J.C. Spatial and seasonal variations of atmospheric organic carbon and elemental carbon in Pearl River Delta Region, China. Atmos. Environ. 2004, 38, 4447–4456. [Google Scholar] [CrossRef]
  58. Ram, K.; Sarin, M.M.; Tripathi, S.N. One-year record of carbonaceous aerosols from an urban location (Kanpur) in the Indo-Gangetic Plain: Characterization, sources and temporal variability. J. Geophys. Res. 2010, 115, D24313. [Google Scholar] [CrossRef]
  59. Wang, J.; Ho, S.S.H.; Cao, J.; Huang, R.; Zhou, J.; Zhao, Y.; Xu, H.; Liu, S.; Wang, G.; Shen, Z.; et al. Characteristics and major sources of carbonaceous aerosols in PM2.5 from Sanya, China. Sci. Total Environ. 2015, 530–531, 110–119. [Google Scholar] [CrossRef]
  60. Lim, H.J.; Turpin, B.J. Origins of primary and secondary organic aerosols in Atlanta: Results of time-resolved measurements during the Atlanta supersite experiment. Environ. Sci. Technol. 2002, 36, 4489–4496. [Google Scholar] [CrossRef]
  61. Jaffrezo, J.L.; Aymoz, G.; Delaval, C.; Cozic, J. Seasonal variation of the water soluble organic carbon mass fraction of aerosol in two valleys of the French Alps. Atmos. Chem. Phys. 2005, 5, 2809–2821. [Google Scholar] [CrossRef] [Green Version]
  62. Miyazaki, Y.; Kondo, Y.; Takegawa, N.; Komazaki, Y.; Fukuda, M.; Kawamura, K.; Mochida, M.; Okuzawa, K.; Weber, R.J. Time-resolved measurements of water-soluble organic carbon in Tokyo. J. Geophys. Res. 2006, 111, D23206. [Google Scholar] [CrossRef] [Green Version]
  63. Sullivan, A.P.; Weber, R.J. Chemical characterization of the ambient organic aerosol soluble in water: 1. Isolation of hydrophilic and hydrophobic fractions with a XAD-8 resin. J. Geophys. Res. 2006, 111, D05314. [Google Scholar] [CrossRef] [Green Version]
  64. Ho, K.F.; Lee, S.C.; Cao, J.J.; Li, Y.S.; Chow, J.C.; Watson, J.G.; Fung, K. Variability of organic and elemental carbon, water soluble organic carbon, and isotopes in Hong Kong. Atmos. Chem. Phys. 2006, 6, 4569–4576. [Google Scholar] [CrossRef] [Green Version]
  65. Weber, R.J.; Sullivan, A.P.; Peltier, R.E.; Russell, A.; Yan, B.; Zheng, M.; de Gouw, J.; Warneke, C.; Brock, C.; Holloway, J.S.; et al. A study of secondary organic aerosol formation in the anthropogenic-influenced southeastern United States. J. Geophys. Res. 2007, 112, D13302. [Google Scholar] [CrossRef]
  66. Miyazaki, Y.; Kondo, Y.; Han, S.; Koike, M.; Kodama, D.; Komazaki, Y.; Tanimoto, H.; Matsueda, H. Chemical characteristics of water-soluble organic carbon in the Asian outflow. J. Geophys. Res. 2007, 112, D22S30. [Google Scholar] [CrossRef]
  67. Park, S.S.; Sim, S.Y.; Bae, M.S.; Schauer, J.J. Size distribution of water-soluble components in particulate matter emitted from biomass burning. Atmos. Environ. 2013, 73, 62–72. [Google Scholar] [CrossRef]
  68. Fan, X.; Wei, S.; Zhu, M.; Song, J.; Peng, P. Comprehensive characterization of humic-like substances in smoke PM2.5 emitted from the combustion of biomass materials and fossil fuels. Atmos. Chem. Phys. 2016, 16, 13321–13340. [Google Scholar] [CrossRef] [Green Version]
  69. Park, S.S.; Yu, J. Chemical and light absorption properties of humic-like substances from biomass burning emissions under controlled combustion experiments. Atmos. Environ. 2016, 136, 114–122. [Google Scholar] [CrossRef]
  70. Yu, J.; Yu, G.H.; Park, S.; Bae, M.S. Chemical and absorption characteristics of water-soluble organic carbon and humic-like substances in size-segregated particles from biomass burning emissions. Asian J. Atmos. Environ. 2017, 11, 1–11. [Google Scholar] [CrossRef]
  71. Zhang, X.; Lin, Y.H.; Surratt, J.D.; Weber, R.J. Sources, composition and absorption Angstrom exponent of light-absorbing organic components in aerosol extracts from the Los Angeles Basin. Environ. Sci. Technol. 2013, 47, 3685–3693. [Google Scholar] [CrossRef]
  72. Yu, G.H.; Park, S.; Shin, S.K.; Lee, K.H.; Nam, H.G. Enhanced light absorption due to aerosol particles in ship plumes observed at a seashore site. Atmos. Pollut. Res. 2018, 9, 1177–1183. [Google Scholar] [CrossRef]
  73. Yu, G.H.; Park, S.; Lee, K.H. Light Absorption characteristics of fine particles using a real-time optical absorption measurement instrument at a seashore wharf. J. Korean Soc. Atmos. Environ. 2019, 35, 564–576. [Google Scholar] [CrossRef]
  74. Jung, J.; Kim, Y. Tracking sources of severe haze episodes and their physicochemical and hygroscopic properties under Asian continental outflow: Long range transport pollution, post-harvest biomass burning, and Asian dust. J. Geophys. Res. 2011, 116, D02206. [Google Scholar] [CrossRef]
  75. Rolph, G.; Stein, A.; Stunder, B. Real-time environmental applications and display system: Ready. Environ. Model. Softw. 2017, 95, 210–228. [Google Scholar] [CrossRef]
  76. Kirchstetter, T.W.; Novakov, T.; Hobbs, P.V. Evidence that spectral dependence of light absorption by aerosols is affected by organic carbon. J. Geophys. Res. 2004, 109, D21208. [Google Scholar] [CrossRef] [Green Version]
  77. Xie, M.; Hay, M.D.; Holder, A.L. Light-absorbing organic carbon from prescribed and laboratory biomass burning and gasoline vehicle emissions. Sci. Rep. 2017, 7, 7318. [Google Scholar] [CrossRef] [Green Version]
  78. Chen, T.; Bond, T.C. Light absorption by organic carbon from wood combustion. Atmos. Chem. Phys. 2010, 10, 1773–1787. [Google Scholar] [CrossRef] [Green Version]
  79. Lei, Y.; Shen, Z.; Zhang, T.; Zhang, Q.; Wang, Q.; Sun, J.; Gong, X.; Cao, J.; Xu, H.; Liu, S.; et al. Optical source profiles of brown carbon in size-resolved particulate matter from typical domestic biofuel burning over Guanzhong Plain, China. Sci. Total Environ. 2018, 622–623, 244–251. [Google Scholar] [CrossRef]
  80. Xie, M.; Chen, X.; Holder, A.L.; Hays, M.D.; Lewandowski, M.; Offenberg, J.H.; Kleindienst, T.E.; Jaoui, M.; Hannigan, M.P. Light absorption of organic carbon and its sources at a southeastern U.S. location in summer. Environ. Pollut. 2019, 244, 38–46. [Google Scholar] [CrossRef]
  81. Ye, Z.; Qu, Z.; Ma, S.; Luo, S.; Chen, Y.; Chen, H.; Chen, Y.; Zhao, Z.; Chen, M.; Ge, X. A comprehensive investigation of aqueous-phase photochemical oxidation of 4-ethylphenol. Sci. Total Environ. 2019, 685, 976–985. [Google Scholar] [CrossRef]
Figure 1. The two sampling locations (Buk-Ku District Office (BKO) and Chonnam National University campus (CNU)) and traffic volume around the BKO site.
Applsci 10 04858 g001
Figure 2. Hourly total traffic density of (a) all vehicles at the BKO and CNU sites, (b) passenger vehicles at BKO, and (c) diesel vehicles at BKO.
Applsci 10 04858 g002
Figure 3. Diurnal patterns of aerosol absorption coefficients at 370 and 880 nm during the summer and winter at CNU.
Applsci 10 04858 g003
Figure 4. Temporal variations in PM2.5 and its major chemical constituents’ concentrations during the summer (left graphs) and winter periods (right graphs) at the two sites.
Applsci 10 04858 g004
Figure 5. Temporal variations in the ambient temperature, relative humidity (RH), and wind speed during the summer and winter.
Applsci 10 04858 g005
Figure 6. Temporal profiles of (a) CO and (b) NO2, and (c) the relationship between the 24 h averaged NO2 and NO3 concentrations during winter at the CNU site.
Applsci 10 04858 g006
Figure 7. Regression relationships between the organic and elemental carbon (OC and EC) concentrations during the summer and winter at the BKO and CNU sites.
Applsci 10 04858 g007
Figure 8. MODIS images and transport pathways of air masses arriving at the sampling site during the summer and winter pollution episodes. Red, blue, and green lines on air-parcel back-trajectories represent the pathways of air masses at heights of 500, 1000, and 1500 m AGL (above ground level).
Applsci 10 04858 g008
Figure 9. Absorption coefficients of BC and brown carbon (BrC) at 370 nm (a), absorption Ångström exponent (AAE) values (b), BrC AAE values (c), and wavelength-dependent absorption coefficients (d) during the summer and winter for the CNU site.
Applsci 10 04858 g009
Table 1. Summary of fine particulate matter (PM2.5) and its carbonaceous and water-soluble ionic species during the summer and winter at the two sampling sites.
Sampling SiteCNU SiteBKO Site
SummerWinterSummerWinter
ParametersRange
(µg/m3)
Mean
(µg/m3)
Range
(µg/m3)
Mean
(µg/m3)
Range
(µg/m3)
Mean
(µg/m3)
Range
(µg/m3)
Mean
(µg/m3)
PM2.58.8–61.924.211.0–93.734.69.8–62.626.39.5–91.134.9
OC2.0–6.84.11.4–12.25.03.1–8.85.41.2–12.25.5
EC0.7–2.61.50.4–2.01.00.9–2.31.60.4–1.81.1
WSOC1.0–2.71.91.0–6.02.51.8–4.22.80.8–6.22.6
OC/EC2.1–4.32.82.4–9.15.12.6–4.93.42.7–9.55.2
WSOC/OC0.22–0.460.380.32–0.820.540.24–0.590.420.31–0.700.49
WSOC/EC0.80–2.251.361.0–4.882.671.39–2.441.821.13–4.572.46
NH4+0.1–11.12.41.0–13.44.20.2–9.32.40.8–12.94.0
K+0.03–0.610.150.07–0.680.240.03–0.600.140.08–0.710.25
Cl0.01–0.300.050.28–2.050.600.01–0.250.050.22–1.820.55
NO30.2–10.31.81.2–27.78.80.5–8.82.01.2–26.28.4
SO42−0.6–24.68.11.4–22.96.00.7–29.47.81.2–22.36.2
OxalateN.D.–0.260.14N.D.–0.400.13N.D.–0.420.19N.D.–0.370.14
NSS K+0.01–0.580.120.07–0.660.230.03–0.550.130.07–0.700.24
∑SIS (1)1.2–45.812.23.6–64.019.01.3–42.512.33.5–61.418.5
NO3/SO420.05–0.790.290.57–4.061.550.06–1.090.380.51–4.01.47
(1) ∑SIS represents the total concentration of secondary ions, including NH4+, NO3, and SO42−.

