Vertical Measurement of Equivalent Black Carbon Concentration at Low Altitude

School of Mechanical Engineering, Korea University of Technology and Education (KOREATECH), Byeongcheon-myeon, Cheonan 31253, Korea
*
Author to whom correspondence should be addressed.
Appl. Sci. 2020, 10(15), 5142; https://0-doi-org.brum.beds.ac.uk/10.3390/app10155142
Submission received: 7 July 2020
/
Revised: 23 July 2020
/
Accepted: 24 July 2020
/
Published: 27 July 2020
(This article belongs to the Special Issue Air Pollution II)
Abstract
:The vertical profile of equivalent black carbon (eBC) concentrations has been measured together with the temperature up to 130 m above ground level at several locations. A hexacopter was deployed for the measurement of eBC, and the temperature on typical days in winter, spring, summer and early autumn. We observed high eBC concentrations between 10 m and 90 m above ground level, which was related to the vertical distribution of temperature. We examined that the measurement noise could be reduced by using a box-average scheme. Furthermore, the negative values at low eBC concentration could be removed for an averaging time of 30 min or longer.
1. Introduction
Monitoring air quality, using small sensors onboard a drone is very complicated, not only for constraints, such as power consumption, weight and propeller effect, but also because of sensor dependence on the pollution sources [1]. The aerosol light absorption of black carbon (BC) is an important measure to quantify the solar radiation toward the earth. In addition, BC is related to environmental climate change, as well as the air quality. At pristine sites, such as remote mountains, small amount of light absorbing aerosols have the potential for thawing permanent snow. The interactions of BC with the atmosphere and light strongly depend on the distribution of BC in the atmosphere. Usually, BC concentration is measured on the ground by a filter-based technique in the form of the equivalent BC (eBC) concentration, which derives mass concentrations associated with absorption coefficient. Light absorption by BC can be measured by a multiangle absorption photometer (MAAP) or an aethalometer which basically use Beer-Lambert law for quantification [2,3]. Among them, the MAAP is effective in that it corrects scattering artifacts. However, the MAAP still suffers from high noise when the aerosol concentration is low. To overcome the shortcomings of any filter-based techniques, corrections have been made by applying various schemes [4,5,6,7,8]. In this situation, it is needed to ascertain the eBC concentration at tens of meters above ground level (agl) because the atmosphere at low altitude is highly related to the air quality on the ground level. Vertical measurement of eBC concentration, using balloons, have already been studied by other research groups [9,10]. The elevation of a balloon, however, may be affected by air drift caused by the turbulence of wind; therefore, it would be difficult to detect BC at the exact position along the vertical axis of elevation. There are several studies for vertical profiles of air pollutants measured using a fixed-wing unmanned aerial vehicle (FW-UAV) [11,12]. However, measurements using FW-UAVs are dangerous near the ground level where most people live. Therefore, measurements of BC using a hexacopter are conducted in this study to investigate short-range vertical profiles of BC starting from the ground level to about 100 m in altitude.
Drones offer a new approach to large scale air pollution elimination that will be able to autonomously monitor and remove pollutants that are already in existence in the environment [13]. Drones can offer a high resolution spatiotemporal sampling, which is not feasible with manned aircraft. Some drone systems are more flexible than others, with the ability to carry multiple sensors and operate at different flight modes (hybrid rotary/fixed wing designs) [1]. Even more, a drone is used to measure a plume of volcanic degassing with the help of arrays for the measurement of multiple gas species such as CO2, SO2 and H2O [14]. Liu et al. (2020) performed vertical profile measurements of PM2.5 and BC by using a hexacopter unmanned aerial vehicle (UAV) for 23 days in the course of 2 months in 2018 in Macau, China and reported that higher particle concentrations, but less pronounced vertical variations were observed in February than those in March [15]. Another study shows that a multi-rotor drone, carrying a remote-controlled whole air sampling device, collects aerial samples with high sample integrity and preservation conditions [16]. A particle collection system was installed on a multicopter UAV for in situ measurement of the concentration of aerosol particles such as pollen grains and spores in the atmospheric boundary layer (ABL) [17]. The utility of a quadrotor unmanned aircraft system (UAS) was explored as a sampling platform to measure vertical and horizontal concentration gradients of trace gases and aerosol particles at high spatial resolution (1 m) within the mixed layer (0−100 m) [18]. A drone provides a lightweight, low-cost and easy controllable system for bioaerosol research too [19].
As we surveyed, drones are used to measure atmospheric pollutants in a high altitude where the concentrations are probably lower than those in the ground level. In addition, it is likely that the noise level of measurement becomes high at low eBC concentration. Therefore, it is needed to reduce such noise for better analysis.
In this study, we demonstrate the vertical profiles of eBC concentrations and temperatures at low altitude from the ground level in typical days selected during winter, spring, summer and early autumn. To reduce the noise of eBC measurement, we suggest a simple way to estimate an averaging time which is physically reasonable.
2. Materials and Methods
2.1. Measurement of eBC Concentration Using a Drone-Based BC Sensor at KOREATECH Campus
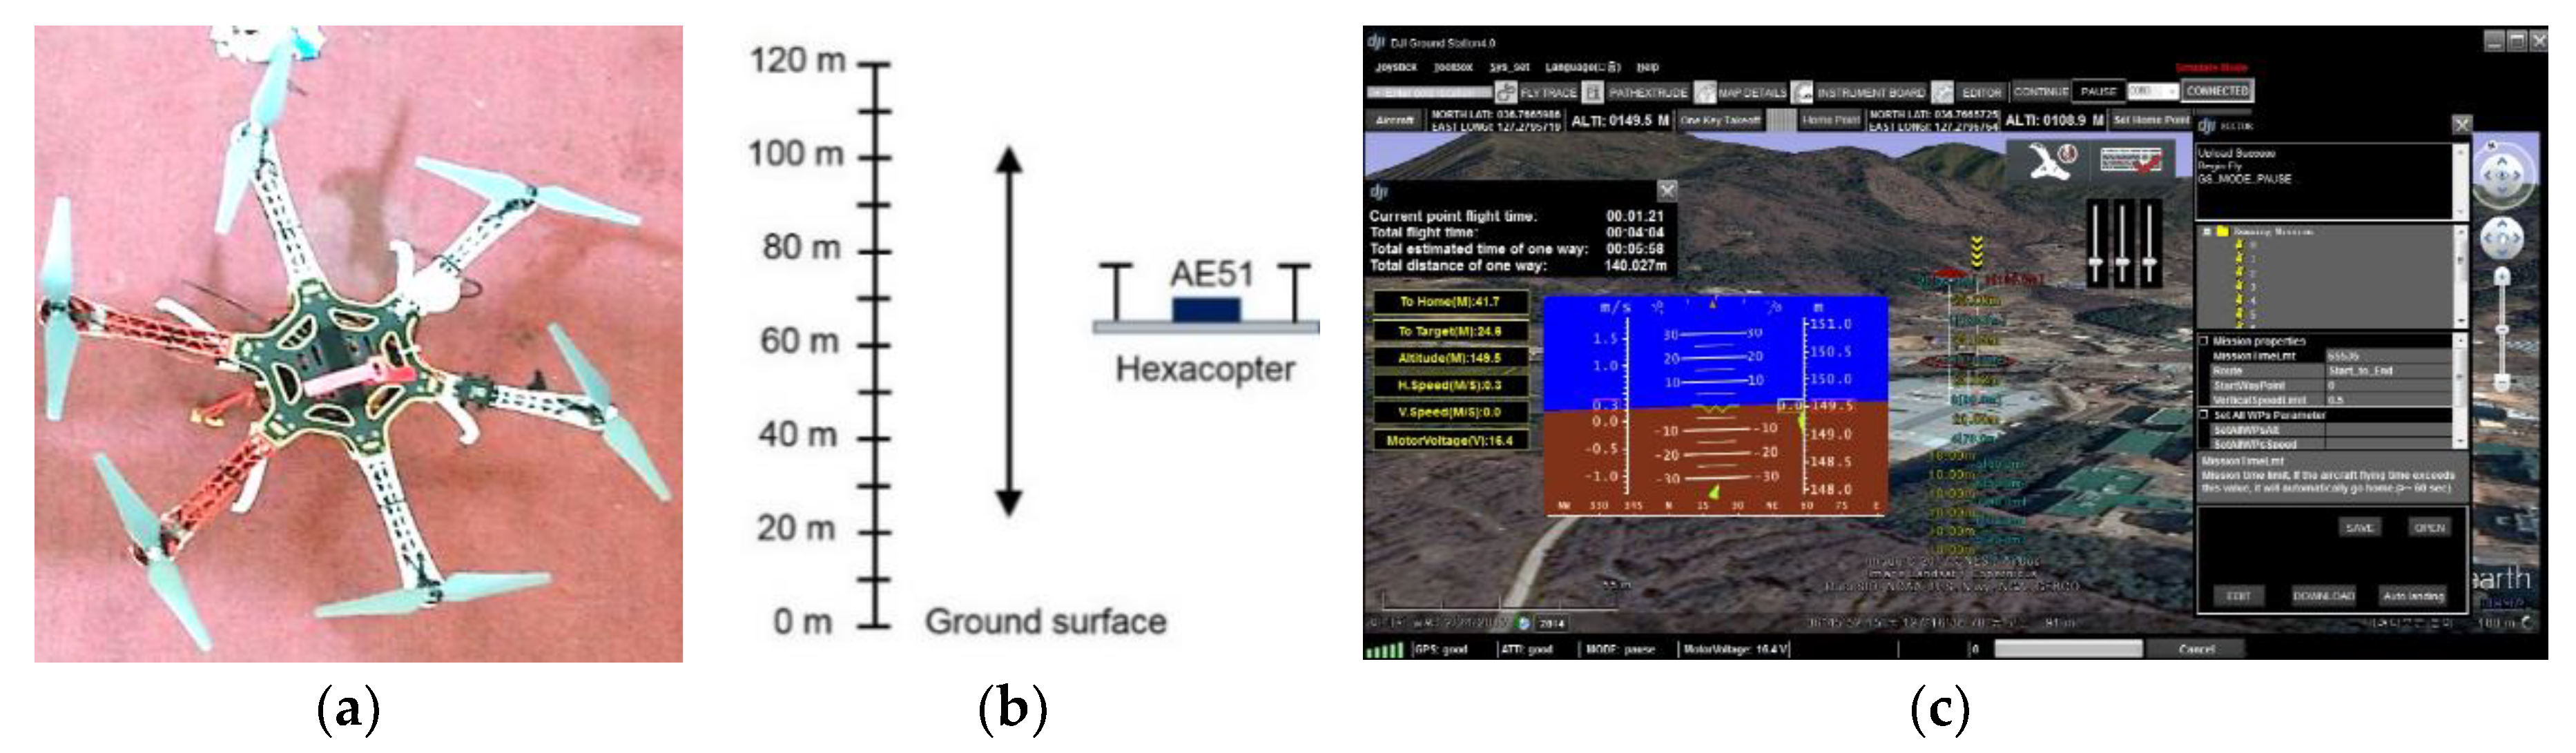
Figure 1 shows the drone used in this study and the snapshot of a program for drone control. A micro-aethalometer (microAeth AE51, AethLabs) weighing approximately 0.3 kg was used for the eBC measurements. The wavelength of the light source is 880 nm. BC was collected and analyzed on a filter strip consisting of a T60 Teflon coated borosilicate glass fiber media housed in a protective casing. To measure the vertical profile of eBC concentration, AE51 and a battery pack were loaded onto the hexacopter (DJI F550), which weighed approximately 2.0 kg in total and could aviate for about 13–15 min depending on weather condition with fully charged batteries. The hexacopter used in this study was modified and built for our experiments. Testo 174H was used to measure the temperature. Testo 174H uses a thermocouple as a probe. The range of measurement is −20 ℃ to 70 ℃. The resolution of temperature measurement is 0.1 °C.
While, a hexacopter can cover an altitude range from the ground to 600 m agl, a FW-UAV aircraft can cover an altitude range from 150 m above the ground to around 2000 m above sea level. The blade diameter of our hexacopter was 0.22 m. The empty weight and the takeoff weight were 0.5 kg, and 2.0 kg, respectively. The maximum operation altitude was about 1000 m. The maximum horizontal and vertical velocities were both 14 m/s. A Graupner MZ-24 controller was used for stable aviation. The control of ascent, descent and hovering is quite straightforward. Naza-M Assistant Software (v2.40) controlled our drone to make an automatic vertical ascent, hovering for a while and descent to the ground. When hovering at a certain position, our drone discharged the thrust equivalent to the weight of the drone at the measurement altitude. Instantaneous changes in wind direction and speed made the position of our drone shift momentarily, but it became stable shortly in a new posture with a help of a compensation scheme by the controller.
At the measurement altitude, our drone was hovering about 4–5 min to measure the eBC and the temperature, which were recorded every minute. The measurement was done in three ways depending on the battery status. First, the measurement height has been selected at random order. For example, the measurement was done at 10 m, 50 m, 20 m, 70 m and then 30 m, etc. This is defined as the random mode. Second, the measurement altitude increases from the ground to 130 m agl in sequence as the drone goes up and this is defined as the ascending mode. Third, the measurement altitude decreases from 130 m agl to the ground in sequence as the drone comes down, and this is defined as the descending mode.
2.2. Location of Measurement and Time Frame Together with Wind Velocity and Wind Direction
The eBC concentrations were measured at various altitudes in KOREATECH campus (36°45′59.4″ N 127°16′50.9″ E) for 5 days representing winter, spring, summer and early autumn. We selected February 28th as a representative day of a late winter. In spring, the measurement was done on April 30th. Summer has been getting longer recently, so we chose multiple days. In early summer, the measurement was done on May 27th and June 21st. To represent late summer and early autumn, the measurement was done on August 19th. The average wind speeds and directions were calculated from the 10 min released data obtained from the website of Korea Meteorological Administration (KMA, http://www.weather.go.kr/weather/observation/aws_table_popup.jsp).
2.3. Measuement at a Mountain
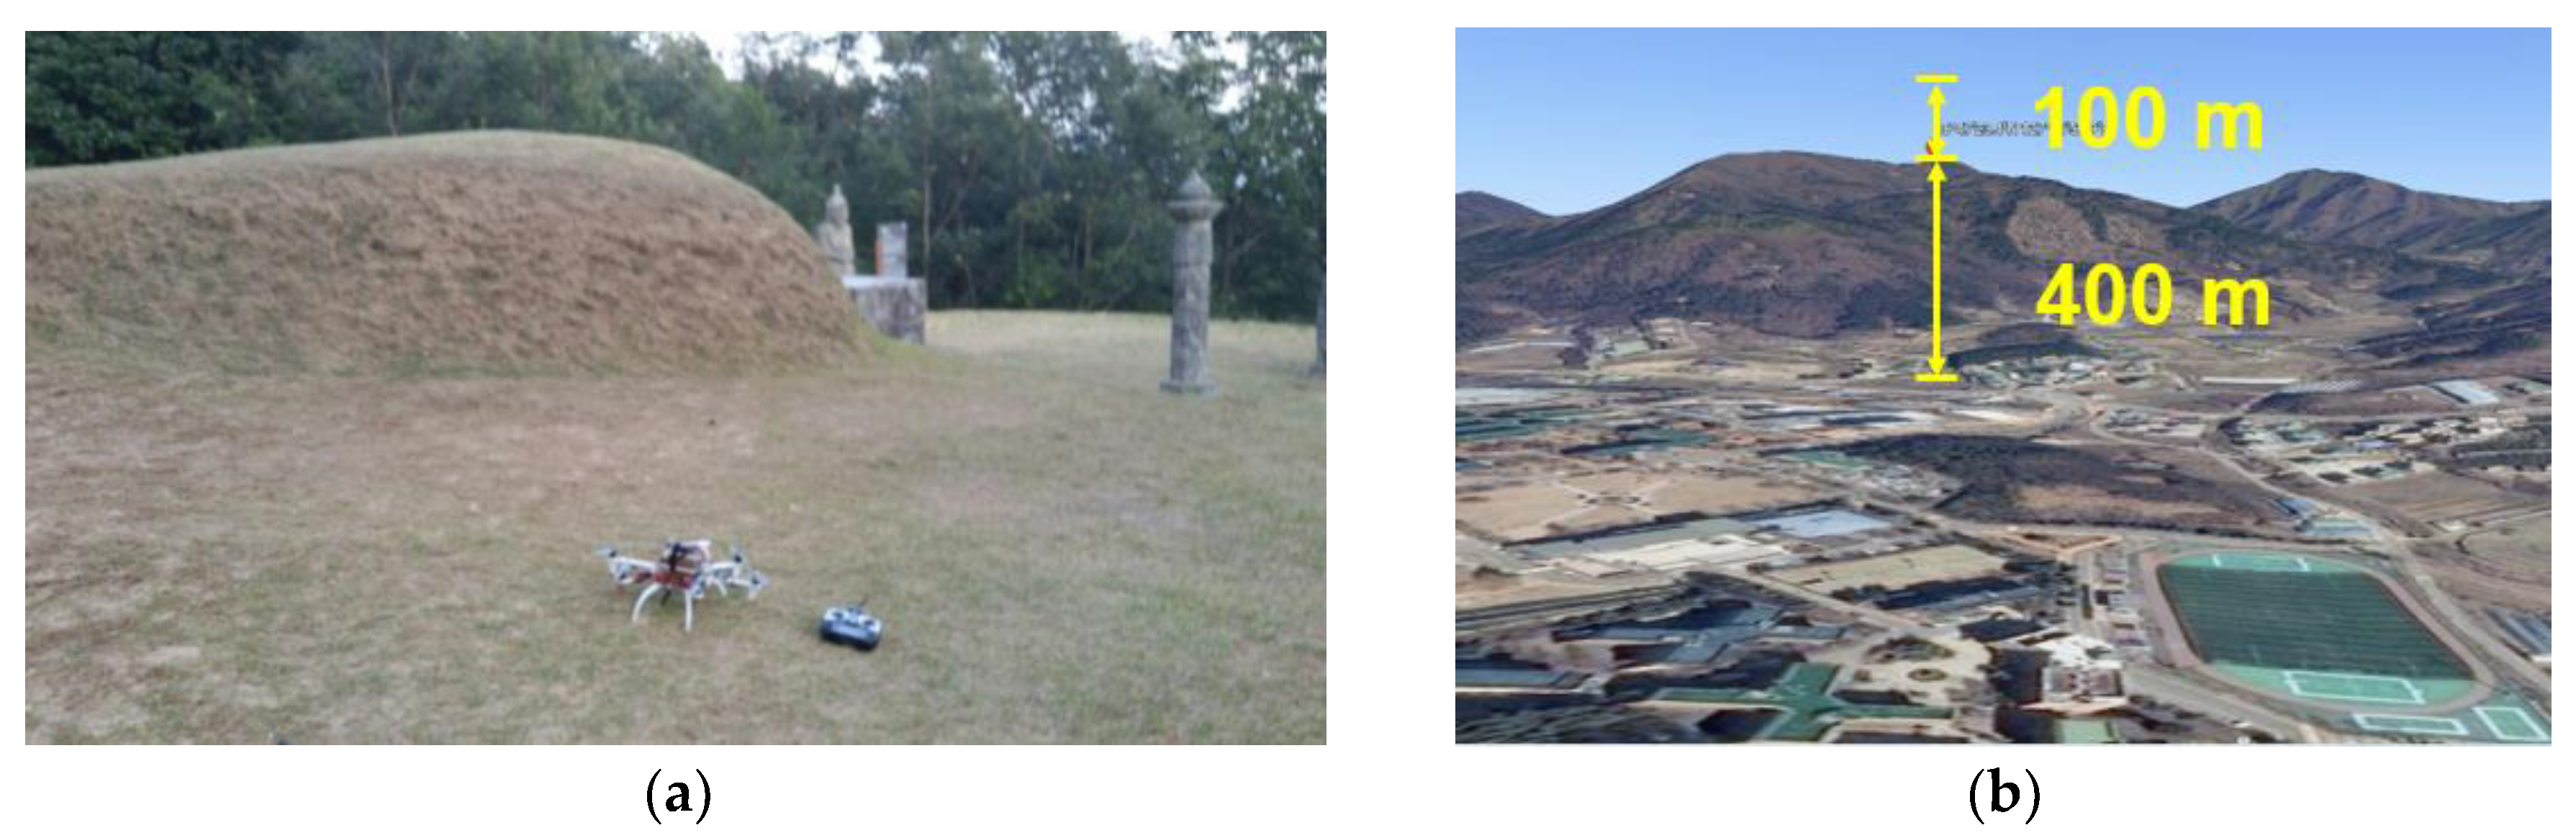
The eBC concentrations were measured at Eun Seok Mountain (36°46′58.5″ N 127°16′58.5″ E) near KOREATECH campus. A large grave tomb near the top of the Eun Seok Mountain (approximately at an altitude of 400 m) provides a safe place to land our hexacopter as shown in Figure 2a. Figure 2b shows that we elevated our hexacopter to 100 m higher than the height of the top of the Eun Seok Mountaion. Our hexacomper was used to check the level of eBC concentrations at a mountain where the altitude was 400–500 m. Even though the mountain was not considered to be high, we need to approximately estimate the level of the eBC concentration at a usual mountain site. At the measurement altitude, drone was hovering about 4–5 min to measure eBC concentrations, which were recorded every minute.
3. Results and Discussion
3.1. eBC Concentrations and Temperatures in Winter, Spring, Summer and Early Autumn
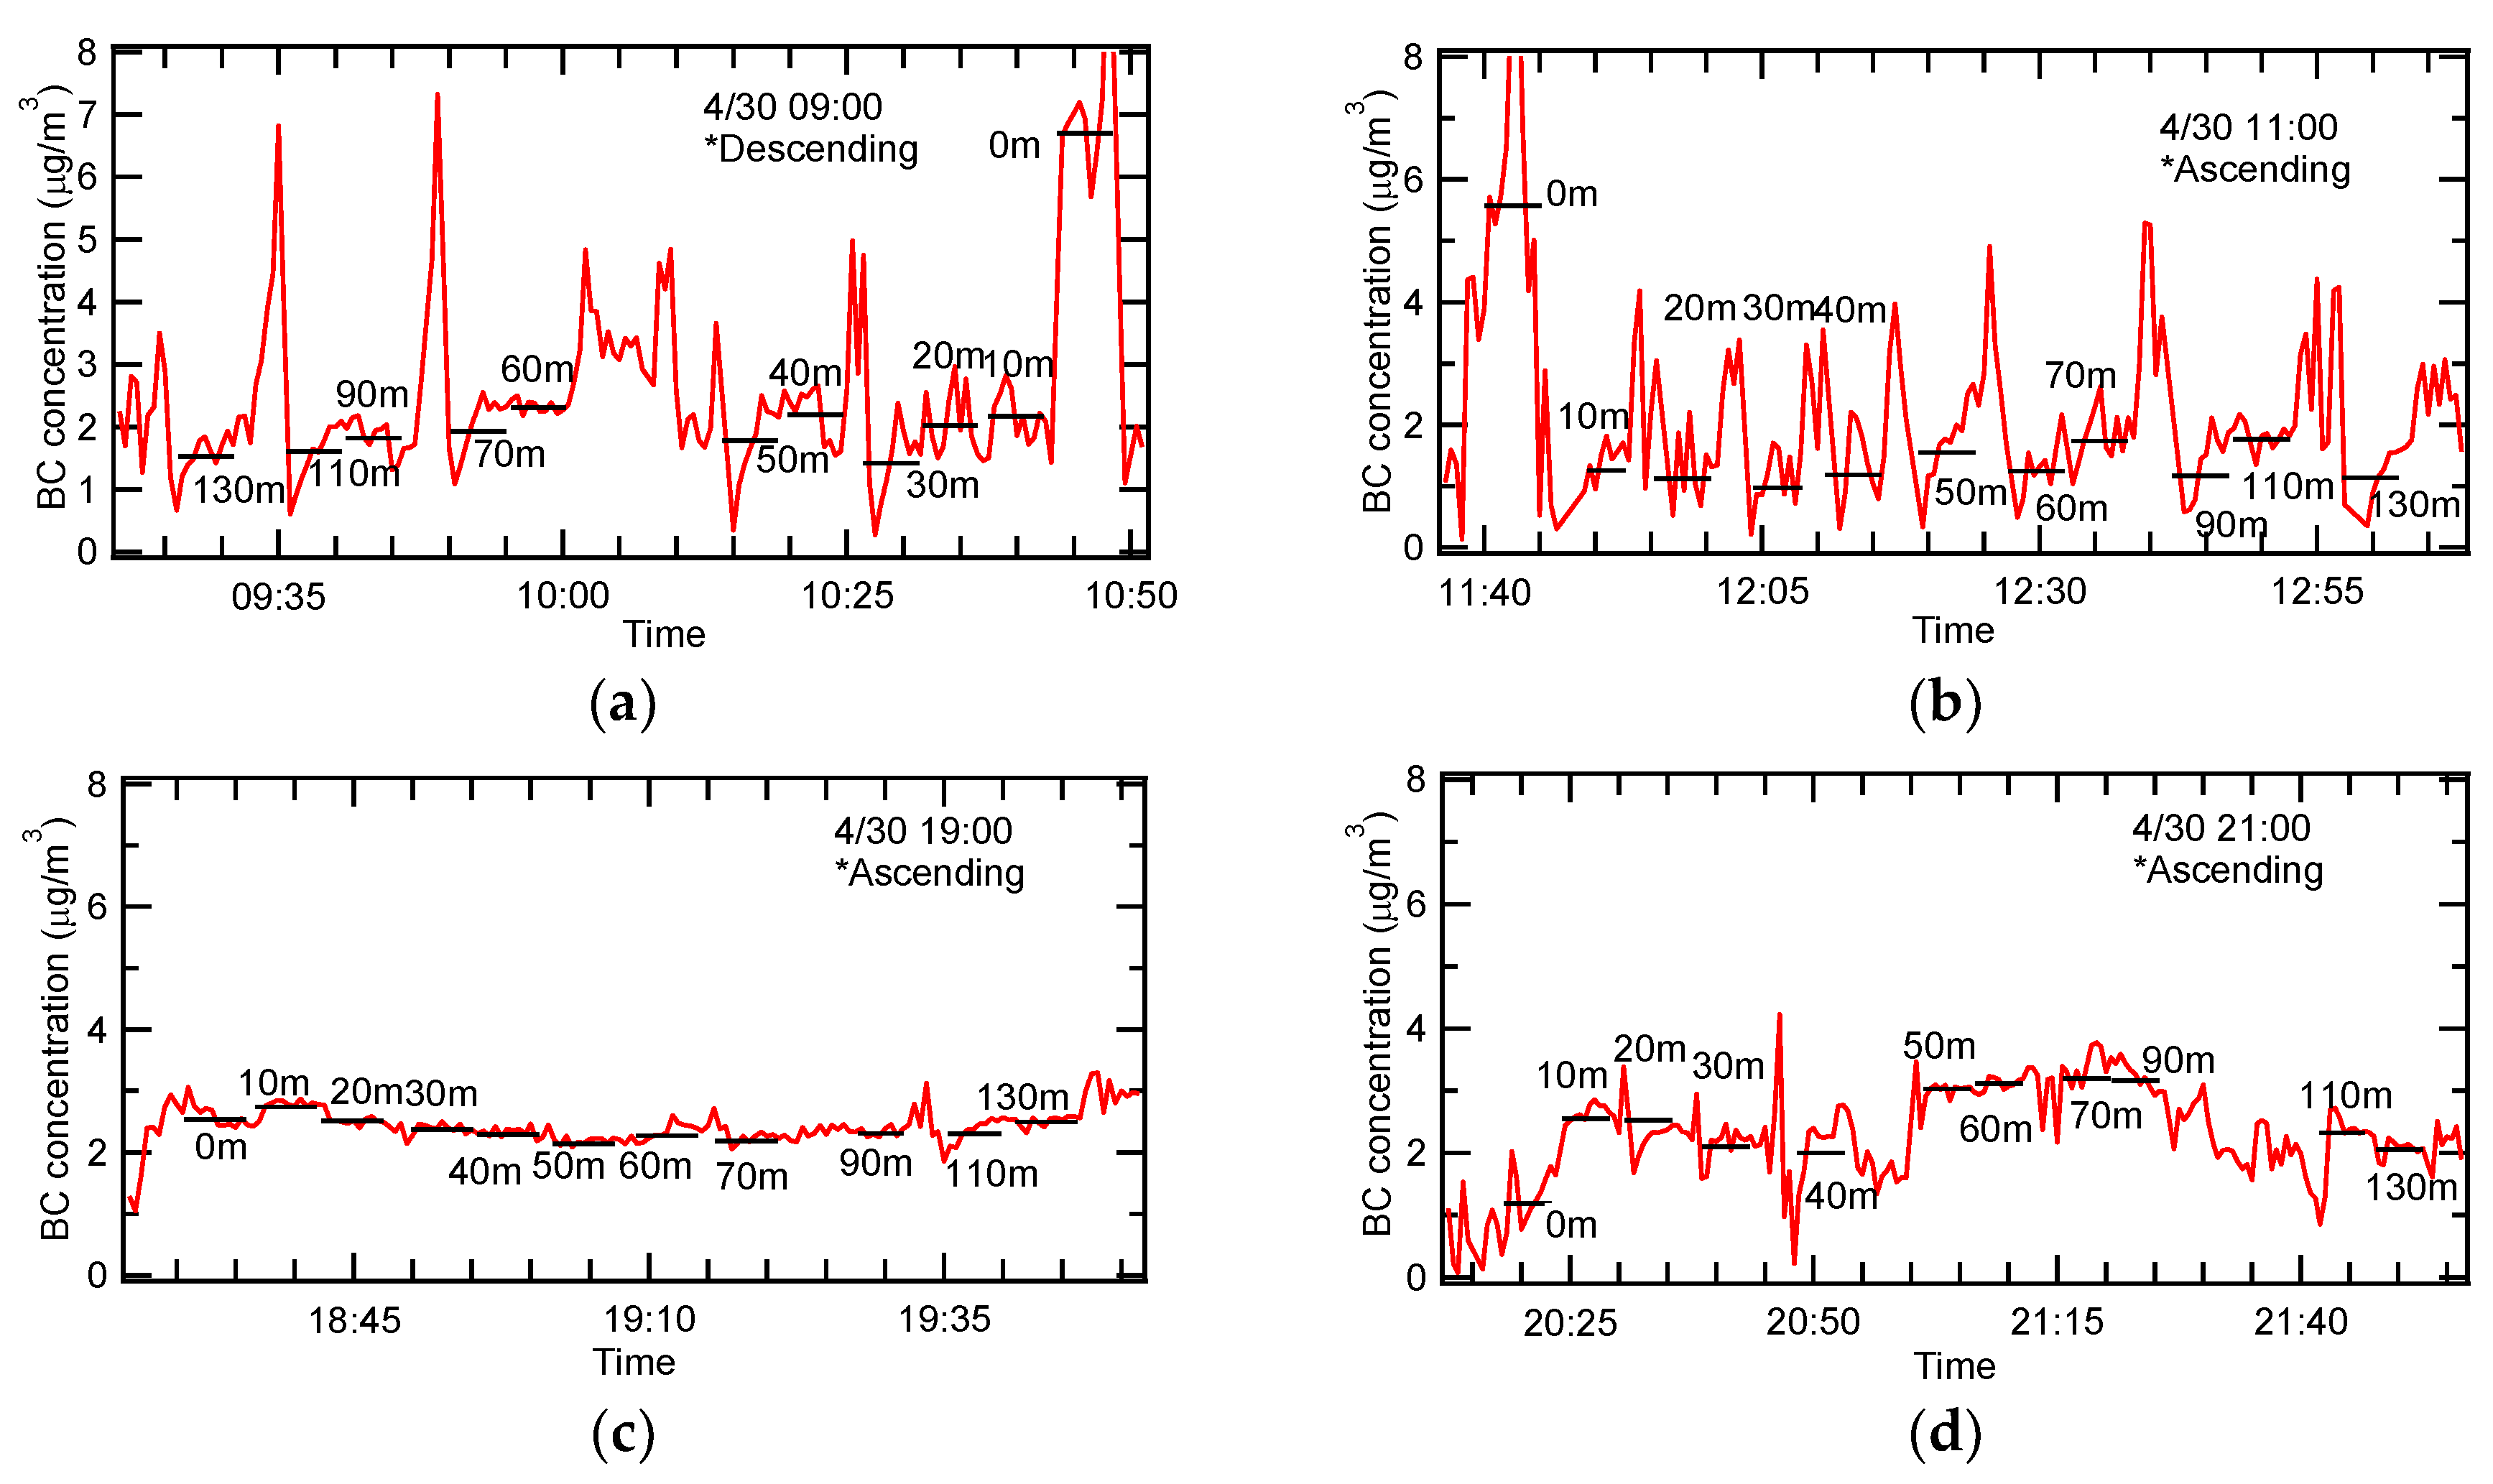
Data shown in Figure 3 are examples of typical characteristics of diurnal evolution of eBC concentrations measured at various altitudes in April 30th, 2017. The eBC concentrations were measured to be noisy in the morning and noon though less noisy in the evening. Most of high spikes around 9:35, 9:50, 10:45, 10:50, 11: 45, 11:55, 12:25, 12:40 and 12:55, as shown in the morning (Figure 3a,b), turned out to be measured on the ground level while batteries were manually being changed. In this case, the peak concentrations were similar to the eBC concentration on the ground. In the morning, the eBC concentration was observed highest at the ground level. In the evening, however, the eBC concentration at the ground level was similar to or less than the eBC concentrations at altitudes from 10 m to 130 m.
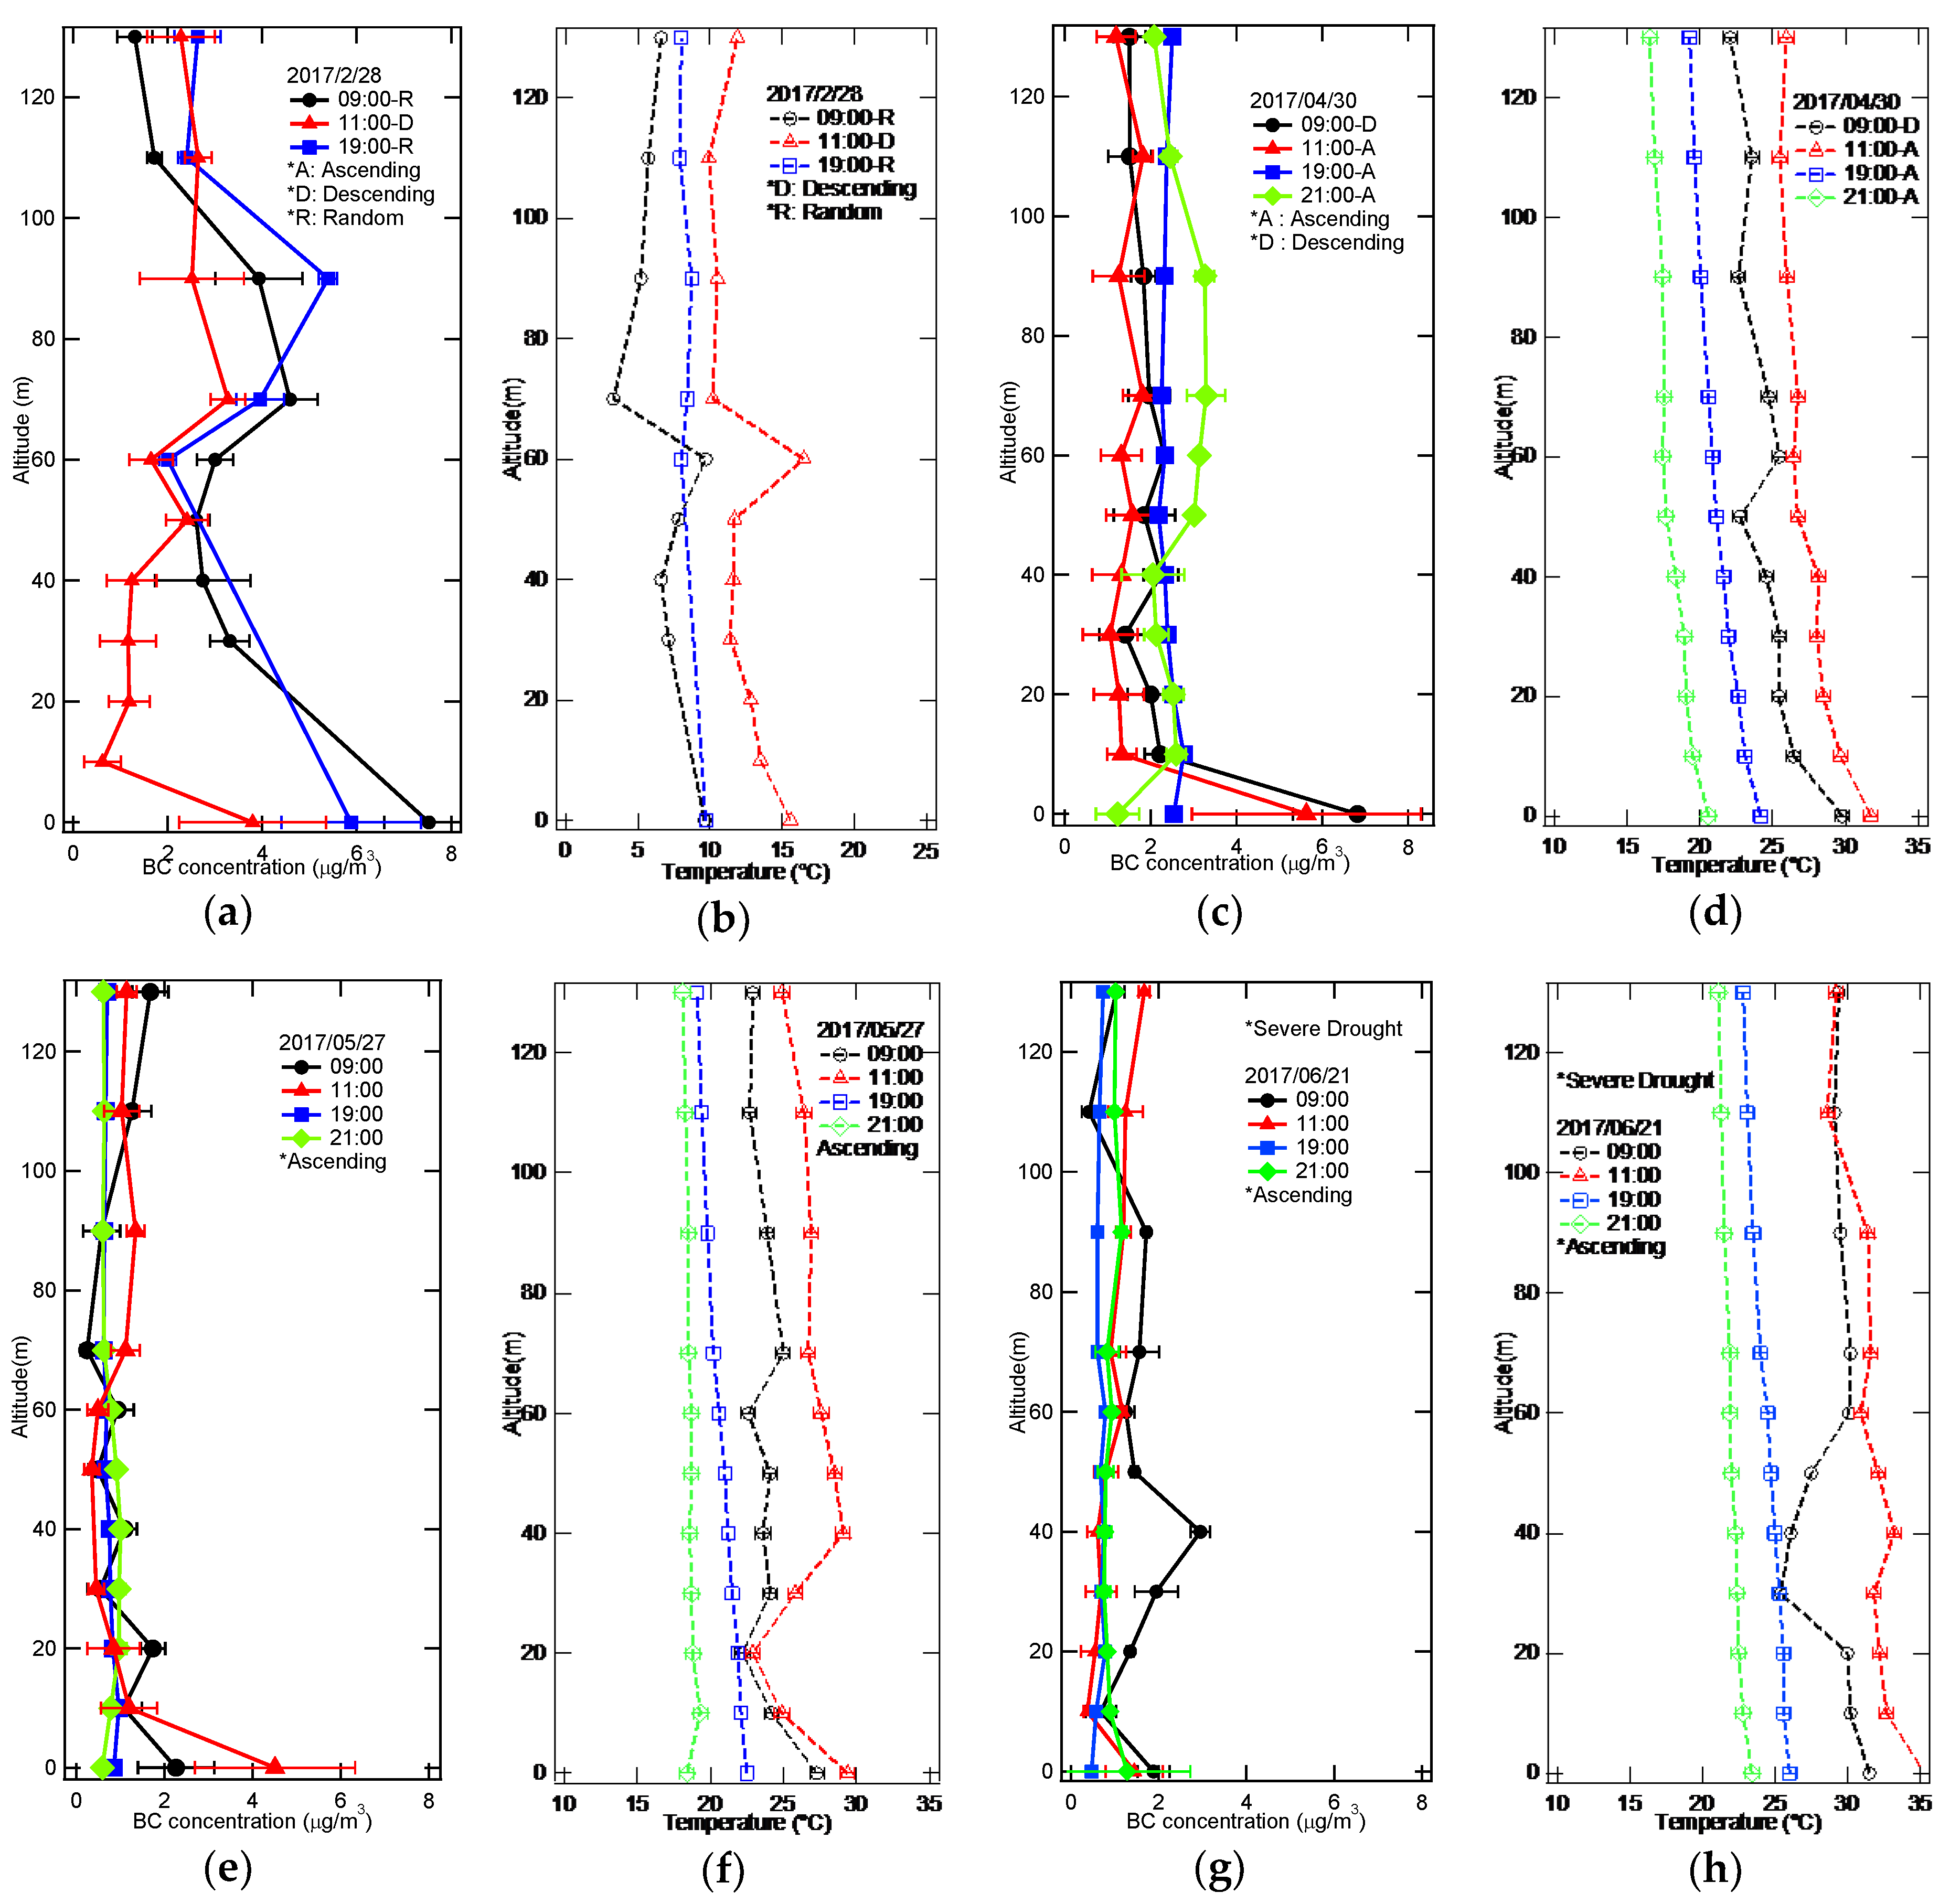
We measured eBC concentrations on 28 February 2017 to represent the BC situation in winter at KOREATECH campus as shown in Figure 4a. The average eBC concentrations alongside the vertical altitude for 3 cases was 2.9 ± 1.6 μg/m3, which is higher than usual eBC concentrations (~1.5 μg/m3) at this area through spring to autumn [20]. In terms of the measurement timing, eBC concentrations measured in the morning were highest among other eBC concentrations measured in the evening or in the late morning. More specifically, eBC concentrations measured in the late morning is the lowest. The eBC concentration decreased as the altitude increased up to around 60 m, and then it increased up to 90 m. It seems that the temperature change around at 60 m high influenced the movement of air mass so that BC has been trapped between 60 m and 90 m high. In other words, high BC concentrations at h = 70–90 m could be related to the temperature inversion (at h = 50–60 m), which blocked transfer from midair to the ground as can be seen in Figure 4b. Average wind speed and direction during the measurements on 28 February 2017 were 2.5 m/s and 294°, respectively. Moderate wind speed seems to partly affect the high eBC concentration on the ground level.
Figure 4c shows eBC concentrations measured on April 30th to reflect the BC situation in spring. Similar to the result in winter, eBC concentrations were highest on the ground, especially in the morning. Average eBC concentrations from 10 m to 130 m, however, were 1.89 ± 0.48 μg/m3, showing less fluctuated than the vertical eBC concentrations measured in winter. The eBC concentrations measured in the morning were higher than those measured in the late morning, which is similar to the situation of the eBC concentration in winter. Note that the temperature scale ranges from 10 to 35 °C, which is 5 °C higher than the temperature scale range in winter as shown in Figure 4d. Average wind speed and direction during the measurements on 30 April 2017 were 7.3 m/s and 224°, respectively.
We measured eBC concentrations on 27 May to represent the BC situation in early summer as shown in Figure 4e. The level of eBC concentrations were mostly low. As opposed to the results in winter and spring (Figure 4a,c), eBC concentrations on the ground were highest when measured in the late morning. The average eBC concentrations from an altitude of 10 m to 130 m were 0.93 ± 0.68 μg/m3. The eBC concentrations measured in the morning on the ground were lower than those measured in the late morning, which is contrary to the eBC situation in winter. Figure 4f shows the temperature inversion at an altitude from 20 m to 40 m in the morning and in the late morning. The inversion blocks the transfer from the ground to high altitude, thus the air mass on the ground is stagnant, causing the high eBC concentration on the ground. It is interesting to note that no vertical temperature gradient was observed at night. Average wind speed and direction during the measurements on 27 May 2017 were 2.7 m/s and 280°, respectively. Moderate wind speed seems to partly affect the high eBC concentration on the ground level similarly to the case of winter.
Figure 4g shows eBC concentrations measured on 21 June show the BC situation in the middle of summer. The temperature was highest as can be seen in Figure 4h. The temperature inversion around h = 30–60 m in the morning seems to cause the high BC at h = 40 m. The level of eBC concentrations were low except at 40 m in the morning. Temperature profiles after 19:00 were more stable than those before noon. The eBC concentrations was similar regardless of the time when the measurements were done. Average eBC concentrations from the ground to 130 m were 1.01 ± 0.49 μg/m3. The temperature profile shows the temperature inversion from an altitude of 30 m to 60 m in the morning and from an altitude of 30 m to 40 m close to noon. The high eBC concentration at 40 m in the morning is associated with the temperature inversion. It is thought that BC particles generated at the ground were elevated up to 40 m and the stable layer created between 30 m and 60 m due to the temperature inversion prevented the BC from being lifted above 40 m. Average wind speed and direction during the measurements on 21 June 2017 were 6.7 m/s and 263°, respectively.
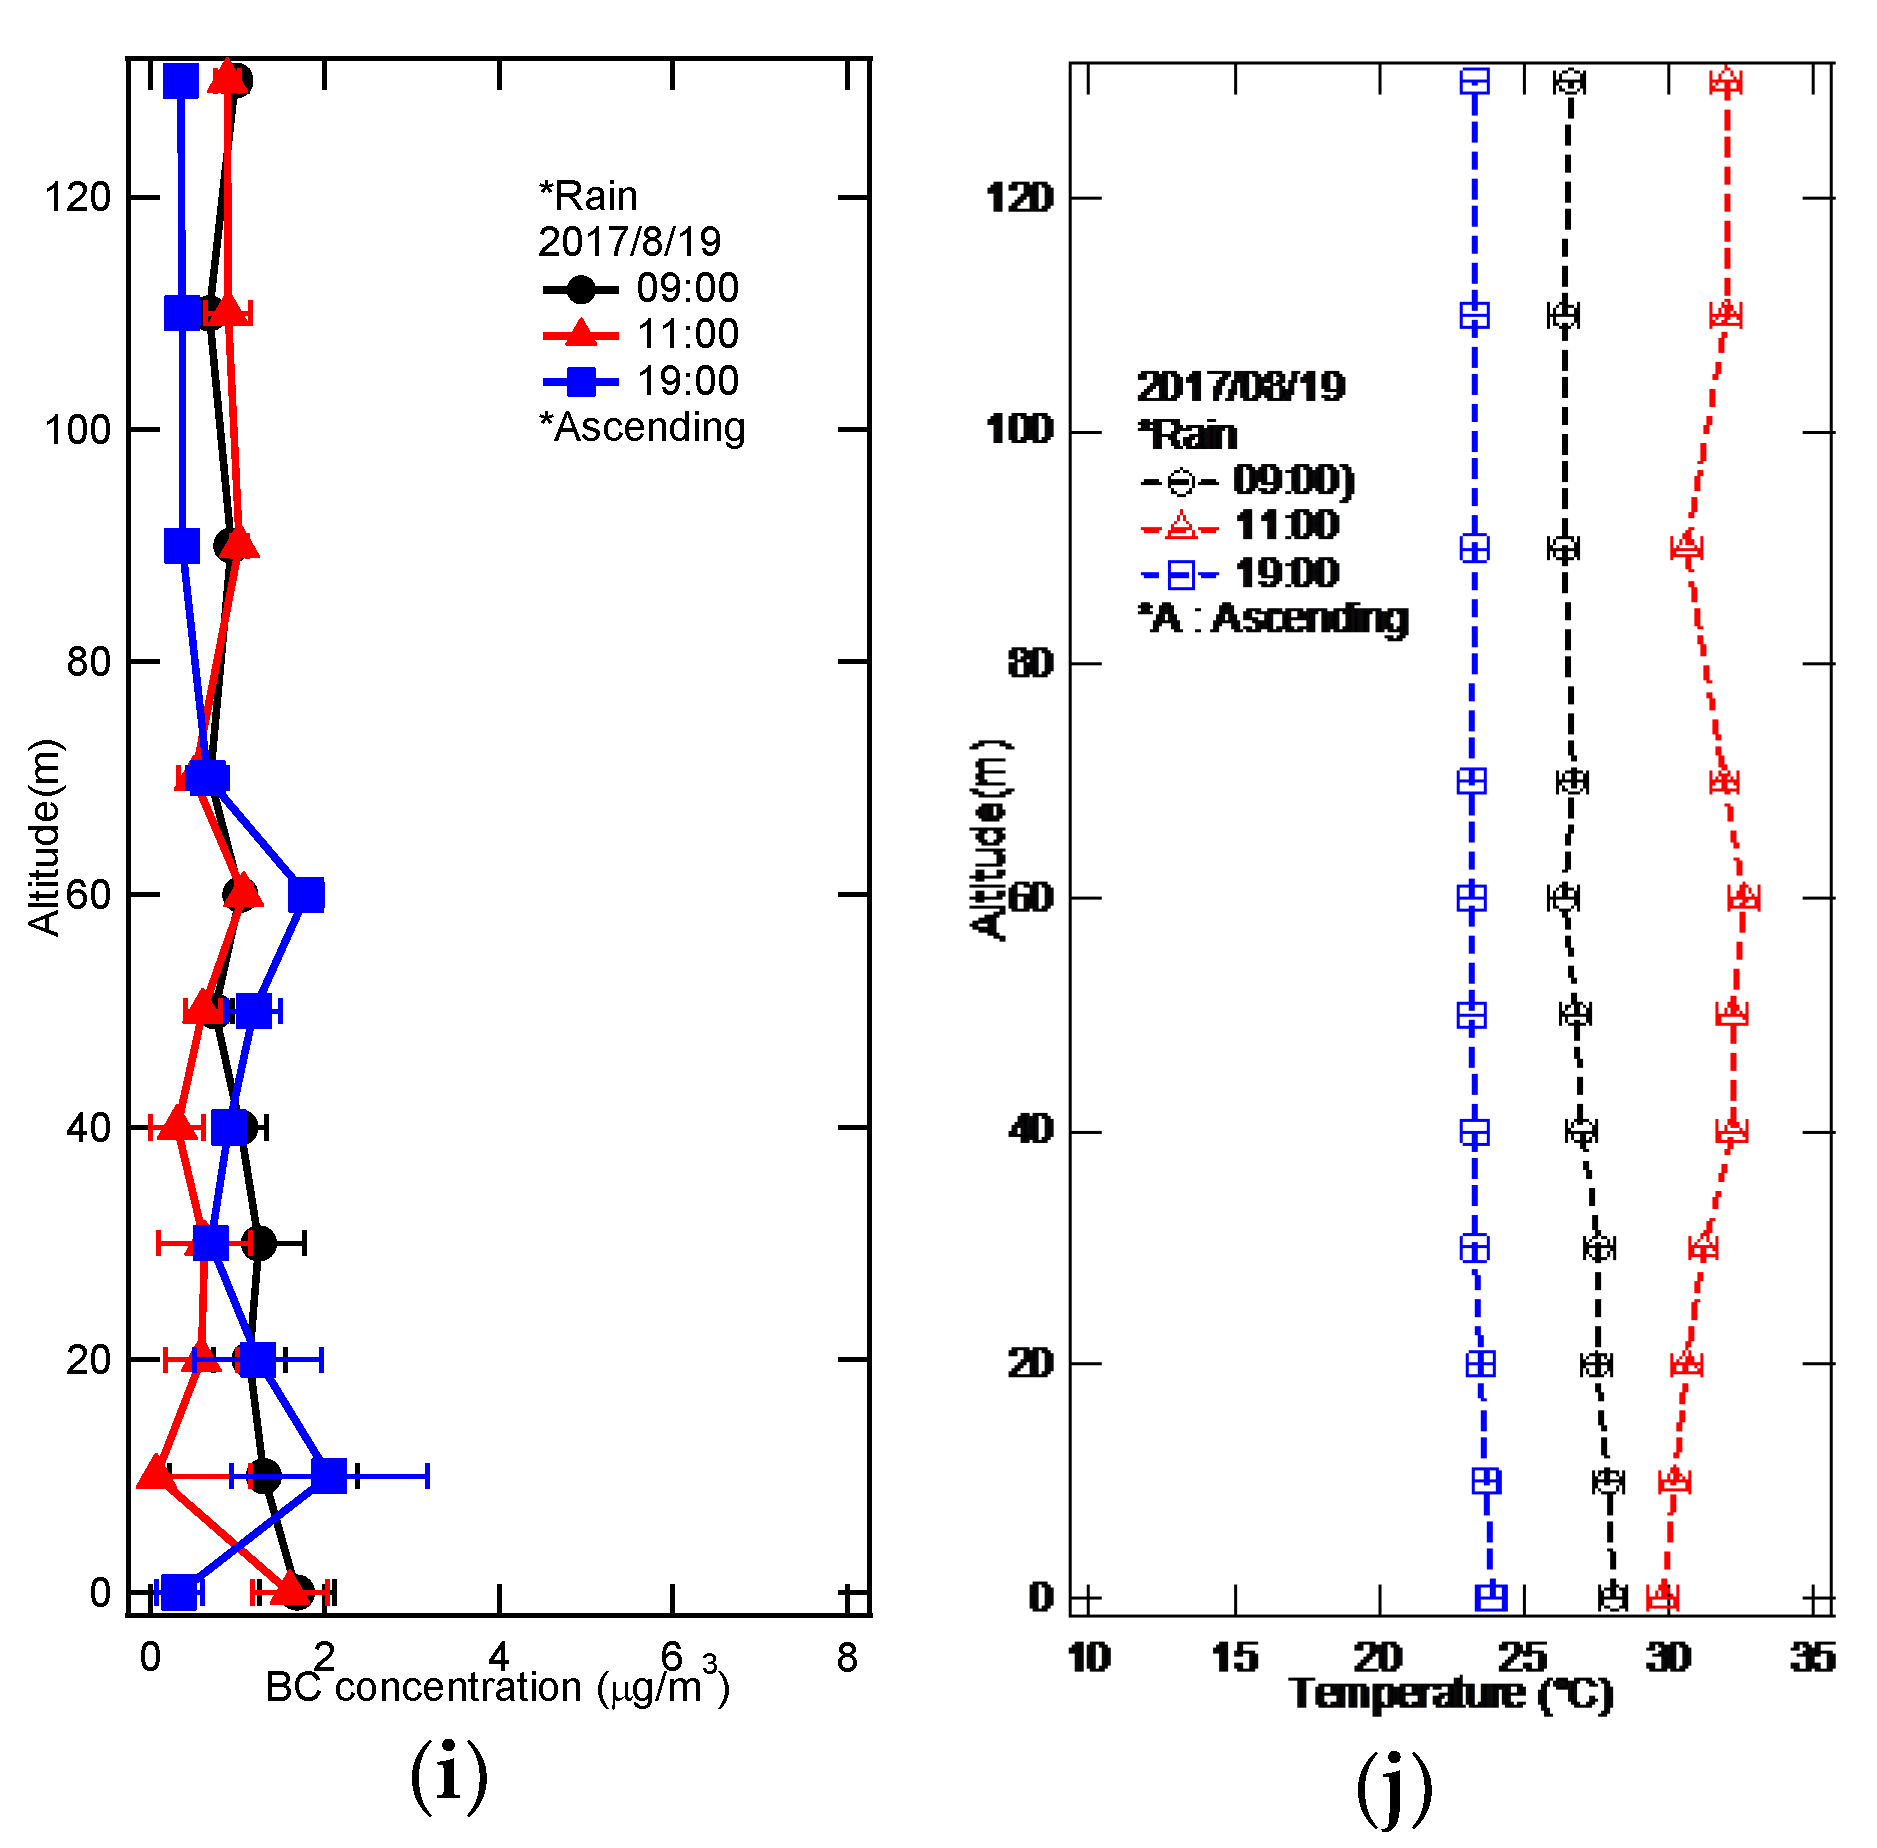
We observed eBC concentrations on August 19th as shown in Figure 4i to ascertain whether the BC situation in the late summer and early autumn is same as before or not. The temperature was still high as shown in Figure 4j. The temperature inversion near noon around h = 0–40 m seems to keep the air mass stagnant. The level of eBC concentrations were low due to intermittent drizzle. Sudden heavy shower and rain at night hindered us from operating the drone, thus there was no data at night. This exemplifies the unavailability of drone system for the atmospheric measurements in some weather conditions including strong wind or heavy rain. Temperature profiles in the late morning showed a weak temperature inversion but other cases did not. Average eBC concentrations from the ground to 130 m were 0.75 ± 0.48 μg/m3. The eBC concentration was the lowest among other cases. The temperature profile shows the temperature inversion from an altitude of 30 m to 60 m and from 90 m to 110 m in the late morning. Average wind speed and direction during the measurements on 19 August 2017 were 5.5 m/s and 87°, respectively.
As for the relationship between the eBC concentrations and the wind speed, eBC concentrations on the ground were low in strong wind days, while eBC concentrations on the ground were high in moderate wind days. Exceptionally, the eBC concentration on the ground on 30 April was high despite the strong wind.
3.2. Measurement of eBC Concentration at a Mountain (400 Meters agl)
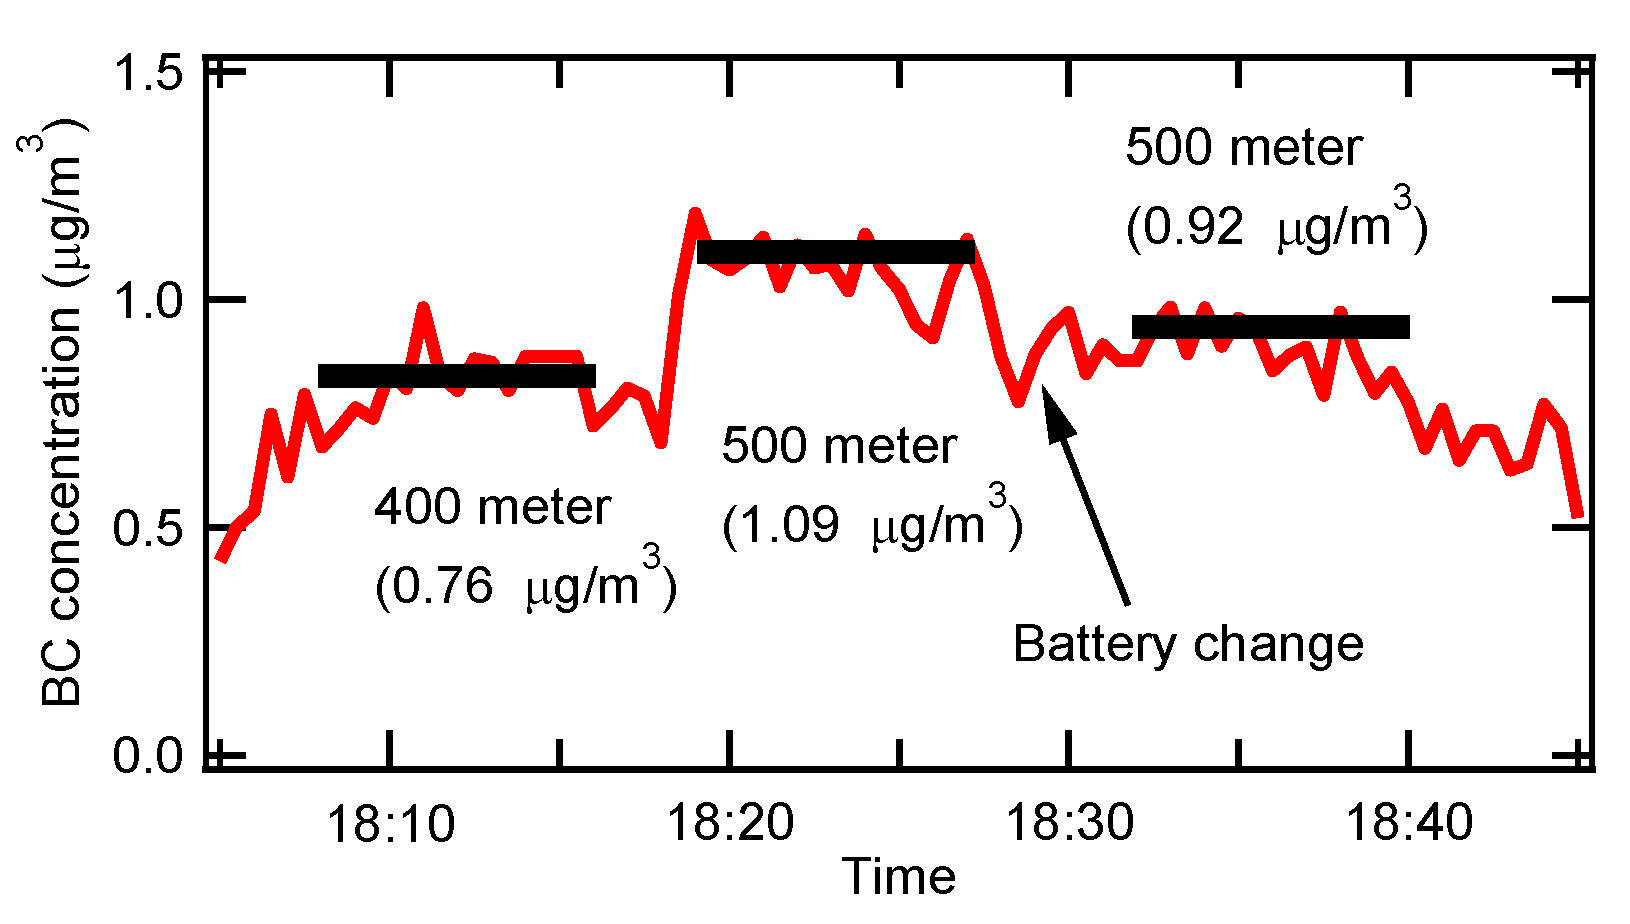
At a mountain, the eBC concentrations were measured to be approximately 1 μg/m3 as shown in Figure 5. The eBC concentrations measured at 400 m agl were slightly different from those measured at 500 m agl but the difference was not so large. Therefore, it is not unreasonable to assume that the nominal eBC concentration at mountain area near KOREATECH campus is below 1 μg/m3. From the result of the measurement at a mountain, it is thought that the value could be regarded as a background eBC concentration.
3.3. Preliminary Remedy for Low eBC Concentration Case
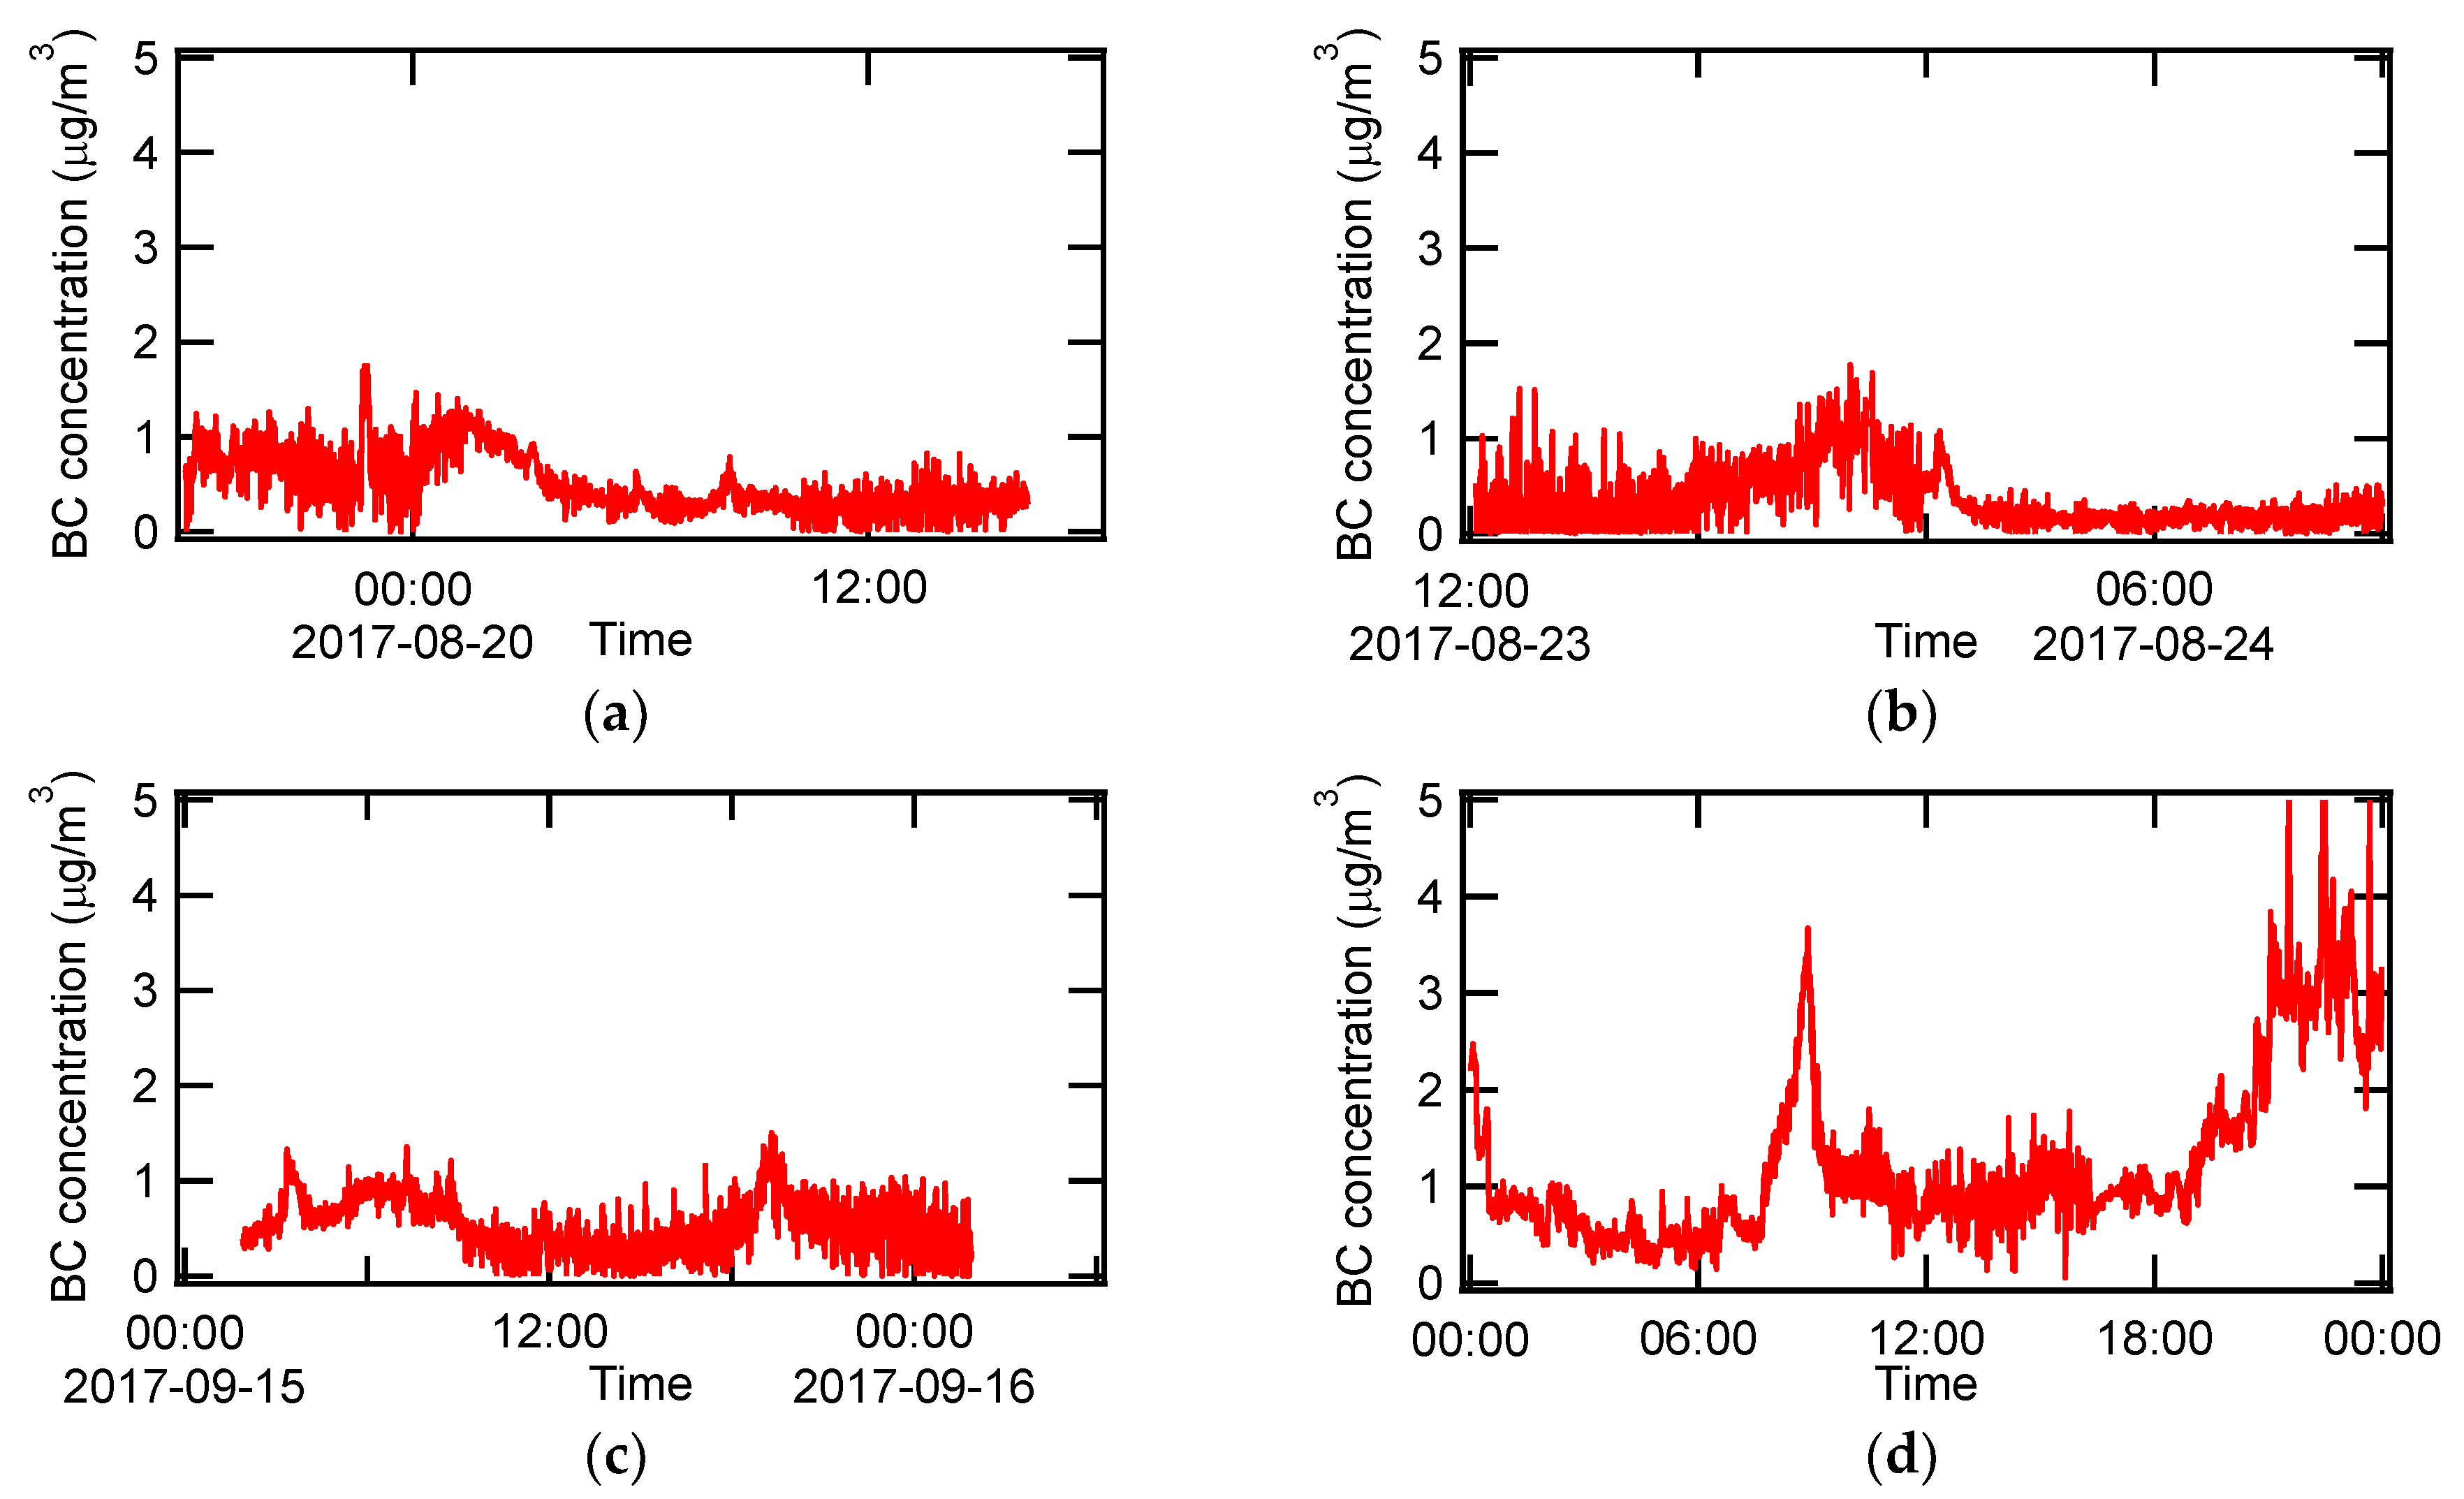
The flight time of our hexacopter is about 13–15 min with a fully charged battery. It takes 1–2 min to translocate our drone from one place to another one. In addition, it takes 1–2 min to stabilize the position of our drone when the wind is strong. Therefore, it is very difficult to continuously measure the eBC concentrations at a certain place for a long time. Therefore, instead of utilizing a hexacopter, we examined the eBC concentrations continuously collected by a multi-angle absorption photometer at the ground level for the analysis of low eBC concentrations. We selected several cases where the concentration at the ground level is low in order to examine how noisy and unrealistic the value is. Low concentration cases include several days when the eBC concentrations were below 1 μg/m3 which was confirmed as a nominal concentration at mountain near KOREATECH. The precipitations and wind speed for CASE I, II, and III were shown in Table 1. The precipitation was present and the wind speed was high when eBC concentrations were very low.
Figure 6a–c show eBC concentrations of CASE I, CASE II, and CASE III, respectively. The eBC concentrations were mostly less than 1 μg/m3 and negative intermittently. For better comparison of low concentration cases to a typical case, a diurnal variation of the eBC concentration was displayed in Figure 6d. Morning rush hour and evening rush hour peaks were observed and the concentration increased to approximately 5 μg/m3, which was higher than a typical eBC concentration near KOREATECH.
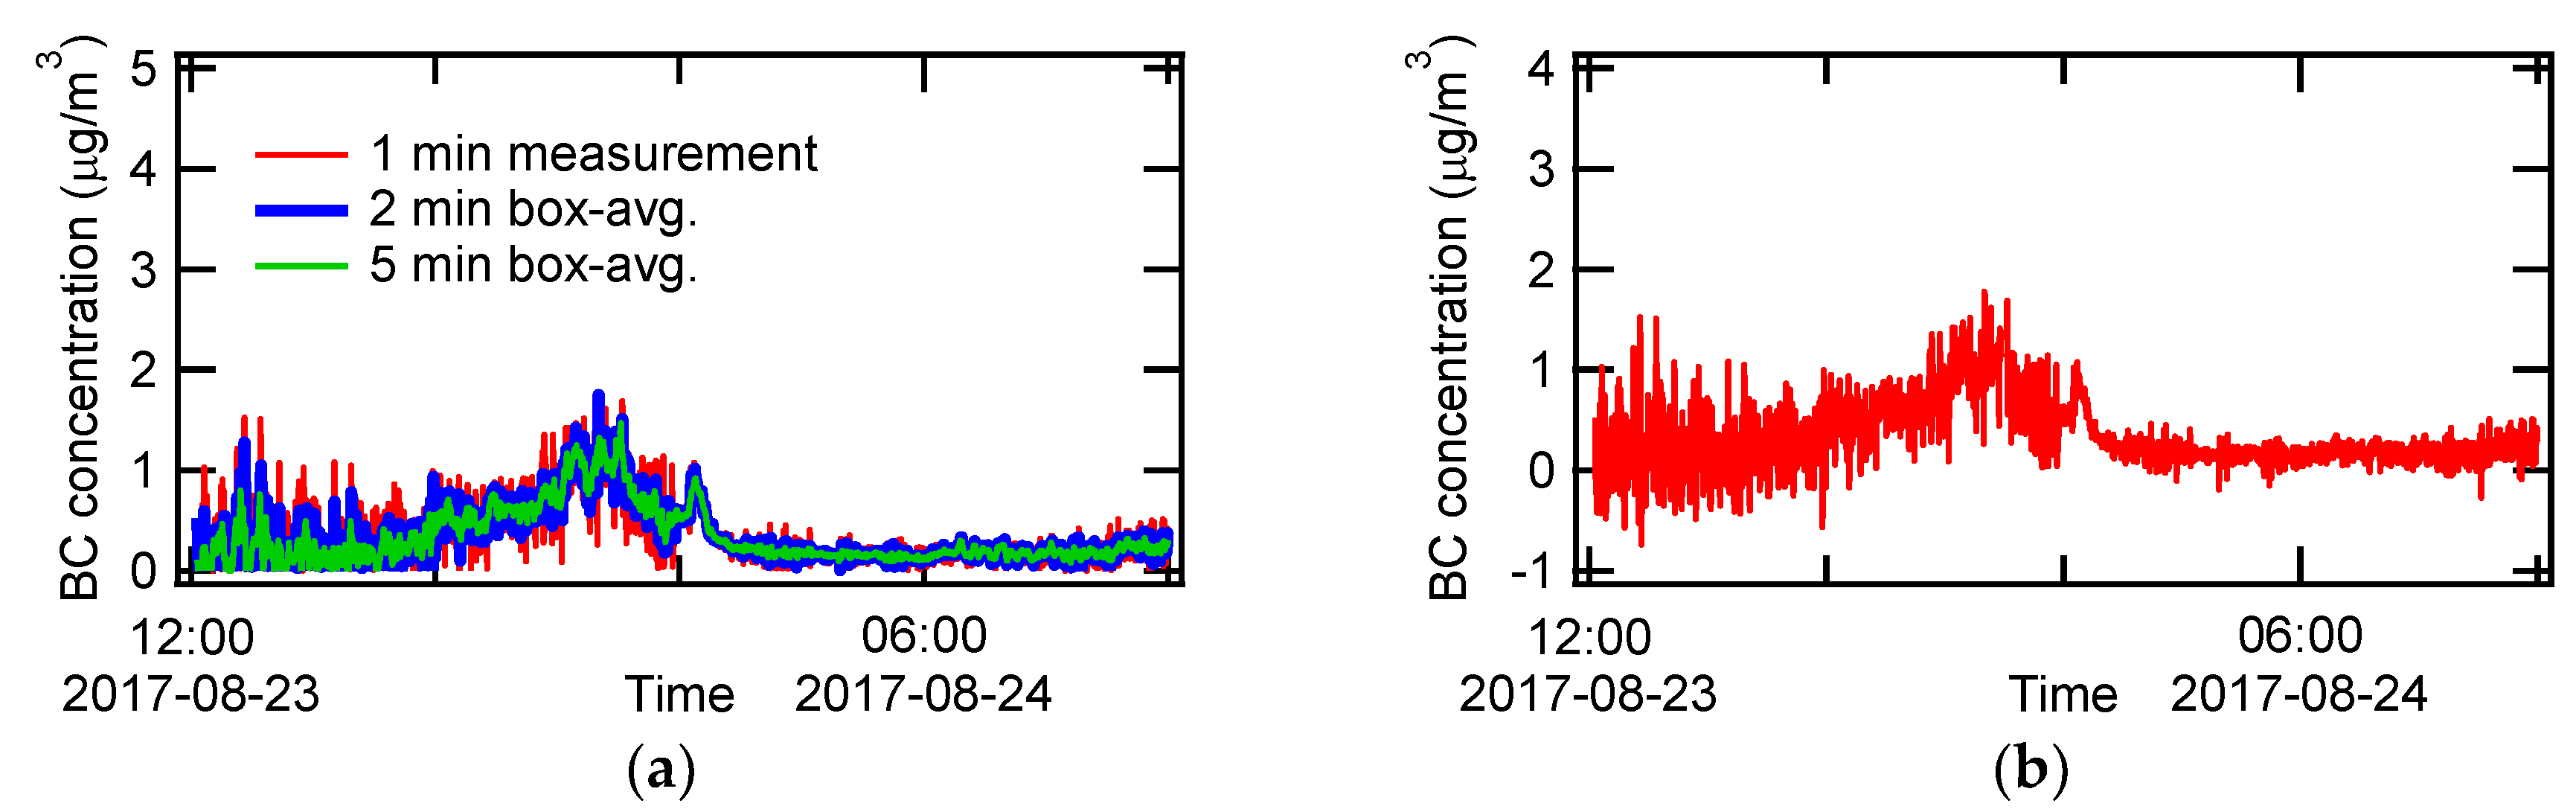
CASE II was selected to investigate how to simply correct noisy and negative eBC concentrations. The simplest way to remove the noise is to do a box-averaging. We performed a box-averaging with 2 min and 5 min time window. As can be seen in Figure 7a, the 5 min averaging looks fair enough to consider that the noise is nominally reduced down to a discernable level. Consequently, a box-averaging for at least 5 min can remove noisiness. However, negative signals were still frequently observed in CASE II as shown in Figure 7b. The negative concentration seems partly due to a compensation scheme which forcedly displays zero concentration under nearly zero concentration condition [21]. In other words, negative values equivalent to positive values are alternately displayed so as to become zero at an extremely low concentration if averaged in time series. The absolute values of negative concentrations are reduced with an averaging time until it becomes zero. Therefore, it is reasonable to assume that negative concentration disappears at an ideal averaging time.
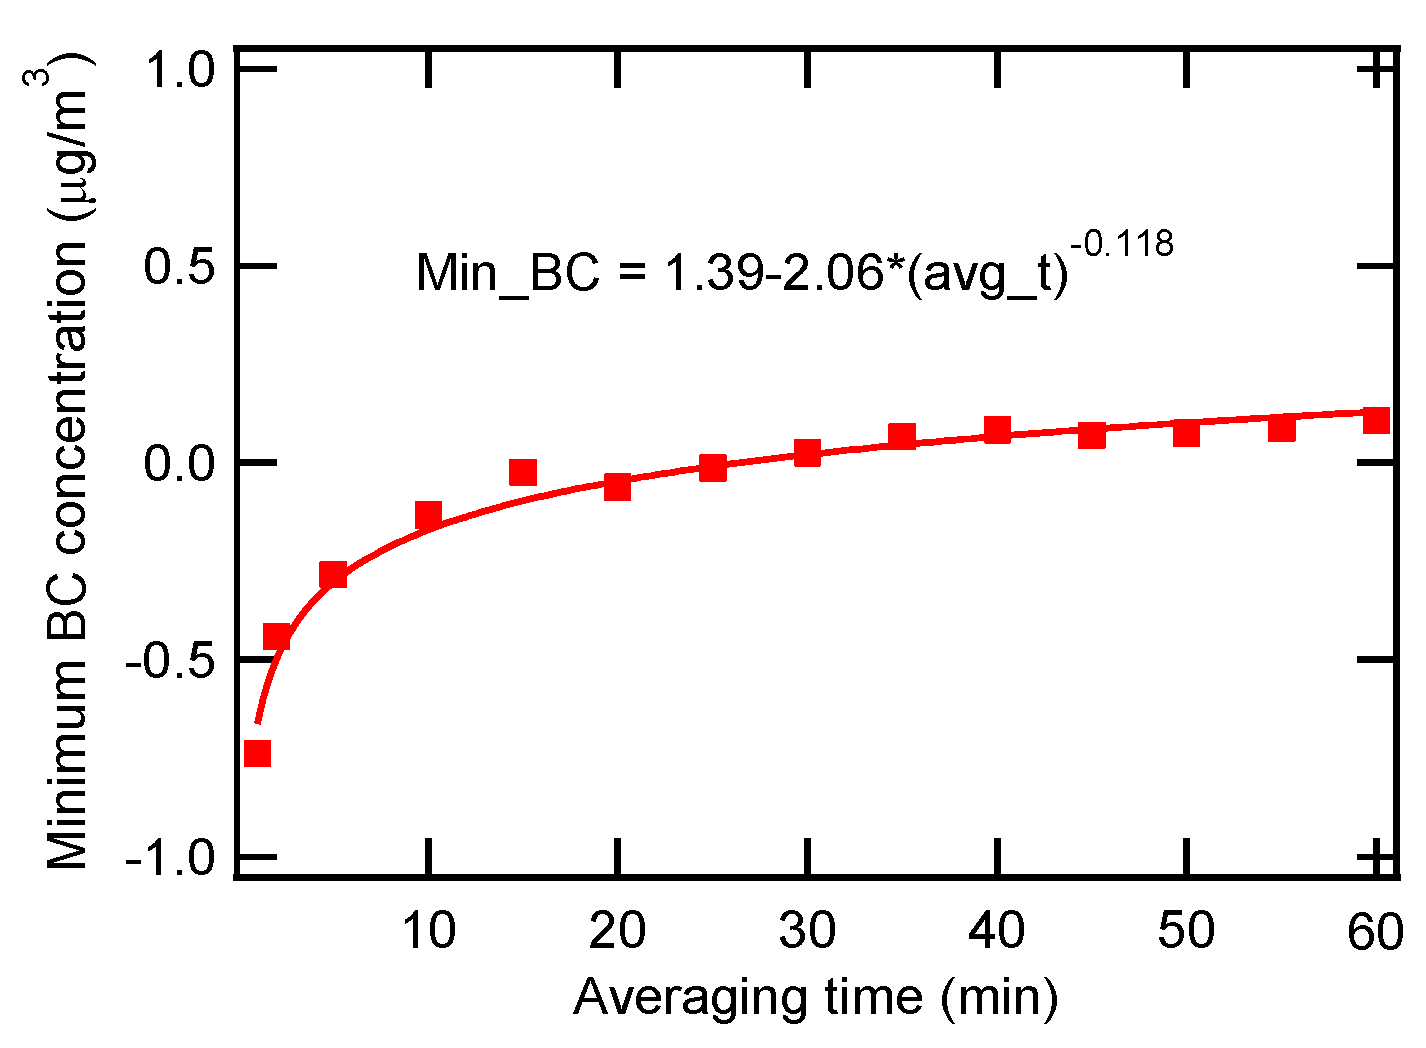
We performed the box-averaging with the time window of 2, 5, 10, 15, 20, 25, 30 and 60 min. We selected the minimum eBC concentration after averaging, then we attempted to find the time window where the negative signal completely disappears. We regarded the minimum eBC concentration as a reference value for comparison. Negative minimum eBC concentration disappeared for the first time when we performed box-averaging with 30 min of average time. Consequently, the best fit for the minimum eBC concentrations versus the averaging time was a power-law fit. Figure 8 shows the minimum eBC concentrations as a function of the averaging time together with a power-law curve fit equation. It was estimated from the equation that the minimum eBC concentration became positive at the averaging time of 28 min. Thus, 30 min of averaging time could reduce the noise and remove the negative concentration, which were observed for a low concentration condition.
4. Concluding Remarks
Simultaneous measurement of the eBC concentration and the temperature at the exact position of interest along a vertical axis using our drone system was carried out for the first time as far as the authors know. We have established a basis for measuring black carbon from the ground up to 130 m above ground level. The caveat of temperature measurement is that temperature gradient could be overestimated on an ascending mode in the evening and descending mode in the morning. The temperature gradient could be underestimated on the ascending mode in the morning. Nonetheless, the temperature information gives us the atmospheric lapse rates. The low concentration cases were selected for better explanation of the correction for eBC concentrations measured at clean area, such as a mountain. At low eBC concentration, signal was noisy and exhibited negative values from time to time. To remove the noise and negativity at low concentration, we performed very simple analysis such as a box-averaging. It is recommended that the averaging time be longer than 30 min for low concentration condition. Longer study needs if available to identify the characteristics of BC and the temperature for entire four seasons. Correction for scattering artifacts is underway as well.
Author Contributions
Conceptualization, J.L.; methodology, J.L.; software, J.L., J.P., J.K.; validation, J.L.; measurement, J.P., J.K.; drone fabrication, J.K.; formal analysis, J.L.; investigation, J.L.; resources, J.L.; data curation, J.L.; writing—original draft preparation, J.L.; writing—review and editing, J.L.; visualization, J.L., J.P.; supervision, J.L.; project administration, J.L.; funding acquisition, J.L. All authors have read and agreed to the published version of the manuscript.
Funding
This research was supported by the Basic Science Research Program through the National Research Foundation of Korea (NRF) funded by the Ministry of Education (2019R1I1A3A01060938).
Acknowledgments
The authors thank Jinsoo Lee for the preparation of drone controller and the software for its operation at the mountain.
Conflicts of Interest
The authors declare no conflict of interest. The funders had no role in the design of the study; in the collection, analyses, or interpretation of data; in the writing of the manuscript, or in the decision to publish the results.
References
- Villa, T.; Gonzalez, F.; Miljevic, B.; Ristovski, Z.D.; Morawska, L. An overview of small unmanned aerial vehicles for air quality measurements: Present applications and future prospectives. Sensors 2016, 16, 1072. [Google Scholar] [CrossRef] [PubMed] [Green Version]
- Petzold, A.; Schönlinner, M. Multi-angle absorption photometry—A new method for the measurement of aerosol light absorption and atmospheric black carbon. J. Aerosol Sci. 2004, 35, 421–441. [Google Scholar] [CrossRef]
- Weingartner, E.; Saathoff, H.; Schnaiter, M.; Streit, N.; Bitnar, B.; Baltensperger, U. Absorption of light by soot particles: Determination of the absorption coefficient by means of aethalometers. J. Aerosol Sci. 2003, 34, 1445–1463. [Google Scholar] [CrossRef]
- Altstädter, B.; Deetz, K.; Vogel, B.; Babić, K.; Dione, C.; Pacifico, F.; Jambert, C.; Ebus, F.; Bärfuss, K.; Pätzold, F.; et al. The Vertical Variability of Black Carbon Observed in the Atmospheric Boundary Layer during DACCIWA. Atmos. Chem. Phys. 2020, 20, 7911–7928. [Google Scholar] [CrossRef]
- Sheridan, P.J.; Patrick Arnott, W.; Ogren, J.A.; Andrews, E.; Atkinson, D.B.; Covert, D.S.; Moosmüller, H.; Petzold, A.; Schmid, B.; Strawa, A.W.; et al. The reno aerosol optics study: An evaluation of aerosol absorption measurement methods. Aerosol Sci. Technol. 2005, 39, 1–16. [Google Scholar] [CrossRef] [Green Version]
- Virkkula, A.; Mäkelä, T.; Hillamo, R.; Yli-Tuomi, T.; Hirsikko, A.; Hämeri, K.; Koponen, I.K. A simple procedure for correcting loading effects of aethalometer data. J. Air Waste Manag. Assoc. 2007, 57, 1214–1222. [Google Scholar] [CrossRef]
- Backman, J.; Schmeisser, L.; Virkkula, A.; Ogren, J.A.; Asmi, E.; Starkweather, S.; Sharma, S.; Eleftheriadis, K.; Uttal, T.; Jefferson, A.; et al. On Aethalometer measurement uncertainties and an instrument correction factor for the Arctic. Atmos. Meas. Tech. 2017, 10, 5039–5062. [Google Scholar] [CrossRef] [Green Version]
- Collaud Coen, M.; Weingartner, E.; Apituley, A.; Ceburnis, D.; Fierz-Schmidhauser, R.; Flentje, H.; Henzing, J.S.; Jennings, S.G.; Moerman, M.; Petzold, A.; et al. Minimizing light absorption measurement artifacts of the Aethalometer: Evaluation of five correction algorithms. Atmos. Meas. Tech. 2010, 3, 457–474. [Google Scholar] [CrossRef] [Green Version]
- Ratnam, M.V.; Raj, S.T.A.; Madhavan, B.L.; Vernier, J.P.; Kiran, V.R.; Jain, C.D.; Basha, G.; Nagendra, N.; Kumar, B.S.; Pandit, A.K.; et al. Vertically resolved black carbon measurements and associated heating rates obtained using in situ balloon platform. Atmos. Environ. 2020, 232, 117541. [Google Scholar] [CrossRef]
- Babu, S.S.; Moorthy, K.K.; Manchanda, R.K.; Sinha, P.R.; Satheesh, S.K.; Vajja, D.P.; Srinivasan, S.; Kumar, V.H.A. Free tropospheric black carbon aerosol measurements using high altitude balloon: Do BC layers build their own homes up in the atmosphere? Geophys. Res. Lett. 2011, 38, 1–6. [Google Scholar] [CrossRef]
- Corrigan, C.E.; Roberts, G.C.; Ramana, M.V.; Kim, D.; Ramanathan, V. Capturing vertical profiles of aerosols and black carbon over the Indian Ocean using autonomous unmanned aerial vehicles. Atmos. Chem. Phys. 2008, 8, 737–747. [Google Scholar] [CrossRef] [Green Version]
- Spackman, J.R.; Gao, R.S.; Neff, W.D.; Schwarz, J.P.; Watts, L.A.; Fahey, D.W.; Holloway, J.S.; Ryerson, T.B.; Peischl, J.; Brock, C.A. Aircraft observations of enhancement and depletion of black carbon mass in the springtime Arctic. Atmos. Chem. Phys. 2010, 10, 9667–9680. [Google Scholar] [CrossRef] [Green Version]
- Rohi, G.; Ejofodomi, O.; Ofualagba, G. Autonomous monitoring, analysis, and countering of air pollution using environmental drones. Heliyon 2020, 6, e03252. [Google Scholar] [CrossRef] [PubMed] [Green Version]
- Stix, J.; de Moor, J.M.; Rüdiger, J.; Alan, A.; Corrales, E.; D’Arcy, F.; Diaz, J.A.; Liotta, M. Using Drones and Miniaturized Instrumentation to Study Degassing at Turrialba and Masaya Volcanoes, Central America. J. Geophys. Res. Solid Earth 2018, 123, 6501–6520. [Google Scholar] [CrossRef]
- Liu, B.; Wu, C.; Ma, N.; Chen, Q.; Li, Y.; Ye, J.; Martin, S.T.; Li, Y.J. Vertical profiling of fine particulate matter and black carbon by using unmanned aerial vehicle in Macau, China. Sci. Total Environ. 2020, 709, 136109. [Google Scholar] [CrossRef] [PubMed]
- Chang, C.C.; Chang, C.Y.; Wang, J.L.; Lin, M.R.; Ou-Yang, C.F.; Pan, H.H.; Chen, Y.C. A study of atmospheric mixing of trace gases by aerial sampling with a multi-rotor drone. Atmos. Environ. 2018, 184, 254–261. [Google Scholar] [CrossRef]
- Crazzolara, C.; Ebner, M.; Platis, A.; Miranda, T.; Bange, J.; Junginger, A. A new multicopter-based unmanned aerial system for pollen and spores collection in the atmospheric boundary layer. Atmos. Meas. Tech. 2019, 12, 1581–1598. [Google Scholar] [CrossRef] [Green Version]
- Brady, J.M.; Stokes, M.D.; Bonnardel, J.; Bertram, T.H. Characterization of a Quadrotor Unmanned Aircraft System for Aerosol-Particle-Concentration Measurements. Environ. Sci. Technol. 2016, 50, 1376–1383. [Google Scholar] [CrossRef]
- Bieber, P.; Seifried, T.M.; Burkart, J.; Gratzl, J.; Kasper-Giebl, A.; Schmale, D.G.; Grothe, H. A drone-based bioaerosol sampling system to monitor ice nucleation particles in the lower atmosphere. Remote Sens. 2020, 12, 552. [Google Scholar] [CrossRef] [Green Version]
- Lee, J.; Yun, J.; Kim, K.J. Monitoring of black carbon concentration at an inland rural area including fixed sources in Korea. Chemosphere 2016, 143, 3–9. [Google Scholar] [CrossRef]
- Lee, J. Performance Test of MicroAeth® AE51 at Concentrations Lower than 2 μg/m3 in Indoor Laboratory. Appl. Sci. 2019, 9, 2766. [Google Scholar] [CrossRef] [Green Version]
Figure 1.
Hexacopter-based eBC and temperature measurement system: (a) Our hexacopter weighs 0.3 kg without payload. Six propellers generate the thrust force to aviate; (b) Diagram of vertical traverse of the measurement using the hexacopter; (c) Control software provided by the drone manufacturer shows the aviation state and geometrical information associated with the flight of measurement.

Figure 2.
Measurement at a mountain: (a) Photo of a tomb near the top of Eun Seok Mountain; (b) The altitude of the tomb from the ground is approximately 400 m. The vertical profile of eBC from the tomb up to 100 m higher than the tomb has been measured.
Figure 2.
Measurement at a mountain: (a) Photo of a tomb near the top of Eun Seok Mountain; (b) The altitude of the tomb from the ground is approximately 400 m. The vertical profile of eBC from the tomb up to 100 m higher than the tomb has been measured.

Figure 3.
Examples of vertical eBC concentration measurements. The short horizontal black bars in figures indicate the duration of eBC concentration measurements at each altitudes: (a) Measurement in the morning; (b) Measurement in the late morning; (c) Measurement in the evening; (d) Measurement at night.

Figure 4.
Vertical profiles of eBC concentration and temperature at low altitude: (a) eBC concentrations in late winter; (b) Temperatures in late winter; (c) eBC concentrations in spring; (d) Temperatures in spring; (e) eBC concentrations in early summer; (f) Temperatures in early summer; (g) eBC concentrations in summer; (h) Temperatures in summer; (i) eBC concentrations in summer and early autumn; (j) Temperatures in summer and early autumn.


Figure 5.
The eBC concentrations measured in Eun Seok Mountain. The three black horizontal lines indicate average eBC concentrations at 400 m agl, 500 m agl, and 500 m agl after battery change.
Figure 5.
The eBC concentrations measured in Eun Seok Mountain. The three black horizontal lines indicate average eBC concentrations at 400 m agl, 500 m agl, and 500 m agl after battery change.

Figure 6.
Several cases of low eBC concentrations measured at the ground level: (a) CASE I; (b) CASE II; (c) CASE III; (d) diurnal variation of eBC concentration for a normal day.
Figure 6.
Several cases of low eBC concentrations measured at the ground level: (a) CASE I; (b) CASE II; (c) CASE III; (d) diurnal variation of eBC concentration for a normal day.

Figure 7.
Box-averaging shows that the noise level of eBC concentrations measured at the ground level was reduced: (a) Averaging with longer time more effectively reduces noise; (b) Negative concentrations were observed in CASE II.
Figure 7.
Box-averaging shows that the noise level of eBC concentrations measured at the ground level was reduced: (a) Averaging with longer time more effectively reduces noise; (b) Negative concentrations were observed in CASE II.

Figure 8.
Minimum eBC concentrations as a function of averaging time. Power-law fitting describes the relationship between the minimum eBC concentration and the averaging time.
Figure 8.
Minimum eBC concentrations as a function of averaging time. Power-law fitting describes the relationship between the minimum eBC concentration and the averaging time.


Table 1.
Precipitation and wind speed for low eBC concentration cases.
| Case (Date) | Precipitation (mm) 1 | Wind Speed (m/s) 1 |
|---|---|---|
| CASE I (August 20) | 21 | 1.0 |
| CASE II (August 23–24) | 6 | 4.5 |
| CASE III (September 15–16) | 0 | 6.0 |
1 Data were obtained from the website of Korea Meteorological Administration (http://www.kma.go.kr/weather/observation/aws_table_popup.jsp).
© 2020 by the authors. Licensee MDPI, Basel, Switzerland. This article is an open access article distributed under the terms and conditions of the Creative Commons Attribution (CC BY) license (http://creativecommons.org/licenses/by/4.0/).
Share and Cite
MDPI and ACS Style
Lee, J.; Park, J.; Kim, J. Vertical Measurement of Equivalent Black Carbon Concentration at Low Altitude. Appl. Sci. 2020, 10, 5142. https://0-doi-org.brum.beds.ac.uk/10.3390/app10155142
AMA Style
Lee J, Park J, Kim J. Vertical Measurement of Equivalent Black Carbon Concentration at Low Altitude. Applied Sciences. 2020; 10(15):5142. https://0-doi-org.brum.beds.ac.uk/10.3390/app10155142
Chicago/Turabian StyleLee, Jeonghoon, Jiseung Park, and Juhyung Kim. 2020. "Vertical Measurement of Equivalent Black Carbon Concentration at Low Altitude" Applied Sciences 10, no. 15: 5142. https://0-doi-org.brum.beds.ac.uk/10.3390/app10155142
Note that from the first issue of 2016, this journal uses article numbers instead of page numbers. See further details here.