Characterizing Black Carbon Emissions from Gasoline, LPG, and Diesel Vehicles via Transient Chassis-Dynamometer Tests

Abstract
:
1. Introduction
2. Materials and Methods
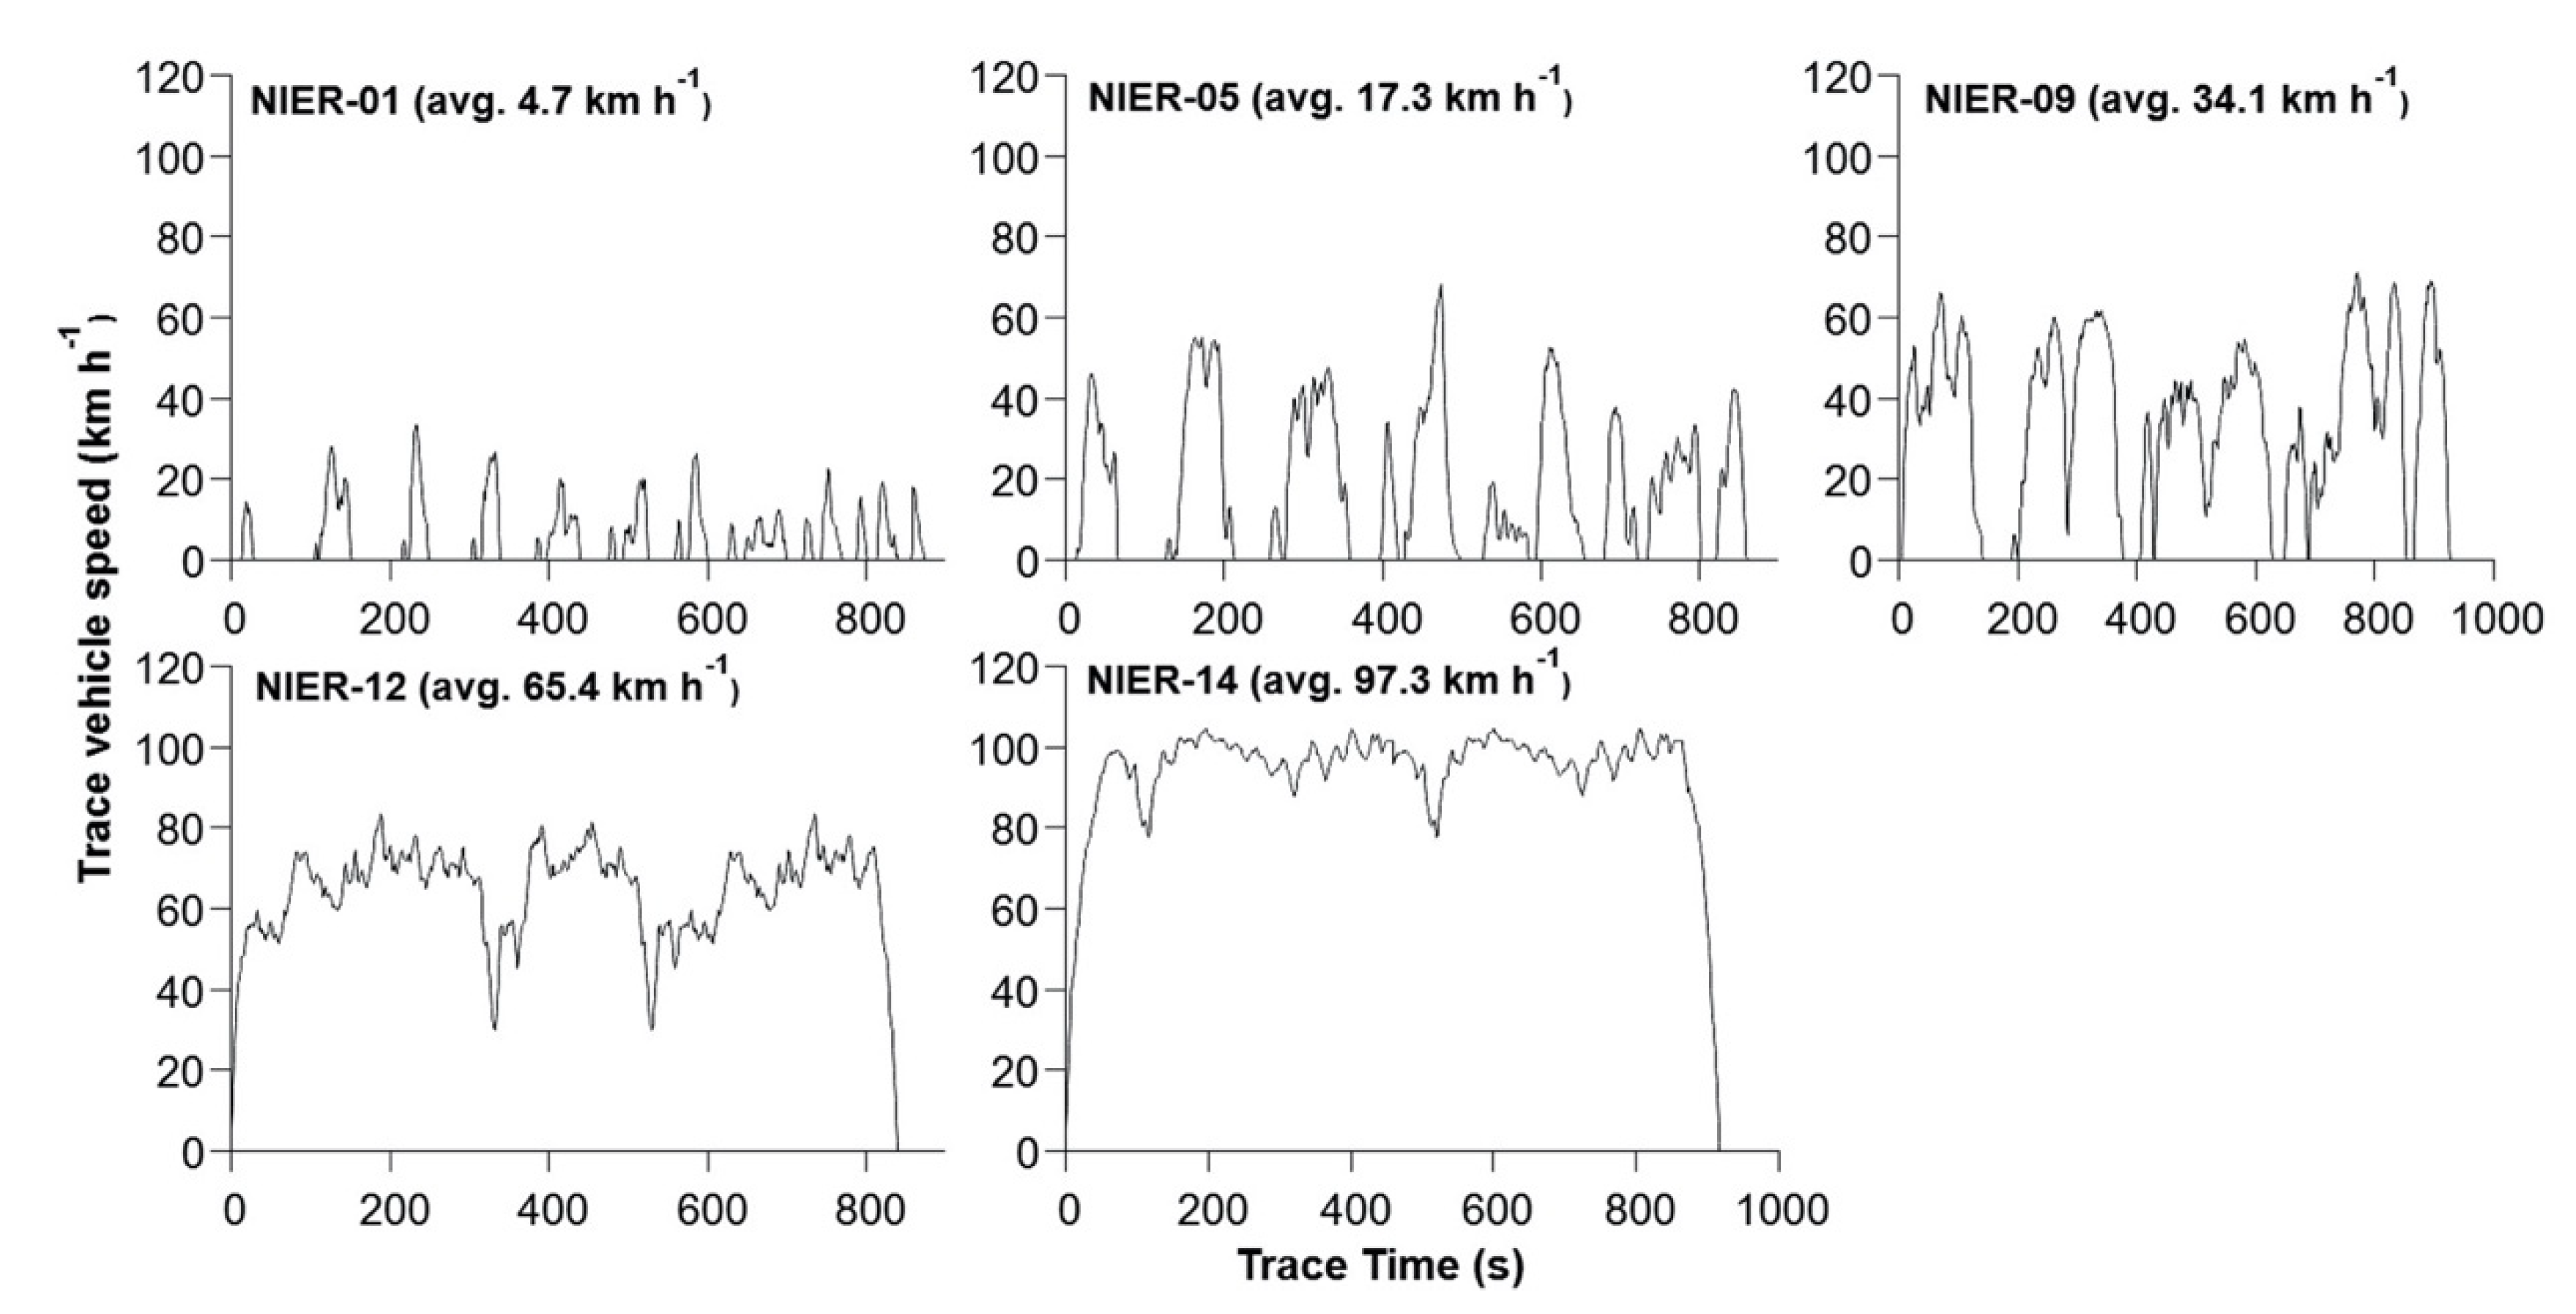
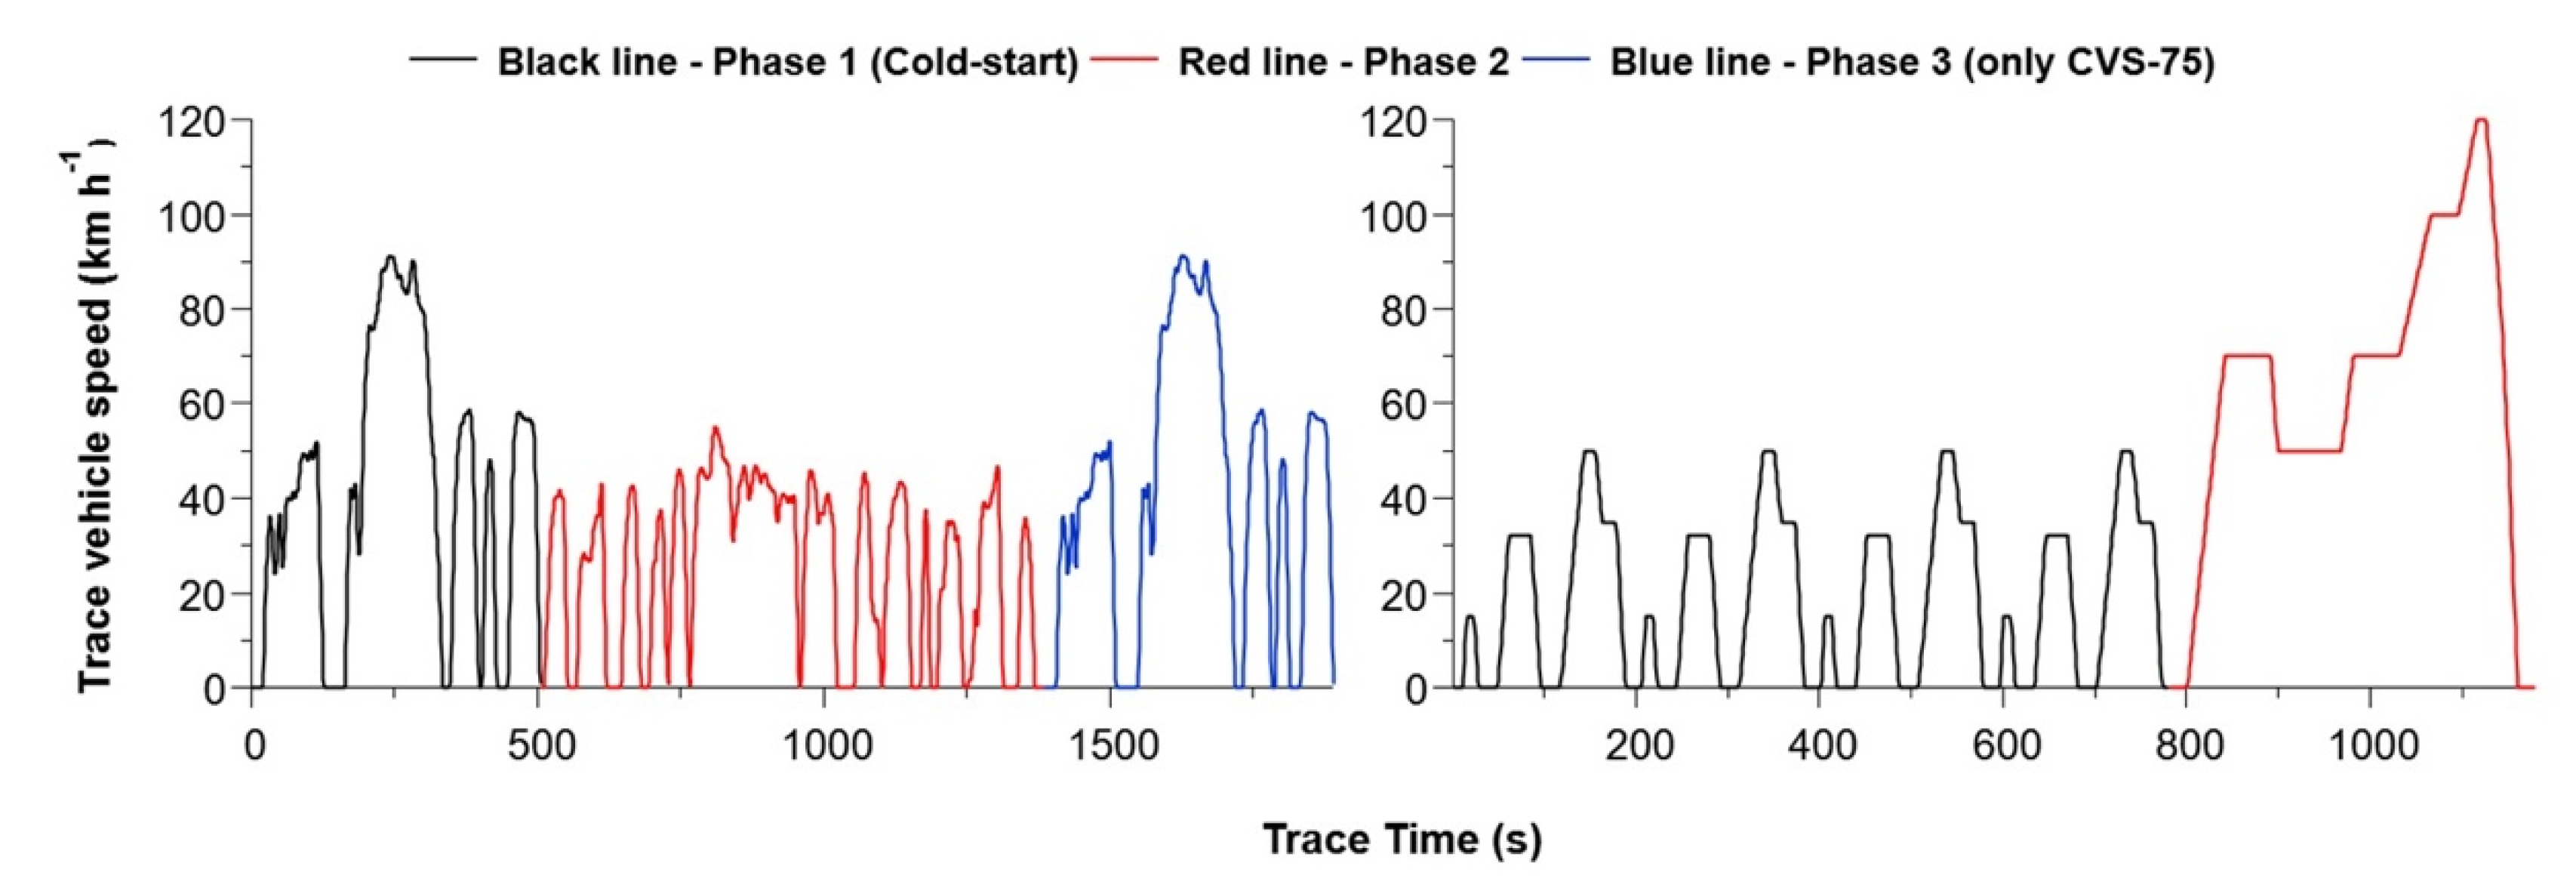
2.1. Vehicle Selection and Driving Modes
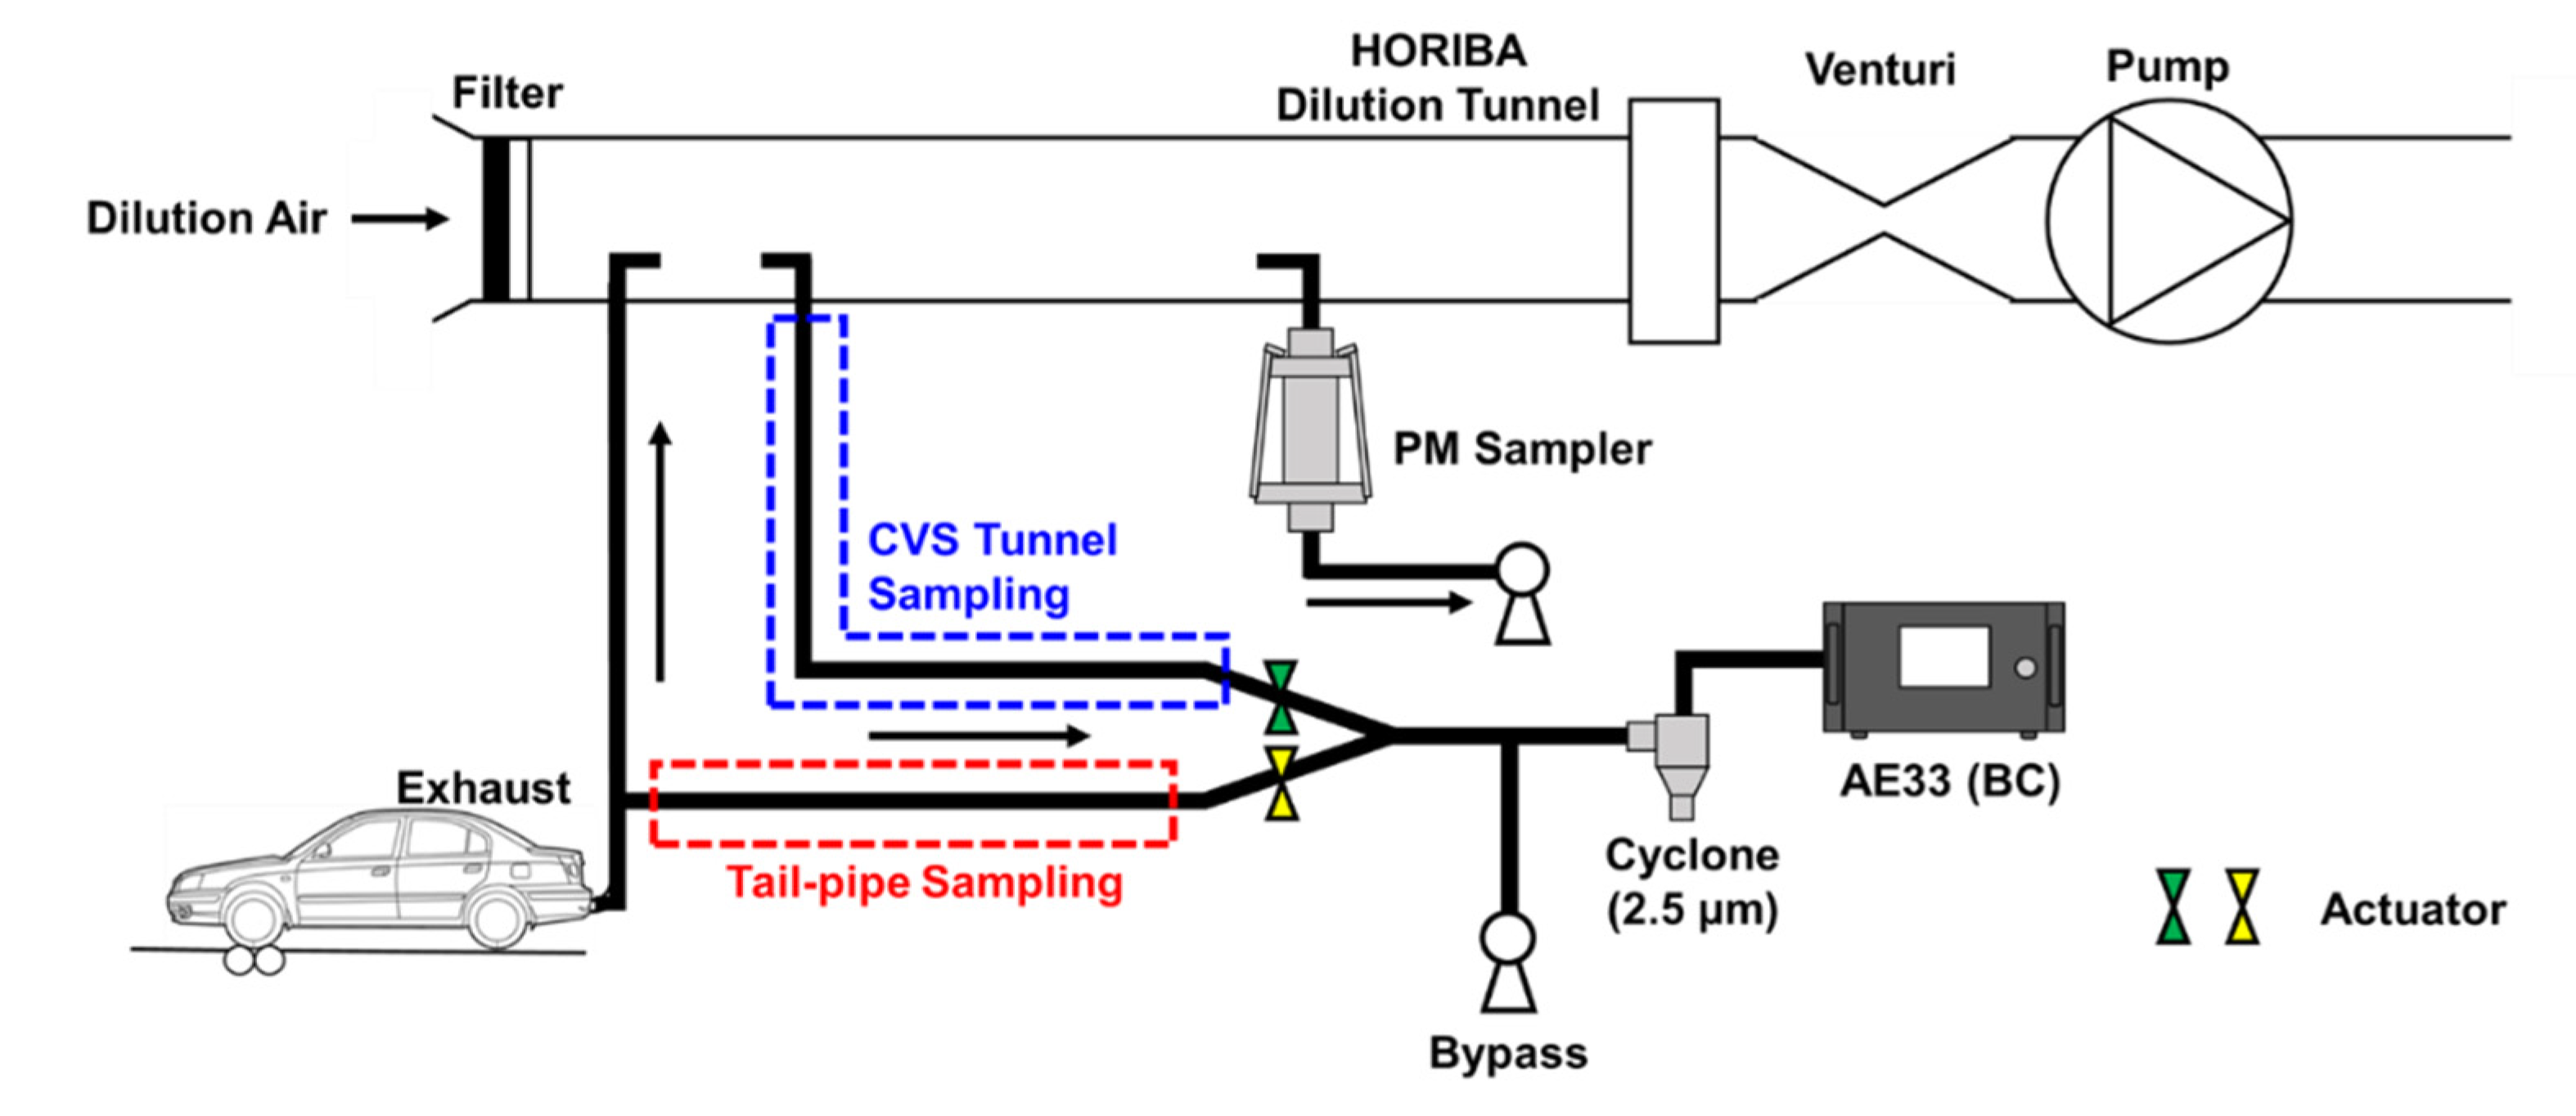
2.2. Measurement Method and Calculation Formula for Emission Estimation
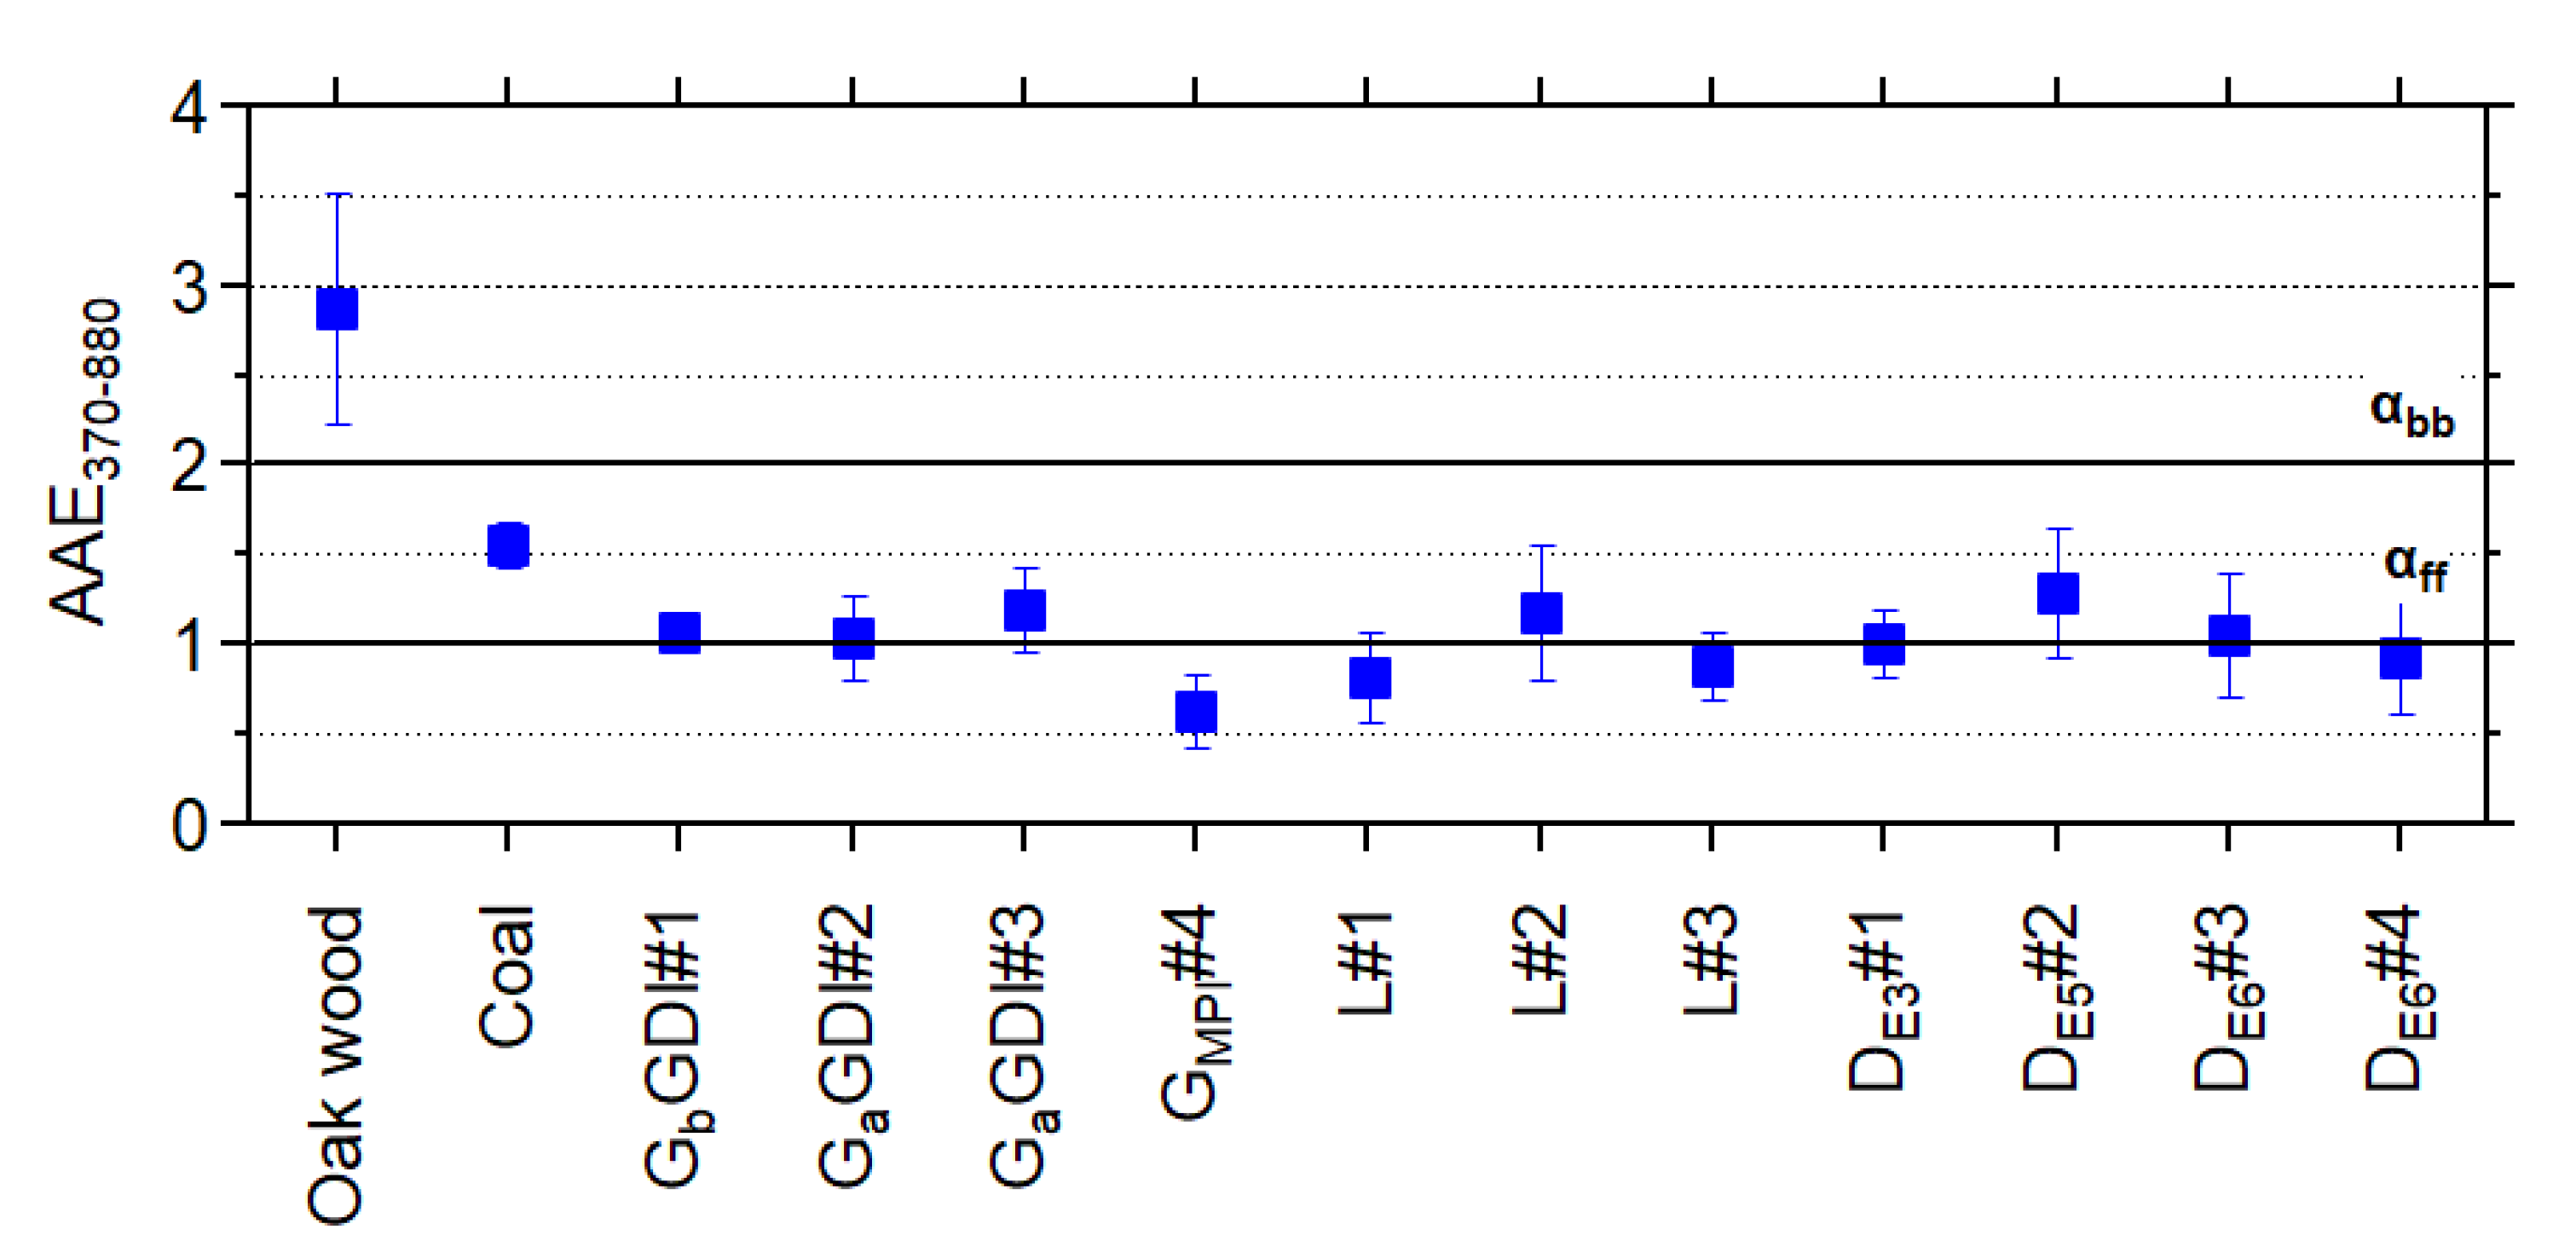
2.3. Calculation of a Absorption Ångström Exponent (AAE)
3. Results
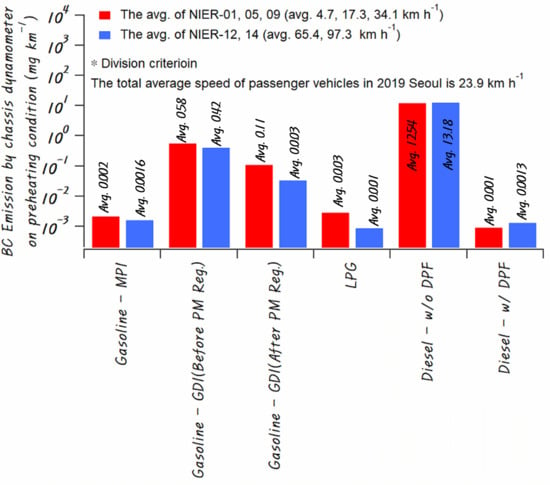
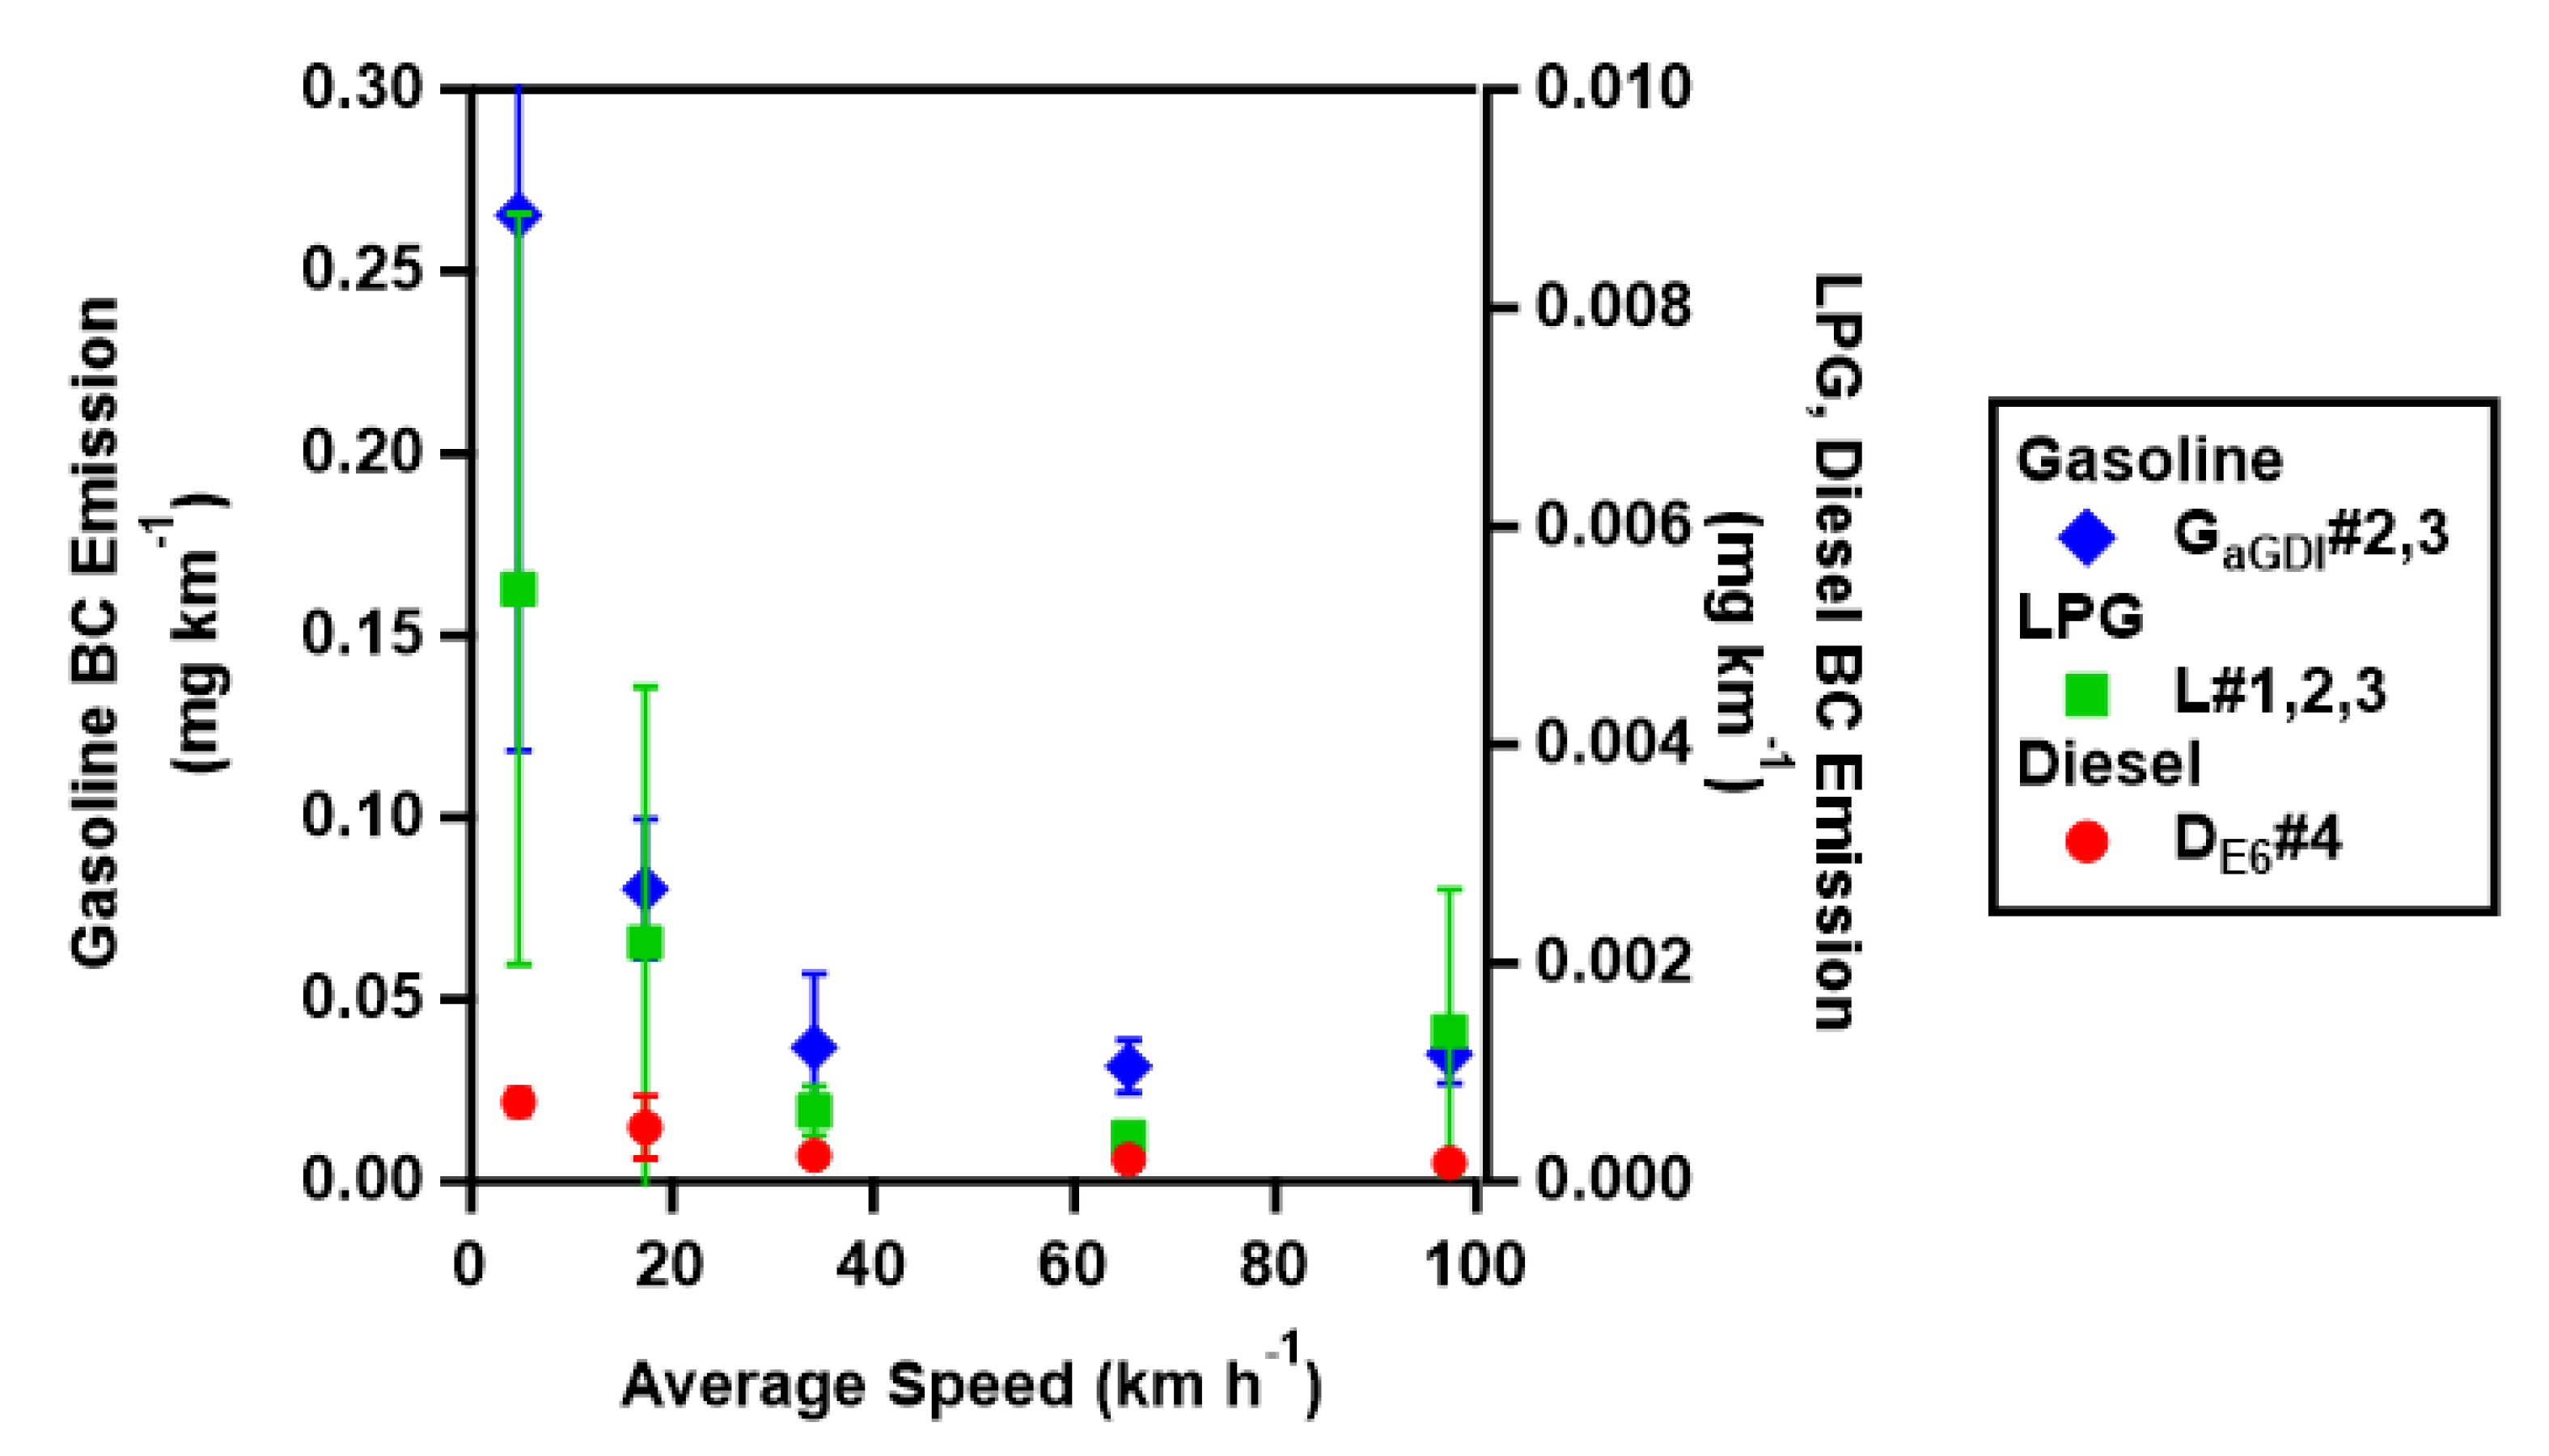
3.1. BC Emission by Fuel Types According to NIER and Regulation Mode
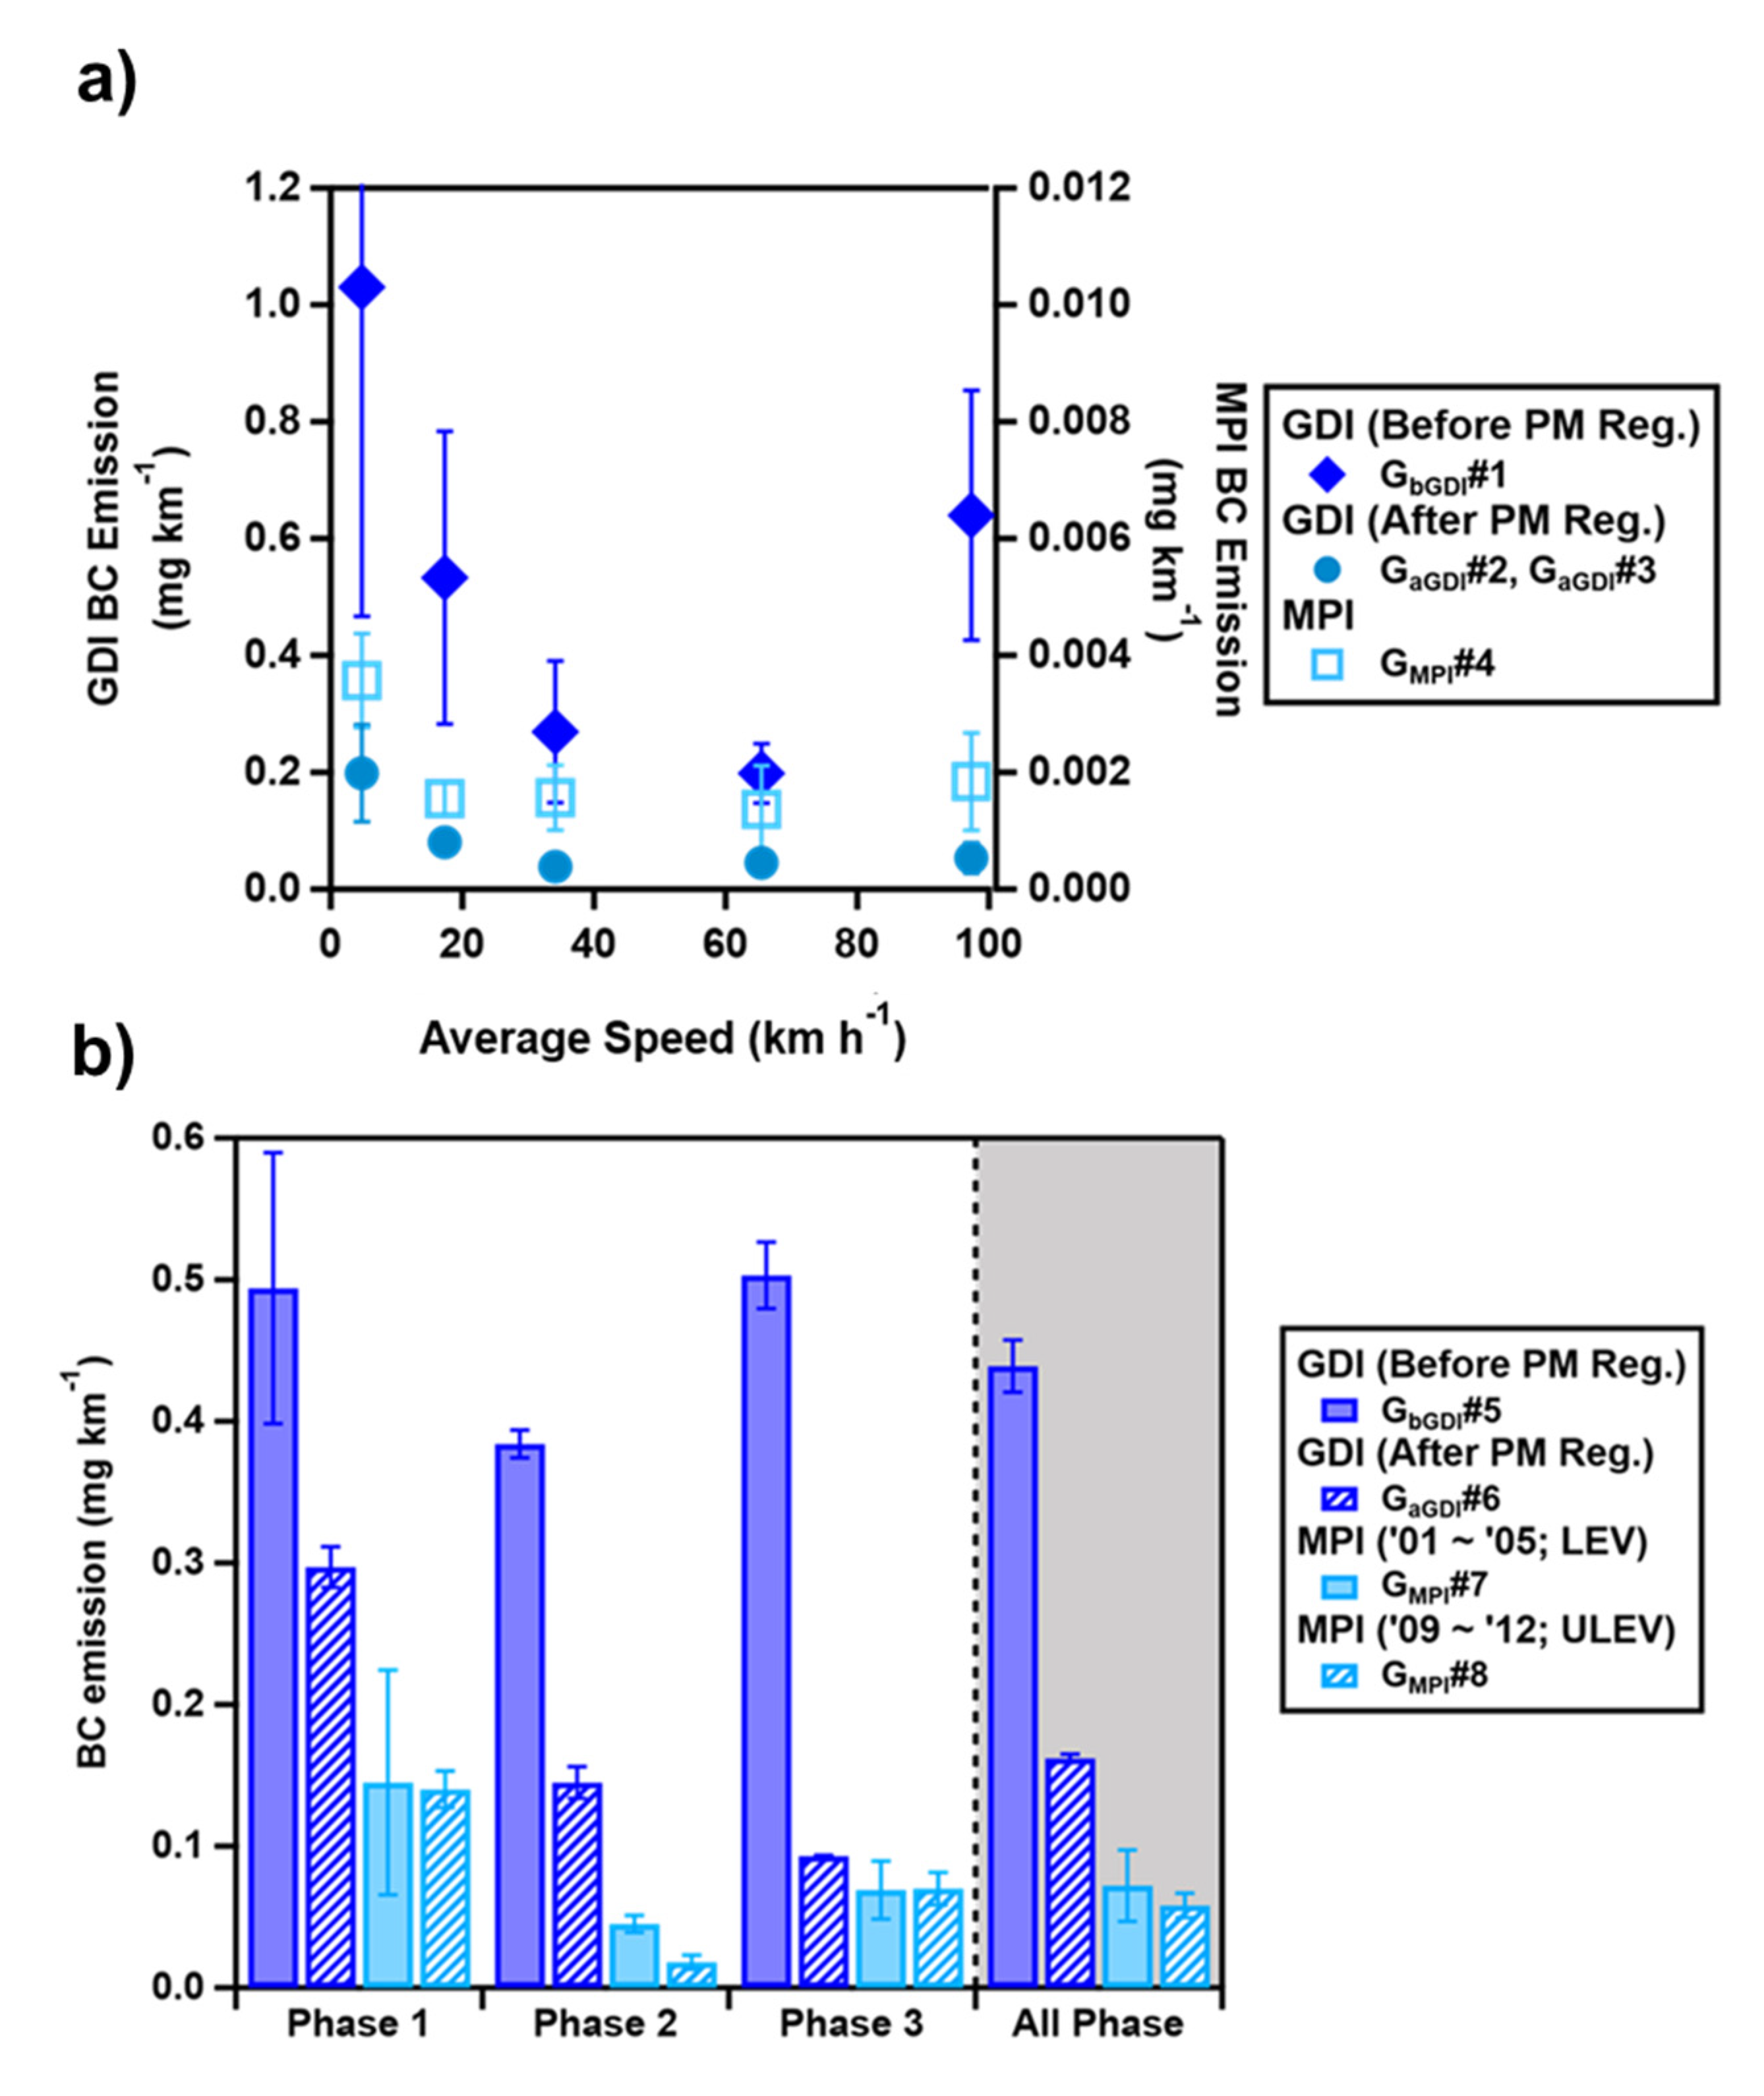
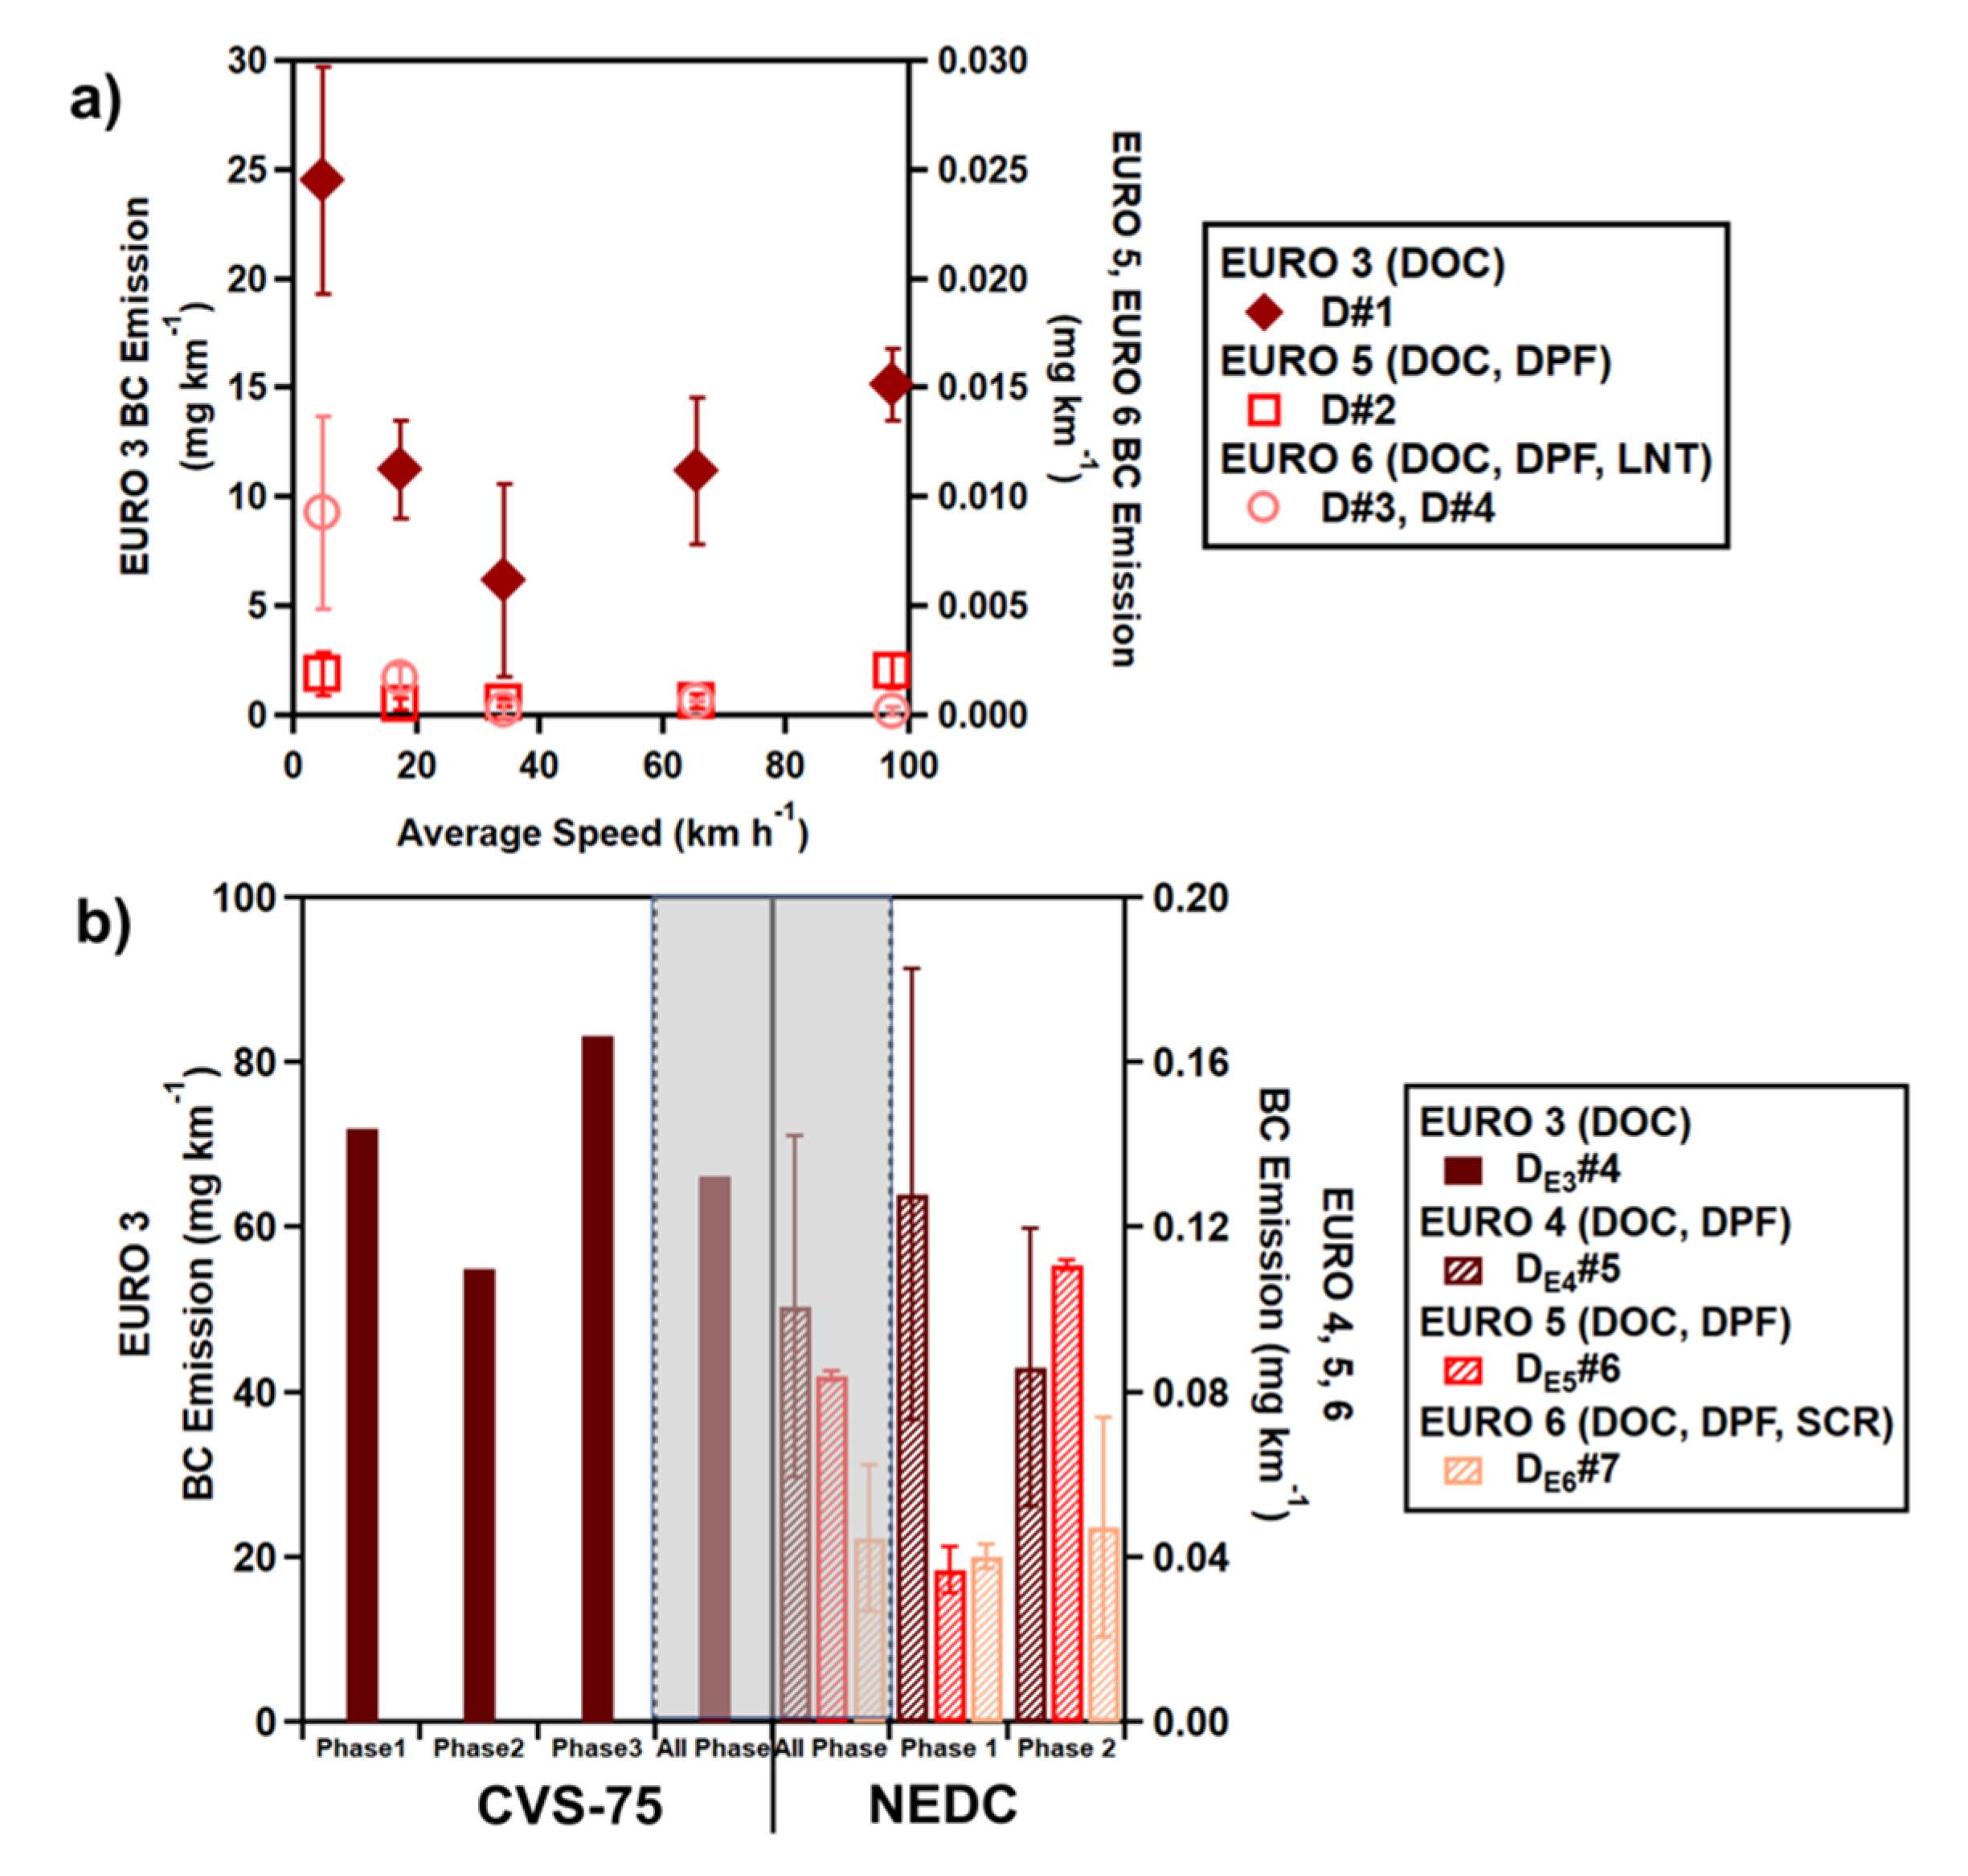
3.2. BC Emission According to Engine Characteristics and Tightening of Regulations
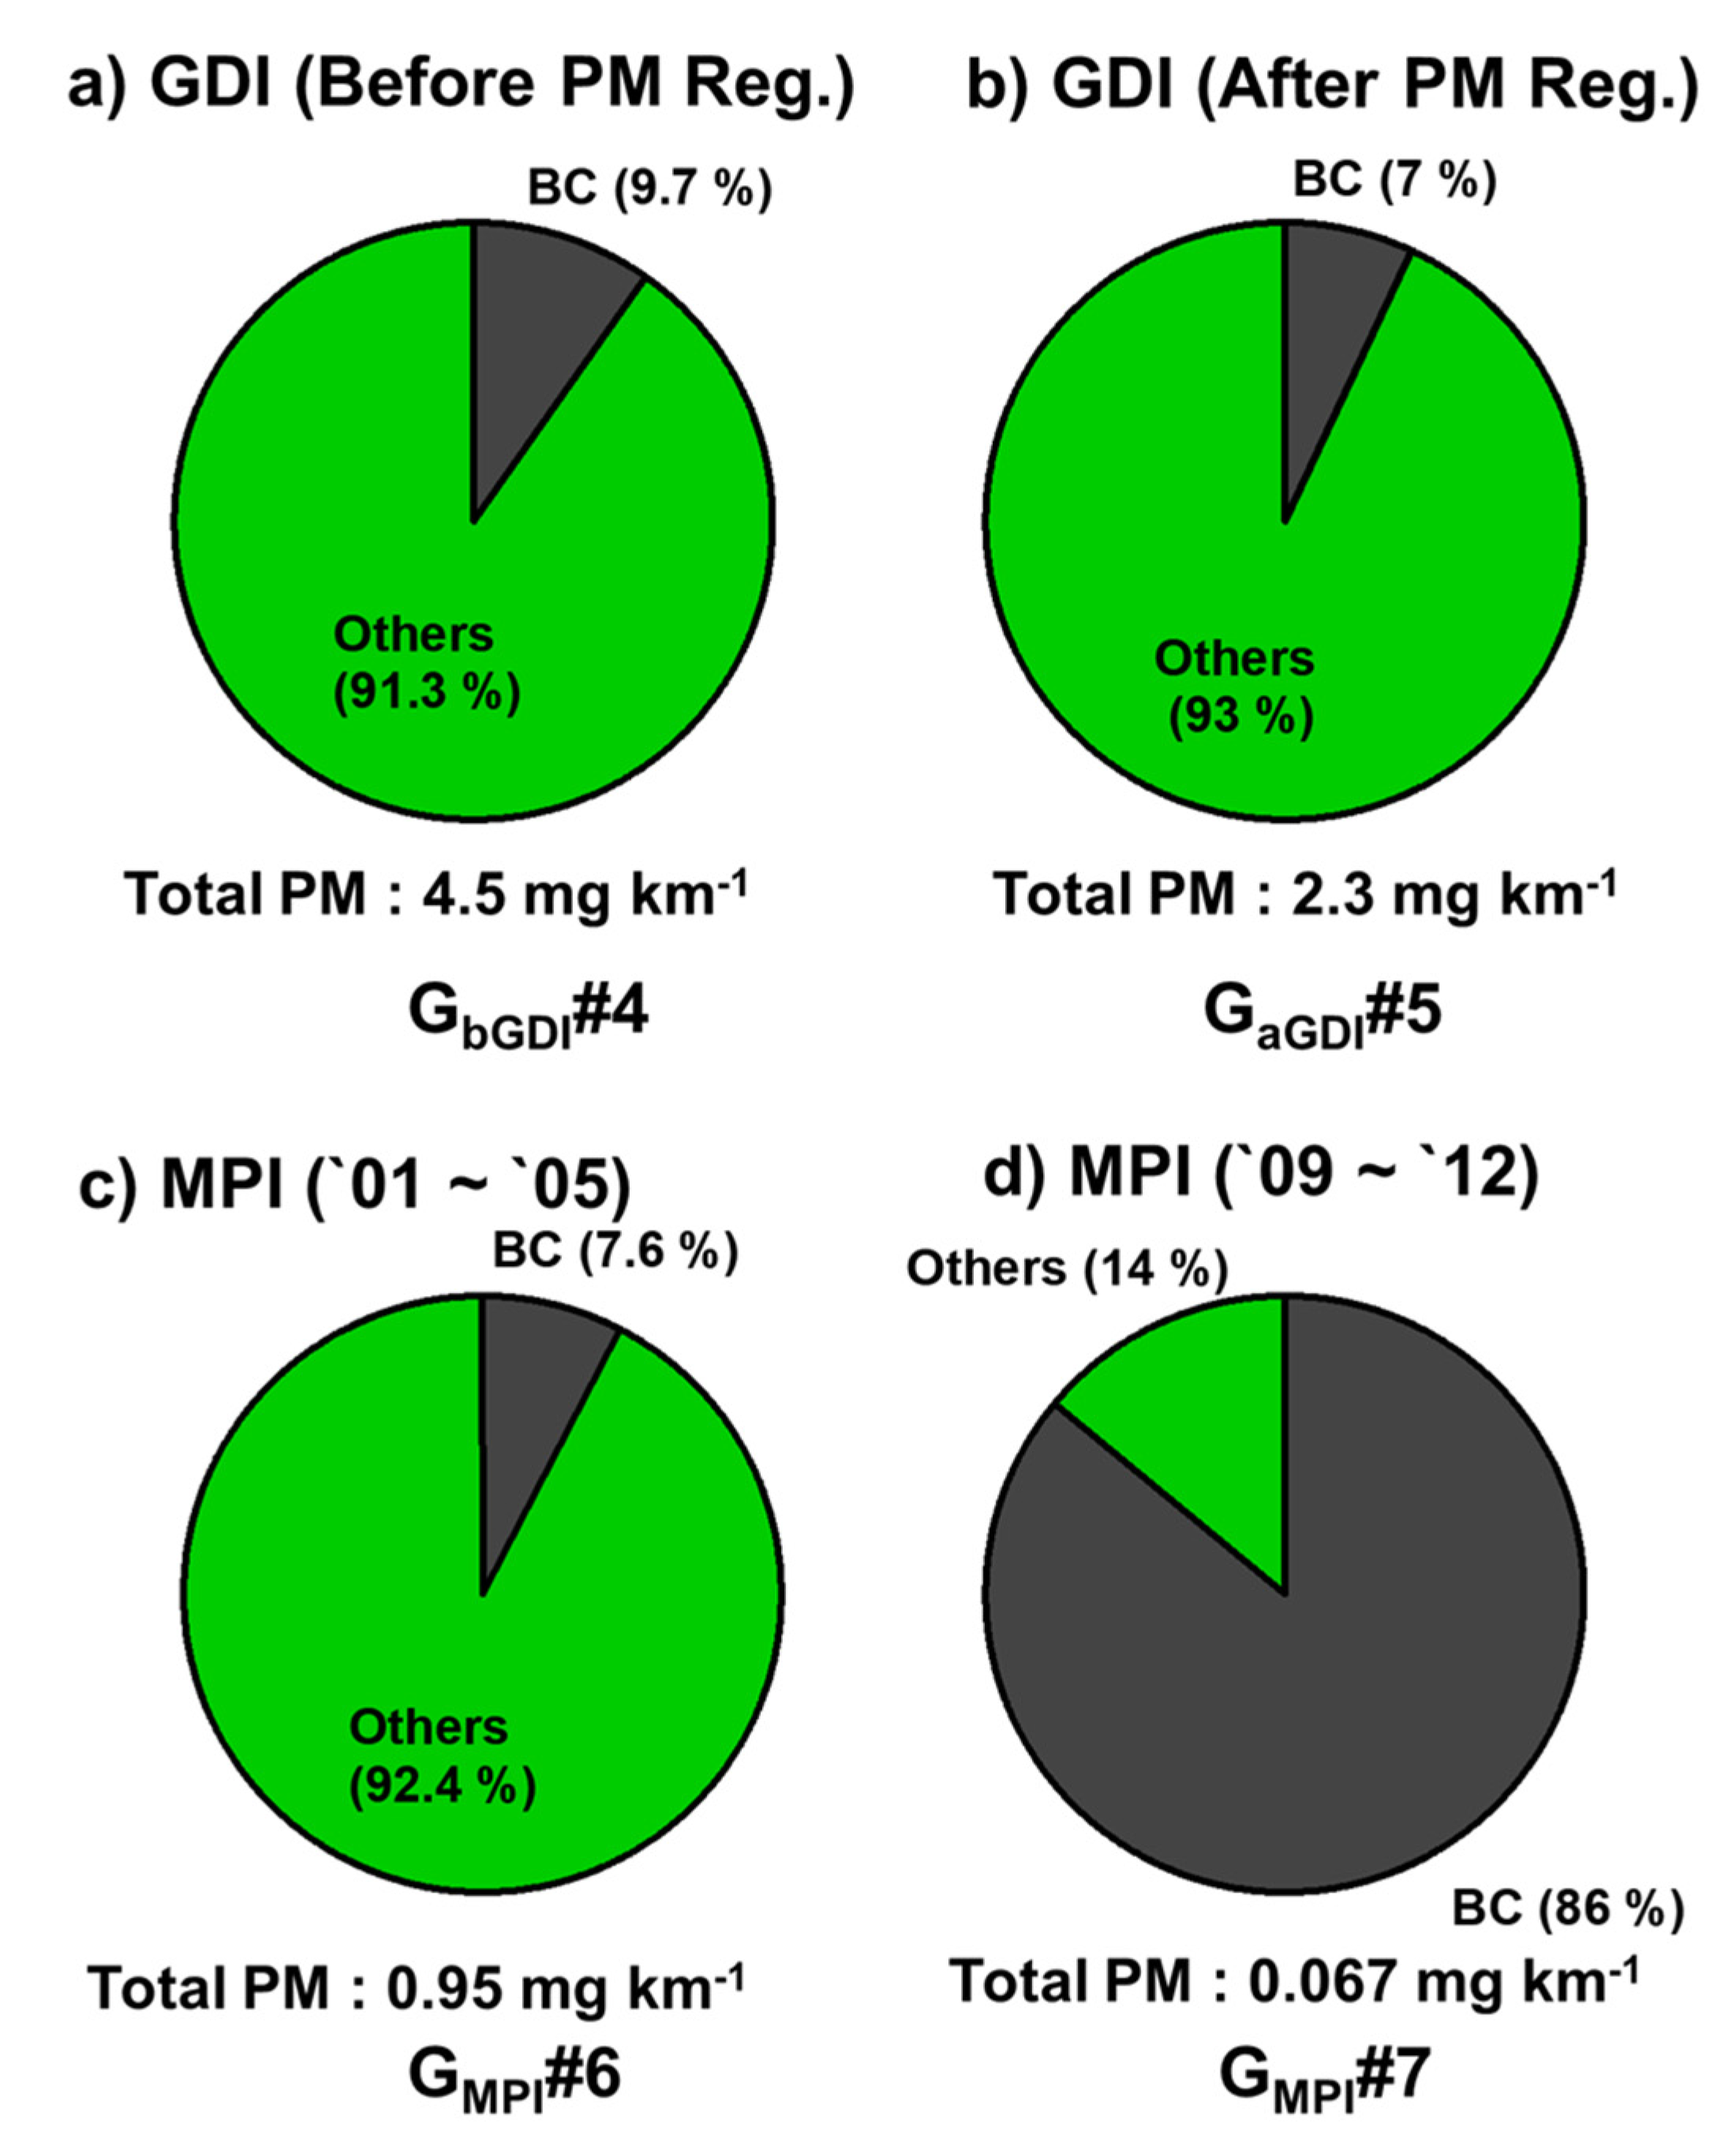
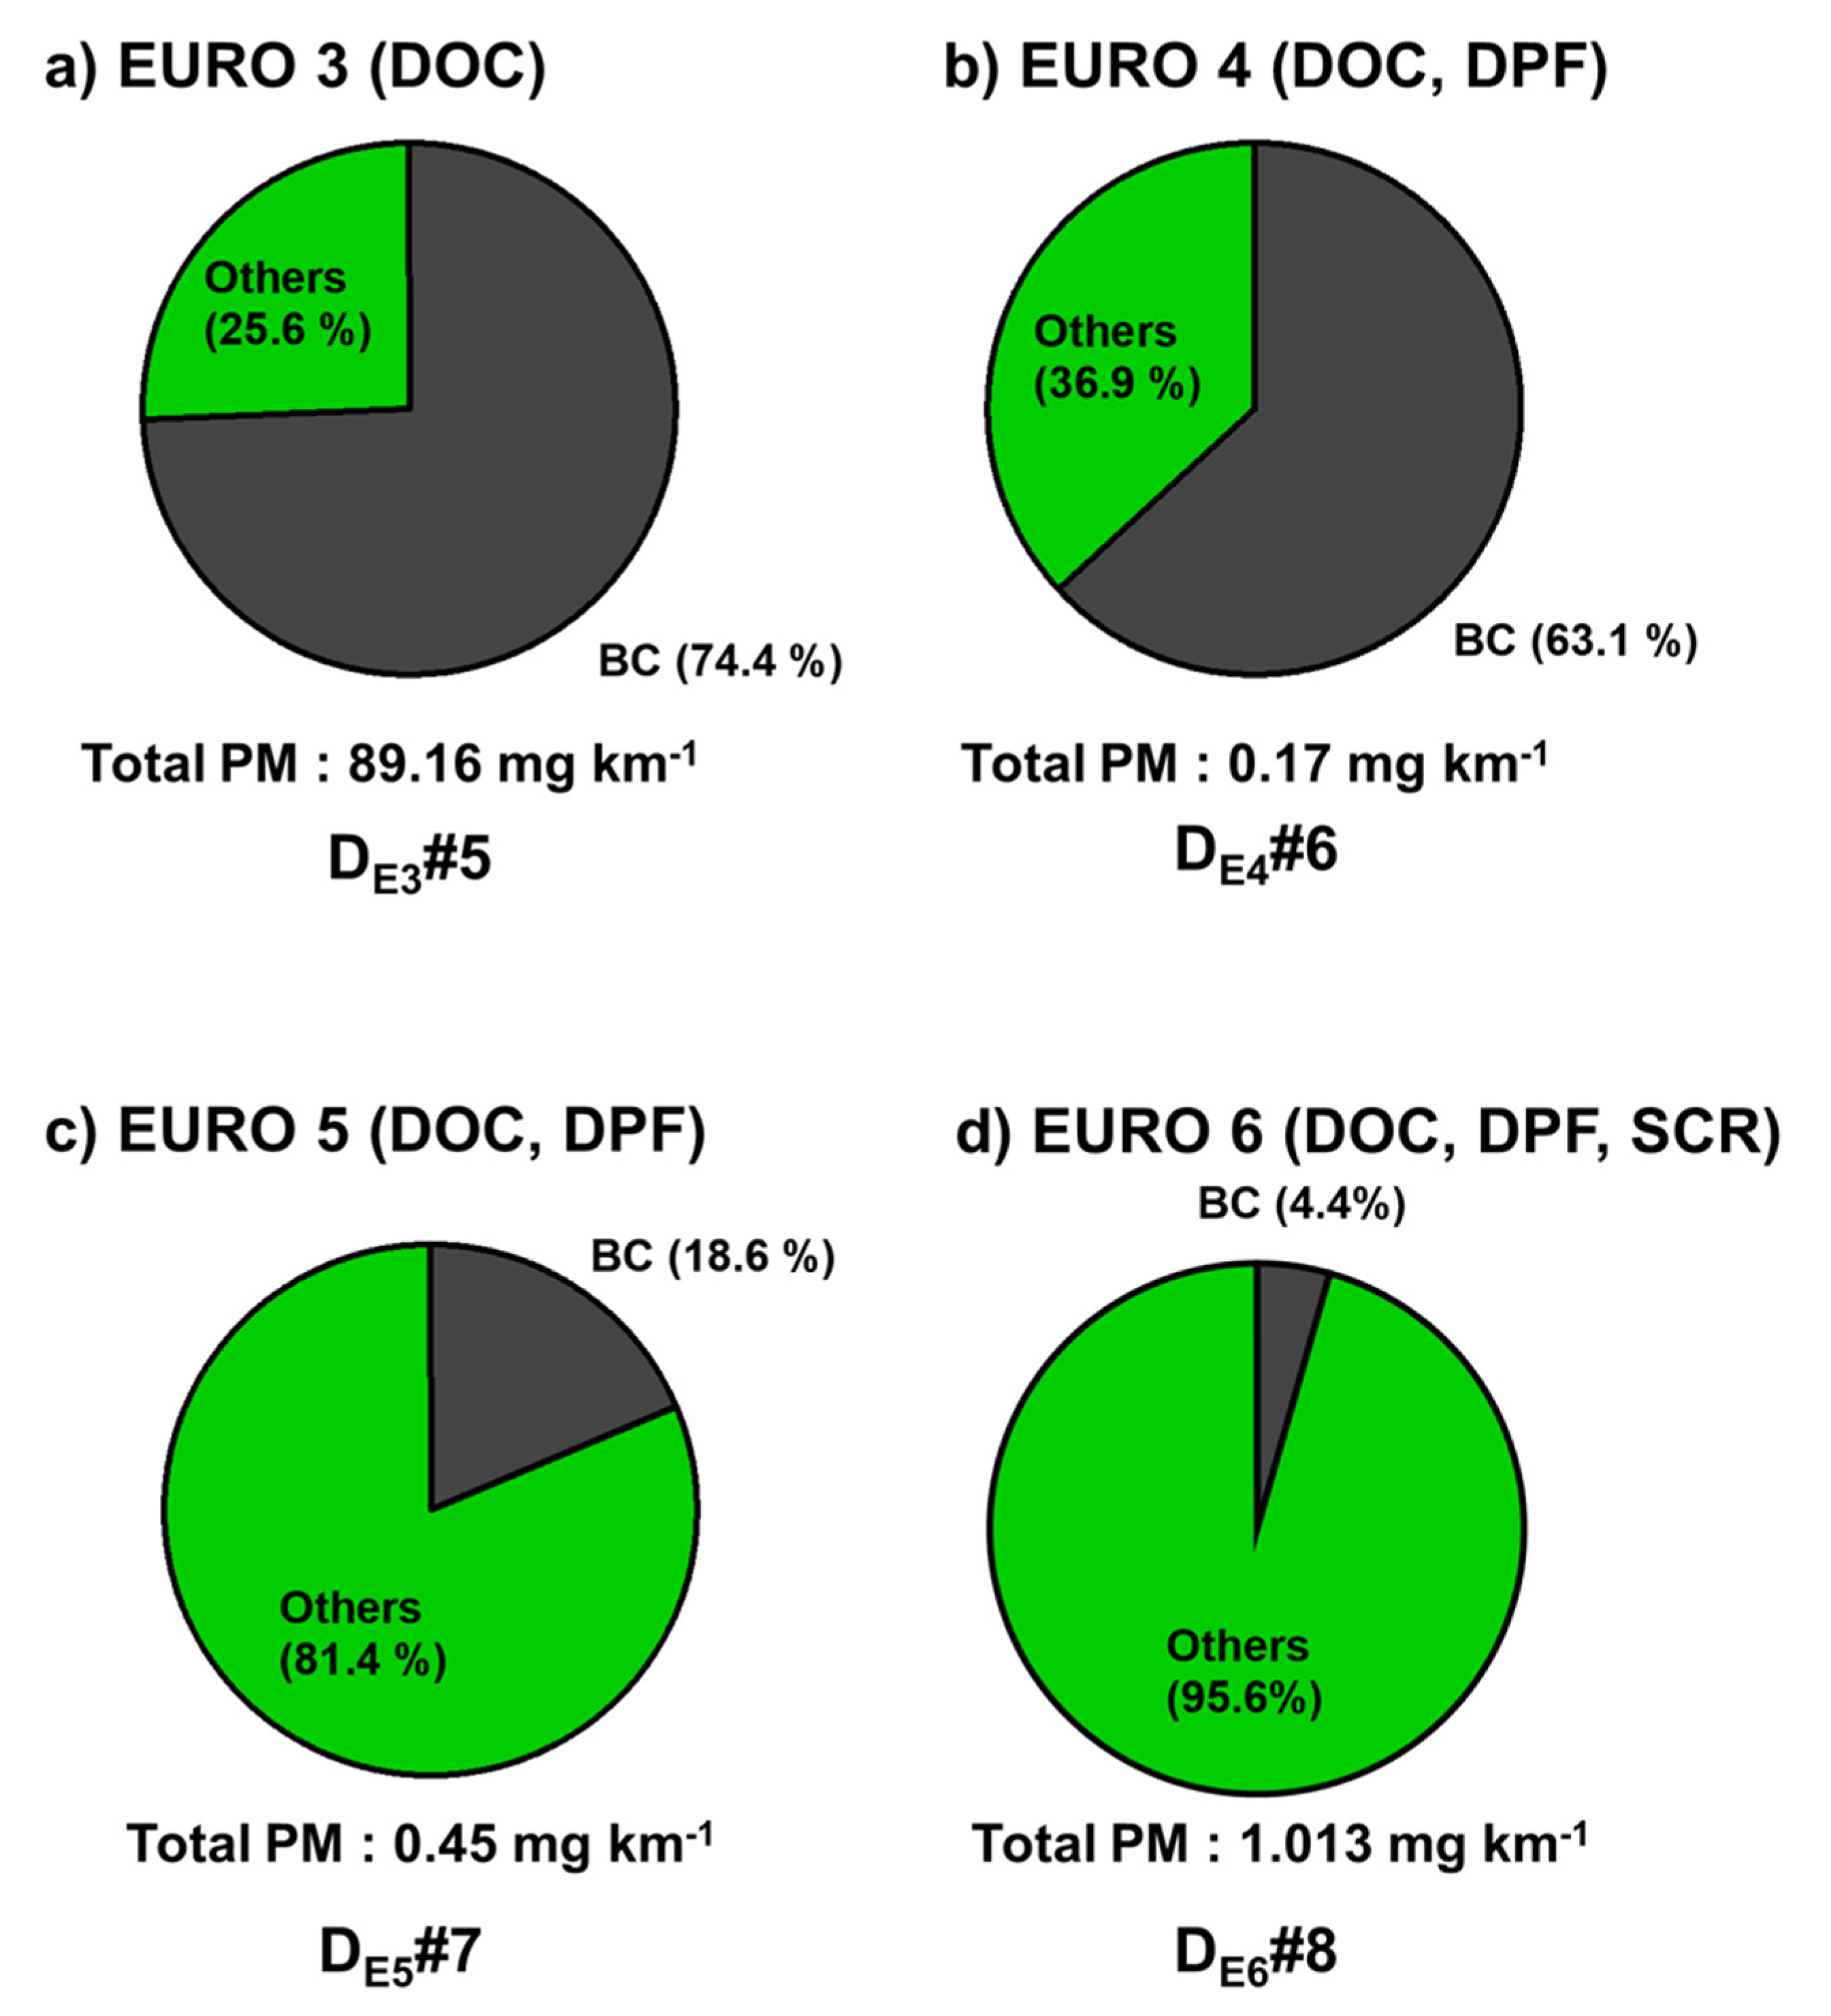
3.3. Characteristics of BC Emissions by Emission Source
4. Conclusions
Author Contributions
Funding
Acknowledgments
Conflicts of Interest
References
- Park, S.-S.; Yu, G.-H.; Lee, S.-I.; Bae, M.-S. Aethalometer-based Estimate of Mass Absorption Cross Section of Black Carbon Particles at an Urban Site of Gwangju. J. Korea Soc. Atmos. Environ. 2018, 34, 727–734. [Google Scholar] [CrossRef]
- Ramanathan, V.; Carmichael, G. Global and regional climate changes due to black carbon. Nat. Geosci. 2008, 1, 221–227. [Google Scholar] [CrossRef]
- Bond, T.C.; Doherty, S.J.; Fahey, D.W.; Forster, P.M.; Berntsen, T.; DeAngelo, B.J.; Flanner, M.G.; Ghan, S.; Kärcher, B.; Koch, D. Bounding the role of black carbon in the climate system: A scientific assessment. J. Geophys. Res. Atmos. 2013, 118, 5380–5552. [Google Scholar] [CrossRef]
- Seo, J.; Kim, J.Y.; Youn, D. Climate Impact of Black Carbon Emissions from Marine Engines. Korean Soc. Mech. Eng. 2015, 3965–3970. [Google Scholar]
- Janssen, N.; Gerlofs-Nijland, M.; Lanki, T.; Salonen, R.; Cassee, F.; Hoek, G.; Fischer, P.; Brunekreef, B.; Krzyzanowski, M. Health Effects of Black Carbon; WHO: Geneva, Switzerland, 2012. [Google Scholar]
- Roosbroeck, S.V.; Hoek, G.; Meliefste, K.; Janssen, N.A.; Brunekreef, B. Validity of residential traffic intensity as an estimate of long-term personal exposure to traffic-related air pollution among adults. Environ. Sci. Technol. 2008, 42, 1337–1344. [Google Scholar] [CrossRef]
- Park, S.H. Estimation of Direct Radiation Forcing of Atmosperic Black Carbon Using Air Quality Modeling. J. Korean Soc. Environ. Technol. 2009, 10, 246–253. [Google Scholar]
- Bond, T.C.; Streets, D.G.; Yarber, K.F.; Nelson, S.M.; Woo, J.H.; Klimont, Z. A technology-based global inventory of black and organic carbon emissions from combustion. J. Geophys. Res. Atmos 2004, 109. [Google Scholar] [CrossRef] [Green Version]
- Chan, T.W.; Meloche, E.; Kubsh, J.; Brezny, R. Black carbon emissions in gasoline exhaust and a reduction alternative with a gasoline particulate filter. Environ. Sci. Technol. 2014, 48, 6027–6034. [Google Scholar] [CrossRef]
- Cédric, L.; Goriaux, M.; Tassel, P.; Perret, P.; André, M.; Liu, Y. Impact of aftertreatment device and driving conditions on black carbon, ultrafine particle and NOx emissions for Euro 5 diesel and gasoline vehicles. Trans. Res. Proc. 2016, 14, 3079–3088. [Google Scholar] [CrossRef] [Green Version]
- Heo, J.; Hopke, P.; Yi, S. Source apportionment of PM2. 5 in Seoul, Korea. Atmos. Chem. Phys. 2009, 9, 4957–4971. [Google Scholar] [CrossRef] [Green Version]
- Bae, G.; Lee, S. Contamination Level of Vehicle-Related Air Pollutants at a Roadside in the Downtown Area of Seoul. In Proceeding of the 2009 KSAE Annual Conference, Incheon, Korea, 29 April 2009; pp. 340–345. [Google Scholar]
- Song, S.; Wu, Y.; Xu, J.; Ohara, T.; Hasegawa, S.; Li, J.; Yang, L.; Hao, J. Black carbon at a roadside site in Beijing: Temporal variations and relationships with carbon monoxide and particle number size distribution. Atmos. Environ. 2013, 77, 213–221. [Google Scholar] [CrossRef]
- Pérez, N.; Pey, J.; Cusack, M.; Reche, C.; Querol, X.; Alastuey, A.; Viana, M. Variability of particle number, black carbon, and PM10, PM2.5, and PM1 levels and speciation: Influence of road traffic emissions on urban air quality. Aerosol. Sci. Technol. 2010, 44, 487–499. [Google Scholar] [CrossRef]
- Stacey, B.; Harrison, R.M.; Pope, F. Evaluation of ultrafine particle concentrations and size distributions at London Heathrow Airport. Atmos. Environ. 2020, 222, 117148. [Google Scholar] [CrossRef]
- Park, G.; Mun, S.; Hong, H.; Chung, T.; Jung, S.; Kim, S.; Seo, S.; Kim, J.; Lee, J.; Kim, K. Characterization of emission factors concerning gasoline, LPG, and diesel vehicles via transient chassis-dynamometer tests. Appl. Sci. 2019, 9, 1573. [Google Scholar] [CrossRef] [Green Version]
- Drinovec, L.; Močnik, G.; Zotter, P.; Prévôt, A.; Ruckstuhl, C.; Coz, E.; Rupakheti, M.; Sciare, J.; Müller, T.; Wiedensohler, A. The “dual-spot” Aethalometer: An improved measurement of aerosol black carbon with real-time loading compensation. Atmos. Meas. Tech. 2015, 8, 1965–1979. [Google Scholar] [CrossRef] [Green Version]
- Mrozek, P.M.; Watson, T.M. The determination of EPA city fuel economy from hot start results. SAE Trans. 1994, 103, 44–50. [Google Scholar]
- Olson, M.R.; Victoria Garcia, M.; Robinson, M.A.; Van Rooy, P.; Dietenberger, M.A.; Bergin, M.; Schauer, J.J. Investigation of black and brown carbon multiple-wavelength-dependent light absorption from biomass and fossil fuel combustion source emissions. J. Geophys. Res. Atmos. 2015, 120, 6682–6697. [Google Scholar] [CrossRef]
- Wu, G.-M.; Cong, Z.-Y.; Kang, S.-C.; Kawamura, K.; Fu, P.-Q.; Zhang, Y.-L.; Wan, X.; Gao, S.-P.; Liu, B. Brown carbon in the cryosphere: Current knowledge and perspective. Adv. Clim. Change Res. 2016, 7, 82–89. [Google Scholar] [CrossRef]
- Liu, C.; Chung, C.E.; Yin, Y.; Schnaiter, M. The absorption Ångström exponent of black carbon: From numerical aspects. Atmos. Chem. Phys. 2018, 18, 6259–6273. [Google Scholar] [CrossRef] [Green Version]
- Fushimi, A.; Kondo, Y.; Kobayashi, S.; Fujitani, Y.; Saitoh, K.; Takami, A.; Tanabe, K. Chemical composition and source of fine and nanoparticles from recent direct injection gasoline passenger cars: Effects of fuel and ambient temperature. Atmos. Environ. 2016, 124, 77–84. [Google Scholar] [CrossRef]
- Pieber, S.M.; Kumar, N.K.; Klein, F.; Comte, P.; Bhattu, D.; Dommen, J.; Bruns, E.A.; Kılıç, D.; Haddad, I.E.; Keller, A. Gas-phase composition and secondary organic aerosol formation from standard and particle filter-retrofitted gasoline direct injection vehicles investigated in a batch and flow reactor. Atmos. Chem. Phys. 2018, 18, 9929–9954. [Google Scholar] [CrossRef] [Green Version]
- Saliba, G.; Saleh, R.; Zhao, Y.; Presto, A.A.; Lambe, A.T.; Frodin, B.; Sardar, S.; Maldonado, H.; Maddox, C.; May, A.A. Comparison of gasoline direct-injection (GDI) and port fuel injection (PFI) vehicle emissions: Emission certification standards, cold-start, secondary organic aerosol formation potential, and potential climate impacts. Environ. Sci. Technol. 2017, 51, 6542–6552. [Google Scholar] [CrossRef]
- Deng, W.; Fang, Z.; Wang, Z.; Zhu, M.; Zhang, Y.; Tang, M.; Song, W.; Lowther, S.; Huang, Z.; Jones, K. Primary emissions and secondary organic aerosol formation from in-use diesel vehicle exhaust: Comparison between idling and cruise mode. Sci. Total Environ. 2020, 699, 134357. [Google Scholar] [CrossRef] [PubMed]
- Kim, Y.; Kim, K.; Lee, K. Effect of a 2-stage injection strategy on the combustion and flame characteristics in a PCCI engine. Int. J. Automot. Technol. 2011, 12, 639. [Google Scholar] [CrossRef]
- Sun, J.Y.; Wu, C.; Wu, D.; Cheng, C.; Li, M.; Li, L.; Deng, T.; Yu, J.Z.; Li, Y.J.; Zhou, Q. Amplification of black carbon light absorption induced by atmospheric aging: Temporal variation at seasonal and diel scales in urban Guangzhou. Atmos. Chem. Phys. 2020, 20, 2445–2470. [Google Scholar] [CrossRef] [Green Version]
- Goetz, J.D.; Giordano, M.R.; Stockwell, C.E.; Christian, T.J.; Maharjan, R.; Adhikari, S.; Bhave, P.V.; Praveen, P.S.; Panday, A.K.; Jayarathne, T. Speciated online PM1 from South Asian combustion sources-Part 1: Fuel-based emission factors and size distributions. Atmos. Chem. Phys. 2018, 18, 14653–14679. [Google Scholar] [CrossRef] [Green Version]
- Kirchstetter, T.W.; Novakov, T.; Hobbs, P.V. Evidence that the spectral dependence of light absorption by aerosols is affected by organic carbon. J. Geophys. Res. Atmos. 2004, 109. [Google Scholar] [CrossRef] [Green Version]
- Laskin, A.; Laskin, J.; Nizkorodov, S.A. Chemistry of atmospheric brown carbon. Chem. Rev. 2015, 115, 4335–4382. [Google Scholar] [CrossRef] [Green Version]
- Blanco-Alegre, C.; Calvo, A.; Alves, C.; Fialho, P.; Nunes, T.; Gomes, J.; Castro, A.; Oduber, F.; Coz, E.; Fraile, R. Aethalometer measurements in a road tunnel: A step forward in the characterization of black carbon emissions from traffic. Sci. Total Environ. 2020, 703, 135483. [Google Scholar] [CrossRef]
- Tan, Y.; Wang, H.; Shi, S.; Shen, L.; Zhang, C.; Zhu, B.; Guo, S.; Wu, Z.; Song, Z.; Yin, Y. Annual variations of black carbon over the Yangtze River Delta from 2015 to 2018. J. Environ. Sci. 2020, 96, 72–84. [Google Scholar] [CrossRef]
- Healy, R.; Sofowote, U.; Su, Y.; Debosz, J.; Noble, M.; Jeong, C.-H.; Wang, J.; Hilker, N.; Evans, G.; Doerksen, G. Ambient measurements and source apportionment of fossil fuel and biomass burning black carbon in Ontario. Atmos. Environ. 2017, 161, 34–47. [Google Scholar] [CrossRef]
- Sandradewi, J.; Prévôt, A.S.; Szidat, S.; Perron, N.; Alfarra, M.R.; Lanz, V.A.; Weingartner, E.; Baltensperger, U. Using aerosol light absorption measurements for the quantitative determination of wood burning and traffic emission contributions to particulate matter. Environ. Sci. Technol. 2008, 42, 3316–3323. [Google Scholar] [CrossRef] [PubMed]
- Healy, R.M.; Wang, J.M.; Jeong, C.H.; Lee, A.K.; Willis, M.D.; Jaroudi, E.; Zimmerman, N.; Hilker, N.; Murphy, M.; Eckhardt, S. Light-absorbing properties of ambient black carbon and brown carbon from fossil fuel and biomass burning sources. J. Geophys. Res. Atmos. 2015, 120, 6619–6633. [Google Scholar] [CrossRef] [Green Version]


| No. | Vehicle | Type | Displacement (cc) | Fuel | After-Treatment | Engine and Regulation | Mode |
|---|---|---|---|---|---|---|---|
| 1 | GbGDI#1 | Passenger | 1600 | Gasoline | TWC | GDI (a) | NIER |
| 2 | GaGDI#2 | Passenger | 3000 | Gasoline | TWC | GDI (b) | NIER |
| 3 | GaGDI#3 | Passenger | 1600 | Gasoline | TWC | GDI (b) | NIER |
| 4 | GMPI#4 | Passenger | 2000 | Gasoline | TWC | MPI | NIER |
| 5 | L#1 | Passenger | 1600 | LPG | TWC | LPI | NIER |
| 6 | L#2 | Passenger | 3000 | LPG | TWC | LPI | NIER |
| 7 | L#3 | Passenger | 1600 | LPG | TWC | LPI | NIER |
| 8 | DE3#1 | SUV | 1991 | Diesel | DOC | EURO 3 | NIER |
| 9 | DE5#2 | Passenger | 1600 | Diesel | DOC, DPF | EURO 5 | NIER |
| 10 | DE6#3 | Passenger | 2200 | Diesel | DOC, DPF, LNT | EURO 6 | NIER |
| 11 | DE6#4 | Passenger | 1600 | Diesel | DOC, DPF, LNT | EURO 6 | NIER |
| 12 | GbGDI#5 | Passenger | 1600 | Gasoline | TWC | GDI (a) | CVS-75 |
| 13 | GaGDI#6 | Passenger | 1600 | Gasoline | TWC | GDI (b) | CVS-75 |
| 14 | GMPI#7 | Passenger | 2000 | Gasoline | TWC | MPI (c) | CVS-75 |
| 15 | GMPI#8 | Passenger | 2000 | Gasoline | TWC | MPI (d) | CVS-75 |
| 16 | L#4 | Passenger | 2000 | LPG | TWC | LPI | CVS-75 |
| 17 | DE3#5 | SUV | 2000 | Diesel | DOC | EURO 3 | CVS-75 |
| 18 | DE4#6 | SUV | 2000 | Diesel | DOC, DPF | EURO 4 | NEDC |
| 19 | DE5#7 | SUV | 2000 | Diesel | DOC, DPF | EURO 5 | NEDC |
| 20 | DE6#8 | Van | 2400 | Diesel | DOC, DPF, SCR | EURO 6 | NEDC |
| (Unit: mg km−1) | |||||
|---|---|---|---|---|---|
| Fuel | NIER-01 | NIER-05 | NIER-09 | NIER-12 | NIER-14 |
| Gasoline | 0.27 ± 0.14 | 0.08 ± 0.028 | 0.037 ± 0.016 | 0.032 ± 0.016 | 0.035 ± 0.0022 |
| LPG | 0.0054 ± 0.003 | 0.0021 ± 0.0023 | 0.0006 ± 0.0002 | 0.0004 ± 0.00001 | 0.0014 ± 0.0001 |
| Diesel | 0.0007 ± 0.0001 | 0.0005 ± 0.0003 | 0.00023 ± 0.00007 | 0.0002 ± 0.00008 | 0.0002 ± 0.00005 |
| (Unit: mg km−1) | |||
|---|---|---|---|
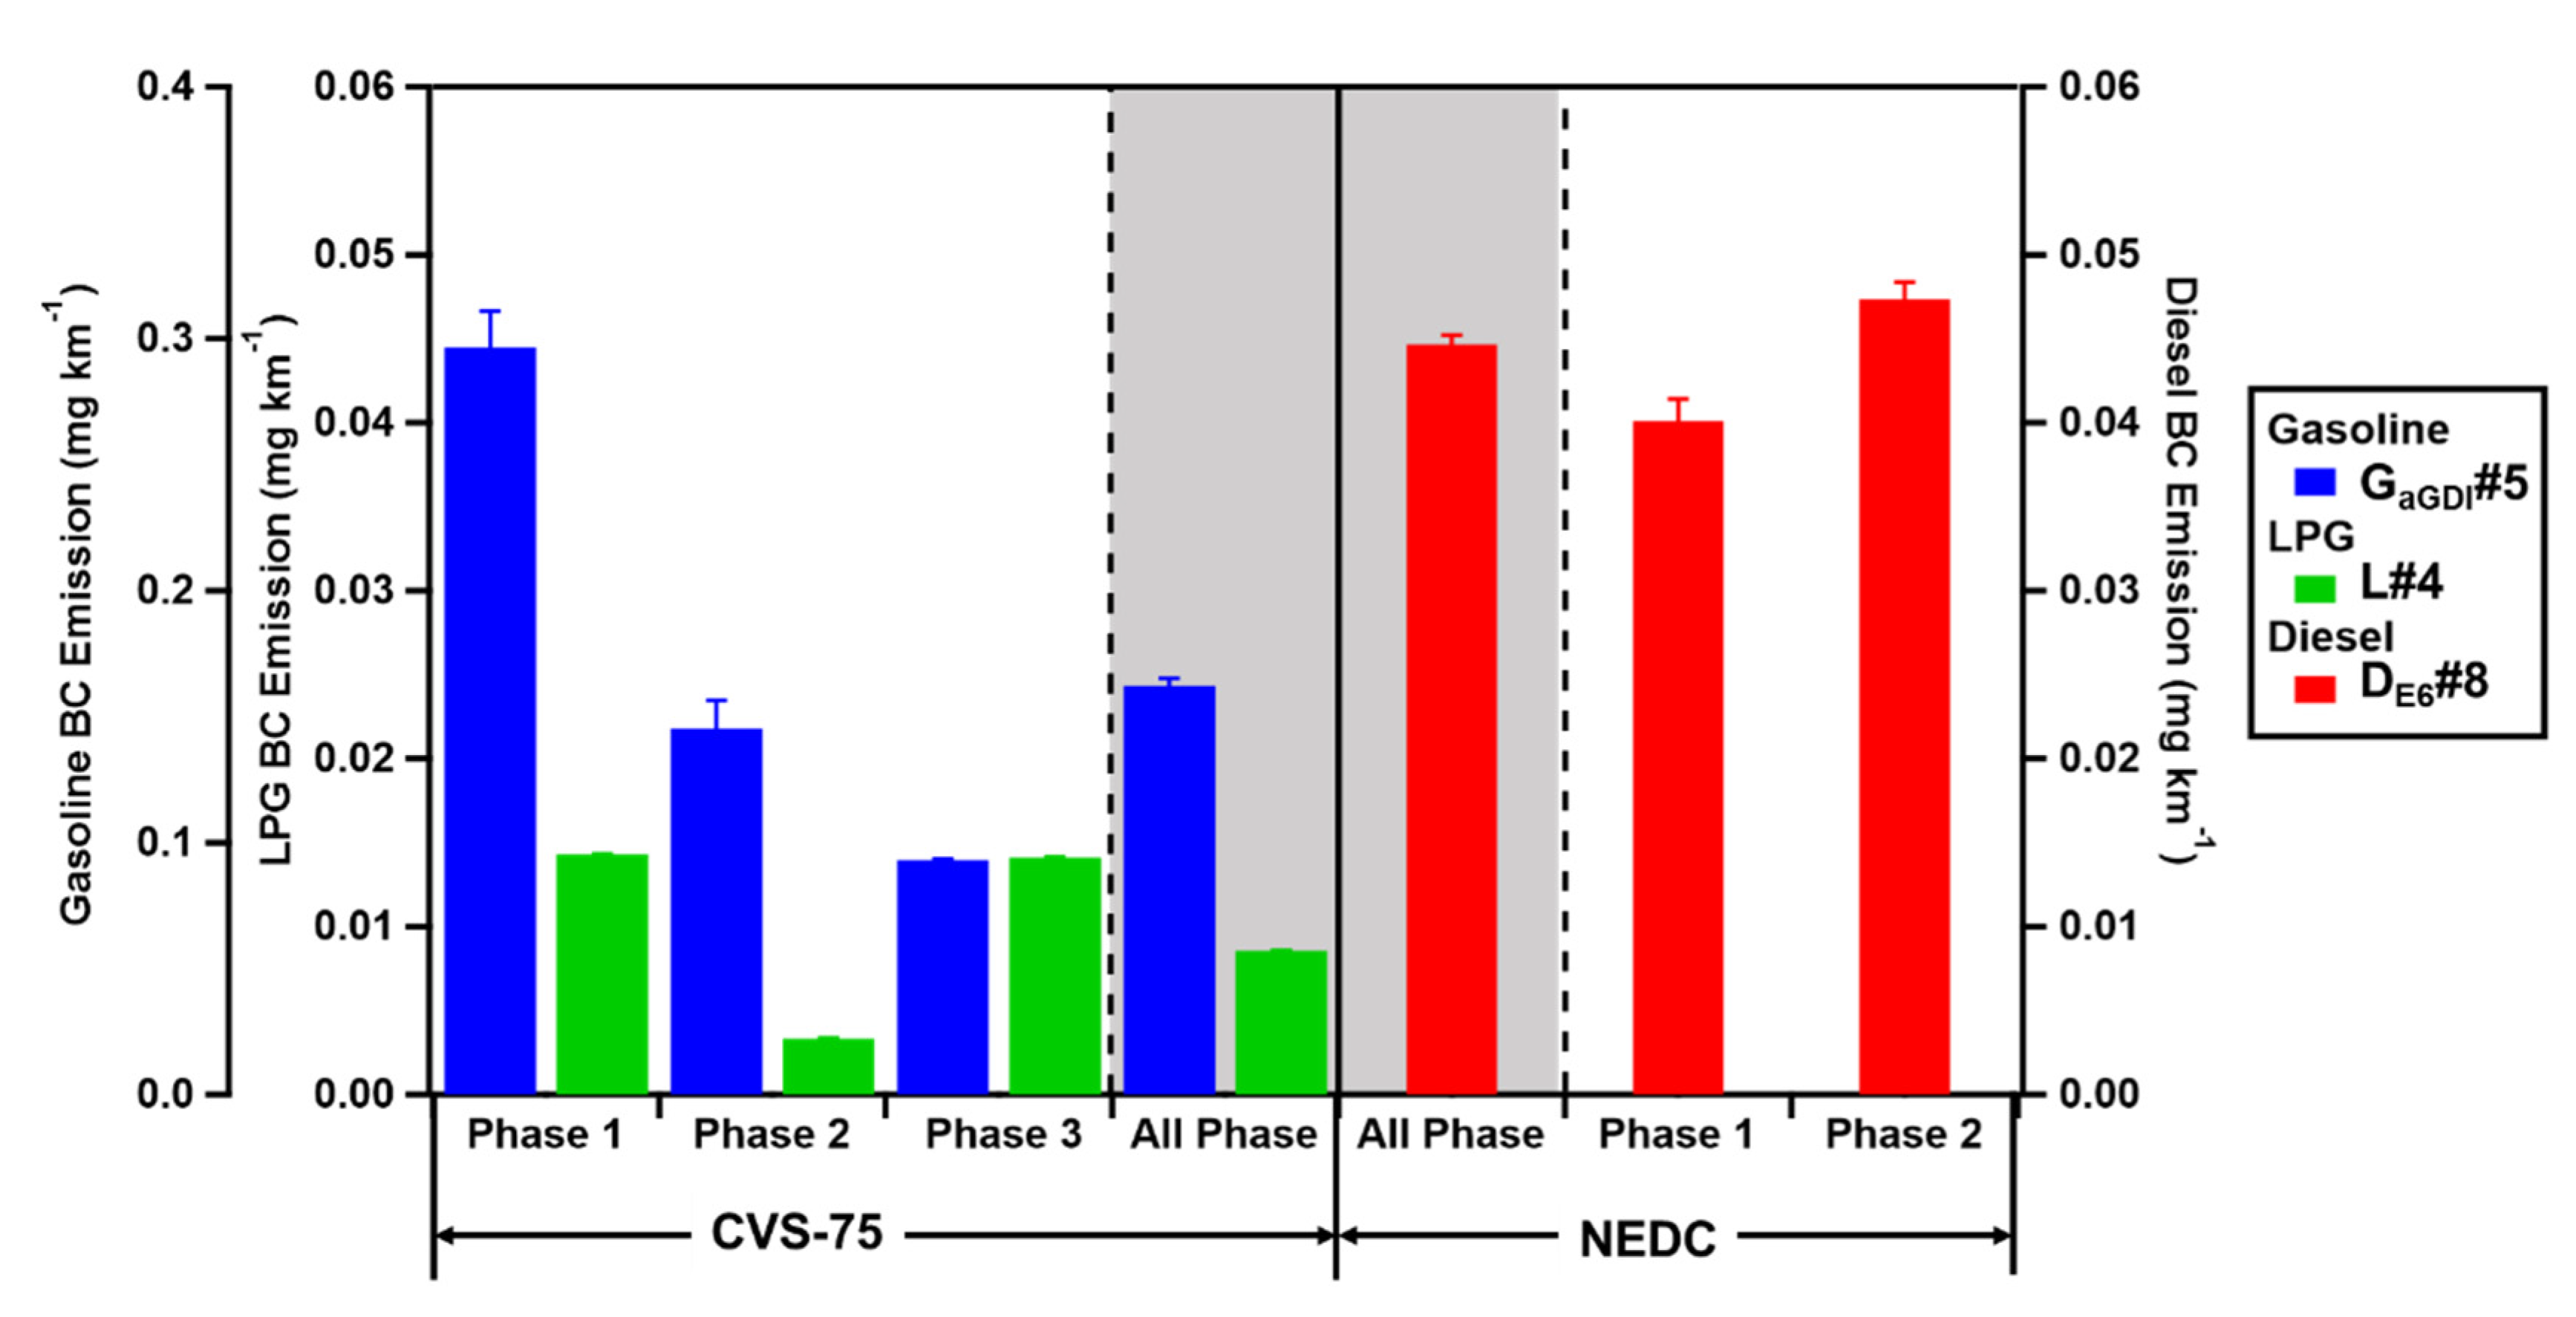
| Mode | Fuel | Phase | BC |
| CVS-75 | Gasoline | Phase 1 | 0.3 ± 0.014 |
| Phase 2 | 0.15 ± 0.011 | ||
| Phase 3 | 0.093 ± 0.0004 | ||
| All Phase | 0.16 ± 0.003 | ||
| LPG (a) | Phase 1 | 0.014 | |
| Phase 2 | 0.0033 | ||
| Phase 3 | 0.014 | ||
| All Phase | 0.0009 | ||
| NEDC | Diesel | Phase 1 | 0.04 ± 0.0005 |
| Phase 2 | 0.047 ± 0.001 | ||
| All Phase | 0.045 ± 0.001 |
| (Unit: mg km−1) | ||||
|---|---|---|---|---|
| Mode | Avg. Speed (km h−1) | GDI (Before PM Reg.) | GDI (After PM Reg.) | MPI |
| NIER-01 | 4.7 | 1.03 ± 0.56 | 0.2 ± 0.083 | 0.0036 ± 0.0008 |
| NIER-05 | 17.3 | 0.53 ± 0.25 | 0.081 ± 0.0004 | 0.0016 ± 0.0003 |
| NIER-09 | 34.1 | 0.27 ± 0.12 | 0.038 ± 0.002 | 0.0016 ± 0.0006 |
| NIER-12 | 65.4 | 0.2 ± 0.05 | 0.045 ± 0.019 | 0.0014 ± 0.0007 |
| NIER-14 | 97.3 | 0.64 ± 0.21 | 0.053 ± 0.026 | 0.0018 ± 0.0008 |
| (Unit: mg km−1) | ||||
|---|---|---|---|---|
| Mode | Vehicle | Phase | PM | BC |
| CVS-75 | GbGDI#5 | Phase 1 | 8.38 ± 1.34 | 0.49 ± 0.096 |
| Phase 2 | 0.41 ± 0.001 | 0.38 ± 0.01 | ||
| Phase 3 | 7.77 ± 1.83 | 0.50 ± 0.023 | ||
| All Phase | 4.5 ± 0.028 | 0.44 ± 0.018 | ||
| GaGDI#6 | Phase 1 | 4.51 ± 1.3 | 0.3 ± 0.014 | |
| Phase 2 | 1.42 ± 0.31 | 0.15 ± 0.011 | ||
| Phase 3 | 1.64 ± 0.82 | 0.093 ± 0.0004 | ||
| All Phase | 2.33 ± 0.72 | 0.16 ± 0.003 | ||
| GMPI#7 | Phase 1 | 2.55 ± 0.49 | 0.15 ± 0.079 | |
| Phase 2 | 0.31 ± 0.10 | 0.045 ± 0.006 | ||
| Phase 3 | 0.63 ± 0.33 | 0.069 ± 0.02 | ||
| All Phase | 0.95 ± 0.27 | 0.072 ± 0.025 | ||
| GMPI#8 | Phase 1 | 0.11 ± 0.037 | 0.14 ± 0.013 | |
| Phase 2 | 0.034 ± 0.034 | 0.018 ± 0.005 | ||
| Phase 3 | 0.074 ± 0.00002 | 0.07 ± 0.012 | ||
| All Phase | 0.067 ± 0.028 | 0.058 ± 0.009 | ||
| (Unit: mg km−1) | ||||
|---|---|---|---|---|
| Mode | Avg. Speed (km h−1) | EURO 3 (DOC) | EURO 5 (DOC, DPF) | EURO 6 (DOC, DPF, LNT) |
| NIER-01 | 4.7 | 24.54 ± 5.20 | 0.0019 ± 0.001 | 0.0093 ± 0.0044 |
| NIER-05 | 17.3 | 11.29 ± 2.27 | 0.00053 ± 0.0003 | 0.0017 ± 0.0006 |
| NIER-09 | 34.1 | 6.21 ± 4.41 | 0.00062 ± 0.0002 | 0.00025 ± 0.0003 |
| NIER-12 | 65.4 | 11.20 ± 3.38 | 0.00064 ± 0.0003 | 0.00065 ± 0.0001 |
| NIER-14 | 97.3 | 15.16 ± 1.68 | 0.0021 ± 0.0008 | 0.00017 ± 0.0002 |
| (Unit: mg km−1) | ||||
|---|---|---|---|---|
| Mode | Vehicle | Phase | PM | BC |
| CVS-75 | DE3#5 (a) | Phase 1 | 87.13 | 72.01 |
| Phase 2 | 80.11 | 55.017 | ||
| Phase 3 | 77.61 | 83.30 | ||
| All Phase | 89.16 | 66.29 | ||
| NEDC | DE4#6 (b) | Phase 1 | 0.53 | 0.13 ± 0.042 |
| Phase 2 | ND (c) | 0.09 ± 0.055 | ||
| All Phase | 0.17 | 0.1 ± 0.034 | ||
| DE5#7 | Phase 1 | 0.54 ± 0.43 | 0.037 ± 0.001 | |
| Phase 2 | 0.40 ± 0.031 | 0.11 ± 0.006 | ||
| All Phase | 0.45 ± 0.18 | 0.084 ± 0.001 | ||
| DE6#8 | Phase 1 | 1.41 ± 0.48 | 0.04 ± 0.018 | |
| Phase 2 | 0.78 ± 0.40 | 0.047 ± 0.003 | ||
| All Phase | 1.01 ± 0.07 | 0.044 ± 0.027 | ||
© 2020 by the authors. Licensee MDPI, Basel, Switzerland. This article is an open access article distributed under the terms and conditions of the Creative Commons Attribution (CC BY) license (http://creativecommons.org/licenses/by/4.0/).
Share and Cite
Park, G.; Kim, K.; Park, T.; Kang, S.; Ban, J.; Choi, S.; Yu, D.-G.; Lee, S.; Lim, Y.; Kim, S.; et al. Characterizing Black Carbon Emissions from Gasoline, LPG, and Diesel Vehicles via Transient Chassis-Dynamometer Tests. Appl. Sci. 2020, 10, 5856. https://0-doi-org.brum.beds.ac.uk/10.3390/app10175856
Park G, Kim K, Park T, Kang S, Ban J, Choi S, Yu D-G, Lee S, Lim Y, Kim S, et al. Characterizing Black Carbon Emissions from Gasoline, LPG, and Diesel Vehicles via Transient Chassis-Dynamometer Tests. Applied Sciences. 2020; 10(17):5856. https://0-doi-org.brum.beds.ac.uk/10.3390/app10175856
Chicago/Turabian StylePark, Gyutae, Kyunghoon Kim, Taehyun Park, Seokwon Kang, Jihee Ban, Siyoung Choi, Dong-Gil Yu, Sanguk Lee, Yunsung Lim, Sunmoon Kim, and et al. 2020. "Characterizing Black Carbon Emissions from Gasoline, LPG, and Diesel Vehicles via Transient Chassis-Dynamometer Tests" Applied Sciences 10, no. 17: 5856. https://0-doi-org.brum.beds.ac.uk/10.3390/app10175856