Scheduling of Preventive Maintenance in Healthcare Buildings Using Markov Chain


1
Industrial Engineering School, University of Extremadura, 06007 Badajoz, Spain
2
Project Engineering Section, Industrial Engineering School, University of Extremadura, 06007 Badajoz, Spain
*
Author to whom correspondence should be addressed.
Appl. Sci. 2020, 10(15), 5263; https://0-doi-org.brum.beds.ac.uk/10.3390/app10155263
Submission received: 2 July 2020
/
Revised: 27 July 2020
/
Accepted: 28 July 2020
/
Published: 30 July 2020
(This article belongs to the Special Issue Reliability Techniques in Industrial Design)
Abstract
:The optimization of maintenance in healthcare buildings reduces operating costs and contributes towards increasing the sustainability of the healthcare system. This paper proposes a tool to schedule preventive maintenance for healthcare centers using Markov chains. To this end, the authors analyzed 25 healthcare centers belonging to the three Healthcare Districts of Spain and built between 1985 and 2005. Markov chains proved useful in choosing the most suitable maintenance policies for each healthcare building without exceeding a specific degradation boundary, which enabled achieving an ideal maintenance frequency and reduced the use of resources. Markov chains have also proven useful in optimizing the periodicity of routine maintenance tasks, ensuring a suitable level of maintenance according to the frequency of the failures and reducing the cost and carbon footprint. The healthcare centers observed during the study managed to save more than 700 km of journeys, reduce emissions in its operations as a whole by 174.3 kg of CO2 per month and increase the overall efficiency of maintenance operations by 15%. This approach, therefore, renders it advisable to plan the maintenance of healthcare buildings.
1. Introduction
Maintenance is one of the most critical activities in healthcare buildings since the safety of users and workers depends on its proper management [1]. It also entails considerable operating costs, mainly due to the high intensity of use of their facilities [2] and limits the productivity of an organization [3]. In addition, maintenance activities are an important source of knowledge management [4].
The Markov chain is a tool used to predict the degradation suffered by a system by simulating its stochastic degradation process [5]. The most appropriate maintenance policies for the systems studied can be determined with this tool [6]. Markov chains have been used as a simulation, decision making and engineering prediction technique [7]. However, despite being considered a suitable method for analysis, the hospital engineering sector does not appear to apply it that much [8]. Markov chains have also been useful in biomedical research in both animal and human experimentation, including but not limited to, blood pressure, the state of the patient during an illness and safety culture of health organizations [9], but have not been applied to the maintenance of healthcare buildings.
Healthcare buildings are designed to develop promotion, prevention and rehabilitation actions related to primary healthcare, and differ from hospitals in that they do not have hospital beds and do not perform surgeries [10]; they are, therefore, smaller in size. These buildings are difficult to maintain [11] given their complex and costly facilities and equipment, the correct functioning of which conditions the quality of the services it provides [12]. Another factor is their locations, selected for their proximity to the patients they serve and consequently dispersed among them [13]. The operating status of these resources depends fundamentally on a suitable design of the facilities, the quality of construction, the use of electronic equipment and the efficiency of their maintenance [14]. The different locations of the healthcare buildings mean that the maintenance is conducted through patrol maintenance. This type of maintenance consists of a team of people who make periodic scheduled visits to each building and repair non-urgent breakdowns that have occurred between visits and perform preventive maintenance previously planned operations [15].
Escobar Mejía, Holguín, and Betancourt (2007) applied the Markov chain to assess maintenance policies and reveal the best implementation method according to the outcome [16]. Velázquez-Martínez, Cruz-Suárez, and J. Santos-Reyes (2016) analyzed the safety culture of a Mexican hospital using Markov chains but did not study the impact on maintenance [17]. Lacasse, et al. (2008) adapted the Markov model to the maintenance of façades made up of concrete panels [18]. Wang and Shen (2013) also conducted a study predicting the consumption of energy of the life cycle of a residential building using the stochastic modeling based on a Markovian model, optimizing different maintenance actions according to the replacement cost of the components based on a multi-objective index [19]. Gomez and Carnero (2016) determined the most suitable maintenance policy for medicinal gas distribution subsystems for the particular case of a general public hospital. They used Markov chains with the Measuring Attractiveness by a Categorical Based Evaluation Technique [20].
Chen and Trivedi (2005) suggested a semi-Markov decision process (SMDP) for the optimization of the preventive maintenance policy based on the condition, and they presented an approach for the joint optimization of the inspection rate and maintenance policy [21]. Chen, Li, Xia, and Pan (2019) developed a hidden Markov model with auto-correlated observations for the study of the degradation of the manufacturing systems and obtained more accurate predictive values by using auto-correlated observation. They also achieved an appropriate time evolution of the degradation processes [22]. Cheng, Wang and Yan (2016) developed an optimal model of the Cold Water for Human Consumption facilities by applying different statistical predictive techniques, using the Markov chains to determine the probability distribution of equipment condition and reliability [23]. Papakonstantinou and Shinozuka (2014) used partially observable Markov decision processes to find appropriate maintenance and management policies for corroded structures [24]. On the other hand, Carnero and Gómez (2017) analyzed the ideal maintenance strategy for electricity distribution systems in organizations providing medical care through a technical assessment based on Markov chains. They proposed a model based on a combination of corrective, preventive and predictive maintenance [25]. Yang, Ye, Lee, and Peng (2019) conducted a study on a new two-phase maintenance policy to optimize revenues through performance-based contracting (PBC) [26]. However, Silva, Gaspar, Brito, and Neves (2016) used Markov chains to predict the degradation of coatings and gain further insight into how the characteristics of coatings contribute to overall degradation [27]. Ortega Madrigal et al. (2015) proposed different techniques to predict the facade and life cycles of the typical roofs, including the Markov model. They compared several construction systems to support the engineer’s work in the design stages of the building [28]. Al-Momani, Al-Tahat, and Jaradat (2006) studied the performance measures for improvement of maintenance effectiveness. The results showed that despite the general increase in equipment availability, there is still a considerable mean time to repair the equipment from the registered failure day, which varies according to the type of equipment and its complexity [29].
The novelty of this work is the use of a proven tool that allows optimizing the management of buildings, ensuring an appropriate level of maintenance according to their failure frequency, thus increasing the reliability of equipment and facilities. Although Markov chains are used in all types of engineering activities, no precedents have been found in the state of the art of studies that apply this statistical model to plan and optimize the maintenance of healthcare centers. This paper, however, proposes a tool to schedule preventive maintenance for healthcare centers using Markov chains. In this way, it will be possible to optimize the periodicity of healthcare centers patrol maintenance.
2. Methods
The authors studied 25 healthcare centers belonging to three different healthcare districts in Spain, built between 1985 and 2005, from a quantitative point of view. The selection of these healthcare centers was made to be representative. They represent the same number of beds and are in the same region, so the activity generated by health care and the climate of the area is similar in the centers. When analyzing the data, statistical analysis techniques based on simple and multiple correlations were used to determine the degree of interconnection between the variables. In all cases, the standard error of the estimate and its correlation coefficient were calculated. A healthcare center is a building designed to carry out Primary Health Care Assistance actions, which has adequate staff and equipment to meet those needs. It is designed according to the World Health Organization welfare protocols to optimize the user’s first contact with the Health System. It has a continuous operation 24–365, therefore the maintenance of them is critical. As the healthcare buildings studied here are isolated centers located in large urban centers, specialists should carry out routine patrol maintenance every certain period of time. The frequency with which each patrol maintenance is carried out was set in three possible alternatives: 7, 15 and 21 days. A Markov chain is split into different states. These states correspond to the states of the system analyzed [30]. For this research, a nine state Markov chain has been developed, representing the degradation of healthcare facilities. All nine states of the Markov chain are designated as the degradation scale. The probability of system degradation corresponds to the state transition probability, which is obtained based on the statistical study of maintenance incidents that occur in health centers. These probabilities constitute the transition matrix of the Markov chain, i.e., the coefficients of that matrix. These coefficients were determined through the statistical analysis of the information available in the engineering and maintenance services of the healthcare centers analyzed. This analysis is based on minimizing the error that occurs between the observations during maintenance inspections and the predictions of the Markov model [31]. Firstly, the transition matrix is obtained based on the observed data [32]. After that, the transition matrix is determined, which reduces the discrepancy between the matrix obtained from the healthcare center incidents and the matrix determined from applying the Markov model. The Solver tool of Microsoft Excel is used to minimize the error. Finally, the validation of this analysis is done through the Pearson X2 test [33]. The incidents used in this paper are defined as nonurgent breakdowns originating in a healthcare center. These incidents may include, window insulation failure, door damage, lighting failure, humidity, damage to stretchers or noncritical equipment, among others. The percentage degradation scale as a function of the number of incidents happening in the facilities of a healthcare center is shown in Table 1, is used as a reference to illustrate the current state of the system as a function of the number of monthly incidents and the percentage of degradation. The degradation scale has a range from 1 to 9, where 1 and 9 corresponds to an excellent and unacceptable condition.
The table above shows that the number of monthly incidents that a healthcare center can have to avoid an unacceptable condition is more than forty. Preventive maintenance is implemented to prevent a health center from getting into an inadequate state of degradation. This is based on a patrol maintenance that fixes the incidents that have arisen in the healthcare centers. The following section details how to select the most appropriate maintenance policy and its respective periodicity. The variable that defines the state of the system called En, is defined below. This variable characterizes the state of the system in the nth observation and is a row vector that has the same number of components as system states. The compilation of all {E1, E2, E3…En} variables is the stochastic process. This type of study requires the future state to be independent of past states and depend only on the current state [34]. Therefore, Markov’s property is fulfilled, and the probability of transition from state i to state j will be determined by Equation (1) [16]:
where En is the vector of the observation state n and Pij is the component of the transition matrix and represents the probability that the system passes from state i to j. Equation (1) reflects the probability of the system to reach state j while in state i. This Markov process is described in Equations (2) and (3):
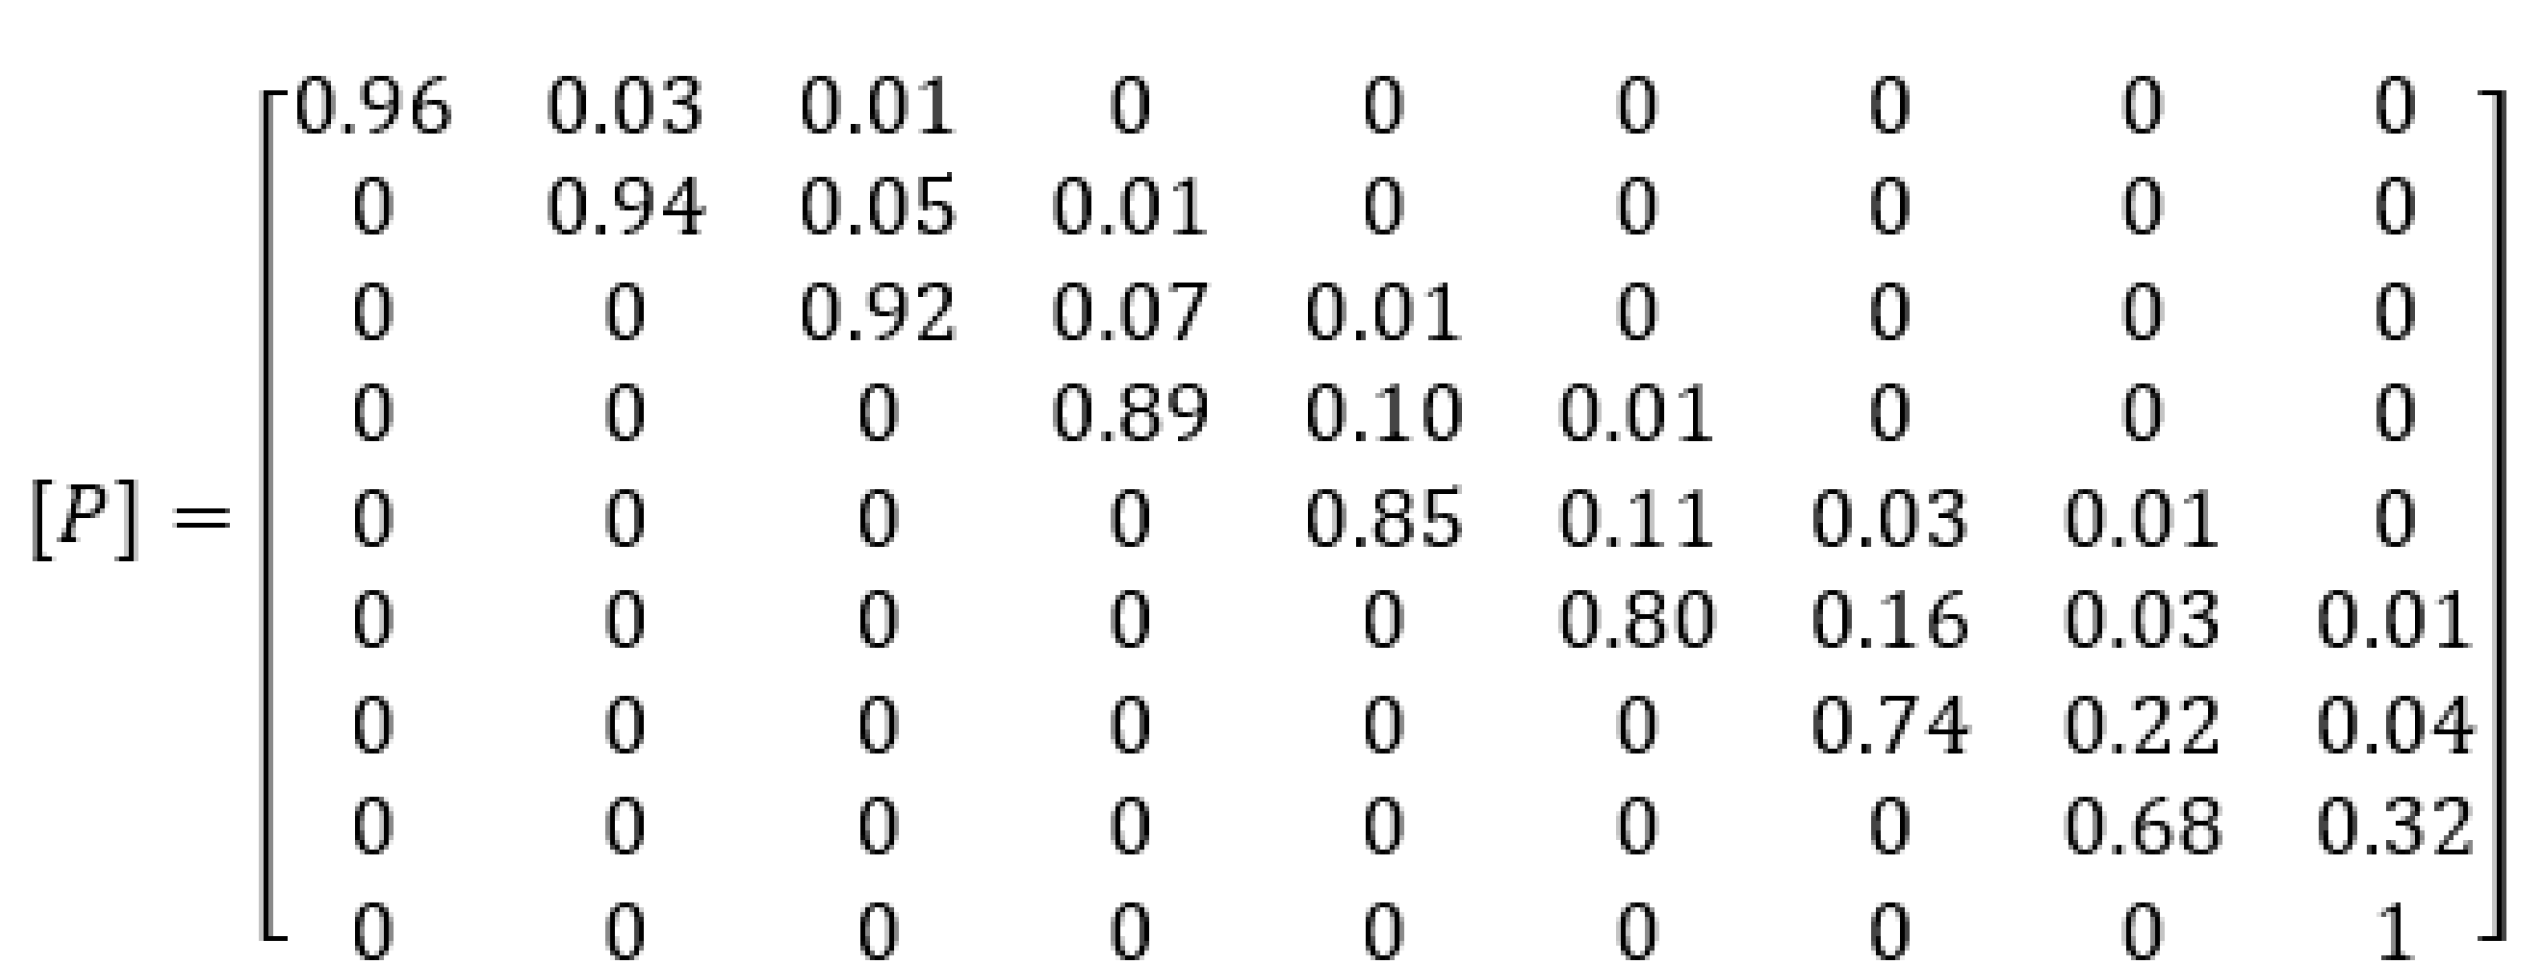
where En is the state vector in the observation n, r is the initial state vector, Pn is the transition matrix of n steps, formed by its components Pijn, which is the probability that the system will transit from state i to j, Q(E) represents the expected value of the system and En(i) is the i-nth component of the vector and En determines the probability that the system will acquire the value i. The coefficients of the transition matrix (Pij) are the result of the statistical analysis of the information obtained from 25 healthcare centers and includes the likelihood of the system moving from one state to another, plus the probability that it remains in the same state. An expert panel in the sector accepted and validated the transition matrix. The panel was formed by four hospital engineering specialists, two private institutions specialists, a technician in charge of the Technical Department of the Public Administration and a technician from the Technical Department of a private hospital. Two important aspects of the transition matrix were supervised by an expert panel. Firstly, the experts evaluated whether the structure of the matrix was correct and whether the matrix obtained showed evidence of degradation in the values. They observed that the higher the degradation state, the higher the probability that the system will change to a more adverse degradation state, and the lower the probability of remaining in the state. Secondly, they validated the coefficients of the transition matrix by verifying that the values of the system in each of the established degradation states were consistent with the existing situation in every healthcare center. Statistical evidence from the Spanish Ministry of Health and the Regional Health Service of Extremadura was also considered. The maintenance patterns were commented with the maintenance engineers of the target healthcare center, after analyzing the corresponding registers, and then assessed.
The probability of transition between states or remaining in the same one is represented in a matrix in the state transition matrix [P] shown in Figure 1.
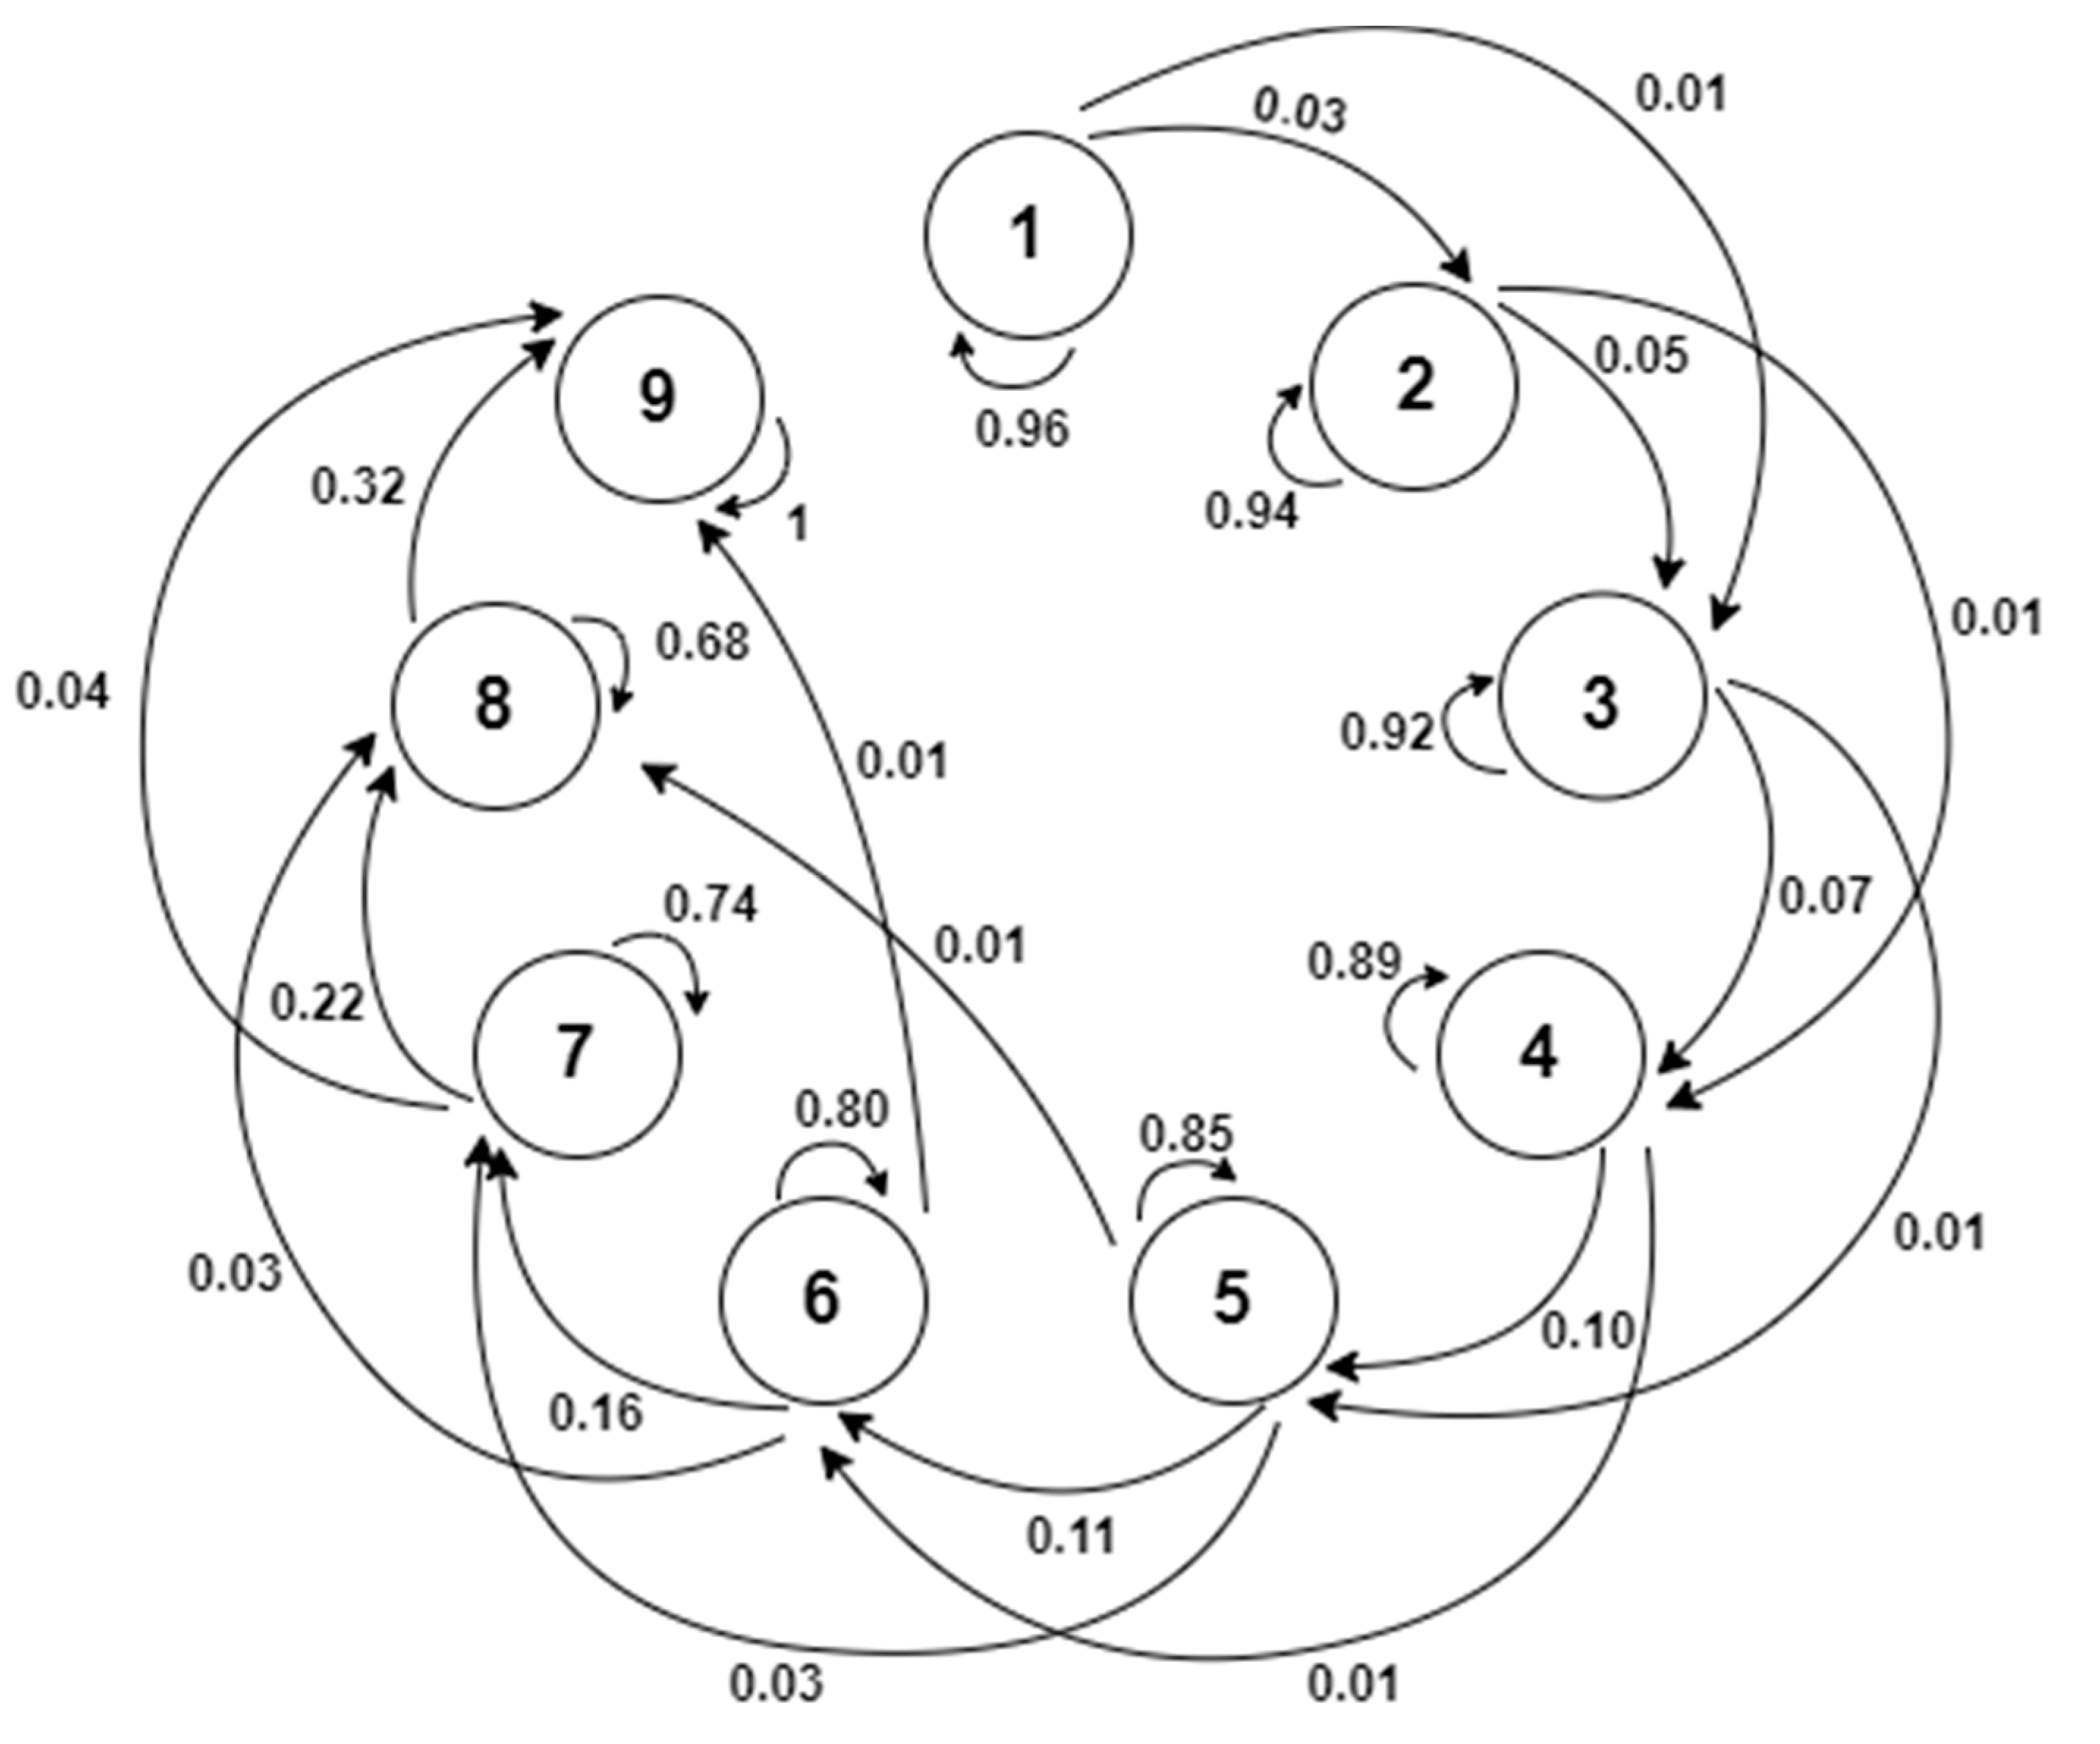
The transition graph shown in Figure 2 and representing the system’s degradation state was created considering the state transition probabilities of the matrix coefficients [P]:
The system presents a gradual degradation, which means that the higher the state of the system, the probability of the system remaining in that state drops and the probability of it changing state increases. There are also several consecutive changes of states, for example, from state 2 to 4. There is less likelihood of this transition happening and is caused by several factors: emergencies that cause incidents during inspections or incidents that appear simultaneously before maintenance and that cause transitions to several states.
In order to determine the most appropriate maintenance policy for healthcare centers, maintenance must be represented in a matrix form. Al-Momani et al. (2005) represented the maintenance strategy of the system in a matrix form [35]. They designed the maintenance policy for a seven-state Markov chain. So, the maximum allowed degradation state is state 4, from which the system degradation is not adequate. In addition, the selected maintenance strategy allows the system’s degradation state to be improved to degradation state 2. Therefore, Equation (4) is expressed as follows:
This model is suitable, assuming that the maintenance is carried out soon after the inspection, without letting the system change state. Moreover, if the maintenance is not conducted, the system will enter an unacceptable state (Level 9), whereas if the relevant inspections and maintenance are carried out, the system should remain operative for long periods of time.
Then, a study was conducted with Markov chains to choose the most suitable maintenance policy for each healthcare center. First, the maximum permitted degradation state was determined to reduce the array of options. For this study, a low degradation state was considered inappropriate for healthcare buildings. Therefore, the maximum state the system had to reach was 6, presenting a significant number of incidents as shown in Table 1. Healthcare centers are buildings designed to carry out Primary Health Care actions continuously 365 days a year. In this way, the state of degradation of a building should not damage the health and safety of the patients. For this reason, the maintenance policy selected must guarantee that the condition of the health centers does not reach state 6.
The selection of the optimum maintenance policy for the system is focused on choosing state i that the system can reach, and once achieved, perform the corresponding maintenance to re-establish the ideal state j. To this end, five maintenance policies were conducted, the results of which are collated in Table 2. Options 1 and 2 represent a maximum degradation state of 5 and 4, respectively, and after maintenance, the system returned to state 2. Options 3 and 4 admitted a maximum degradation state of 5 and 4 respectively, but these options returned to state 1 after maintenance. Lastly, option 5 considered the possibility of the system reaching the maximum degradation state of 5, but only returned to state 3 after maintenance.
3. Results
To simplify the results, the procedure for obtaining the probability that the system is in each of the states described in Table 1 for one of the five maintenance strategies is detailed. For the rest of the maintenance policies the process is the same, therefore only the results will be shown. Maintenance strategy number 2 has been chosen. The maintenance matrix [M] of this example is shown in Figure 3.
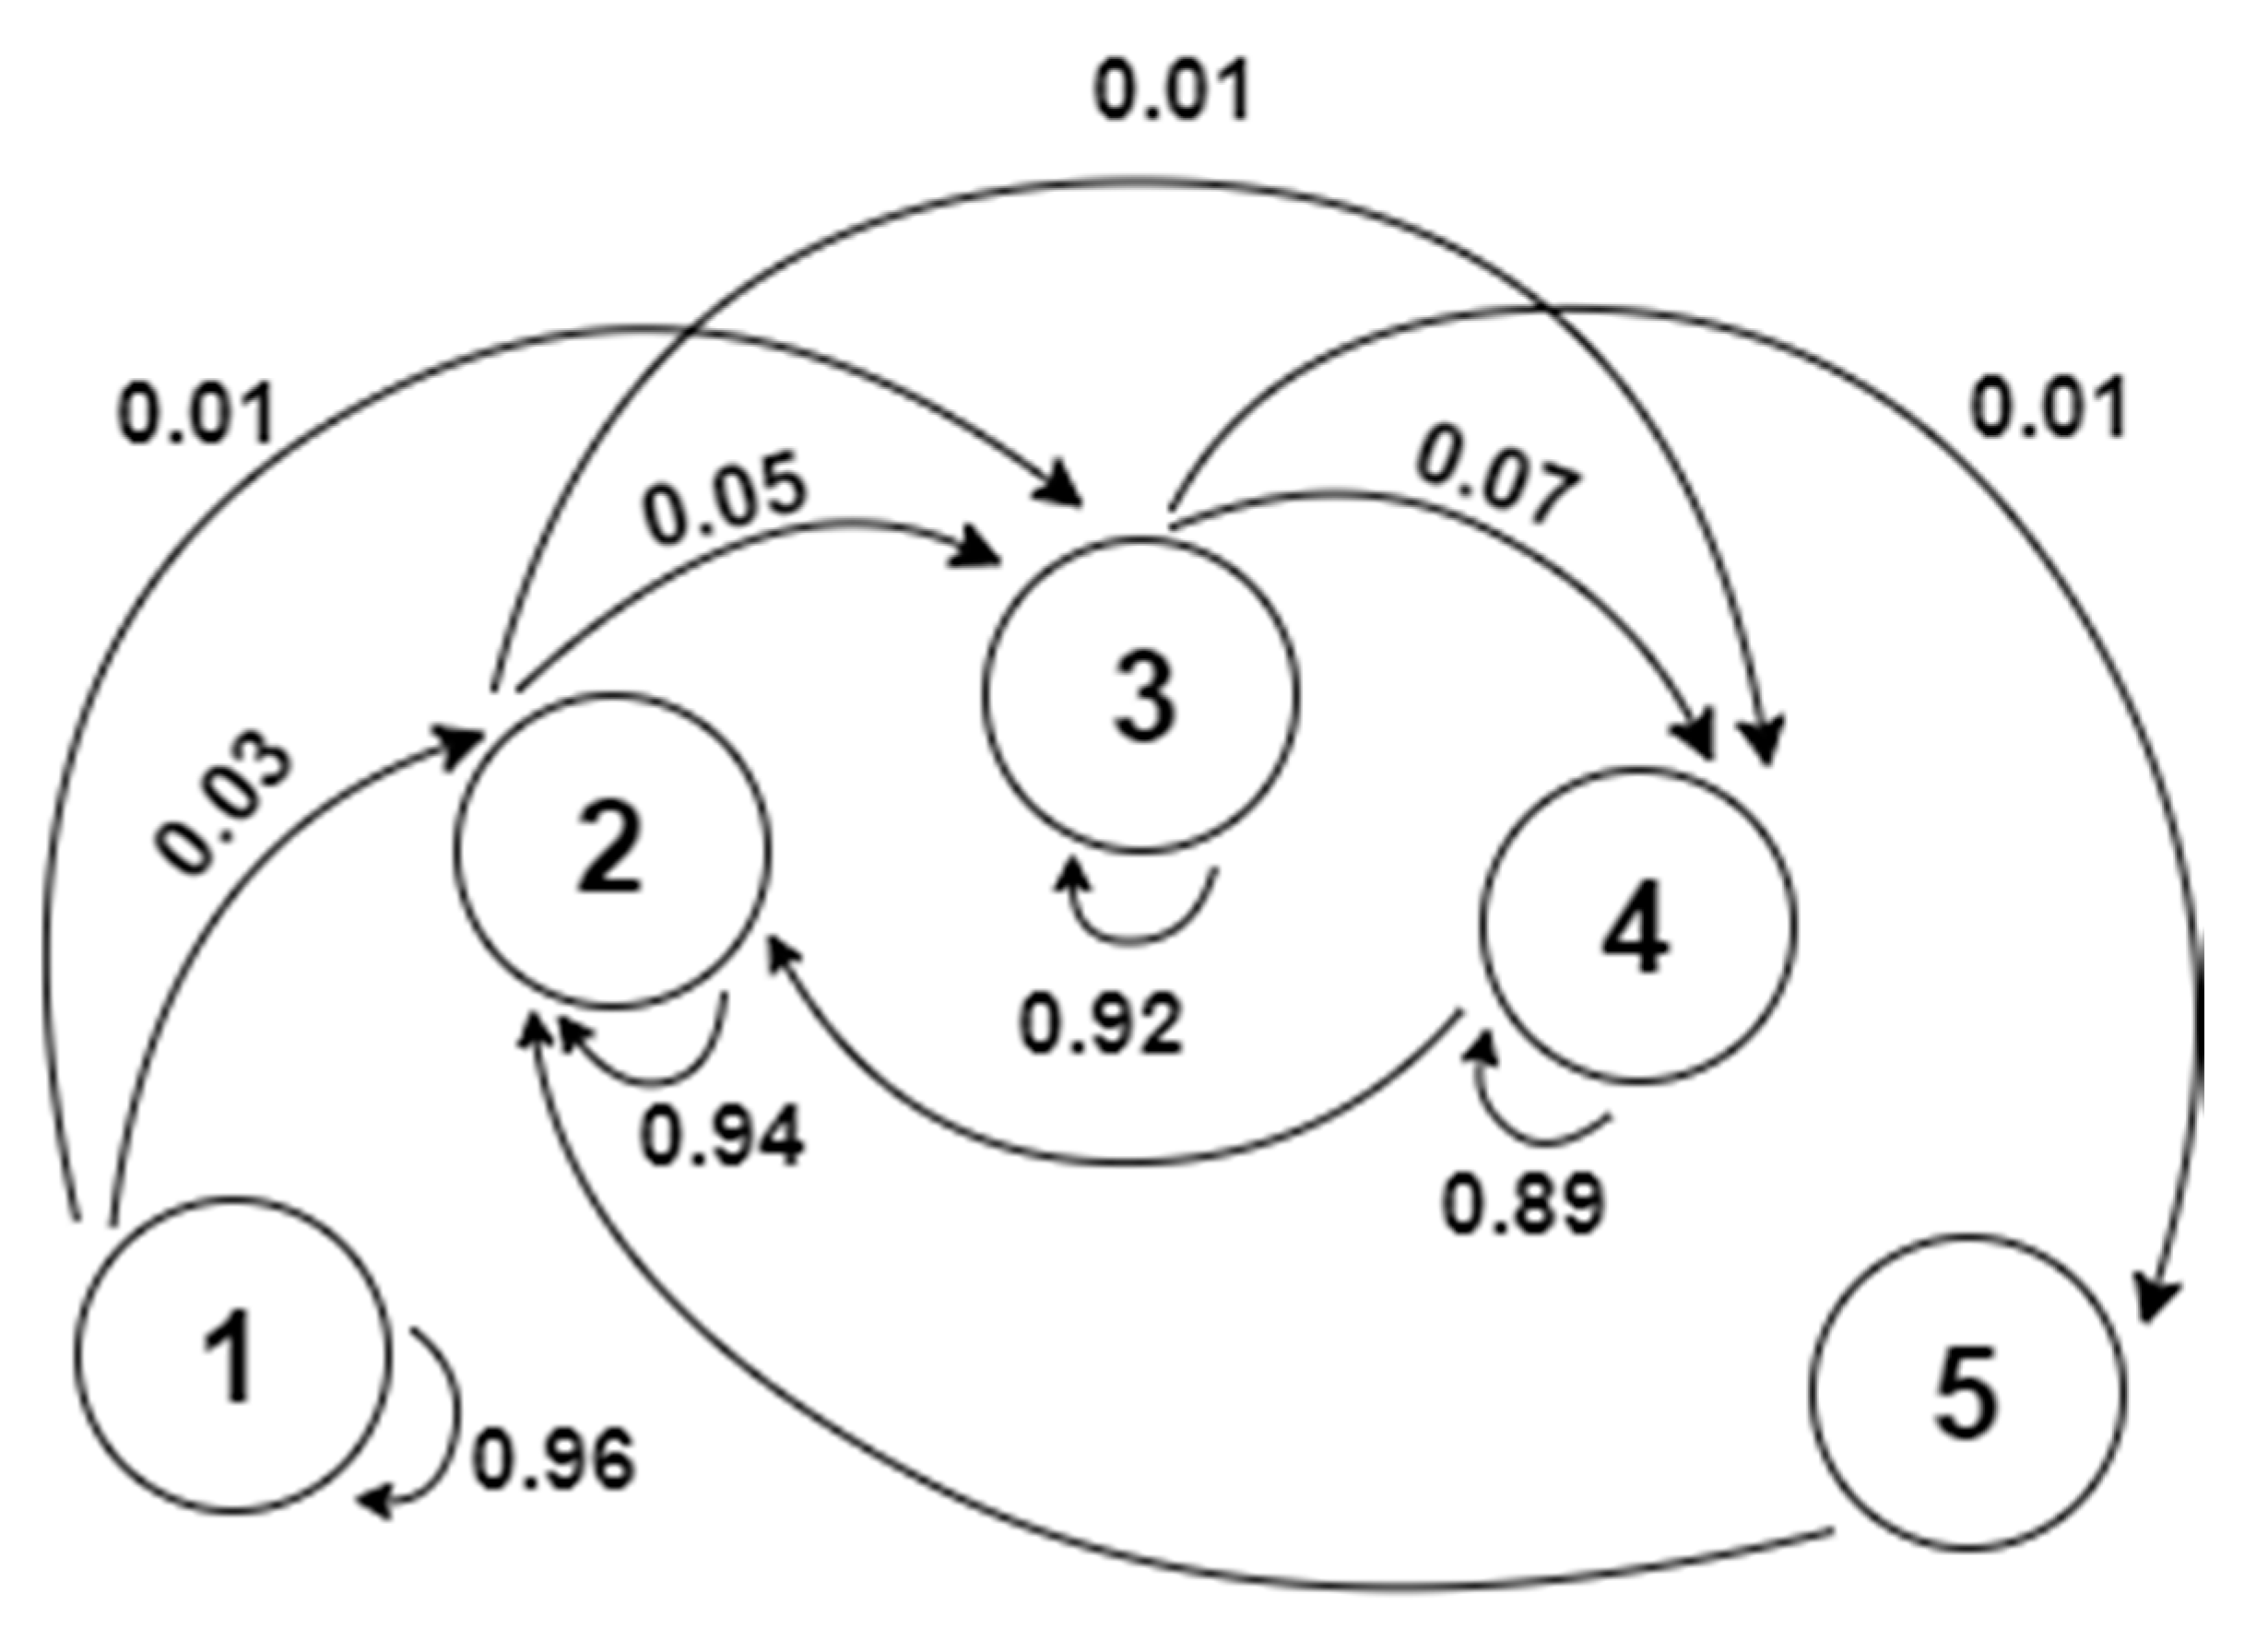
By applying the proposed maintenance policy, the maintenance would be carried out in such a way that the system would never reach states higher than 4 and always returns to state 2, creating a regular sequence of states 2, 3 and 4, as illustrated in Figure 4.
The maintenance strategy transition graph shows two parts of the process life cycle. The first goes from the initial state (1) to the first state of the periodic stage (2) and the second is a regular sequence of states 2, 3, 4 and 5. The real interest of the study lies in the analysis of this second part. The analysis of the behavior in the stationary state of the process probability distributions is one of the main problems of Markov chains. In particular, the boundary of each process probability distribution should be calculated for each state i when n tends to infinity and this boundary belongs to the distribution of probability in the space of states. If this boundary exists, it must be unique and the distribution boundary (π) must satisfy the properties shown in Equation (5) [17]:
By implementing the maintenance strategy in the form of a matrix, Equation (5) becomes Equation (6):
where each component of the vector π(j) corresponds with the time in which the system remains in state j after reaching the periodic behavior. Furthermore, for the solution to correspond to a process boundary distribution, the Markov chain must have been proven irreducible and aperiodic and the chain states recurrent positive. As for the maintenance policy analysis, the state vector for 20, 40 and 80 observations are first evaluated by Equation (1), which leads to Equations (7)–(9).
The results lead the authors to conclude that the higher the number of observations, the higher the probability of the system being in states 2 and 3, whereas the probability of the system being in state 1 is less. First element of the state vector of Equation (7) has a value of 0.442. Therefore, there is a 44.2% probability that the system is in the state of degradation 1. When the observations increase, the probability that the system is in state 1 decrease to 19.54% and 3.82% according to Equations (8) and (9) respectively. In the same way, it is proved as the value of the second and third element of the state vector increases.
Finally, the system behavior was evaluated in a stationary state, i.e., when n tends to infinity. This was determined by solving Equation (6), which translates into a system of equations made up of nine equations with nine unknowns, the results of which are:
The authors found that the probability of the system being in a stationary state while in state 1, 6, 7, 8 or 9 was nil since they are all outside the periodic sequence. This procedure has been carried out with 5 different maintenance strategies to compare them and determine which of them is more suitable for the system. The results are shown in Table 2.
The optimal solution was obtained by comparing the results of the Markov chains and relating them to the number of incidents in the corresponding healthcare centers. Options 1 and 3 were found to be less likely to be in the first five states, i.e., the system will remain less time in states that have been deemed suitable for healthcare centers. Therefore, options 2, 4 and 5 were analyzed to select the best solution. Option 5 presents a 0.39% probability that the system is in state 6. However, despite being a very low probability, the authors considered that the system could not reach that state so the option will not be suitable. The fourth option shows a high probability that the system is in states 1, 2 and 3 with a value of 49.55%, 25.81% and 22.58%, respectively. This determines that the system will be in the first three states most of the time with this maintenance policy. The second option has a 0% chance of being in state 1 since maintenance causes the system to return to state 2. The probabilities of the system being in states 2, 3, and 5 with this maintenance policy are 57.85%, 38.46% and 3.31%, respectively. The system in the states illustrated above is suitable in both cases.
These two maintenance strategies are not prioritized, but instead there is a combination of the two, according to the average monthly incidents of each of the 25 healthcare centers to obtain a better solution. Thus, the healthcare centers that require maintenance that resolves more incidents, but with less frequency, will opt for option 4. However, centers that require more regular maintenance, but correct fewer incidents, will choose option 2. As each healthcare center is more suited to one option than the other, the use of the two maintenance strategies will increase the success of the outcome. The number of average monthly incidents that each of the healthcare centers has was recorded to determine whether the maintenance is carried out every 1, 2 or 3 weeks. These data were extracted from the historical archives available at the technical services responsible for the maintenance of the health centers, for three years. Table 3 shows the average monthly incidents, RP being the speed factor with which the first failure occurs, considering A > 2 days; B from 3–6 days; C > 6 days, N° the average monthly number of nonurgent failures and HCC is the healthcare center studied.
The relationship between the results shows that the maintenance frequency and policy depend on the average incidents in each of the healthcare centers every month. Table 4 shows when the maintenance is carried out according to monthly incidents and the most appropriate maintenance option.
The broadest range of incidents allowed by each option was chosen, adequately managing the resources, and consequently, reducing maintenance costs. With this, the number of incidents corrected after maintenance in options 2 and 4 is 15 and 20, respectively. Therefore, this will be the maximum number of incidents allowed between maintenance visits. Table 5 shows the best maintenance option and periodicity for each of the 25 healthcare centers analyzed.
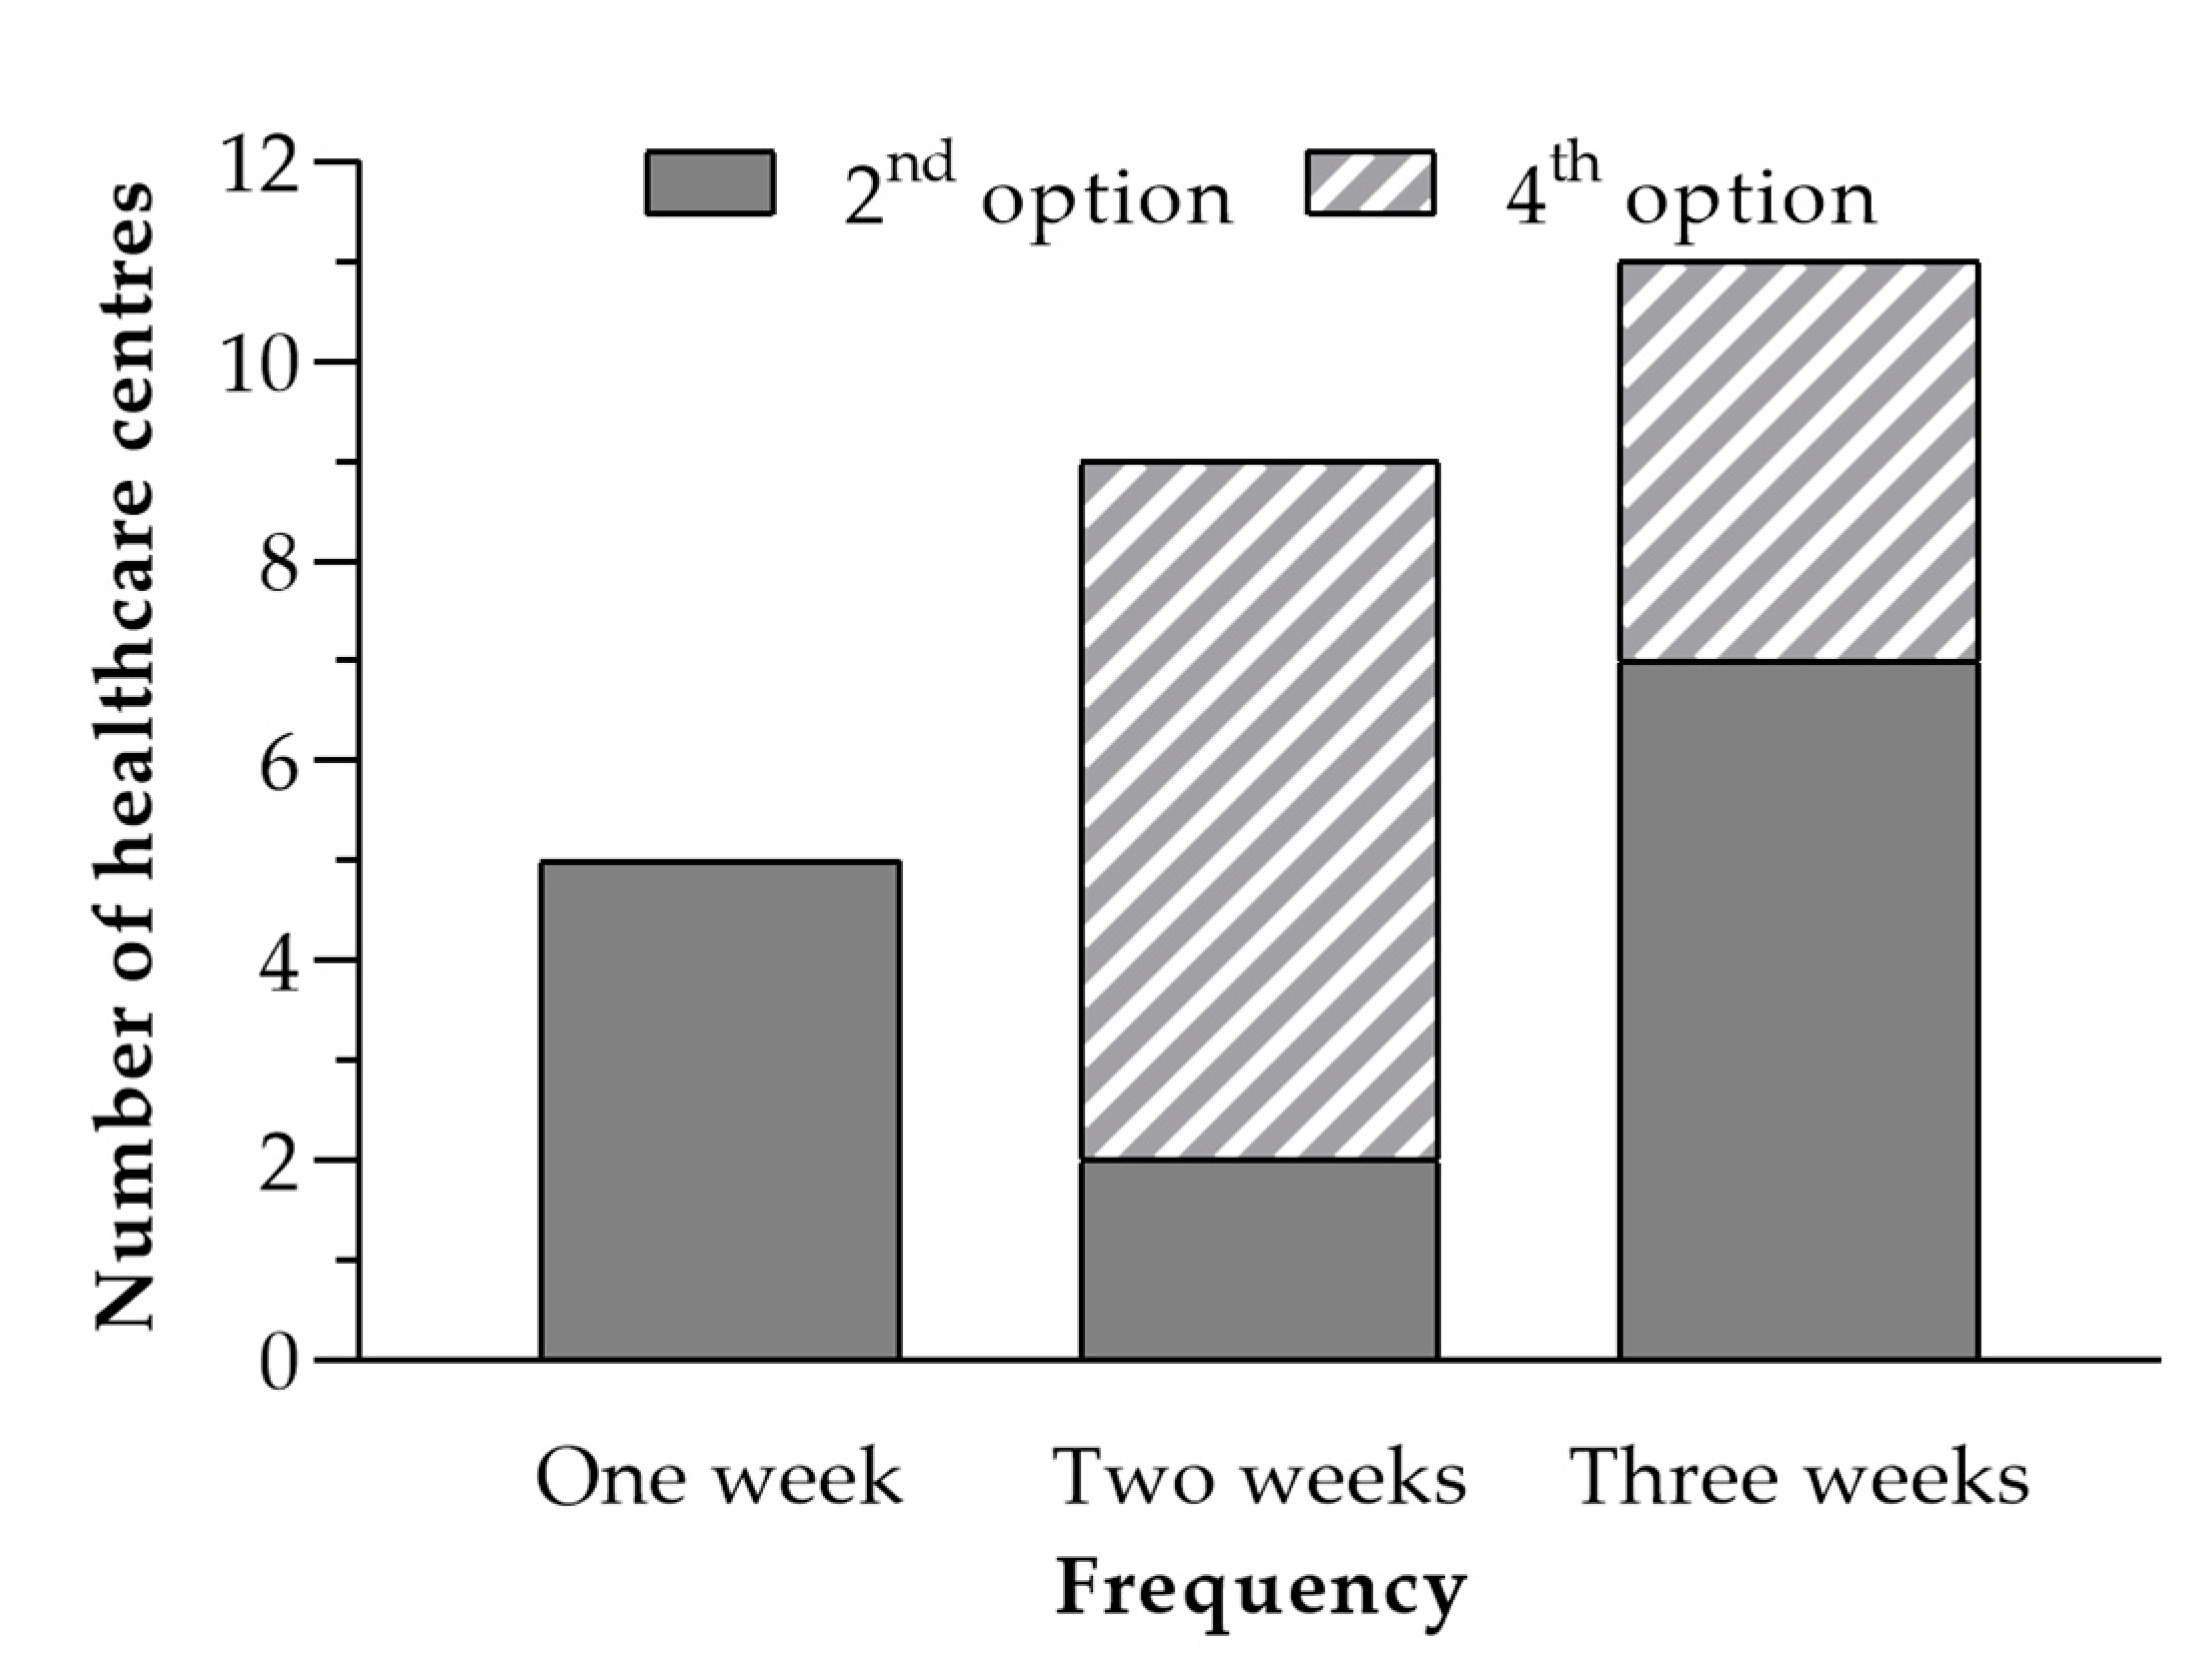
Then, the data of Table 5 were grouped by similarity of the frequency of maintenance actions of each of the centers and their respective maintenance policies. Figure 5 illustrates this grouping.
The authors found that option 2 was more convenient in 14 of the 25 healthcare centers since maintenance is carried out every week in five centers, every two weeks in two centers and every three weeks in seven centers. On the other hand, of the remaining 11 healthcare centers, seven centers have a periodicity of two weeks and four centers have a periodicity of three weeks. By optimizing the frequency of maintenance of a healthcare center, maintenance can be carried out at more appropriate times, instead of every 15 days across all the healthcare centers in the sample. This approach also reduces transport and labor costs. After conducting the study, the authors found that the healthcare centers of this study were able to save 700 km of travel per month, saving time and fuel, and reducing emissions by 174.3 kg of CO2 each month.
4. Discussion
The best maintenance strategy was determined for each of the healthcare centers analyzed based on the results of the study. This maintenance strategy should prevent the selected system from reaching a state higher than the tolerable state (5). This is of utmost importance in healthcare buildings, the facilities of which are vital for patients [36]. In many cases, making decisions in the health sector is very difficult due to its complexity and its influence on the life quality of people [37]. The authors found that the combination of two maintenance policies ensures that the system is always appropriate, and that, therefore, the joint implementation of the two policies is much better than separate implementation. For this reason, it would be convenient to conduct a study every 6 months of the average incidents found in each of the 25 healthcare centers to readjust the maintenance policy and adjust the periodicity [38].
The Markov chains have proven to be useful to determine the best maintenance strategy for healthcare buildings. With this probabilistic tool, the most appropriate maintenance policy can be determined, which prevents healthcare centers from exceeding a certain degree of degradation, thus guaranteeing the functioning of the system and the safety of the patients [39]. It also allows for planned and implemented maintenance strategies to save time and costs [40], which is one of the main objectives of hospital engineering [41].
This method was also found to allow for maintenance planning with more appropriate periods, which translates into savings in respect of travel costs and time spent on maintenance tasks. This optimizes the use of these resources and their possible use in other aspects. Also, the maintenance technician emits less CO2 during his or her travels. The use of Markov chains for preventive maintenance planning is, therefore, part of a strategy based on circular economy [42], meeting savings and emission reduction targets. The outcome of this research is useful for planning the maintenance of healthcare centers, guaranteeing an appropriate level of maintenance according to the failures, and can be extrapolated to other buildings in the tertiary sector with similar complexity [43].
5. Conclusions
Based on the results, it can be concluded that the Markov chains are a suitable probabilistic tool to optimize the planning of preventive maintenance of healthcare centers. It allows for obtaining the maintenance strategy without the system not exceeding a certain state of degradation, and to establish the appropriate periodicity of maintenance. In this way it is possible to reduce the environmental impact of maintenance and increase the safety and health of the users of a healthcare center.
Before applying Markov’s techniques, the maintenance frequency of all the health centers analyzed was 15 days. By applying this model, a periodicity of 3, 2 and 1 weeks was set according to the most appropriate maintenance policy and the average monthly number of incidents at each center. As a result, the periodicity of the patrol maintenance was optimized, preventing the system from exceeding the desired states of degradation. This resulted in a reduction in the time and distance traveled by the expert technician, thus reducing the cost of maintenance and the carbon footprint associated with the journey. Specifically, a saving of 700 km per month was achieved, which reduces 174.3 kg of CO2 per month and an increase in overall maintenance efficiency of close to 15%.
Future work should be aimed at carrying out a comparative analysis between different healthcare centers in other countries, to analyze their behavior and deviations from the demand for corrective maintenance after applying the method proposed here. In addition, this statistical model can be applied to determine the most appropriate maintenance policy for the different elements of vital importance for the operation of sanitary buildings, such as the structure, windows, air conditioning systems, electrical energy distribution systems, water distribution system, electronic equipment, etc. In this way, the degradation of the above elements is not detrimental to the health service.
Author Contributions
Data curation, J.G.-D.; Formal analysis, G.S.-B. and J.G.-S.-C.; Investigation, J.G.-D. and J.G.-S.-C.; Methodology, J.G.-D. and J.G.-S.-C.; Resources, G.S.-B.; Software, J.G.-D. and G.S.-B.; Validation, J.G.-S.-C.; Writing—original draft, J.G.-D.; Writing—review and editing, J.G.-S.-C. All authors have read and agreed to the published version of the manuscript.
Funding
This research was funded by VI Regional Research, Technological Development, and Innovation Plan of the Government of Extremadura, grant number GR-18029 through European Regional Development Fund.
Acknowledgments
The authors wish to express their acknowledgement to the VI Regional Research, Technological Development and Innovation Plan of the Government of Extremadura (GR-18029), and to the European Regional Development Fund for their financial support to García-Sanz-Calcedo during his work stay at the University of Evora (Portugal).
Conflicts of Interest
The authors declare no conflict of interest.
References
- Geisler, E. Trends in Hospital and Healthcare Technologies-The future. Hosp. Eng. Fac. Manag. 2002, 18–22. [Google Scholar]
- Ciarapica, F.E.; Giacchetta, G.; Paciarotti, C. Facility management in the healthcare sector: Analysis of the Italian situation. Prod. Plan. Control 2008, 19, 327–341. [Google Scholar] [CrossRef]
- Carnero, M.C.; Gómez, A. A multicriteria Decision-Making approach applied to improving maintenance policies in healthcare organizations. BMC Med. Inform. Decis. Mak. 2016, 16, 47. [Google Scholar] [CrossRef] [Green Version]
- Cárcel-Carrasco, J.; Cárcel-Carrasco, J.A.; Peñalvo-López, E. Factors in the Relationship between Maintenance Engineering and Knowledge Management. Appl. Sci. 2020, 10, 2810. [Google Scholar] [CrossRef] [Green Version]
- Van Widen, C.; Dekker, R. Rationalisation of building maintenance by Markov Decision Models: A pilot Study. J. Oper. Res. Soc. 1998, 49, 928–935. [Google Scholar] [CrossRef]
- González, A.; García-Sanz-Calcedo, J.; Salgado, D.R. A quantitative analysis of final energy consumption in hospitals in Spain. Sustain. Cities Soc. 2018, 36, 169–175. [Google Scholar] [CrossRef]
- Papakonstantinou, K.; Shinozuka, M. Planning structural inspection and maintenance policies via dynamic programming and Markov processes. Part I: Theory. Reliab. Eng. Syst. Saf. 2014, 130, 202–213. [Google Scholar] [CrossRef]
- Chyu, M.; Austin, T.; Calisir, F.; Chanjaplammootil, S.; Davis, M.J.; Favela, J.; Gan, H.; Gefen, A.; Haddas, R.; Hahn-Goldberg, S.; et al. Healthcare Engineering Defined: A White Paper. J. Healthc. Eng. 2015, 6, 635–648. [Google Scholar] [CrossRef] [PubMed]
- Ocaña-Riola, R. Markov models applied to health sciences research. Interciencia 2009, 34, 157–162. [Google Scholar]
- García Sanz-Calcedo, J. Analysis on Energy Efficiency in Healthcare Buildings. J. Healthc. Eng. 2014, 5, 361–373. [Google Scholar] [CrossRef] [PubMed] [Green Version]
- Bilec, M.; Ries, R.; Needy, K.; Gokhan, M.; Phelps, A.; Enache-Pommer, E.; Horman, M.J.; Little, S.E.; Powers, T.L.; McGregor, E.; et al. Analysis of the design process of green children’s hospitals: Focus on process modeling and lessons learned. J. Green Build. 2009, 4, 121–134. [Google Scholar] [CrossRef]
- Ali, M.; Mohamad, W.M. Audit assessment of the facilities maintenance management in a public hospital in Malaysia. J. Facil. Manag. 2009, 7, 142–158. [Google Scholar] [CrossRef]
- Ministerio de Sanidad y Consumo de España, Organización de Mantenimiento en Centros de Salud. Manual de Planificación Técnica y Funcional; Instituto Nacional de la Salud: Madrid, Spain, 1990. [Google Scholar]
- Shohet, I.; Nobili, L. Performance-Based Maintenance of Public Facilities: Principles and Implementation in Courthouses. J. Perform. Constr. Fac. 2015, 30, 04015086. [Google Scholar] [CrossRef] [Green Version]
- Maik, J.A.; Havinga, B.J. Condition-Based maintenance in the cyclic patrolling repairman problem. Int. J. Prod. Econ. 2019, 222, 107497. [Google Scholar]
- Mejía, A.E.; Holguín, L.M.; Betancourt, G. Uso de las cadenas de Markov en la selección de políticas de mantenimiento. Sci. Tech. 2007, 13, 115–120. [Google Scholar]
- Velázquez-Martínez, J.D.; Cruz-Suárez, H.; Santos-Reyes, J. Análisis y modelado de la cultura de seguridad de un hospital mexicano mediante cadenas de Markov. Rev. Calid. Asist. 2016, 31, 309–314. [Google Scholar] [CrossRef]
- Lacasse, M.A.; Kyle, B.; Talon, A.; Boissier, D.; Hilly, T.; Abdulghani, K. Optimization of the building maintenance management process using a markovian model. In Proceedings of the 11th International Conference on the Durability of Building Materials and Components, Istanbul, Turkey, 11 May 2008. [Google Scholar]
- Wang, E.; Shen, Z. Lifecycle energy consumption prediction of residential buildings by incorporating longitudinal uncertainties. J. Civ. Eng. Manag. 2013, 19, S161–S171. [Google Scholar] [CrossRef]
- Gomez, A.; Carnero, M. Decision Support System for maintenance policy optimization in medical gases subsystems. IFAC Pap. Online 2016, 49, 268–273. [Google Scholar] [CrossRef]
- Chen, D.; Trivedi, K.S. Optimization for condition-based maintenance with semi-Markov decision process. Reliab. Eng. Syst. Saf. 2005, 90, 25–29. [Google Scholar] [CrossRef]
- Chen, A.; Li, Y.; Xia, T.; Pan, E. Hidden Markov model with auto-correlated observations for remaining useful life prediction and optimal maintenance policy. Reliab. Eng. Syst. Saf. 2019, 184, 123–136. [Google Scholar] [CrossRef]
- Cheng, Q.; Wang, S.; Yan, C. Robust optimal design of chilled water systems in buildings with quantified uncertainty and reliability for minimized life-cycle cost. Energy Build. 2016, 126, 159–169. [Google Scholar] [CrossRef]
- Papakonstantinou, K.; Shinozuka, M. Optimum inspection and maintenance policies for corroded structures using partially observable Markov decision processes and stochastic, physically based models. Probabilist. Eng. Mech. 2014, 37, 93–108. [Google Scholar] [CrossRef]
- Carnero, M.; Gómez, A. Maintenance strategy selection in electric power distribution systems. Energy 2017, 129, 255–272. [Google Scholar] [CrossRef]
- Yang, L.; Ye, Z.; Lee, C.; Peng, R. A two-phase preventive maintenance policy considering imperfect repair and postponed replacement. Eur. J. Oper. Res. 2019, 274, 966–977. [Google Scholar] [CrossRef]
- Silva, A.; Gaspar, P.L.; Brito, J.; Neves, L.C. Probabilistic analysis of degradation of façade claddings using Markov chain models. Mater. Struct. 2016, 49, 2871–2892. [Google Scholar] [CrossRef]
- Madrigal, L.O.; Lanzarote, B.S.; Bretones, J.M.F. Propuesta metodológica para estimación de la vida útil de la envolvente de los edificios. Revista de la Construcción 2015, 14, 60–68. [Google Scholar]
- Al-Momani, K.; Al-Tahat, M.D.; Jaradat, E. Performance Measures for Improvement of Maintenance Effectiveness: A Case Study in King Abdullah University Hospital (KAUH). In Proceedings of the 2006 International Conference on Service Systems and Service Management, Troyes, France, 25–27 October 2006. [Google Scholar]
- Domański, A.; Domańska, J.; Filus, K.; Szyguła, J.; Czachórski, T. Self-Similar Markovian Sources. Appl. Sci. 2020, 10, 3727. [Google Scholar] [CrossRef]
- Grussing, M.N.; Liu, L.Y.; Uzarski, D.R.; El-Rayes, K.; El-Gohary, N. Discrete Markov Approach for Building Component Condition, Reliability, and Service-Life Prediction Modeling. J. Perform. Constr. Facil. 2016, 30, 04016015. [Google Scholar] [CrossRef]
- Papakonstantinou, K.G.; Shinozuka, M. Planning structural inspection and maintenance policies via dynamic programming and Markov processes. Part II: POMDP implementation. Reliab. Eng. Syst. Saf. 2014, 130, 214–224. [Google Scholar] [CrossRef]
- Edirisinghe, R.; Setunge, S.; Zhang, G. Markov Model—Based Building Deterioration Prediction and ISO Factor Analysis for Building Management. J. Manag. Eng. 2015, 31, 04015009. [Google Scholar] [CrossRef]
- Masetti, G.; Robol, L. Computing performability measures in Markov chains by means of matrix functions. J. Comput. Appl. Math. 2020, 368, 112534. [Google Scholar] [CrossRef] [Green Version]
- Al-Momani, K.; Al-Tahat, M.D.; Jaradat, E. Uncertainty analysis in using Markov chain model to predict roof life cycle performance. In Proceedings of the International Conference on Durability of Building Materials and Components, Lyon, France, 17–20 April 2005. [Google Scholar]
- Hicks, C.; McGovern, T.; Prior, G.; Smith, I. Applying lean principles to the design of healthcare facilities. Int. J. Prod. Econ. 2015, 170, 677–686. [Google Scholar] [CrossRef]
- Mardani, A.; Hooker, R.E.; Ozkul, S.; Yifan, S.; Nilashi, M.; Sabzi, H.Z.; Fei, G.C. Application of decision making and fuzzy sets theory to evaluate the healthcare and medical problems: A review of three decades of research with recent developments. Expert Syst. Appl. 2019, 137, 202–231. [Google Scholar] [CrossRef]
- Mahfoud, H.; Barkany, A.E.; Biyaali, A.E. Preventive maintenance optimization in healthcare domain: Status of research and perspective. Qual. Reliab. Eng. 2016, 2016, 5314312. [Google Scholar]
- Sanchez-Barroso, G.; García-Sanz-Calcedo, J. Evaluation of HVAC design parameters in high-performance hospital operating theatres. Sustainability 2019, 11, 1493. [Google Scholar] [CrossRef] [Green Version]
- Kaegi, M.; Mock, R.; Kröger, W. Analyzing maintenance strategies by agent-based simulations: A feasibility study. Reliab. Eng. Syst. Saf. 2009, 94, 1416–1421. [Google Scholar] [CrossRef]
- Shohet, I.; Nobili, L. Application of key performance indicators for maintenance management of clinics facilities. Int. J. Strateg. Prop. Manag. 2017, 21, 58–71. [Google Scholar] [CrossRef]
- Bocken, N.M.; de Pauw, I.; Bakker, C.; Van der Grinten, B. Product design and business model strategies for a circular economy. J. Ind. Prod. Eng. 2016, 33, 308–320. [Google Scholar] [CrossRef] [Green Version]
- Gómez-Chaparro, M.; García-Sanz-Calcedo, J.; Aunión-Villa, J. Maintenance in hospitals with less than 200 beds: Efficiency indicators. Build. Res. Inf. 2020, 48, 526–537. [Google Scholar] [CrossRef]
Figure 1.
Status transition matrix.

Figure 2.
System transition graph.

Figure 3.
Maintenance matrix.

Figure 4.
Maintenance strategy transition graph.

Figure 5.
Bar graph of maintenance periodicity.


Table 1.
Degradation scale of the condition according to the number of incidents.
| Degree | Status Description | No of Monthly Incidents | Degradation |
|---|---|---|---|
| 1 | Excellent | <5 | 0 to 10% |
| 2 | Very good | 6–10 | 11 to 20% |
| 3 | Good | 11–15 | 21 to 30% |
| 4 | Acceptable | 16–20 | 31 to 40% |
| 5 | Tolerable | 21–25 | 41 to 50% |
| 6 | Low | 26–30 | 51 to 60% |
| 7 | Very low | 31–35 | 61 to 70% |
| 8 | Poor | 36–40 | 71 to 80% |
| 9 | Unacceptable | >40 | >80% |
Table 2.
Results obtained from the different maintenance strategies analyzed.
| Option | Transition Graph | Maintenance Matrix | Results |
|---|---|---|---|
| 1 Maximum degradation state 5; returns to state 2 after maintenance |  | ||
| 2 Maximum degradation state 4; returns to state 2 after maintenance |  | ||
| 3 Maximum degradation state 5; returns to state 1 after maintenance |  | ||
| 4 Maximum degradation state 4; returns to state 1 after maintenance |  | ||
| 5 Maximum degradation state 5; returns to state 3 after maintenance |  |
Table 3.
Average monthly incidents of each healthcare center.
| HCC | N° | RP | HCC | N° | RP | HCC | N° | RP | HCC | N° | RP | HCC | N° | RP |
|---|---|---|---|---|---|---|---|---|---|---|---|---|---|---|
| 1 | 21 | C | 6 | 27 | B | 11 | 15 | C | 16 | 31 | B | 21 | 12 | C |
| 2 | 32 | A | 7 | 38 | A | 12 | 14 | C | 17 | 41 | B | 22 | 44 | A |
| 3 | 42 | B | 8 | 20 | C | 13 | 41 | A | 18 | 36 | A | 23 | 42 | A |
| 4 | 19 | C | 9 | 30 | B | 14 | 17 | C | 19 | 21 | C | 24 | 34 | B |
| 5 | 23 | B | 10 | 33 | B | 15 | 32 | B | 20 | 18 | C | 25 | 26 | B |
Table 4.
Maintenance frequency based on monthly incidents and maintenance policy.
| Visit | 3 Weeks | 2 Weeks | 1 Week | |
|---|---|---|---|---|
| Option | ||||
| 2nd | ≤20 incidents | 27–30 incidents | 41–60 incidents | |
| 4th | 21–26 incidents | 31–40 incidents | 61–80 incidents | |
Table 5.
Classification of healthcare centers.
| 2nd Option | 4th Option | ||||
|---|---|---|---|---|---|
| Healthcare Centers | Incidents | Periodicity (Weeks) | Healthcare Centers | Incidents | Periodicity (Weeks) |
| 3 | 42 | 1 | 1 | 21 | 3 |
| 4 | 19 | 3 | 2 | 32 | 2 |
| 6 | 27 | 2 | 5 | 23 | 3 |
| 8 | 20 | 3 | 7 | 38 | 2 |
| 9 | 30 | 2 | 10 | 33 | 2 |
| 11 | 15 | 3 | 15 | 32 | 2 |
| 12 | 14 | 3 | 16 | 31 | 2 |
| 13 | 41 | 1 | 18 | 36 | 2 |
| 14 | 17 | 3 | 19 | 21 | 3 |
| 17 | 41 | 1 | 24 | 34 | 2 |
| 20 | 18 | 3 | 25 | 26 | 3 |
| 21 | 12 | 3 | |||
| 22 | 44 | 1 | |||
| 23 | 42 | 1 | |||
© 2020 by the authors. Licensee MDPI, Basel, Switzerland. This article is an open access article distributed under the terms and conditions of the Creative Commons Attribution (CC BY) license (http://creativecommons.org/licenses/by/4.0/).
Share and Cite
MDPI and ACS Style
González-Domínguez, J.; Sánchez-Barroso, G.; García-Sanz-Calcedo, J. Scheduling of Preventive Maintenance in Healthcare Buildings Using Markov Chain. Appl. Sci. 2020, 10, 5263. https://0-doi-org.brum.beds.ac.uk/10.3390/app10155263
AMA Style
González-Domínguez J, Sánchez-Barroso G, García-Sanz-Calcedo J. Scheduling of Preventive Maintenance in Healthcare Buildings Using Markov Chain. Applied Sciences. 2020; 10(15):5263. https://0-doi-org.brum.beds.ac.uk/10.3390/app10155263
Chicago/Turabian StyleGonzález-Domínguez, Jaime, Gonzalo Sánchez-Barroso, and Justo García-Sanz-Calcedo. 2020. "Scheduling of Preventive Maintenance in Healthcare Buildings Using Markov Chain" Applied Sciences 10, no. 15: 5263. https://0-doi-org.brum.beds.ac.uk/10.3390/app10155263
Note that from the first issue of 2016, this journal uses article numbers instead of page numbers. See further details here.