End-Users’ Augmented Reality Utilization for Architectural Design Review


1
Department of Building and Real Estate, The Hong Kong Polytechnic University, 11 Yuk Choi Rd., Hung Hom, Kowloon, Hong Kong, China
2
Seoul Institute of Technology, Maebongsan-ro 37, Mapo-gu, Seoul 03909, Korea
*
Author to whom correspondence should be addressed.
Appl. Sci. 2020, 10(15), 5363; https://0-doi-org.brum.beds.ac.uk/10.3390/app10155363
Submission received: 13 July 2020
/
Revised: 24 July 2020
/
Accepted: 28 July 2020
/
Published: 3 August 2020
(This article belongs to the Special Issue BIM and Its Integration with Emerging Technologies)
Abstract
:To effectively use augmented reality (AR) technology for end-user involved design collaboration, it is necessary to ensure the effectiveness of the AR system from the end-user’s perspective. However, most efforts have mainly focused on technological development, and as such, limited attention has been paid to the end-user’s application of the AR system. Therefore, this study investigates how the AR system affects architectural design review based on the user’s perspectives. Three different display systems presenting a 3D model including a 2D screen, VR, and AR were tested, and a total of 76 participants evaluated visual presentation quality, perceived acceptability, and user experience according to their usage of the visualization platform types during the design review activities. Compared to other systems, the results indicated that the AR system could be more effective in reviewing the visual elements of a building. Furthermore, AR showed the highest ratings for acceptance level and user experience. The innovation provided by AR created a positive user experience, despite its remaining challenges to be resolved in terms of functionality. Since it is expected that the use of AR can be promoted by overcoming certain technological limitations, this study contributes to guiding AR system applications for end-users involved in the design review process.
1. Introduction
Architectural design is a continuous process of meeting a client’s needs through collaboration [1]. As acquiring reliable feedback from end-users for the assessment of design options would be beneficial for the overall quality of the design and end-user satisfaction, the design review process involves not only designers and engineers but also end-users [2,3]. Design review with end-users also requires a continuous iterative process of sharing building information, and the client is generally provided with project-relevant information by the design team in the form of drawings or models. During this information sharing, finely visualized building information could improve the understanding of design concepts and ideas and facilitate the effectiveness of communication between participants [4].
To support information delivery and management, building information modeling (BIM) is rapidly being adopted by project participants. Moreover, three-dimensional (3D) models allow non-technical parties to understand designs more quickly compared to 2D drawings [5]. 3D models have mostly been presented through 2D systems so far. That said, the recent use of virtual reality (VR) and augmented reality (AR) technologies are gaining considerable attention as a new means of visualization platform. Immersive VR environments using a cave automatic virtual environment (CAVE) or a head-mounted display (HMD) have also been widely used for design review [6]. Recently, with the introduction of a new AR system called HoloLens by Microsoft, an AR system that superimposes a virtual model in the real world has shown its potential as an alternative visualization platform in various applications such as construction simulation and clash detection [7,8]. With a head-mounted device (e.g., HoloLens), users can get a more realistic visualization in a physical environment, which increases the sense of presence and immersion for users. Applying AR to building design tasks allows users to get a more realistic visualization of a 3D building in the real world, which is not easily achieved with traditional or VR-based methods.
However, despite the potential of AR as a new visualization platform, the application of AR for design collaboration remains a niche area. In fact, most efforts in previous studies have focused on the technical development of AR systems, such as the real-time registration of virtual objects into real-world scenes [9]. Limited attention has been paid to investigating how useful the new AR system is as a visualization tool for design review from an end-user’s perspective [10]. Therefore, project participants are still not familiar with the use of AR technology for design collaboration; as such, it is difficult to choose an appropriate visualization platform that enables end-users to better understand building information during design review. To facilitate the use of the AR system for design review, it is necessary to ensure that the perception of AR-based design information can improve the end-user’s level of awareness to building information, and will improve the user’s experience for design review tasks. However, few studies have investigated the user’s comprehension of building information and the mechanism of AR experience on user-involved design review activities.
With this research gap, this study aims to investigate the visual presentation quality and user acceptability of an architectural design presented using AR through a controlled experiment. In particular, the experiment was designed to compare design review effectiveness and user perception between AR and other existing visualization platforms (i.e., visualization using a 2D monitor and a VR system). For the experiment, 76 undergraduate students were recruited and provided with different design alternatives using three types of visualization platforms (i.e., 2D monitor, VR, and AR) to test the feasibility of the new technology under the perspective of a general user. This study selected various design review factors (i.e., color, texture, shape, fenestration, naturalness, and scale) to be examined, which aimed to measure how effectively the visualization platform could present various building elements. Additionally, the subject’s acceptance level of three visualization platforms was investigated through a survey based on the concept of the technology acceptance model. Lastly, the user experience from the AR platform was measured to investigate a user’s perception toward future utilization. Based on the results, suggestions to improve the AR system for design review were discussed.
2. Literature Review
2.1. End-User Involved Design Review and Visualized Building Information
Design review is a co-creation process, which involves the representatives of designers, project teams, subcontractors, suppliers, and even clients to review designs and share different perspectives to address potential issues [2]. By gathering all actors involved in a project at an early stage, it allows professionals and clients to create building project design in a collaborative way. An effective and efficient design review can improve the quality of the final product and ultimately reduce the project’s cost and duration [11]. In particular, the participation of end-users is critical, since they will occupy most of the building’s life cycle as inhabitants, external service providers, operation and maintenance personnel, or building administration. For these reasons, end-user involvement during design review is considered as an essential phase that can elaborate on the end-user’s requirements to significantly improve overall design quality and satisfaction. In this regard, when it comes to sharing design information with end-users, appropriate and effective visualization of building information is required during the iterative presentation and evaluation phases. This is because design proposals should be reviewed by various participants, such as clients or a design review board [4,12]. However, in the past, it was common for clients to only be provided with images of 2D drawings or 3D physical models as the visual component in communication. Even if a 3D virtual model is used, it was common to present a 3D model of a building through a 2D environment, such as a printed copy or monitor display [13]. In general, end-users have various backgrounds, limited experience in design review, and are not familiar with design representation language or information used by experts. These types of information prepared by experts rely on their skills for mutual understanding, which may lead to a misunderstanding of information for non-experts. Furthermore, it does not allow end-users to actively understand the building design, which makes it difficult for experts to interpret the client’s perception of design. As a result, end-user involvement in design review is often minimized or ignored due to the lack of appropriate resources [14]. Meanwhile, with the recent advancements of computing technology, VR and AR have shown the potential of presenting more realistic representations of virtual models to end-users [15]. VR and AR can also provide non-technical parties with an increased sense of presence and immersion, which is not easily possible with 2D-based traditional methods [16].
With the potential of becoming new visualization platforms, VR and AR-related technologies have been rapidly accepted by the field of architecture, engineering, and construction (AEC), allowing BIM models to be visualized more intuitively [6]. VR and AR are the two main visual presentation platforms that are used for building information. VR has been defined as a simulated virtual environment in which a user experiences telepresence (the feeling of being present in the current environment) and can freely navigate, manipulate, and interact with virtual objects [17,18]. Examples of a virtual environment often include graphic simulations using a computer with either a monitor-based or immersive head-mounted device [19]. The term mixed reality (MR) refers to environments where real and virtual objects are presented together within a single display [20]. Specifically, MR incorporates virtual objects into reality or introduces real-world objects to a virtual environment [21]. AR is placed within the range of MR since it allows the presentation of virtual objects in a real environment by using see-through and monitor-based displays. AR simulates virtual prototypes into the real world and provides a connection between the virtual and real-world while maintaining the flexibility of the virtual world [22,23].
2.2. Application of Augmented Reality in the Construction Industry
The unique features of AR technologies (e.g., enhancing additional virtual information on real-world scenes) have provided new opportunities to improve the existing practices of construction projects. The virtual aspects of AR have great potential for pre-construction stages, as it can imitate risky settings that are difficult to simulate in real construction sites [24]. AR not only provides a virtual construction environment in a risk-free setting but also allows users to interact with their surroundings through a wearable device or screen projection [25]. In addition, the AR can create a spatial relationship between the virtual information and the real space by overlapping new virtual information to the real space. This allows users to have a realistic experience of viewing the augmented virtual building object in a real space. Benefiting from this feature, an AR system can analyze constructability or safety issues by simulating construction processes with a virtual prototype at real construction sites [26]. State-of-the-art AR software and hardware, including hand-held devices or head-mounted devices, achieve a seamless synthesis between the digital and physical world to provide virtual information overlaid in a physical environment [23]. Hand-held AR devices can simply include smartphones and tablets, while head-mounted AR devices can be head-up displays for screens, eyeglasses, contact lenses, and space displays [27]. During a design phase, the combination of AR with BIM models allows users to visualize a proposed 3D model that is merged with a surrounding space [7]. For example, when a digital model is overlaid on the actual site, users get to see the parts of the building (i.e., materials, ductwork, furniture, light fixtures, etc.) as they are intended to be installed in advance. With such functional advantages, AR has been applied in construction research that focuses on design collaboration [6,10], construction management [8,28,29], and safety management [30,31,32].
Several studies have shown AR as an effective way of reviewing designed building models [33]. Tonn et al. (2007) focused on AR system application to review aesthetic factors (e.g., color and texture), and Wang and Dunston (2008) tested an AR system on the design error detection task in the construction stage [34,35]. Although previous studies have examined the application of AR for various design review tasks, they have focused on the technical aspects of the AR system (e.g., registration algorithms) or its feasibility for design review tasks. As such, there is a lack of investigation for the end-user experience. Thus, project stakeholders still may have trouble finding an appropriate visualization platform to involve end-users in design review activities [36]. To implement AR technology in a design review phase, it is necessary to ensure that the AR experience improves users’ level of awareness to building information and level of involvement [37]. In this regard, previous studies have limitations in investigating the quality of presentation and end-user acceptability during AR-based design review activities. Considering AR technologies are increasingly recognized as a new alternative display platform for design information, design review elements, such as color, texture, shape, and volume, should be examined differently based on the type of visualization platform. Additionally, since most of the research is limited to comparing VR or AR with traditional 2D screens respectively, a comprehensive comparison is required for all three display platforms (i.e., 2D screen, VR, and AR) when analyzing its quality of presentation and end-user perception [13,38]. Furthermore, the usability and user experience of the AR platform, which determines how well end-users can utilize the AR system, should be carefully examined for a practical application in the future. Only a few prior studies have explained how AR utilization affects a design review task, especially from the view of end-user experience. Overall, to find an appropriate method for involving end-users in the design review process, it is essential to understand an AR system’s strengths and weaknesses in terms of visualization, acceptability, and user experience.
3. Research Methodology
3.1. Procedures and Participants
The primary purpose of this study is to evaluate the effectiveness of an AR system for an architectural design review task, concerning visual presentation quality, acceptability, and experience from the end-user’s perspective. This includes comparing the AR system with other visualization platforms such as a 2D screen and a VR system. For a comparative analysis, fully prepared BIM-based environments using a 2D screen, a VR headset, and an AR headset were employed for a design review task. A total of 30 undergraduate students from the Hong Kong Polytechnic University who are studying construction-related majors were recruited. They were randomly divided into three different groups for each visualization platform. Participants were briefed about the procedures of the design review task using the assigned display platform as a visualization tool before performing a design review. After the design review was conducted by each subject, he or she verbally answered a questionnaire to determine the level of satisfaction regarding the design of specific architectural components (e.g., siding, roofing, walls, floors, and fenestration of the building) and overall atmospheric aspects (e.g., overall shape and volume of the building’s interior and exterior) of the building model. In addition, to measure the user experience of the AR system for design review, an additional 46 participants performed AR-based design review activities including rotating viewpoint, navigating through a building, and measuring building elements. After the design review, subjects were required to complete questionnaires in order to rate the quality of visual presentation, perceived acceptability, and user experience for conducting an architectural design review. All 76 participants were provided with the informed consent process for voluntary participation and briefed about the purpose and process of the experiments sufficiently.
3.2. BIM Models for Design Review Tasks and Display Devices
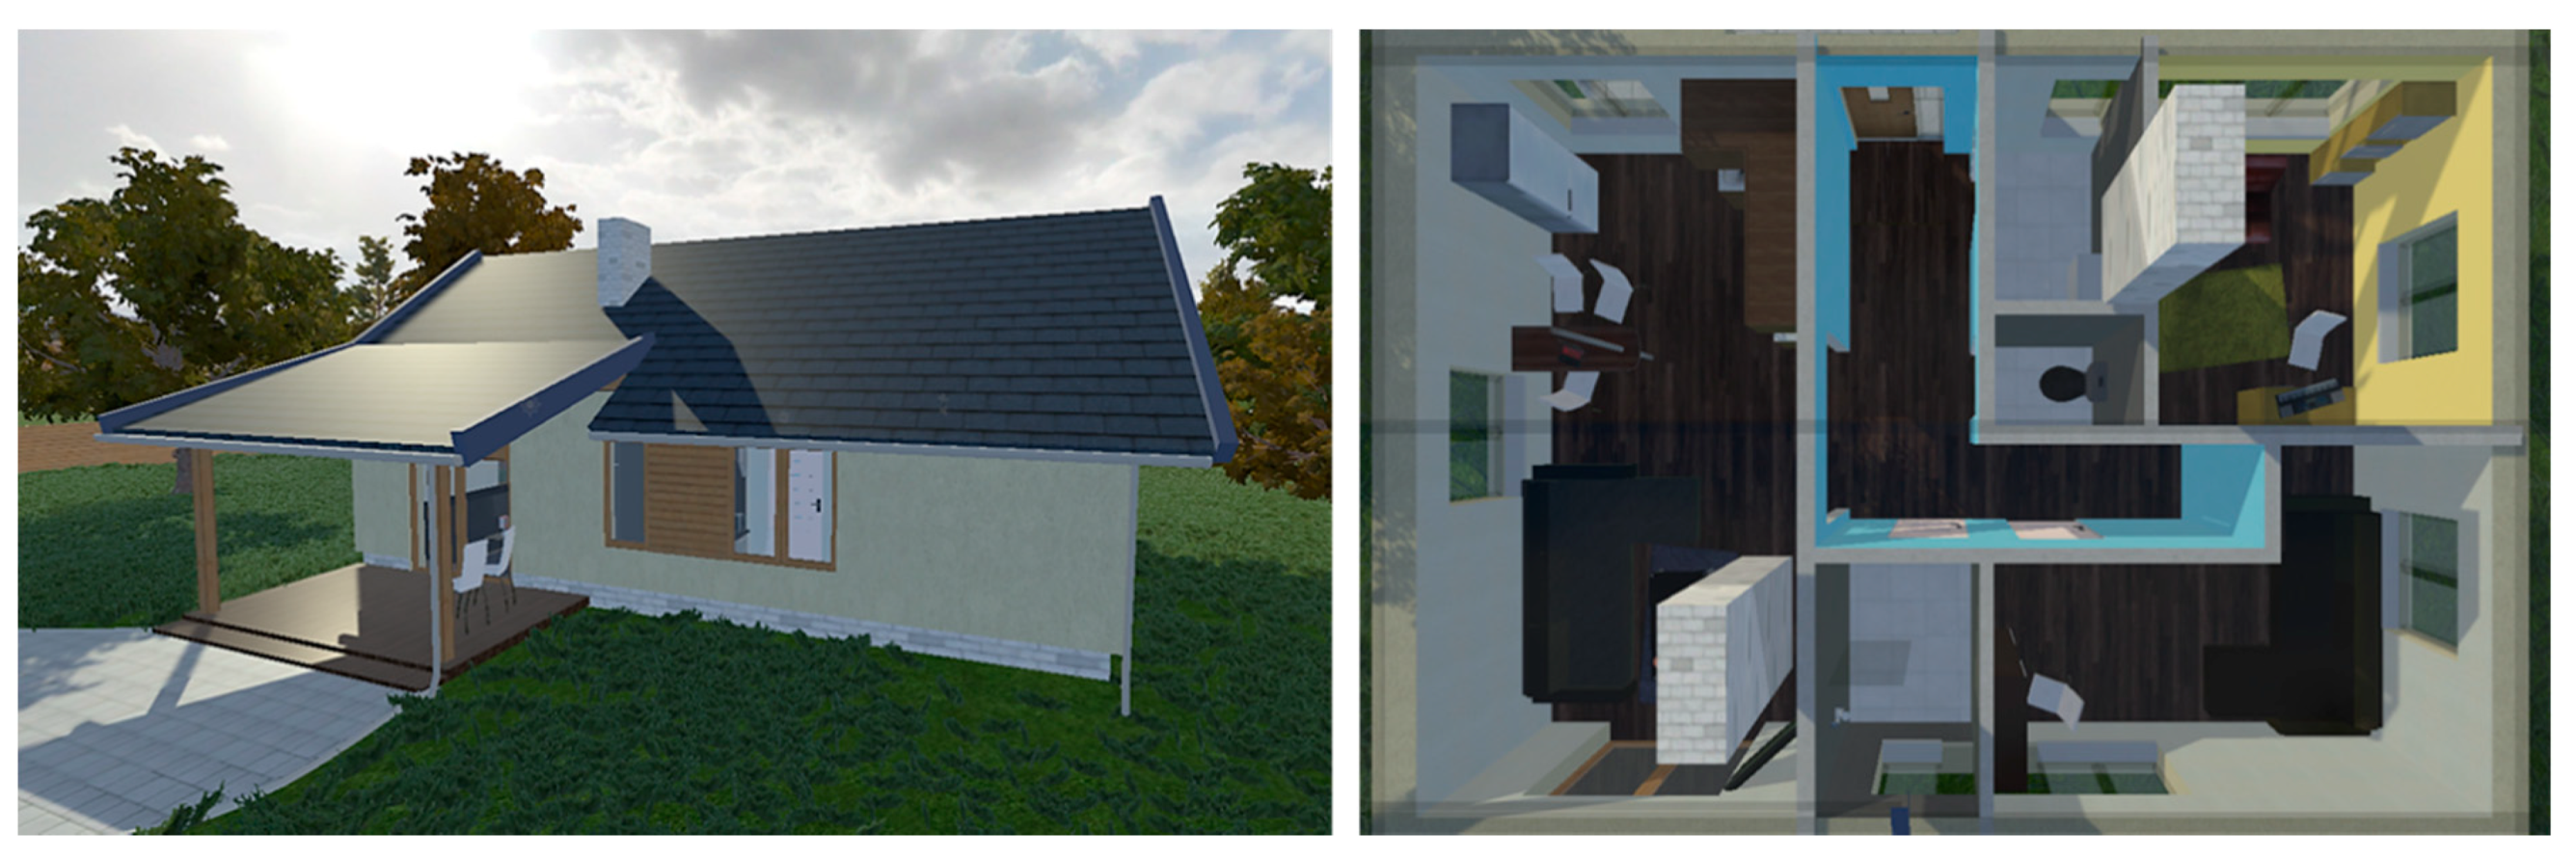
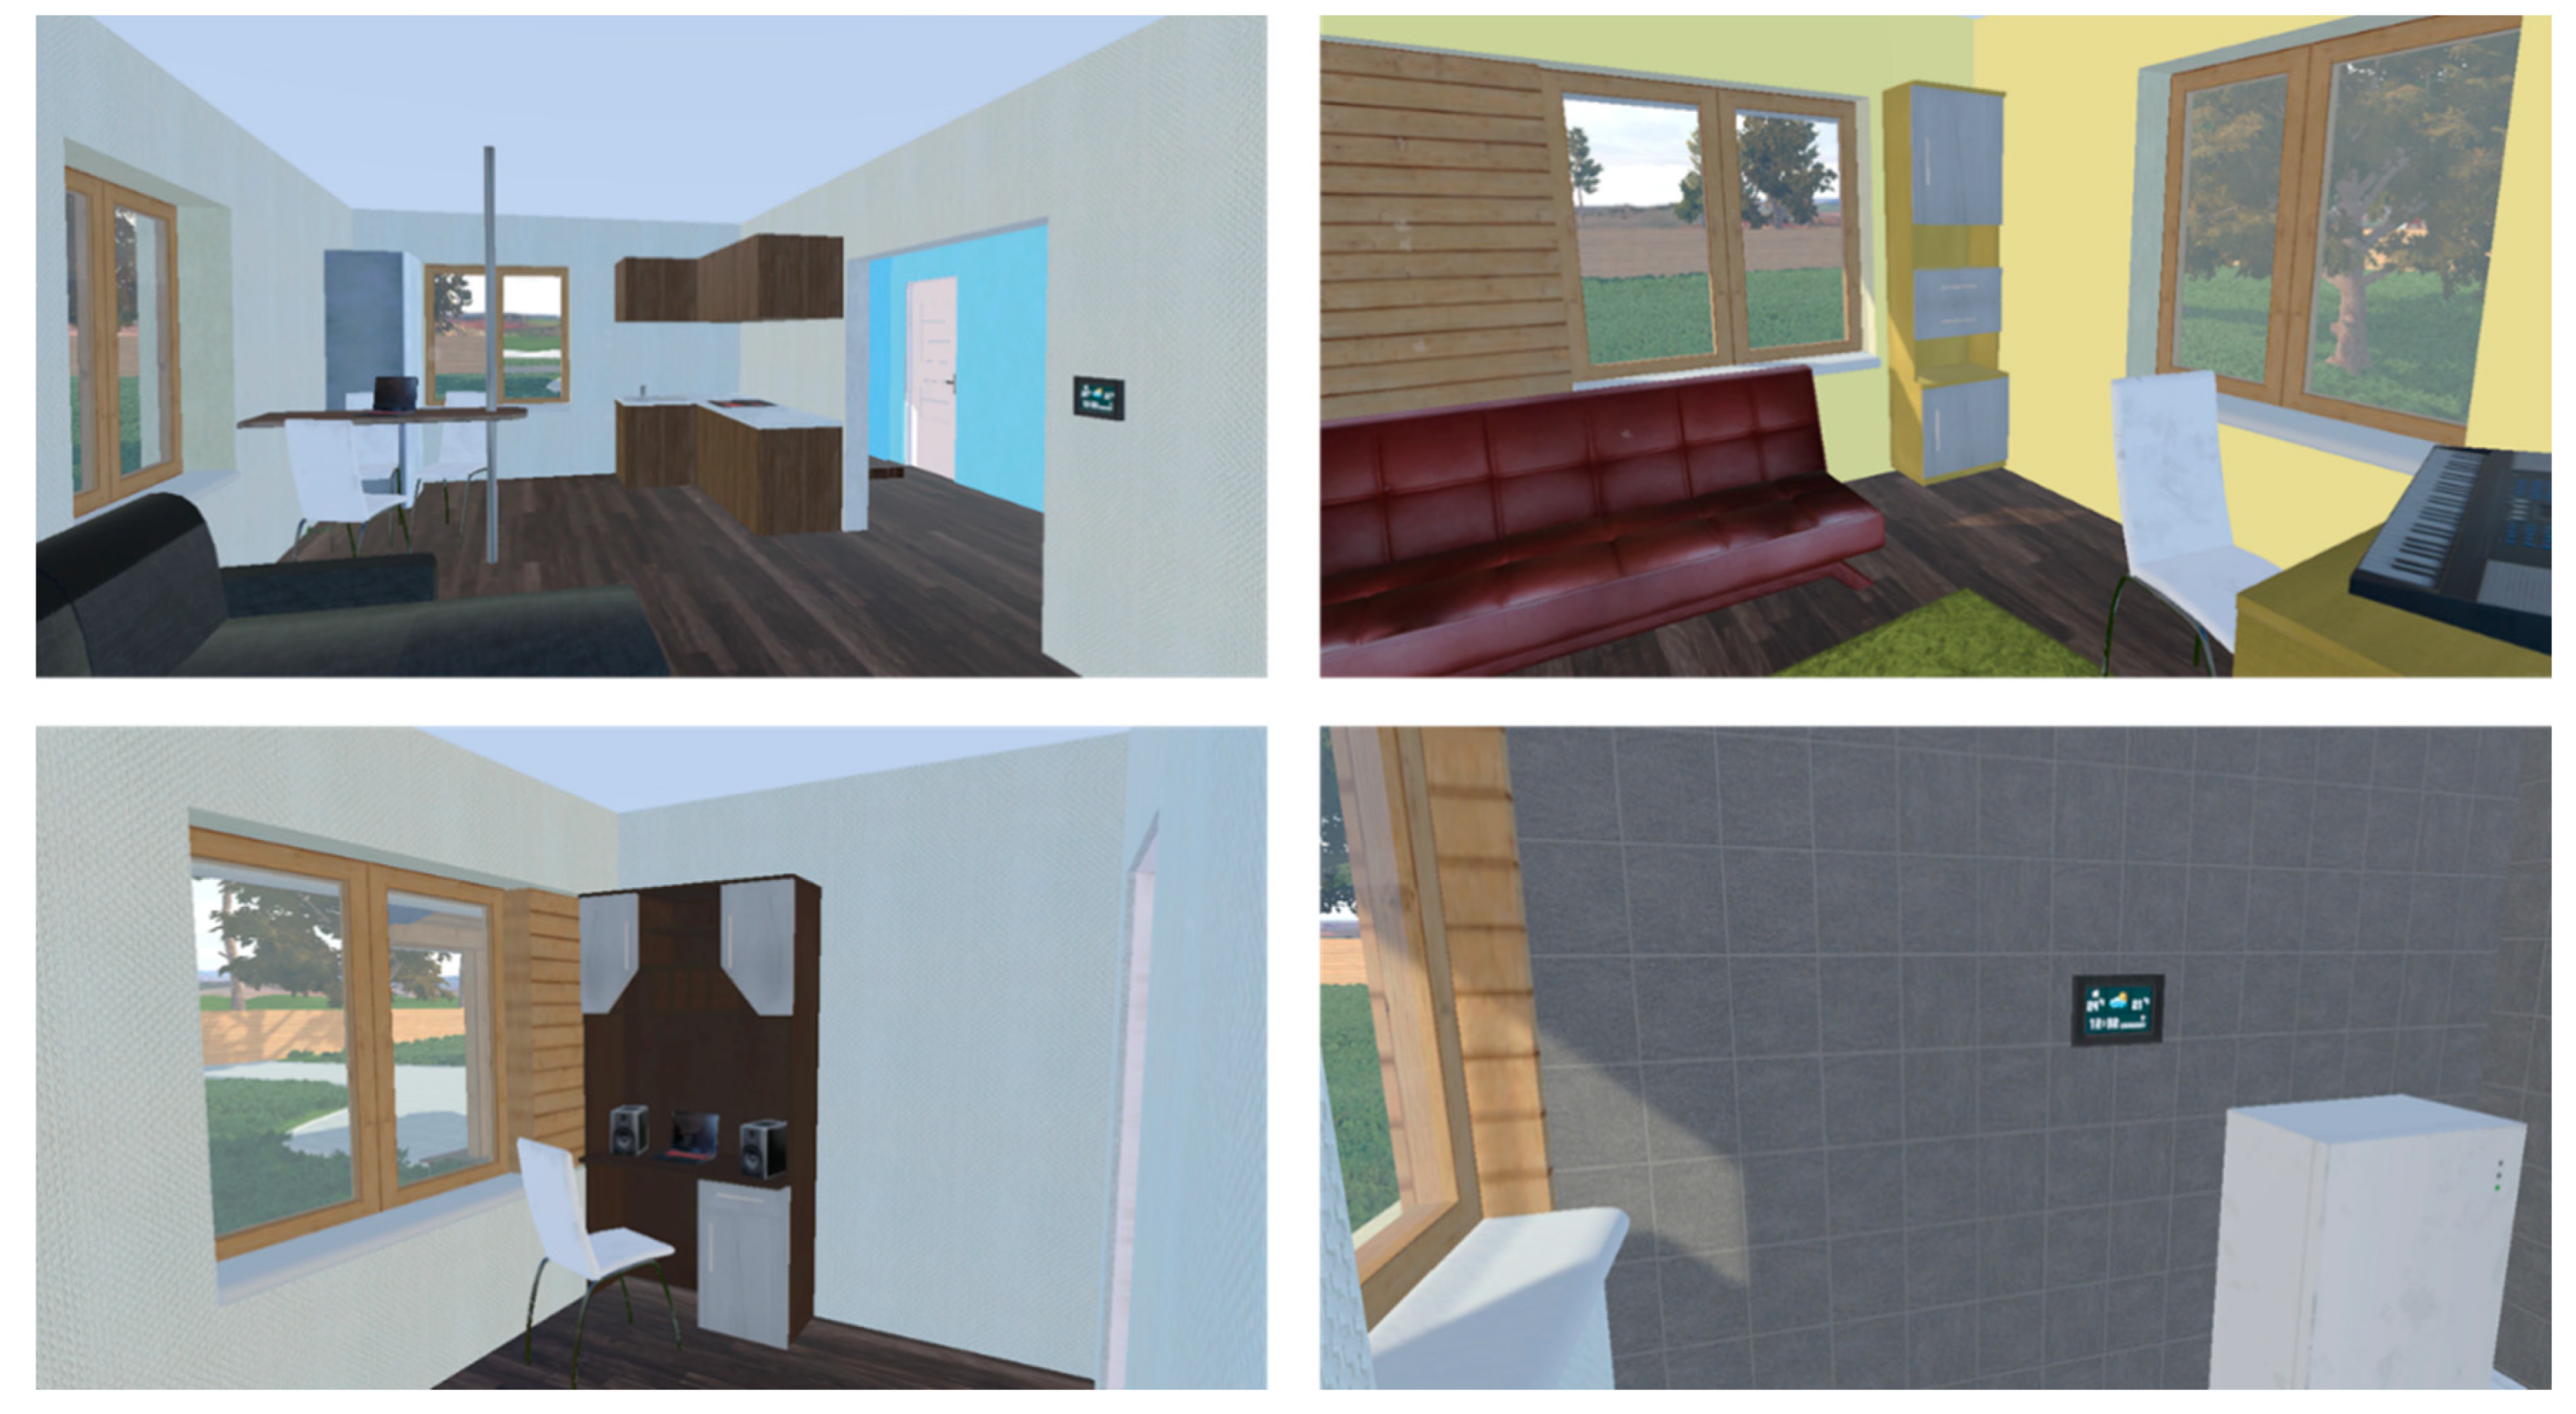
A one-story residential building was modeled and visualized through three visualization platforms (i.e., a 2D screen, a VR head-mounted display, and an AR headset). The building is separated by seven different areas including a living room, a main hall, a bedroom, a study room, a shower room, a toilet, and a laundry room (Figure 1). The model presented a detailed level of architectural design. The walls and floors inside are decorated with materials with different textures and colors, and each area is equipped with components such as a furnace, sofa, table, sink, and table (Figure 2). The BIM model was built using Autodesk Revit Software, and was imported into the Unity game engine to visualize the model in the VR and AR systems. The size of the model was adjusted in Unity so that users could experience the same magnitude and volume of the model regardless of system type. This process also requires additional software to display the model in VR and AR devices (SteamVR for VR, and Vuforia for AR systems).
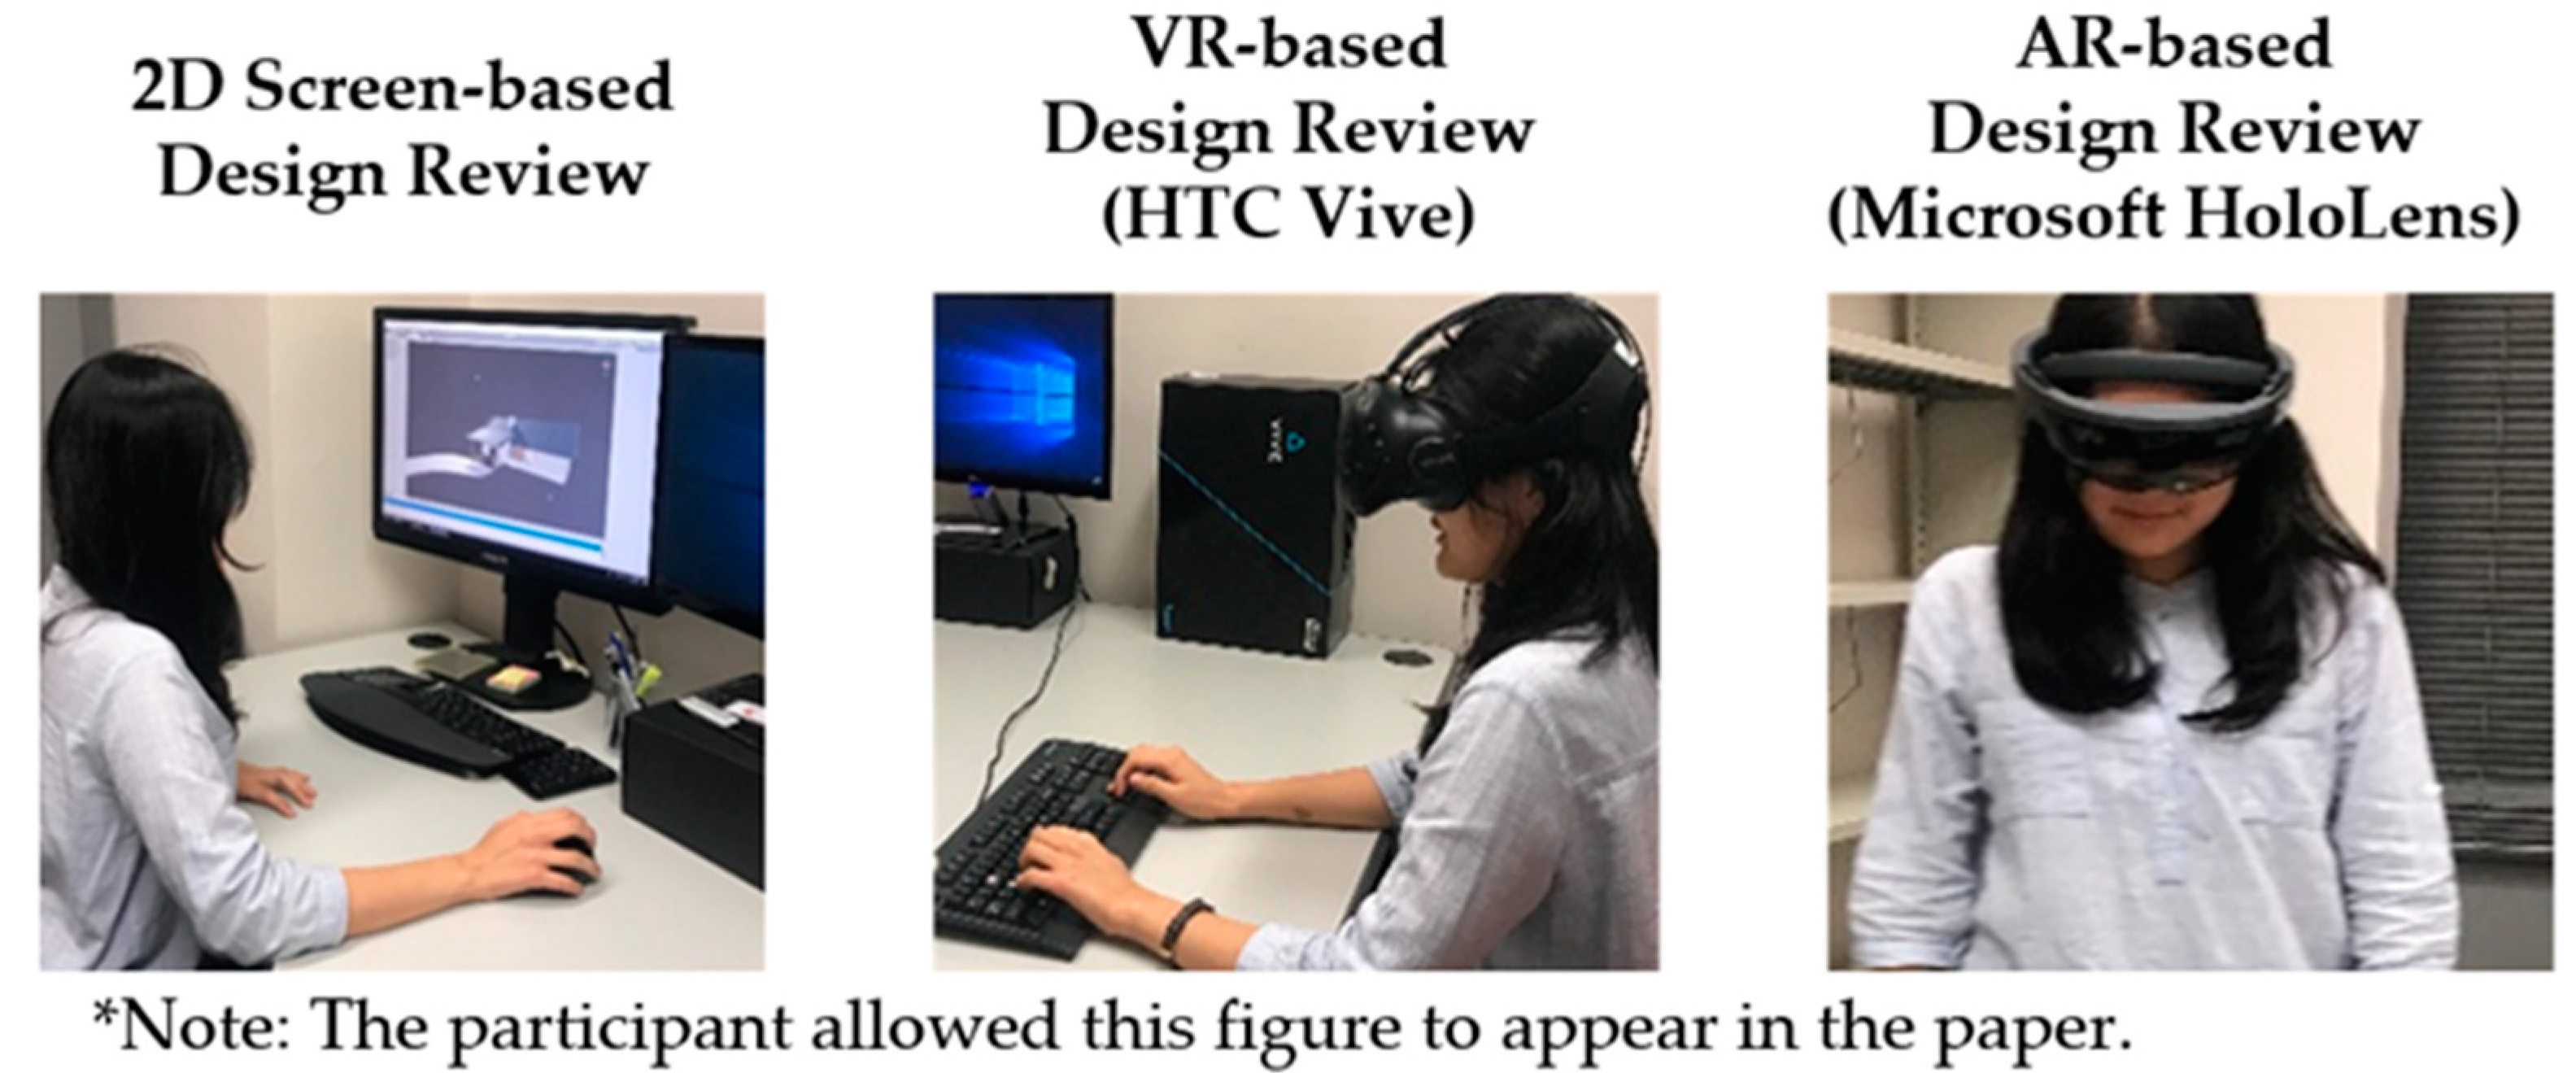
Two groups wore head-mounted devices to use the VR and AR systems; the HTC Vive and Microsoft HoloLens were used for VR and AR, respectively, while the remaining group reviewed the design presented on a 2D screen (Figure 3). The subjects that used a 2D screen (2D screen user group) could directly control the model using a mouse and keyboard whenever they wanted to rotate or zoom in/out. The group with an HCT Vive (VR user group) could walk in and around the virtual model in a fully immersive environment by simply controlling their movement with the arrow keys on a keyboard. Last, the group using a Microsoft HoloLens (AR user group) was required to walk around in the real world to change the scenery of the visual model, which was overlaid into a designated physical space. The participants used the device in front of the desk and walls where no other objects exist; the augmented building information in the HoloLens was not disturbed by other objects in the physical space. To get closer or turn an angle of view in the AR environment, the subjects needed to physically approach or rotate around the area, which is similar to a real-world setting.
3.3. Questionnaire and Measurement
The first part of the questionnaire aims to compare subjects’ perceived quality of visual presentation of the three display platforms for the design review task. The questionnaire is divided into categories of color, texture, size/location, naturalness, and scale [35,39]. The categories for color, texture, and size/location directly deal with the specific characteristics of an element. “Naturalness” refers to the degree of how a user can naturally perceive or understand the model. Lastly, the scale measures the degree to which a user can judge scale and spatial volume from the model, which is associated with the overall impression or ambiance of the model. Specific items for visual presentation are summarized in Table 1, and a Likert scale was adopted for the questionnaire to rate each item from 1 (strongly disagree) to 5 (strongly agree).
For the second part of the questionnaire, subjects’ acceptability toward each display platform is measured. Based on the technology acceptance model (TAM) and extended research on TAM [40,41,42,43], the questions are divided into six categories of physical comfort, mental comfort, perceived usefulness, perceived ease of use, user satisfaction, and behavioral intention (Table 2). Based on Hart and Staveland’s (1988) descriptions on measuring perceived workload, physical and mental comfort can be defined as a relationship between the amount of mental/physical process resources and the amount that the task requires [41]. Perceived usefulness explains the degree to which a user believes that using technology would enhance job performance [40]. User satisfaction is defined as the level of satisfaction that users feel after using technology [42], and behavioral refers to a user’s intention to use technology [44]. Another category that measures user motivation for technology along with perceived usefulness is perceived ease of use, which measures the degree to which a user believes that using technology would be free of effort [40].
For the last part of the questionnaire, the user experience questionnaire (UEQ) was used to evaluate the user experience of the AR system. UEQ is an evaluation method used to collect the subjective metrics of user experiments quickly and directly in terms of pragmatic and hedonic quality [44]. UEQ measures six factors through 26 questionnaire items (Table 3). The scale of an item ranges from −3 to +3, with −3 representing the most negative answer, 0 representing a neutral answer, and +3 representing the most positive answer.
4. Results
4.1. Quality of Visual Presentation
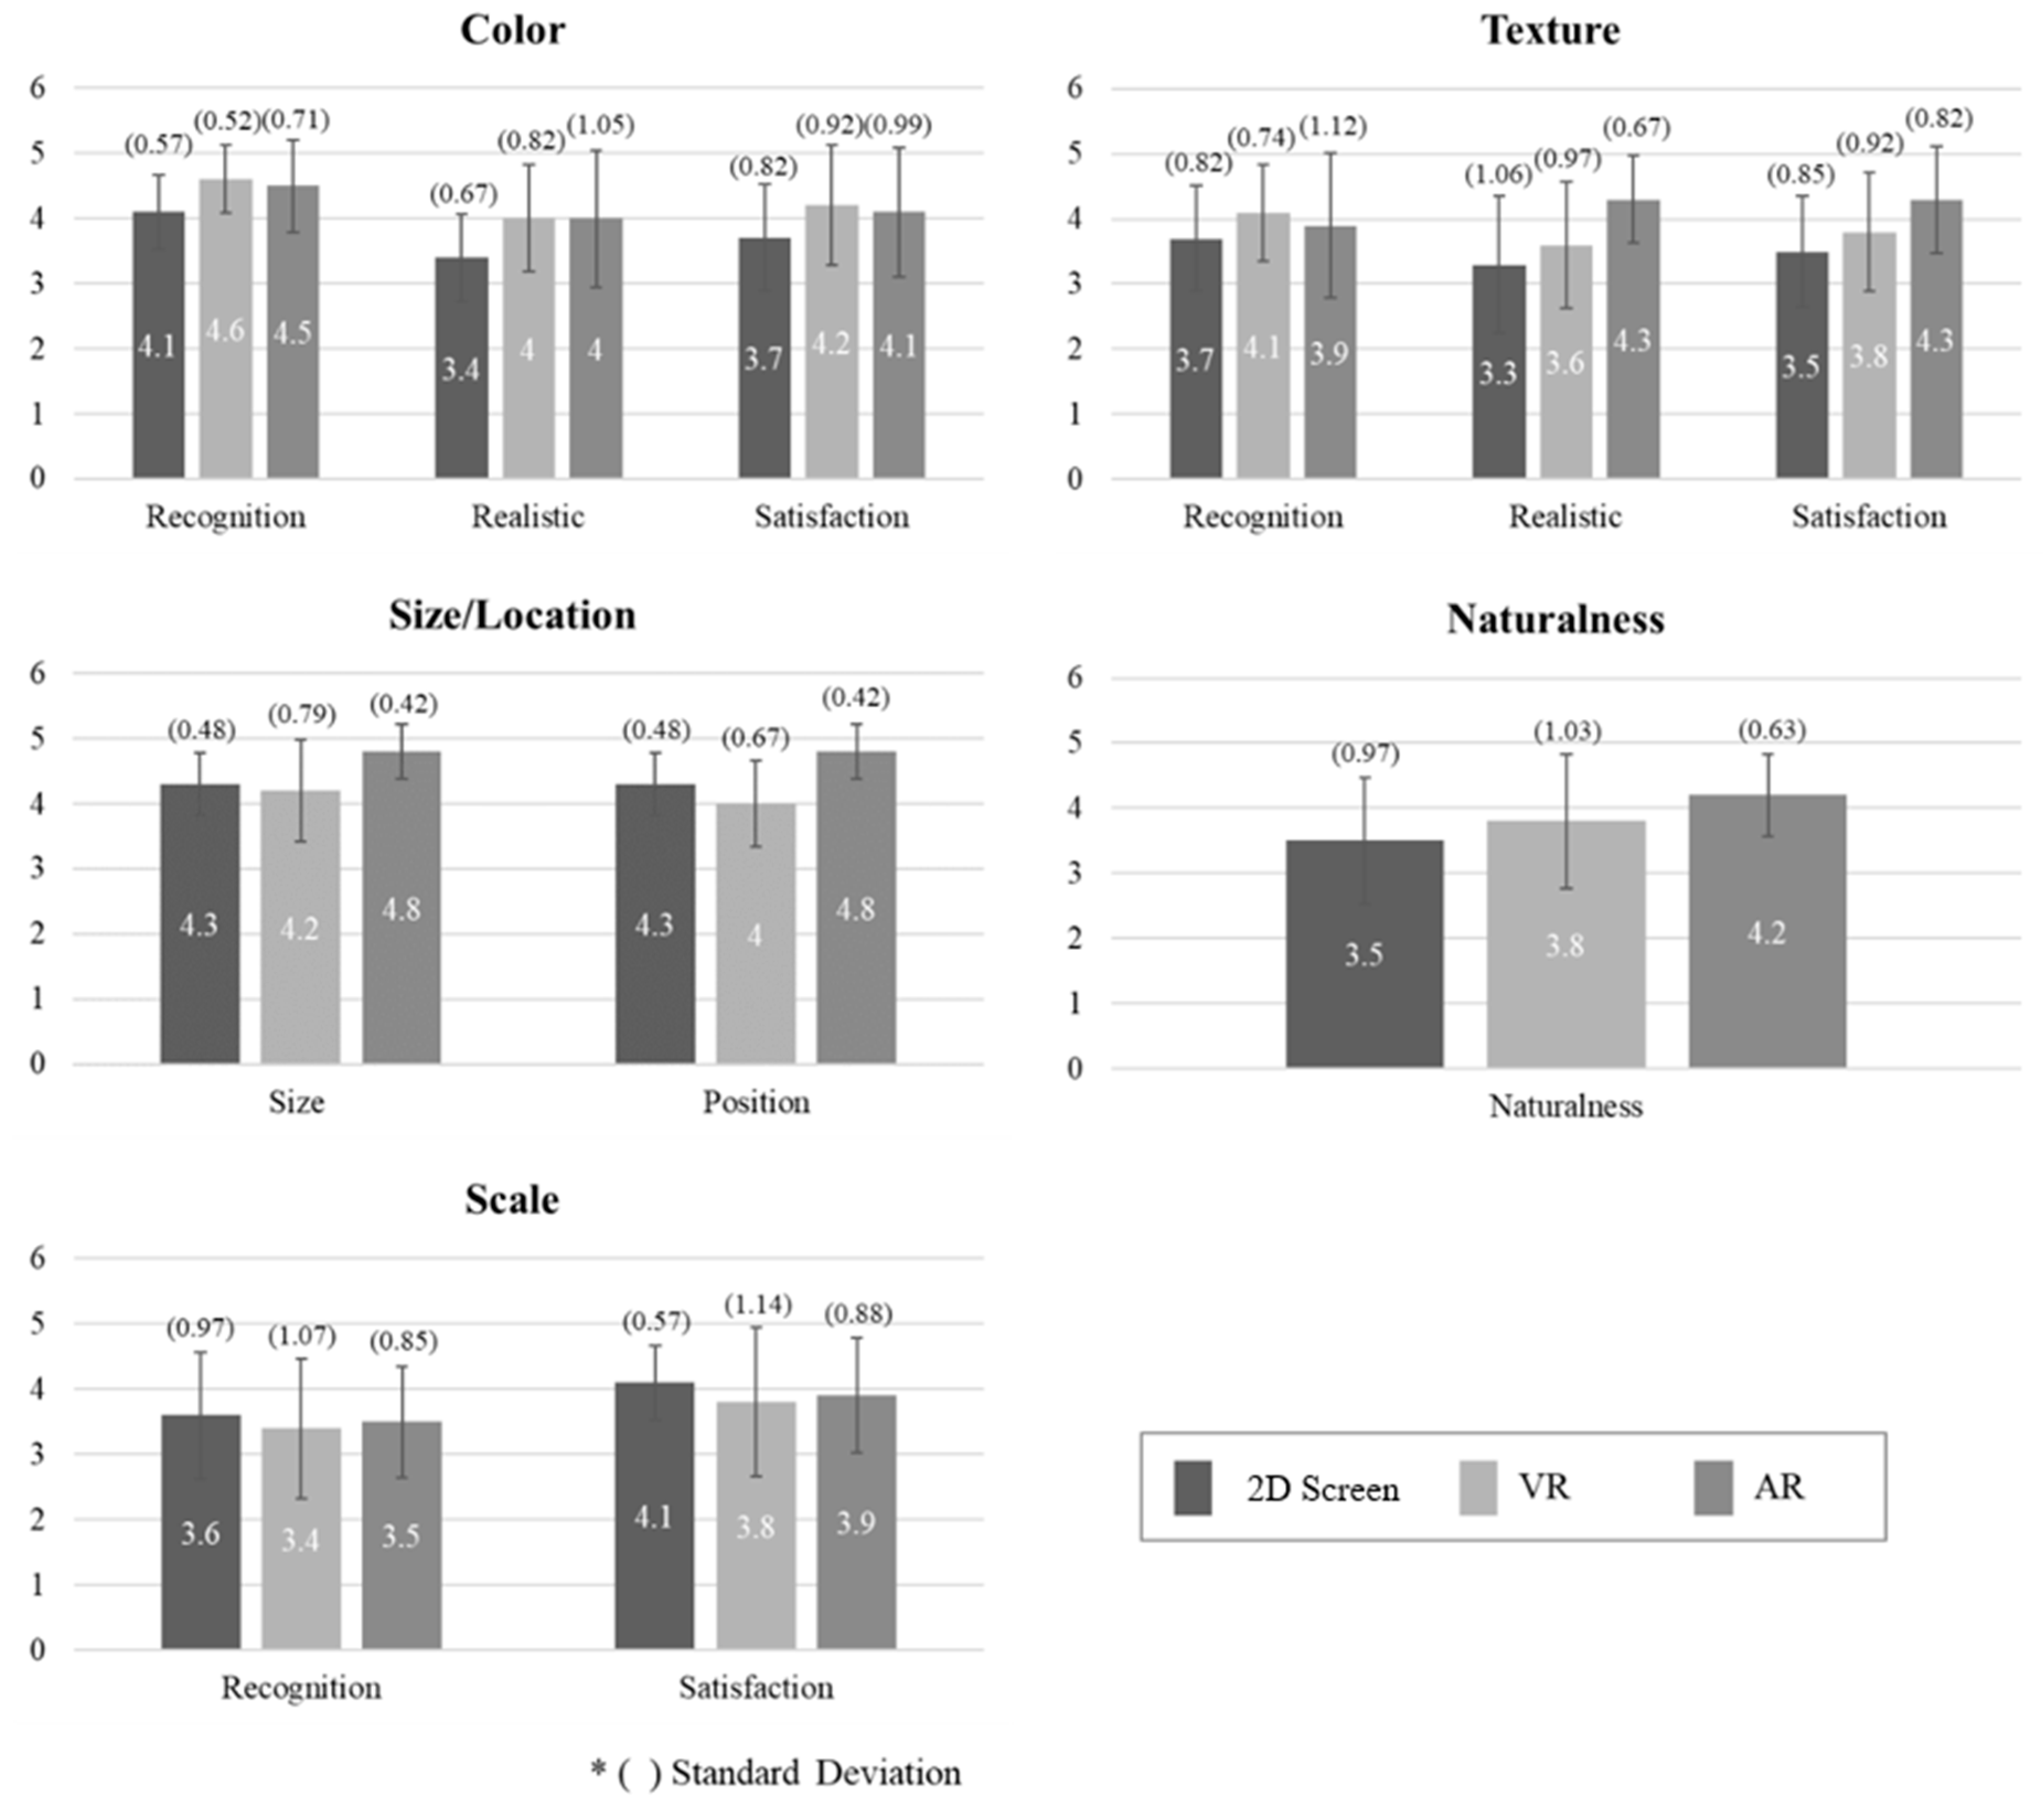
Table 4 summarizes the subjects’ responses on the quality of visual presentation in terms of color, texture, size/location, naturalness, and scale of the 3D BIM model during design review using the 2D screen, VR, and AR. Overall, subjects responded by saying that AR provided better visual presentation quality, specifically for texture, size/location, and naturalness, compared to the 2D screen and VR. However, the color of the 3D BIM model was best presented in VR and subjects felt a better sense of scale with the 2D screen compared to other systems.
The color and texture were measured using three factors: ease of recognition, realism level, and satisfaction level. VR (M = 4.27) presented the color of the model better than the AR (M = 4.20) and 2D screen systems (M = 3.73). Specifically, VR received the highest score for color recognition and satisfaction compared to AR and the 2D screen (Figure 4). It was reported that the color was presented more realistically and vividly in both VR and AR (M = 4.0) compared to the 2D screen system (M = 3.4). In terms of texture review, different to the color, the AR environment obtained the highest mean value of 4.17 compared to the VR and 2D screen environments, with a value of 3.83 and 3.50, respectively. The distinct rating is shown in Figure 4, in that the model deployed through AR was the most realistic and satisfactory, followed by VR and the 2D screen. On the other hand, VR was better for texture recognition (M = 4.1) than AR (M = 3.9) and 2D screen (M = 3.7). While AR and VR had higher ratings in terms of color and texture presentation than the 2D screen system, it is noticeable that AR performed better in providing more realistic color and texture than the other two methods.
Test subjects were asked to review the ease of size and location recognition of specific building elements (e.g., windows and doors). Size recognition was better in AR (M = 4.8) than with the 2D screen (M = 4.3) or VR (M = 4.2), and the position of elements was also better recognized using AR (M = 4.8) than VR (M = 4.0) and the 2D screen (M = 4.3). The naturalness data shows the order of the three different types (Figure 4). The AR system (M = 4.2) was deemed to be the most natural, followed by VR (M = 3.8) and then the 2D screen (M = 3.5). This implies that VR is presented more naturally than the AR system for the design review task. Participants were required to review not only exterior features but also an indoor space of the model. Two front doors of the building were opened so that 2D screen and AR users could see inside. VR subjects were able to directly walk through the indoor area, while 2D screen users could go inside the area by using zoom in and rotate functions. AR users were only able to review through windows and open doors. Although VR users were able to go inside, the results show that the 2D screen (M = 3.6) was better than AR (M = 3.4) and VR (M = 3.4) in terms of space recognition. Furthermore, users were satisfied most with the 2D screen to review the area (M = 4.1), followed by AR (M = 3.9) and VR (M = 3.8). Some students using the VR system remarked that while reviewing the indoor area, they needed to move their head around, which made them feel dizzy. This discomfort was reflected in the results.
4.2. User Acceptability
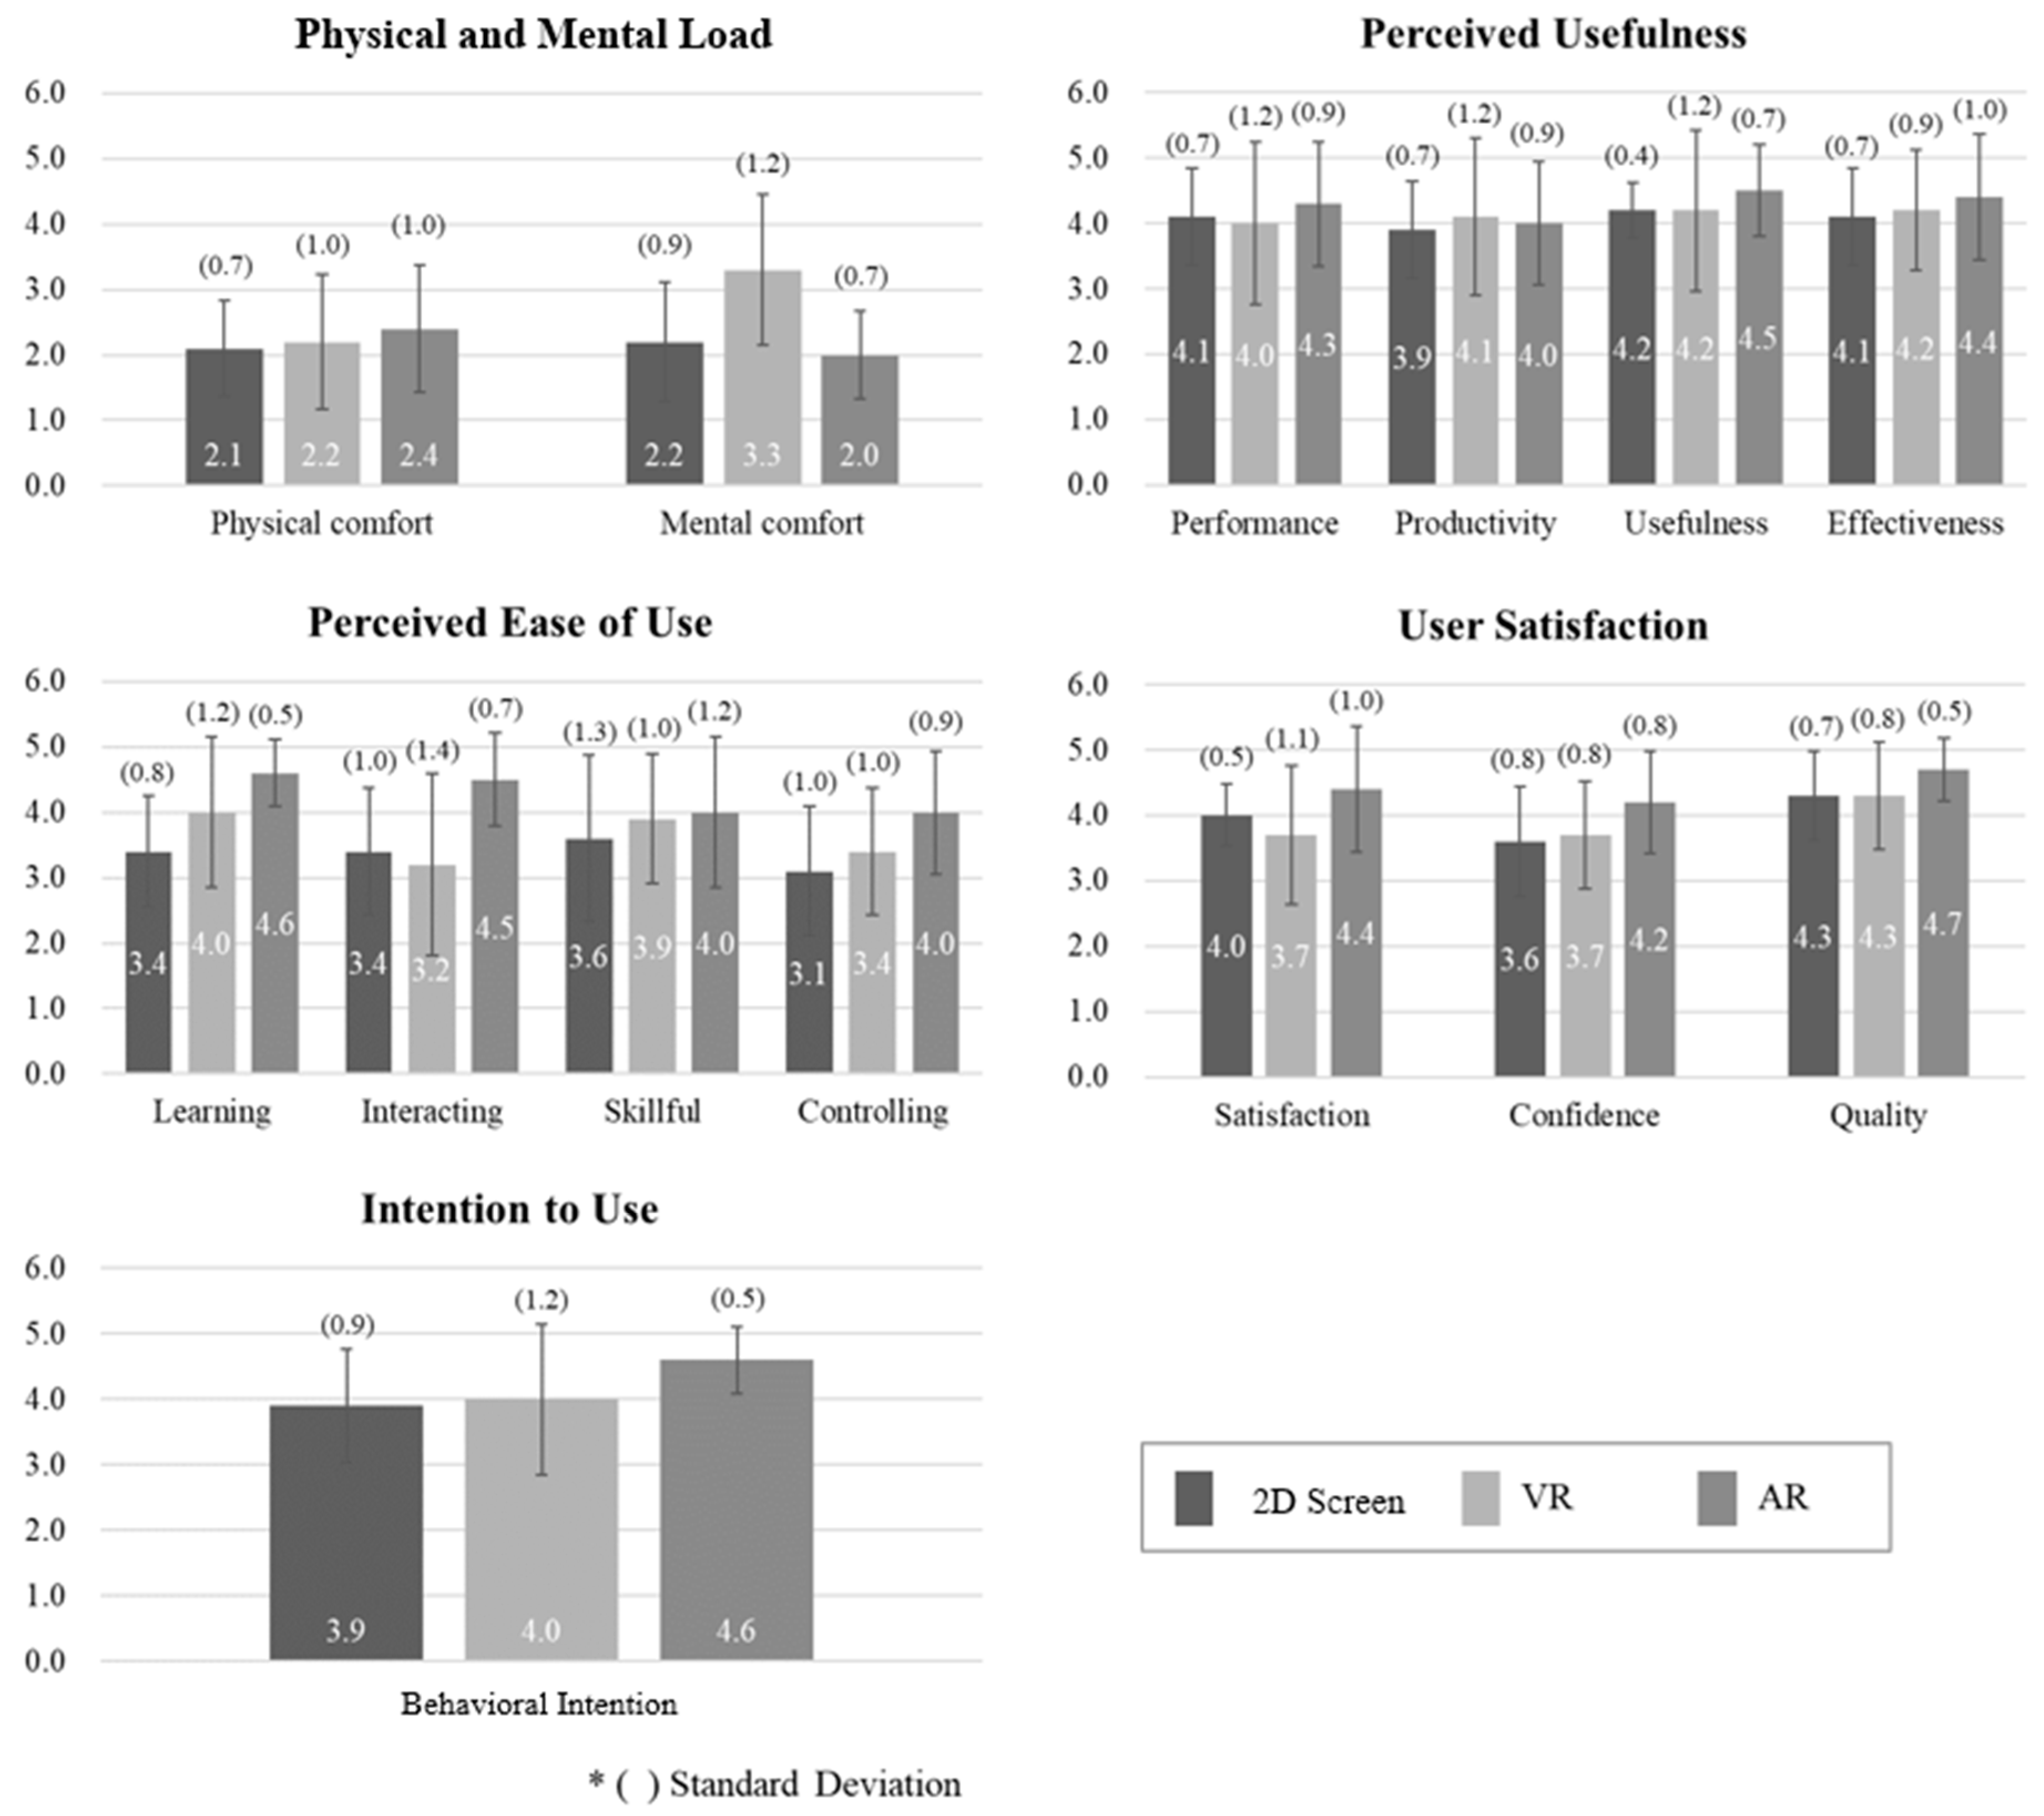
As shown in Table 5, the results show that AR has the highest technology acceptance level across all factors for user acceptability, except for physical comfort. The results indicate that AR was the most physically demanding, while VR was the most mentally demanding. Subjects revealed that the 2D screen was less physically demanding compared to AR and VR, which requires users to wear the device on their head. Mental demand was noticeable with the VR device, with a mean value of 3.3, and the 2D screen was rated better than AR with a mean value of 2.2 and 2.0, respectively. Although the dizziness level was different for each individual, most felt dizzy in the VR environment. However, the difference was insignificant between VR and AR in regard to the physical demand because both systems require an HMD. Moreover, AR subjects were required to walk around while wearing the device on their head to review the model, which is physically demanding.
Although the difference between the three systems for perceived usefulness is not readily noticeable, users recognized that AR (M = 4.3) was better than VR (M = 4.0) and the 2D screen (M = 4.1). Perceived usefulness included four components: performance, productivity, usefulness, and effectiveness. Users perceived that the AR system was the most useful for design review as it improved their performance and efficiency. However, VR was rated as having the highest level of productivity with a mean value of 4.1. For perceived ease of use, subjects felt that AR was the easiest to use compared to VR and the 2D screen. This was predictable, as AR reviewers were only required to wear the device and walk around the deployed model to perform the design review. However, VR reviewers had to walk around the virtual environment using a keyboard to navigate, while 2D screen reviewers used a keyboard and mouse to review the model. Consequently, AR had the highest mean value for all factors, and VR recorded a higher mean than the 2D screen for the learning, skillful, and controlling factors (Figure 5). In addition, interacting with the model in the system was deemed to be more comfortable using the 2D screen compared to VR.
The mean user satisfaction score was distinctively higher with AR (M = 4.43) than the 2D screen (M = 3.97) and VR (M = 3.90). The results were similar to user confidence and the industry quality factors (shown in Figure 5). The high mental demand of the VR system might have affected system satisfaction, although it provided high visual presentation quality. Lastly, the behavioral intention results were higher with the AR system (M = 4.6), while the VR system (M = 4.0) was slightly higher than the 2D screen system (M = 3.9). This could be interpreted as the users being more willing to use the AR system for aesthetic design review since they were most satisfied with the AR method in terms of both visual presentation quality and technical acceptance level.
4.3. User Experience
Table 6 summarizes the UEQ results for the AR system. The UEQ does not produce an overall score for the user experience. The scale of an item ranges from −3 (horribly bad) to +3 (extremely good). The result values between −0.8 and 0.8 represent a neutral evaluation of the corresponding scale, with values over 0.8 describing a positive evaluation, and values under −0.8 describing a negative evaluation. In that respect, the satisfaction level of the user experience of the AR system was positively evaluated in each category. It received the highest evaluation in terms of novelty (M = 1.75) and the lowest evaluation in efficiency (M = 0.98). The UEQ scales can be grouped into pragmatic quality (perspicuity, efficiency, and dependability) and hedonic quality (stimulation and originality). Pragmatic quality describes task-related quality aspects, while hedonic quality describes non-task-related quality aspects. The mean of the pragmatic quality aspects was 1.11, and the mean of hedonic quality aspects was 1.73. The Cronbach-Alpha coefficients in Table 6 measure the consistency of a scale from the UEQ survey. Though there are no clear rules describing how big the Alpha coefficient should be, values larger than 0.6 or 0.7 are considered sufficient. According to the data collected, these responses had sufficient scale consistency.
5. Discussion
From the response of the participants, the application of the AR system is still a novel experience, and the new AR system has not been investigated as a visualization tool for design review from an end-user’s perspective. In this regard, the findings of this research can facilitate the use of the AR system for design review by validating that the AR-based design information can improve the end-user’s level of awareness to building information, and will improve the user’s experience for design review tasks. The results show the possibility of adopting an AR or VR system for different aesthetic factors in design review. The details of the notable findings are analyzed in the following sections, and these discussions can provide guidance for choosing an appropriate visualization platform that allows end-users to have effective building information experience for design review.
5.1. AR for Design Review
Color and texture were reviewed better in AR and VR compared to a 2D screen. As shown in the data, the enriched naturalness of the model affects the checking of the color and texture. This is meaningful, as both VR and AR systems have the potential to be used for reviewing aesthetic aspects. Specifically, an AR system could be used to examine texture, while a VR system is better for reviewing color. Building element texture is seen better via an AR system designed to recognize texture. That said, the VR participants felt that it was unsuitable to review the texture of a model in VR since the image is only clear when viewed from directly in front. Although the vivid color of the model in the VR system allows reviewers to focus more on color, the semi-transparent model in the AR system allows for a more comfortable environment in which to concentrate on the texture.
AR has another potential for review fenestration (window and doors), especially the space through open fenestrations. Recognizing the size and position of fenestrations through an AR system is easy since it provides greater space perception with the surrounding real environment. On the other hand, assessing the suitability of spacing, size, and position is better done using the 2D screen method as it requires less mental discomfort. This could have been affected by the functional limitations of the AR system used in this research. The model was unable to rotate or zoom, and to review, users were only able to walk around the model in the AR system. Thus, the limited functional settings were inefficient to review overall spacing, size, and position of fenestration, which could be quickly done by rotating the model in the 2D screen system. In this experiment, there was no interaction between the information in the real space and the augmented information by using an AR device in a space where no other objects exist. This setting did not take advantage of the link between real and virtual information of the AR technology. If the AR system projects the tailored building object information (fenestration) into the real building, the user can experience the three-dimensional volume and size of the building object in an immersive way.
5.2. Technical Acceptance
The results of the technical acceptance questionnaire reveal that the AR system was deemed the most comfortable visualization platform to conduct the design review. The user was only required to wear the device and walk around to review the virtual building design. AR system users felt that the technology was useful, easy, satisfactory, and that they would have high intention to use it in the future. However, for long-term use, the physical discomfort users felt this needs to be resolved. Although the technology acceptance level was higher than the 2D screen, the VR and AR systems had a visually induced motion sickness (VIMS) side effect [45]. All VR participants and some AR participants experienced motion sickness when wearing the HMD. Based on the participants’ comments, motion sickness increased with the amount and speed of head movements. There have been several attempts to reduce VIMS. Participants who were exposed to pleasant music or scents reported feeling less sick [45,46]. Reducing the wear time of the HMD has also been suggested as a potential remedy [47]. As such, priority must be given to improve the technology in order to mitigate VIMS and facilitate end-user involvement in design collaboration.
5.3. User Experience
The results of the UEQ indicate that respondents may not be satisfied with the product, i.e., the speed, efficiency, and functionality of the HoloLens. The relatively low task-related pragmatic quality of the AR device was a limitation that affected the user experience. Since it was the first time most students had used an AR application, it is understandable that they might have found using the HoloLens challenging, such as with the hand gestures required to control the device. Furthermore, due to the limited interaction capabilities of the HoloLens, students did not feel in control of the interaction. Therefore, end-users unfamiliar with AR devices might consider them inefficient and not fast enough to solve the required task when compared to conventional methods. On the other hand, the high hedonic quality score indicates that respondents enjoyed using the HoloLens, and that they felt it was innovative and interesting. Participants thought that the AR application improved interaction by giving an “unprecedented” view for users. Not only does the novel experience enable the user to be more actively involved in the design collaboration, it also better facilitates end-user requirements and feedback.
6. Conclusions
The goal of this study was to analyze the technical quality and acceptability of an AR system for architectural design review from the end-user’s perspective. To achieve this, the quality of visual presentation and technology acceptance level was measured and compared with VR and 2D screen systems. The user experience of the AR system was also evaluated through a UEQ questionnaire. The results indicate that an AR system could be beneficial in reviewing the visual components of building elements, including color, texture, and fenestration. The technical acceptance level results further strengthen the effectiveness of an AR system for design review. AR received the highest technology acceptance level, albeit with physical discomfort to the user, while VR had a better technology acceptance level compared to the 2D screen system, except for user satisfaction and mental comfort. In light of this, the physical discomfort of the AR system and the mental discomfort of the VR system needs to be reduced or solved for effective adoption in the AEC field in the future. Lastly, the results of the UEQ survey show that most respondents found using the AR application to be innovative and creative. While there are still some features that need to be improved in terms of functionality, the novel experiences provided by the AR system made a pleasant user experience.
Since this research focused on the feasibility of using an AR system for design review focusing on non-professional perspectives, the targets, and tasks of reviewing building design are relatively simple compared to the detailed design review activities within professionals. Therefore, to implement the findings of this study to design collaboration with experts, it is necessary to validate the applicability and efficiency of the AR-based visualization platform for more complex design review tasks. It is anticipated that model-based design collaboration will be embraced by the construction industry as sharing virtual information is getting easier. It is also expected that by overcoming the technological limitations, the use of AR devices for end-users can be encouraged and promoted. In this regard, the findings of this study contribute to guiding practical usage of AR systems for end-user-involved architectural design review.
Author Contributions
Conceptualization, J.S. and J.G.L.; methodology, A.A. and M.C.; writing—original draft preparation, J.G.L. and M.C.; writing—review and editing, J.S. and J.G.L.; project administration, J.S. All authors have read and agreed to the published version of the manuscript.
Funding
This research study was supported by the Early Career Scheme (PolyU 25210917) from Research Grants Council, Hong Kong.
Conflicts of Interest
The authors declare no conflict of interest.
References
- Singh, V.; Gu, N.; Wang, X. A theoretical framework of a BIM-based multi-disciplinary collaboration platform. Autom. Constr. 2011, 20, 134–144. [Google Scholar] [CrossRef]
- East, E.W.; Kirby, J.G.; Perez, G. Improved Design Review through Web Collaboration. J. Manag. Eng. 2004, 20, 51–55. [Google Scholar] [CrossRef]
- Mohammadpour, A.; Karan, E.; Asadi, S.; Rothrock, L. Measuring End-User Satisfaction in the Design of Building Projects Using Eye-Tracking Technology. In Proceedings of the Computing in Civil Engineering 2015, Austin, TX, USA, 21–23 June 2015; pp. 564–571. [Google Scholar]
- Lee, N.; Kim, Y. A Conceptual Framework for Effective Communication in Construction Management: Information Processing and Visual Communication. In Proceedings of the Construction Research Congress 2018, New Orleans, LA, USA, 2–4 April 2018; pp. 531–541. [Google Scholar]
- Jin, H.; Kim, M. Architectural VR Realization Using Game Engine. 2015. Available online: https://pdfs.semanticscholar.org/5253/2be52799cc92c795ee10c9503f92eb0053f2.pdf (accessed on 3 August 2020).
- Shiratuddin, M.F.; Thabet, W. Utilizing a 3D Game Engine to Develop a Virtual Design Review System. Electron. J. Inf. Technol. Constr. 2011, 16, 39–68. [Google Scholar]
- Wang, J.; Wang, X.; Shou, W.; Xu, B. Integrating BIM and augmented reality for interactive architectural visualisation. Constr. Innov. 2014, 14, 453–476. [Google Scholar] [CrossRef]
- Whiskard, H.; Jones, D.; Voller, S.; Snider, C.; Gopsill, J.; Hicks, B. Mixed Reality Tools as an Enabler for Improving Operation and Maintenance in Small and Medium Enterprises. In Product Lifecycle Management to Support Industry 4.0, Turin, Italy, 2–4 July 2018; Chiabert, P., Bouras, A., Noël, F., Ríos, J., Eds.; Springer International Publishing: Cham, Switzerland, 2018. [Google Scholar]
- Van Krevelen, D.W.F.; Poelman, R. A Survey of Augmented Reality Technologies, Applications and Limitations. IJVR 2010, 9, 1–20. [Google Scholar] [CrossRef] [Green Version]
- Heydarian, A.; Carneiro, J.P.; Gerber, D.; Becerik-Gerber, B.; Hayes, T.; Wood, W. Immersive virtual environments versus physical built environments: A benchmarking study for building design and user-built environment explorations. Autom. Constr. 2015, 54, 116–126. [Google Scholar] [CrossRef]
- Spillinger, R.S. Adding Value to the Facility Acquisition Process: Best Practices for Reviewing Facility Designs; Federal Facilities Council Technical Report; National Academy Press: Washington, DC, USA, 2000; ISBN 9780309068949. [Google Scholar]
- Soibelman, L.; Liu, L.Y.; Kirby, J.G.; East, E.W.; Caldas, C.H.; Lin, K.-Y. Design Review Checking System with Corporate Lessons Learned. J. Constr. Eng. Manag. 2003, 129, 475–484. [Google Scholar] [CrossRef]
- Dunston, P.S.; Arns, L.L.; Mcglothlin, J.D.; Lasker, G.C.; Kushner, A.G. An Immersive Virtual Reality Mock-Up for Design Review of Hospital Patient Rooms. In Collaborative Design in Virtual Environments; Intelligent Systems, Control and Automation: Science and Engineering; Wang, X., Tsai, J.J.-H., Eds.; Springer: Dordrecht, The Netherlands, 2011; pp. 167–176. ISBN 9789400706057. [Google Scholar]
- Pemsel, S.; Widén, K.; Hansson, B. Managing the needs of end-users in the design and delivery of construction projects. Facilities 2010, 28, 17–30. [Google Scholar] [CrossRef] [Green Version]
- Varun, K.; Zhengbo, Z.; Burcu, A.; Justin, R. Evaluation and Comparison of Different Virtual Reality Environments towards Supporting Tasks Done on a Virtual Construction Site. Constr. Res. Congr. 2016, 2371–2381. [Google Scholar] [CrossRef]
- Kress, B.C.; Cummings, W.J. 11-1: Invited Paper: Towards the Ultimate Mixed Reality Experience: HoloLens Display Architecture Choices. SID Symp. Dig. Tech. Pap. 2017, 48, 127–131. [Google Scholar] [CrossRef]
- Steuer, J. Defining Virtual Reality: Dimensions Determining Telepresence. J. Commun. 1992, 42, 73–93. [Google Scholar] [CrossRef]
- Kinateder, M.; Ronchi, E.; Nilsson, D.; Kobes, M.; Müller, M.; Pauli, P.; Mühlberger, A. Virtual reality for fire evacuation research. In Proceedings of the 2014 Federated Conference on Computer Science and Information Systems, Warsaw, Poland, 7–10 September 2014; pp. 313–321. [Google Scholar]
- Aromaa, S.; Väänänen, K. Suitability of virtual prototypes to support human factors/ergonomics evaluation during the design. Appl. Ergon. 2016, 56, 11–18. [Google Scholar] [CrossRef] [PubMed]
- Milgram, P.; Takemura, H.; Utsumi, A.; Kishino, F. Augmented reality: A class of displays on the reality-virtuality continuum. In Proceedings of the Telemanipulator and Telepresence Technologies, Boston, MA, USA, 31 October–1 November 1994; International Society for Optics and Photonics: Bellingham, WA, USA, 1995; Volume 2351, pp. 282–292. [Google Scholar]
- Pan, Z.; Cheok, A.D.; Yang, H.; Zhu, J.; Shi, J. Virtual reality and mixed reality for virtual learning environments. Comput. Graph. 2006, 30, 20–28. [Google Scholar] [CrossRef]
- Lei, H.; Xiangyu, W.; Leonhard, B.; Love Peter, E.D. Using Animated Augmented Reality to Cognitively Guide Assembly. J. Comput. Civ. Eng. 2013, 27, 439–451. [Google Scholar] [CrossRef]
- Li, X.; Yi, W.; Chi, H.-L.; Wang, X.; Chan, A.P.C. A critical review of virtual and augmented reality (VR/AR) applications in construction safety. Autom. Constr. 2018, 86, 150–162. [Google Scholar] [CrossRef]
- Waly, A.F.; Thabet, W.Y. A Virtual Construction Environment for preconstruction planning. Autom. Constr. 2003, 12, 139–154. [Google Scholar] [CrossRef]
- Boyle, L.N.; Lee, J.D. Using driving simulators to assess driving safety. Accid. Anal. Prev. 2010, 42, 785–787. [Google Scholar] [CrossRef]
- Khalid, C.M.L.; Mohamed, Z.; Fathi, M.S.; Zakiyudin, M.Z.; Rawai, N.; Abedi, M. The Potential of Augmented Reality Technology for Pre-Construction. Available online: /AMM.405-408.3419 (accessed on 27 June 2020).
- Dünser, A.; Billinghurst, M. Evaluating Augmented Reality Systems. In Handbook of Augmented Reality; Furht, B., Ed.; Springer: New York, NY, USA, 2011; pp. 289–307. ISBN 9781461400646. [Google Scholar]
- Huang, K.-T.; Ball, C.; Francis, J.; Ratan, R.; Boumis, J.; Fordham, J. Augmented Versus Virtual Reality in Education: An Exploratory Study Examining Science Knowledge Retention When Using Augmented Reality/Virtual Reality Mobile Applications. Cyberpsychol. Behav. Soc. Netw. 2019, 22, 105–110. [Google Scholar] [CrossRef]
- Kivrak, S.; Arslan, G.; Tuncan, M. Implementing Augmented Reality in Construction Projects. Available online: /AMM.719-720.197 (accessed on 27 June 2020).
- JeongWook, S.; Ken-Yu, L.; Rojas Eddy, M. Developing and Testing a 3D Video Game for Construction Safety Education. Comput. Civ. Eng. 2011, 867–874. [Google Scholar] [CrossRef]
- Sneha, B.; Behzad, E. State-of-the-Art Review of Virtual Reality Environment Applications in Construction Safety. AEI 2015, 457–468. [Google Scholar] [CrossRef]
- Jun, Z.; Issa Raja, R.A. Collecting Fire Evacuation Performance Data Using BIM-Based Immersive Serious Games for Performance-Based Fire Safety Design. Comput. Civ. Eng. 2015, 612–619. [Google Scholar] [CrossRef]
- Broll, W.; Lindt, I.; Ohlenburg, J.; Wittkämper, M.; Yuan, C.; Novotny, T.; Fatah gen Schieck, A.; Mottram, C.; Strothmann, A. ARTHUR: A Collaborative Augmented Environment for Architectural Design and Urban Planning. JVRB 2004, 1. [Google Scholar] [CrossRef]
- Tonn, C.D. Simulating the Atmosphere of Spaces. In Proceedings of the Predicting the Future 25th eCAADe Conference, Frankfurt am Main, Germany, 26–29 September 2007. [Google Scholar]
- Wang, X.; Dunston, P.S. Compatibility issues in Augmented Reality systems for AEC: An experimental prototype study. Autom. Constr. 2006, 15, 314–326. [Google Scholar] [CrossRef]
- Edwards, G.; Li, H.; Wang, B. BIM based collaborative and interactive design process using computer game engine for general end-users. Vis. Eng. 2015, 3, 4. [Google Scholar] [CrossRef] [Green Version]
- Sutcliffe, A.; Gault, B. Heuristic evaluation of virtual reality applications. Interact Comput. 2004, 16, 831–849. [Google Scholar] [CrossRef]
- Tang, A.; Owen, C.; Biocca, F.; Mou, W. Comparative effectiveness of augmented reality in object assembly. In Proceedings of the SIGCHI Conference on Human Factors in Computing Systems, Ft. Lauderdale, FL, USA, 5–10 April 2003; Association for Computing Machinery: New York, NY, USA, 2003; pp. 73–80. [Google Scholar]
- Kushniruk, A.W.; Patel, V.L. Cognitive and usability engineering methods for the evaluation of clinical information systems. J. Biomed. Inform. 2004, 37, 56–76. [Google Scholar] [CrossRef] [Green Version]
- Davis, F.D. Perceived Usefulness, Perceived Ease of Use, and User Acceptance of Information Technology. MIS Q. 1989, 13, 319–340. [Google Scholar] [CrossRef] [Green Version]
- Hart, S.G.; Staveland, L.E. Development of NASA-TLX (Task Load Index): Results of Empirical and Theoretical Research. In Advances in Psychology; Hancock, P.A., Meshkati, N., Eds.; Human Mental Workload: North-Holland, The Netherlands, 1988; Volume 52, pp. 139–183. [Google Scholar]
- Abu-Dalbouh, A. Questionnaire approach based on the technology acceptance model for mobile tracking on patient progress applications. J. Comput. Sci. 2013, 9, 763–770. [Google Scholar] [CrossRef] [Green Version]
- Venkatesh, V.; Davis, F.D. A Theoretical Extension of the Technology Acceptance Model: Four Longitudinal Field Studies. Manag. Sci. 2000, 46, 186–204. [Google Scholar] [CrossRef] [Green Version]
- Schrepp, M.; Hinderks, A.; Thomaschewski, J. Applying the User Experience Questionnaire (UEQ) in Different Evaluation Scenarios. In Design, User Experience, and Usability. Theories, Methods, and Tools for Designing the User Experience, Proceedings of the Third International Conference, DUXU 2014, Held as Part of HCI International 2014, Heraklion, Crete, Greece, 22–27 June 2014; Marcus, A., Ed.; Springer International Publishing: Cham, Switzerland, 2014; pp. 383–392. [Google Scholar]
- Keshavarz, B.; Stelzmann, D.; Paillard, A.; Hecht, H. Visually induced motion sickness can be alleviated by pleasant odors. Exp. Brain Res. 2015, 233, 1353–1364. [Google Scholar] [CrossRef]
- Sang, F.D.Y.P.; Billar, J.P.; Golding, J.F.; Gresty, M.A. Behavioral Methods of Alleviating Motion Sickness: Effectiveness of Controlled Breathing and a Music Audiotape. J. Travel Med. 2006, 10, 108–111. [Google Scholar] [CrossRef] [PubMed]
- Sharples, S.; Cobb, S.; Moody, A.; Wilson, J.R. Virtual reality induced symptoms and effects (VRISE): Comparison of head mounted display (HMD), desktop and projection display systems. Displays 2008, 29, 58–69. [Google Scholar] [CrossRef]
Figure 1.
3D BIM model for design review.

Figure 2.
Interior view of the 3D BIM model.

Figure 3.
Display platform for each subject group.

Figure 4.
Quality of visual presentation with the 2D screen, VR, and AR.

Figure 5.
User acceptability with the 2D screen, VR, and AR.


Table 1.
Questionnaire category and item for quality of visual presentation.
| Category | Item |
|---|---|
| Color | Is the color of the material easy to recognize? |
| Is the color of the material realistic and vivid? | |
| Are you satisfied with the presentation quality of the color? | |
| Texture | Is the texture of the material easy to recognize? |
| Is the texture of the material realistic? | |
| Are you satisfied with the presentation quality of the texture? | |
| Size/Location | Is the size of a specific element (e.g., window/door) easy to recognize? |
| Is the position of a specific element (e.g., window/door) easy to recognize? | |
| Naturalness | Overall, rate the naturalness of the environment to conduct a design review |
| Scale | Is it easy to review the suitability of the height of the area? |
| Are you satisfied with the space (area/volume) of the building? |
Table 2.
Questionnaire categories and items for user acceptability.
| Category | Item |
|---|---|
| Physical Comfort | The design review task using the system was physically demanding in a 2D screen, and VR and AR environment |
| Mental Comfort | The design review task using the system was mentally demanding in a 2D screen, and VR and AR environment |
| Perceived Usefulness | Using the system improved my design review performance |
| Using the system for design review increased my productivity | |
| I found the system to be useful for design review | |
| Using the system enhanced my effectiveness in design review | |
| Perceived Ease of Use | Learning to perform the design review in the system was easy |
| Interacting with the system did not require a lot of mental effort | |
| It would be easy for me to become skillful at using the system for design review | |
| I found it easy to get the system to do what I wanted it to do | |
| User Satisfaction | I am completely satisfied with using a 2D screen, and a VR and AR system for design review |
| I feel very confident using a 2D screen, and a VR and AR system for design review | |
| I believe using a 2D screen, and a VR and AR system will increase the quality of the construction industry | |
| Behavioral Intention | Assuming I have access to the system, I intend to use it |
Table 3.
Questionnaire categories and definitions (and items) for user experience.
| Category | Definition (and Items) |
|---|---|
| Attractiveness | Overall impression of the product. Is it attractive, enjoyable, or pleasing? (Six items: annoying/enjoyable; good/bad; unlikable/pleasing; unpleasant/pleasant; attractive/unattractive; friendly/unfriendly) |
| Perspicuity | Is it easy to become familiar with the product? Is it easy to understand how to use the product?(Four items: not understandable/understandable, easy to learn/difficult to learn; complicated/easy; clear/confusing) |
| Efficiency | Can users solve tasks without unnecessary effort? Is interaction efficient and fast?(Four items: fast/slow; inefficient/efficient; impractical/practical; organized/cluttered) |
| Dependability | Does the user feel in control of the interaction? (Four items: unpredictable/predictable; obstructive/supportive; secure/not secure; meets expectations/does not meet expectations) |
| Stimulation | Is it exciting and motivating to use? (Four items: valuable/inferior; boring/exciting; not interesting/interesting; motivating/demotivating) |
| Novelty | Novelty: Is the product innovative and creative? Does the product capture the interest of users? (Four items: creative/dull; inventive/conventional; usual/cutting-edge; conservative/innovative) |
Table 4.
Visual presentation quality.
| 2D Screen | VR | AR | |
|---|---|---|---|
| Color | 3.73 (0.74) | 4.27 (0.78) | 4.20 (0.92) |
| Texture | 3.50 (0.90) | 3.83 (0.87) | 4.17 (0.91) |
| Size/Location | 4.27 (0.64) | 4.20 (0.66) | 4.63 (0.72) |
| Naturalness | 3.50 (0.97) | 3.80 (1.03) | 4.20 (0.63) |
| Scale | 3.85 (0.81) | 3.60 (1.10) | 3.70 (0.96) |
Note: Mean (standard deviation).
Table 5.
User acceptability.
| 2D Screen | VR | AR | |
|---|---|---|---|
| Physical Comfort | 2.10 (0.74) | 2.20 (1.03) | 2.40 (0.97) |
| Mental Comfort | 2.20 (0.92) | 3.30 (1.16) | 2.00 (0.67) |
| Perceived Usefulness | 4.08 (0.66) | 4.13 (1.11) | 4.30 (0.88) |
| Perceived Ease of Use | 3.38 (1.00) | 3.63 (1.15) | 4.28 (0.88) |
| User Satisfaction | 3.97 (0.72) | 3.90 (0.92) | 4.43 (0.77) |
| Behavioral Intention | 3.90 (0.86) | 4.00 (1.15) | 4.60 (0.52) |
Note: Mean (standard deviation).
Table 6.
User experience using AR.
| Group | Category | Mean (Standard Deviation) | Cronbach-Alpha |
|---|---|---|---|
| Attractiveness | Attractiveness | 1.56 (0.74) | 0.86 |
| Pragmatic Quality | Perspicuity | 1.20 (0.90) | 0.79 |
| Efficiency | 0.98 (0.86) | 0.82 | |
| Dependability | 1.13 (0.99) | 0.89 | |
| Hedonic Quality | Stimulation | 1.70 (0.75) | 0.85 |
| Novelty | 1.75 (0.89) | 0.90 |
© 2020 by the authors. Licensee MDPI, Basel, Switzerland. This article is an open access article distributed under the terms and conditions of the Creative Commons Attribution (CC BY) license (http://creativecommons.org/licenses/by/4.0/).
Share and Cite
MDPI and ACS Style
Lee, J.G.; Seo, J.; Abbas, A.; Choi, M. End-Users’ Augmented Reality Utilization for Architectural Design Review. Appl. Sci. 2020, 10, 5363. https://0-doi-org.brum.beds.ac.uk/10.3390/app10155363
AMA Style
Lee JG, Seo J, Abbas A, Choi M. End-Users’ Augmented Reality Utilization for Architectural Design Review. Applied Sciences. 2020; 10(15):5363. https://0-doi-org.brum.beds.ac.uk/10.3390/app10155363
Chicago/Turabian StyleLee, Jin Gang, JoonOh Seo, Ali Abbas, and Minji Choi. 2020. "End-Users’ Augmented Reality Utilization for Architectural Design Review" Applied Sciences 10, no. 15: 5363. https://0-doi-org.brum.beds.ac.uk/10.3390/app10155363
Note that from the first issue of 2016, this journal uses article numbers instead of page numbers. See further details here.