Rocking Blocks Stability under Critical Pulses from Near-Fault Earthquakes Using a Novel Energy Based Approach


Department of Civil Engineering, Lebanese American University, Byblos 1102 2801, Lebanon
*
Author to whom correspondence should be addressed.
Appl. Sci. 2020, 10(17), 5924; https://0-doi-org.brum.beds.ac.uk/10.3390/app10175924
Submission received: 29 April 2020
/
Revised: 29 July 2020
/
Accepted: 3 August 2020
/
Published: 27 August 2020
(This article belongs to the Special Issue Effects of Near-Fault Ground Motions on Civil Infrastructure)
Abstract
:Featured Application
A novel energy based approach is derived from basic physical principles to assess the stability of rocking blocks and inverted pendulum structures subjected to single pulses of various shapes. The Discrete Element Method is used to numerically verify the theoretical results. The normalized stability chart can be used to identify the critical pulses from near-fault earthquakes and study the stability of various objects prone to overturning once the corresponding intensity measures are derived. The proposed approach offers a robust lower bound for the body of work published in the acceleration–frequency spectrum. The results can also be used to characterize the critical acceleration–period content of historical earthquakes based on archaeoseismological evidence.
Abstract
Following the seminal work of Housner, a novel energy based critical pulse theoretical model is derived to assess the seismic stability of rocking rigid blocks under single pulses from near-fault earthquakes. It is shown that overturning is conditional on the availability of sufficient kinetic energy in the exciting pulse and on the inception of rocking. The theoretical model is shown to be in good agreement with discrete element method numerical simulations for similar blocks of sizes 0.5, 1, and 20 m. Similitude rules are established to scale between block sizes and pulse types and tested successfully. The results agree with available experimental data. The proposed stability chart approach provides a practical and simple alternative to the presentation and study of the stability and overturning of blocks published by others in the frequency spectrum domain. For any given rigid block or inverted pendulum structure the model or normalized stability charts provide a method to determine the characteristic period and peak acceleration required for overturning and by extension to identify the critical content of the dominant pulse of a given earthquake signal. Alternatively, the approach could be used in archaeoseismology to identify the characteristics of the dominant pulse content of past earthquakes based on their impacts on various historical and heritage structures.
1. Introduction
The problem of predicting the overturning of block structures under earthquake excitations has received continued attention over the years as it may respond to two intriguing questions of interest to seismologists, archaeoseismologists, and engineers: (i) what are the physical conditions and earthquake excitation properties that may cause a rigid block structure to overturn? And (ii) given that some rocks, columns, tombstones and other man-made artefacts are reported to have overturned in the aftermath of earthquakes while others of different dimensions did not overturn, what information can be deduced from these observations about the intensity and properties of the seismic signal?
Near-fault ground motions are characterized by single long duration strong pulses which make them particularly destructive to some structures, such as inverted pendulum structures, due to the high velocities that are imparted to above ground masses. This has prodded Housner [1] to investigate the overturning potential of a near-fault earthquake on a rocking block. The equations he derived for block rocking under a half sine pulse have been adopted by the majority of researchers in the field over the last 40 years. Various numerical solutions as well as closed form solutions that depend on the shape of the adopted pulse were proposed. Many shapes and refinements were developed to represent the dominant pulse of near-earthquake ground motions to be used in lieu of the full earthquake signal when investigating the overturning stability of blocks. Experimental programs were carried out to identify which intensity measures correlate better with overturning outcomes of blocks and columns subjected to various pulse types and full earthquake signals. Robust predictive models have not, however, been obtained. In the following paragraphs, previous research relevant to the problem is reviewed along four converging avenues: (i) theoretical and numerical investigations of the stability of rocking blocks, (ii) experimental investigations, (iii) representations of near-fault earthquakes by their dominant impulses, and (iv) archaeoseismological relevance of the rocking block problem and the need for efficient scalar intensity measures is identified.
1.1. Theoretical and Numerical Investigations of Rocking Blocks Stability
Rigid block structures such as free-standing tall slender pillars, monuments, columns, tombstones, and statues, precariously balanced rocks, as well as other man made inverted pendulum structures and artefacts such as power transformers, elevated water tanks, various equipment and large cabinets exhibit a characteristic rocking motion under pulse-like seismic excitations resulting sometimes in overturning [1]. The response of rigid block structures to earthquakes has been a subject of study since the early work of Mallet [2], Milne and Omori [3], and Kirkpatrick [4]. They proposed that the overturning or survival of monuments and tombstones could be used as forensic evidence of the strength and characteristics of a historical seismic event. Housner [1] analyzed the dynamics of a rigid block that is resting upon a rigid, horizontal base which is excited into rocking motion and derived a first complete set of equations of motion shedding light on what he described as an “anomalous behavior” showing the particular vibrational characteristics of such rigid block structures in contrast to the traditional deformable structure approach. His derivation adopted a single half sine rocking pulse to represent the effect of near-fault ground-motions. It identified some of the necessary conditions for rocking and set conditions for overturning based on the properties of the pulse and the simplifying assumptions of the derivation as to the time of reaching the unstable position. This subject has received increasing attention during the last decades with the development of earthquake engineering and the growing computational capabilities available to researchers. Early contributions by Yim and et al. [5,6] and Ishiyama [7] proposed numerical solutions, Spanos and Koh [8] were the first to numerically establish “stability diagrams” for the safe–unsafe boundaries of rigid block response to harmonic horizontal accelerations, whereas, Tso and Wong [9,10] combined numerical with experimental work. Hogan [11] explored the complicated dynamics of the problem showing mathematically that the response could ultimately produce a chaotic response. Shenton et al. [12,13,14] established criteria for the initiation of slide, rock, and slide-rock rigid-body modes. Improvements and corrections to the original Housner derivation were proposed by Shi et al. [15], Makris and Roussos [16], and Zhang and Makris [17]. Theoretical extensions and closed form solutions were proposed by others including Dimitrakopoulos and DeJong [18], Voyagaki et al. [19], Dimitrakopoulos and Fung [20], Nabeshima et al. [21], Ther and Kollar [22], and Giouvanidis and Dimitrakopoulos [23].
1.2. Experimental and Empirical Investigations of Rocking Blocks Stability
Following the early experimentations by Milne and Omori [3] and Kirkpatrick [4] many experimental programs were carried out in order to investigate the stability of rocking blocks with the objective of being able to predict their response and the associated overturning risks. Aslam et al. [24] carried one of the first analytical and experimental studies of the earthquake induced rocking and overturning response of rigid blocks to establish safe design criteria for radiation shielding systems under strong motion earthquakes. Lipscombe and Pellegrino [25] investigated experimentally and theoretically the free rocking of prismatic blocks and Manos and Demosthenous [26] reported on the response to sinusoidal shaking table base movements of reduced scale columns. Lourenço et al. [27,28,29] contributed various theoretical and analytic formulations. They carried experimental investigations where they noted the high variability of the results and sensitivity to initial conditions which prevented them from establishing a predictive relationship between the theory and the data [29,30]. Following the approach of Yim et al. [5], Purvance et al. [31] proposed a probabilistic fragility numerical approach based on linear regression against various strong motion intensity measures that were then experimentally corroborated. Kostantinidis and Makris [32] reported on a comprehensive experimental program on the seismic response of full scale freestanding laboratory equipment summarizing the results in the form of fragility curves based on a physically based specifically derived intensity measure. Kafle et al. [33] carried out an extensive experimental program on the response of rigid blocks to seven earthquake time histories successfully using the peak displacement demand as the main intensity measure. Earthquake scenarios were generated by stochastic simulations and used to establish fragility curves that were then compared to the experimental results. Baratta et al. [34] investigated rocking blocks numerically and experimentally reporting on the difficulty in achieving reliable forecasts of the rocking response given all the experimental variables that can affect the results. They recommended the development of a “worst scenario” or lower bound approach in order to effectively determine the stability under seismic events.
Saraswat et al. [35] found that the response of a rocking block depends not only on the amplitude of base excitation, coefficient of friction and aspect ratio, but also on the base excitation frequency. Following the approach of Shenton [12,13,14], they established the various regions corresponding to sliding, rocking, slide–rock, and rest and determined the presence of a region of no motion above a threshold frequency value for any given combination of parameters. Similarly, Gesualdo et al. [36] investigated theoretically and experimentally the interaction between rocking and sliding and the cut-off between them.
Arredondo et al. [37] and Al Abadi et al. [38] have studied experimentally and numerically irregular free-standing rigid bodies subject to earthquake motion.
Di Sarno et al. [39] carried out an extensive experimental investigation of the seismic performance of hospital building equipment reporting that the best intensity measures to develop fragility curves were the peak floor acceleration and peak floor velocity. Manzo and Vassiliou [40] have proposed the use of displacement demand as the control intensity measure for the design against overturning.
1.3. Representation of the Dominant Pulse of Near-Fault Earthquakes
Earthquakes can have devastating effects on the urban infrastructure of large metropolitan centers in the vicinity of faults such as in California, Japan, Italy, and Turkey [41,42,43,44]. The study of near-fault seismic ground motions and their effects on the performance of engineering structures has been an active research topic for both seismologists and earthquake engineers for the past two decades starting with the works of Hall et al. [45] and Somerville et al. [46]. Near-fault ground-motion records exhibit a simple impulsive form with strong single pulses generated by shear dislocation and crack-type ruptures. Ground motions with fling-step characteristics contain a one-sided dominant velocity pulse resulting in a monotonic step in the displacement time-history, whereas, ground motions with forward-directivity characteristics contain a two-sided dominant velocity pulse [47]. Somerville et al. [46,48,49] have worked on relating the period of the dominant pulse to the magnitude of the earthquake. Chen et al. [50] and Hough et al. [51] have described the cascading and pulse-like ruptures during a recent series of earthquakes. Sasani and Bertero [52] have reviewed the effects of severe pulse-like ground motions in performance based engineering. Hall et al. [45], Alavi and Krawinkler [53], Kalkan and Kunnath [47], and Mollaioli et al. [54] have investigated the effects of near-fault ground motions on the response of various building structures showing the particular sensitivity of long period structures.
In order to analyze the effect of near-fault earthquakes on structures the input horizontal ground motion is commonly represented by one or more single pulse in the shape of a simple square, triangular, or sinusoidal waveform [55,56]. Idealized half or full cycle sinusoidal pulses were suggested by Makris and Roussos [16]. Sasani and Bertero [52] and Kalkan and Kunnath [47] proposed the use of one-cycle and 1.5-cycle sinusoidal waves. Kojima et al. [21,57] have simulated the main portion of the pulse-like ground motions using double and triple sinusoidal impulses. Arroyo and Ordaz [58] used a corrected sinusoidal pulse for a better representation. Zhang et al. [59] used an empirical mode decomposition method to extract high frequency acceleration pulses representing them with simple sinusoidal approximations.
To improve on simplified waveforms Mavroeidis and Papageorgiou [60] proposed to use modified Gabor wavelets to represent the dominant impulse of near-fault ground motions. Baker [61] and Shahi and Baker [62] also used wavelet analysis to extract the largest velocity pulse from a given ground motion. Makris and Vassiliou [63] used sine, symmetrical Ricker and Asymmetrical Ricker pulses and Yamamoto et al. [64] used a mix of Fourier and wavelet analysis to extract dominant pulses.
1.4. Archaeoseimological Relevance
In addition to the dangerous effects they can have on rocking prone structures and equipment [32,39,65], earthquakes are among the most important causes of the destruction of archeological and historical sites and present the largest risk that conservation efforts have to address for large masonry structures, most emblematic of which are obelisks [66], colonnades, and statues [67,68]. The study of the damage, structural disorder and collapse patterns caused by historically recorded earthquakes [69,70] can inform strengthening and conservation efforts as well as provide estimates of the intensity and nature of these past archaeoseismic [69,71,72,73] and paleoseismic [74] events.
1.5. The Need for Efficient Scalar Intensity Measures
In a recent review of the state of the art, Casapulla et al. [75] highlighted the lack of robust methods to predict the rocking response and the need to use combinations of intensity measures such as peak ground acceleration, PGA, peak ground velocity, PGV, and their ratio PGV/PGA. Based on the above literature review, and in agreement with Casapulla et al. [75] it appears that there is a need to establish a simple pulse based model that can be used to determine the stability of rigid block structures under near-fault ground motions without resorting to numerical simulations or complex mathematical closed forms. The determination of scalar intensity measures that complement PGA also motivated the current effort in an attempt at linking experimental results with theoretical work on rocking blocks, while also contributing to archaeoseismology, paleoseismology, and the study of near-fault earthquakes. A simple approach that allows a rapid verification of the properties of the critical pulses causing overturning is proposed. The final objective of the authors is to develop a simple set of rules, combining earthquake intensity measures with object size and time related parameters, that could be used to predict the response type and stability of a rigid block subjected to strong ground motions without having to resort to implicit numerical solutions or full discrete element simulations. An energy based model is presented in the following paragraphs deriving a simple, yet robust, criterion that allows a quick classification of the response of a rigid block to a strong ground motion pulse. Numerical verification of the theoretical predictions is carried out as well as a comparison with some experimental results.
2. Theoretical Model
Based on the seminal works of Mallet [2], Milne and Omori [3], Kirkpatrick [4], Housner [1], Ishiyama [7], Shenton [14], Shi et al. [15], Makris and Roussos [16], Zhang and Makris [17], and noting more recent derivations and contributions [18,20,21,22] including the authors’ [76], the stability of a rigid rectangular block subjected to a single pulse can be determined using five parameters: (i) the size of the block, 2h, (ii) the shape factor or slenderness of the block, b/h, (iii) the amplitude of the pulse or maximum acceleration, a, (iv) the duration of the pulse, tp, and (v) the shape of the pulse. With reference to Figure 1 adopted from Housner [1]: the block height is 2 h, its width is 2 b, its mass is m, its weight is W = mg with g being the acceleration of gravity and its rotational moment of inertia is Io = (4/3) mR2; with R = √(h2 + b2). As the block rotates around its corner O, the block rotation, θ, increases from zero to a limit value at which the block overturns. The limit value of θ is the angle α = tan−1 (b/h). Values of (b/h) are relatively small for slender blocks and α ≈ b/h.
In order for rocking to start, the overturning moment due to the horizontal acceleration, MO = (ma)h, must exceed the restoring moment of the block, MR = (mg)b. Hence for inception of rocking it is necessary that MO ≥ MR or the horizontal acceleration caused by the applied pulse, a, exceeds at some point the minimum value of αg:
a ≥ αg.
Another necessary condition for rocking to take place is that no sliding takes place before inception of rocking and afterwards, i.e., the friction between the block and its base is sufficiently high to prevent sliding. In other terms, the coefficient of friction between the block and its base, μ, is such that a ≤ μ at all times.
In order to rotate around its edge until eventually reaching the limit position of stability beyond which overturning takes place, the rotational kinetic energy of the block must be equal or greater than the change in potential energy necessary to reach the unstable position at θ = α, i.e., Δ(kinetic energy) = Δ(potential energy) at the limit:
where is the rotational kinetic energy of the block and ω the angular velocity reached at the end of the pulse. Linear momentum is imparted to the block by the horizontal ground movement pulse. It is equal to mν with ν being the linear horizontal velocity reached at the end of the pulse. When the block rotates the linear momentum is transformed into angular momentum due to momentum conservation and we have:
By combining Equations (2) and (3) and eliminating ω we obtain:
or:
For small angles α, (1 − cosα) = α2/2 and cos2 α = 1, hence:
where p is the frequency parameter of the rocking block given by p2 = WR/Io, or p =
For any pulse:
where: tp = duration of pulse, ap = peak acceleration of the pulse, and β = fullness factor according to the above equation [19,22,68]. Therefore, the critical impulse curve or relationship is given by:
or:
and the point of intersection with the rocking limit, or the transition point: ap = αg, is at :
A normalized curve describing the Safe–Unsafe space for a pulse characterized by ap and tp is then given by: , where:
For the case of a half-sine pulse of period T = 2 tp, we have:
Therefore, and .
For the cases of step and linear pulses β is equal to 1 and 0.5, respectively. Similarly, β is equal to 2/3 for a parabolic pulse.
For a given periodic pulse, the intersection point between Equations (1) and (5) is given by:
where is the pulse duration at the intersection of the two curves and is the characteristic period of the block, or transition period, given by for the sinusoidal pulse.
The safe–unsafe boundary in the acceleration-pulse period as per Equations (1), (5), and (7) is plotted in Figure 2a showing that at low periods the relationship between maximum impulse acceleration and pulse period is hyperbolic as per Equation (5) and at larger periods the condition of Equation (1) dominates. The intersection or transition at the calculated critical normalized pulse period is also shown. Figure 2b shows the shape of the overturning half sine impulses for different periods.
The proposed approach allows for a simple determination of the unsafe domain boundary based on the identification of a critical pulse energy value that is a characteristic of the rocking block. Strong-motion earthquake accelerations may be thought of as a train of pulses and the identification of a critical pulse in the earthquake signal could help determine the overturning effect of that earthquake. This is of course a first order approximation as there may be pulses which are not critical but are sufficient to cause stable rocking opening up the possibility for kinetic energy build up over a period of time under a number of sub-critical pulses leading to overturning of the block. The conditions for these critical combinations require further refinement of the model. Previous theoretical and numerical works [5,6,8,16,17] have shown that there are various rocking response modes prior to overturning under a single pulse with or without impact. They have also shown that as the magnitude of the acceleration is increased for the same pulse frequency the rigid block may overturn in one mode at a given acceleration, undergo stable rocking at a greater acceleration then overturn again in another mode as the magnitude of the acceleration is further increased. Hence, there may be non-critical combinations of acceleration and period that fall inside the identified unsafe zone, the locus of these combinations is however limited and may be conservatively ignored given the first order approximation proposed in this work.
Equation (7) presents a dimensionless parametric formulation of the model that allows scaling between blocks of different dimensions to be established. The larger of two geometrically similar blocks would be more stable than the smaller block. For the same critical acceleration the 1/N reduced block would have a critical period 1/N0.5 smaller.
This similarity rule should be used in scaling up the experimental results to the full size columns as well as in scaling down recorded earthquakes signals before their application to small scale structural models [77].
3. Numerical Verification
Noting the complexity of the closed form mathematical solutions it is proposed to use a Distinct Element Model (DEM) to model numerically the rocking and overturning response of rigid blocks under regular pulses. A commercial 2D software, the Universal Distinct Element Code, UDEC [78], was selected to model the response of a rigid block to repeated regular pulses. The equations governing two-dimensional rocking response are nonlinear, differential equations that do not admit a closed form analytical solution unless the equations are linearized and the ground motion is idealized. Thus, the need for a numerical solution that adopts an incremental time marching scheme. This can be accomplished using a differential equation solver, or alternatively, can be accomplished using a DEM. The solution scheme is very different from one method to the other. While the equation solver would solve the differential equations of the problem directly, the DEM approach would solve the dynamic equations of motion about the centroids of the blocks using springs at contact points between rigid blocks to control the overlap or inter-block penetration. The time integration in UDEC uses the central difference scheme which is second-order accurate as first-order error terms vanish from the solution. This is an important characteristic that prevents long-term drift in a distinct element simulation. In addition, the scheme is explicit dynamic and does not require any corrective iterations or solution tolerances. Furthermore, the UDEC environment allows for: visualization of results and future work expansion to model multiple blocks subjected to real earthquakes ground motions such as in large historical masonry structures.
The proportions of the block adopted matched those of the roman columns found in the temple of Jupiter in Baalbek, Lebanon with α = b/h = 0.11. Three sizes of block were numerically modeled of heights 0.5, 1, and 20 m corresponding to available shaking table models for the 0.5 and 1 m [79] and the full size of the column at 20 m. Damping was neglected on the basis that the strong ground motion pulse of a near-fault earthquake signal, which is the cause for the loss of stability and overturning of the structure, is not affected by the actual value of the damping coefficient. Damping may have to be considered when energy is dissipated in the free vibrations of the structure going to rest. For simplicity, the damping coefficient was set equal to zero considering that the numerical analysis presented is focused on identifying the stability threshold at which overturning takes place during strong shaking [80].
The UDEC code models contact between blocks through placing springs along the normal and shear directions at contact points. The contact forces generated by these springs are governed by stress–displacement constitutive relations that are a function of the relative displacements at the ends of each spring. The spring stiffness is an input parameter to the code that should be chosen judiciously: (1) it should be high enough to limit the amount of overlap between the contacting blocks to capture the actual conditions and (2) it should be low enough to obtain tractable execution times, knowing that the stable time increment is inversely proportional to square root of the stiffness. A schematic of the UDEC numerical model is shown in Figure 3a consisting of two rigid blocks: a base block where the ground motion is prescribed and another block that is resting on it. Contact forces between the blocks are determined using: a spring in the direction of contact normal with stiffness = Kn; a spring in the shear direction with stiffness = Ks; and a Coulomb slip model.
In UDEC, the default contact overlap tolerance is one-half the rounding length at the corners. The rounding length in the analysis was set to 0.1% width of the block. Thus, the overlap tolerance was 0.05% width of the block for all runs. If this overlap tolerance is exceeded during a run, UDEC issues an error message and stops the run. Several preliminary runs were performed to check values of overlap and time increment. During these runs, the block was allowed to rock freely for several cycles after the cessation of the cyclic base motion in order to verify the period of free vibration as compared with the analytical values derived by Housner [1] where the period is strongly dependent on the block rotation at the beginning of free vibrations cycles. As a result, the spring stiffness was set to 200 GPa/m for the 1 m block in both normal and shear directions and was scaled with the size of the block to maintain similar overlap values. The calculation cycle steps for the distinct element method are shown in Figure 3b.
The loads applied to the model where of two types: (i) the self-weight of the block and (ii) a repeated periodic pulse base velocity with a prescribed amplitude and period. For each applied pulse at a given period the acceleration was incremented until the block overturned within 25 cycles. At overturning, the critical combinations of period and acceleration of the applied pulses were noted. The application of up to 25 cycles was selected to produce realistic estimations of the critical combinations of accelerations and periods for a given pulse as it was noted by previous researchers [80,81] that the critical acceleration found by UDEC for short harmonic pulse periods decreases as the number of applied cycles of the forcing function increases from 1 to 5 stabilizing beyond that. For long harmonic pulse periods the critical acceleration found is independent of the number of cycles applied.
In order to visualize the rocking movement, the applied excitation at the base block and the response displacement at the top of the rocking block were plotted versus time. When both plots fall on top of each other it means the block is moving in one piece without rocking. When the two plots are different that means the block is rocking, and the difference in displacement between the two points can be used to measure the magnitude of rocking, the time interval between successive impacts and the angle of rotation.
Table 1 and Table 2 show typical results for the 0.5 m and the 1 m sized blocks at critical combinations found by numerical simulation. Both blocks show the same results qualitatively except for an expected shift in the corresponding periods.
- (a)
- For periods greater roughly than 0.4 s for the 0.5 m block and 0.6 s for the 1 m block, the base and the top of the block move together. Inception of rocking is indicated by a minor lag between the two displacements followed by rapid increase over one or two impacts leading to overturning.
- (b)
- For periods smaller than 0.4 s for the 0.5 m block and 0.6 s for the 1 m block, multiple rocking takes place followed by overturning. The rocking response exhibits an apparent period that is different from the period of the applied excitation with an increase in the magnitude of rocking, akin to resonance, which leads to overturning after a few cycles.
The boundary between safe and unsafe pulses was determined for all the blocks and signals in the period–acceleration space. Figure 4 plots the normalized boundaries between the safe and unsafe domains for three block sizes: 0.5, 1, and 20 m as determined from the numerical simulations of UDEC with respect to the period or time scale in comparison with the theoretical model. The critical periods of the 1/N reduced blocks scale with 1/N0.5. N = 1 for the 20 m block and N = 20 and 40 for the 1 m and 0.5 m blocks, respectively.
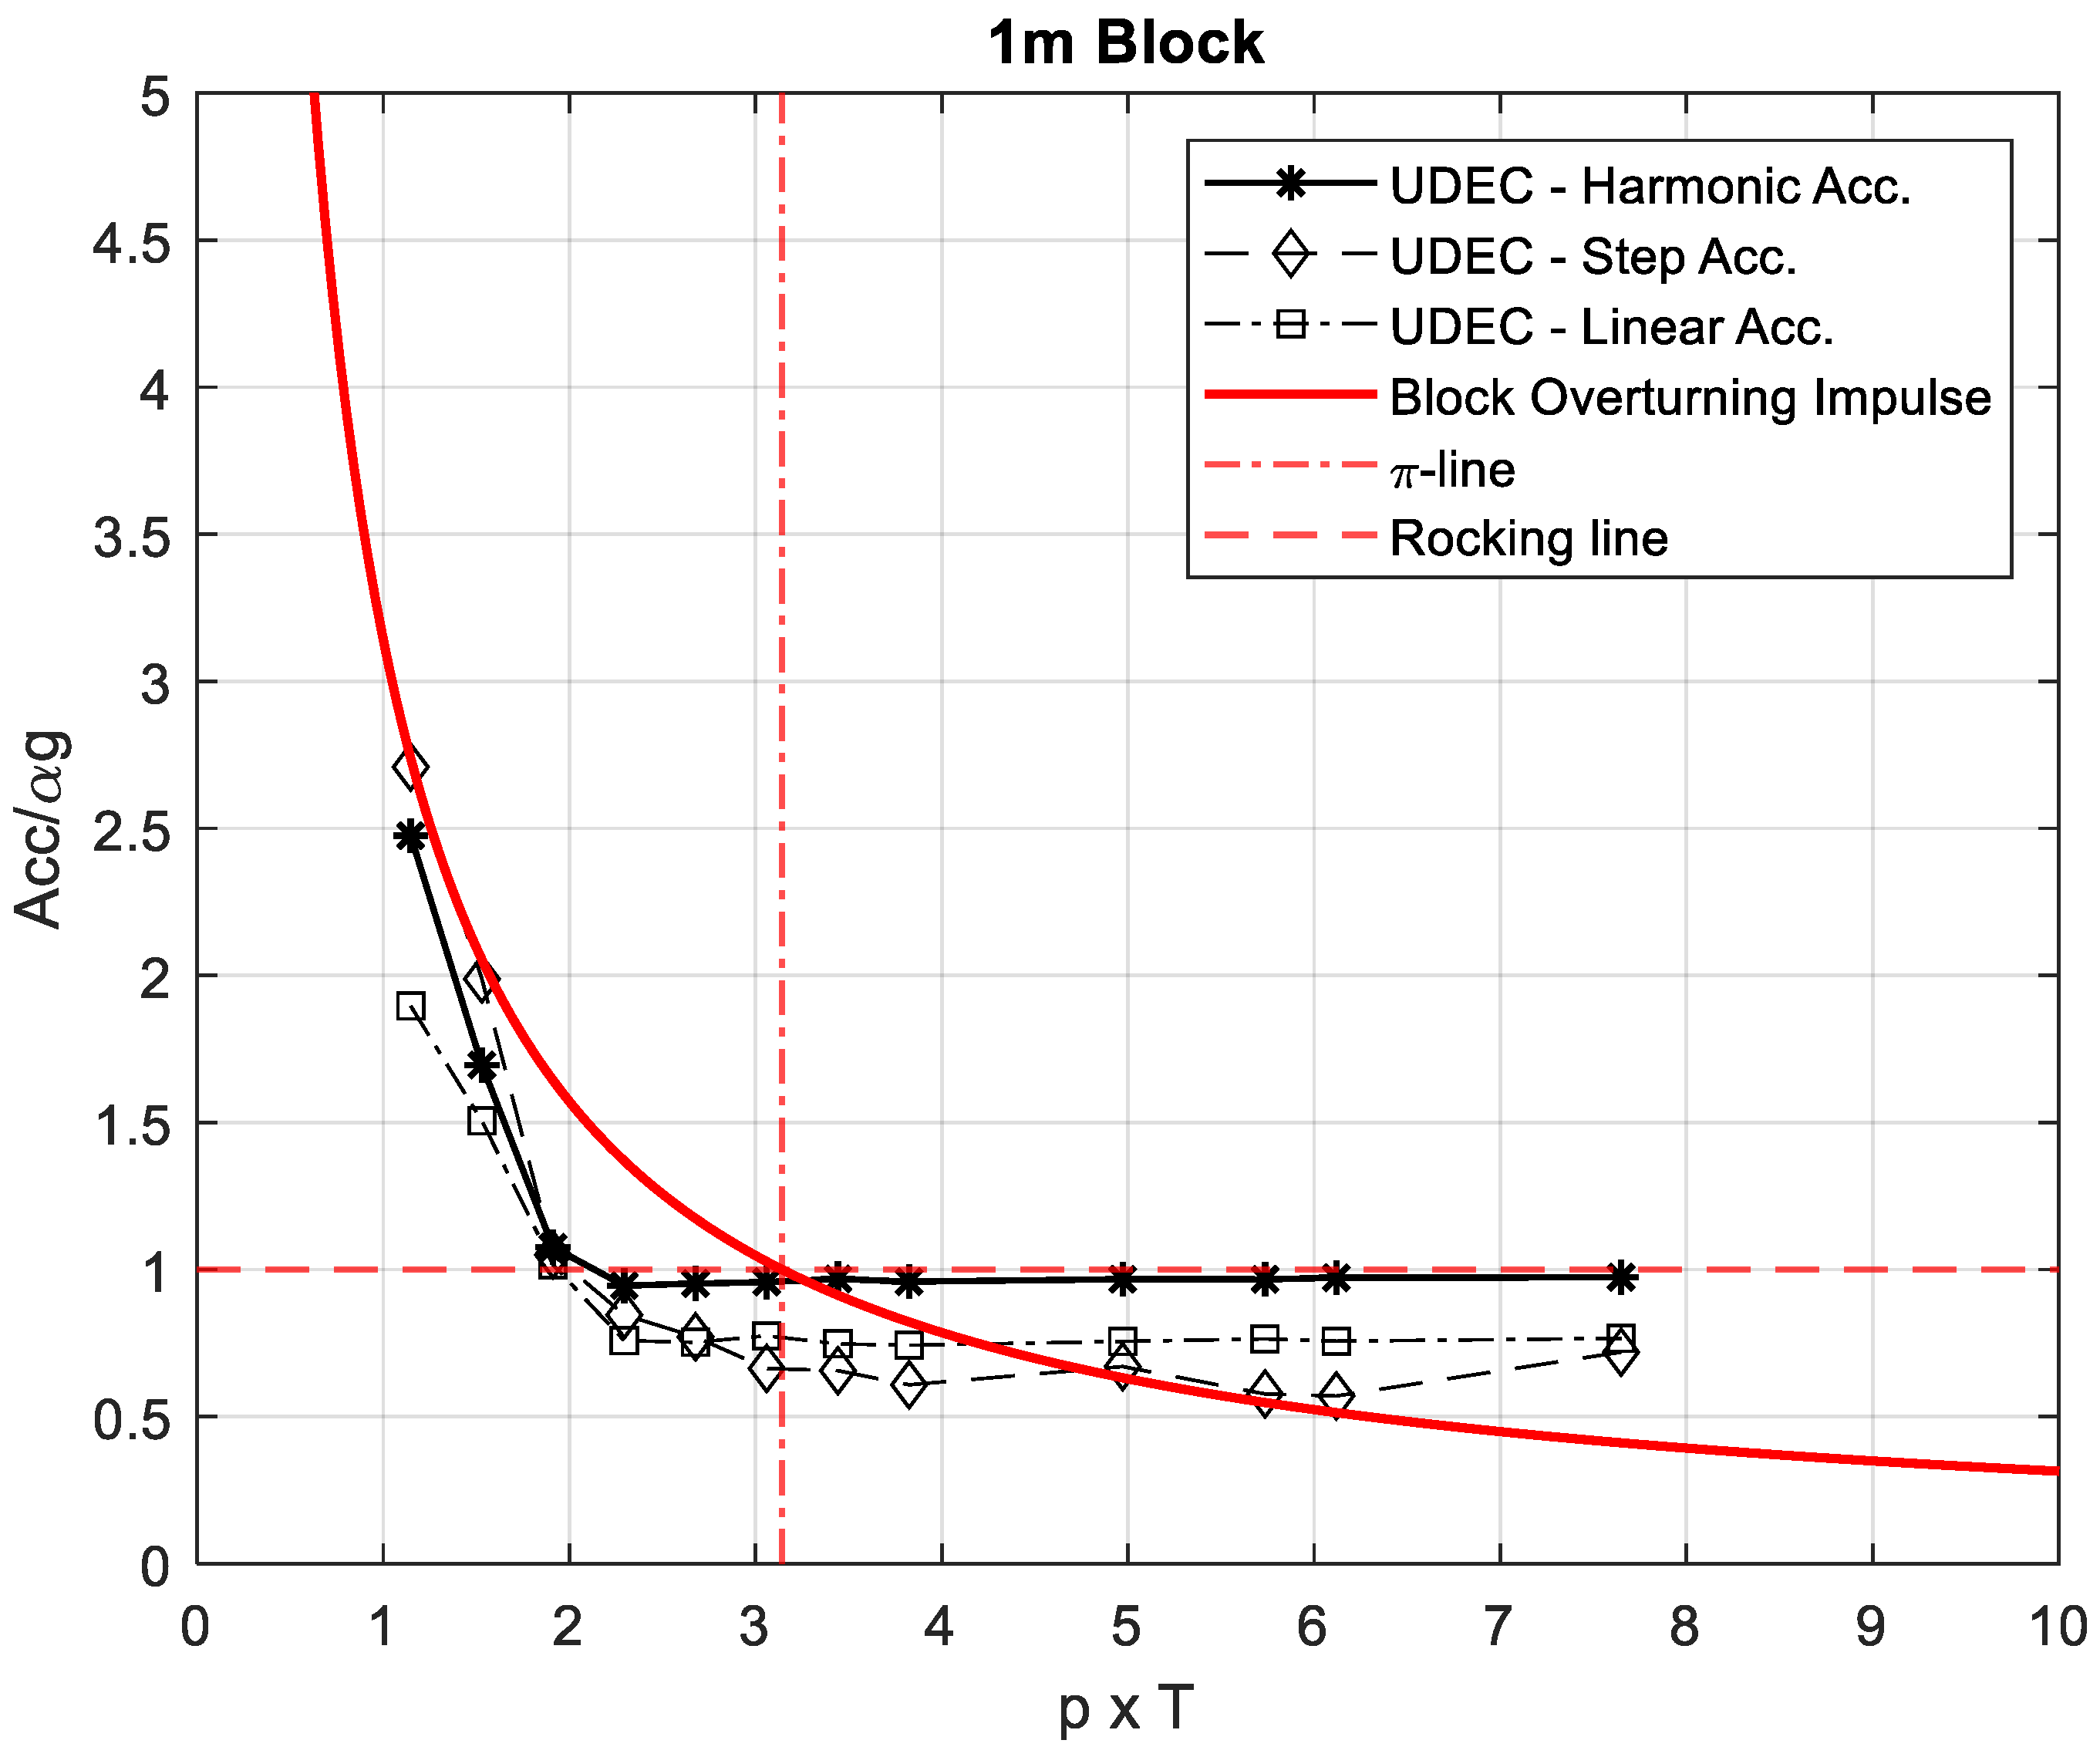
Figure 5 shows the three types of periodic pulses used. Figure 6 plots in the acceleration–period space the numerical results from UDEC for the safe–unsafe domains’ boundary for the 1 m block subject to harmonic, linear and step periodic pulses, given in Figure 5, normalized with respect to the energy content of the reference half-sine harmonic pulse. The energy content normalization can be done through the use of the fullness factor, β, of Equation (5) using β (half pulse)/β (half sine) as a scaling factor.
4. Discussion
The responses of 0.5 m and 1 m blocks to harmonic pulses presented in Table 1 and Table 2 show clearly two modes of response as predicted by the theory. The numerically observed transition periods, around 0.4 and 0.6 s for the 0.5 and 1 m blocks, respectively, fall consistently below the theoretically predicted transition periods of (0.5 m column) = 0.580 s, (1 m column) = 0.821 s; for comparison (20 m column) = 3.67 s. This is also shown in the normalized graphs of Figure 4 where the normalized transition period falls around pT = 2 for the numerical simulation while pT = π theoretically.
Periodic pulses with periods less than the transition period of the block have high acceleration that can drive rocking; this rocking becomes unstable if the minimum energy condition is met. At higher periods (that are larger than the transition period), the energy of the pulse is much higher than the energy required to overturn the block, therefore whenever the rocking condition is met, overturning takes place immediately without rocking or within one or two impacts, i.e., within less than one rocking cycle.
In Figure 4, the time/scale normalized curves fall on top of each other showing a very good match. The normalized UDEC boundary for all three block sizes is bi-modal, all three curves show two regimes that correspond to the two conditions of the simplified safe–unsafe theoretical boundary defined by Equation (7) for the minimum acceleration and minimum kinetic energy required for overturning. The transition period separates the flat part of the UDEC boundary at higher periods from the sharply rising part below the transition period value where higher accelerations are required to overturn the block. It is important to note here that both theoretical and numerical curves are truncated when the normalized acceleration required for overturning reaches a value of μ/α at which point sliding takes over and the conditions for rocking do not hold any more. For the columns used in the numerical model μ = 0.5 and α = 0.11 setting μ/α slightly above 4.5.
Above the transition period the UDEC results fall on or just below the flat line which corresponds to a = αg (Equation (1)), where α = tan−1 (b/h) is the critical stability angle and αg is the minimum theoretically required acceleration for overturning.
The normalized transition period between the two modes of response is the same for all block sizes used in the numerical simulation. Its value is however smaller by about one third than the theoretically calculated period shown by the intersection of the block overturning impulse curve giving the minimum kinetic energy and the rocking line defined by the minimum critical acceleration value.
In Figure 6, the pulse energy normalized curves for the 1 m size block are bi-modal, fall close to each other and show satisfactory agreement with the simplified safe–unsafe boundary following closely Equations (1), (5), and (7) for the minimum acceleration and minimum kinetic energy necessary to cause overturning. The normalized transition period between the two modes of response is the same for all periodic pulses used in the numerical simulation. As noted above, its value is smaller by about one third than the theoretically calculated transition period.
In their numerical analysis of columns subjected to harmonic pulses, Psycharis et al. [80] and Dimitri et al. [81] reported the same observations as in this work with respect to the decreasing trend of the safe–unsafe boundary in the ground acceleration–period space and its bi-modal shape. Dimitri et al. [81] also reported that the safe–unsafe boundary exhibits a discontinuity in slope for a given transition pulse duration reflected also in a change in the mode of collapse. They also reported that independently of the type of excitation applied scalability with respect to the square root of R was observed in agreement with the results presented in the previous paragraph. The findings of the theoretical and numerical approach also agree well with the findings of Makris and Kampas [82] who have distinguished size and slenderness as the two competing parameters in the stability of free-standing rocking columns. Slenderness determines the theoretical minimum acceleration required for overturning while the size determines the minimum pulse energy required for overturning.
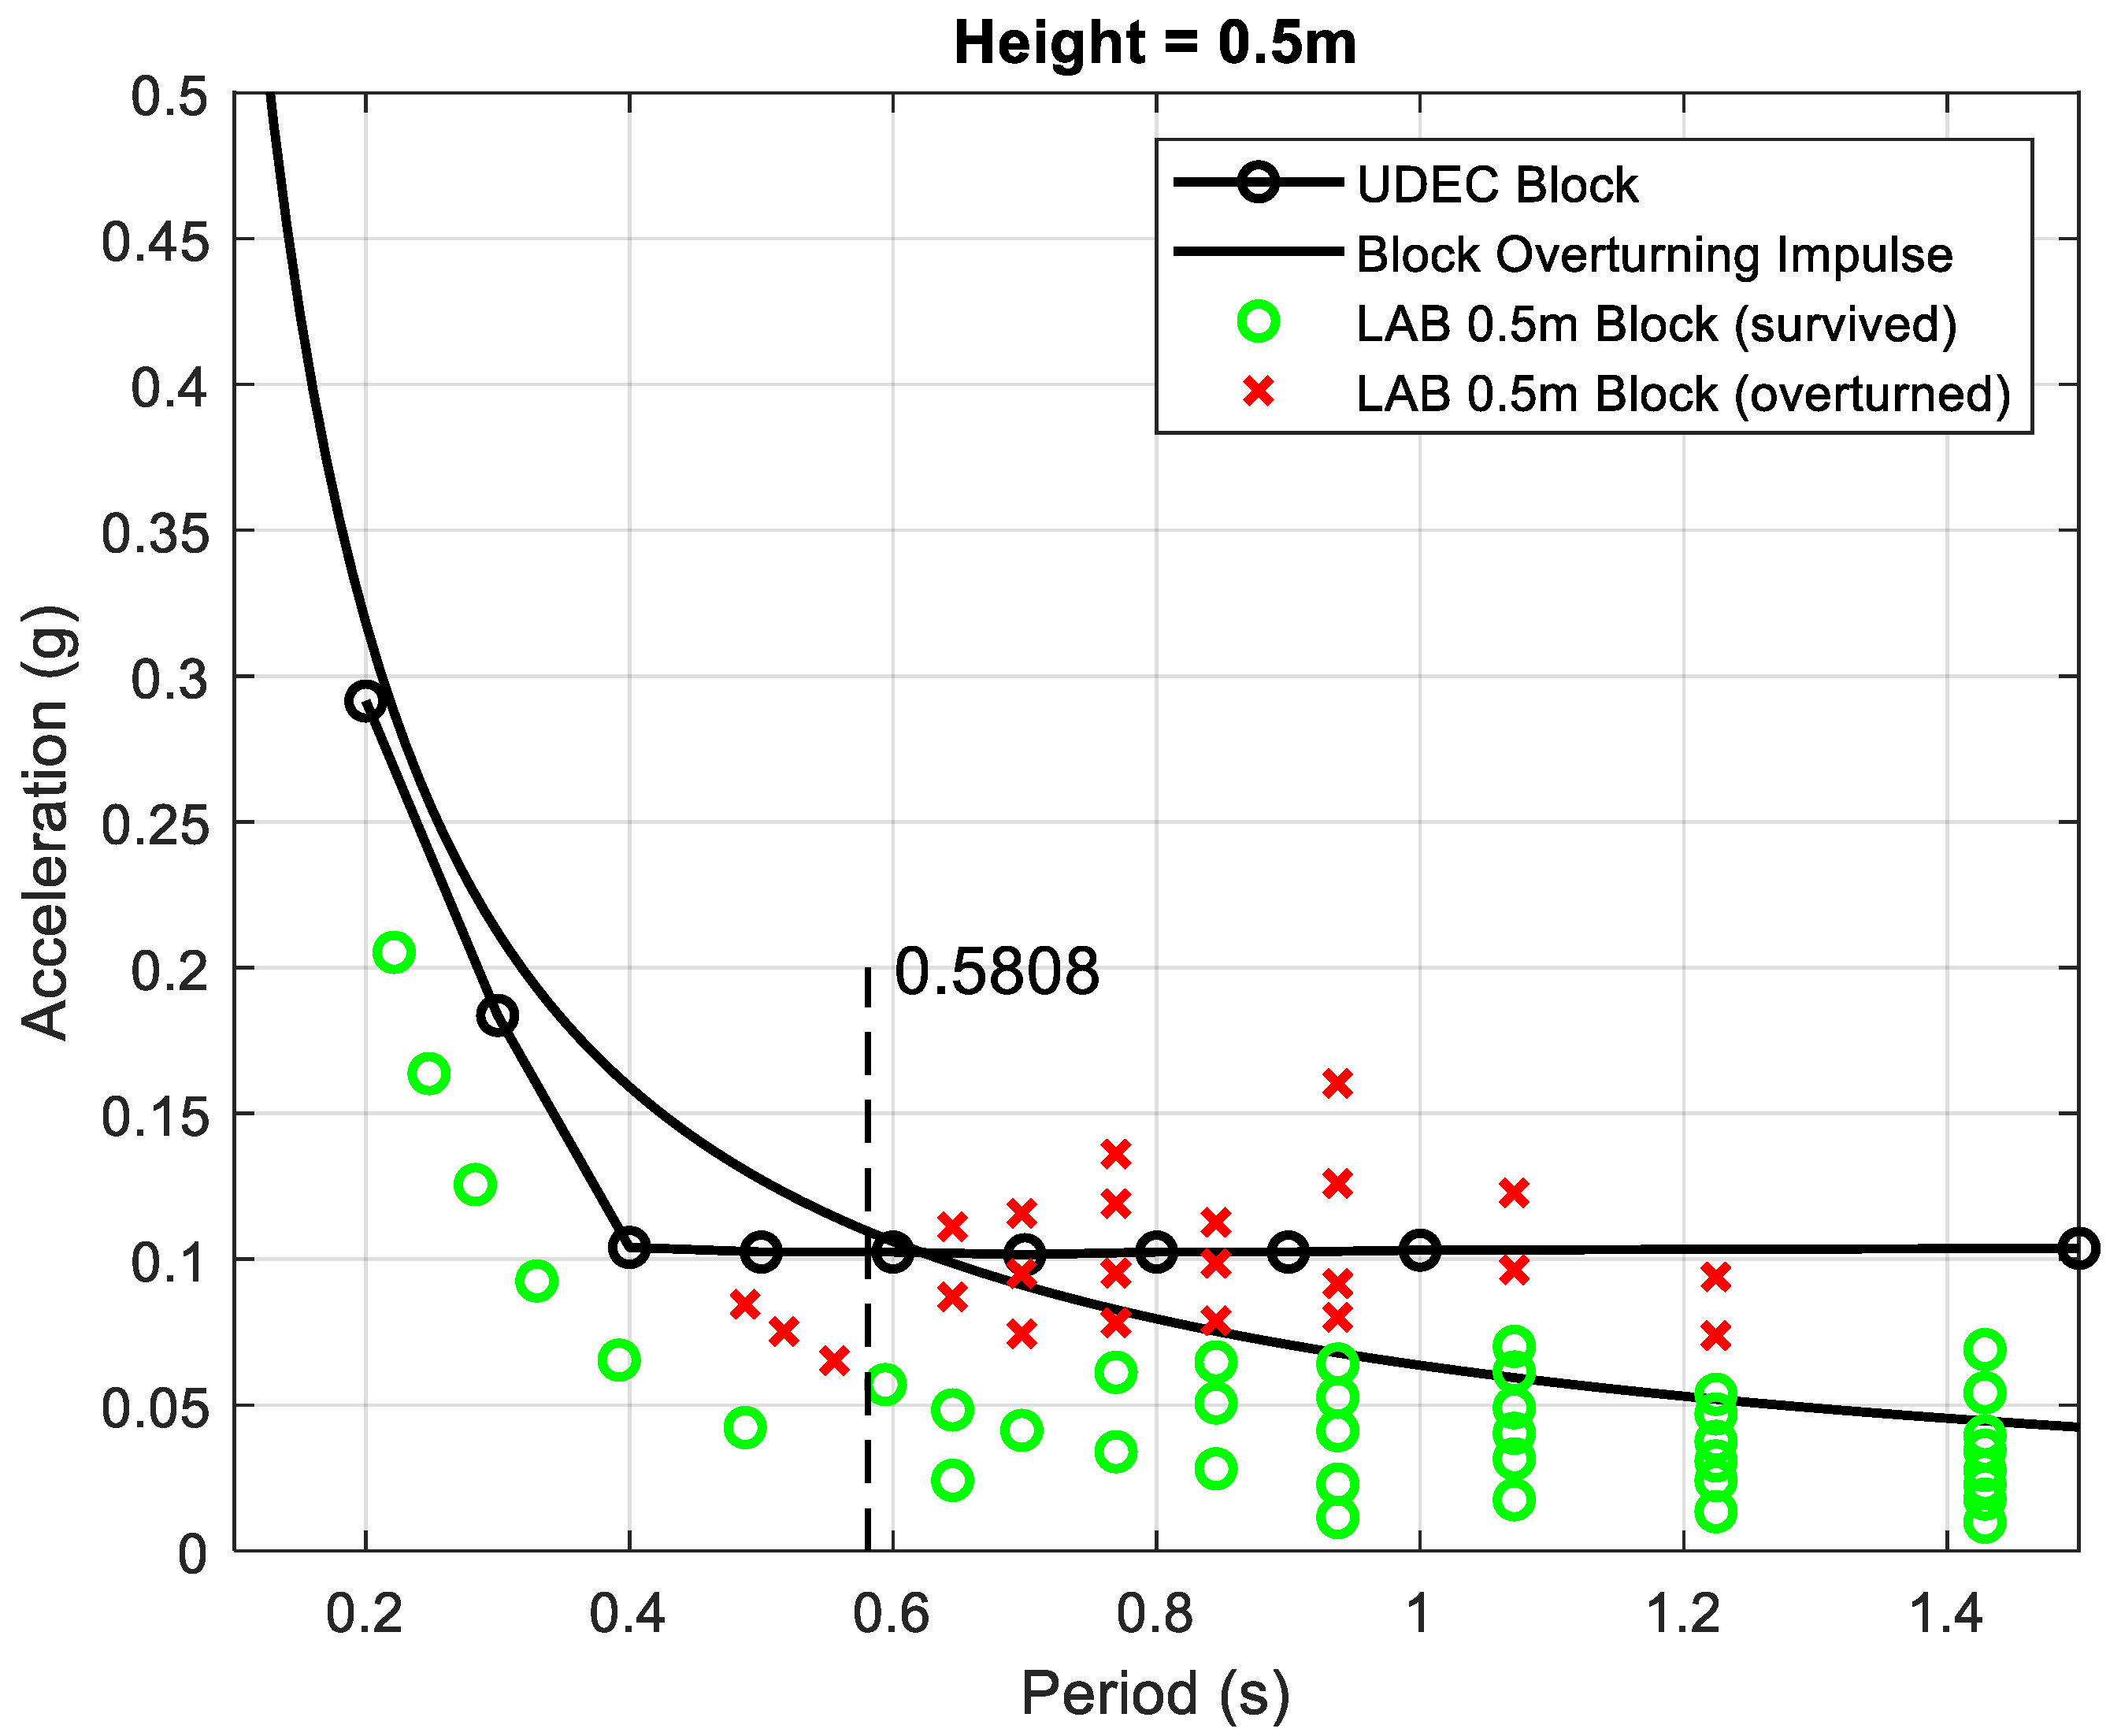
The results of shaking table experiments on a single block stone column of 0.5 m height representing a simplified reduced model of the Baalbek column (α = tan(b/h) = 0.11) under harmonic excitations [79] are compared to the theoretical and numerical models in Figure 7. Up to 25 cycles were applied and the experiment was noted as a green circle when the block did not overturn. Overturning at any time before the 25 cycles were elapsed was noted as a red cross. The data presented was obtained by systematic sweep in the acceleration–period space and confirmed repeatable results were reported noting the sensitivity of the shake table test results around the critical stability values [79]. The survival and overturning zones are clearly separated. The separation line between the green circles and the red crosses, representing each a single experiment, falls below both the theoretical and the numerical models. This is probably caused by the multiple imperfections in the experimental set up such as eccentricities and surface roughness as well as the differences between the actual situation of a cylindrical block rocking in 3D and the 2D modeling approach adopted [83]. Wobbling, or out-of-plane movement, can take place under transitional conditions in actual experiments when the conditions for rocking are met. The simple theoretical model proposed cannot predict out-of-plane response and a DEM 2D simulation maintaining the same geometric conditions was used for numerical verification. A comparison of the theoretical model and the 2D DEM results with 3D DEM simulations has been carried out by the authors showing no major differences with respect to the stability chart [84,85].
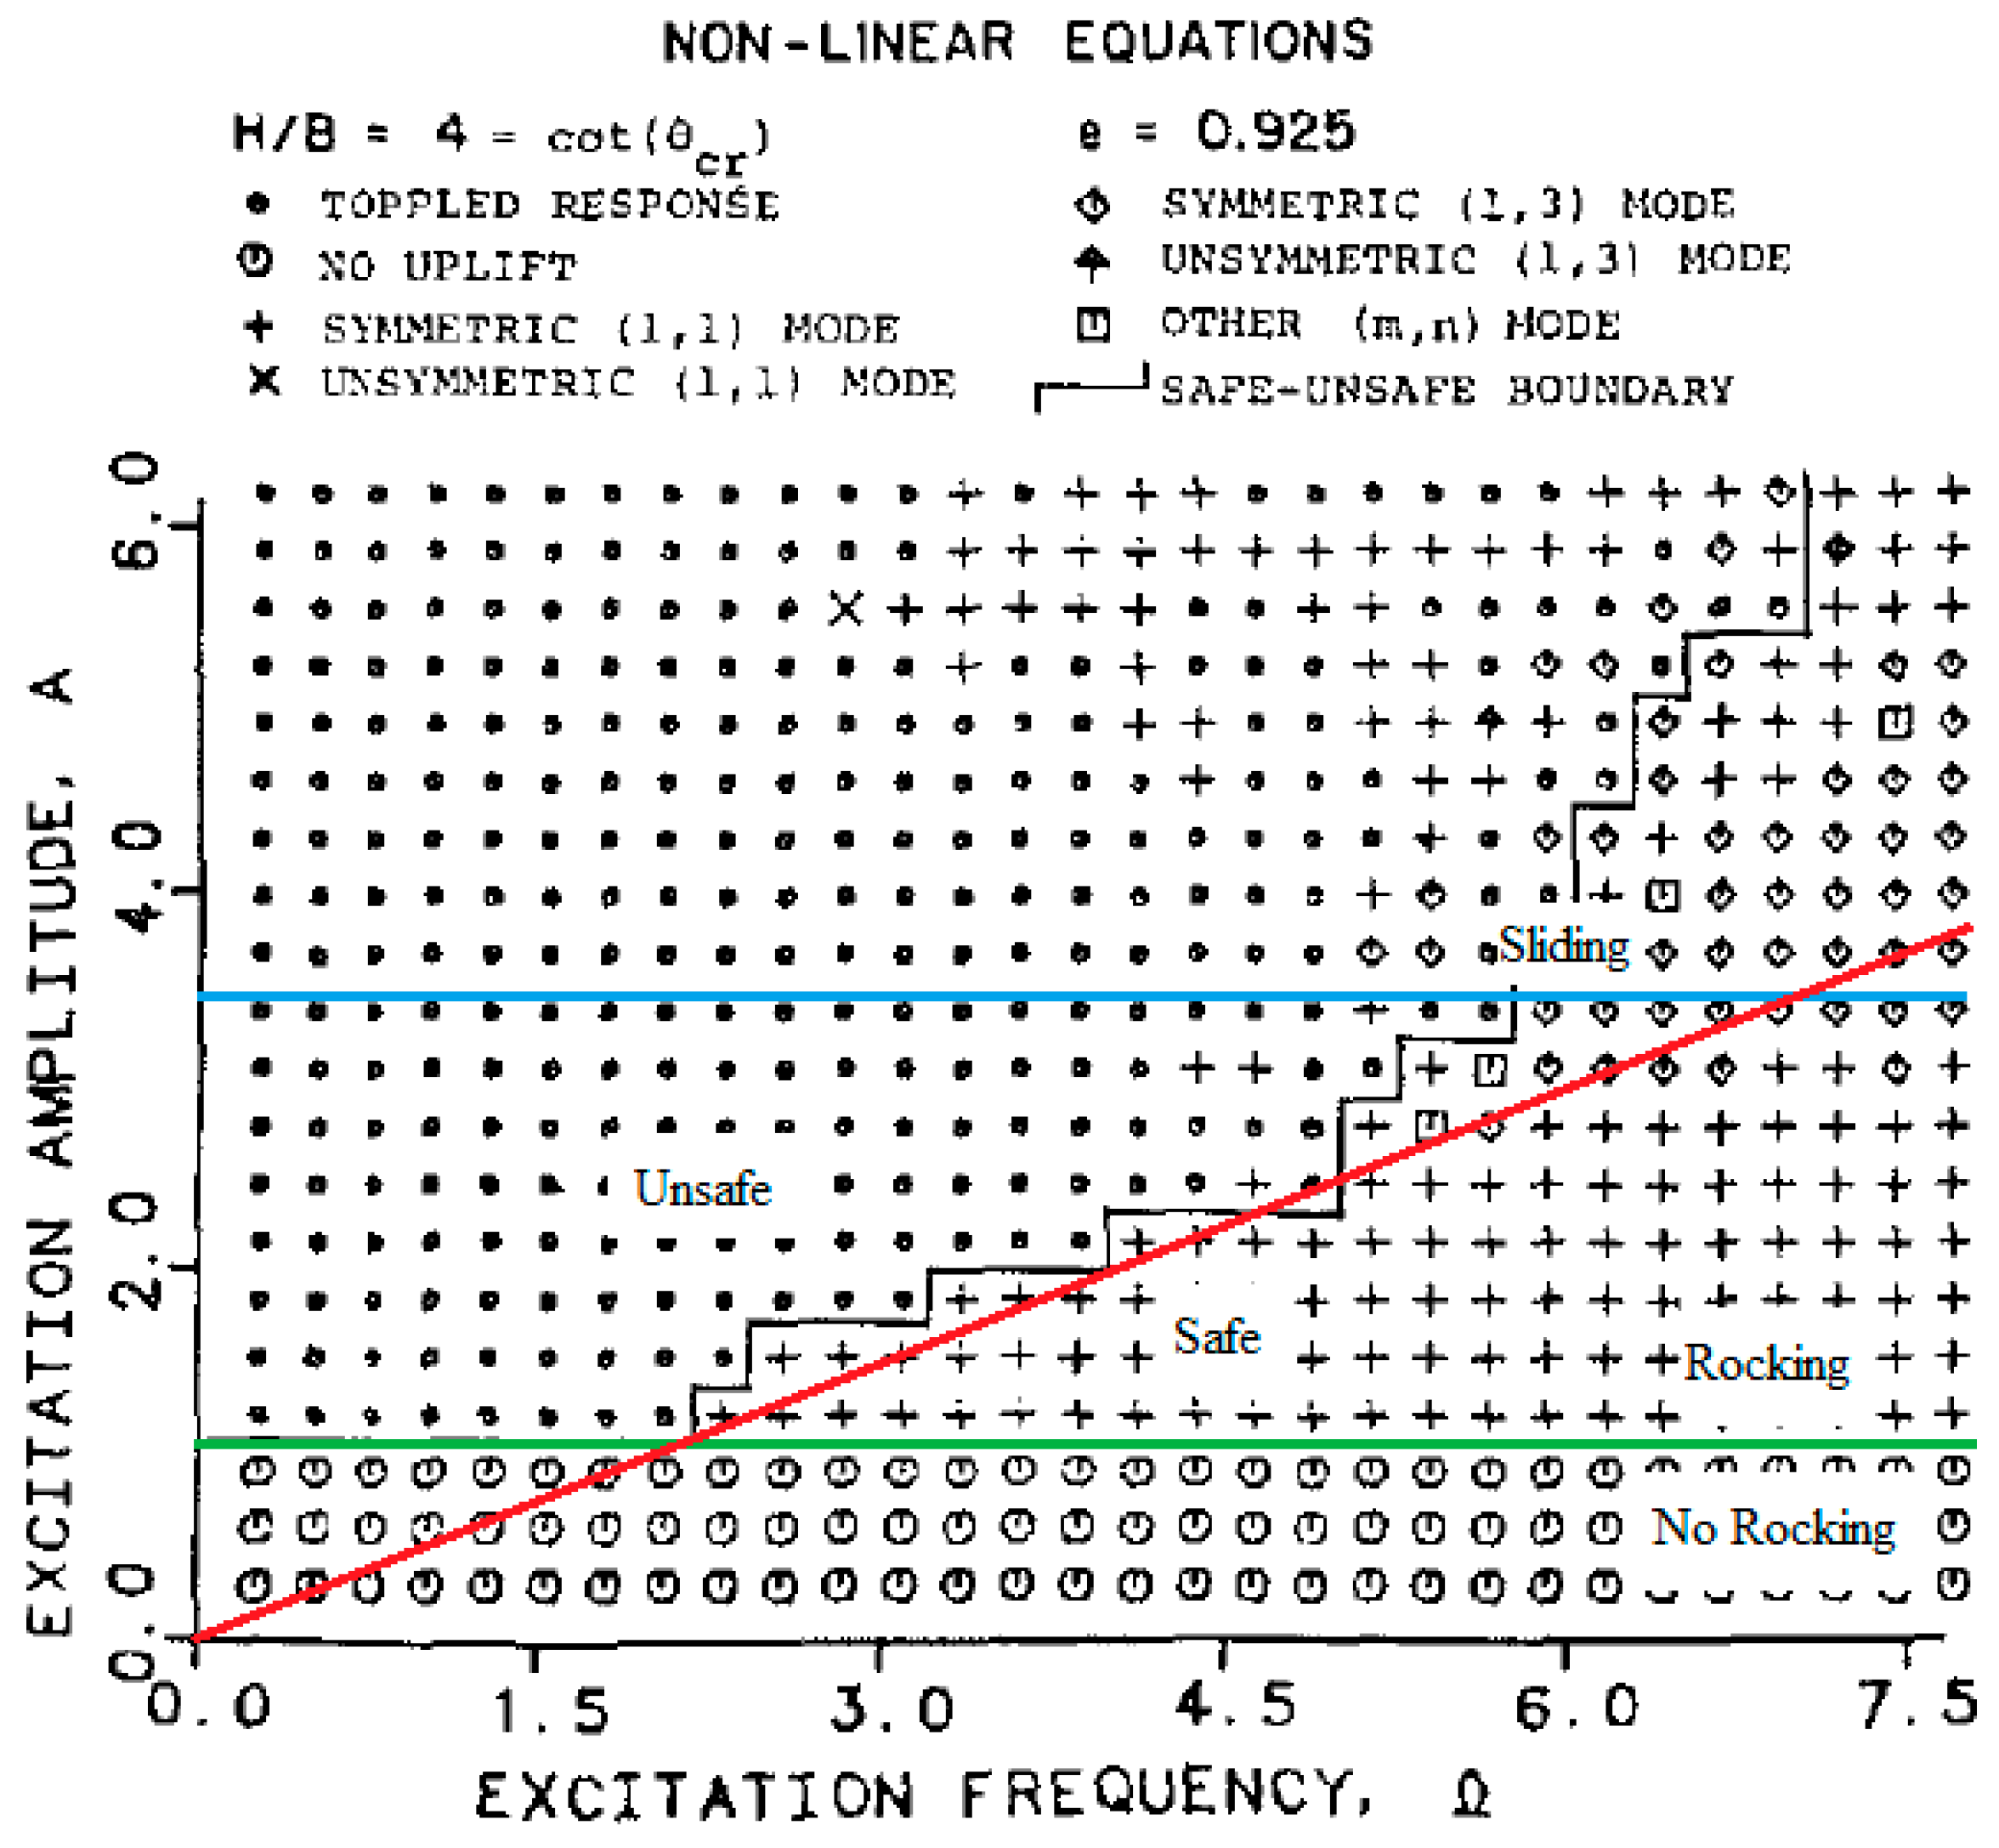
The stability chart of Figure 2a can be plotted in the acceleration-frequency domain nothing that the frequency of the half sine impulse signal, ω, is given by ω = 2π/T, where T is the period of the impulse. The dimensionless boundary is plotted in Figure 8 on top of the overturning acceleration spectrum for a freestanding rocking column with tan α = 0.25 when it is subjected to a one-sine acceleration pulse from the work of Makris and Vassiliou [63] and Makris and Kampas [82]. The double lobed numerical solution is presented in a dimensionless form that can be used for any column size and shape. The safe–unsafe boundary is plotted on top of the overturning spectrum as per Equations (1), (5), and (7). The periods shown on the abscissa axis are calculated for the 8 m tall column with tan α = 0.25 studied [82]. Noting that rock friction factors vary typically from 0.25 to 0.85 [86], the sliding limit is set for discussion at a maximum friction factor of μ = 0.85 giving μ/α = 3.4.
In reference to Figure 8: (i) no rocking takes place under the green line when the pulse acceleration is smaller than αg; (ii) rocking can take place when the pulse acceleration is greater than αg and smaller than μg, i.e., between the green and the blue lines; and (iii) sliding takes place above the blue line when the pulse acceleration is greater than μg. The red line plots the critical pulse energy required for overturning. All pulses above the line contain sufficient energy for overturning the block. Overturning can only take place when both acceleration and energy conditions are met, i.e., above both red and green lines and before sliding take over, i.e., below the blue line. The example presented in Figure 8 shows a practical application to an 8 m high column with α = 0.25, with (8 m column) = 2.32 s and other relevant periods calculated. It is seen that the relevant domain concerned with real physical values is rather limited compared to extent of numerical modeling. The domain of large periods for the 8 m column [2.32 s; ∞) corresponds to ωp/p in the interval of (0; 2] and the domain of the small periods (2.32 s; 0.68 s) corresponds to ωp/p in the interval of (2; 6.8). Similarly to Figure 8, Figure 9 compares the original numerical data of Spanos and Koh [8] for a block with tan α = 0.25 under a harmonic acceleration forcing function to the predicted safe–unsafe boundary for half sine impulse under the same maximum friction factor limitation.
The simple energy based approach proposed in this work provides a practical, reliable, and conservative alternative to the presentation and study of the stability and overturning of blocks carried by others in the frequency spectrum domain [8,63,82]. The proposed stability chart corresponds to the “dynamic identity card” of Foti and Vacca [87] and to the “contour plot” of Anderson et al. [88]. It offers a lower bound to the “safety wall” judiciously proposed by Dimitrakopoulos and Fung [20] and to the “overturning acceleration spectrum” of Ther and Kollar [89] and a linearization of the solution proposed by Kounadis [90] for a rocking-sliding block.
Makris and co-workers [63,82] have proposed to use the characteristic length scale, Lp = apT p2, of the ground excitation as an intensity measure for the near-fault single pulse noting that they still needed one more size related variable to properly characterize the rocking instability. Kavvadias et al. [91] investigated the effect of 23 ground motion intensity measures (IMs) on the stability of ancient rocking columns trying to identify the most relevant ones. They found that acceleration based parameters could predict rocking response only if combined with a frequency content parameter and that free-standing columns exhibited increased stability due to increasing size and rocking behavior. They only collapsed under long period extreme seismic records. Pappas et al. [92] investigated the efficiency of using Peak Ground Acceleration (PGA) and Peak Ground Velocity (PGV) as earthquake IM for the seismic vulnerability assessment of monolithic rocking bodies. To do so, a three-dimensional model of an existing free-standing ancient column of the Roman Agora of Thessaloniki was analyzed numerically with a three-dimensional DEM. A strong influence of the mean frequency of the ground motions, fm, on the structural response was observed and the authors concluded that it is deemed more efficient to consider dual Intensity Measures such as, (PGA, fm) and (PGV, fm) pairs, instead of single PGA and PGV amplitudes. Some of their numerical results can be interpreted and proved using the simple energy based critical pulse approach presented above. Giouvanidis and Dimitrakopoulos [23] showed that duration-based IMs outperformed other examined scalar IMs such as intensity, frequency, and/or energy but would need to be used concurrently with other IMs in order to fully predict the rocking block response. The works of Kavvadias et al. [90], Pappas et al. [91], and Giouvanidis and Dimitrakopoulos [23] provide solid support for the use of to the proposed simple energy based critical pulse approach as a ground motion intensity measure. The intensity measure would be constituted of two measures one shape related and the other energy related, noting that the three independent variables used in the theoretical derivation are block slenderness, α, block size, R, and pulse shape, β. Purvance et al. [31] identified the PGV/PGA as a reliable IM to predict the PGA at first overturning as it is directly correlated with the predominant acceleration pulse of various waveforms including five near-fault earthquake records along with synthetic waveforms. In fact the ratio PGV/PGA returns a time value that is akin to the duration, tp, of a step pulse with β = 1. Plots a, c, and d of Figure 7 in [31] present PGA versus PGV/PGA shaking table results on symmetrical 1.2 m high columns with α = 0.29, 0.21, and 0.27 respectively. The PGA data was normalized by αg and the PGV/PGA data was normalized by 1/p for all three columns and plotted in Figure 10 against the safe–unsafe boundary for half step impulse. The normalized experimental data points overlap as predicted by the theory and while they follow the same trend as the theoretical model they fall below its prediction for the same reasons presented above in the discussion of Figure 7 presenting the experimental results of the authors [79].
It is proposed that further work should concentrate on the application of the proposed approach to the analysis of earthquake histories for critical pulse content that can drive a rocking system to overturn. Near-fault earthquake records could be analyzed to determine the applicable intensity measure of the single critical impulse, such as dominant periods, maximum signal acceleration, and total energy content that would allow direct plotting and comparison to the proposed stability charts. In general, earthquake records could also be analyzed for critical trains of sub-critical pulses that could pump sufficient energy in a rocking system to cause overturning. This could be achieved by building on the Housner’s [1] seminal work suggesting that multiple successive non-critical pulses can cause overturning by building up the amplitude, and also following the suggestion of DeJong [93] to explore the ability of multiple impulses to amplify the block response through a “rocking resonance” phenomenon.
5. Conclusions
Based on considerations of stability and minimum kinetic energy a simple theoretical two-dimensional bi-modal model was derived to determine the safe–unsafe boundaries in the acceleration–period domain for rigid blocks under seismic single pulses.
UDEC numerical simulations have substantiated the proposed two-dimensional model showing bi-modal behavior and the existence of a transition period in agreement with the derived model. The transition between the response modes in the numerical model takes place at a period that is close to the theoretically calculated characteristic period of the rigid block.
The time/scale similitude rule established in the theoretical derivation is verified numerically showing that the critical period to cause instability of a 1/N reduced block scales with 1/N0.5.
The pulse energy similitude rule established in the theoretical derivation is verified numerically showing that for the same pulse energy the safe–unsafe boundaries in the acceleration–period domain are similar for different shape regular pulses.
The theoretical model and the numerical simulation results are in good agreement with the experimental results from shaking table tests on a cylindrical small sized block, showing good predictive capabilities. The discrepancy between the experimental data and the theoretical and numerical results is attributed to imperfections in the shaking table model, eccentricities, contact surface roughness, and 3D effects.
The model provides a first order approximation to determine the stability or overturning of rigid blocks under critical pulses. The time/scale and pulse energy similitude rules verified theoretically and numerically between various scales provide a robust method to determine the behavior under earthquake loads of full-sized block structures from experiments on scaled down models.
The model shows good agreement with the published body of work on the overturning acceleration–frequency spectrum of rocking blocks under single pulses and other waveforms and presents a practical lower bound for realistic block sizes and impulse periods.
Further development work is required to extend the proposed approach to the analysis of earthquake histories for critical pulses or critical trains of pulses that can drive a rocking system to overturn. The results presented in this work can be applied to investigate the response of rigid block structures such as obelisks, columns, colonnades, walls, precariously balanced rocks, and various block shaped equipment and furniture to complex seismic events. The model can also be used to estimate the critical parameters of near-fault earthquake pulses that have resulted in the historical destruction of some of these structures contributing to in archaeoseismology.
Author Contributions
Conceptualized the problem and conducted the experimental program, G.K.; carried out the numerical modeling, M.T. All authors have read and agreed to the published version of the manuscript.
Funding
This research received no external funding.
Acknowledgments
The authors wish to acknowledge the valuable contribution of anonymous reviewers whose judicious comments have resulted in substantial improvements to this paper.
Conflicts of Interest
The authors declare no conflict of interest.
References
- Housner, G.W. The Behavior of Inverted Pendulum Structures during Earthquakes. Bull. Seismol. Soc. Am. 1963, 53, 403–417. [Google Scholar]
- Mallet, R. Great Neapolitan Earthquake of 1857: The First Principles of Observational Seismology as Developed in the Report to the Royal Society of London of the Expedition Made by Command of the Society Into the Interior of the Kingdom of Naples, to Investigate the Circumstances of the Great Earthquake of December 1857; Chapman and Hall: London, UK, 1862; Volume 2. [Google Scholar]
- Milne, J.; Omori, F. On the overturning and fracturing of Brick and other Columns by horizontally applied Motion. Seismol. J. Jpn. 1893, 17, 59–86. [Google Scholar]
- Kirkpatrick, P. Seismic measurements by the overthrow of columns. Bull. Seismol. Soc. Am. 1927, 17, 95–109. [Google Scholar]
- Yim, C.S.; Chopra, A.K.; Penzien, J. Rocking response of rigid blocks to earthquakes. Earthq. Eng. Struct. Dyn. 1980, 8, 565–587. [Google Scholar] [CrossRef]
- Yim, S.C.; Lin, H. Nonlinear impact and chaotic response of slender rocking objects. J. Eng. Mech. 1991, 117, 2079–2100. [Google Scholar] [CrossRef]
- Ishiyama, Y. Motions of rigid bodies and criteria for overturning by earthquake excitations. Earthq. Eng. Struct. Dyn. 1982, 10, 635–650. [Google Scholar] [CrossRef]
- Spanos, P.D.; Koh, A.S. Rocking of rigid blocks due to harmonic shaking. J. Eng. Mech. 1984, 110, 1627–1642. [Google Scholar] [CrossRef]
- Tso, W.K.; Wong, C.M. Steady state rocking response of rigid blocks part 1: Analysis. Earthq. Eng. Struct. Dyn. 1989, 18, 89–106. [Google Scholar] [CrossRef]
- Wong, C.M.; Tso, W.K. Steady state rocking response of rigid blocks Part 2: Experiment. Earthq. Eng. Struct. Dyn. 1989, 18, 107–120. [Google Scholar] [CrossRef]
- Hogan, S.J. On the dynamics of rigid-block motion under harmonic forcing. Proc. R. Soc. Lond. A Math. Phys. Sci. 1989, 425, 441–476. [Google Scholar]
- Shenton, H.W., III; Jones, N.P. Base excitation of rigid bodies. I: Formulation. J. Eng. Mech. 1991, 117, 2286–2306. [Google Scholar] [CrossRef]
- Shenton, H.W., III; Jones, N.P. Base excitation of rigid bodies. II: Periodic slide-rock response. J. Eng. Mech. 1991, 117, 2307–2328. [Google Scholar] [CrossRef]
- Shenton, H.W., III. Criteria for initiation of slide, rock, and slide-rock rigid-body modes. J. Eng. Mech. 1996, 122, 690–693. [Google Scholar] [CrossRef]
- Shi, B.; Anooshehpoor, A.; Zeng, Y.; Brune, J.N. Rocking and overturning of precariously balanced rocks by earthquakes. Bull. Seismol. Soc. Am. 1996, 86, 1364–1371. [Google Scholar]
- Makris, N.; Roussos, Y. Rocking Response of Rigid Blocks under Near-Source Ground Motions. Géotechnique 2000, 50, 243–262. [Google Scholar] [CrossRef]
- Zhang, J.; Makris, N. Rocking response of free-standing blocks under cycloidal pulses. J. Eng. Mech. 2001, 127, 473–483. [Google Scholar] [CrossRef] [Green Version]
- Dimitrakopoulos, E.G.; DeJong, M.J. Revisiting the rocking block: Closed-form solutions and similarity laws. Proc. R. Soc. A Math. Phys. Eng. Sci. 2012, 468, 2294–2318. [Google Scholar] [CrossRef]
- Voyagaki, E.; Psycharis, I.; Mylonakis, G. Rocking Response and Overturning Criteria for Free Standing Blocks to Single-Lobe Pulses. Soil Dyn. Earthq. Eng. 2013, 46, 85–95. [Google Scholar] [CrossRef]
- Dimitrakopoulos, E.G.; Fung, E.D.W. Closed-form rocking overturning conditions for a family of pulse ground motions. Proc. R. Soc. A Math. Phys. Eng. Sci. 2016, 472, 20160662. [Google Scholar] [CrossRef] [Green Version]
- Nabeshima, K.; Taniguchi, R.; Kojima, K.; Takewaki, I. Closed-form overturning limit of rigid block under critical near-fault ground motions. Front. Built Environ. 2016, 2, 9. [Google Scholar] [CrossRef] [Green Version]
- Ther, T.; Kollar, L. Overturning of rigid blocks for earthquake excitation. Bull. Earthq. Eng. 2018, 16, 1607–1631. [Google Scholar] [CrossRef]
- Giouvanidis, A.I.; Dimitrakopoulos, E.G. Rocking amplification and strong-motion duration. Earthq. Eng. Struct. Dyn. 2018, 47, 2094–2116. [Google Scholar] [CrossRef]
- Aslam, M.; Godden, W.G.; Scalise, D.T. Earthquake rocking response of rigid bodies. J. Struct. Div. ASCE 1980, 106, 377–392. [Google Scholar]
- Lipscombe, P.R.; Pellegrino, S. Free rocking of prismatic blocks. J. Eng. Mech. 1993, 119, 1387–1410. [Google Scholar] [CrossRef] [Green Version]
- Manos, G.C.; Demosthenous, M. Dynamic response of rigid bodies subjected to horizontal base motion. In Proceedings of the 10th WCEE, Madrid, Spain, 19–24 July 1992; pp. 2817–2821. [Google Scholar]
- Prieto, F.; Lourenço, P.B.; Oliveira, C.S. Impulsive Dirac-delta forces in the rocking motion. Earthq. Eng. Struct. Dyn. 2004, 33, 839–857. [Google Scholar] [CrossRef] [Green Version]
- Prieto, F.; Lourenço, P.B. On the rocking behavior of rigid objects. Meccanica 2005, 40, 121–133. [Google Scholar] [CrossRef] [Green Version]
- Peña, F.; Prieto, F.; Lourenço, P.B.; Campos Costa, A.; Lemos, J.V. On the dynamics of rocking motion of single rigid-block structures. Earthq. Eng. Struct. Dyn. 2007, 36, 2383–2399. [Google Scholar] [CrossRef] [Green Version]
- Peña, F.; Lourenço, P.B.; Campos-Costa, A. Experimental dynamic behavior of free-standing multi-block structures under seismic loadings. J. Earthq. Eng. 2008, 12, 953–979. [Google Scholar] [CrossRef] [Green Version]
- Purvance, M.D.; Anooshehpoor, A.; Brune, J.N. Freestanding block overturning fragilities: Numerical simulation and experimental validation. Earthq. Eng. Struct. Dyn. 2008, 37, 791–808. [Google Scholar] [CrossRef]
- Konstantinidis, D.; Makris, N. Experimental and analytical studies on the response of freestanding laboratory equipment to earthquake shaking. Earthq. Eng. Struct. Dyn. 2009, 38, 827–848. [Google Scholar] [CrossRef]
- Kafle, B.; Lam, N.T.; Gad, E.F.; Wilson, J. Displacement controlled rocking behaviour of rigid objects. Earthq. Eng. Struct. Dyn. 2011, 40, 1653–1669. [Google Scholar] [CrossRef]
- Baratta, A.; Corbi, I.; Corbi, O. Towards a seismic worst scenario approach for rocking systems: Analytical and experimental set-up for dynamic response. Acta Mech. 2013, 224, 691–705. [Google Scholar] [CrossRef]
- Saraswat, A.; Reddy, G.R.; Ghosh, A.K.; Ghosh, S. Effects of base excitation frequency on the stability of a freestanding rigid block. Acta Mech. 2016, 227, 795–812. [Google Scholar] [CrossRef]
- Gesualdo, A.; Iannuzzo, A.; Minutolo, V.; Monaco, M. Rocking of freestanding objects: Theoretical and experimental comparisons. J. Theor. Appl. Mech. 2018, 56, 977–991. [Google Scholar] [CrossRef]
- Arredondo, C.; Jaimes, M.A.; Reinoso, E. A Simplified Model to Evaluate the Dynamic Rocking Behavior of Irregular Free-Standing Rigid Bodies Calibrated with Experimental Shaking-Table Tests. J. Earthq. Eng. 2019, 23, 46–71. [Google Scholar] [CrossRef]
- Al Abadi, H.; Paton-Cole, V.; Gad, E.; Lam, N.; Patel, V. Rocking Behavior of Irregular Free-Standing Objects Subjected to Earthquake Motion. J. Earthq. Eng. 2019, 23, 793–809. [Google Scholar] [CrossRef]
- Di Sarno, L.; Magliulo, G.; D’Angela, D.; Cosenza, E. Experimental assessment of the seismic performance of hospital cabinets using shake table testing. Earthq. Eng. Struct. Dyn. 2019, 48, 103–123. [Google Scholar] [CrossRef] [Green Version]
- Reggiani Manzo, N.; Vassiliou, M.F. Displacement-based analysis and design of rocking structures. Earthq. Eng. Struct. Dyn. 2019, 48, 1613–1629. [Google Scholar] [CrossRef]
- Durukal, E. Critical evaluation of strong motion in Kocaeli and Düzce (Turkey) earthquakes. Soil Dyn. Earthq. Eng. 2002, 22, 589–609. [Google Scholar] [CrossRef]
- Godschalk, D.R. Urban hazard mitigation: Creating resilient cities. Nat. Hazards Rev. 2003, 4, 136–143. [Google Scholar] [CrossRef]
- Rashed, T.; Weeks, J. Assessing vulnerability to earthquake hazards through spatial multicriteria analysis of urban areas. Int. J. Geogr. Inform. Sci. 2003, 17, 547–576. [Google Scholar] [CrossRef]
- Godschalk, D.; Xu, C. Urban hazard mitigation: Creating resilient cities. Urban Plan. Int. 2015, 2, 22–29. [Google Scholar] [CrossRef]
- Hall, J.F.; Heaton, T.H.; Halling, M.W.; Wald, D.J. Near-source ground motion and its effects on flexible buildings. Earthq. Spec. 1995, 11, 569–605. [Google Scholar] [CrossRef]
- Somerville, P.G.; Smith, N.F.; Graves, R.W.; Abrahamson, N.A. Modification of empirical strong ground motion attenuation relations to include the amplitude and duration effects of rupture directivity. Seismol. Res. Lett. 1997, 68, 199–222. [Google Scholar] [CrossRef]
- Kalkan, E.; Kunnath, S.K. Effects of fling step and forward directivity on seismic response of buildings. Earthq. Spec. 2006, 22, 367–390. [Google Scholar] [CrossRef]
- Somerville, P.G. Magnitude scaling of the near fault rupture directivity pulse. Phys. Earth Planet. Int. 2003, 137, 201–212. [Google Scholar] [CrossRef]
- Somerville, P.G. Engineering characterization of near fault ground motions. In Proceedings of the NZSEE 2005 Conference, Wairakei, New Zealand, 11–13 March 2005. [Google Scholar]
- Chen, K.; Avouac, J.P.; Aati, S.; Milliner, C.; Zheng, F.; Shi, C. Cascading and pulse-like ruptures during the 2019 Ridgecrest earthquakes in the Eastern California Shear Zone. Nat. Commun. 2020, 11, 1–8. [Google Scholar] [CrossRef]
- Hough, S.E.; Thompson, E.; Parker, G.A.; Graves, R.W.; Hudnut, K.W.; Patton, J.; Blake, K. Near-field ground motions from the July 2019 Ridgecrest, California, earthquake sequence. Seismol. Res. Lett. 2020, 91, 1542–1555. [Google Scholar] [CrossRef]
- Sasani, M.; Bertero, V.V. Importance of Severe Pulse-Type Ground Motions in Performance-Based Engineering: Historical and Critical. In Proceedings of the 12th World Conference on Earthquake Engineering, New Zealand Society for Earthquake Engineering, Upper Hutt, New Zealand, 30 January–4 February 2000. [Google Scholar]
- Alavi, B.; Krawinkler, H. Behavior of moment-resisting frame structures subjected to near-fault ground motions. Earthq. Eng. Struct. Dyn. 2004, 33, 687–706. [Google Scholar] [CrossRef]
- Mollaioli, F.; Bruno, S.; Decanini, L.D.; Panza, G.F. Characterization of the dynamic response of structures to damaging pulse-type near-fault ground motions. Meccanica 2006, 41, 23–46. [Google Scholar] [CrossRef] [Green Version]
- Tong, M.; Rzhevsky, V.; Dai, J.; Lee, G.C.; Qi, J.; Qi, X. Near-fault ground motions with prominent acceleration pulses: Pulse characteristics and ductility demand. Earthq. Eng. Eng. Vib. 2007, 6, 215–223. [Google Scholar] [CrossRef]
- Xie, L.; Xu, L.; Adrian, R.M. Representation of near-fault pulse-type ground motions. Earthq. Eng. Eng. Vib. 2005, 4, 191–199. [Google Scholar] [CrossRef]
- Kojima, K.; Fujita, K.; Takewaki, I. Double and Triple Impulses for Capturing Critical Elastic-Plastic Response Properties and Robustness of Building Structures Under Near-Fault Ground Motions. In Resilient Structures and Infrastructure; Springer: Singapore, 2019; pp. 225–242. [Google Scholar]
- Arroyo, D.; Ordaz, M. Use of corrected sinusoidal pulses to estimate inelastic demands of elasto-perfectly plastic oscillators subjected to narrow-band motions. J. Earthq. Eng. 2007, 11, 303–325. [Google Scholar] [CrossRef]
- Zhang, Y.; Hu, Y.; Zhao, F.; Liang, J.; Yang, C. Identification of acceleration pulses in near-fault ground motion using the EMD method. Earthq. Eng. Eng. Vib. 2005, 4, 201–212. [Google Scholar] [CrossRef]
- Mavroeidis, G.P.; Papageorgiou, A.S. A mathematical representation of near-fault ground motions. Bull. Seismol. Soc. Am. 2003, 93, 1099–1131. [Google Scholar] [CrossRef]
- Baker, J.W. Quantitative classification of near-fault ground motions using wavelet analysis. Bull. Seismol. Soc. Am. 2007, 97, 1486–1501. [Google Scholar] [CrossRef]
- Shahi, S.K.; Baker, J.W. An efficient algorithm to identify strong-velocity pulses in multicomponent ground motions. Bull. Seismol. Soc. Am. 2014, 104, 2456–2466. [Google Scholar] [CrossRef]
- Makris, N.; Vassiliou, M.F. Sizing the slenderness of free-standing rocking columns to withstand earthquake shaking. Arch. Appl. Mech. 2012, 82, 1497–1511. [Google Scholar] [CrossRef]
- Yamamoto, M.; Sato, Y.; Inoue, S. Extraction method using sinusoidal waves to simplify earthquake ground motion. Jpn. Archit. Rev. 2018, 1, 322–330. [Google Scholar] [CrossRef]
- Makris, N.; Roussos, Y. Rocking Response and Overturning of Equipment under Horizontal Pulse-Type Motions; Pacific Earthquake Engineering Research Center: Berkeley, CA, USA, 1998. [Google Scholar]
- Francaviglia, V.; Augusti, G.; Sepe, V. Did Earthquakes fell Aksum obelisks? Ann. Geophys.-Italy 1995, 38, 983–1000. [Google Scholar]
- Erdik, M.; Durukal, E.; Ertürk, N.; Sungay, B. Earthquake risk mitigation in Istanbul museums. Nat. Hazards 2010, 53, 97–108. [Google Scholar] [CrossRef]
- Ambraseys, N.; Psycharis, I.N. Earthquake Stability of Columns and Statues. J. Earthq. Eng. 2011, 15, 685–710. [Google Scholar] [CrossRef]
- Galadini, F.; Hinzen, K.G.; Stiros, S. Archaeoseismology: Methodological issues and procedure. J. Seismol. 2006, 10, 395–414. [Google Scholar] [CrossRef] [Green Version]
- Sintubin, M. Archaeoseismology: Past, present and future. Quatern. Int. 2011, 242, 4–10. [Google Scholar] [CrossRef]
- Anooshehpoor, A.; Heaton, T.H.; Shi, B.; Brune, J.N. Estimates of the ground accelerations at Point Reyes Station during the 1906 San Francisco earthquake. Bull. Seismol. Soc. Am. 1999, 89, 845–853. [Google Scholar]
- Hinzen, K.G. Simulation of toppling columns in archaeoseismology. Bull. Seismol. Soc. Am. 2009, 99, 2855–2875. [Google Scholar] [CrossRef]
- De Silva, F.; Sica, S.; Silvestri, F.; Aversa, S. Estimation of the ground shaking from the response of rigid bodies. Ann. Geophy. 2016, 59. [Google Scholar] [CrossRef]
- Anooshehpoor, A.; Brune, J.N.; Zeng, Y. Methodology for obtaining constraints on ground motion from precariously balanced rocks. Bull. Seismol. Soc. Am. 2004, 94, 285–303. [Google Scholar] [CrossRef]
- Casapulla, C.; Giresini, L.; Lourenço, P.B. Rocking and kinematic approaches for rigid block analysis of masonry walls: State of the art and recent developments. Buildings 2017, 7, 69. [Google Scholar] [CrossRef] [Green Version]
- Tabbara, M.; Karam, G. Experimental, numerical and theoretical investigation of the rocking response of Baalbek columns under harmonic excitations. J. Earthq. Eng. 2019. [Google Scholar] [CrossRef]
- Drosos, V.; Anastasopoulos, I. Shaking Table Testing of Multidrum Columns and Portals. Earthq. Eng. Struct. Dyn. 2014, 43, 1703–1723. [Google Scholar] [CrossRef]
- Itasca Consulting Group Inc. UDEC-Universal Distinct Element Code, Version 6.0–User’s Guide; Itasca: Minneapolis, MN, USA, 2014. [Google Scholar]
- Tabbara, M.; Karam, G. Experimental Investigation of the Stability of Colonnades under Harmonic Excitation. In Proceedings of the 16th European Conference on Earthquake Engineering (16ECEE), Thessaloniki, Greece, 18–21 June 2018. [Google Scholar]
- Psycharis, I.; Papastamatiou, D.; Alexandris, A. Parametric Investigation of the Stability of Classical Columns under Harmonic and Earthquake Excitations. Earthq. Eng. Struct. Dyn. 2000, 29, 1093–1109. [Google Scholar] [CrossRef]
- Dimitri, R.; Lorenzis, L.; Zavarise, G. Numerical Study on the Dynamic Behavior of Masonry Columns and Arches on Buttresses with the Discrete Element Method. Eng. Struct. 2011, 33, 3172–3188. [Google Scholar] [CrossRef]
- Makris, N.; Kampas, G. Size versus slenderness: Two competing parameters in the seismic stability of free-standing rocking columns. Bull. Seismol. Soc. Am. 2016, 106, 104–122. [Google Scholar] [CrossRef]
- Ther, T.; Kollar, L. Refinement of Housner’s Model on Rocking Blocks. Bull. Earthq. Eng. 2017, 15, 2305–2319. [Google Scholar] [CrossRef]
- Tabbara, M.; Karam, G.; Jello, J.; Beaino, C. Numerical Investigation of the Wobbling Response of a Free Standing Multi-drum Column under Harmonic Excitations. Presented at the 9th Turkish Conference on Earthquake Engineering (9TCEE), Istanbul, Turkey, 1–3 June 2020. Postponed to June 2021 due to COVID19. [Google Scholar]
- Tabbara, M.; Karam, G.; Jello, J.; Beaino, C. Rocking, Wobbling and Overturning of the Multi-drum Columns of Baalbek under Periodic Pulses. J. Seismol. 2020. submitted. [Google Scholar]
- Ohnaka, M. Frictional Characteristics of Typical Rocks. J. Phys. Earth 1975, 23, 87–112. [Google Scholar] [CrossRef] [Green Version]
- Foti, D.; Vacca, V. Rocking of Multiblock Stone Classical Columns. Earthq. Resist. Eng. Struct. 2017, 172, 1. [Google Scholar]
- Anderson, J.G.; Biasi, G.P.; Brune, J.N. Precarious rocks: Providing upper limits on past ground shaking from earthquakes. In Earthquake Hazard, Risk and Disasters; Shroder, J.F., Wyss, M., Eds.; Elsevier: Amsterdam, The Netherlands, 2014; pp. 377–403. [Google Scholar]
- Ther, T.; Kollár, L.P. Model for multiblock columns subjected to base excitation. Earthq. Eng. Struct. Dyn. 2018, 47, 418–437. [Google Scholar] [CrossRef]
- Kounadis, A.N. On the rocking–sliding instability of rigid blocks under ground excitation: Some new findings. Soil Dyn. Earthq. Eng. 2015, 75, 246–258. [Google Scholar] [CrossRef]
- Kavvadias, I.E.; Vasiliadis, L.K.; Elenas, A. Seismic response parametric study of ancient rocking columns. Int. J. Archit. Herit. 2017, 11, 791–804. [Google Scholar] [CrossRef]
- Pappas, A.; Sextos, A.; Da Porto, F.; Modena, C. Efficiency of alternative intensity measures for the seismic assessment of monolithic free-standing columns. Bull. Earthq. Eng. 2017, 15, 1635–1659. [Google Scholar] [CrossRef]
- DeJong, M.J. Seismic Assessment Strategies for Masonry Structures. Chapter 6: Analytical Modeling: Rocking Structures. Ph.D. Thesis, Massachusetts Institute of Technology, Cambridge, MA, USA, 2009. [Google Scholar]
Figure 1.
Rocking Block after Housner [1].
Figure 1.
Rocking Block after Housner [1].

Figure 2.
(a) Safe–unsafe boundary for half sine impulse signal and (b) shape of critical half-sine impulses.
Figure 2.
(a) Safe–unsafe boundary for half sine impulse signal and (b) shape of critical half-sine impulses.

Figure 3.
(a) Schematic of the numerical model. (b) Calculation cycle steps for the distinct element method.
Figure 3.
(a) Schematic of the numerical model. (b) Calculation cycle steps for the distinct element method.


Figure 4.
Normalized numerical results for all three block sizes under harmonic pulses.

Figure 5.
Harmonic, linear, and step acceleration periodic pulses with period T.

Figure 6.
Normalized numerical results for all three types of pulses for the 1 m block.

Figure 7.
Experimental results for 0.5 m solid cylinder compared to theoretical and UDEC model for 0.5 m block after [79].
Figure 7.
Experimental results for 0.5 m solid cylinder compared to theoretical and UDEC model for 0.5 m block after [79].

Figure 8.
Safe–unsafe boundary for half sine impulse drawn on top of the overturning acceleration spectrum of the freestanding rocking column with tan α = 0.25 when it is subjected to a one-sine acceleration pulse after Makris and Kampas [82].
Figure 8.
Safe–unsafe boundary for half sine impulse drawn on top of the overturning acceleration spectrum of the freestanding rocking column with tan α = 0.25 when it is subjected to a one-sine acceleration pulse after Makris and Kampas [82].

Figure 9.
Safe–unsafe boundary for half sine impulse drawn on top of the overturning acceleration spectrum of the freestanding rocking block with tan α = 0.25 under a harmonic acceleration forcing function after Figure 4 of Spanos and Koh [8] (permission requested).

Figure 10.
Comparison of the experimentally observed Peak Ground Acceleration (PGA) in plots a, c, and d of Figure 7 in Purvance et al. [31] with the safe–unsafe boundary for half step impulse.


Table 1.
Critical combinations for 0.5 m block UDEC simulation.
| T (s) | Velocity Amplitude (m/s) | Acceleration Amplitude (g) | Block, 0.5 m, 25 cycles, Displacement History (Base and Top) |
|---|---|---|---|
| 0.2 | 0.091 | 0.2914 |  |
| 0.3 | 0.086 | 0.1836 |  |
| 0.4 | 0.065 | 0.1041 |  |
| 0.6 | 0.096 | 0.1025 |  |
| 0.9 | 0.144 | 0.1025 |  |
| 1.5 | 0.243 | 0.1038 |  |
Table 2.
Critical combinations for 1 m block UDEC simulation.
| T (s) | Velocity Amplitude (m/s) | Acceleration Amplitude (g) | Block, 1 m, 25 cycles, Displacement History (Base and Top) |
|---|---|---|---|
| 0.3 | 0.127 | 0.2711 |  |
| 0.4 | 0.116 | 0.1857 |  |
| 0.5 | 0.092 | 0.1178 |  |
| 0.6 | 0.097 | 0.1035 |  |
| 1.0 | 0.164 | 0.1050 |  |
| 1.5 | 0.248 | 0.1059 |  |
© 2020 by the authors. Licensee MDPI, Basel, Switzerland. This article is an open access article distributed under the terms and conditions of the Creative Commons Attribution (CC BY) license (http://creativecommons.org/licenses/by/4.0/).
Share and Cite
MDPI and ACS Style
Karam, G.; Tabbara, M. Rocking Blocks Stability under Critical Pulses from Near-Fault Earthquakes Using a Novel Energy Based Approach. Appl. Sci. 2020, 10, 5924. https://0-doi-org.brum.beds.ac.uk/10.3390/app10175924
AMA Style
Karam G, Tabbara M. Rocking Blocks Stability under Critical Pulses from Near-Fault Earthquakes Using a Novel Energy Based Approach. Applied Sciences. 2020; 10(17):5924. https://0-doi-org.brum.beds.ac.uk/10.3390/app10175924
Chicago/Turabian StyleKaram, Gebran, and Mazen Tabbara. 2020. "Rocking Blocks Stability under Critical Pulses from Near-Fault Earthquakes Using a Novel Energy Based Approach" Applied Sciences 10, no. 17: 5924. https://0-doi-org.brum.beds.ac.uk/10.3390/app10175924
Note that from the first issue of 2016, this journal uses article numbers instead of page numbers. See further details here.