Establishing Correlations between Breast Tumor Response to Radio-Immunotherapy and Radiomics from Multi-Parametric Imaging: An Animal Study

 ,
,  ,
,
Abstract
:1. Introduction
2. Materials and Methods
2.1. Preparation of Cell Suspension
2.2. Animal Model
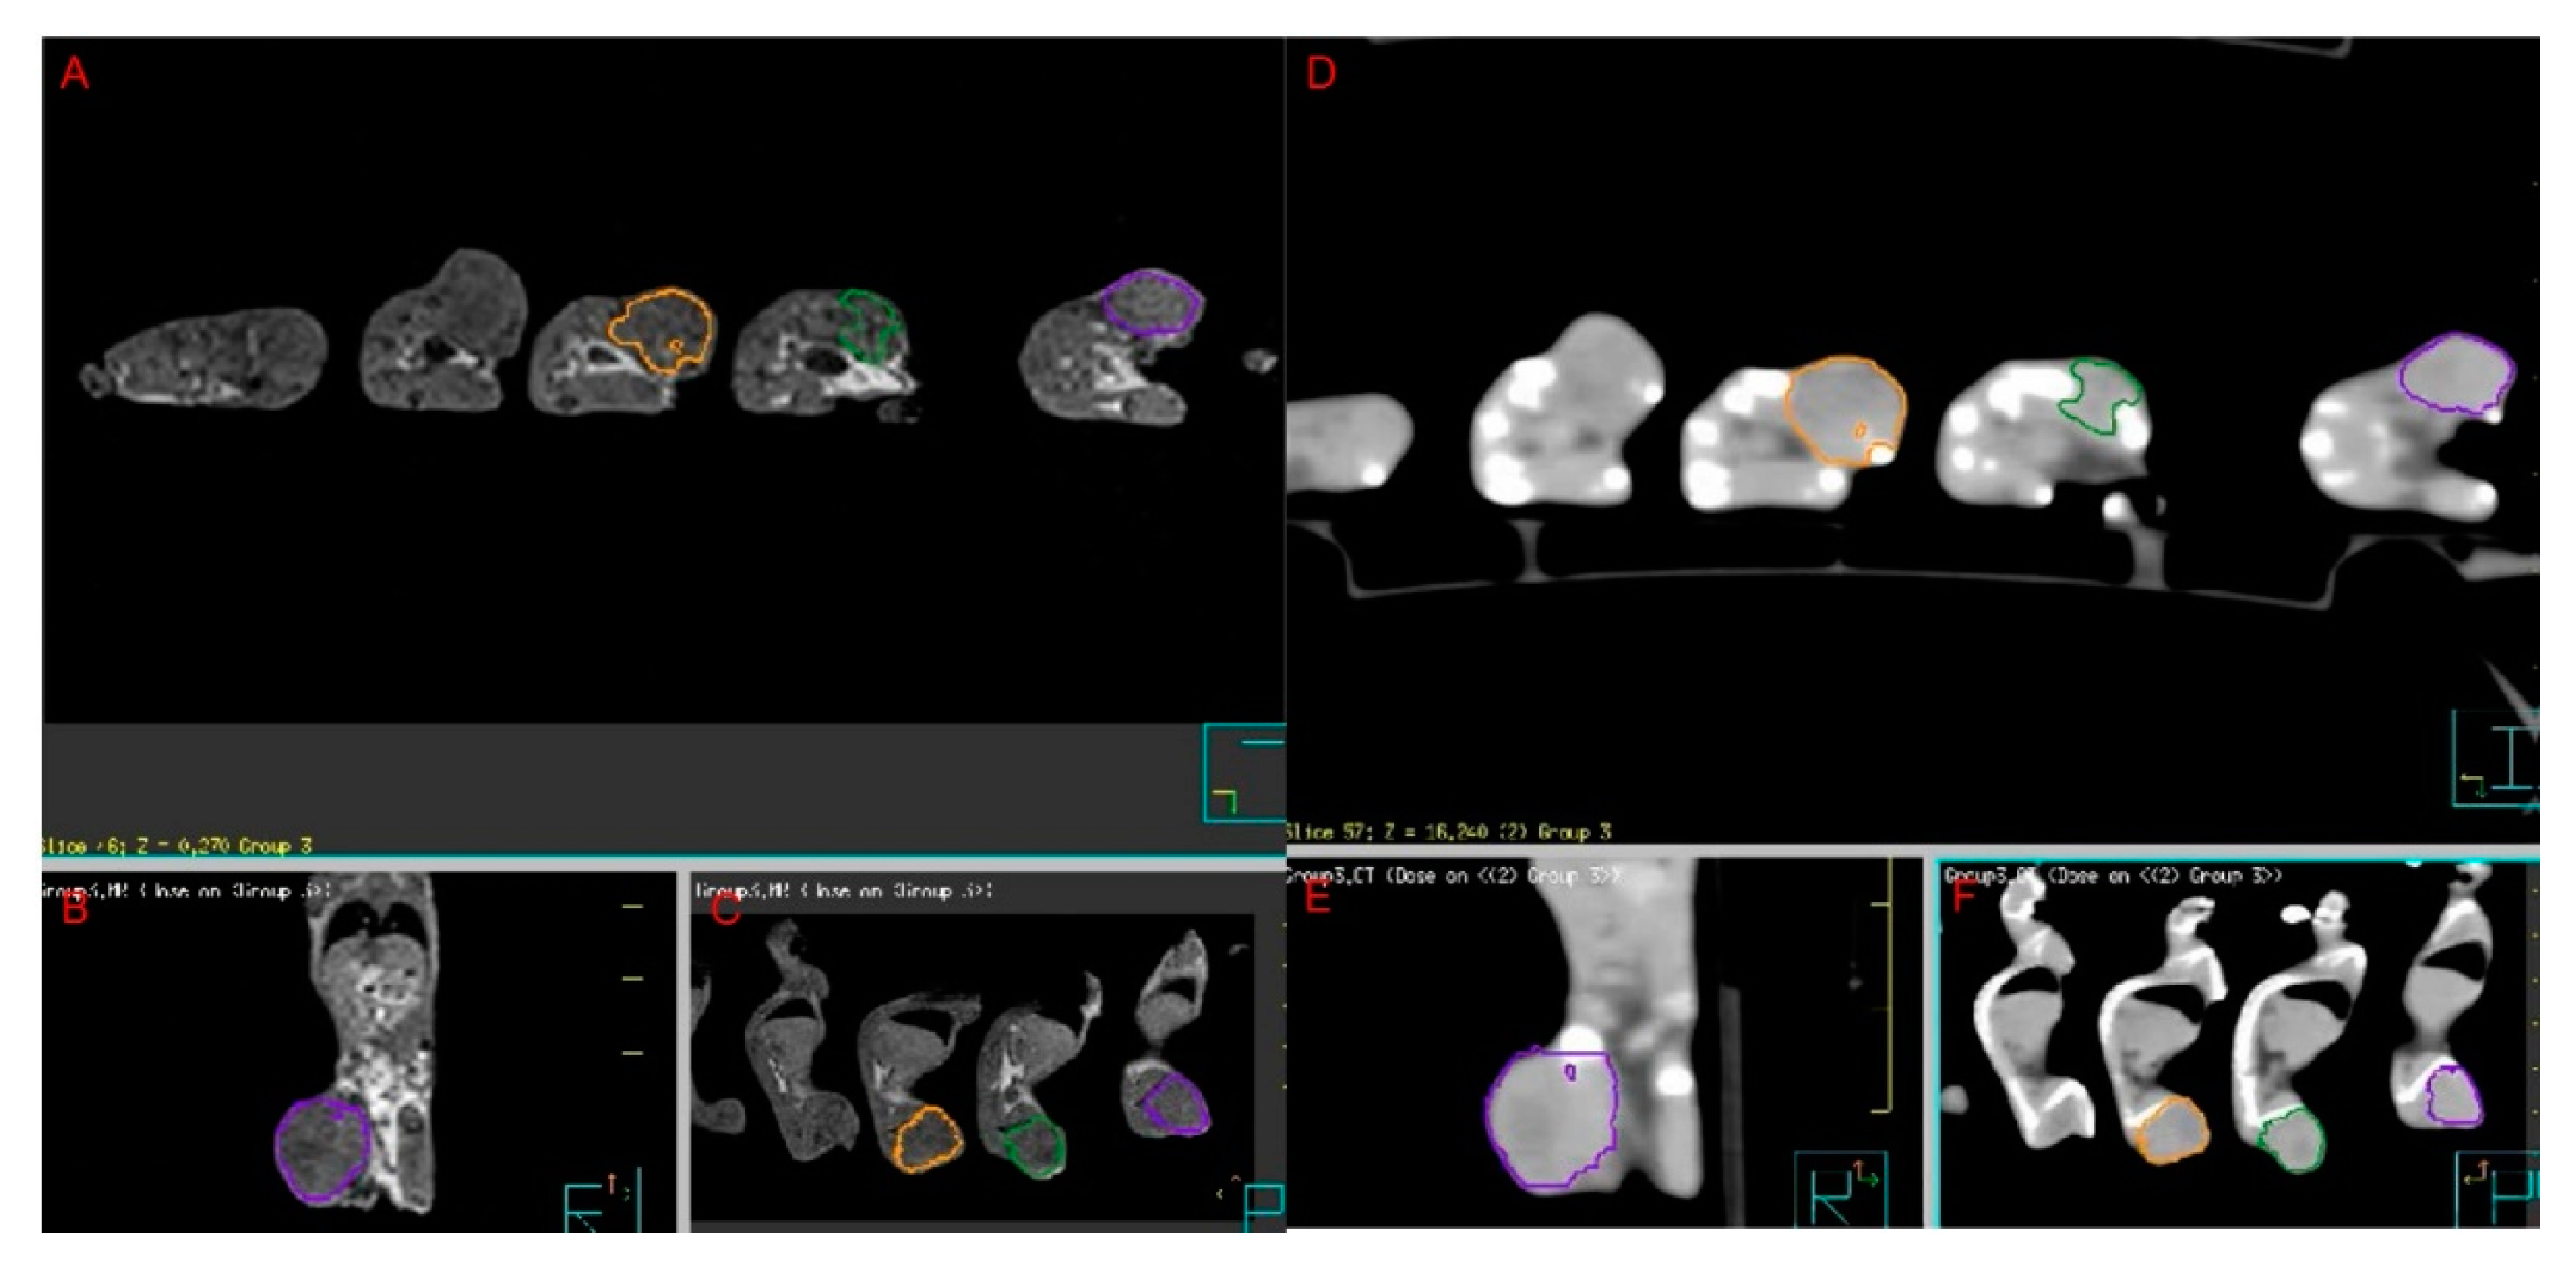
2.3. Imaging
2.4. Radiomics
2.5. Treatment
2.6. Histology
2.7. Imaging Feature Selection
3. Results
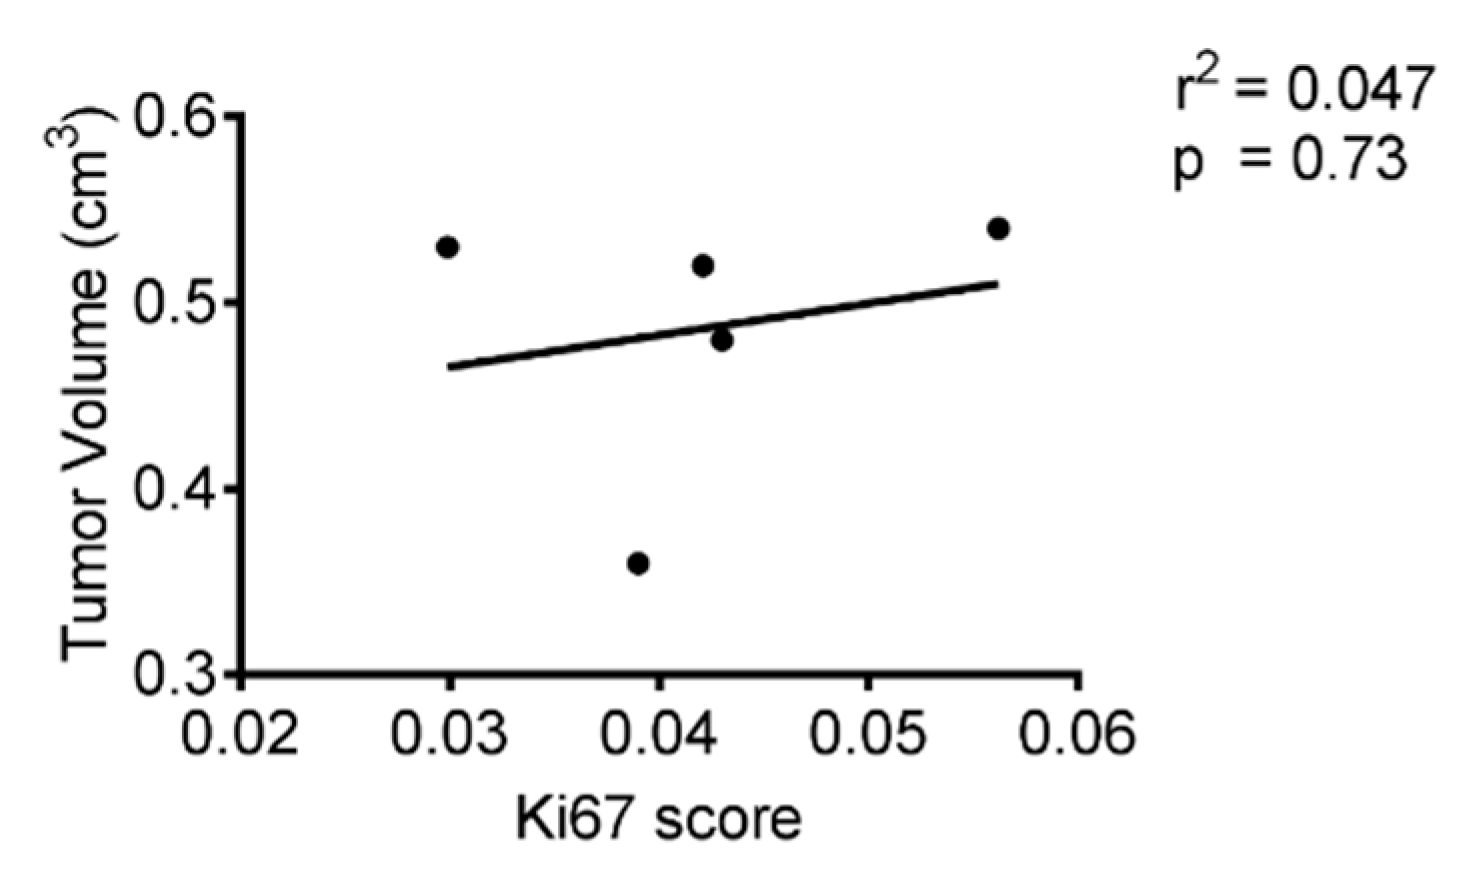
3.1. Describing the Correlation between the Tumor Volume and Ki-67
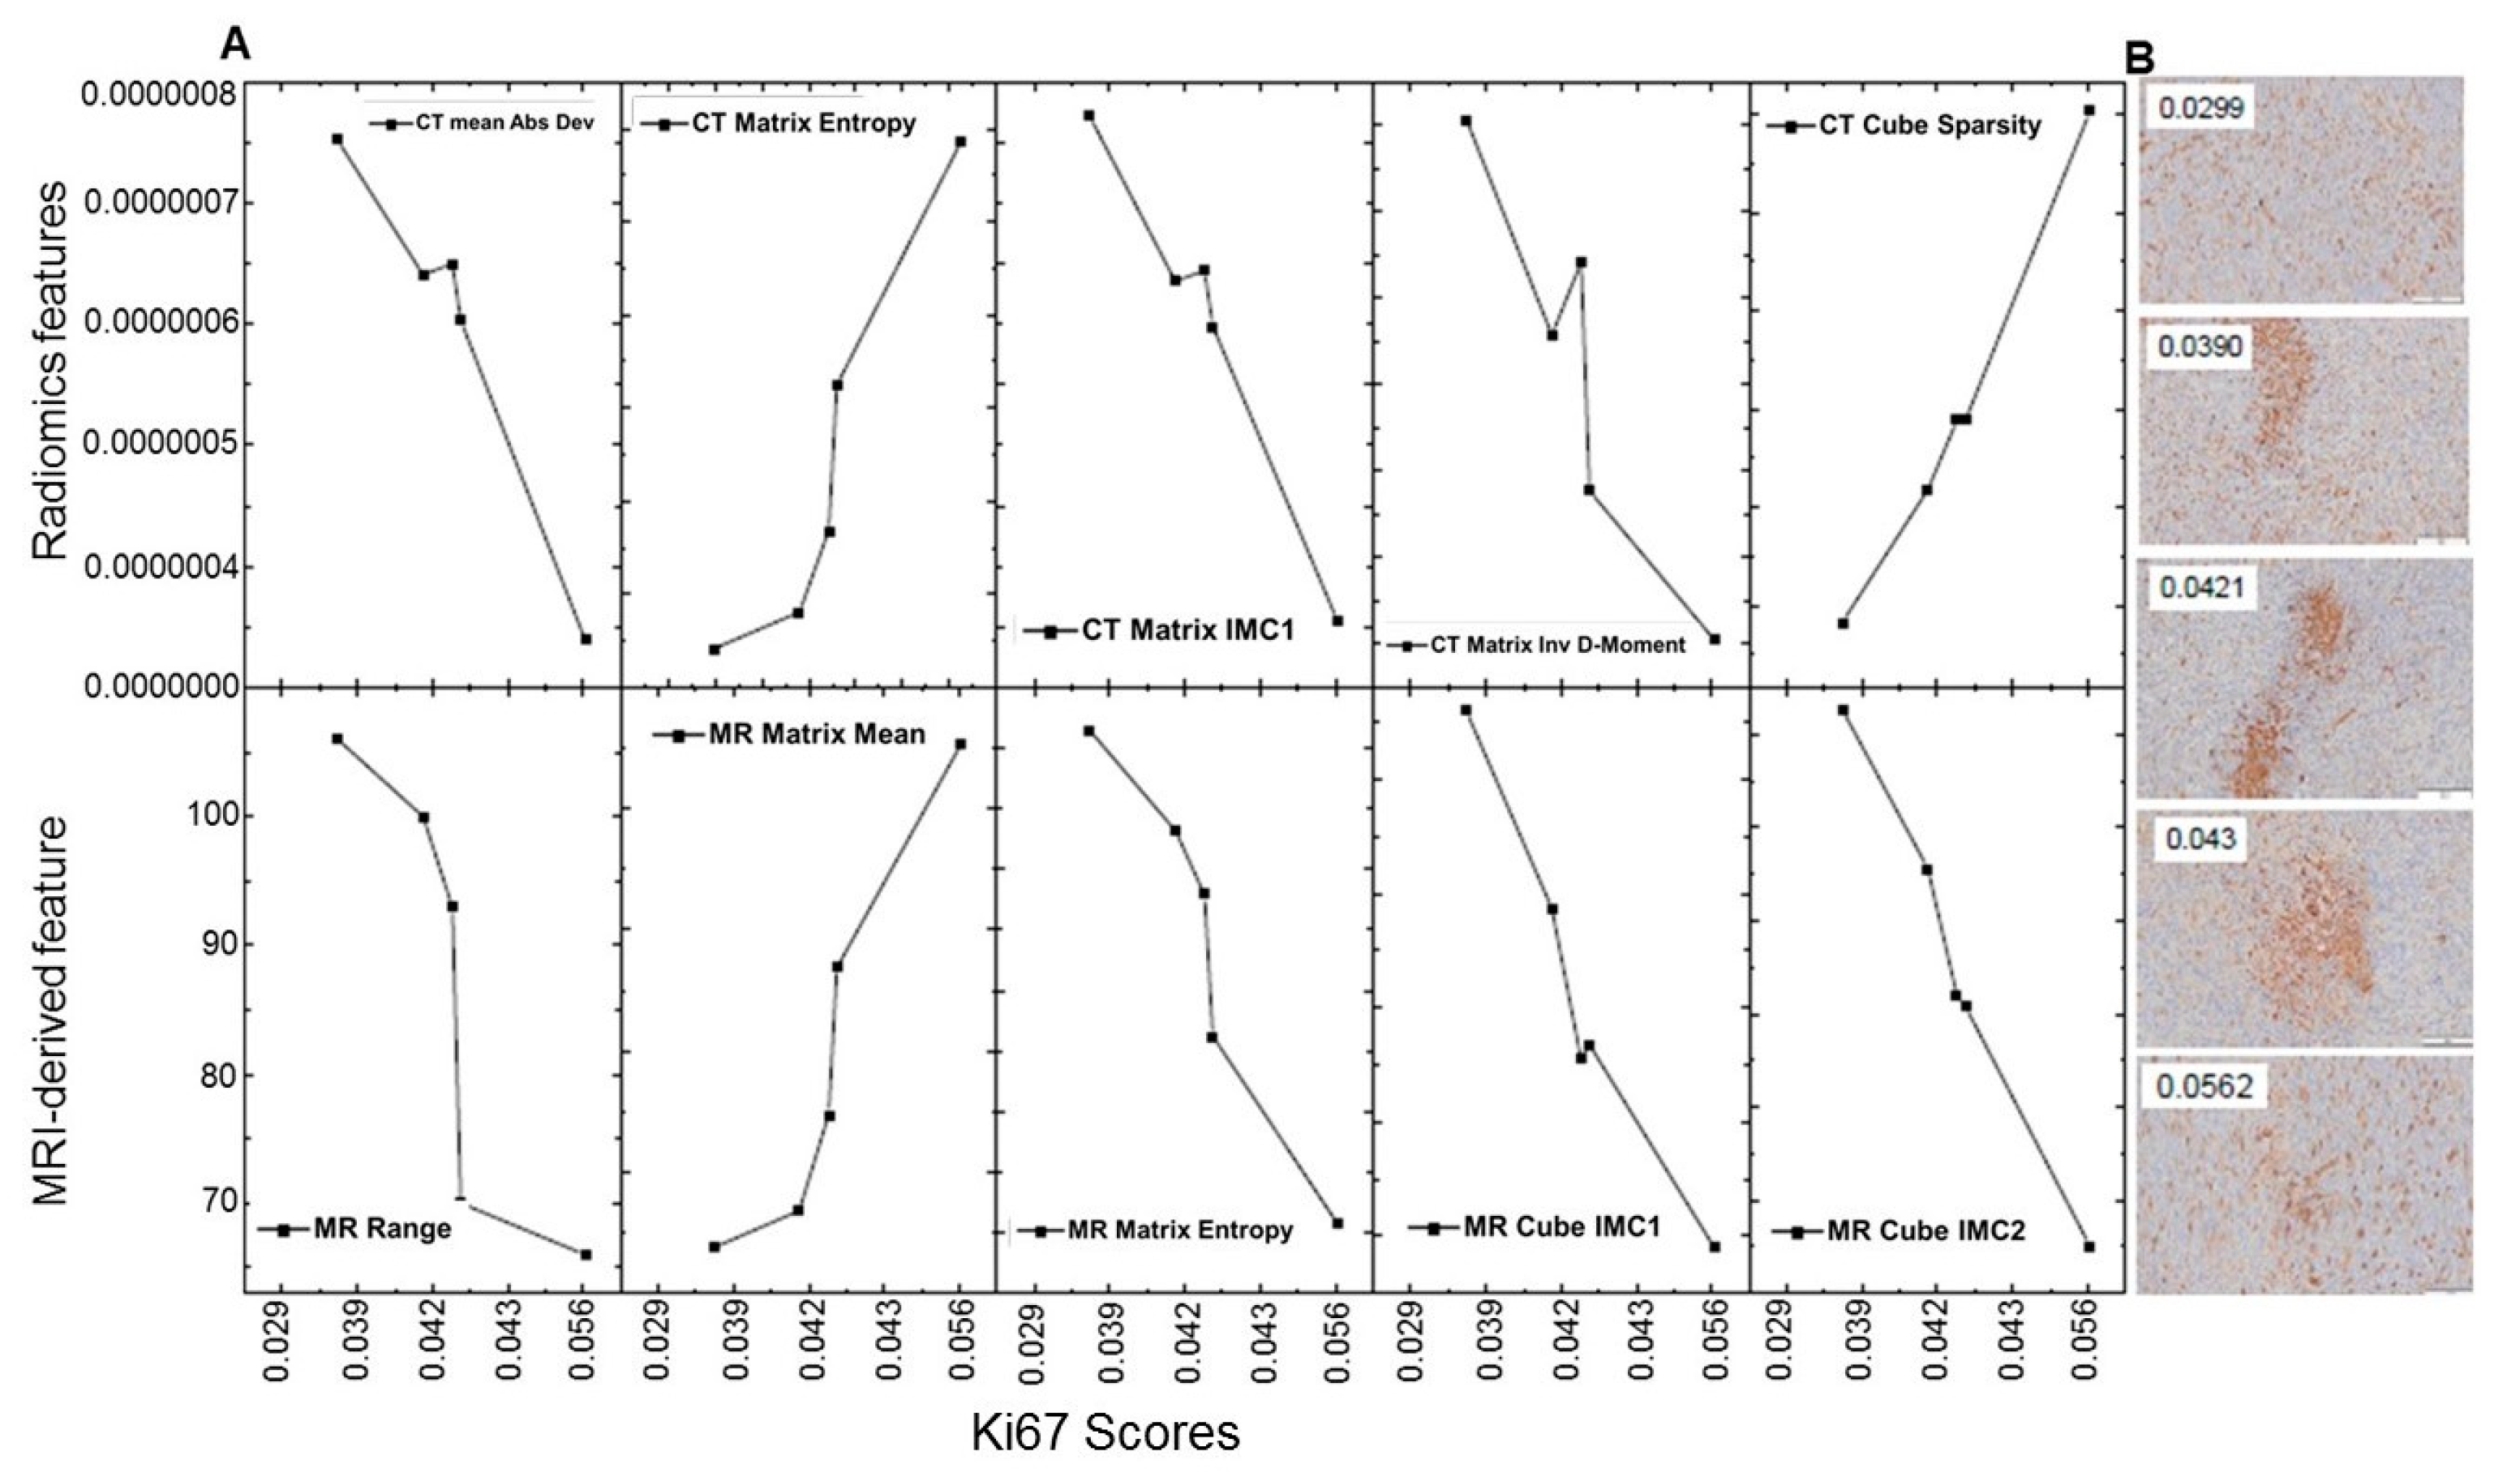
3.2. Correlation between Seven CT, Twenty-Four MRI Features and Ki-67 Score
4. Discussion
5. Conclusions
Supplementary Materials
Author Contributions
Funding
Acknowledgments
Conflicts of Interest
References
- Stagg, J.; Allard, B. Immunotherapeutic approaches in triple-negative breast cancer: Latest research and clinical prospects. Ther. Adv. Med. Oncol. 2013, 5, 169–181. [Google Scholar] [CrossRef] [PubMed] [Green Version]
- Eriksson, D.; Stigbrand, T. Radiation-induced cell death mechanisms. Tumour Biol. 2010, 31, 363–372. [Google Scholar] [CrossRef] [PubMed]
- Park, W.; Kwon, D.; Saravia, D.; Desai, A.; Vargas, F.; El Dinali, M.; Warsch, J.; Elias, R.; Chae, Y.K.; Kim, D.W.; et al. Developing a Predictive Model for Clinical Outcomes of Advanced Non-Small Cell Lung Cancer Patients Treated With Nivolumab. Clin. Lung Cancer 2018, 19, 280–288.e284. [Google Scholar] [CrossRef] [PubMed]
- Sharabi, A.B.; Nirschl, C.J.; Kochel, C.M.; Nirschl, T.R.; Francica, B.J.; Velarde, E.; Deweese, T.L.; Drake, C.G. Stereotactic Radiation Therapy Augments Antigen-Specific PD-1-Mediated Antitumor Immune Responses via Cross-Presentation of Tumor Antigen. Cancer Immunol. Res. 2015, 3, 345–355. [Google Scholar] [CrossRef] [Green Version]
- Dovedi, S.J.; Adlard, A.L.; Lipowska-Bhalla, G.; McKenna, C.; Jones, S.; Cheadle, E.J.; Stratford, I.J.; Poon, E.; Morrow, M.; Stewart, R.; et al. Acquired resistance to fractionated radiotherapy can be overcome by concurrent PD-L1 blockade. Cancer Res. 2014, 74, 5458–5468. [Google Scholar] [CrossRef] [Green Version]
- Hu, Z.S.I.; McArthur, H.L.; Ho, A.Y. The Abscopal Effect of Radiation Therapy: What Is It and How Can We Use It in Breast Cancer? Curr. Breast Cancer Rep. 2017, 9, 45–51. [Google Scholar] [CrossRef] [Green Version]
- Liu, Y.; Dong, Y.P.; Kong, L.; Shi, F.; Zhu, H.; Yu, J.M. Abscopal effect of radiotherapy combined with immune checkpoint inhibitors. J. Hematol. Oncol. 2018, 11, 104. [Google Scholar] [CrossRef] [Green Version]
- Ngwa, W.; Irabor, O.C.; Schoenfeld, J.D.; Hesser, J.; Demaria, S.; Formenti, S.C. Using immunotherapy to boost the abscopal effect. Nat. Rev. Cancer 2018, 18, 313–322. [Google Scholar] [CrossRef]
- Gillies, R.J.; Kinahan, P.E.; Hricak, H. Radiomics: Images Are More than Pictures, They Are Data. Radiology 2016, 278, 563–577. [Google Scholar] [CrossRef] [Green Version]
- Lambin, P.; Rios-Velazquez, E.; Leijenaar, R.; Carvalho, S.; van Stiphout, R.G.P.M.; Granton, P.; Zegers, C.M.L.; Gillies, R.; Boellard, R.; Dekker, A.; et al. Radiomics: Extracting more information from medical images using advanced feature analysis. Eur. J. Cancer 2012, 48, 441–446. [Google Scholar] [CrossRef] [Green Version]
- Trebeschi, S.; Drago, S.G.; Birkbak, N.J.; Kurilova, I.; Calin, A.M.; Pizzi, A.D.; Lalezari, F.; Lambregts, D.M.J.; Rohaan, M.; Parmar, C.; et al. Predicting Response to Cancer Immunotherapy using Non-invasive Radiomic Biomarkers. Ann. Oncol. 2019, 30, 998–1004. [Google Scholar] [CrossRef] [PubMed] [Green Version]
- Tunali, I.; Gray, J.E.; Qi, J.; Abdalah, M.; Jeong, D.K.; Guvenis, A.; Gillies, R.J.; Schabath, M.B. Novel clinical and radiomic predictors of rapid disease progression phenotypes among lung cancer patients treated with immunotherapy: An early report. Lung Cancer 2019, 129, 75–79. [Google Scholar] [CrossRef] [PubMed]
- Spieler, B.; Azzam, G.; Asher, D.; Lopes, G.; Saravia, D.; Kwon, D.; Yechieli, R.; Dal Pra, A.; Diwanji, T.; Mihaylov, I.B. Overall Survival of Patients with Advanced NSCLC Treated with Nivolumab Correlates with Texture Features on Pre-Immunotherapy CT Imaging and Radiotherapy History. Int. J. Radiat. Oncol. Biol. Phys. 2019, 105, E531–E532. [Google Scholar] [CrossRef] [Green Version]
- Spieler, B.O.; Saravia, D.; Lopes, G.; Azzam, G.; Kwon, D.; Dal Pra, A.; Yechieli, R.; Diwanji, T.; Mihaylov, I. Can texture analysis of pre-immunotherapy CT imaging predict clinical outcomes for patients with advanced NSCLC treated with Nivolumab? J. Clin. Oncol. 2019, 37, e20720. [Google Scholar] [CrossRef]
- Demaria, S.; Golden, E.B.; Formenti, S.C. Role of Local Radiation Therapy in Cancer Immunotherapy. JAMA Oncol. 2015, 1, 1325–1332. [Google Scholar] [CrossRef]
- Reynders, K.; Illidge, T.; Siva, S.; Chang, J.Y.; De Ruysscher, D. The abscopal effect of local radiotherapy: Using immunotherapy to make a rare event clinically relevant. Cancer Treat. Rev. 2015, 41, 503–510. [Google Scholar] [CrossRef] [Green Version]
- Padgett, K.; Mihaylov, I. Radiomics Feature Variability On 0.35T MR-Guided-RT System. Med. Phys. 2017, 44, 3148. [Google Scholar]
- Leijenaar, R.T.; Carvalho, S.; Velazquez, E.R.; van Elmpt, W.J.; Parmar, C.; Hoekstra, O.S.; Hoekstra, C.J.; Boellaard, R.; Dekker, A.L.; Gillies, R.J.; et al. Stability of FDG-PET Radiomics features: An integrated analysis of test-retest and inter-observer variability. Acta Oncol. 2013, 52, 1391–1397. [Google Scholar] [CrossRef] [Green Version]
- Do, Q.N.; Lewis, M.A.; Madhuranthakam, A.J.; Xi, Y.; Bailey, A.A.; Lenkinski, R.E.; Twickler, D.M. Texture analysis of magnetic resonance images of the human placenta throughout gestation: A feasibility study. PLoS ONE 2019, 14, e0211060. [Google Scholar] [CrossRef] [Green Version]
- Loizou, C.P.; Pantziaris, M.; Pattichis, C.S.; Seimenis, I. Brain MR image normalization in texture analysis of multiple sclerosis. J. Biomed. Graph. Comput. 2012, 3. [Google Scholar] [CrossRef]
- Sun, X.F.; Shi, L.; Luo, Y.S.; Yang, W.; Li, H.P.; Liang, P.P.; Li, K.C.; Mok, V.C.T.; Chu, W.C.W.; Wang, D.F. Histogram-based normalization technique on human brain magnetic resonance images from different acquisitions. Biomed. Eng. Online 2015, 14, 73. [Google Scholar] [CrossRef] [PubMed] [Green Version]
- Anderson, A.R.; Weaver, A.M.; Cummings, P.T.; Quaranta, V. Tumor morphology and phenotypic evolution driven by selective pressure from the microenvironment. Cell 2006, 127, 905–915. [Google Scholar] [CrossRef] [PubMed] [Green Version]


| Feature | Pearson Correlation Coefficient | Significance | Variance of Pearson Correlation Coefficient |
|---|---|---|---|
| Mean Abs Dev 3D | 0.94 | 0.007 | 2.4 × 10⁻³ |
| Matrix IMC1 | 0.983 | 0.003 | 2.6 × 10⁻³ |
| Matrix IMC2 | −0.893 | 0.041 | 2.8 × 10⁻⁴ |
| Matrix Inverse Difference Moment Normalized | −0.926 | 0.024 | 9.4 × 10⁻³ |
| Matrix Inverse Difference Normalized | −0.951 | 0.013 | 5.7 × 10⁻² |
| Cube Sparsity | 0.987 | 0.002 | 5.2 × 10⁻² |
| Cube IMC1 | 0.988 | 0.001 | 4.9 × 10⁻³ |
| Feature | Pearson Correlation Coefficient | Significance | Variance of Pearson Correlation Coefficient |
|---|---|---|---|
| Mean Abs Dev 2D | 0.977 | 0.004 | 8.6 × 10⁻⁶ |
| Root Min Square 2D | 0.964 | 0.008 | 8.0 × 10⁻⁵ |
| Entropy 2D | 0.971 | 0.006 | 6.3 × 10⁻⁵ |
| Uniformity 2D | 0.964 | 0.008 | 7.6 × 10⁻⁵ |
| Kurtosis 2D | 0.900 | 0.008 | 8.5 × 10⁻⁵ |
| Skewness 2D | 0.922 | 0.026 | 6.7 × 10⁻⁵ |
| Matrix Mean | 0.997 | 0.045 | 3.7 × 10⁻⁴ |
| Matrix Variance | 0.932 | 0.021 | 4.1 × 10⁻⁵ |
| Matrix Entropy | −0.960 | 0.01 | 4.9 × 10⁻⁵ |
| Matrix Energy | 0.957 | 0.011 | 7.0 × 10⁻⁵ |
| Matrix IMC1 | 0.967 | 0.007 | 1.2 × 10⁻⁴ |
| Matrix IMC2 | −0.984 | 0.002 | 1.9 × 10⁻⁴ |
| Matrix Cluster Prominence | −0.940 | 0.017 | 1.3 × 10⁻⁴ |
| Matrix Cluster Contrast | −0.908 | 0.033 | 1.6 × 10⁻⁵ |
| Matrix Cluster Tendency | −0.961 | 0.009 | 7.2 × 10⁻⁵ |
| Matrix Cluster Homogeneity1 | −0.931 | 0.022 | 9.6 × 10⁻⁶ |
| Matrix Cluster Homogeneity2 | −0.908 | 0.033 | 1.6 × 10⁻⁵ |
| Cube Variance | 0.928 | 0.023 | 4.6 × 10⁻³ |
| Cube Entropy | −0.954 | 0.012 | 1.8 × 10⁻² |
| Cube Energy | 0.956 | 0.011 | 6.9 × 10⁻⁵ |
| Cube IMC1 | 0.974 | 0.005 | 4.8 × 10⁻³ |
| Cube IMC2 | −0.991 | 0.001 | 2.5 × 10⁻⁴ |
| Cube Cluster Prominence | −0.944 | 0.016 | 1.8 × 10⁻³ |
| Cube Cluster Tendency | −0.961 | 0.009 | 1.7 × 10⁻³ |
© 2020 by the authors. Licensee MDPI, Basel, Switzerland. This article is an open access article distributed under the terms and conditions of the Creative Commons Attribution (CC BY) license (http://creativecommons.org/licenses/by/4.0/).
Share and Cite
Ahmad, A.; Totiger, T.M.; Benaduce, A.P.; Marples, B.; Mihaylov, I.B. Establishing Correlations between Breast Tumor Response to Radio-Immunotherapy and Radiomics from Multi-Parametric Imaging: An Animal Study. Appl. Sci. 2020, 10, 6493. https://0-doi-org.brum.beds.ac.uk/10.3390/app10186493
Ahmad A, Totiger TM, Benaduce AP, Marples B, Mihaylov IB. Establishing Correlations between Breast Tumor Response to Radio-Immunotherapy and Radiomics from Multi-Parametric Imaging: An Animal Study. Applied Sciences. 2020; 10(18):6493. https://0-doi-org.brum.beds.ac.uk/10.3390/app10186493
Chicago/Turabian StyleAhmad, Anis, Tulasigeri M. Totiger, Ana Paula Benaduce, Brian Marples, and Ivaylo Bodganov Mihaylov. 2020. "Establishing Correlations between Breast Tumor Response to Radio-Immunotherapy and Radiomics from Multi-Parametric Imaging: An Animal Study" Applied Sciences 10, no. 18: 6493. https://0-doi-org.brum.beds.ac.uk/10.3390/app10186493