Characteristics of Crack Growth in Rock-Like Materials under Monotonic and Cyclic Loading Conditions


1
TBM Team, SK E&C, Seoul 03149, Korea
2
Department of Earth Resources and Environmental Engineering, Hanyang University, Seoul 04763, Korea
*
Author to whom correspondence should be addressed.
Appl. Sci. 2020, 10(2), 719; https://0-doi-org.brum.beds.ac.uk/10.3390/app10020719
Submission received: 16 December 2019
/
Revised: 16 January 2020
/
Accepted: 17 January 2020
/
Published: 20 January 2020
(This article belongs to the Special Issue Structural Performances of Concrete Composite Members: Experimental, Theoretical, Numerical Approaches)
Abstract
:Experiments with gypsum as a model rock material were conducted to investigate the characteristics of crack growth under monotonic and cyclic loading. The specimens had two pre-existing flaws that were placed at different inclination angle, spacing and continuity. Tensile or wing cracks and secondary or shear cracks were observed in both the monotonic and cyclic tests. Wing cracks or tensile cracks initiated at (or near) the tips of flaws and grew parallel to the loading direction. Secondary or shear cracks occurred after initiation of the wing crack and culminated in a final failure. Secondary cracks started at the tips of flaws and propagated in the colinear direction of flaws or perpendicular to loading. Six types of coalescence were observed. Both the monotonic and cyclic tests showed almost identical coalescence types. Coalescence occurred due to the internal shear cracks in specimens containing colinear flaws, while it occurred through combinations of internal shear cracks, internal wing cracks and tension cracks in specimens with non-colinear flaws. Fatigue cracks occurred in tests under cyclic loads. Finally, the subcritical crack growth parameters under monotonic and cyclic loading were determined. Although there were variations in the parameters, the parameter “n” showed similar values.
1. Introduction
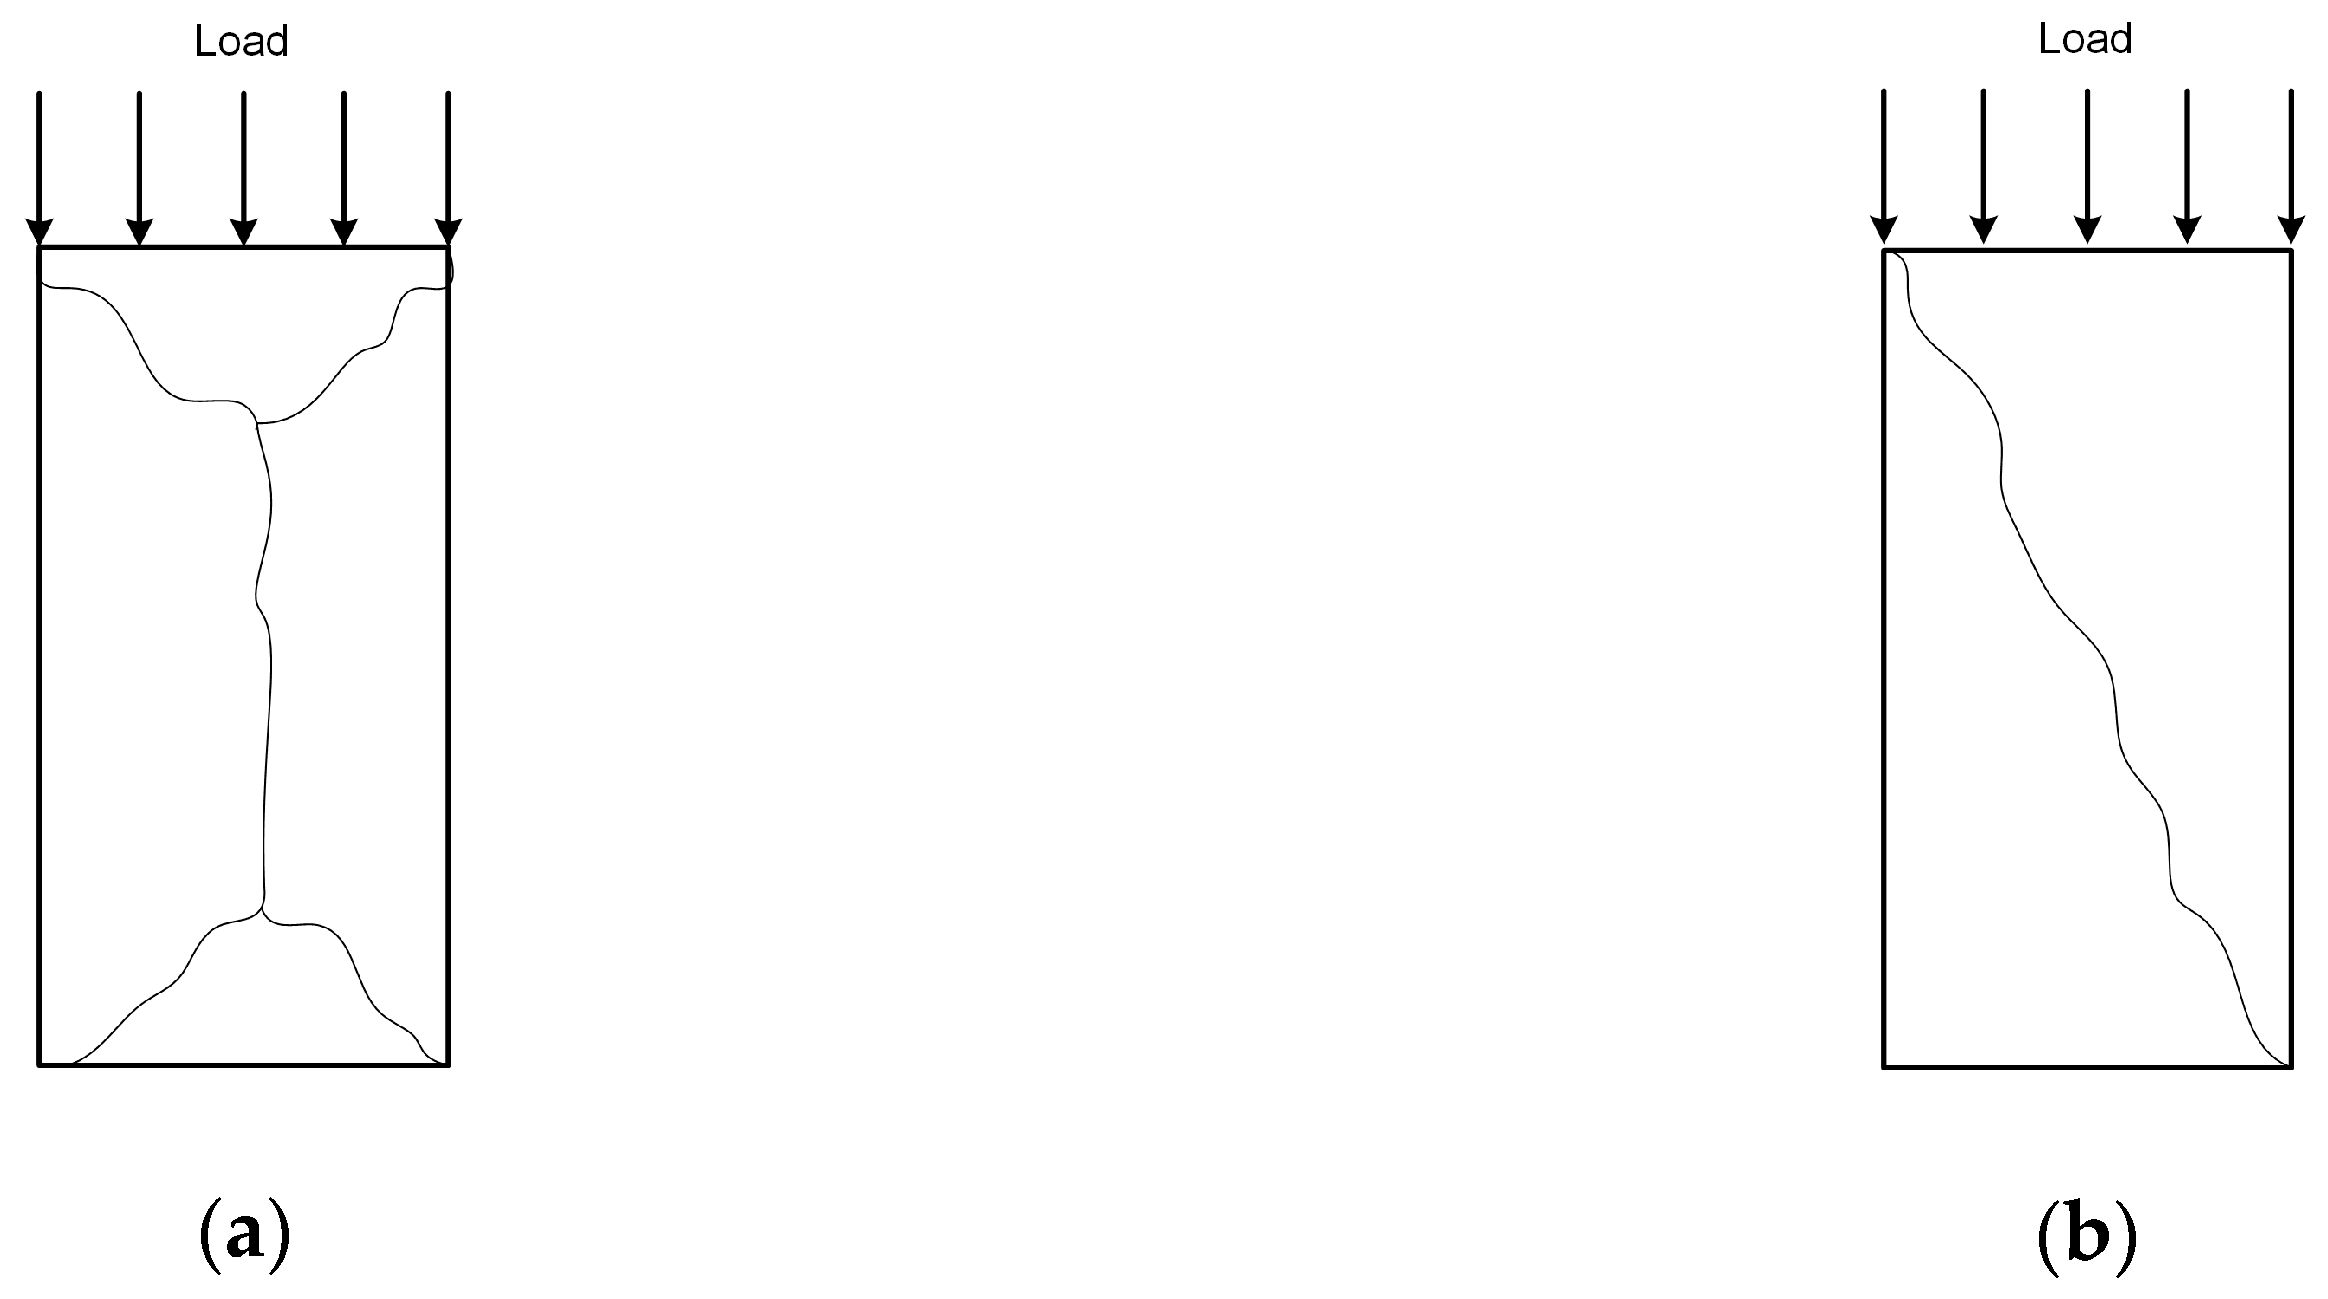
Rocks and underground structures often subjected to cyclic loading due to natural earthquakes, vibrations by car or train, and drill-and-blast by humans. Ground structures such as man-made masonry arch bridges also need to be assessed for stability due to earthquakes or cyclic loads [1]. Thus, it is necessary to investigate the crack growth characteristics of rocks under cyclic loading to ensure that there are no problems with the stability of structures in rocks. Under cyclic loading, rocks may exhibit a pattern of failure which differs from a pattern of monotonic loading failure. Royer-Carfagni and Salvatore [2] showed the difference of failure patterns in marble under monotonic and cyclic loading. Figure 1 shows that under uniaxial monotonic loading, two cone-shaped failure patterns develop at both ends of the specimen. However, under uniaxial cyclic loading, a fracture occurs along an inclined plane which develops over the entire height of the specimen. Therefore, monotonic and cyclic loading may cause a different pattern of fracture propagation and coalescence in rocks. Confining stress affects the stress–strain relation, and it modifies the material behavior under monotonic and cyclic loading [3].
Cyclic loading often results in a rock failure at a lower stress level than its monotonically determined strength. Crack growth at a stress level much lower than fracture stress is called subcritical crack growth. Subcritical crack growth occurs under cyclic loads, monotonic loads, or their combination. Subcritical crack growth under cyclic loading is usually characterized by the Paris law [4]. For a cyclic load, the rate of crack growth is a function of the range of the stress intensity factor:
where da/dN is the crack growth rate, ∆K is the range of stress intensity factor during the fatigue cycle, and C and m are constants that depend on the material, environment and stress ratio.
Kim and Mobeen [5] reported the validity of Paris’ law for Westerly granite. They found that C was dependent on the stress ratio.
Under monotonic loads, subcritical crack growth due to stress corrosion by an environmental agent can be expressed by Charles law [6]:
where v is the crack velocity, K is the stress intensity factor, Kc is fracture toughness, and A and n are subcritical crack growth parameters.
Stress corrosion is considered to be the primary mechanism underlying subcritical crack growth in rocks [7]. The present pore water in the crack tip environment can induce crack propagation by facilitating weakening reactions. For silicon dioxide, most commonly found in rocks, the strong silicon–oxygen bonds are replaced with much weaker hydrogen bonds [7]. This phenomenon is called stress corrosion.
There have been many studies on crack growth in rocks or brittle rock-like materials under monotonic loading [8,9,10,11,12,13,14,15]. In monotonic compression tests using flaw-induced specimens, tensile or wing cracks appear first and propagate parallel to the applied compressive loading direction. Secondary or shear cracks appear later and are responsible for specimen failure as a rule. Crack coalescence occurs through secondary cracks or a combination of wing cracks and secondary cracks [8,9,10,11,12]. However, crack growth under cyclic loading has not been sufficiently investigated. Most experiments have focused on the fatigue properties of intact rock and the influence of cyclic frequency and strain rates [16,17,18,19,20,21,22,23,24,25,26]. Thus, research related to crack propagation and coalescence under cyclic loading is very rare.
Both Paris law and Charles law are related to subcritical crack growth, and they can be used to predict lifetime and time-dependent behavior of rock structures. Since the two laws have similar forms, the exponents m and n are also likely to be related to each other, but few studies have been conducted.
Experiments with gypsum as a model rock material were performed to examine the characteristics of crack growth under monotonic and cyclic loading. Although natural rocks could be selected as the test material, it takes much time and effort to generate the initial flaws, and it is difficult to fabricate a large number of uniform specimens. Gypsum was selected as a model material due to the ease of introducing initial flaws and because the short curing time allows a large number of test specimens to be produced in a relatively short time. Besides, stress and strain relations are similar to rocks.
The primary purpose of this study was to determine the fracture process in rock-like material under monotonic and cyclic loading. First, we investigated the difference in crack propagation and coalescence between monotonic and cyclic compression loading. Specimens with two pre-existing flaws were employed in monotonic and cyclic compression. A total of 34 different flaw patterns were used to identify crack propagation and coalescence under different loading configurations. Second, subcritical crack growth parameters under monotonic and cyclic loading were evaluated. A constant stress-rate test was used to evaluate the subcritical crack growth parameter n under monotonic loading. The subcritical crack growth parameter m under cyclic loading was calculated from the relationship between the rate of crack growth and the range of stress intensity factor. Finally, the fatigue crack growth under cyclic loading was examined.
2. Materials and Methods
2.1. Specimen Geometry and Preparation
The material used in this study was gypsum. The material is a mixture of Hydrocal B-11 (gypsum manufactured by Gypsum Company, Charlotte, NC, USA), Dicalite (diatomaceous earth manufactured by Grefco Inc., Torrance, CA, USA), and water. The proportions used are as follows: gypsum, 560 g; water, 224 ml; and diatomaceous earth, 6.4 g. The material properties of the gypsum specimen are summarized in Table 1. Its mechanical properties are similar to those of typical sedimentary rocks, and the ratio of tensile strength to compressive strength is close to 1:10. Therefore, the gypsum mixture is a relatively ideal rock-like material with high brittleness.
The specimen’s dimensions are 152.4 mm high, 76.2 mm wide, and around 30 mm thick. Two pre-existing flaws of length 2a = 12.7 mm were arranged in the center of the specimen. A thickness of 0.1 mm steel shims were arranged in the mold to produce the desired flaw thickness of 0.1 mm (Figure 2). Open flaws were used in this study. These flaws remained open during a compression test, so no stresses are transmitted across them.
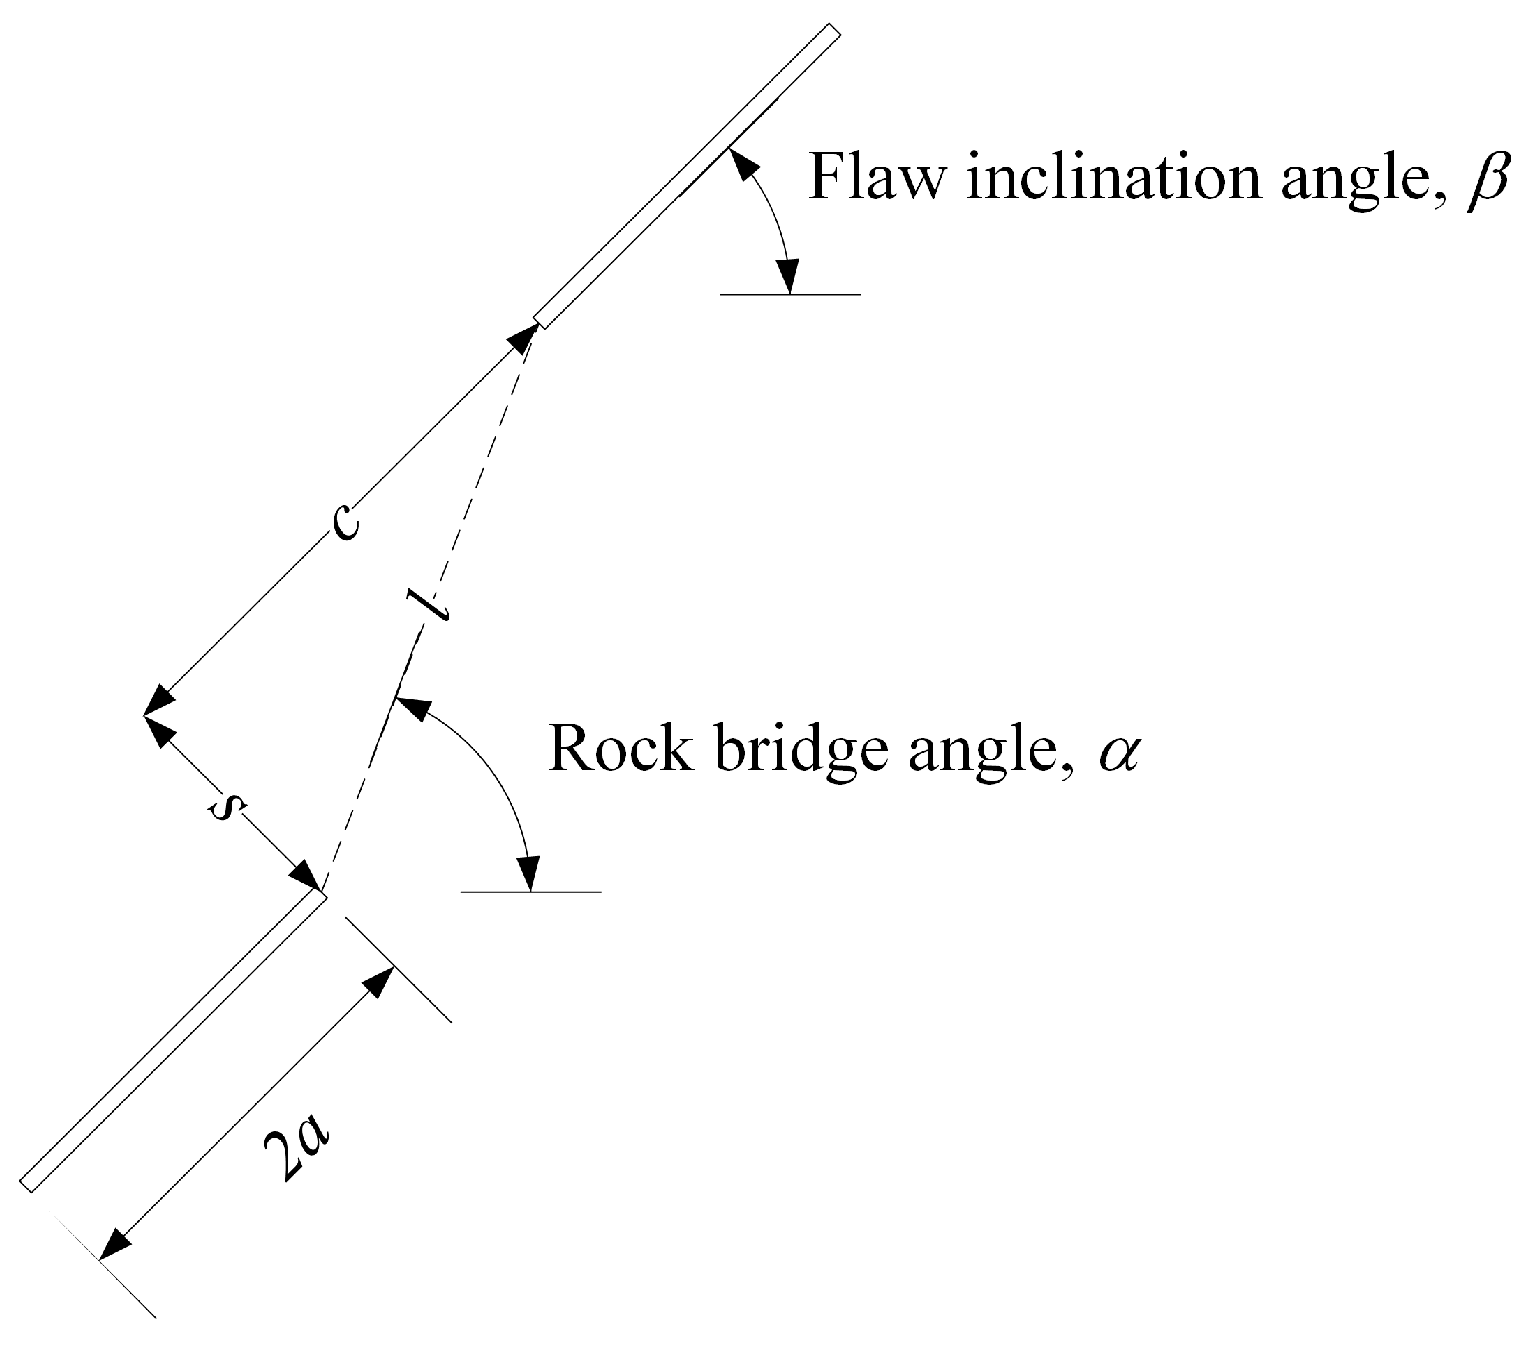
The flaw inclination angle, β, is the angle of the flaw with the horizontal direction. Continuity, c, is the distance between flaws measured along their respective plane. Spacing, s, is the distance between two flaws measured along a direction perpendicular to their plane. The rock bridge length, l, is the shortest distance between the inner tips, and the rock bridge angle, α, is the angle of the ligament with the horizontal direction. The flaw geometry is defined in the form of “flaw inclination angle (β)-spacing (s)-continuity (c)”. Spacing, continuity and rock bridge length are represented by multiples of ‘a’ (a = half flaw length). A total of 34 different flaw geometries were prepared. The geometry parameters of the specimen are presented as follows:
Flaw inclination angle (β): 30°, 45°, 60°, spacing (s): 0, a, 2a, continuity (c): 0, a, 2a, 3a, 4a
The same flaw geometries were used in the previous studies [6,7,8] to facilitate the comparison of previous and new findings.
Table 2 shows a list of all the geometries and the number of specimens for this study. A total of 292 specimens were prepared and tested.
The procedure for the specimen preparation is detailed below:
- Assemble the two PMMA plates and the four metallic plates. Insert steel shims for open cracks.
- The water and diatomaceous earth are poured in a mixer and mixed for 20 s.
- Add the gypsum to the water-diatomaceous earth mixture and mix for 4 min.
- Pour mixture into the mould, then vibrate the mould for 2 min to remove entrapped air in the mixture.
- After an hour following vibration, the steel shims are pulled out.
- The gypsum specimens solidify within an hour. Then, the specimens are taken out of the mould.
- Dry for 24 h at room temperature.
- All faces of the specimens are polished in a rotating grinding machine to achieve a smooth surface and an even thickness.
- For curing, the specimens are placed in an oven at 40 °C for four days. Then, the specimens are removed from the oven and tested.
After four days of curing, there was little change in the strength of the specimen.
2.2. Monotonic Compression
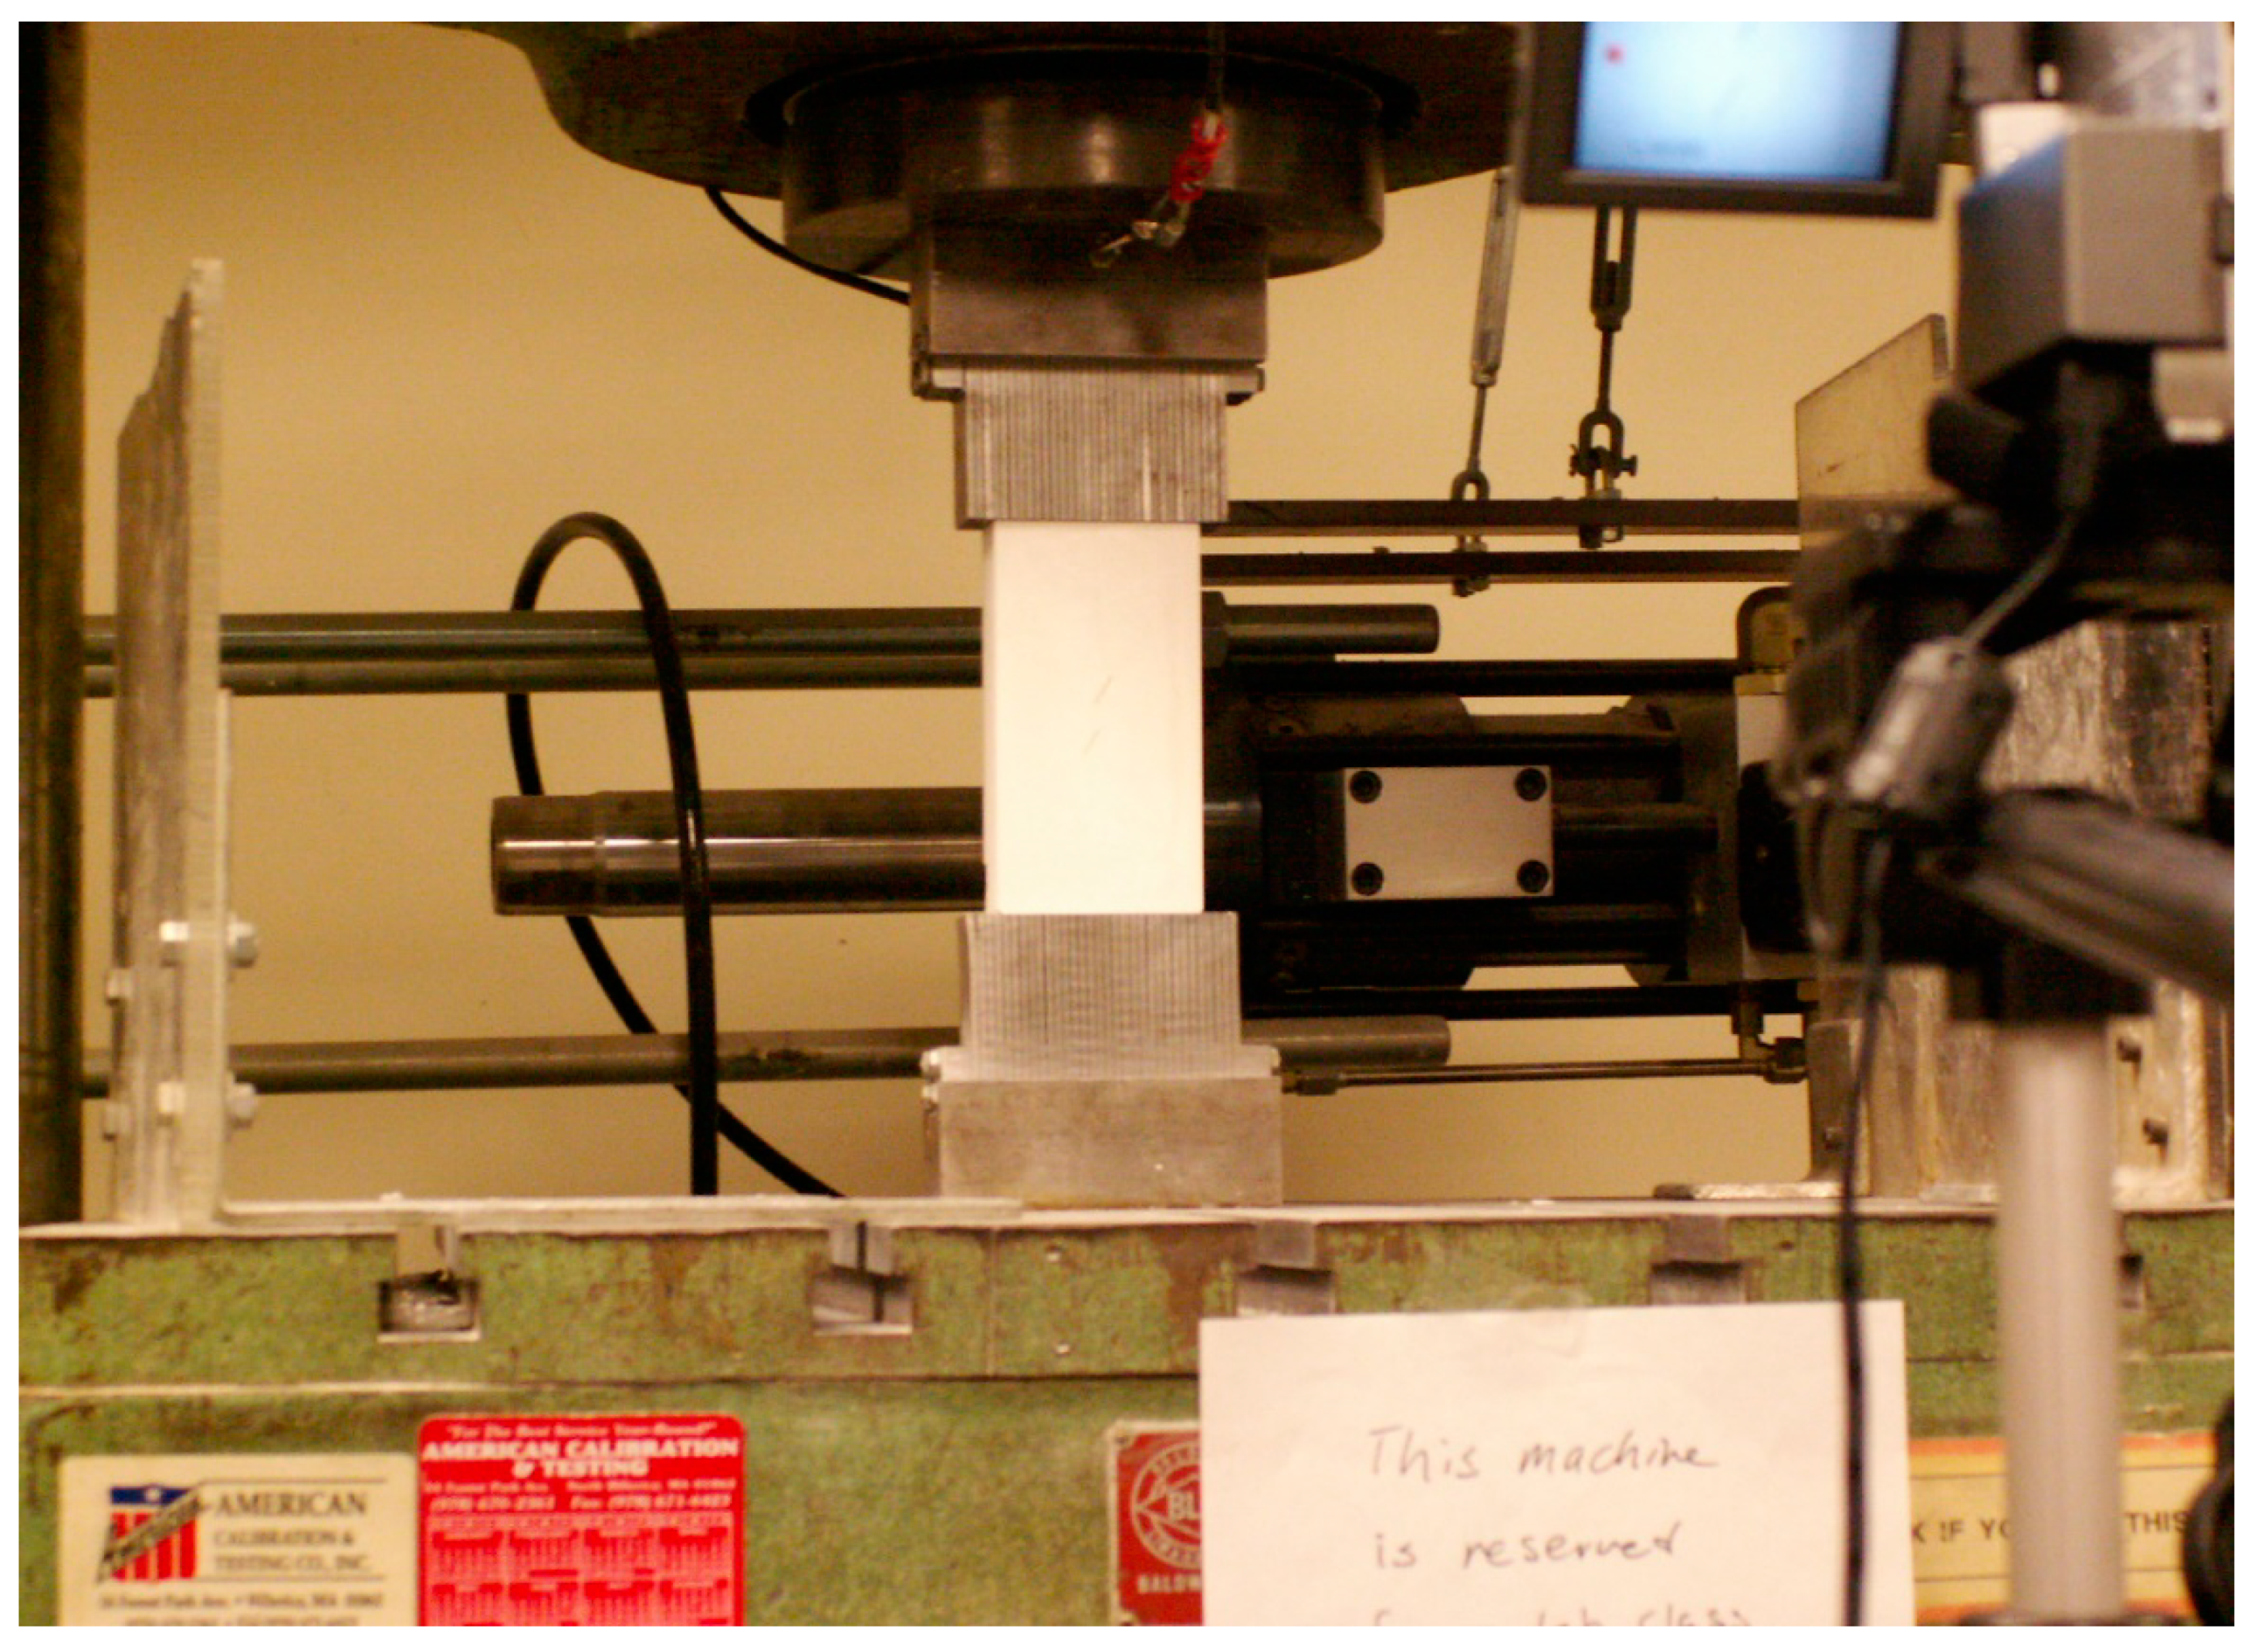
The specimens were loaded in a Baldwin emery 200 kips loading machine until failure occurred. Brush platens were used to reduce friction and shear stresses between specimen and loading platens. Figure 3 shows the experimental configuration for monotonic compression. Loading was carried out using displacement control, and three steps were used for the displacement rate. This approach was used to reduce the time required for the overall test. In the first step, a rate of 0.3 mm/min was used until loading reached 5 MPa. In the second step, a rate of 0.15 mm/min was used until loading reached 7.5 MPa. In the third step, the displacement rate was 0.03 mm/min. A rate of 0.03 mm/min is low enough to cause crack initiation and coalescence.
Because the cracking process usually occurs rapidly, a video camcorder was used to capture the whole process of crack initiation and propagation. This method was suitable for the overall crack pattern study.
2.3. Cyclic Compression
The cyclic loading used in this study is termed ‘compression–compression’ because the applied stresses remain compressive during the complete loading–unloading cycle. Compressive loading must be maintained to prevent any loss of contact between the test specimen and platens during the unloading phase of the cycle and to eliminate possible impact effects on the specimen during the subsequent phase. According to Haimson and Kim [16], the cyclic rate for simulating the frequencies of the major pulses in earthquakes is 1–2 Hz, and blasting is 10 Hz. A loading frequency of 0.5 Hz was used for the experiment. Higher frequencies were not used because they are beyond the capacity of the compression machine. Several initial tests showed that the equivalent displacement rate for the 0.5 Hz loading frequency is 83.82 mm/min. Hence, the dynamic compressive strength is defined as the failure strength at the displacement rate of 83.82 mm/min. Table 3 presents the average dynamic compressive strength with respect to the initial flaw inclination angle. In this study, σmin was held constant at 0.18 MPa for all tests, and only the effects of different σmax values were investigated. Values of 90%, 85%, and 80% of the dynamic compressive strength were used for σmax. Similar to the monotonic compression test, the whole process of crack initiation and propagation was captured by a digital camcorder. The cyclic loading continued until a failure occurred or the number of cycles reached 4000.
2.4. Constant Stress-Rate Test
Rock strength generally increases as the applied stress rate increases. The constant stress-rate test utilizes this theory to relate the fracture strength and applied stress rate, and hence calculate subcritical crack growth parameters.
The generalized stress intensity factor (K) is represented as:
where Y is a geometric factor related to the crack geometry, σ is applied stress, and a is crack length.
Using Equations (2) and (3) together with the mathematical expansion, the relation between the fracture strength and loading rate is explained as follows [27]:
where:
where σf is fracture strength, is stress rate, and D is another subcritical crack growth parameter, which is a function of the fracture toughness (Kc), inert strength (σi), geometric factor (Y) and subcritical crack growth parameters (n and A).
The inert strength can be determined by using high-speed stress rates or an inert environment.
In this study, two kinds of stress rates, 0.02 MPa/s and 50 MPa/s, were employed to determine the subcritical crack growth parameter n. In each loading rate, two to three compression tests were performed using four different pre-existing flaws geometries.
3. Experimental Results
3.1. Crack Initiation
As other researchers have observed [8,9,10,11,12], tensile or wing cracks occur at (or near) the tips of the flaws and propagate parallel to the compressive loading axis in both monotonic and cyclic tests. Even though wing cracks propagated to the top and bottom edges of a specimen, the specimen sustained additional loads until a final failure occurred.
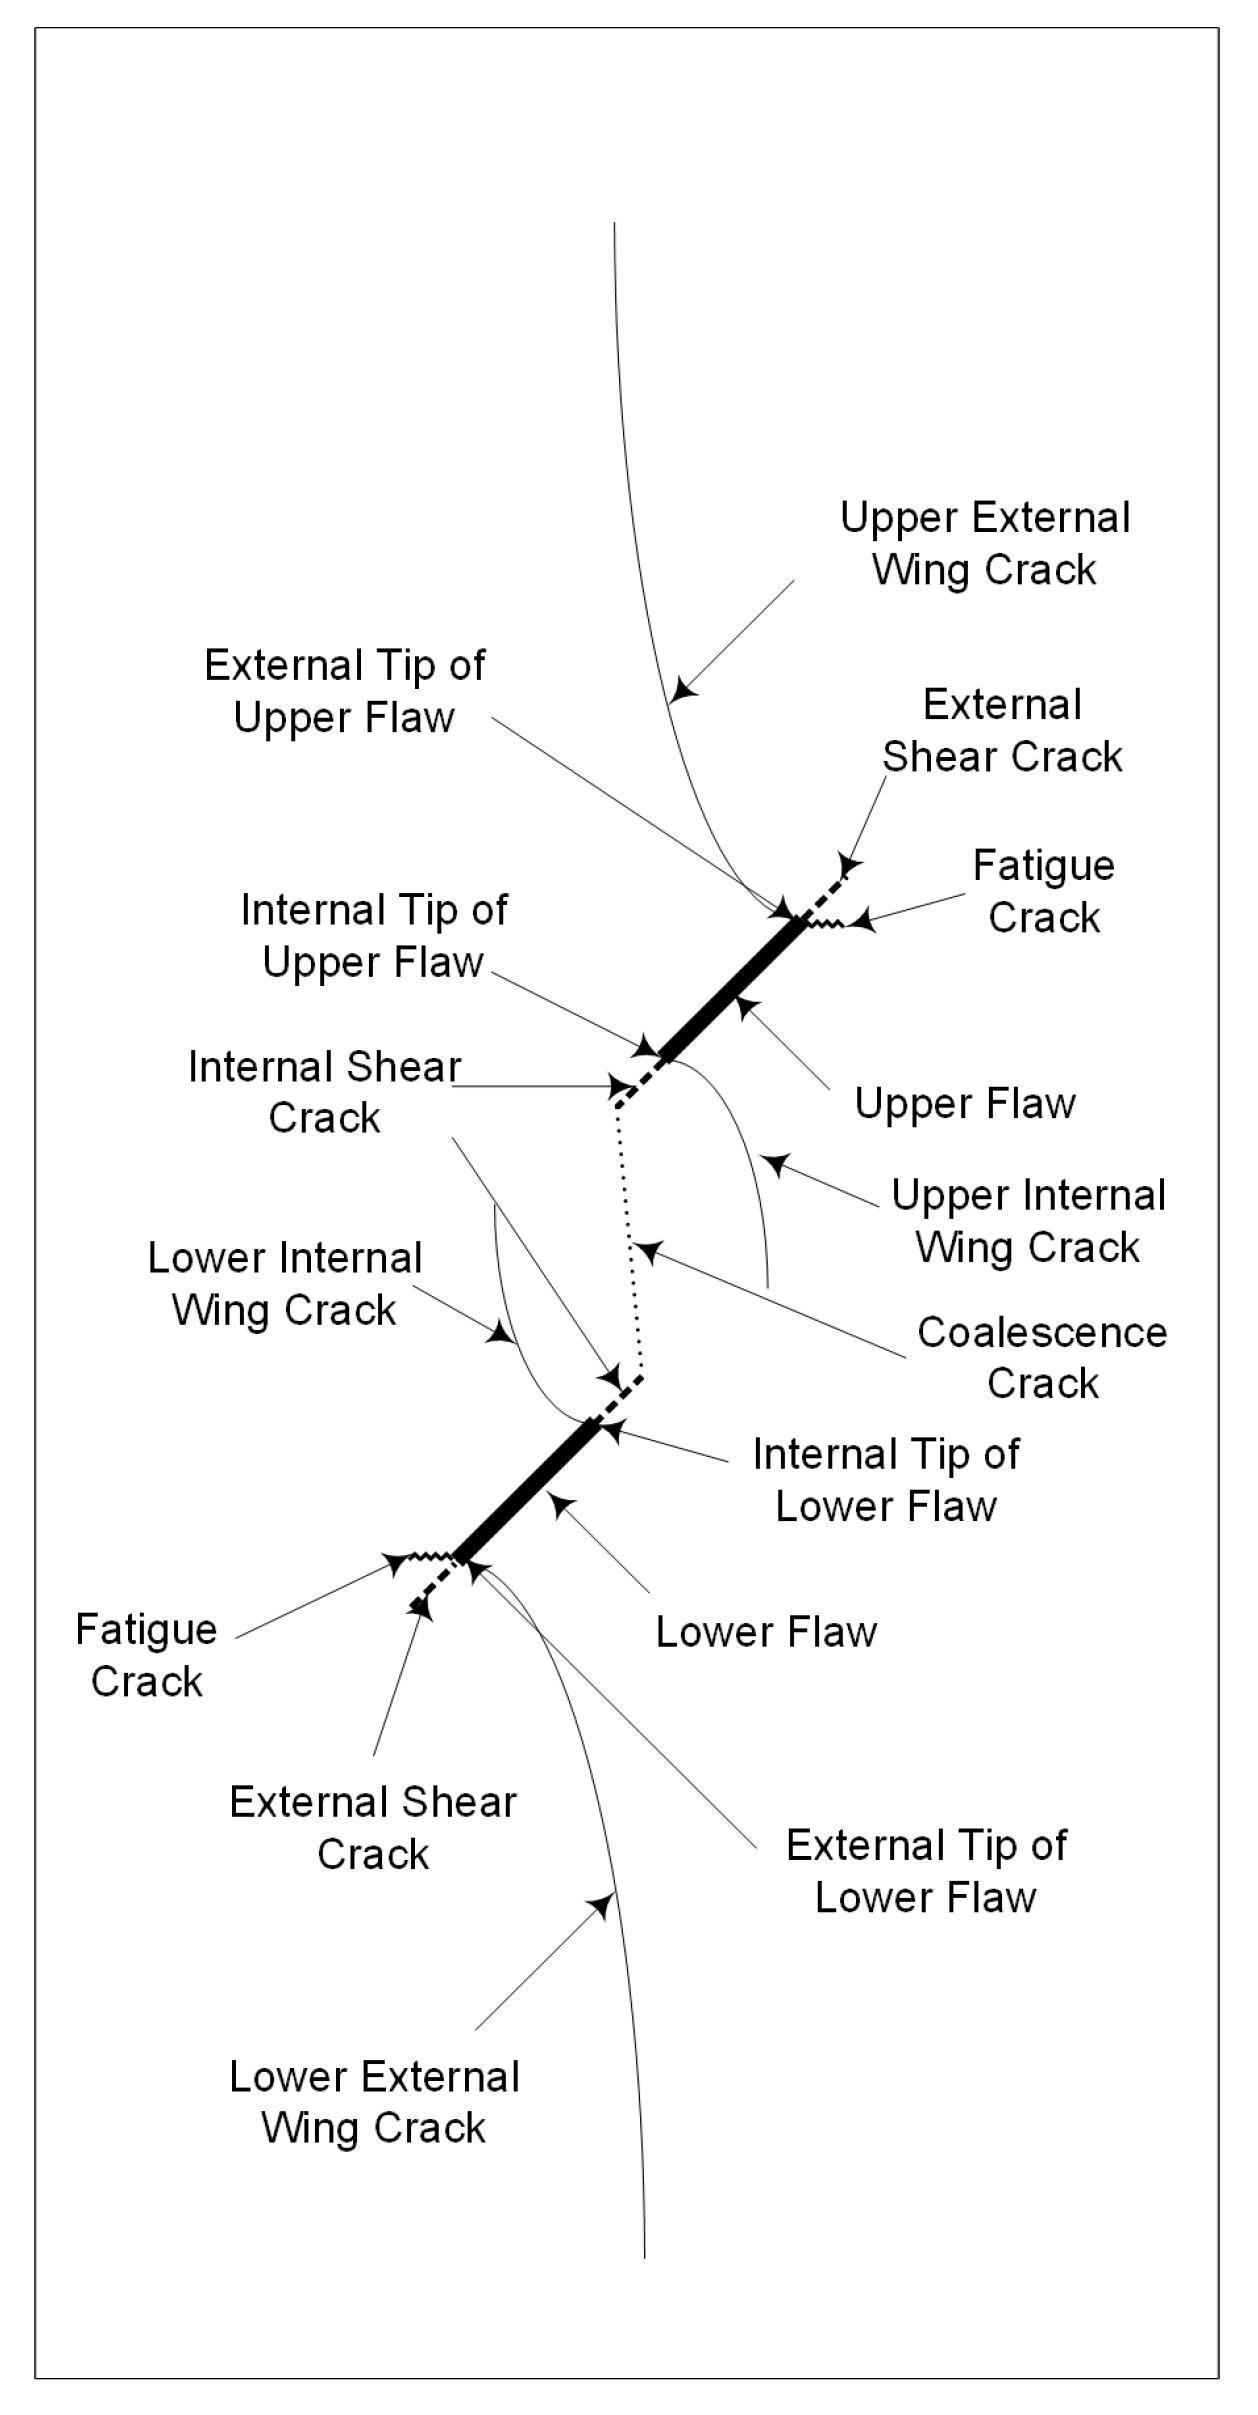
Wing cracks can be classified as upper external wing cracks, lower external wing cracks, upper internal wing cracks, and lower internal wing cracks according to a crack’s initiation position (see Figure 4).
External wing cracks were always observed for all specimens, and most propagated to the top and bottom edges of specimens; internal wing cracks were not observed in all the tests and usually stopped and did not propagate further.
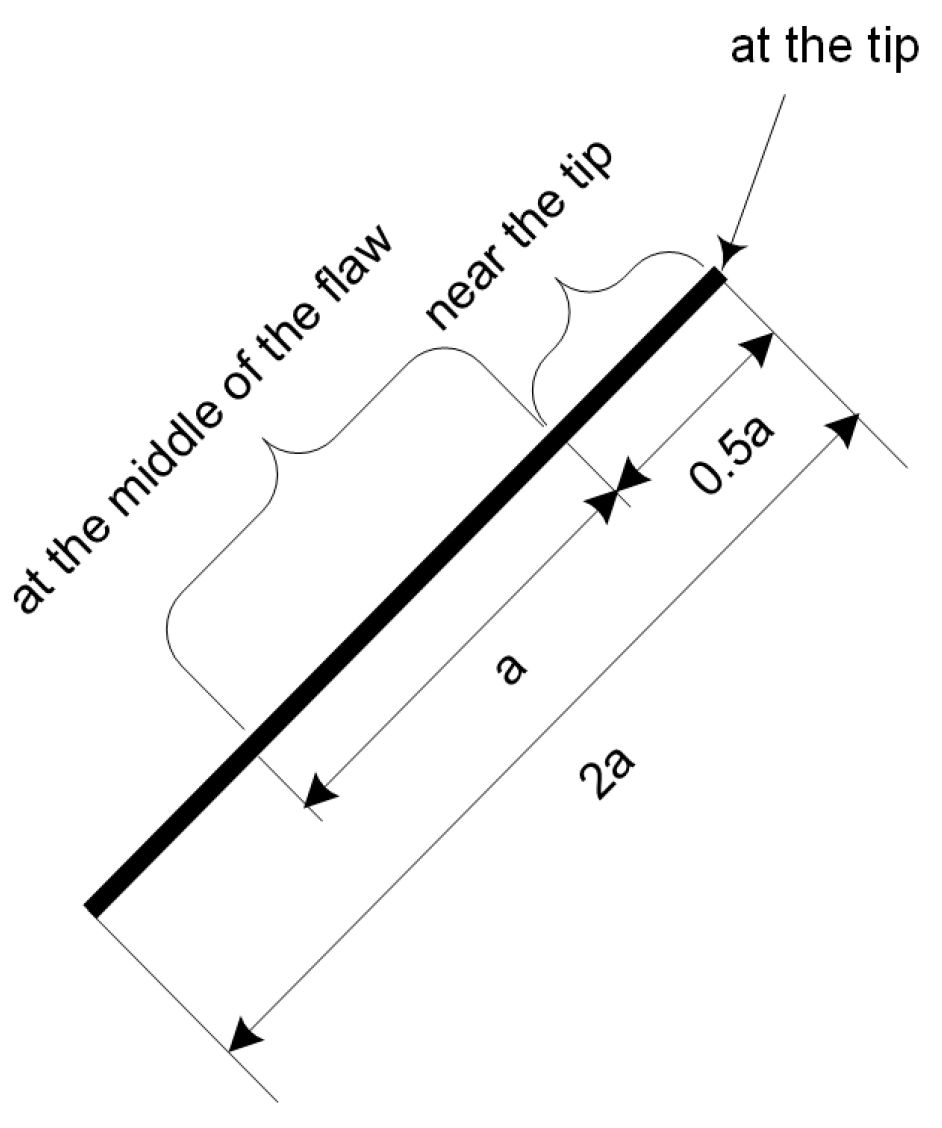
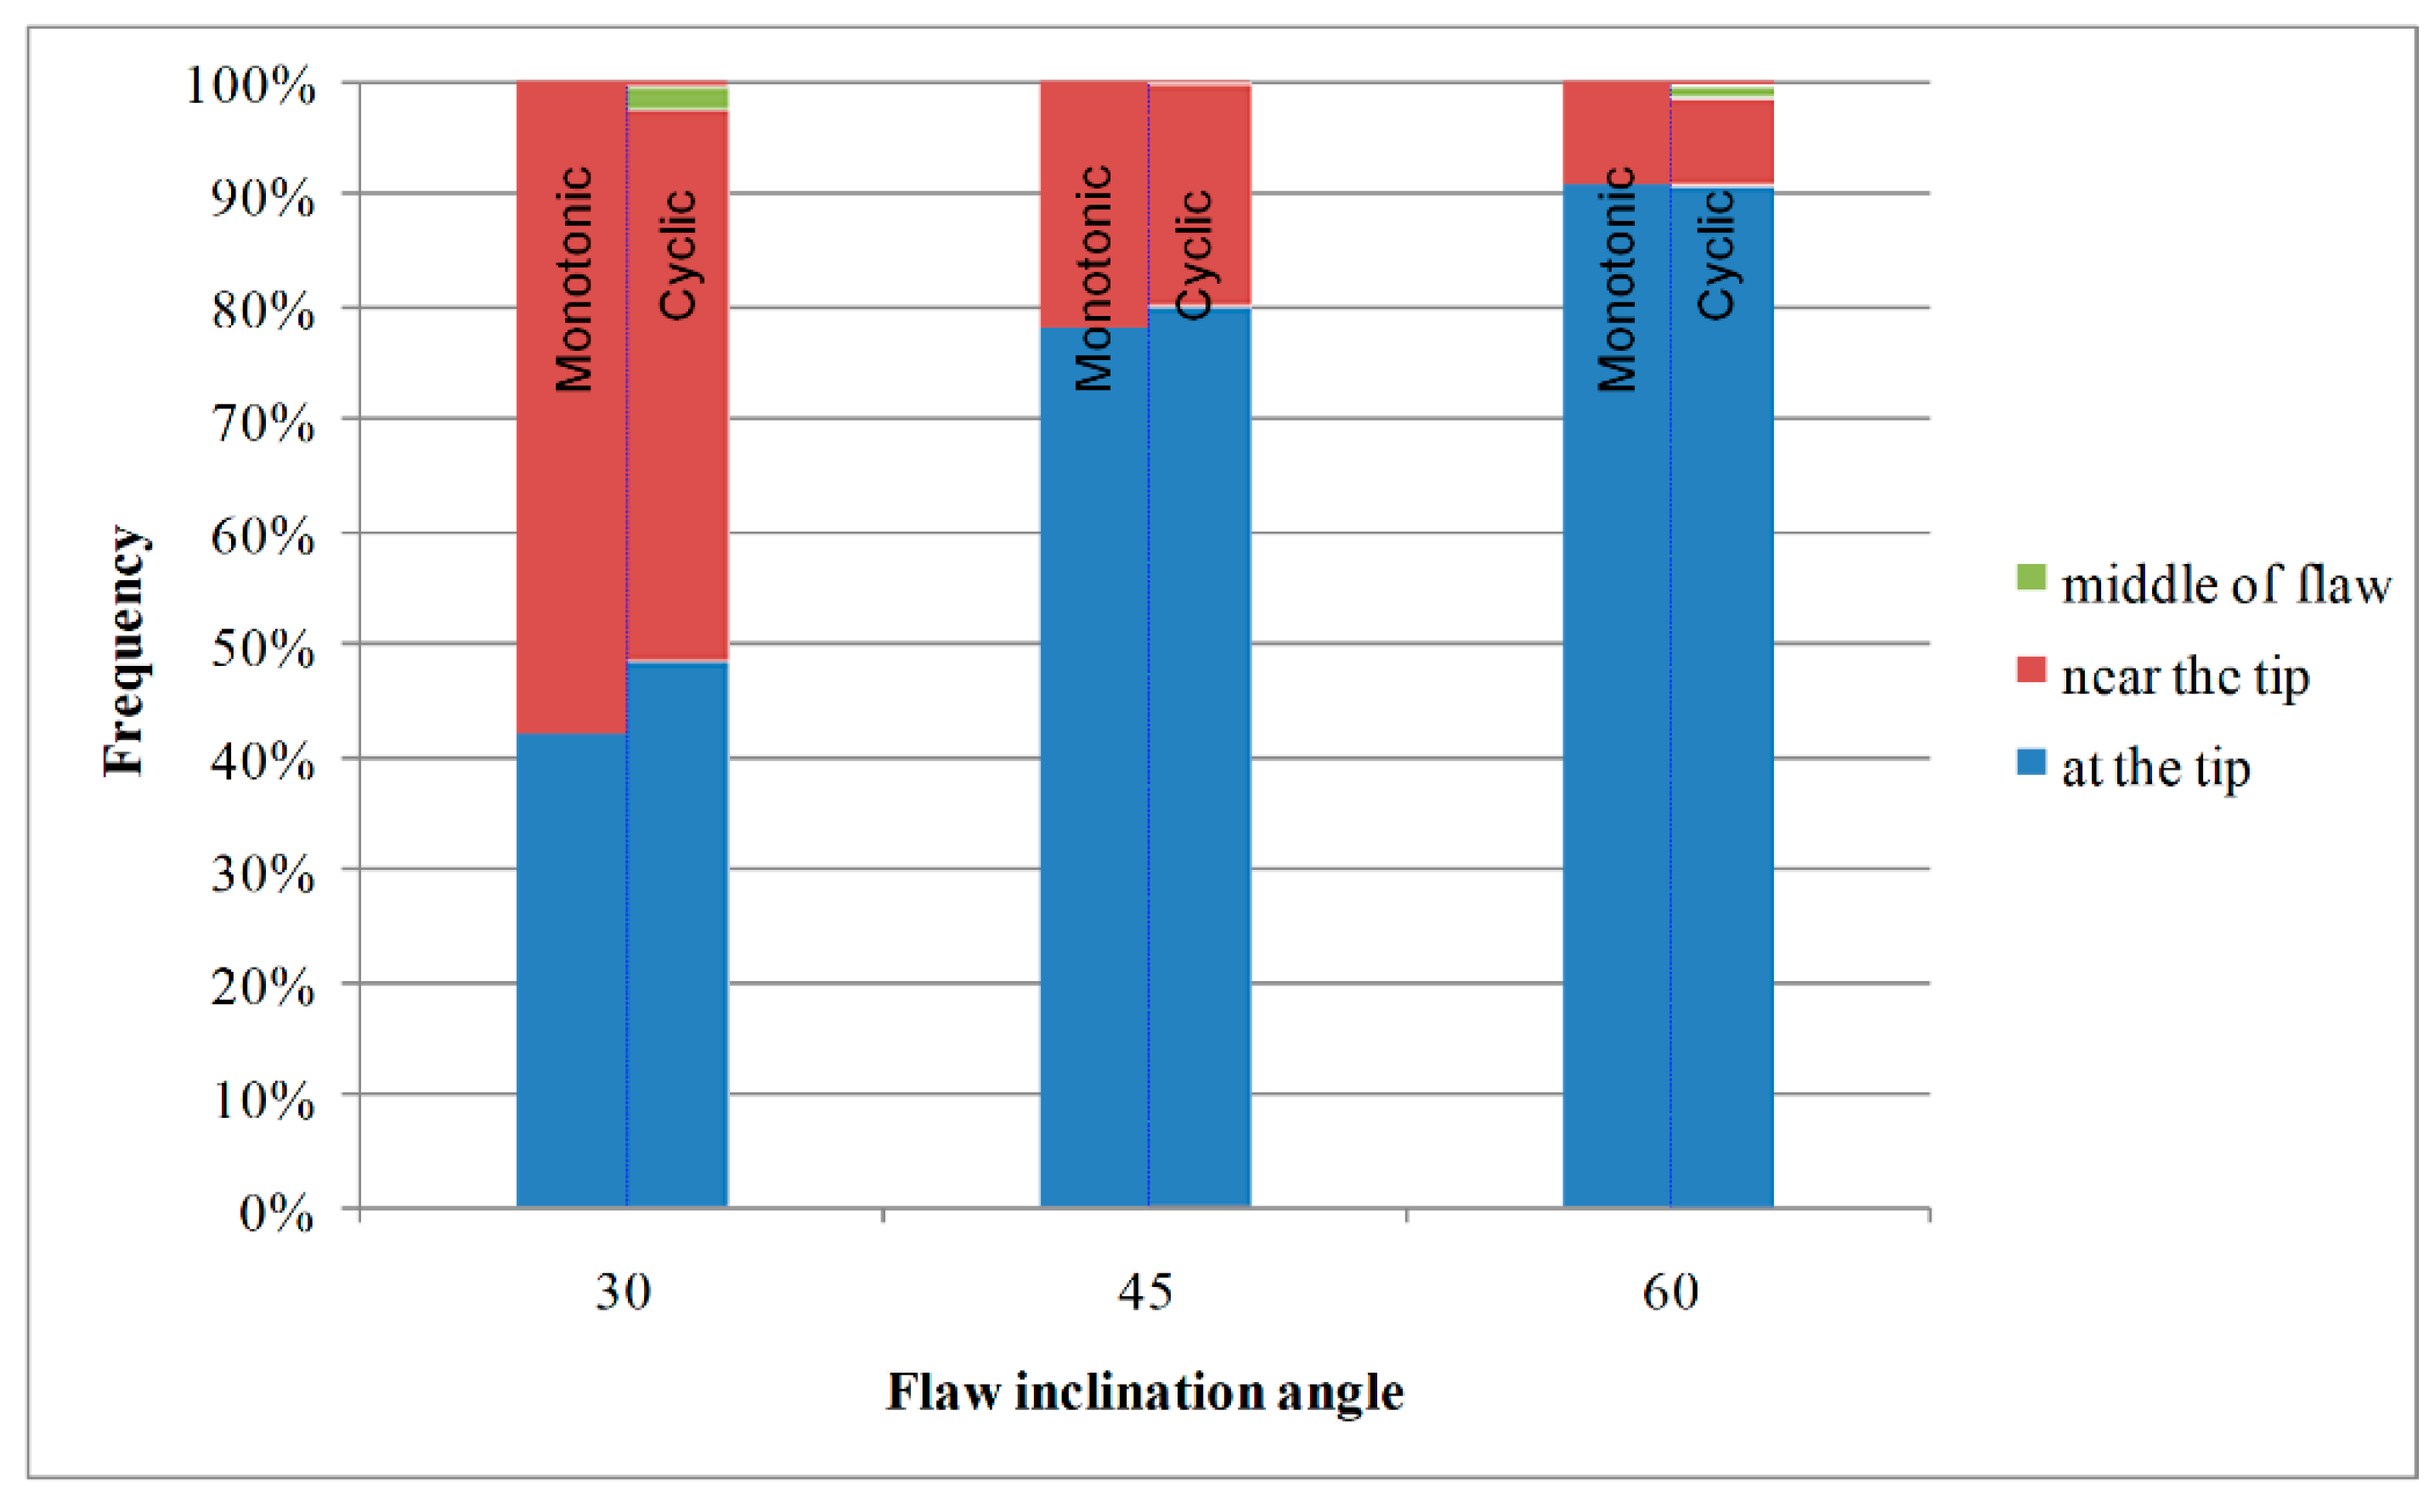
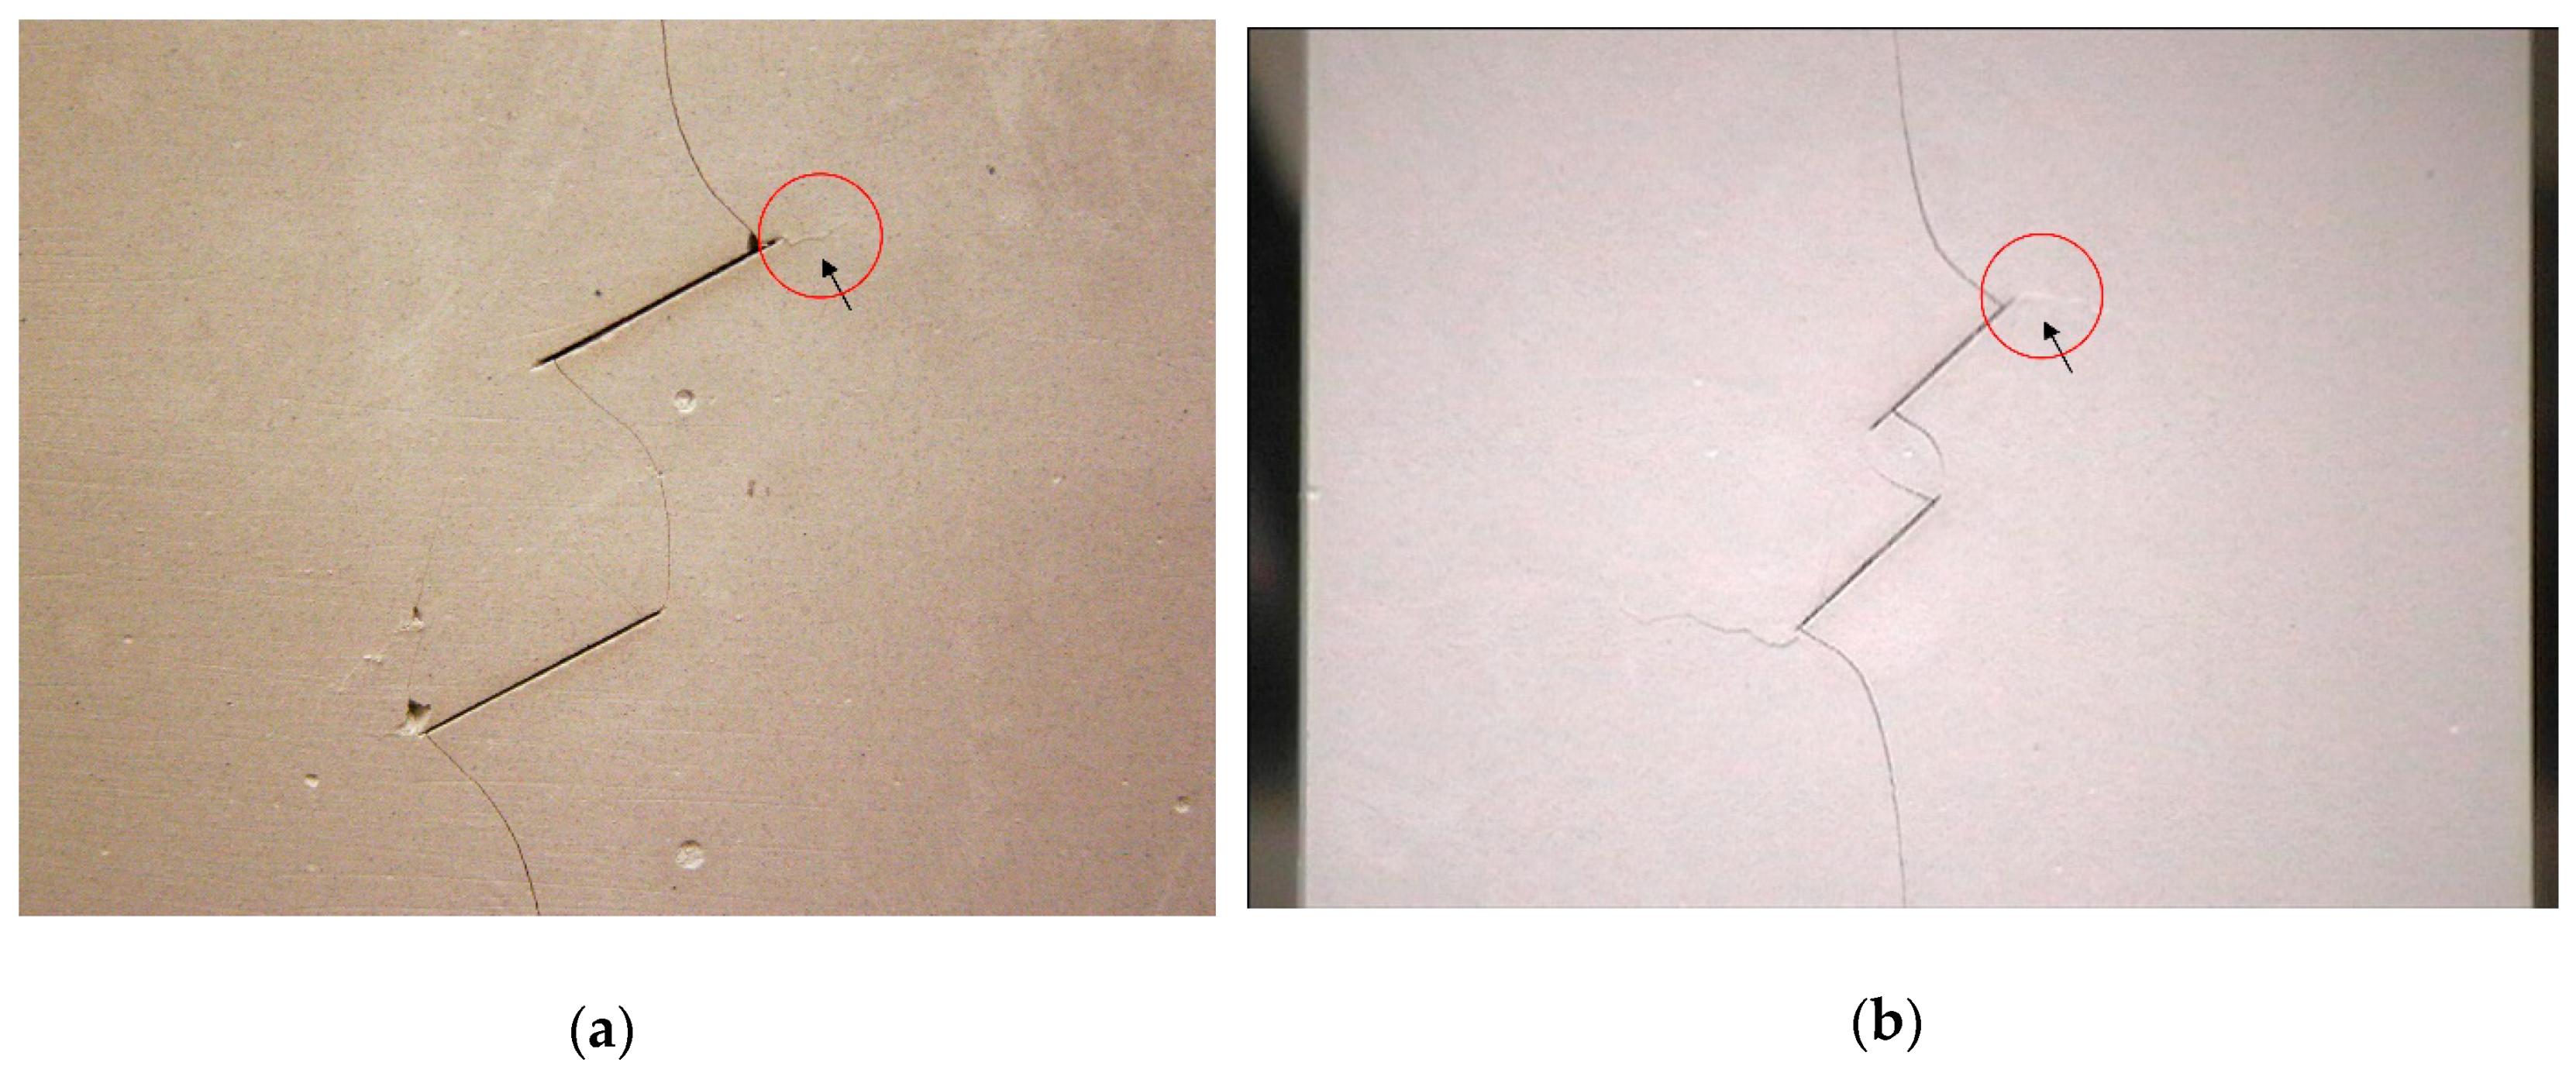
The wing crack initiation position differed for each flaw inclination angle. Three different wing crack initiation positions were observed. Figure 5 shows these positions—at the tip, near the tip, and in the middle of the flaw. The total number of wing crack initiation positions for all the geometries in both the monotonic and cyclic tests are presented in Figure 6. More than half of the 30° flaw inclination specimens show that the wing crack initiation position is near the tip of the flaw. As the flaw inclination angle increases, a higher percentage of wing crack initiations occur at the tip. Moreover, the loading types (monotonic and cyclic) appear not to affect the wing crack initiation position.
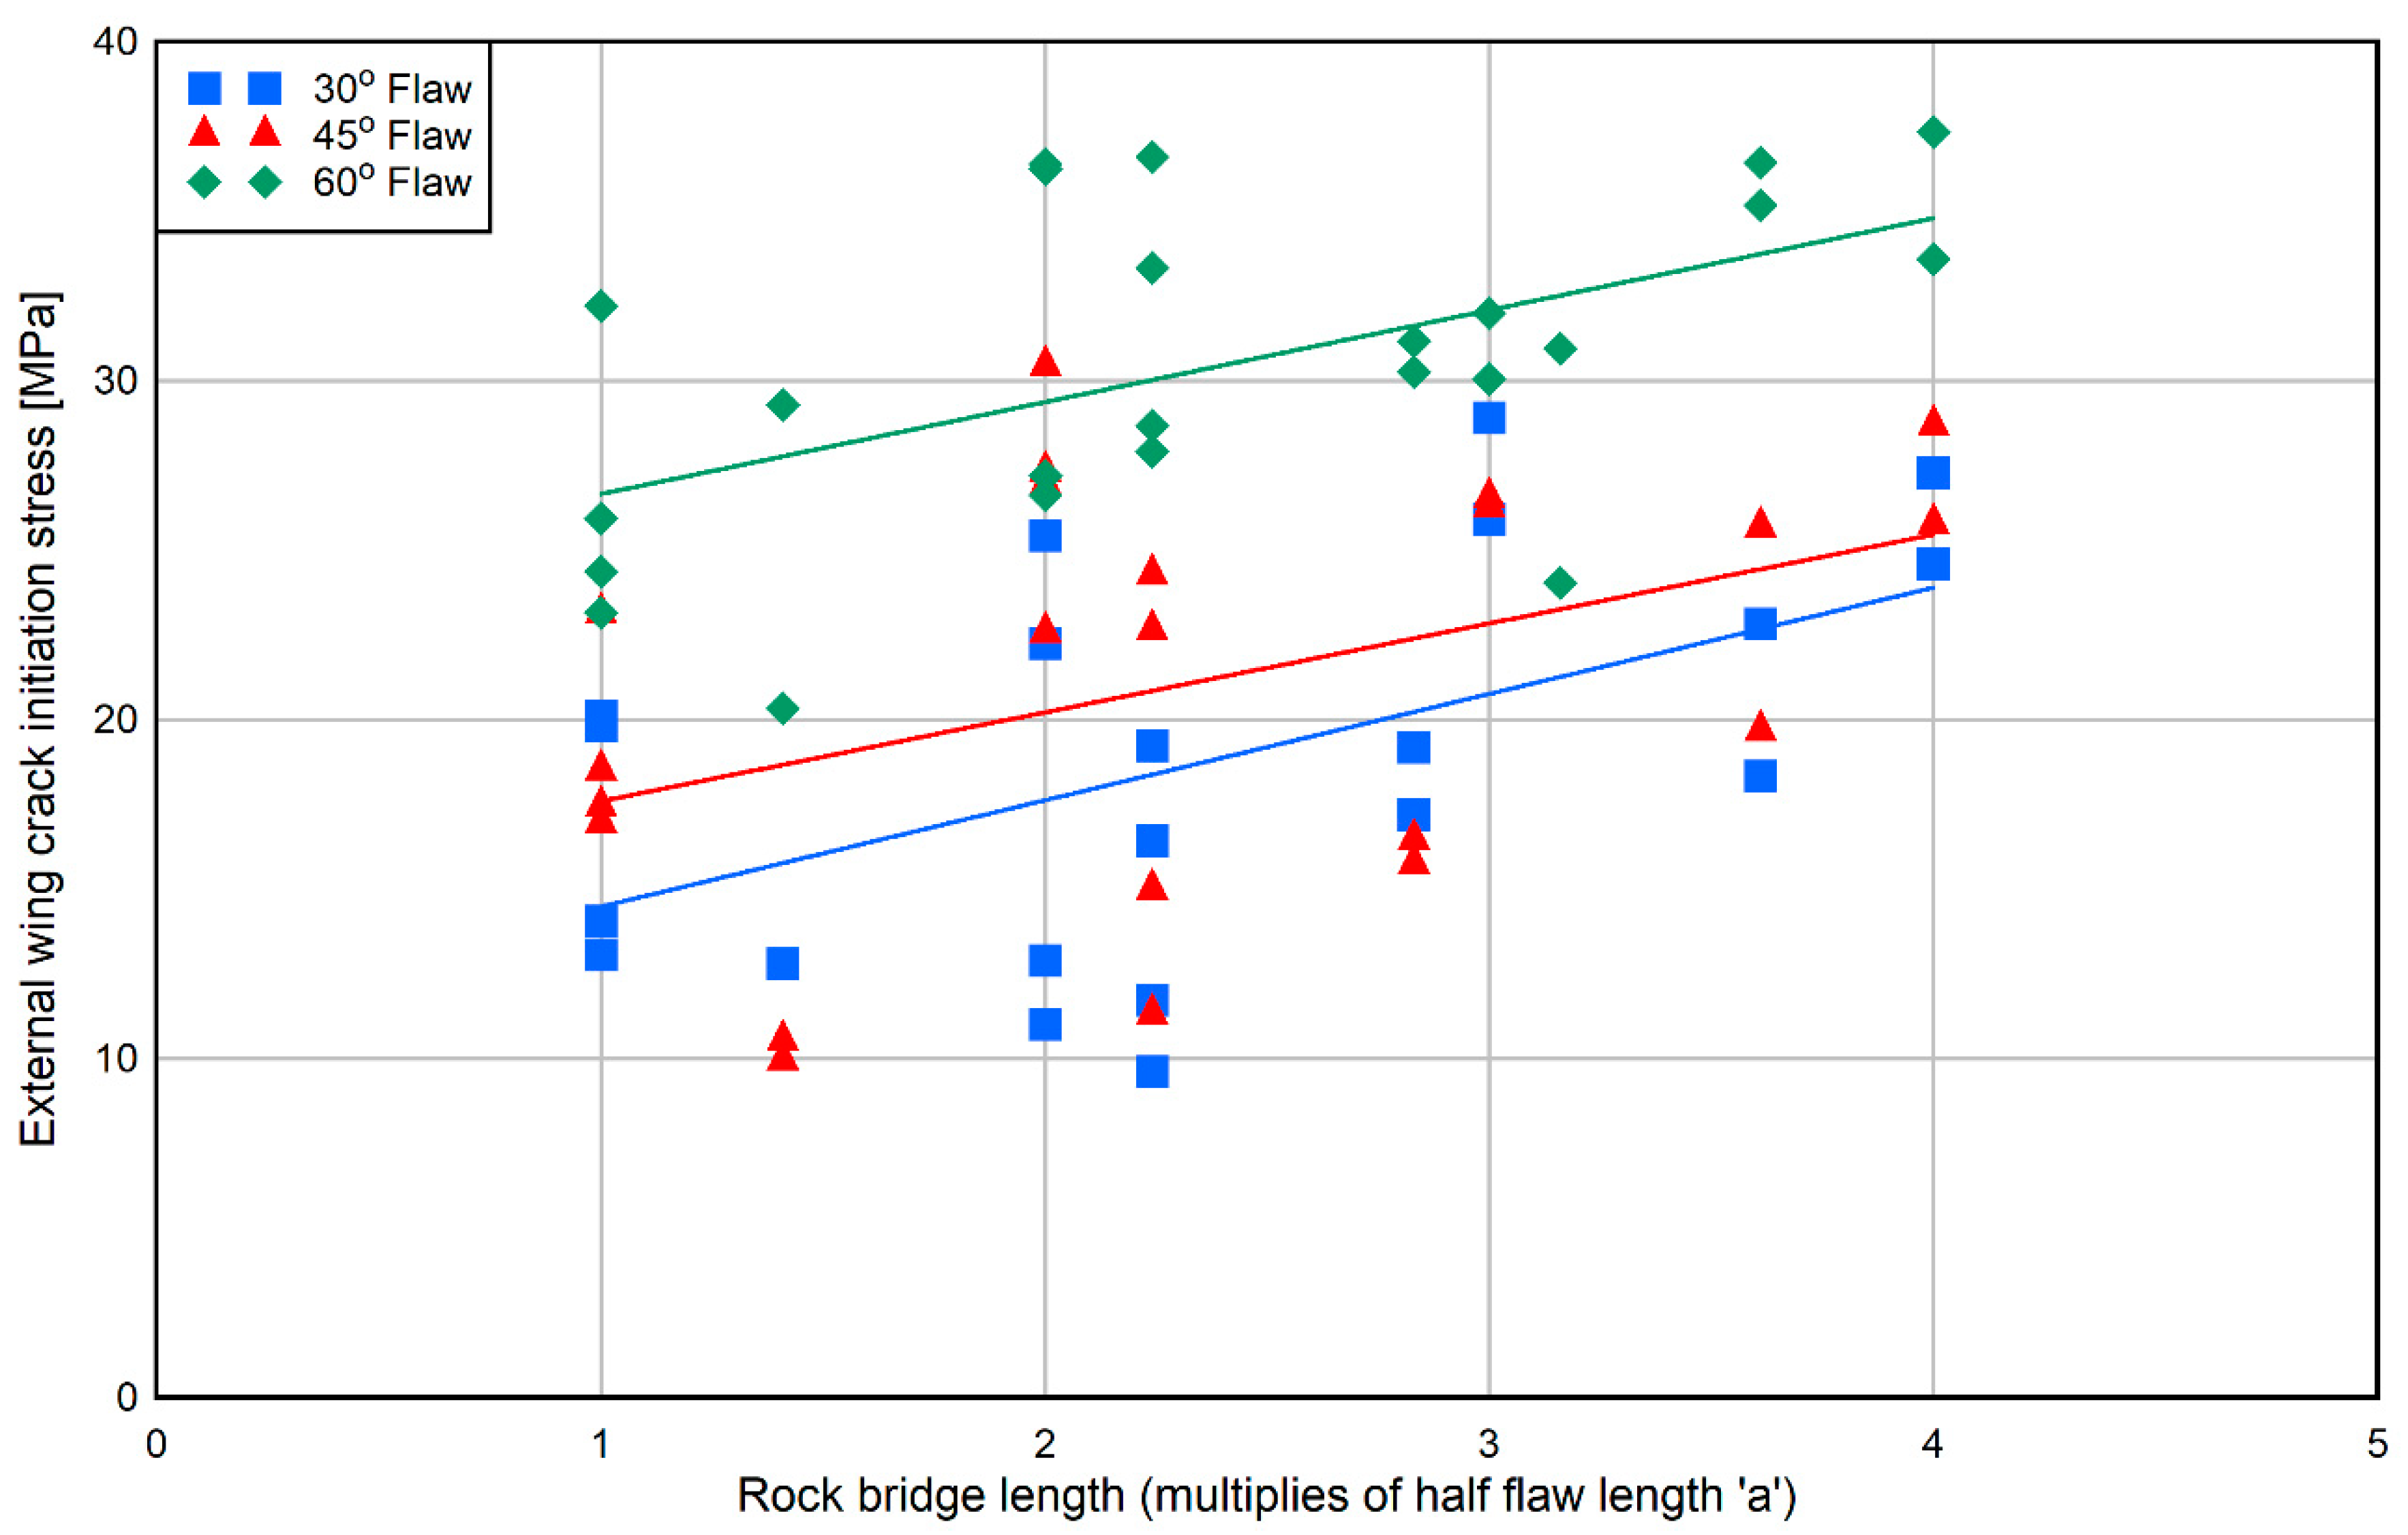
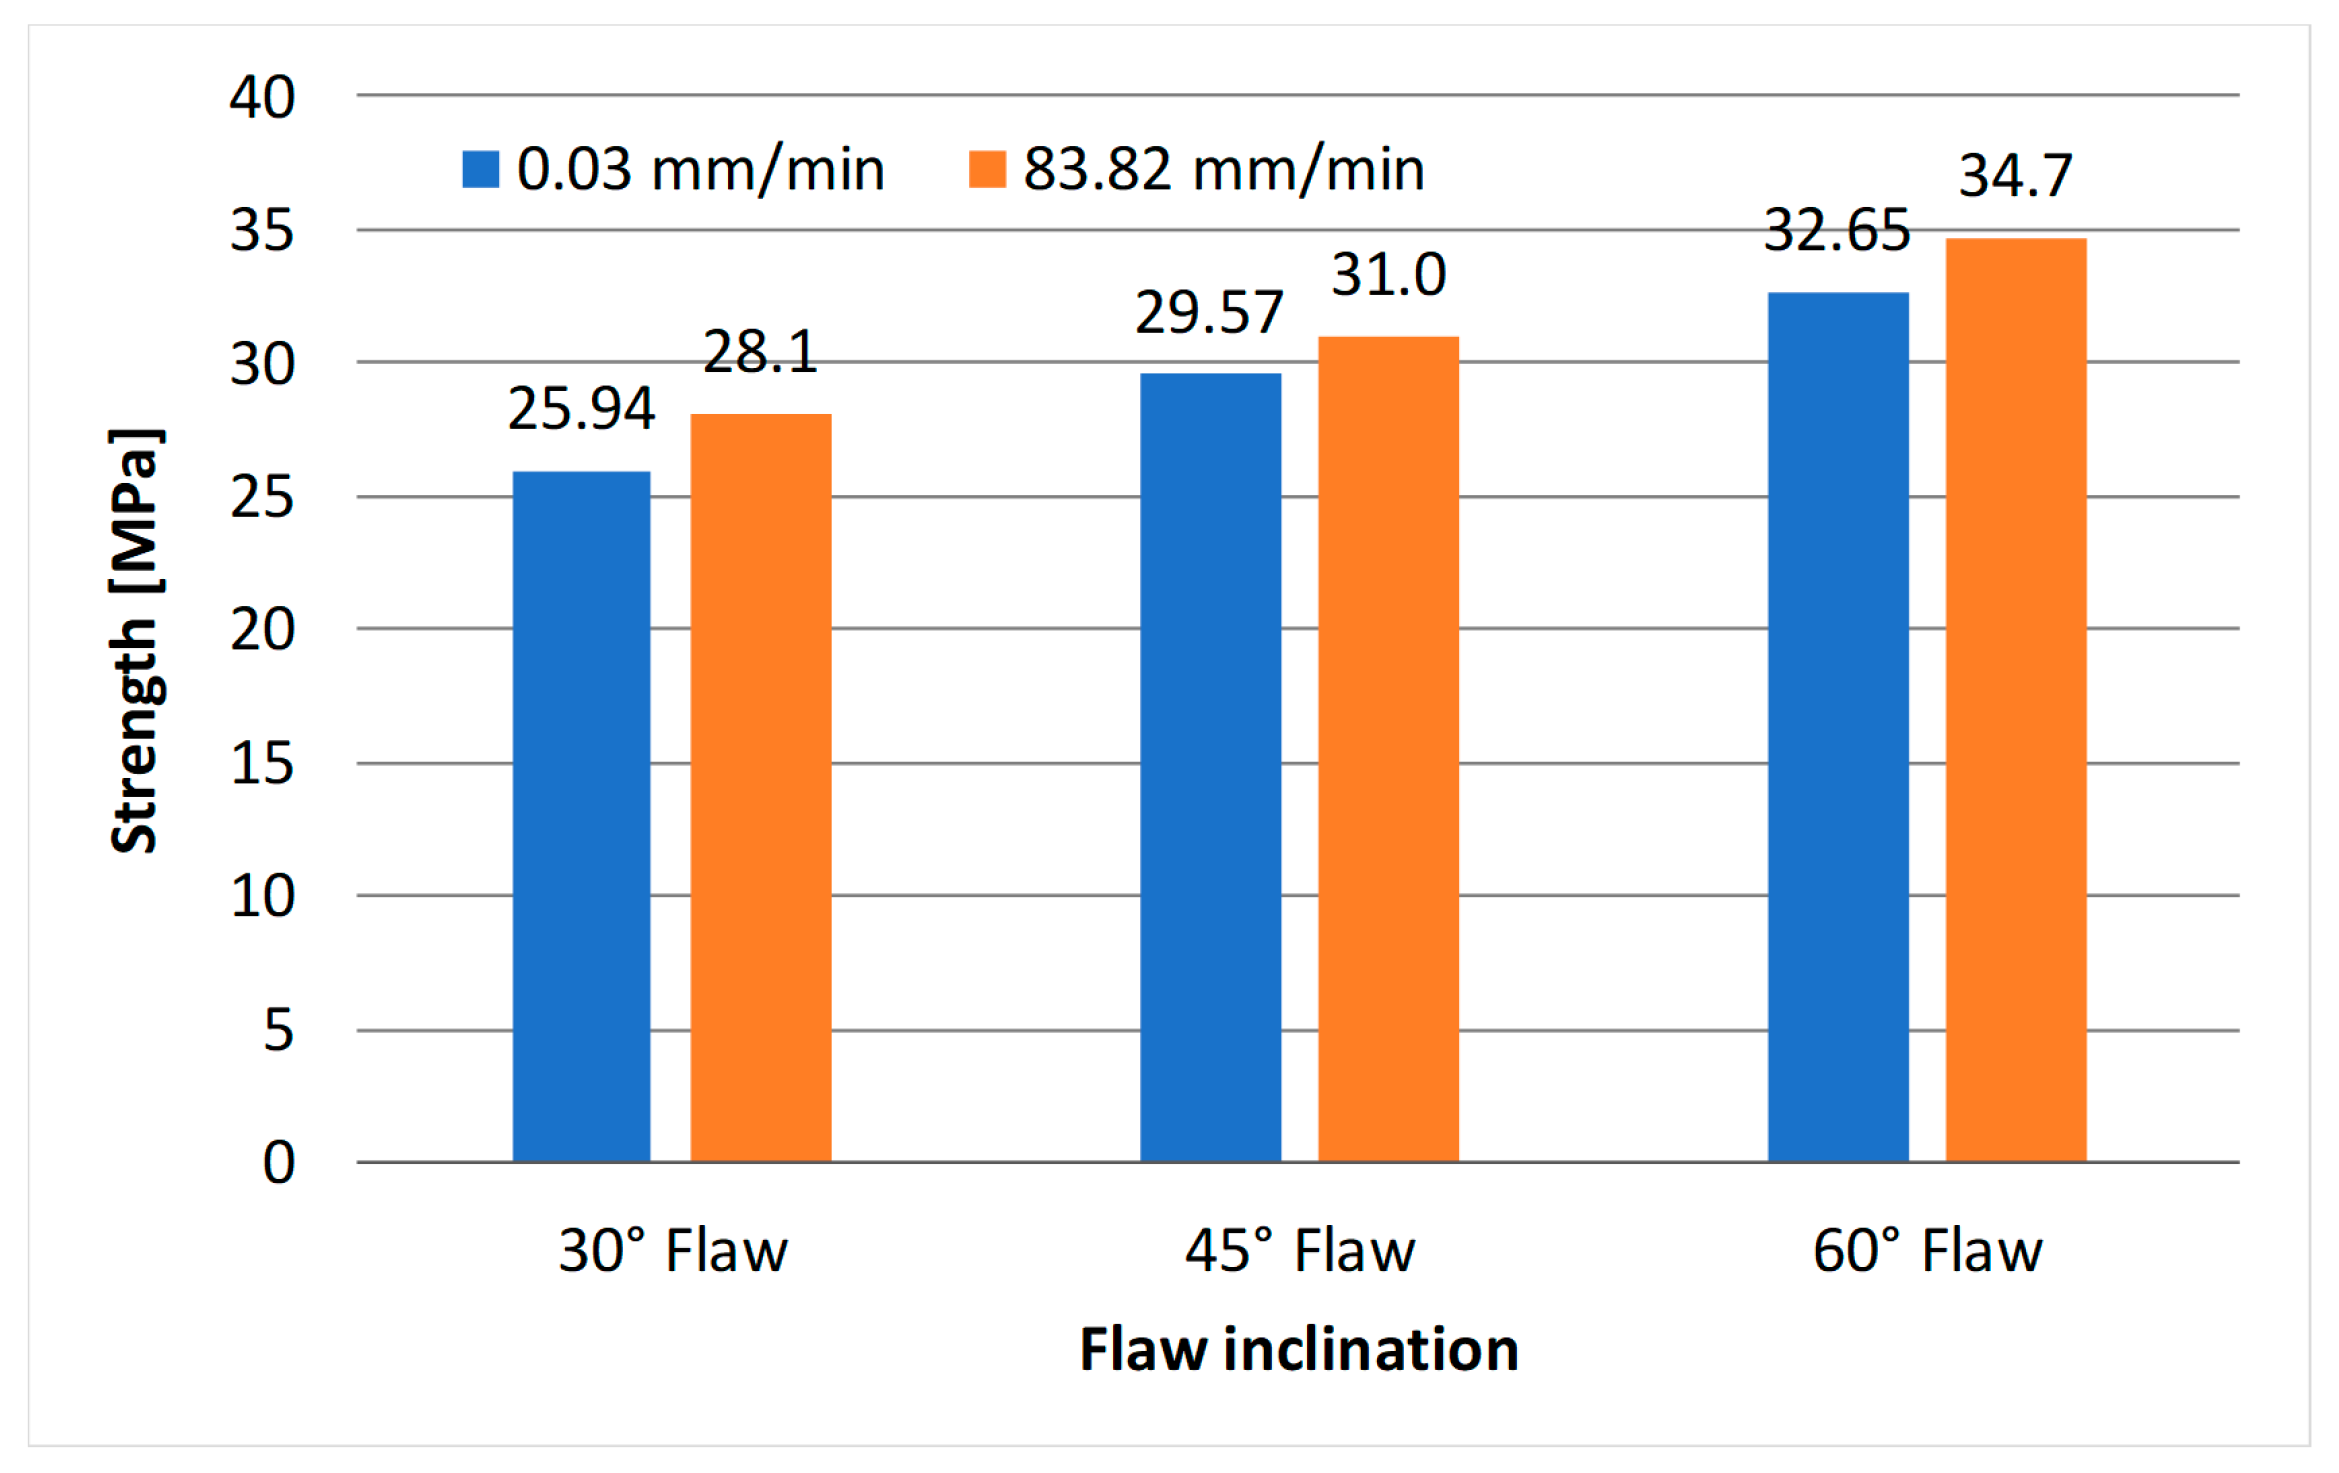
Figure 7 is a plot of external wing crack initiation stress with respect to the rock bridge length in monotonic tests. Although there is some scatter, external wing crack initiation stresses increase with increasing the rock bridge length and flaw inclination angle. Figure 8 shows the variation of strength with a loading rate of 0.03 mm/min and 83.82 mm/min under monotonic tests. The fracture strength tends to increase with increasing the loading rate and the flaw inclination angle.
Secondary or shear crack initiation and propagation examples were not as clear as wing crack initiation and propagation, and secondary cracks usually occurred near the failure. Thus, secondary cracks are more difficult to observe than wing cracks. Secondary cracks were observed in both monotonic and cyclic tests. They always appeared after the wing crack initiation and led to the final failure. Secondary cracks initiated at the tips of the flaws and propagated in the colinear direction of the flaw or perpendicular to the loading axis. Figure 9 shows the two different types of secondary cracks.
3.2. Crack Propagation
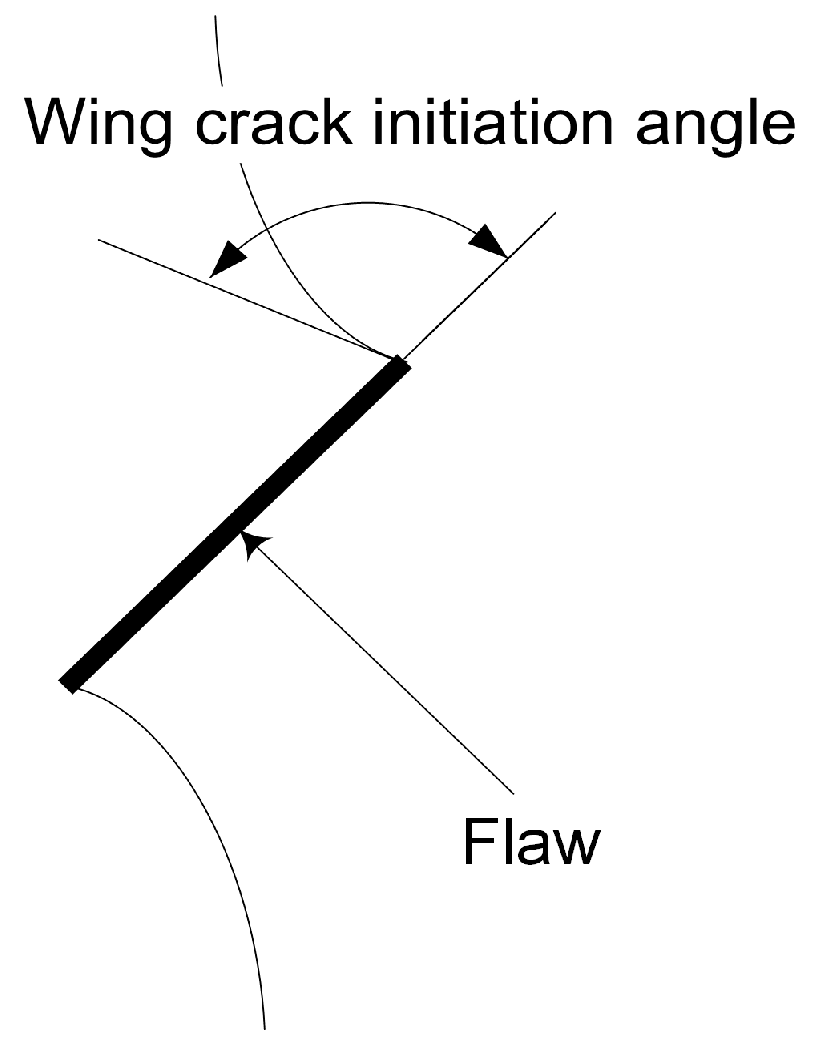
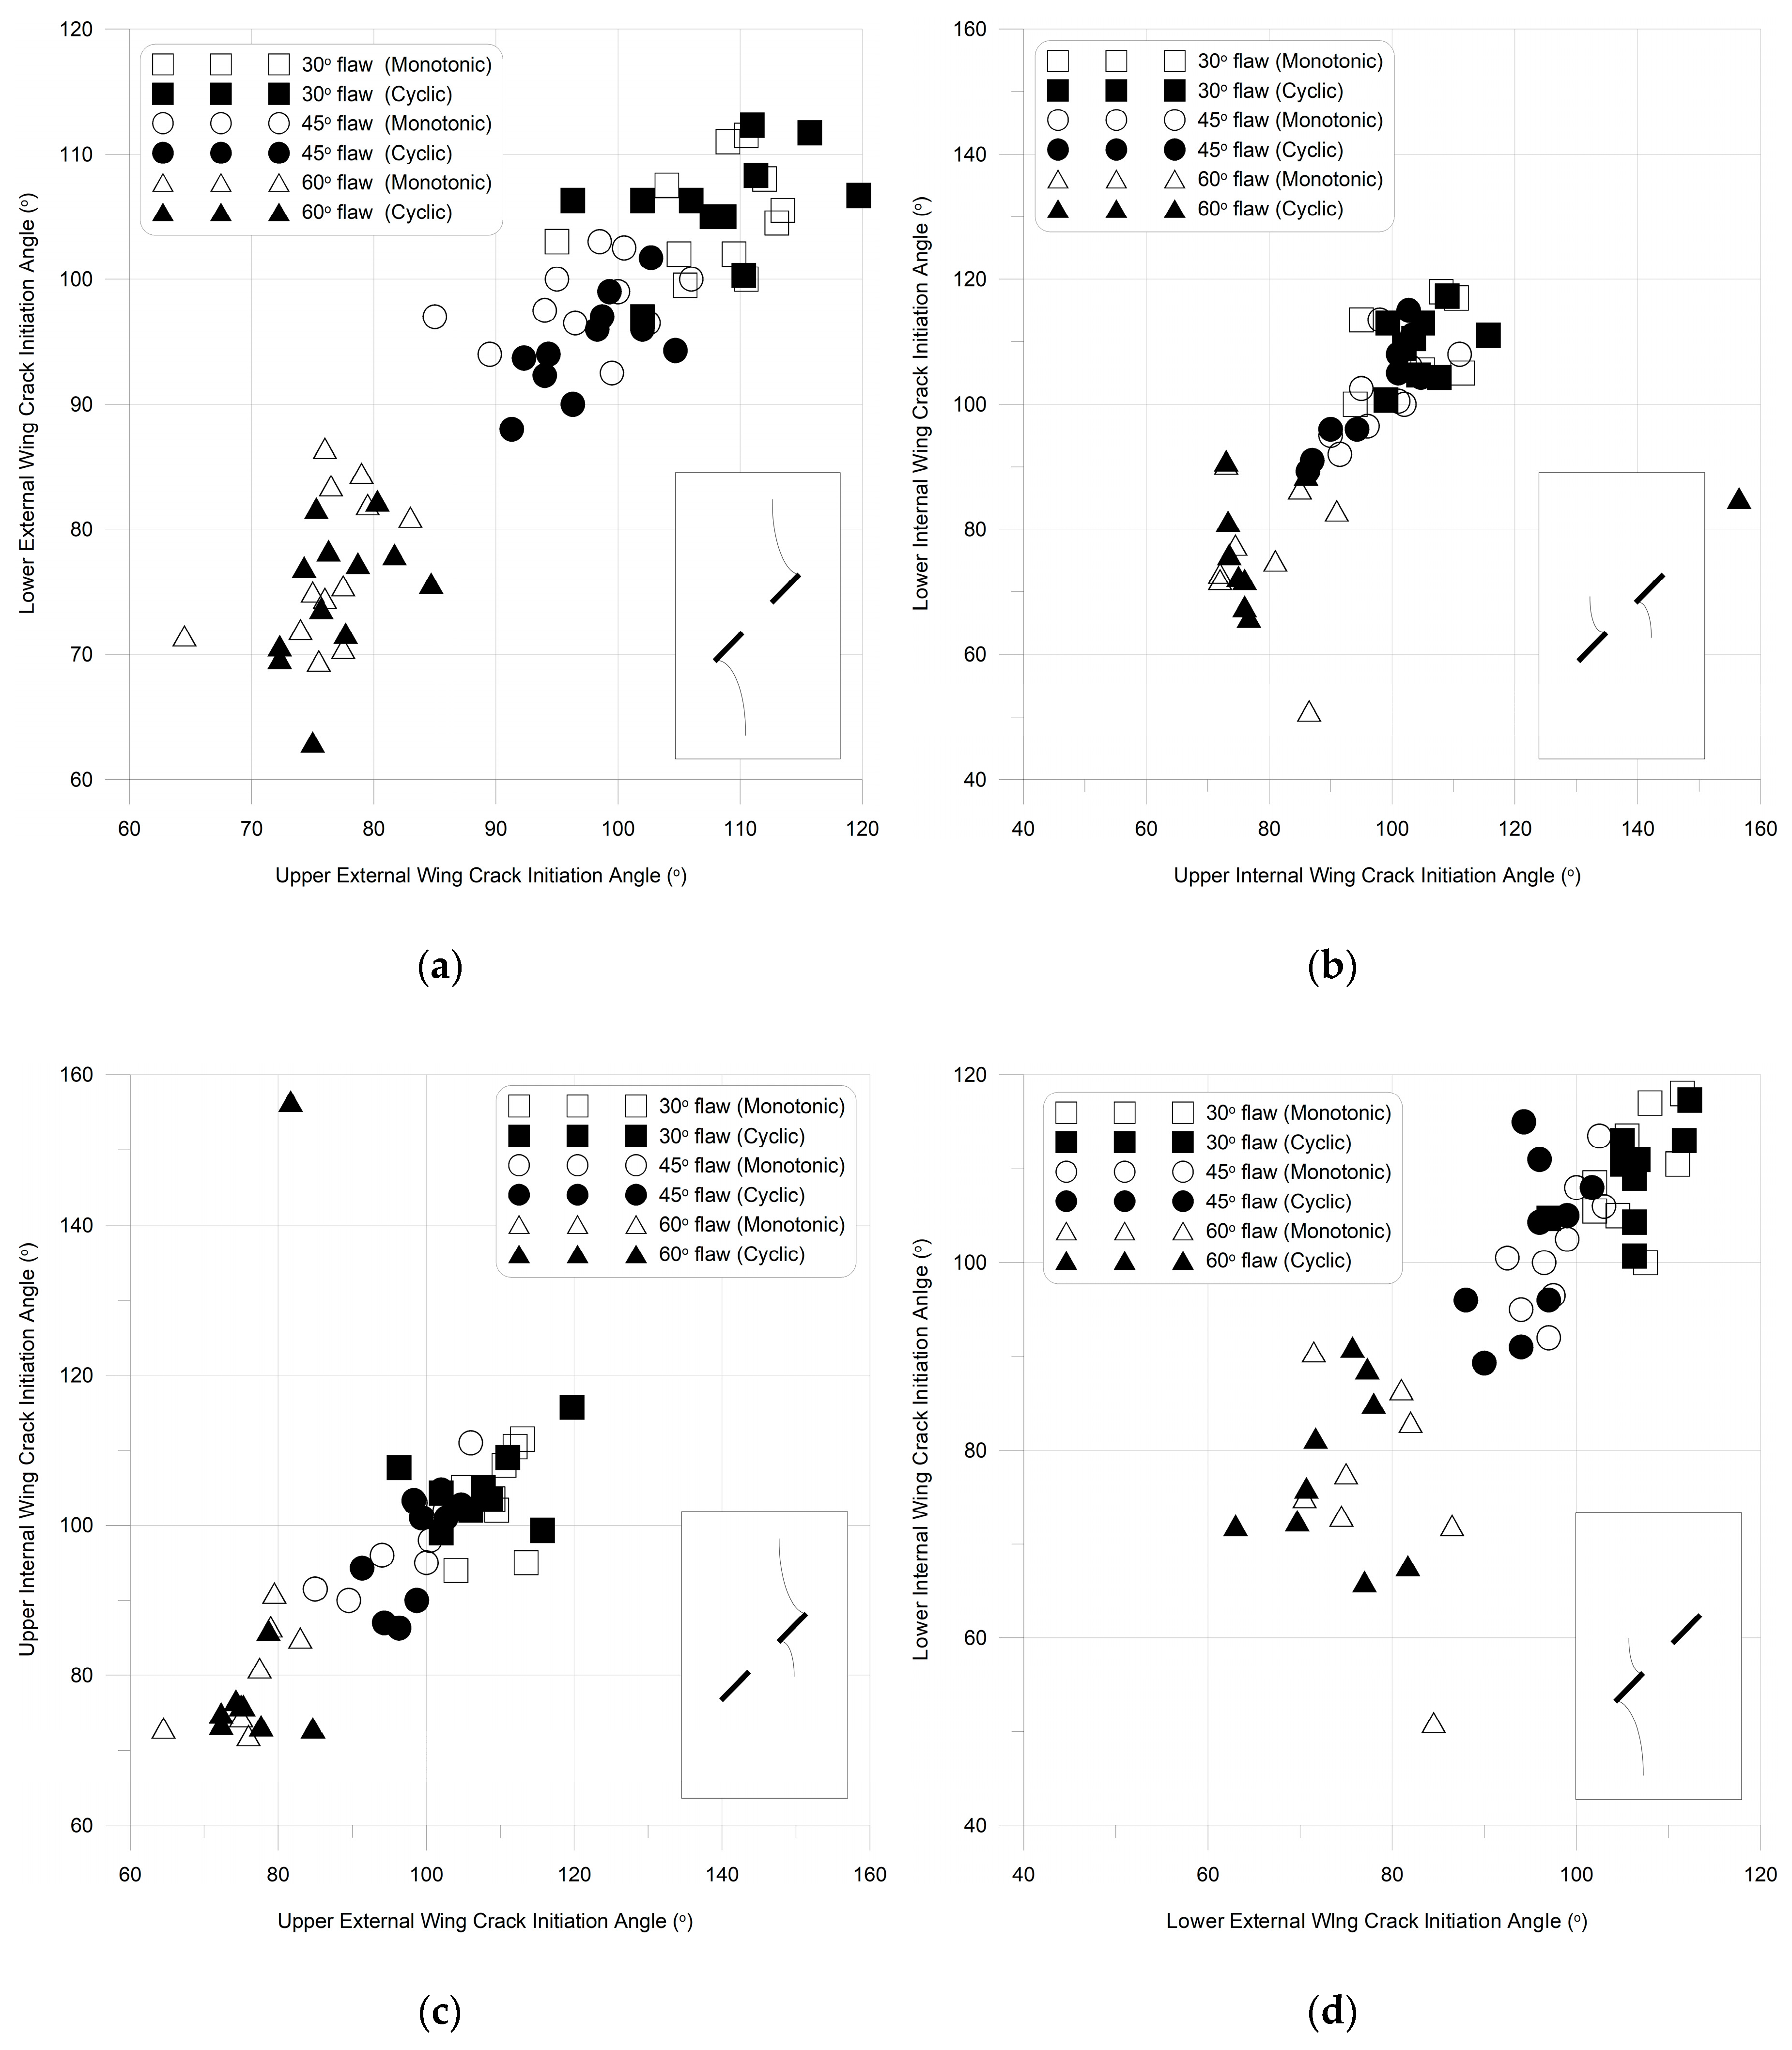
Wing crack propagation angles were measured at each wing crack initiation position (Figure 10). Figure 11 shows plots of the upper and lower external wing crack propagation angles, the upper and lower internal wing crack propagation angles, the upper external and internal wing crack propagation angles, and the lower external and internal wing crack initiation angles for all geometries and loading types. These plots roughly indicate that the upper and lower external wing crack propagation angle, the upper and lower internal wing crack propagation angles and the external and internal wing crack propagation angles have a linear relationship and are almost identical regardless of the geometry and loading type. The wing crack propagation angles also decreased as the flaw inclination angles increased.
3.3. Crack Coalescence
Both the monotonic and cyclic tests showed almost identical coalescence types. For colinear geometry specimens, coalescence occurred due to the internal shear cracks. For non-colinear geometry specimens, coalescence occurred through combinations of internal shear cracks, internal wing cracks and tension cracks. Table 4 summarizes all observed coalescence types.
Type I coalescence occurs by the propagation of internal shear cracks in a colinear flaw geometry or an almost colinear flaw geometry. The 30-0-a, 45-0-a, 60-0-a, 45-0-2a, 60-0-2a, 60-0-3a, 60-0-4a, and 30-a-2a geometries show Type I coalescence. The 30-0-2a geometry only shows Type I coalescence in monotonic tests, while Type I coalescence occurs only during cyclic tests within the 45-0-3a geometry.
Type II coalescence is formed by the connection of two internal shear cracks by a vertical or quasi-vertical tension crack. This tension crack is not a wing crack but is instead produced under tension. The 30-a-a, 45-a-a, 45-a-2a, 60-a-2a, 60-a-3a, 30-2a-a, 30-2a-2a, 45-2a-2a, 30-2a-3a, 60-a-a, 30-2a-a, 45-2a-2a, and 45-2a-3a geometries show Type II coalescence.
Type III coalescence can be divided into two classes: Type III-A and Type III-B coalescence. Type III-A coalescence takes place when an internal wing crack from one of the flaws reaches the other flaw. The 60-2a-2a and 60-a-0 geometries show Type III-A coalescence. Type III-B coalescence takes place when an internal shear crack from one of the flaws reaches the internal wing crack of the other flaw. The 60-2a-3a geometry shows Type III-B coalescence.
Type IV coalescence can be divided into three classes: Type IV-A, Type IV-B, and Type IV-C coalescence. Type IV-A coalescence occurs when two internal wing cracks from certain flaw tips reach the other flaw tips. The 30-a-0, 45-a-0, 60-a-a, 30-2a-0, and 45-2a-a geometries show Type IV-A coalescence. Type IV-B coalescence appears when two internal wing cracks from the flaw tips reach the middle of the other flaws and show a different wing crack curvature than in Type IV-A coalescence. The 60-a-0 geometry is a representative example of Type IV-B coalescence. Type IV-C coalescence occurs when two internal shear cracks from the flaw tips reach the internal wing cracks of the other flaws. The 60-2a-0 geometry is a representative example of Type IV-C coalescence.
Type V coalescence occurs by a combination of the connection of an internal wing crack that initiates from the internal tip of the upper flaw, an external wing crack that initiates from the external tip of the lower flaw, and Type III-A or Type III-B coalescence. An internal wing crack and an external wing crack propagate until they unite. An external wing crack has a reverse propagation direction from the other external wing crack. The 60-2a-a geometry is a representative example of this type of coalescence.
Type VI coalescence occurs by a combination of the connection of two internal wing cracks that propagate until they unite, tension cracks, and internal shear cracks. The first two internal wing cracks initiate from the internal tips of the flaws and propagate until they join. Then, other tension cracks initiate from the external tips of the flaws and propagate to the other tips. Finally, internal shear cracks develop at the external tips of the flaws and reach the other tension cracks. The 45-2a-0 geometry is a representative example of Type VI coalescence.
3.4. Subcritical Crack Growth Parameters
The colinear flaw geometries of 45-0-2a and 60-0-2a and the non-colinear flaw geometries of 45-a-a and 45-2a-2a were employed for the determination of subcritical crack growth parameters. In the 45-0-2a and 60-0-2a specimens, coalescence occurred by the propagation of internal shear cracks, and then external wing cracks propagated until the specimen failed under monotonic and cyclic loading. In the 45-a-a and 45-2a-2a specimens, coalescence occurred through a vertical or quasi-vertical tension crack.
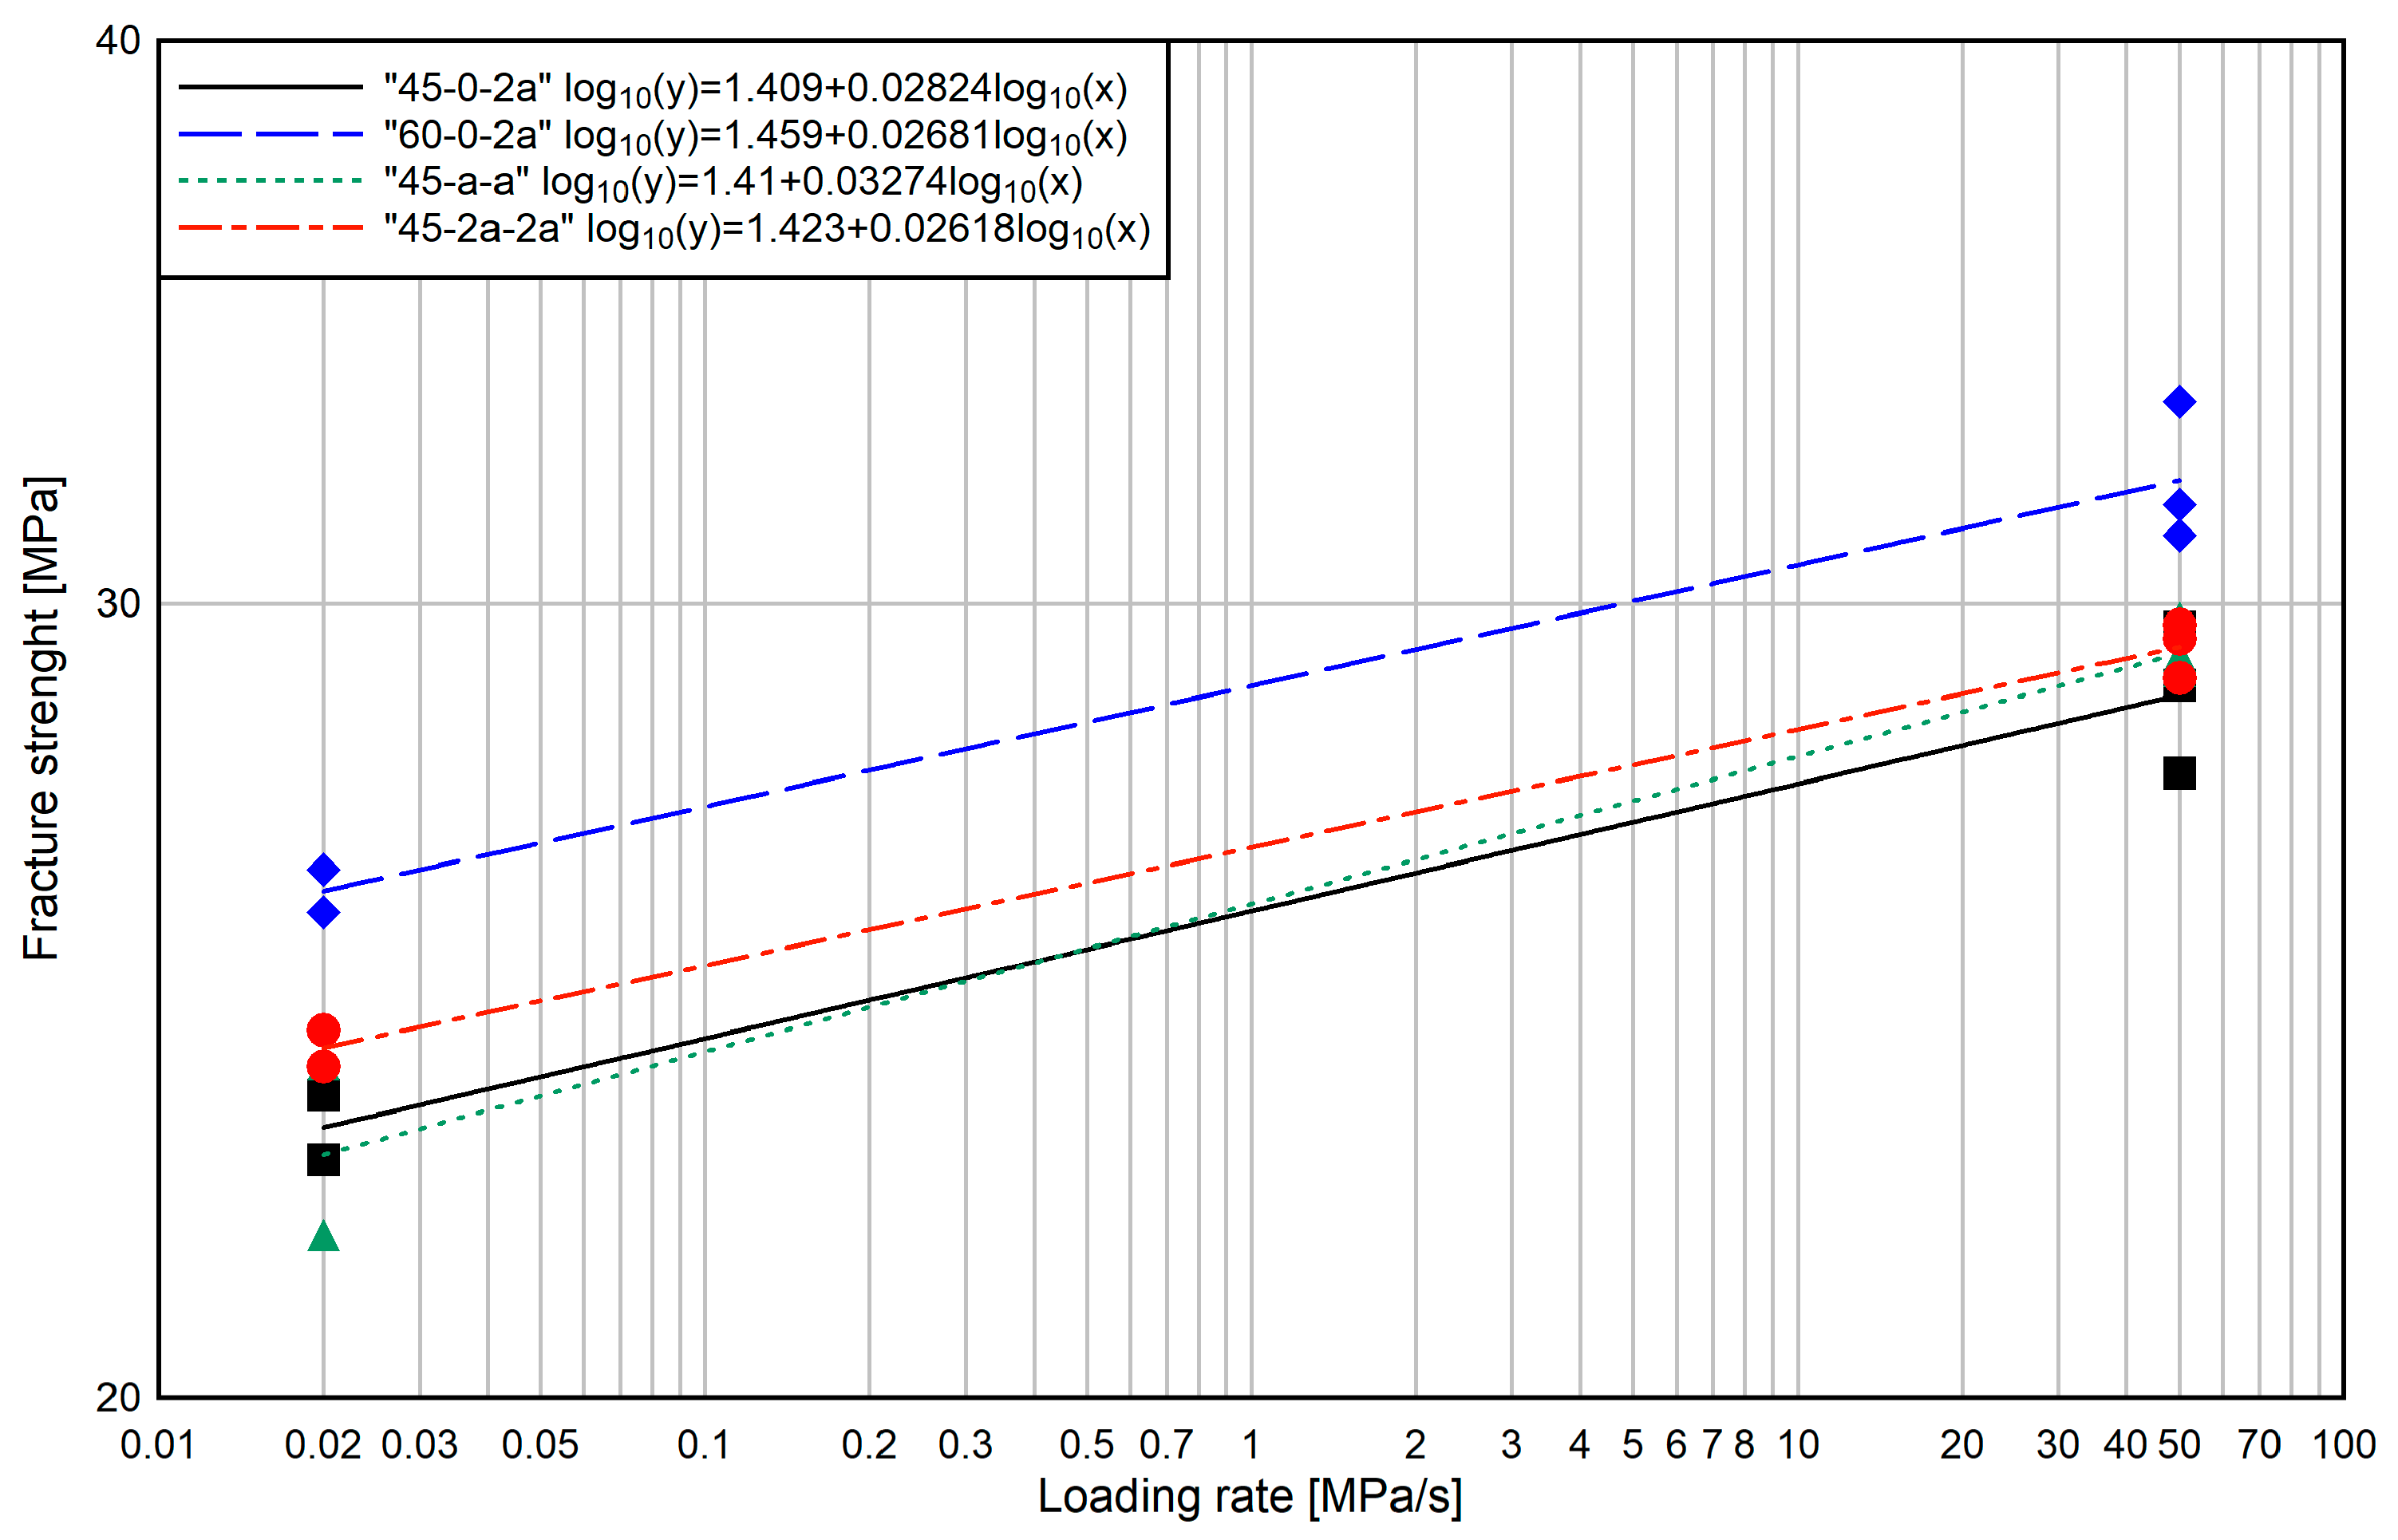
For the 45-0-2a and 60-0-2a specimens, the fracture strength was determined when the coalescence occurred through the propagation of internal shear cracks. For the 45-a-a and 45-2a-2a specimens, the fracture strength was determined when a vertical or quasi-vertical tension crack occurred to coalesce the flaws. Two tests were performed for the loading rate of 0.02 MPa/s, and three tests were carried out for the loading rate of 50 MPa/s.
The relationship between the loading rate and fracture strength is presented in Figure 12. The subcritical crack growth parameter n values for the 45-0-2a and 60-0-2a specimens, which were coalesced by shear cracks, were 34 and 36, respectively. The subcritical crack growth parameter n values for the 45-a-a and 45-2a-2a specimens, which were coalesced by vertical tension cracks, were 30 and 37, respectively.
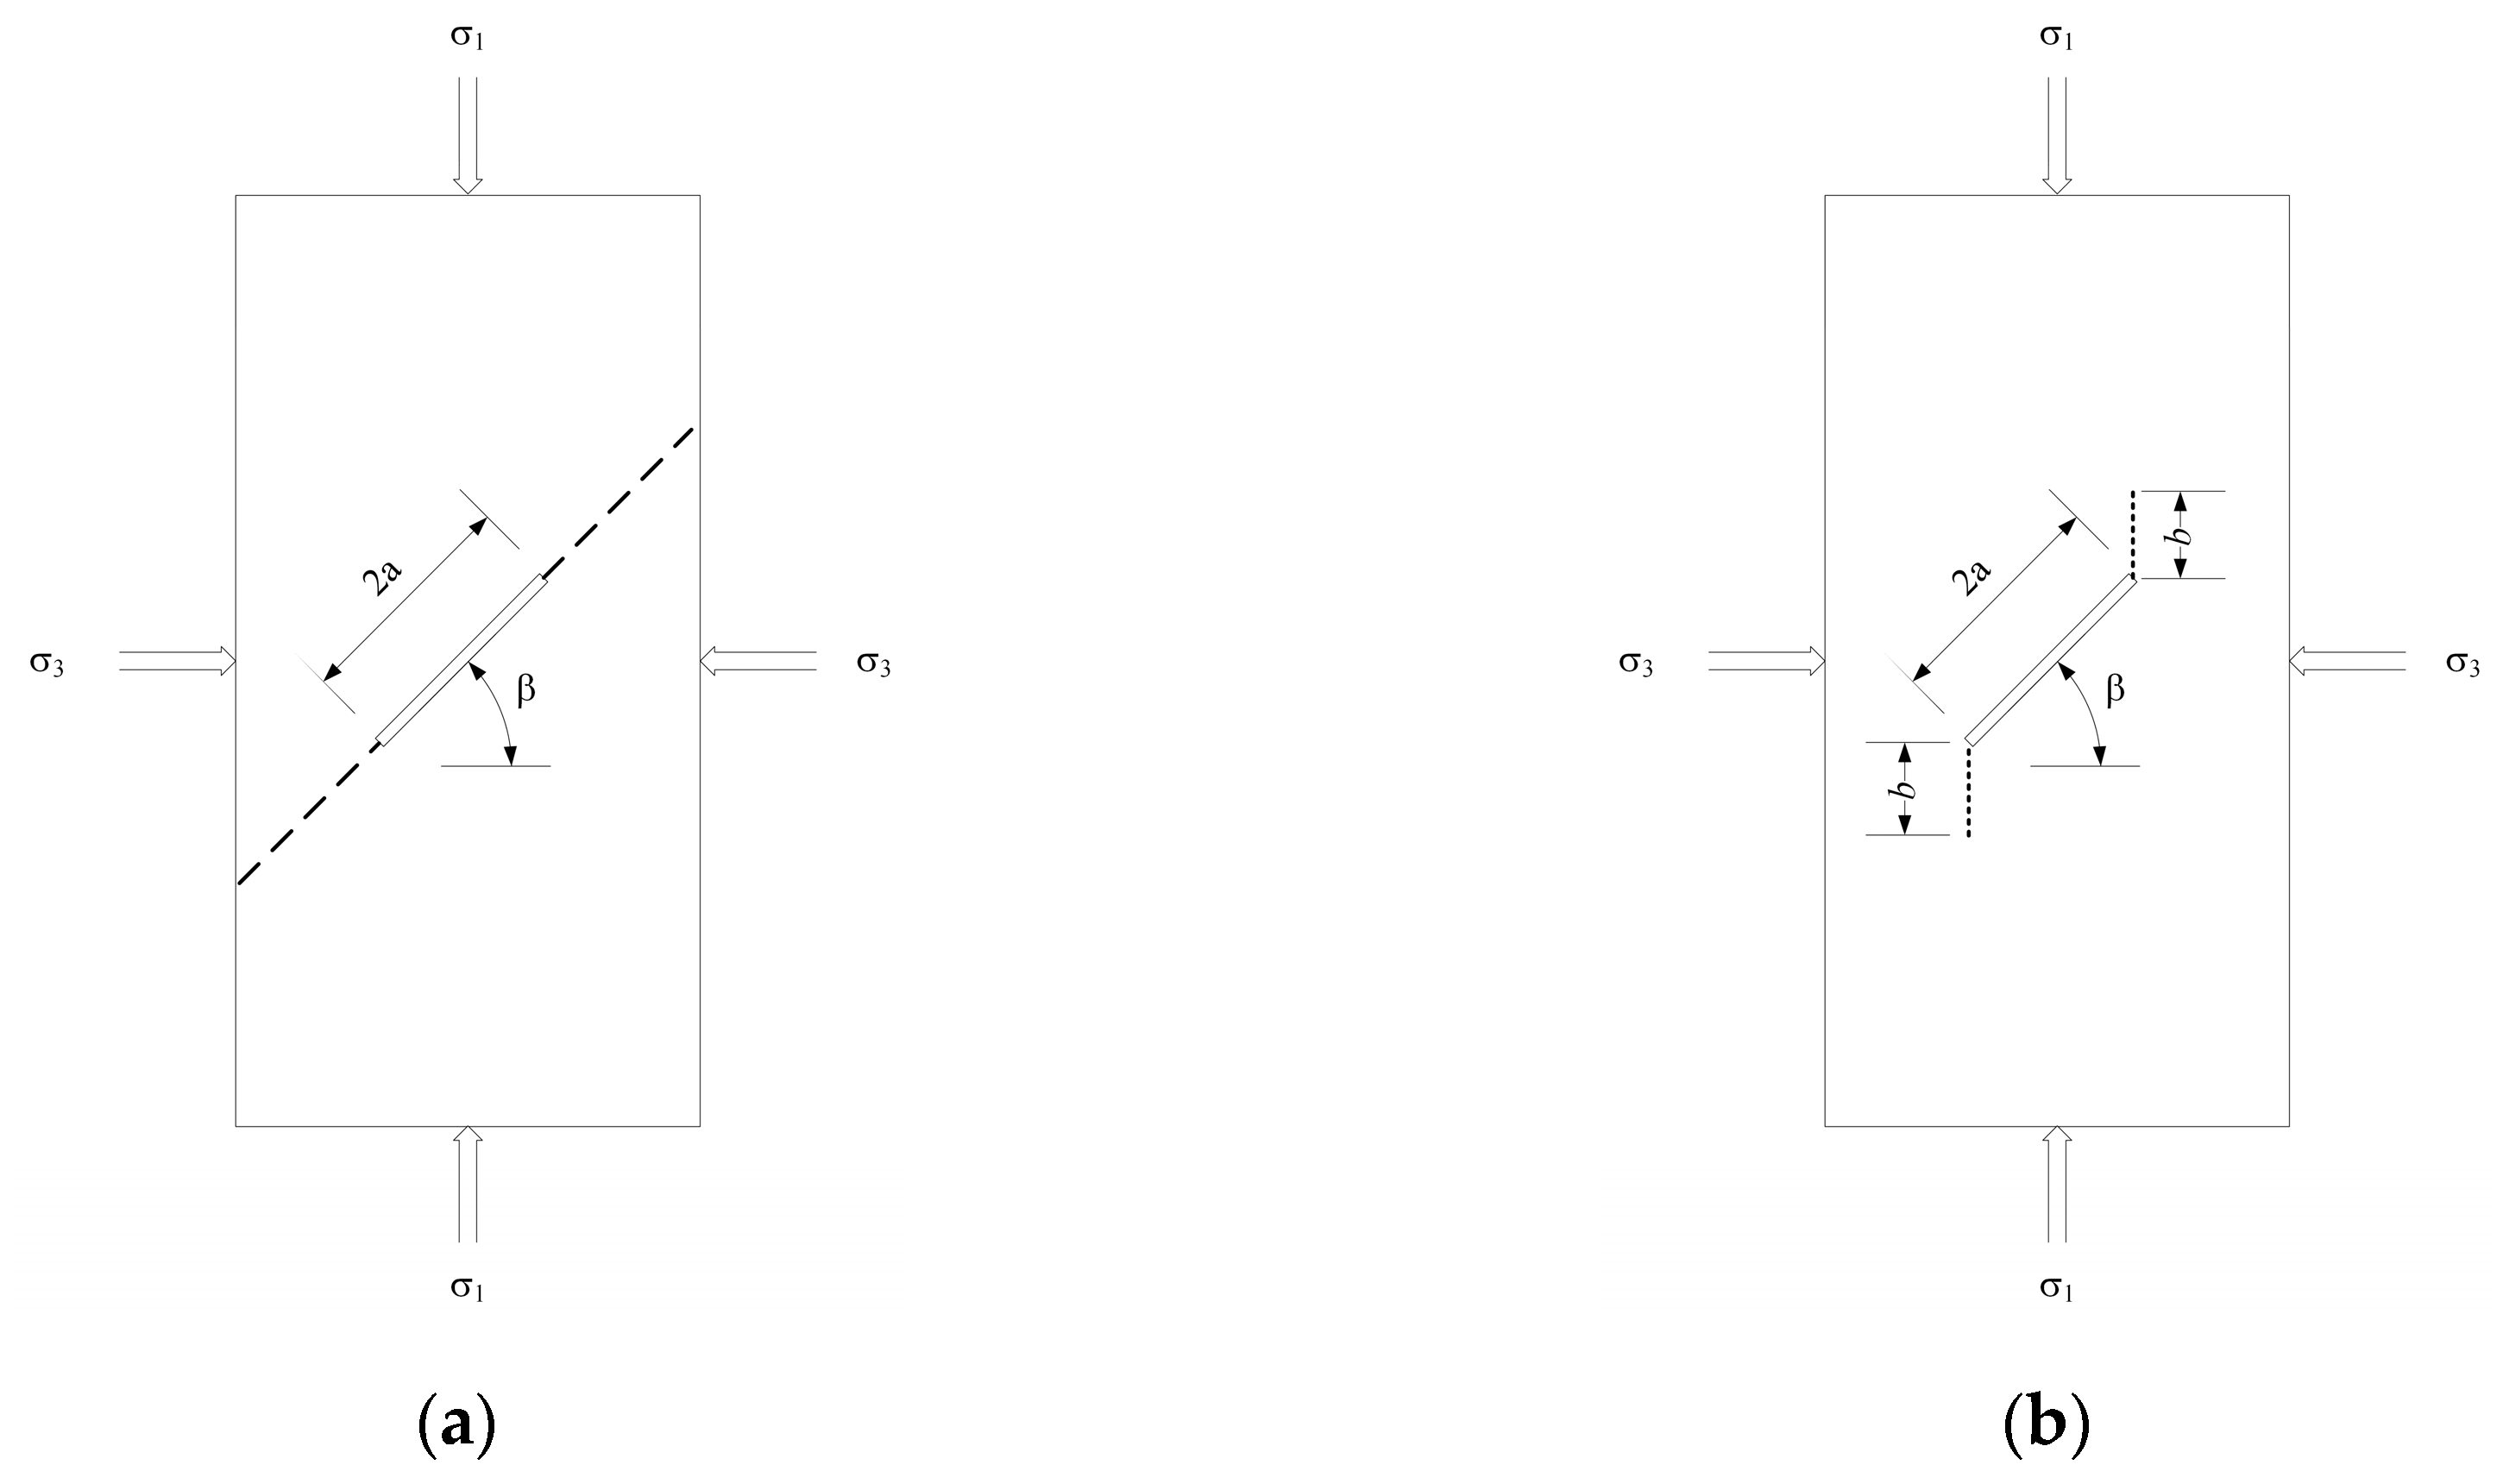
Stress intensity factors are needed to determine the subcritical crack growth parameter m under cyclic loading. The specimens coalesced by shear cracks used the shear crack model to determine the stress intensity factor [26]. A schematic illustration of the shear crack model is shown in Figure 13a. The shear crack model assumed that the cracks grew in their own plane. The stress intensity factor is expressed as:
where a is half of the crack length and τ* is the effective shear stress.
τ* is given by:
where β is the crack inclination angle, and μ is the friction coefficient between the crack surfaces.
In this study, only a uniaxial compression was applied, and the cracks remained open under compression; Equation (7) can be simplified as:
and the stress intensity factor of Equation (6) yields:
The specimens coalesced by a vertical tension crack employed the sliding crack model to determine the stress intensity factor [28]. A schematic illustration of the sliding crack model is shown in Figure 13b. The sliding crack model predicted that the failure of the rock would occur by axial splitting. The stress intensity factor solution for this configuration was given as:
where b is the wing crack length and τ* is given in Equation (7).
Additionally, only a uniaxial compression was applied and Equation (10) is reduced to:
The stress intensity factor equations of the shear crack model and sliding crack models developed while containing one crack and did not consider the interaction of the two cracks. The specimens used in this study included two existing cracks, but they were separated by more than half of the length of the crack; consequently, the interactions between the two cracks would be negligible when new cracks grew from the exiting crack tip. Therefore, Equations (9) and (11) were assumed to be valid even under conditions with two exiting cracks.
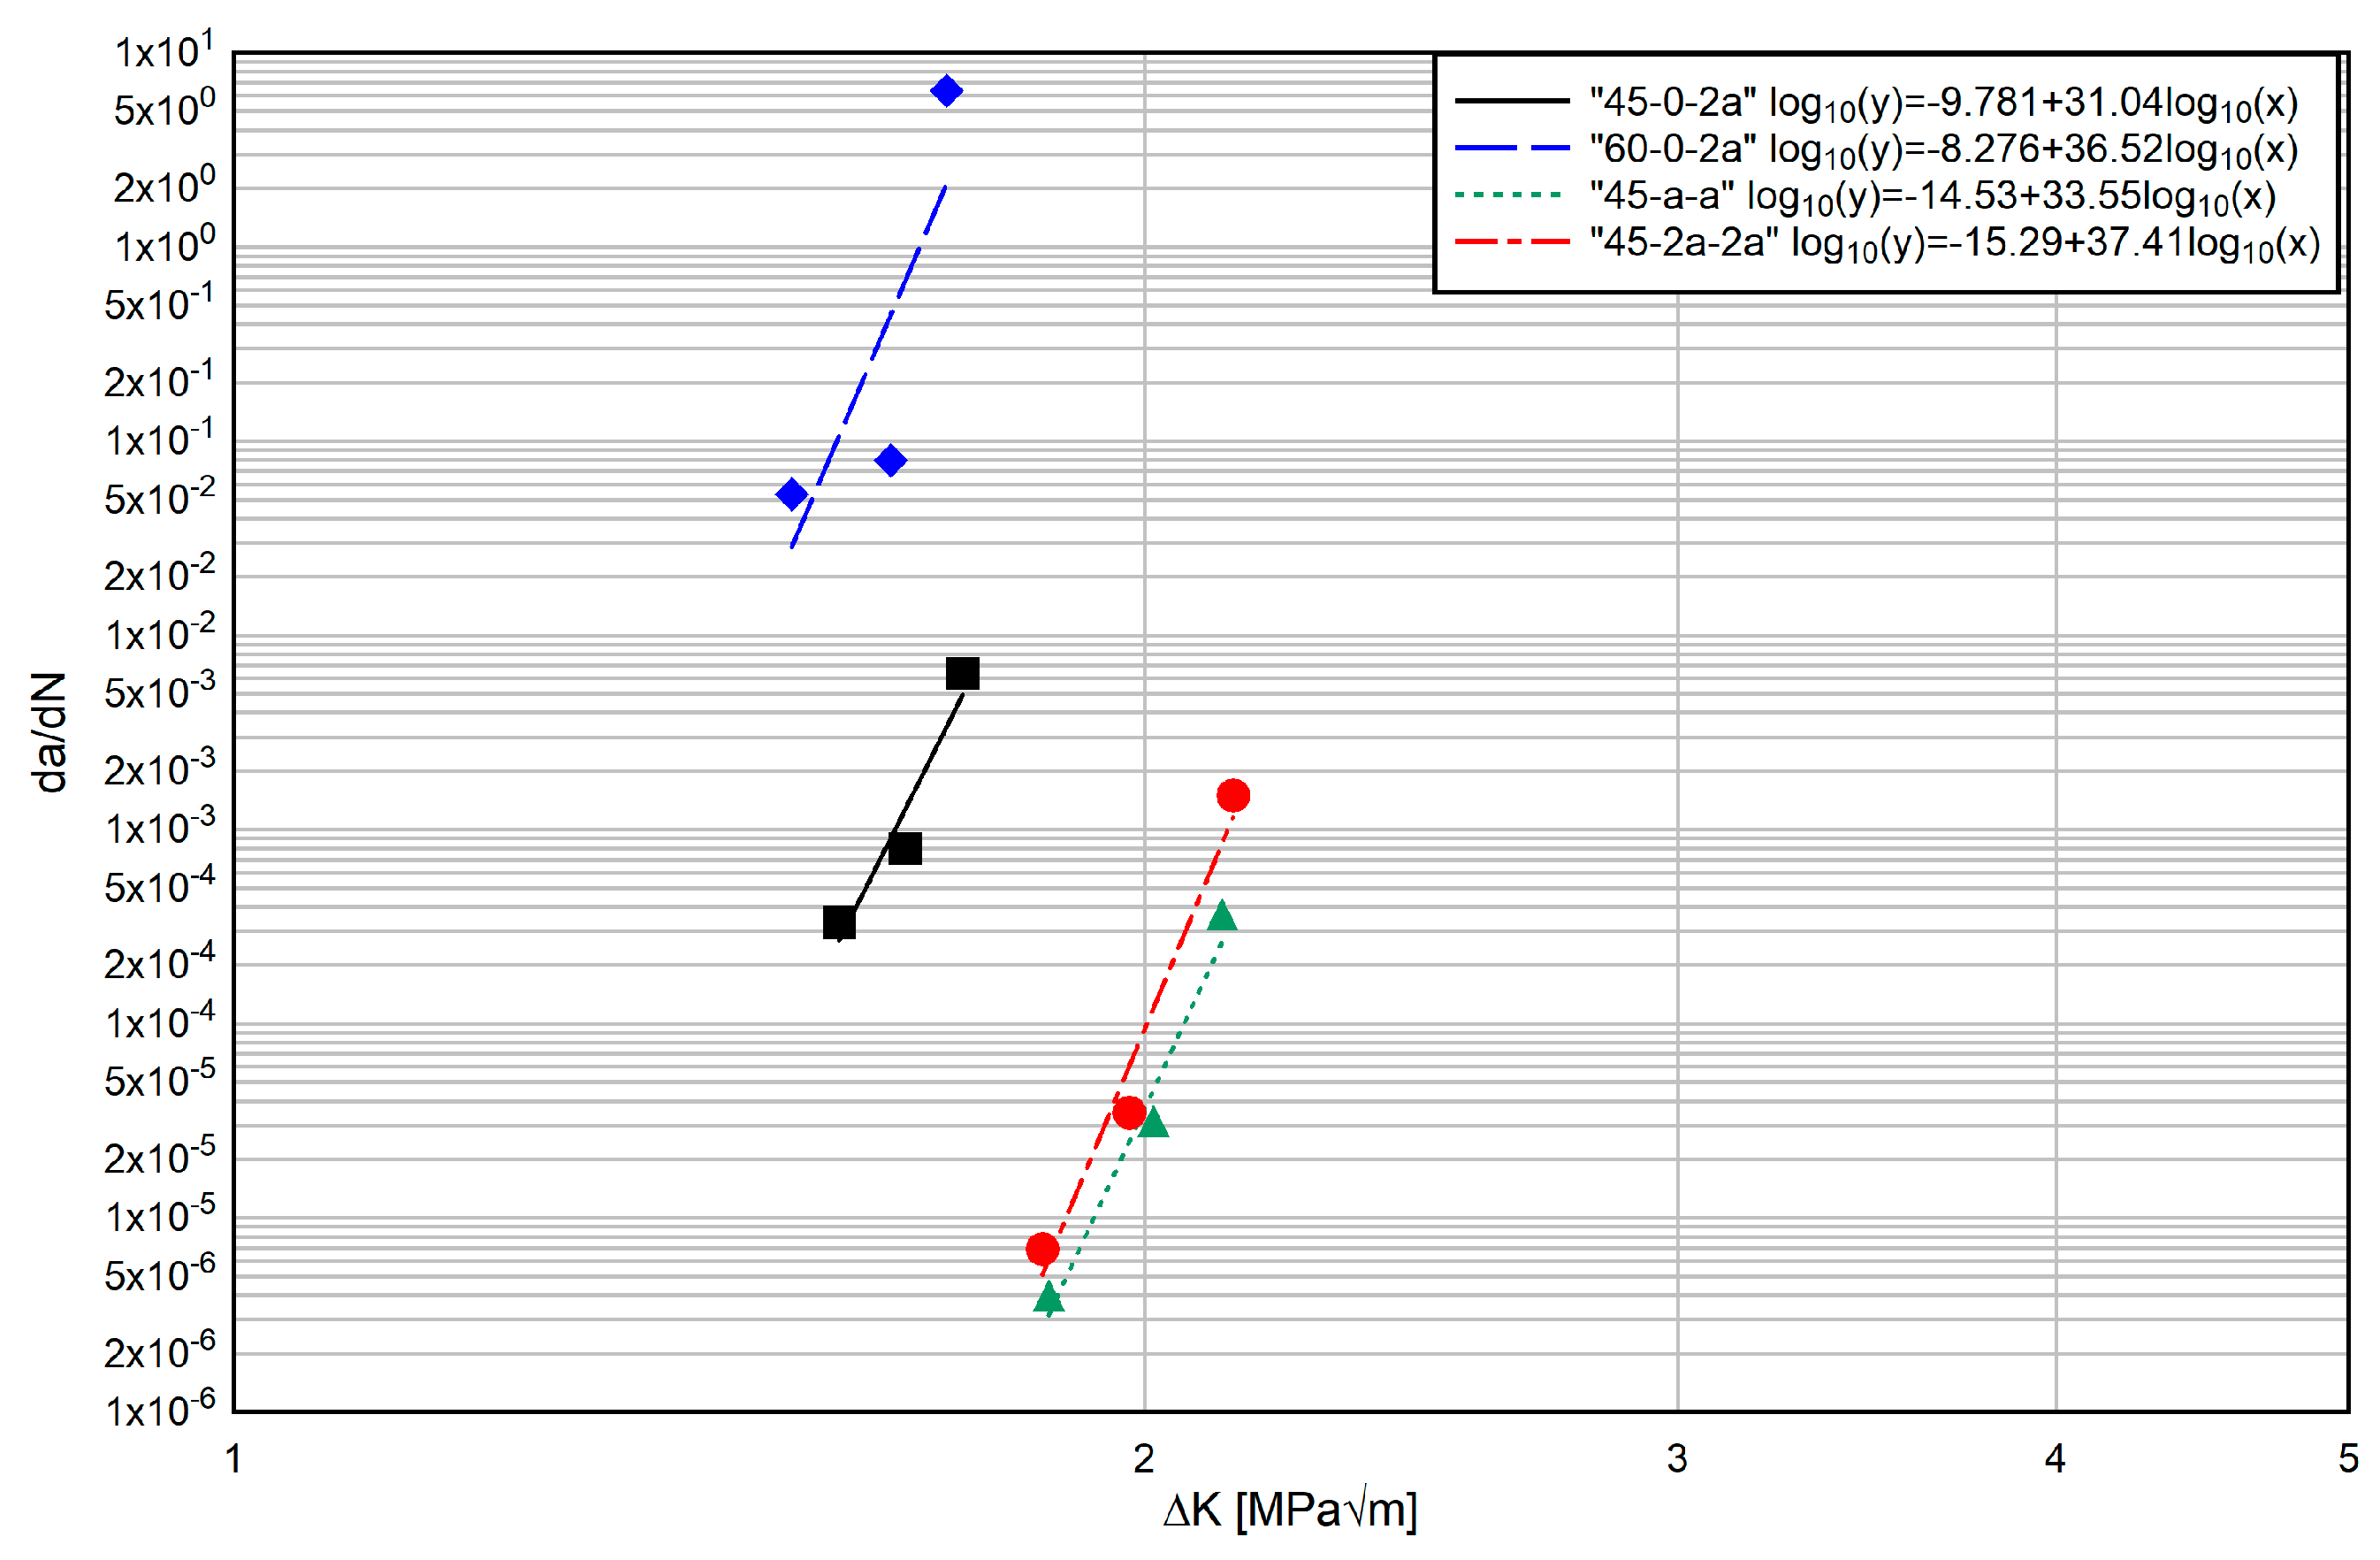
Figure 14 presents the variation in the crack growth rate per cycle as a function of the stress intensity factor range ∆K.
For the 45-0-2a and 60-0-2a specimens, the subcritical crack growth parameter m values under cyclic loading were 31 and 37, respectively. The subcritical crack growth parameter m values under cyclic loading in the 45-a-a and 45-2a-2a specimens were 34 and 37, respectively.
4. Discussion
4.1. Crack Propagation
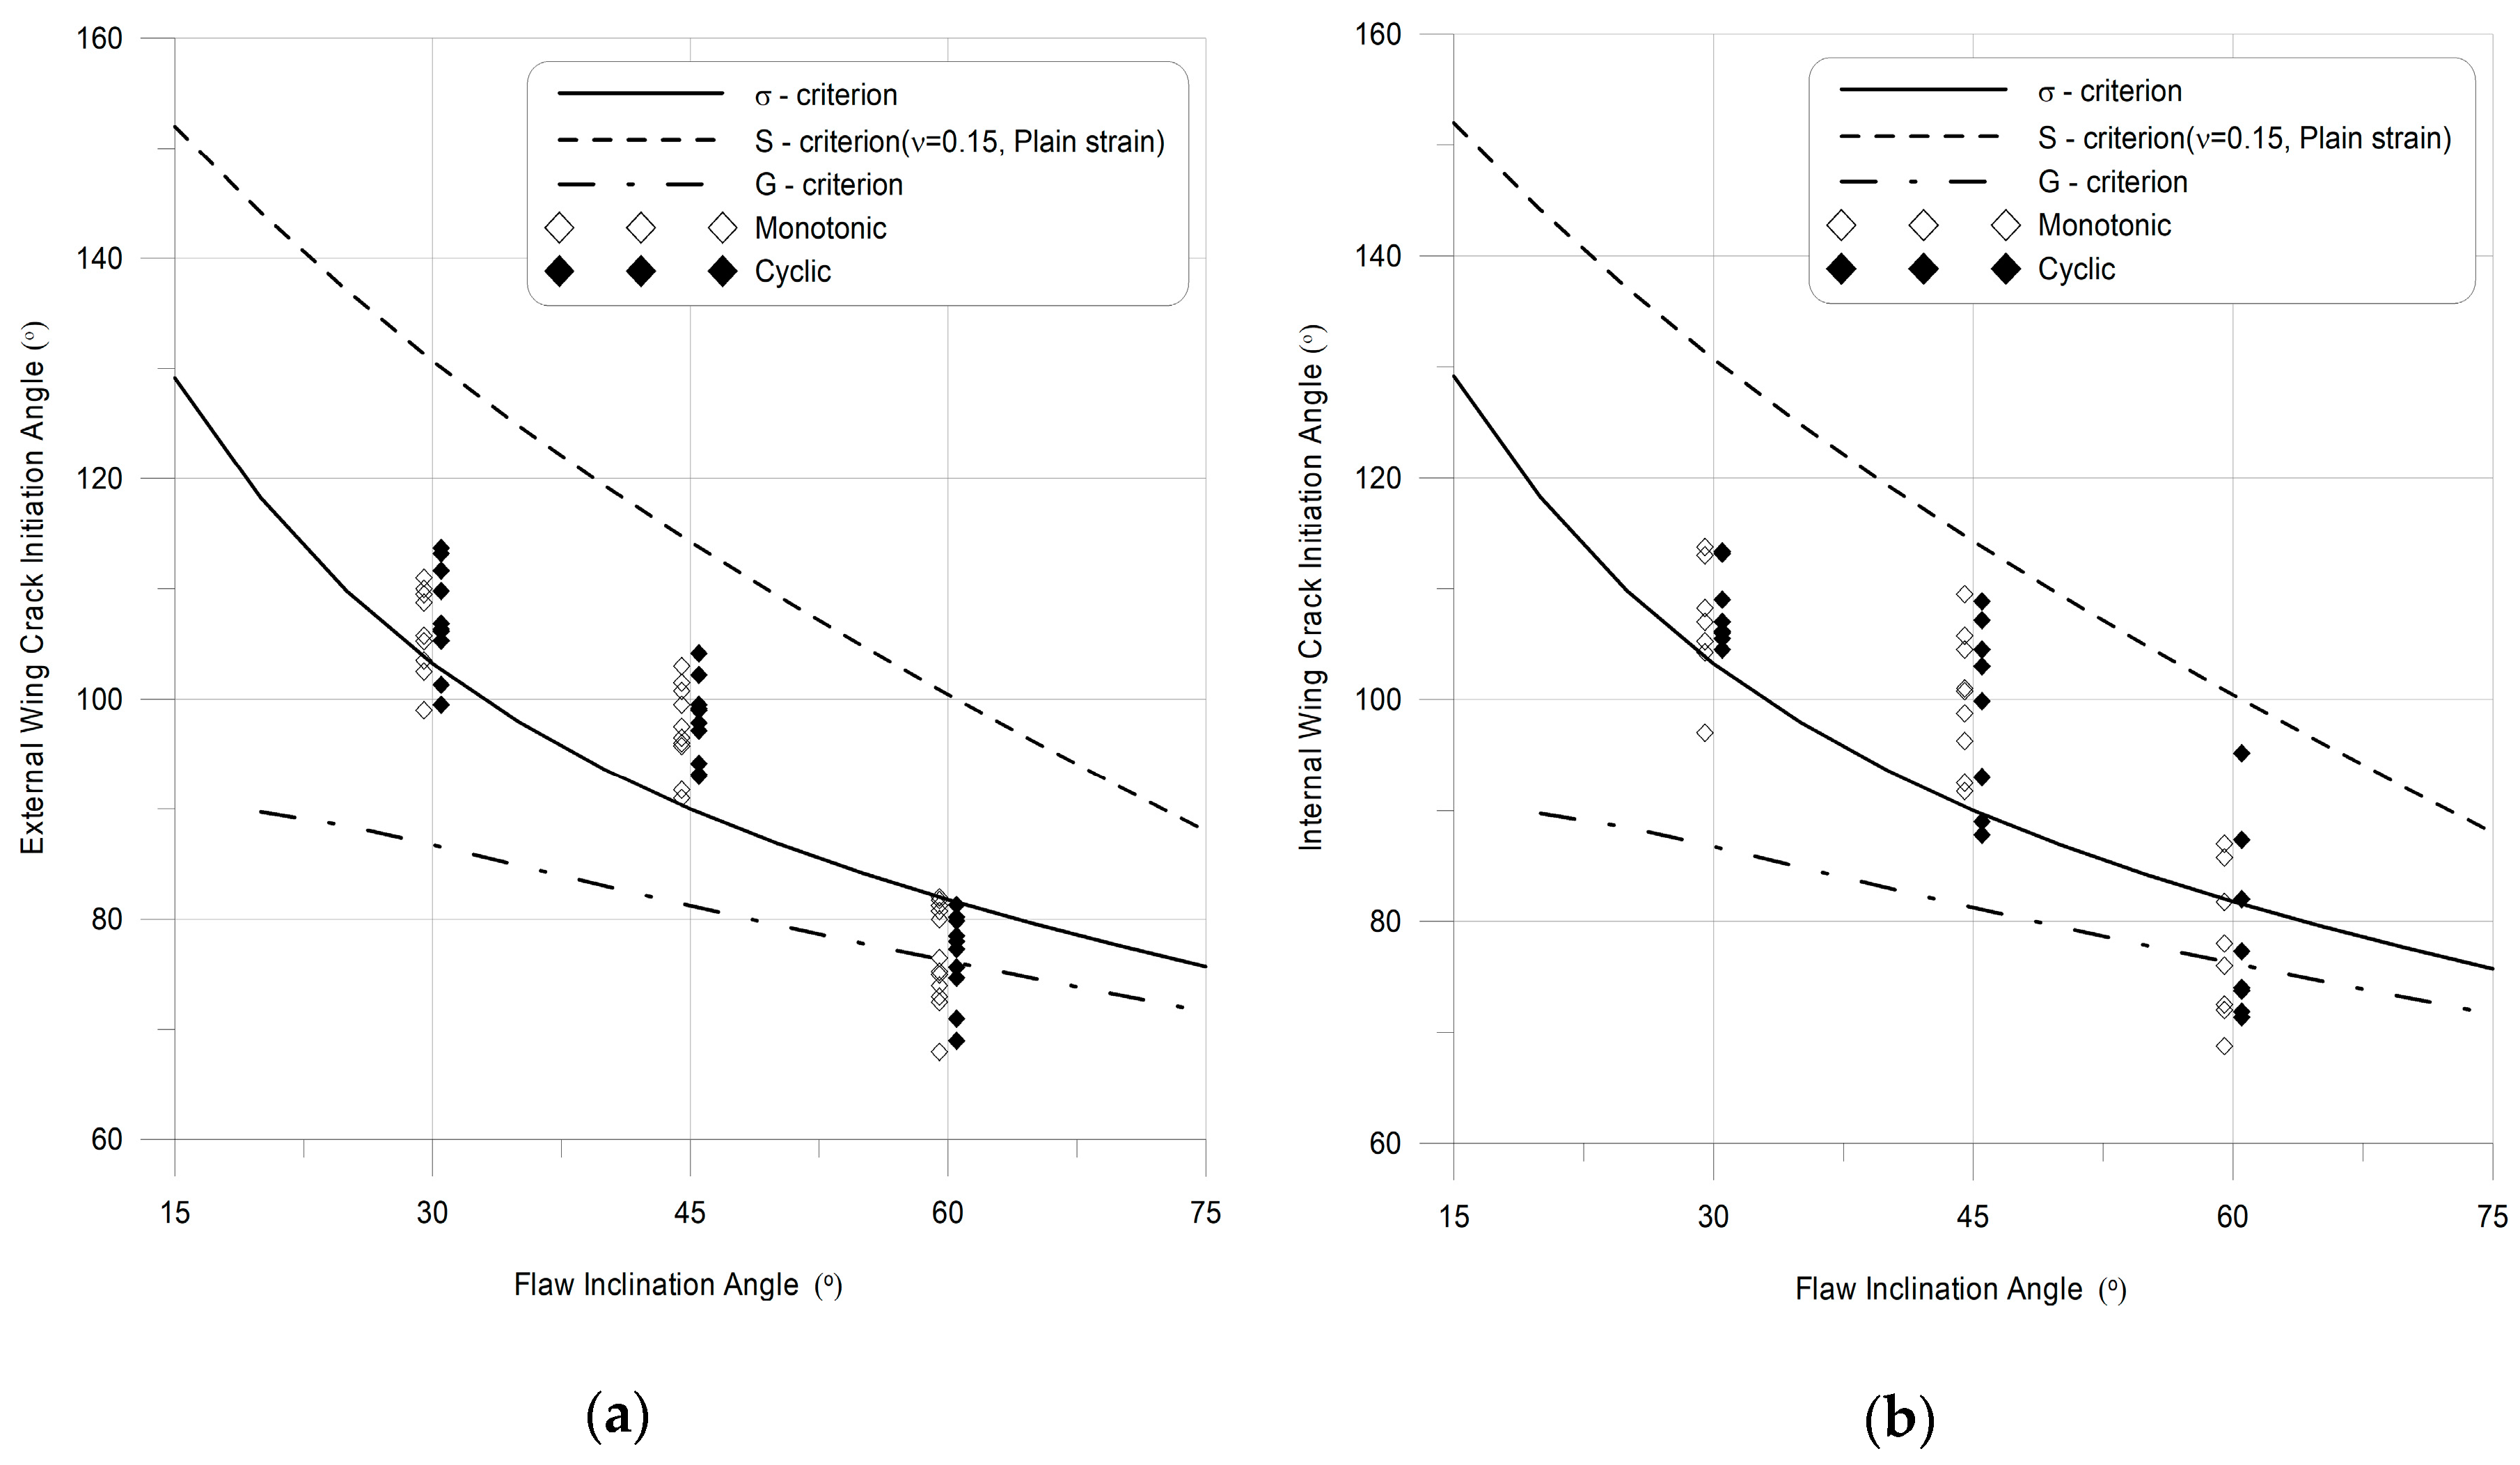
Crack propagation directions (from crack propagation theories such as the σ-criterion [29], the G-criterion [30], and the S-criterion [31]) as well as the external and internal wing crack initiation angles from this study’s monotonic and cyclic tests are presented in Figure 15a,b, respectively. The wing crack initiation angles in monotonic tests were similar to those observed in the cyclic tests. For the 30° and 45° flaw inclination specimens, both the external and internal wing crack initiation angles occurred between the S-criterion and G-criterion. For the 60° flaw inclination specimens, the wing crack initiation angles are lower than the theoretical values. Overall, the σ-criterion appears to fit the experimental results closest compared to the other criterion.
4.2. Crack Coalescence
In general, the coalescence patterns were similar to each other during monotonic and cyclic loading. Table 5 lists the average coalescence stress and standard deviation with respect to the flaw inclination angles under monotonic loading. Larger flaw inclination angles showed higher coalescence stress. For the 45-0-3a geometry, coalescence occurred during cyclic loading but did not occur during monotonic loading (Figure 16). This phenomenon is due to the difference in the size of the fracture process zone (FPZ) according to the loading conditions. Le et al. [24] showed that the fracture process zone under cyclic loading is larger than that under monotonic loading. Thus, it is believed that the larger size of the fracture process zone would facilitate the coalescence between two existing flaws under cyclic loading.
4.3. Secondary Cracks
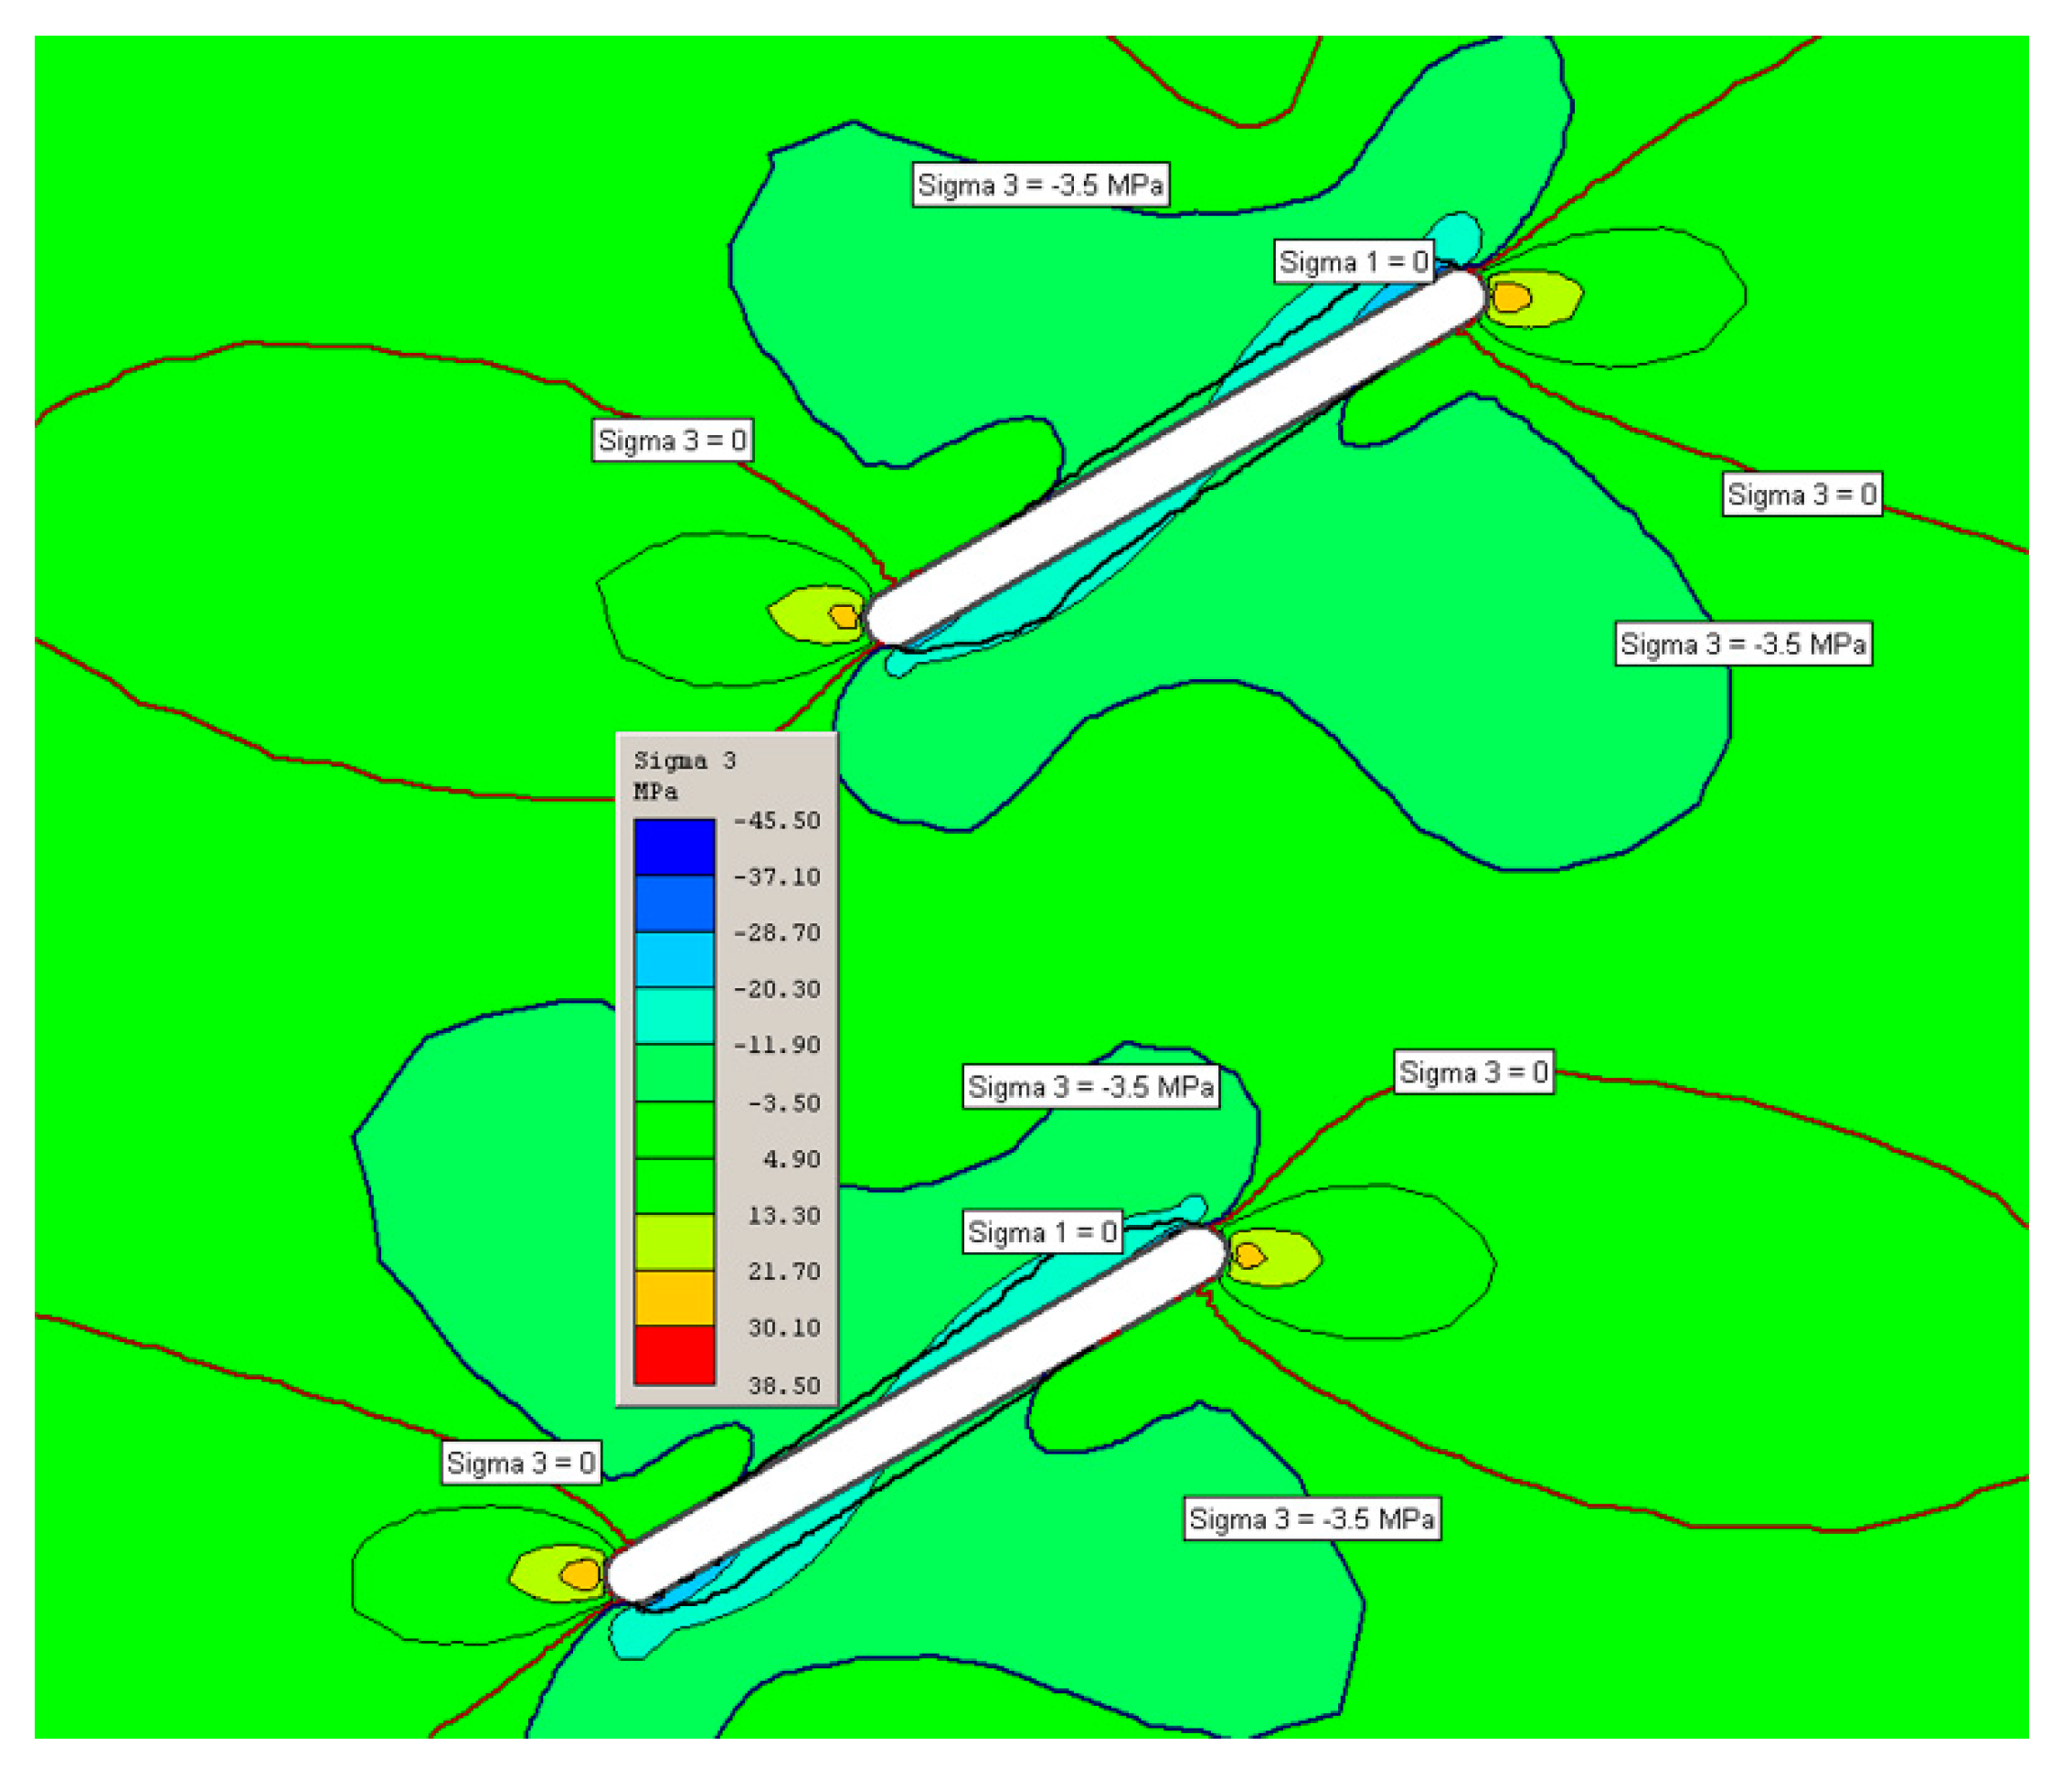
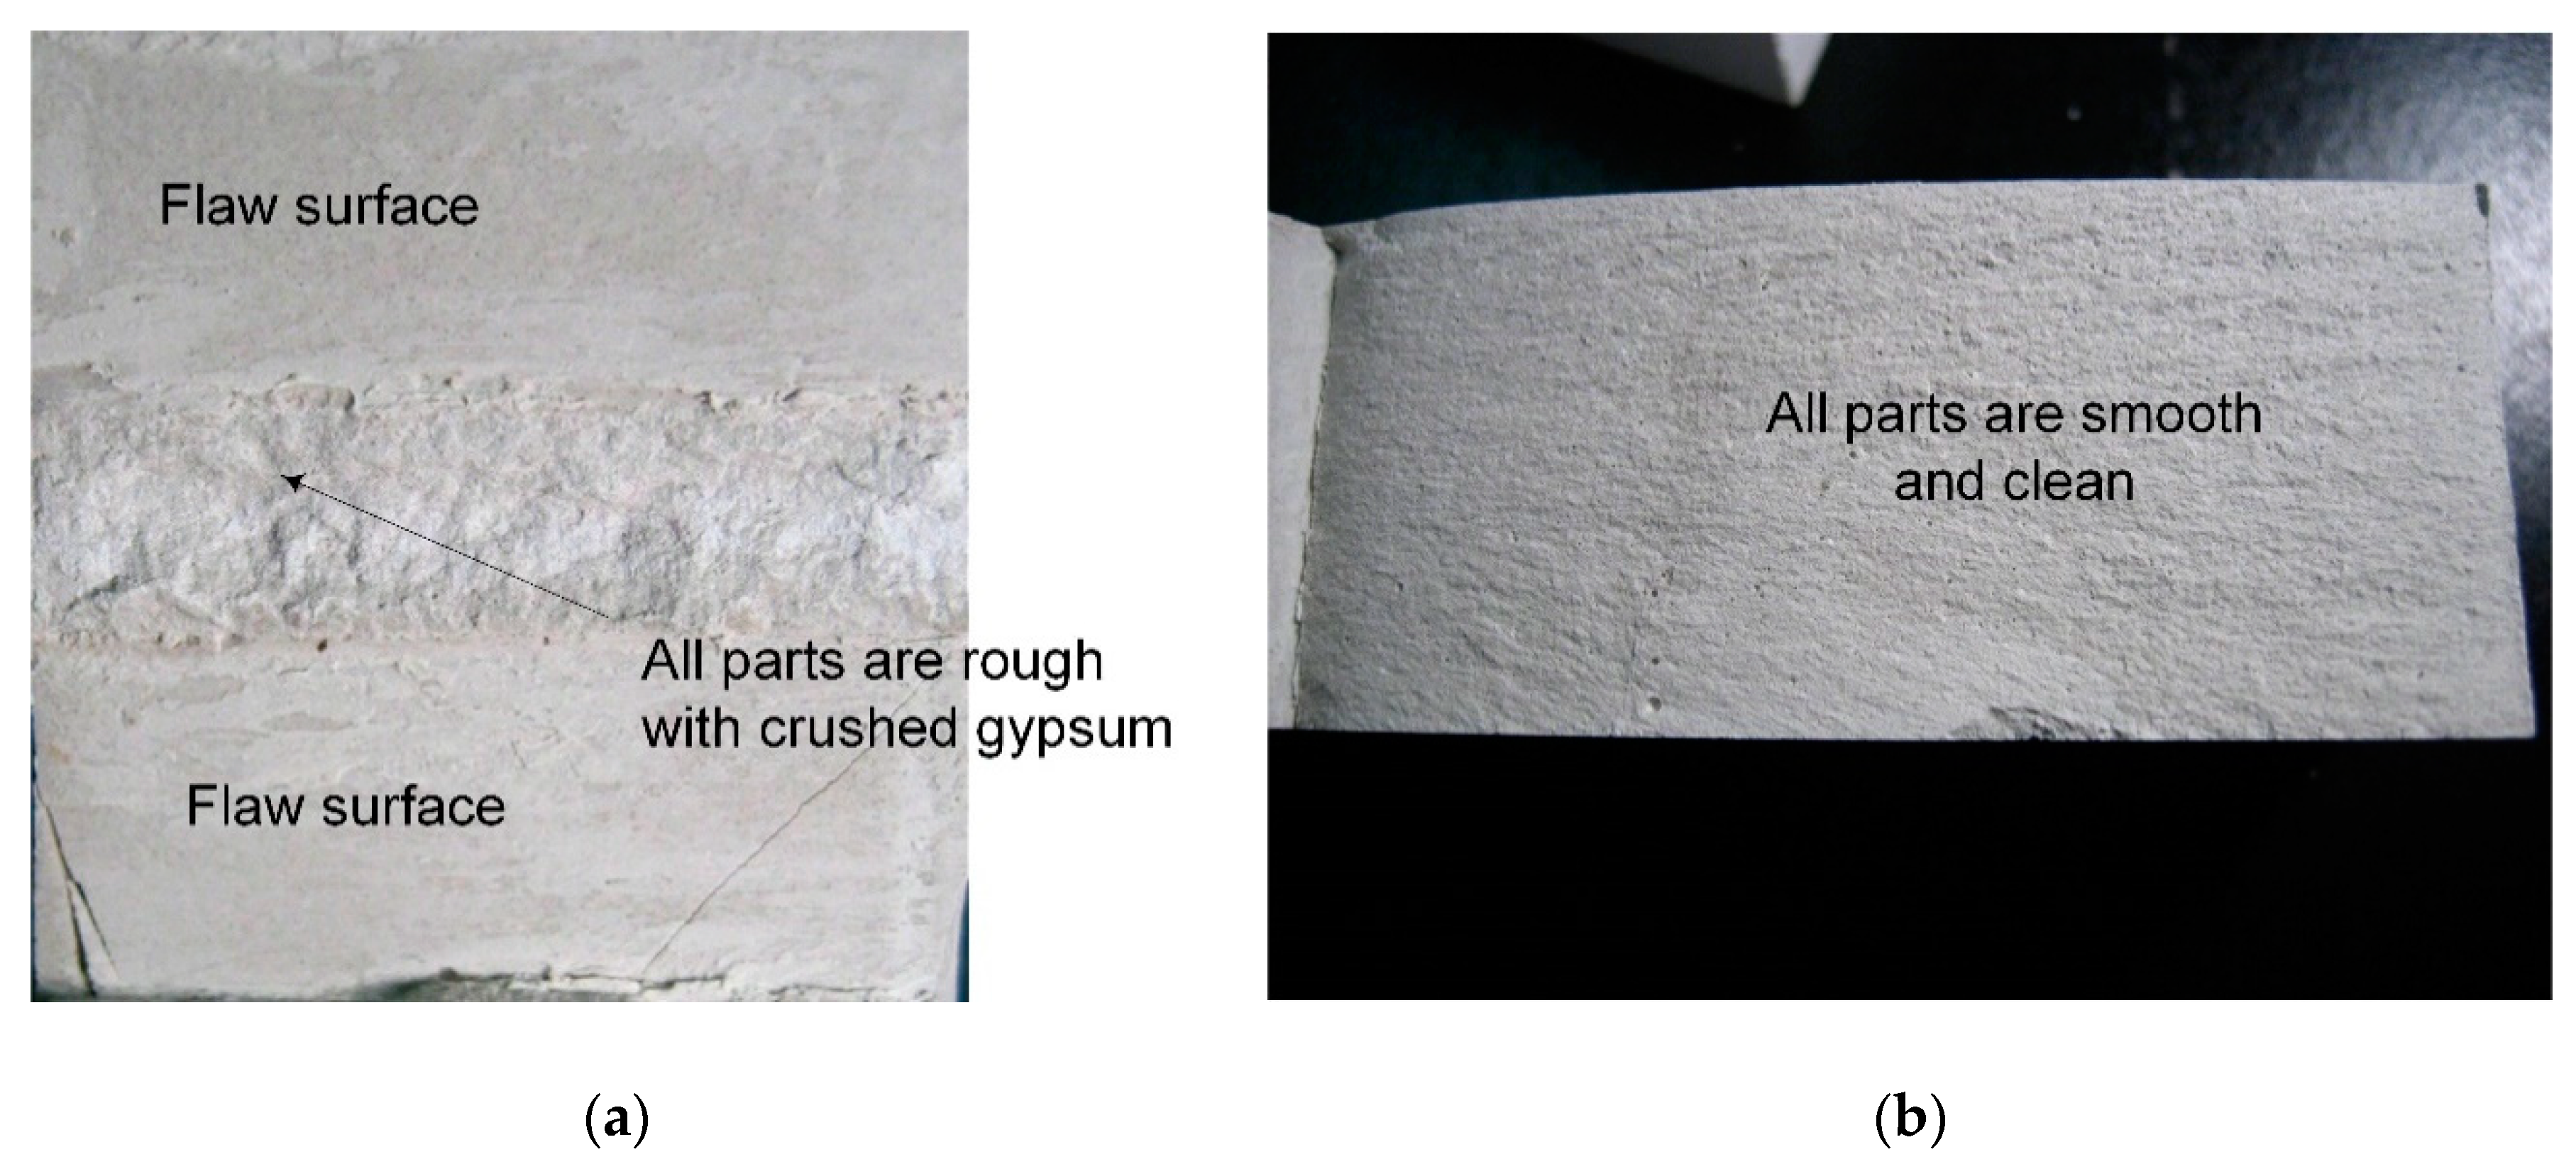
The term “secondary cracks” can be attributed to the initiation of cracking after the wing crack occurred. Many studies have shown that secondary cracks have a shear origin [8,9,10,11]. However, Wong and Einstein [12] have shown that the secondary cracks consist not only of shear cracks but also of tensile cracks. In this research, secondary cracks are shear cracks. First, the stress state around the flaw tip shows that the secondary cracks initiated in a compressive stress zone. Figure 17 shows finite element analysis results with the principal stress around the flaw tip for the 30-2a-0 geometry, and the stress state around the flaw tip was in compression. Second, the surface of the secondary cracks is very rough and composed of crushed gypsum and gypsum powder. Figure 18 compares the crack surfaces. Figure 18a shows the surface of the coalescence crack due to the internal shear cracks. Figure 18b shows the surface of a wing crack, which is smooth and clean.
4.4. Fatigue Cracks
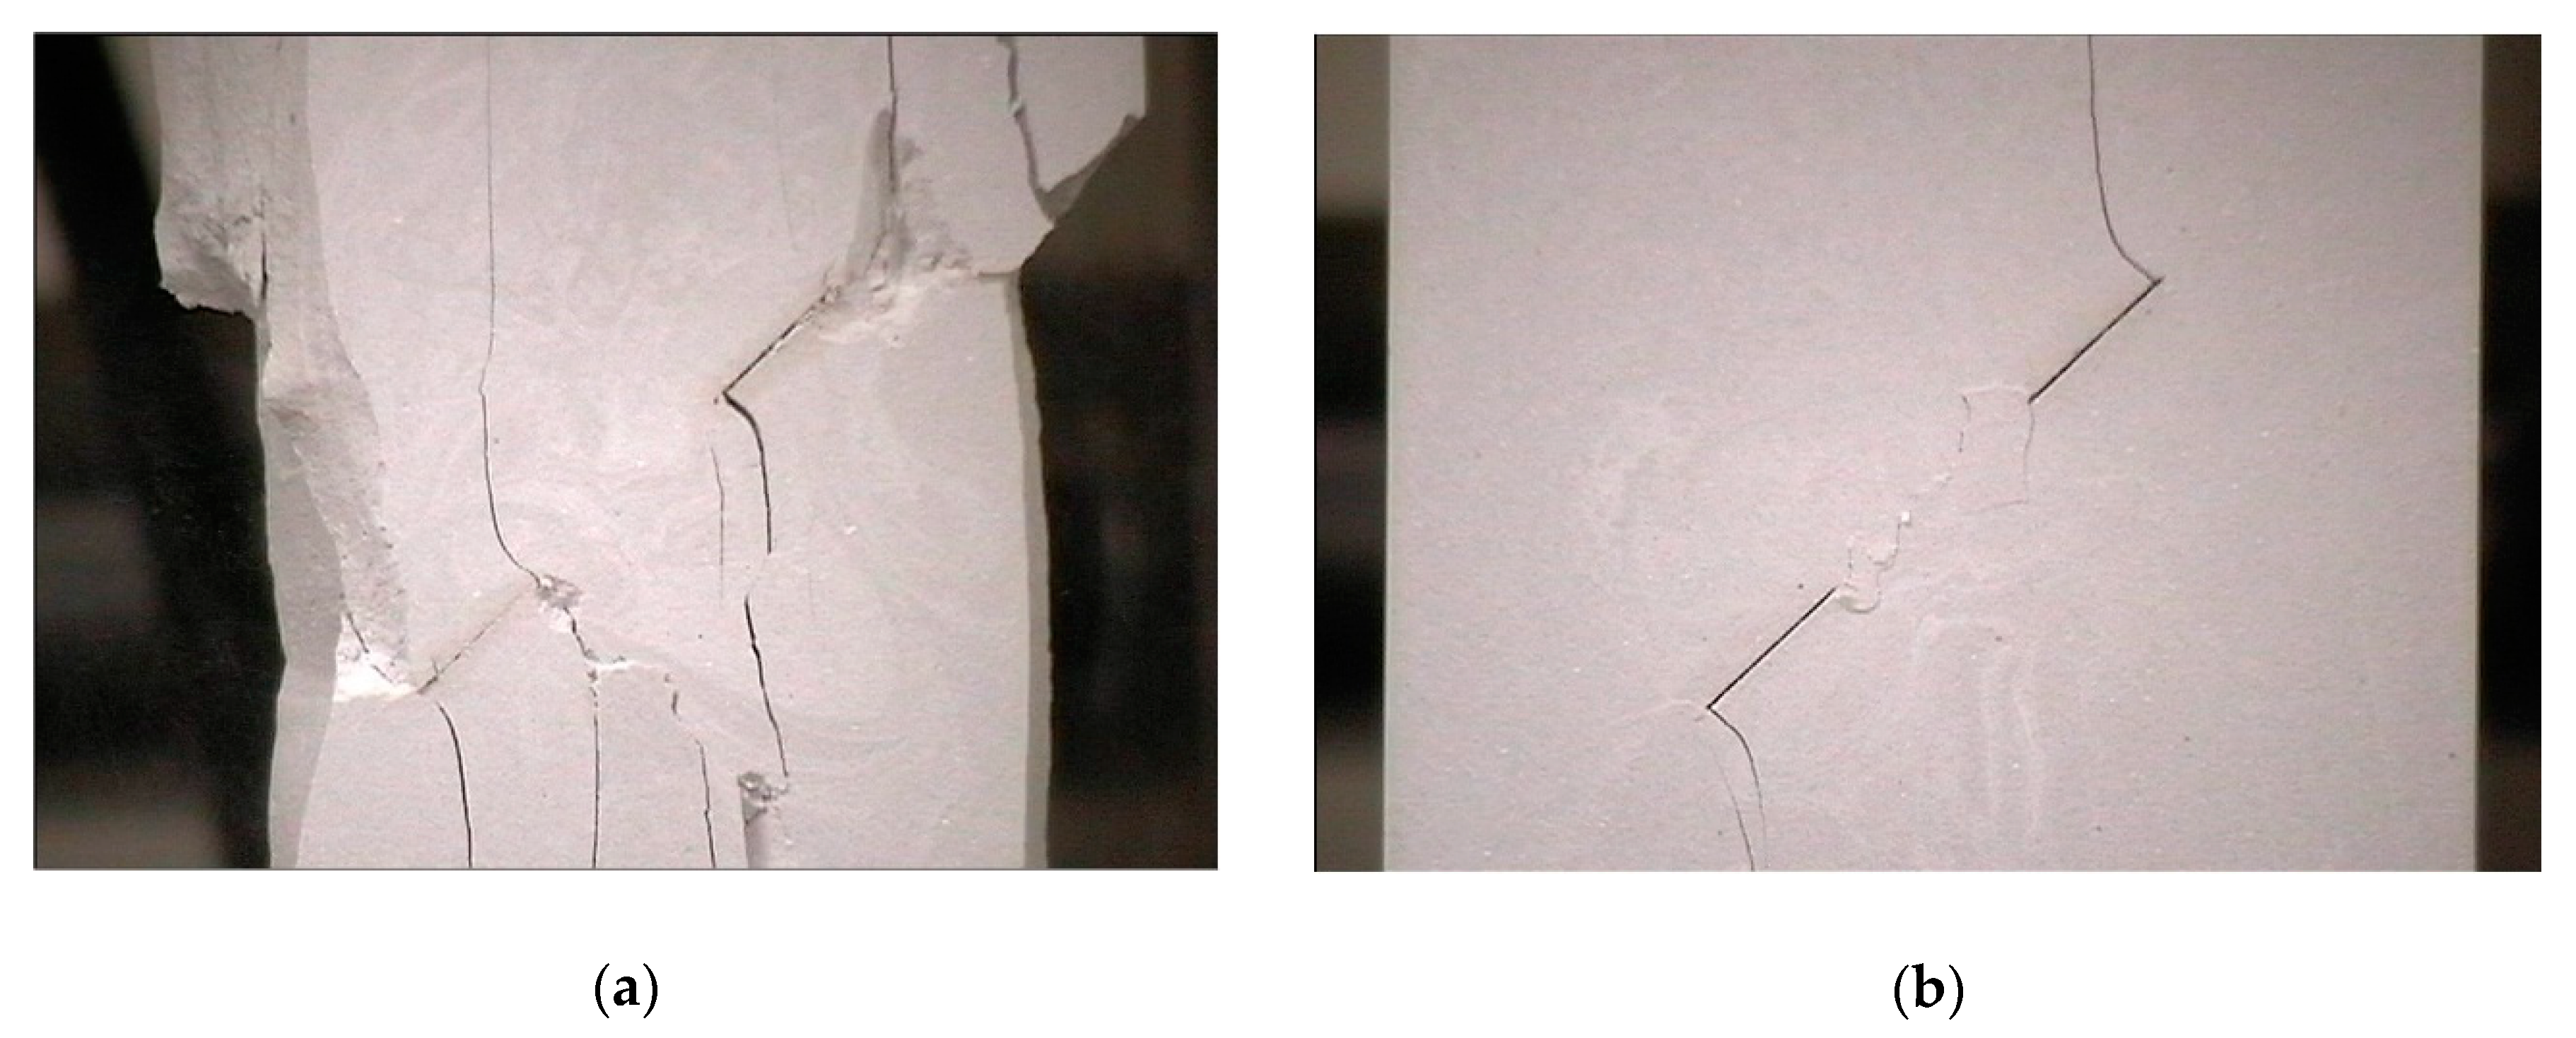
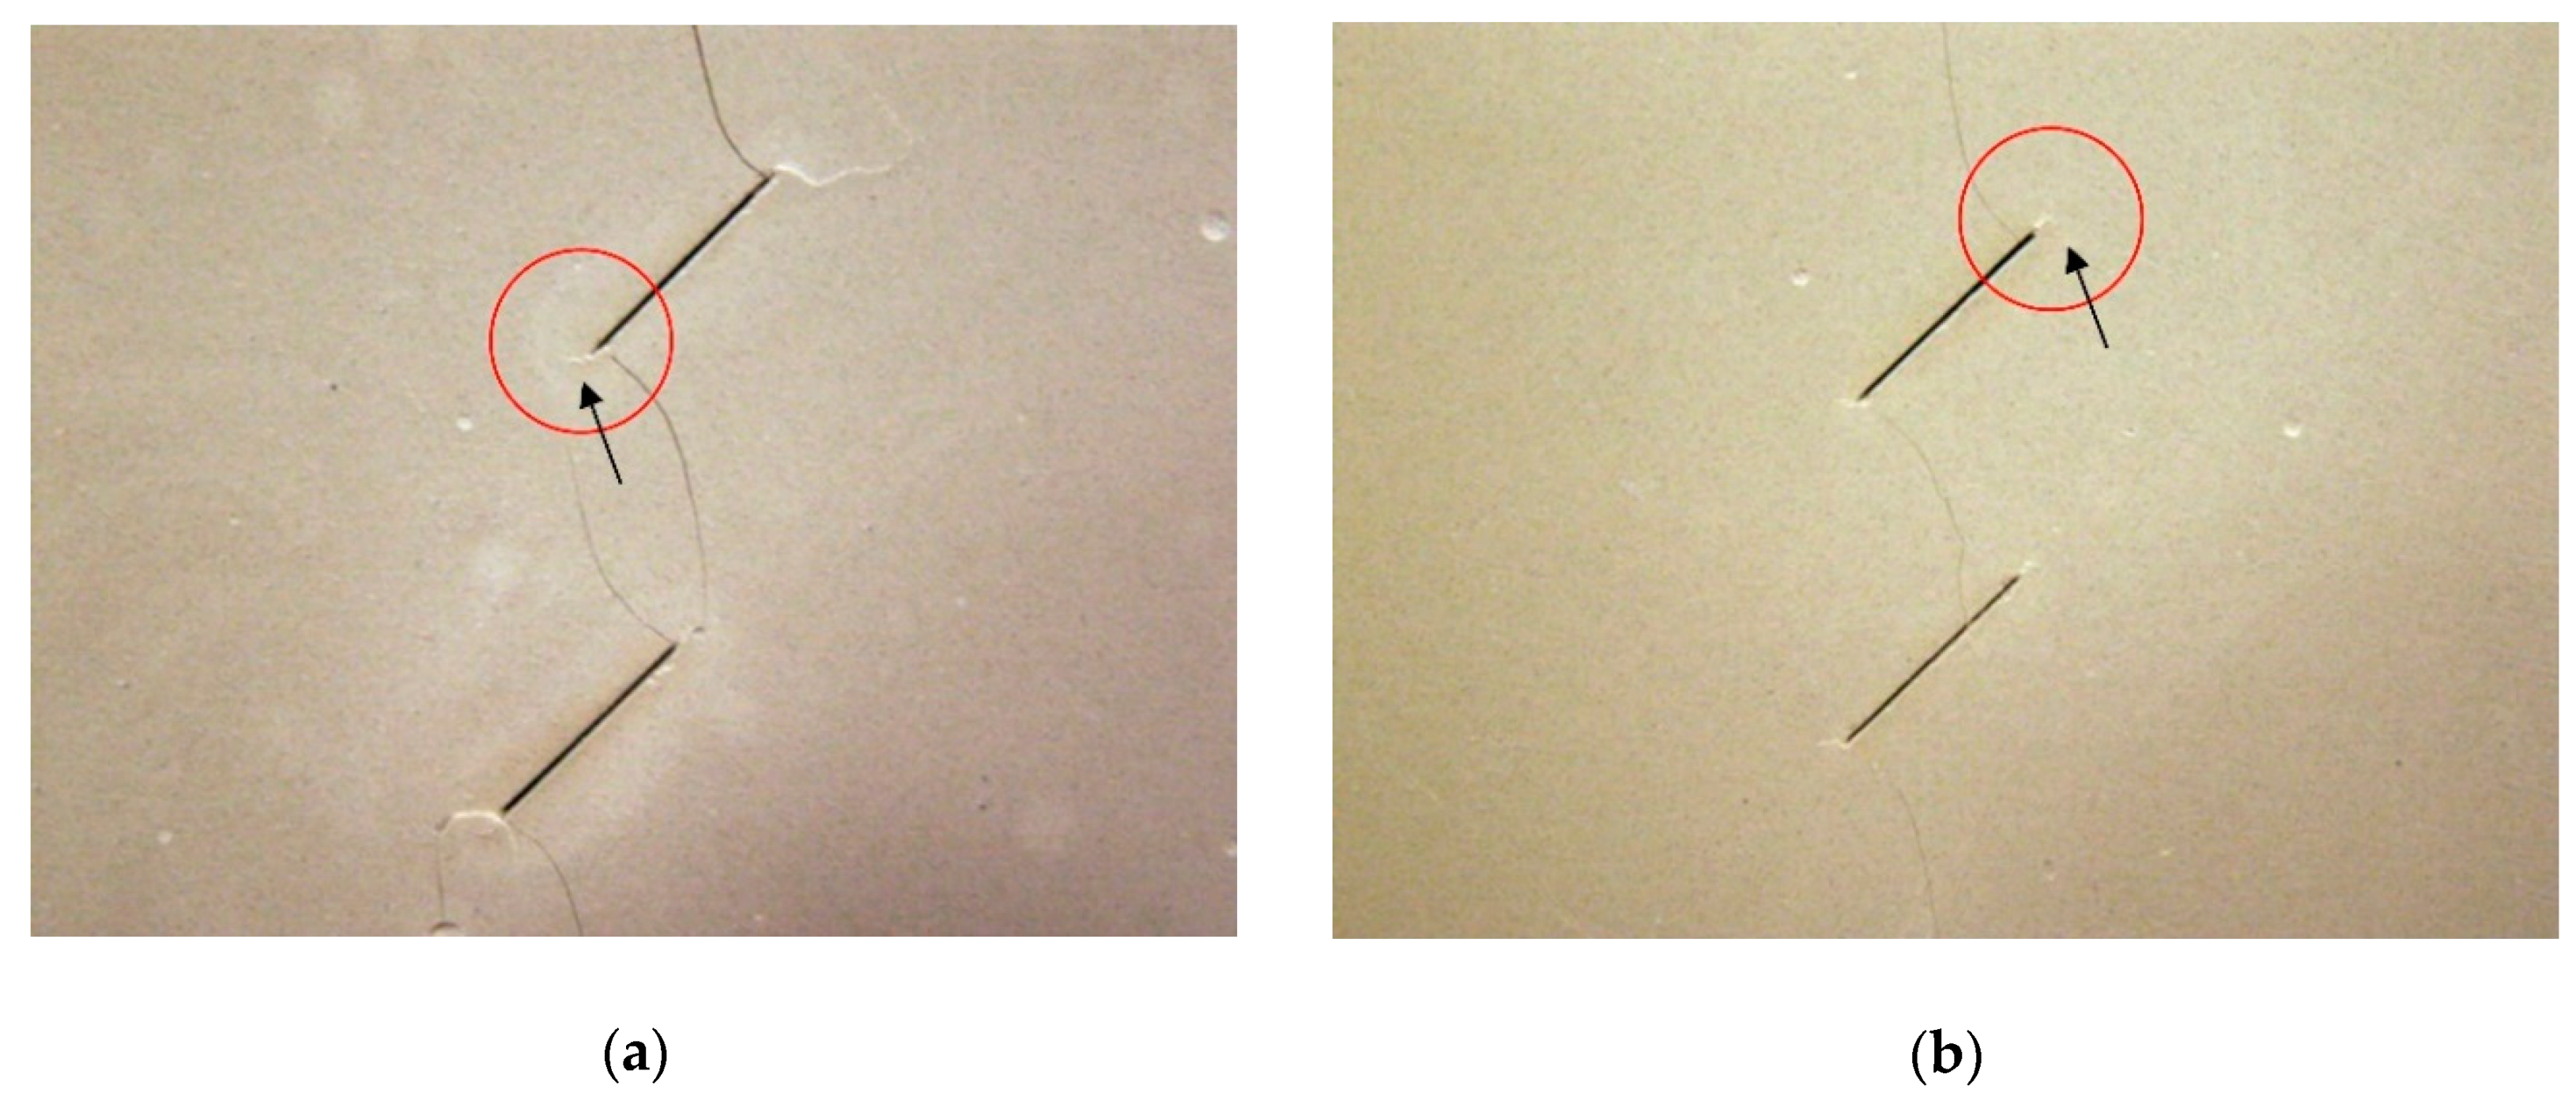
Unlike the monotonic tests, the cyclic tests produced new types of cracks, known as fatigue cracks. Fatigue cracks typically appeared either (1) after coalescence, when the specimens behaved as if they had just one bigger crack, or (2) after the specimens were exposed to a certain number of cycles. In these experiments, two different directions for the initiation of fatigue crack were observed: horizontal and colinear to the flaw. Figure 19 shows the two different types of fatigue cracks. Horizontal fatigue cracks usually produced for colinear or non-overlapping geometries. The specimens appeared after coalescence as if they had only one bigger crack. Then, the specimens are separated into two sections. During loading, buckling occurs in the specimens, and large lateral displacements occurred in the middle of the specimens. The external tips of the flaws acted as stress concentrators. According to Pruitt and Suresh [32], residual tensile stresses are induced ahead of the stress concentrations during unloading, and fatigue cracks develop horizontally to the compression load axis. Colinear fatigue cracks usually occurred in overlapping geometries. Buckling occurred in the specimen during loading, but a relatively small lateral displacement also was observed. Shear stresses were more dominant ahead of the tips of the flaws than the residual tensile stresses. Repeated compressive loading produced a shear stress zone ahead of the tips of the flaw and fatigue cracks developed in the colinear direction.
4.5. Subcritical Crack Growth Parameter
The subcritical crack growth parameter was between 30 and 37, depending on the loading conditions. The mean value of the subcritical crack growth parameter n by the monotonic load was 34, and the mean value of subcritical crack growth parameter m by cyclic load was 35, thereby showing similar values. Thus, although some deviations were observed, the subcritical crack growth parameter values were generally similar regardless of the loading conditions. This is because the subcritical crack growth was caused by environmental factors rather than by mechanical loading. Several potential mechanisms for generating subcritical cracks have been proposed. These mechanisms include stress corrosion, dissolution, diffusion, ion change, and microplasticity [7,33]. The chemical effect on pore water in rock influences these mechanisms. Stress corrosion is thought to be the main mechanism for subcritical crack growth in rocks [7]. The reactions between strained bonds and the pore water result in a weak state, which can be broken at lower stress rates compared to string bonds [7]. During the interaction of crack tips with these environmental agents, the duration of their exposure to environmental factors is more important than loading. Therefore, regardless of the loading conditions, the values of the subcritical crack growth parameter are similar.
Results similar to this study were found in other studies. Ko [34] and Ko et al. [35] showed that the subcritical crack growth parameters under shear and tensile loads are similar for Coconino sandstone. Hashiba et al. [36] showed that the subcritical crack growth parameters were similar for the same rock type regardless of the test methods in compressive and tensile strength tests.
5. Conclusions
In this study, prismatic specimens of moulded gypsum were prepared and tested under uniaxial monotonic and cyclic compression. Tensile or wing cracks and secondary or shear cracks were produced by both monotonic and cyclic compression, and fatigue cracks were produced by cyclic compression. A brief summary of the experimental results is presented as follows.
- Both the monotonic and cyclic tests had similar wing crack initiation positions, wing crack initiation angles, cracking sequences, and coalescence types.
- Observed coalescence types are categorized into six classes: Type I, II, III, IV, V, and VI. Type III coalescences are subdivided into two classes and Type IV coalescences into three classes. For colinear geometry specimens, coalescence was caused by the internal shear cracks. For non-colinear geometry specimens, coalescence occurred by variations of internal shear cracks, internal wing cracks and tension cracks.
- Secondary cracks were found in both the monotonic and cyclic tests. Secondary cracks started at the tips of the flaws and propagated in the colinear direction of the flaw or in a horizontal direction.
- Fatigue cracks appeared in cyclic tests but not monotonic tests. Depending on the flaw geometry, two types of fatigue crack initiation directions were observed. In the coplanar, non-overlapping, and slightly overlapping geometries, horizontal fatigue cracks were observed. In the overlapping geometry, coplanar fatigue cracks occurred.
- Although there were some deviations, the subcritical crack growth parameter values were generally similar regardless of the loading conditions.
Author Contributions
Writing—original draft preparation, T.Y.K.; writing—review & editing, S.S.L. All authors have read and agreed to the published version of the manuscript.
Funding
This research was funded by Hanyang University grant number (HY-201700000002431) and the authors greatly appreciate the financial support.
Acknowledgments
The authors greatly appreciate the financial support of Hanyang University.
Conflicts of Interest
The authors declare no conflict of interest. The funders had no role in the design of the study, in the collection, analyses, or interpretation of data, in the writing of the manuscript, or in the decision to publish the results.
References
- D’Amato, M.; Laterza, M.; Casamassima, V.M. Seismic performance evaluation of a multi-span existing masonry arch bridge. Open Civ. Eng. J. 2017, 11, 1191–1207. [Google Scholar] [CrossRef]
- Royer-Carfagni, G.; Salvatore, W. The characterization of marble by cyclic compression loading: Experimental results. Mech. Cohes. Frict. Mater. 2000, 5, 535–563. [Google Scholar] [CrossRef]
- Laterza, M.; D’Amato, M.; Braga, F.; Gigliotti, R. Extension to rectangular section of an analytical model for concrete confined by steel stirrups and/or FRP jackets. Comps. Struct. 2017, 176, 910–922. [Google Scholar] [CrossRef]
- Paris, P.; Erdogan, F. A critical analysis of crack propagation laws. J. Basic Eng. 1963, 85, 528–534. [Google Scholar] [CrossRef]
- Kim, K.; Mobeen, A. Relationship between differential stress intensity factor and crack growth rate in cyclic tension in Westerly granite. In Fracture Mechanics Methods for Ceramics, Rocks and Concrete; Frieman, S.W., Roller, E.R., Jr., Eds.; American Society for Testing and Materials: West Conshohocken, PA, USA, 1981; pp. 157–168. [Google Scholar]
- Charles, R.J. Static fatigue of glass. J. Appl. Phys. 1958, 29, 1549–1560. [Google Scholar] [CrossRef]
- Atkinson, B.K. Subcritical crack growth in geological materials. J. Geophys. Res. 1984, 86, 4077–4114. [Google Scholar] [CrossRef]
- Reyes, O. Experimental Study and Analytical Modelling of Compressive Fracture in Brittle Materials. Ph.D. Thesis, MIT, Cambridge, MA, USA, 1991. [Google Scholar]
- Shen, B.; Stephansson, O.; Einstein, H.H.; Ghahreman, B. Coalescence of fracture under shear stresses in experiments. J. Geophys. Res. 1995, 100, 5975–5990. [Google Scholar] [CrossRef]
- Bobet, A.; Einstein, H.H. Fracture coalescence in rock-type materials under uniaxial and biaxial compression. Int. J. Rock Mech. Min. Sci. 1998, 35, 863–888. [Google Scholar] [CrossRef]
- Sagong, M.; Bobet, A. Coalescence of multiple flaws in a rock-model material in uniaxial compression. Int. J. Rock Mech. Min. Sci. 2002, 39, 229–241. [Google Scholar] [CrossRef]
- Wong, L.N.Y.; Einstein, H.H. Crack coalescence in molded gypsum and Carrara marble: Part 1. macroscopic observations and interpretation. Rock Mech. Rock Eng. 2009, 42, 475–511. [Google Scholar] [CrossRef]
- Nezhad, M.M.; Fisher, Q.J.; Gironacci, E.; Rezania, M. Experimental study and numerical modeling of fracture propagation in shale rocks during Brazilian disk test. Rock Mech. Rock Eng. 2018, 51, 1755–1775. [Google Scholar] [CrossRef] [Green Version]
- Huang, J.; Chen, G.; Zhao, Y.; Wang, R. An experimental study of the strain field development prior to failure of a marble plate under compression. Tectonophysics 1990, 175, 269–284. [Google Scholar]
- Cao, P.; Liu, T.; Pu, C.; Lin, H. Crack propagation and coalescence of brittle rock-like specimens with pre-existing cracks in compression. Eng. Geol. 2015, 187, 113–121. [Google Scholar] [CrossRef]
- Haimson, B.C.; Kim, C.M. Mechanical behaviour of rock under cyclic fatigue. In Proceedings of the 13th Symposium on Rock Mechanics, Urbana, IL, USA, 30 August–1 September 1971; pp. 845–863. [Google Scholar]
- Attewell, P.B.; Farmer, I.W. Fatigue behaviour of rock. Int. J. Rock Mech. Min. Sci. 1973, 10, 1–9. [Google Scholar] [CrossRef]
- Costin, L.S.; Holcomb, D.J. Time-dependent failure of rock under cyclic loading. Tectonophysics 1981, 79, 279–296. [Google Scholar] [CrossRef]
- Zhenyu, T.; Haihong, M. An experimental study and analysis of the behaviour of rock under cyclic loading. Int. J. Rock Mech. Min. Sci. Geomech. Abstr. 1990, 27, 51–56. [Google Scholar] [CrossRef]
- Brown, E.T.; Hudson, J.A. Fatigue failure characteristics of some models of jointed rock. Earthquake Eng. Struct. Dyn. 1974, 2, 379–386. [Google Scholar] [CrossRef]
- Prost, C.L. Jointing at rock contacts in cyclic loading. Int. J. Rock Mech. Min. Sci. Geomech. Abstr. 1988, 25, 263–272. [Google Scholar] [CrossRef]
- Li, N.; Zhang, P.; Chen, Y.; Swoboda, G. Fatigue properties of a cracked, saturated and frozen sandstone samples under cyclic loading. Int. J. Rock Mech. Min. Sci. 2003, 40, 145–150. [Google Scholar] [CrossRef]
- Xiao, J.; Ding, D.; Jiang, F.; Xu, G. Fatigue damage variable and evolution of rock subjected to cyclic loading. Int. J. Rock Mech. Min. Sci. 2010, 47, 461–468. [Google Scholar] [CrossRef]
- Le, J.; Manning, J.; Labuz, J. Scaling of fatigue crack growth in rock. Int. J. Rock Mech. Min. Sci. 2014, 72, 71–79. [Google Scholar] [CrossRef]
- Jobli, A.; Noor, M.; Tawie, R.; Hampden, A.; Julai, N. Uniaxial compressive strength of Malaysian weathered granite due to cyclic loading. J. Eng. Appl. Sci. 2017, 12, 4298–4301. [Google Scholar]
- Liu, Y.; Dai, F.; Fan, P.; Xu, N.; Dong, L. Experimental investigation of the influence of joint geometric configurations on the mechanical properties of intermittent jointed rock models under cyclic uniaxial compression. Rock Mech. Rock Eng. 2017, 50, 1453–1471. [Google Scholar] [CrossRef]
- Ko, T.Y.; Kemeny, J. Determination of the subcritical crack growth parameters in rocks using the constant stress-rate test. Int. J. Rock Mech. Min. Sci. 2013, 59, 166–178. [Google Scholar] [CrossRef]
- Kemeny, J.M.; Cook, N.G.W. Crack models for the failure of rock under compression. In Proceedings of the 2nd International Conference on Constitutive Laws for Engineering Materials, Theory and Applications, Tucson, AZ, USA, 5–8 January 1987. [Google Scholar]
- Erdogan, F.; Sih, G.C. On the crack extension in plates under loading and transverse shear. J. Basic Eng. 1963, 85, 519–525. [Google Scholar] [CrossRef]
- Palinaswamy, K.; Knauss, W.G. Propagation of a crack under general, in-plane tension. Int. J. Frac. Mech. 1972, 8, 114–117. [Google Scholar] [CrossRef]
- Sih, G.C. A special theory of crack propagation. In Methods of Analysis and Solutions of Crack Problems, Mechanics of Fracture, 1st ed.; Sih, G.C., Ed.; Noordhoff International Publishing: Leyden, The Netherlands, 1973; Volume 1, pp. XXI–XLV. [Google Scholar]
- Pruitt, L.; Suresh, S. Cyclic stress fields for fatigue cracks in amorphous solids—Experimental measurements and their implications. Philos. Mag. A 1993, 67, 1219–1245. [Google Scholar] [CrossRef]
- Atkinson, B.K.; Meredith, P.C. The theory of subcritical crack growth with applications to minerals and rocks. In Fracture Mechanics of Rock, 1st ed.; Atkinson, B.K., Ed.; Academic Press: London, UK, 1987; pp. 111–166. [Google Scholar]
- Ko, T.Y. Subcritical Crack Growth under Mode I, II and III Loading for Coconino Sandstone. Ph.D. Thesis, University of Arizona, Tucson, USA, 2008. [Google Scholar]
- Ko, T.Y.; Kemeny, J.; Jeon, S.W. Loading rate dependency of strength and fracture toughness of rocks. In Proceedings of the YSRM Young Scholars Symposium on Rock Mechanics, Jeju, Korea, 10–13 May 2017. [Google Scholar]
- Hashiba, K.; Okubo, S.; Fukui, K. A new testing method for investigating the loading rate dependency of peak and residual rock strength. Int. J. Rock Mech. Min. Sci. 2006, 43, 894–904. [Google Scholar] [CrossRef]
Figure 1.
Typical fracture schemes: (a) monotonic test; (b) cyclic test.

Figure 2.
Specimen geometry.

Figure 3.
Experimental setup for monotonic and cyclic compression.

Figure 4.
General crack patterns observed in the test.

Figure 5.
Wing crack initiation position.

Figure 6.
Wing crack initiation position.

Figure 7.
External wing crack initiation stress with respect to the rock bridge length.

Figure 8.
Variation of strength with the different loading rate.

Figure 9.
An example of secondary cracks (a) colinear secondary cracks in the 30-2a-0 geometry; (b) horizontal secondary cracks in the 45-a-0 geometry.
Figure 9.
An example of secondary cracks (a) colinear secondary cracks in the 30-2a-0 geometry; (b) horizontal secondary cracks in the 45-a-0 geometry.

Figure 10.
Wing crack propagation angle measurement.

Figure 11.
Wing crack propagation angles. (a) Upper and lower external wing crack propagation angle. (b) Upper and lower internal wing crack propagation angle. (c) Upper external and internal wing crack propagation angle. (d) Lower external and internal wing crack propagation angle.
Figure 11.
Wing crack propagation angles. (a) Upper and lower external wing crack propagation angle. (b) Upper and lower internal wing crack propagation angle. (c) Upper external and internal wing crack propagation angle. (d) Lower external and internal wing crack propagation angle.

Figure 12.
Relationship between the loading rate and fracture strength for determining the subcritical crack growth parameter under monotonic loading.
Figure 12.
Relationship between the loading rate and fracture strength for determining the subcritical crack growth parameter under monotonic loading.

Figure 13.
Schematic illustration of the crack model (a) shear crack mode; (b) sliding crack model.

Figure 14.
Variation of the rate of crack growth as a function of the stress intensity factor range ∆K.
Figure 14.
Variation of the rate of crack growth as a function of the stress intensity factor range ∆K.

Figure 15.
Comparison of wing crack initiation angle: (a) external wing crack; (b) internal wing crack.
Figure 15.
Comparison of wing crack initiation angle: (a) external wing crack; (b) internal wing crack.

Figure 16.
Difference in the coalescence type in monotonic and cyclic loading. (a) Monotonic loading. (b) Cyclic loading.
Figure 16.
Difference in the coalescence type in monotonic and cyclic loading. (a) Monotonic loading. (b) Cyclic loading.

Figure 17.
Plot of principal stress for 30-2a-0 geometry.

Figure 18.
Comparison of the crack surface. (a) Surface of shear cracks. (b) Surface of wing cracks.
Figure 18.
Comparison of the crack surface. (a) Surface of shear cracks. (b) Surface of wing cracks.

Figure 19.
Example of fatigue cracks. (a) Horizontal fatigue cracks. (b) Colinear fatigue cracks.


Table 1.
Material properties of the gypsum specimen.
| Uniaxial Compressive Strength [MPa] | Tensile Strength [MPa] | Poisson’s Ratio | Young’s Modulus [GPa] |
|---|---|---|---|
| 34.5 | 3.2 | 0.15 | 5.96 |
Table 2.
List of all the geometries and the number of specimens.
| Geometry | Dynamic Compressive Strength | Monotonic Test | Cyclic Test | Constant Stress-Rate Test | Total |
|---|---|---|---|---|---|
| 30-0-a | 3 | 2 | 3 | 8 | |
| 45-0-a | 3 | 2 | 3 | 8 | |
| 60-0-a | 3 | 2 | 3 | 8 | |
| 30-0-2a | 3 | 2 | 3 | 8 | |
| 45-0-2a | 3 | 2 | 3 | 5 | 13 |
| 60-0-2a | 3 | 2 | 3 | 5 | 13 |
| 30-0-3a | 3 | 2 | 3 | 8 | |
| 45-0-3a | 3 | 2 | 3 | 8 | |
| 60-0-3a | 3 | 2 | 3 | 8 | |
| 30-0-4a | 3 | 2 | 3 | 8 | |
| 45-0-4a | 3 | 2 | 3 | 8 | |
| 60-0-4a | 3 | 2 | 3 | 8 | |
| 30-a-0 | 3 | 2 | 3 | 8 | |
| 45-a-0 | 3 | 2 | 3 | 8 | |
| 60-a-0 | 3 | 2 | 3 | 8 | |
| 30-a-a | 3 | 2 | 3 | 8 | |
| 45-a-a | 3 | 2 | 3 | 5 | 13 |
| 60-a-a | 3 | 2 | 3 | 8 | |
| 30-a-2a | 3 | 2 | 3 | 8 | |
| 45-a-2a | 3 | 2 | 3 | 8 | |
| 60-a-2a | 3 | 2 | 3 | 8 | |
| 60-a-3a | 3 | 2 | 3 | 8 | |
| 30-2a-0 | 3 | 2 | 3 | 8 | |
| 45-2a-0 | 3 | 2 | 3 | 8 | |
| 60-2a-0 | 3 | 2 | 3 | 8 | |
| 30-2a-a | 3 | 2 | 3 | 8 | |
| 45-2a-a | 3 | 2 | 3 | 8 | |
| 60-2a-a | 3 | 2 | 3 | 8 | |
| 30-2a-2a | 3 | 2 | 3 | 8 | |
| 45-2a-2a | 3 | 2 | 3 | 5 | 13 |
| 60-2a-2a | 3 | 2 | 3 | 8 | |
| 30-2a-3a | 3 | 2 | 3 | 8 | |
| 45-2a-3a | 3 | 2 | 3 | 8 | |
| 60-2a-3a | 3 | 2 | 3 | 8 | |
| Sum | 102 | 68 | 102 | 20 | 292 |
Table 3.
Average dynamic compressive strength with respect to the initial flaw inclination angle.
| Flaw Inclination Angle | 30° | 45° | 60° |
|---|---|---|---|
| Strength | 28.1 MPa | 31.0 MPa | 34.7 MPa |
Table 4.
Observed crack coalescence types.
| Type | Coalescence Pattern | Type of Coalescence Crack | |
|---|---|---|---|
| I |  |  | Shear crack |
| II |  |  | Internal shear and tension crack |
| III-A |  |  | Internal wing crack |
| III-B |  |  | Internal wing crack and internal shear crack |
| IV-A |  |  | Internal wing crack |
| IV-B |  |  | Internal wing crack |
| IV-C |  |  | Internal wing crack and internal shear crack |
| V |  |  | Internal wing crack and internal shear crack |
| VI |  |  | Internal wing crack, internal shear crack and tension crack |
Table 5.
Average coalescence stress and standard deviation with respect to the flaw inclination angles.
Table 5.
Average coalescence stress and standard deviation with respect to the flaw inclination angles.
| Flaw Inclination Angle | 30° | 45° | 60° |
|---|---|---|---|
| Average coalescence stress | 23.98 MPa | 26.96 MPa | 31.93 MPa |
| Standard deviation | 3.15 MPa | 5.0 MPa | 4.66 MPa |
© 2020 by the authors. Licensee MDPI, Basel, Switzerland. This article is an open access article distributed under the terms and conditions of the Creative Commons Attribution (CC BY) license (http://creativecommons.org/licenses/by/4.0/).
Share and Cite
MDPI and ACS Style
Ko, T.Y.; Lee, S.S. Characteristics of Crack Growth in Rock-Like Materials under Monotonic and Cyclic Loading Conditions. Appl. Sci. 2020, 10, 719. https://0-doi-org.brum.beds.ac.uk/10.3390/app10020719
AMA Style
Ko TY, Lee SS. Characteristics of Crack Growth in Rock-Like Materials under Monotonic and Cyclic Loading Conditions. Applied Sciences. 2020; 10(2):719. https://0-doi-org.brum.beds.ac.uk/10.3390/app10020719
Chicago/Turabian StyleKo, Tae Young, and Sean Seungwon Lee. 2020. "Characteristics of Crack Growth in Rock-Like Materials under Monotonic and Cyclic Loading Conditions" Applied Sciences 10, no. 2: 719. https://0-doi-org.brum.beds.ac.uk/10.3390/app10020719
Note that from the first issue of 2016, this journal uses article numbers instead of page numbers. See further details here.