Article

Discrimination of Sweet Cherry Cultivars Based on Electronic Tongue Potentiometric Fingerprints

by
Isabel Rodrigues
1,
Nuno Rodrigues
1,*,
Ítala M. G. Marx
1,
Ana C. A. Veloso
2,3,
Ana Cristina Ramos
4,5,
José Alberto Pereira
1 and
António M. Peres
1,*
1
Centro de Investigação de Montanha (CIMO), ESA, Instituto Politécnico de Bragança, 5300-253 Bragança, Portugal
2
Instituto Politécnico de Coimbra, ISEC, DEQB, 3030-199 Coimbra, Portugal
3
CEB–Centre of Biological Engineering, University of Minho, 4710-057 Braga, Portugal
4
Instituto Nacional de Investigação Agrária e Veterinária, 2780-157 Oeiras, Portugal
5
GeoBioTec, Universidade Nova de Lisboa, Campus de Campolide, 1099-085 Lisboa, Portugal
*
Authors to whom correspondence should be addressed.
Submission received: 23 September 2020 / Revised: 2 October 2020 / Accepted: 8 October 2020 / Published: 11 October 2020
(This article belongs to the Special Issue Integrative Approaches for Food Sensory and Flavor Analysis)

Abstract

:

Featured Application

The study contributes toward highlighting the practical use of a lab-made electronic tongue with lipid polymeric sensor membranes to discriminate sweet cherry cultivars based on potentiometric profiles and a linear discriminant analysis-meta-heuristic simulated annealing variable selection algorithm. The successful classification performance achieved with the taste potentiometric sensor device may foresee its possible application as a cherry cultivar identification tool, which may be of major interest for producers.

Abstract

Sweet cherry is highly appreciated by its characteristic flavor, which conditions the consumer’s preference. In this study, four sweet cherry cultivars (Durona, Lapins, Summit, and Van cultivars) were characterized according to biometric (fruit and stone weights, length, maximum and minimum diameters, pulp/stone mass ratio), physicochemical (CIELAB color, penetration force, titratable acidity, and total soluble solids), and potentiometric profiles (recorded by a lab-made electronic tongue with lipid polymeric membranes). Biometric and physicochemical data were significantly cultivar-dependent (p-value < 0.0001, one-way ANOVA). Summit cherries had higher masses and dimensions. Lapins cherries had the highest penetration force values having, together with Summit cherries, the highest CIELAB values. Van cherries showed the highest total soluble solids contents. No significant differences were found for fruits’ acidity (similar titratable acidities). The possibility of discriminating cherry cultivars was also evaluated using a linear discriminant analysis/simulated-annealing algorithm. A discriminant model was established based on nine non-redundant biometric-physicochemical parameters (using a low-level data fusion), with low sensitivity (75 ± 15% for the repeated K-fold cross-validation). On the contrary, a discriminant model, based on the potentiometric fingerprints of 11 selected sensors, allowed a better discrimination, with sensitivities of 88 ± 7% for the repeated K-fold cross-validation procedure. Thus, the electronic tongue could be used as a practical tool to discriminate cherry cultivars and, if applied by fruit traders, may reduce the risk of mislabeling, increasing the consumers’ confidence when purchasing this high-value product.

1. Introduction

Sweet cherry (Prunus avium L.) is a fruit that is appreciated worldwide and is economically attractive, providing a high income for producers. Indeed, the consumer demand has greatly increased in recent years, leading to a current increase of cherry agricultural production [1,2]. Both sour and sweet cherries possess distinct flavors, depending on the cultivar, geographical origin, and fruit maturity, among other factors [3]. Cherries are mainly consumed fresh [3]. Besides their recognized good taste and appealing color, sweet cherries have nutritional and health-promoting characteristics due to their richness in organic acids, sugars, vitamins, minerals, volatile compounds, and antioxidants compounds (e.g., melatonin and dietary phenolic compounds), as well as their fiber content [2,4,5,6,7,8]. The cherry fruit chemical composition has been extensively studied using both destructive and non-destructive conventional analytical techniques (physicochemical, spectroscopic, and chromatographic analyses). The generated data were treated using different chemometric tools, such as principal component analysis (PCA), linear discriminant analysis (LDA), and least square-support vector machines (LS-SVM). The results allowed, for example, assessing of the cultivar or botanical origin [5,6,7,8,9], the geographical origin [6,10,11], the maturity stage [3,12], or the fruits’ bruises degree [13].
The capability to discriminate the cherry cultivar based on the fruit evaluation, although usually requiring a destructive analytical procedure, is of utmost importance. The chemical and nutritional composition greatly depends on the cultivar, a characterization needed due to legal requirements related to the use of protected designation of origin (PDO) and protected geographical indication (PGI) designations [6,9,11]. It has been reported that conventional fruit quality parameters, bioactive compound compositions (e.g., phenolics and anthocyanins), volatile compounds, and antioxidant activity data [5,8,14,15] would allow a fair unsupervised differentiation, using PCA, of different sweet cherry cultivars. Additionally, it was shown that physicochemical, spectroscopic, and chromatographic data (mineral composition, total soluble solids, titratable acidity, total polyphenols, color data, and volatile compounds), individually or after data fusion, would allow to satisfactorily discriminate sweet cherries according to the cultivar. The correct classification rates greatly depend on the type of data and the number of cultivars considered [6,9,10,11]. On the other hand, DNA-based techniques have also been successfully applied in the identification and discrimination of cherry cultivars [1,16,17,18]. However, these techniques are not green or user-friendly, require skilled technicians, are time-consuming, and are usually beyond the economic and technical possibilities of most sweet cherry producers, which are mainly micro and small familiar producers. On the other hand, electronic tongues (E-tongues) have been recognized as portable and cost-effective analytical tools for monitoring and quality control of several food matrices [19,20,21]. Several advantages are well-documented, which led to the development of commercial devices for routine analysis (e.g., Taste Sensing System model SA 402B and model TS-5000Z, from Intelligent Sensor Technology, Inc., Kanagawa, Japan; α-Astree II device from AlphaMOS, Toulouse, France; and, Multiarray Chemical Sensor from McScience Inc., Suwon, Korea) [22].
In this context, the possible use of a sensor-based E-tongue to discriminate sweet cherries according to the cultivar was evaluated for the first time. In fact, the chemical and sensory characteristics of fruits can be reflected in the potentiometric profiles collected by lipid sensor membranes, as recently reported by the research team for table olives [23,24,25] and sweet peppers [26]. In fact, potentiometric and voltammetric E-tongues have been used to evaluate basic taste attributes (e.g., acid, pungent, salty, sweet, and umami), positive gustatory attributes (e.g., bitter, fruity, and green sensations), and negative attributes (e.g., butyric, fusty, musty, putrid, rancid, wine-vinegary, and zapateria sensations) of different foods [23,24,26,27,28,29,30,31,32,33,34,35]. Thus, in this study, it was envisioned to characterize four common sweet cherry cultivars (Durona, Lapins, Summit, and Van) produced in the northeast region of Portugal, based on typical biometric and physicochemical data, and further evaluate the cultivar discrimination capability of those data. As an alternative approach, it was also intended to study the feasibility of applying a potentiometric E-tongue with lipid-polymeric sensor membranes to correctly discriminate the cherry cultivars. Although the use of sensor-based devices in this research field is not common, recently, Zhang et al. [36] successfully applied a multi-sensor device to monitor and assess the quality of sweet cherry.

2. Materials and Methods

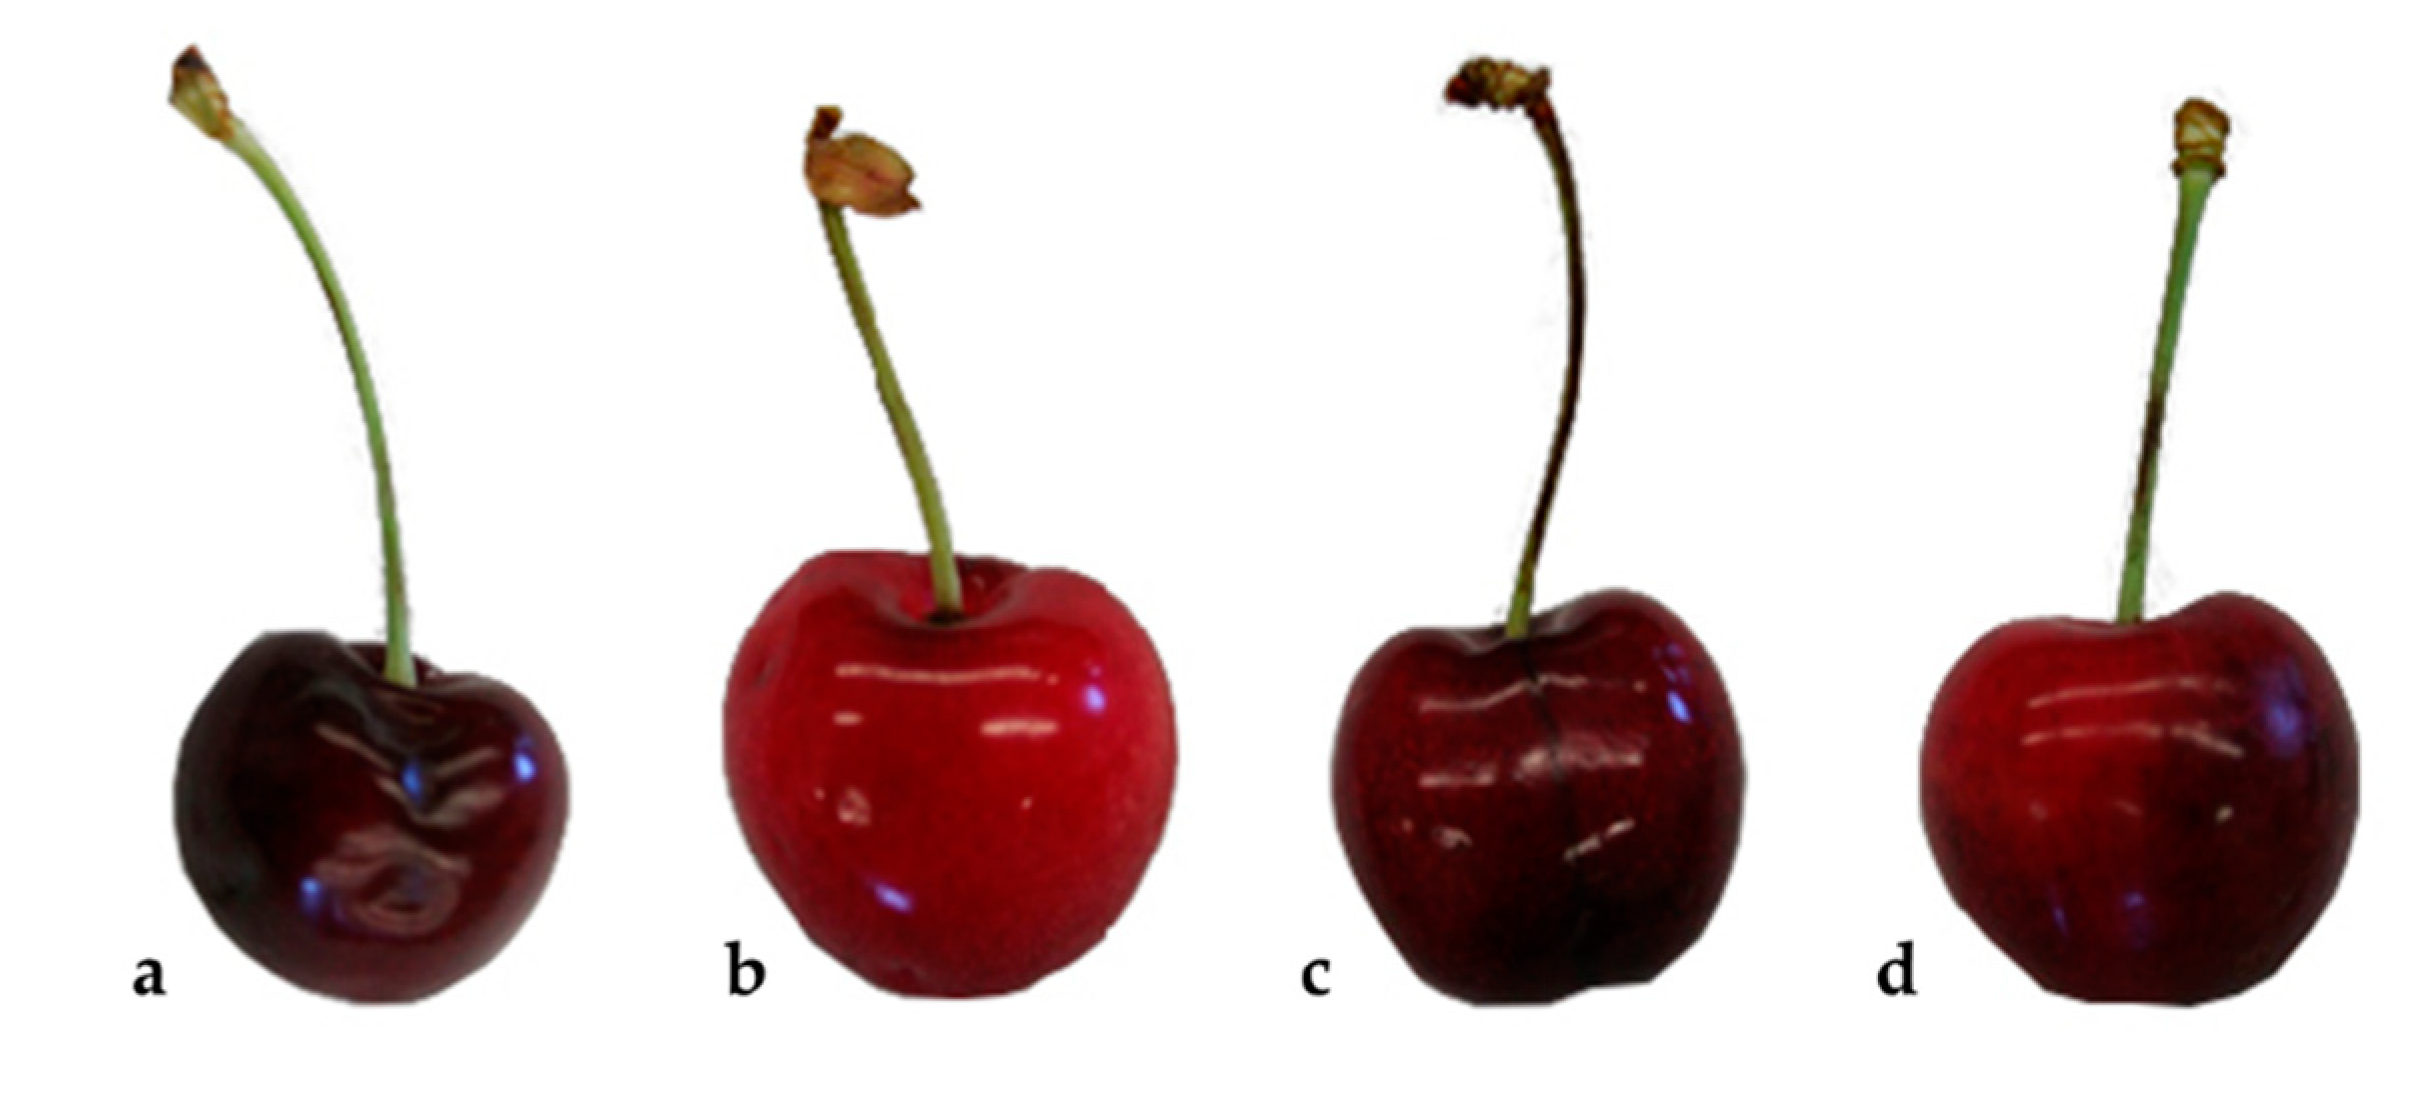
2.1. Sweet Cherry Samples

Cherries from different cultivars were collected in orchards located in the region of Resende/Lamego (northern region of Portugal). This region is a traditional Portuguese cherry-producing region, in which the growing area has increased in the recent years with the plantation of new orchards. The climatic conditions, soil characteristics, and the form of growing give particular quality and flavor, with a high national and international demand. Four major cultivars were selected, namely Durona, Lapins, Summit, and Van (Figure 1), taking into account the expression in the region, being the most representative cultivars with the most commercial impact in the region. Cultivars outside the geographical region under evaluation were not included to minimize possible agro-climacteric effects. A total of 27 independent samples (~1 kg of fruits each) were collected from different producers and for the different cultivars: Van (9 samples), Durona (7 samples), Lapin (7 samples), and Summit (4 samples). The fruits were grown using a similar mode of production, in integrated production, with similar fertilization practices to minimize possible agronomic effects. The fruits were collected at the same degree of ripeness, at the commercial maturity for each cultivar. The cherries were stored at refrigerated temperature (4 °C) and analyzed within two days after harvest.

2.2. Sweet Cherry Biometric and Chemical and Color Characterization

The sweet cherries collected were characterized, taking into account biometric and conventional physicochemical quality parameters.
For biometric characterization, from each cherry sample, a subsample of 20 fruits were randomly picked for morphological characterization, whereas the remaining fruits were used for physicochemical quality parameters and electronic tongue analyses. All samples were evaluated at a morphological level, using biometric parameters for fruits and respective endocarps (stones). The following parameters were evaluated: fruit mass (g), length (mm), maximum diameter (mm), minimum diameter (mm), stone mass (g), and pulp/stone mass ratio.
Texture, CIELAB color scale, titratable acidity (TA), and total soluble solids (TSSs) were determined, using conventional analytical techniques. A HD plus texture analyzer (Stable Microsystems, Godalming, UK) was used to determine the maximum penetration force (N). A 2 mm cylinder probe, with a 5.0 kg (50 N) charge cell, a test speed of 1.0 mm/s, and 10 mm length, was used in the assays. A colorimeter Minolta CR-200b (Osaka, Japan) was used to assess color parameters, according to the CIELAB scale (L*, a* and b* coordinates). L* varies between 0 (black) and 100 (white), the chromatic a* varies from green (−a*) to red (+a*), and the chromatic b* axis ranges from blue (−b*) to yellow (+b*). Three fruits per sample were used and, for each fruit, four points of the epidermis were evaluated, using an 8 mm reading aperture, diffuse lighting, and an observation angle of 0° under artificial daylight (CIE D65 standard illuminant). Titrimetric analysis (with a NaOH solution, 0.10 mol/L) was applied to assess the titratable acidity (TA). Around 10 g of each grounded sample was mixed with 50 mL of water and heated under reflux for 30 min. The solution was then transferred to a glass balloon of 100 mL, which was exactly 20 mL, then filtrated and transferred to a beaker with a stirrer. The pH of the solution was then monitored to establish the titration curve. The pH at the equivalence point was established as 8.1, following the Portuguese regulation (NP-1421, 1977) [37]. The values were expressed on grams of gallic acid per 100 g of fresh weight (fw). The solution obtained for the acidity determination (after filtration) was also used to measure total soluble solids (TSSs) contents (in °Brix) at 20 °C, in an ATAGO refractometer (Saitama, Japan).

2.3. E-Tongue Equipment and Analysis
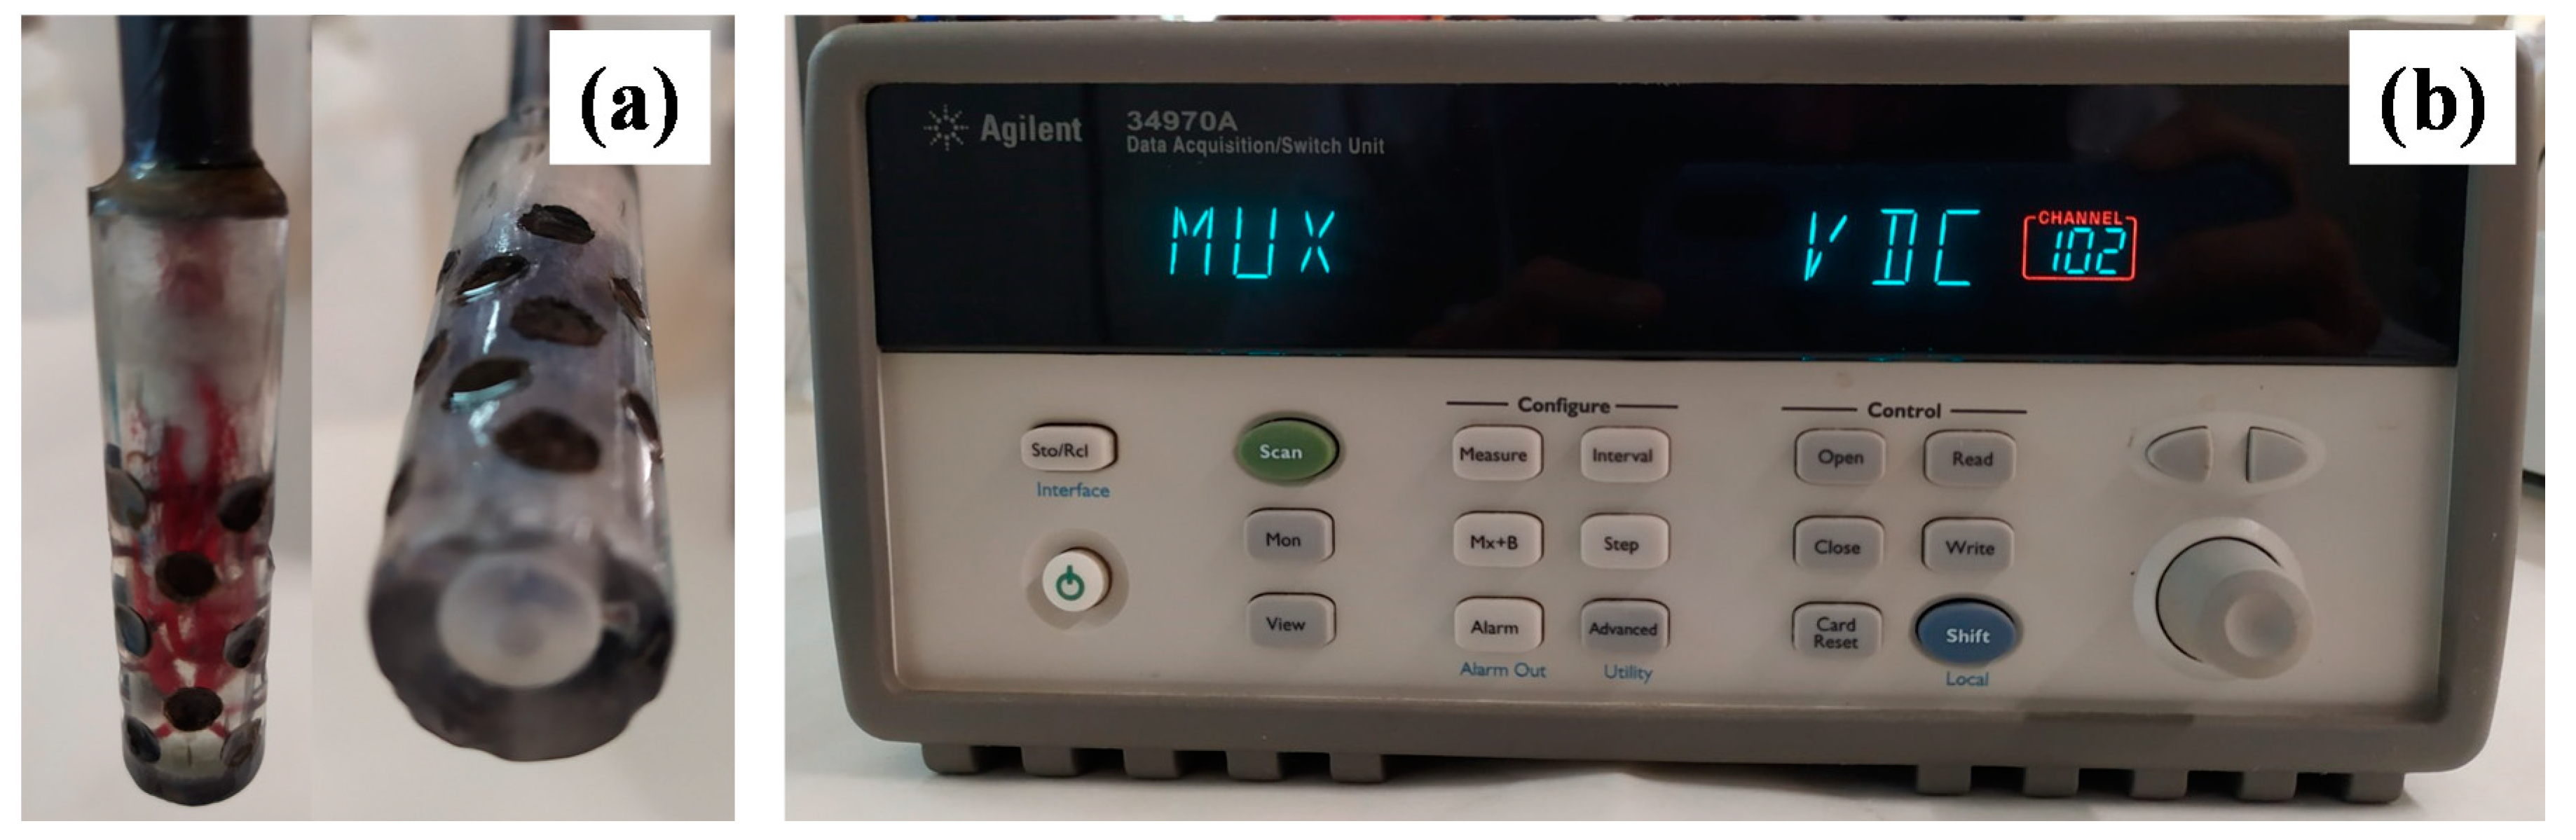
2.3.1. Apparatus

A lab-made potentiometric E-tongue multi-sensor device, comprising two cylindrical (6 cm height and 1.5 cm diameter) acrylic arrays was used (Figure 2a). Each array contained 20 sensors (circular shape with 5 mm of diameter and 2 mmm of thickness, Figure 2a). In total, 40 E-tongue non-specific sensors were used due to their cross-sensitivity and reduced selectivity [38]. The sensor compositions (lipid additive, 3%; plasticizer, 32%; and polyvinyl chloride, 65%) were the same as previously reported [26]. The sensors comprised lipid polymeric membranes, with polar (negative or positive polarities) and non-polar regions that could interact with taste polar compounds through electrostatic or hydrophobic interactions [23,24,39]. The selected lipid-polymeric membranes allow the qualitative recognition of basic taste attributes, including acid and sweet sensations [24,40], which are typical sensory sensations of cherry, and quantitatively assess reducing sugar contents [41]. The membranes were connected to a multiplexer Agilent Data Acquisition Switch Unit (model 34970A) controlled by an Agilent BenchLink Data Logger (Figure 2b). Each potentiometric assay takes 5 min, allowing recording of the pseudo-equilibrium potentiometric signals of all sensor membranes. The reference electrode was an An Ag/AgCl double-junction glass electrode (Crison, 5241). The same sensor coding previously adopted by the research team was used, and each sensor was identified with a letter S (for sensor) followed by the number of the array (1: or 2:) and the number of the membrane (1 to 20, corresponding to different combinations of plasticizers and additives).

2.3.2. E-Tongue Analysis: Sweet Cherry Sample Preparation and Potentiometric Assays

Sweet cherry fruits were pre-processed, as previously described by Guilherme et al. [26], with some modifications. For each replicate assay, 20 g of mashed sweet cherry (Moulinex knife chopper) was mixed with 60 mL of deionized water and agitated during 1 min. The aqueous cherry paste was stored overnight at approximately ~4 °C. The potentiometric assays were performed within a 24-h period at ambient temperature (~20 °C) and after a smooth agitation (~1 min). For each replicate, two assays were carried out, and an extra assay was performed if the signal recorded by any of the sensors showed a coefficient of variation greater than 20% [34]. For the chemometric analysis, data were randomly split, allowing establishment of the training and internal-validation data subsets. For model development, only one “mean” potentiometric signal profile per sample (i.e., per sweet cherry from the independent quintuplicate assays) was used, avoiding data from replicate assays of the same sweet cherry independent sample becoming included into both training and internal validation sets [42].

2.4. Statistical Analysis

One-way ANOVA was used to evaluate if the cultivar had a statistically significant effect on the cherry biometric and physicochemical data. The post-hoc multi-comparison Tukey’s test was further used to identify the cultivars with significant different values. Linear discriminant analysis (LDA) was applied to evaluate the discriminant potential of the biometric or physicochemical data, individually or merged (low-level data fusion), as well as the E-tongue potentiometric profiles. The simulated annealing (SA) algorithm, a meta-heuristic variable selection technique, was implemented to identify the variables with the most discriminant power, as well as minimize the risk of multicollinearity and noise effects, due to the inclusion of redundant variables [43,44]. This algorithm searches the optimal conditions based on the annealing physic process, being capable of selecting a subset of the original independent variables to achieve a global optimum for a given approximation criterion [44]. The leave-one-out (LOO) and the repeated K-fold cross-validation (CV) variants were used to assess the predictive performance of the LDA-SA model. For the repeated variant, data was randomly split into K folds. K-1 folds was used for model training and the remaining fold was left out in turn for internal validation. The predictive quality was evaluated using the average sensitivities (percentage of correct/true classifications) of the K estimates [45]. Four folds were used, allowing a bias reduction, since each internal validation subset (for each cultivar studied) had 25% of the initial data. The procedure was repeated 10 times, putting the modelling process under stress. The supervised classification performances were qualitatively assessed by plotting the principal discriminant components, as well as the class membership ellipses established using the posterior probabilities, computed using the Bayes’ theorem [46]. The sensitivity values (i.e., the percentage of correct classifications) were also calculated. The statistical analysis was performed at a 5% significance level, using the Subselect [44] and MASS [47] packages of the open source statistical program R (version 3.6.2).

3. Results and Discussion

3.1. Biometric and Physicochemical Characterization of Sweet Cherries and Cultivar Effect Evaluation

Biometric and physicochemical parameters of the four sweet cherry cultivars (Durona, Lapins, Summit, and Van) were evaluated, as shown in Table 1. In general, cultivar significantly influenced the 13 biometric-physicochemical characteristics studied (p-value < 0.0001), which is in-line with the literature data. Summit cherries had more desirable biometric characteristics, including greater fruit mass, length, maximum diameter, and pulp/stone mass ratio. On the contrary, Durona showed the worst characteristics (in general, Summit > Lapins ≥ Van > Durona). Regarding the penetration force and CIELAB color scale, Lapins and Summit cherries had the highest value, which were significantly greater (p-value < 0.0001) than those of Van and Durona cherries. On the other hand, Van and Summit cherries had the highest TSS values and were supposedly more sweet than Lapins and Durona cherries. Finally, no significant differences were observed for the TA between the four studied cherry cultivars, thus pointing out that all fruits had a similar acidity. The biometric-physicochemical value ranges are in accordance with the wide range of literature data for dozens of sweet cherry cultivars from different geographical origins (e.g., Croatia, Italy, Greece, Turkey, Portugal, Serbia, Spain, etc.) and are grown under different agro-climatic conditions [4,5,6,7,11,15,48,49,50,51,52,53,54,55,56,57,58]. Furthermore, it should be noticed that this agreement was also observed with the data reported in the literature for Lapins cherries [9,53], Van cherries [11,49,51,56,57], and Summit cherries [49,51,52].

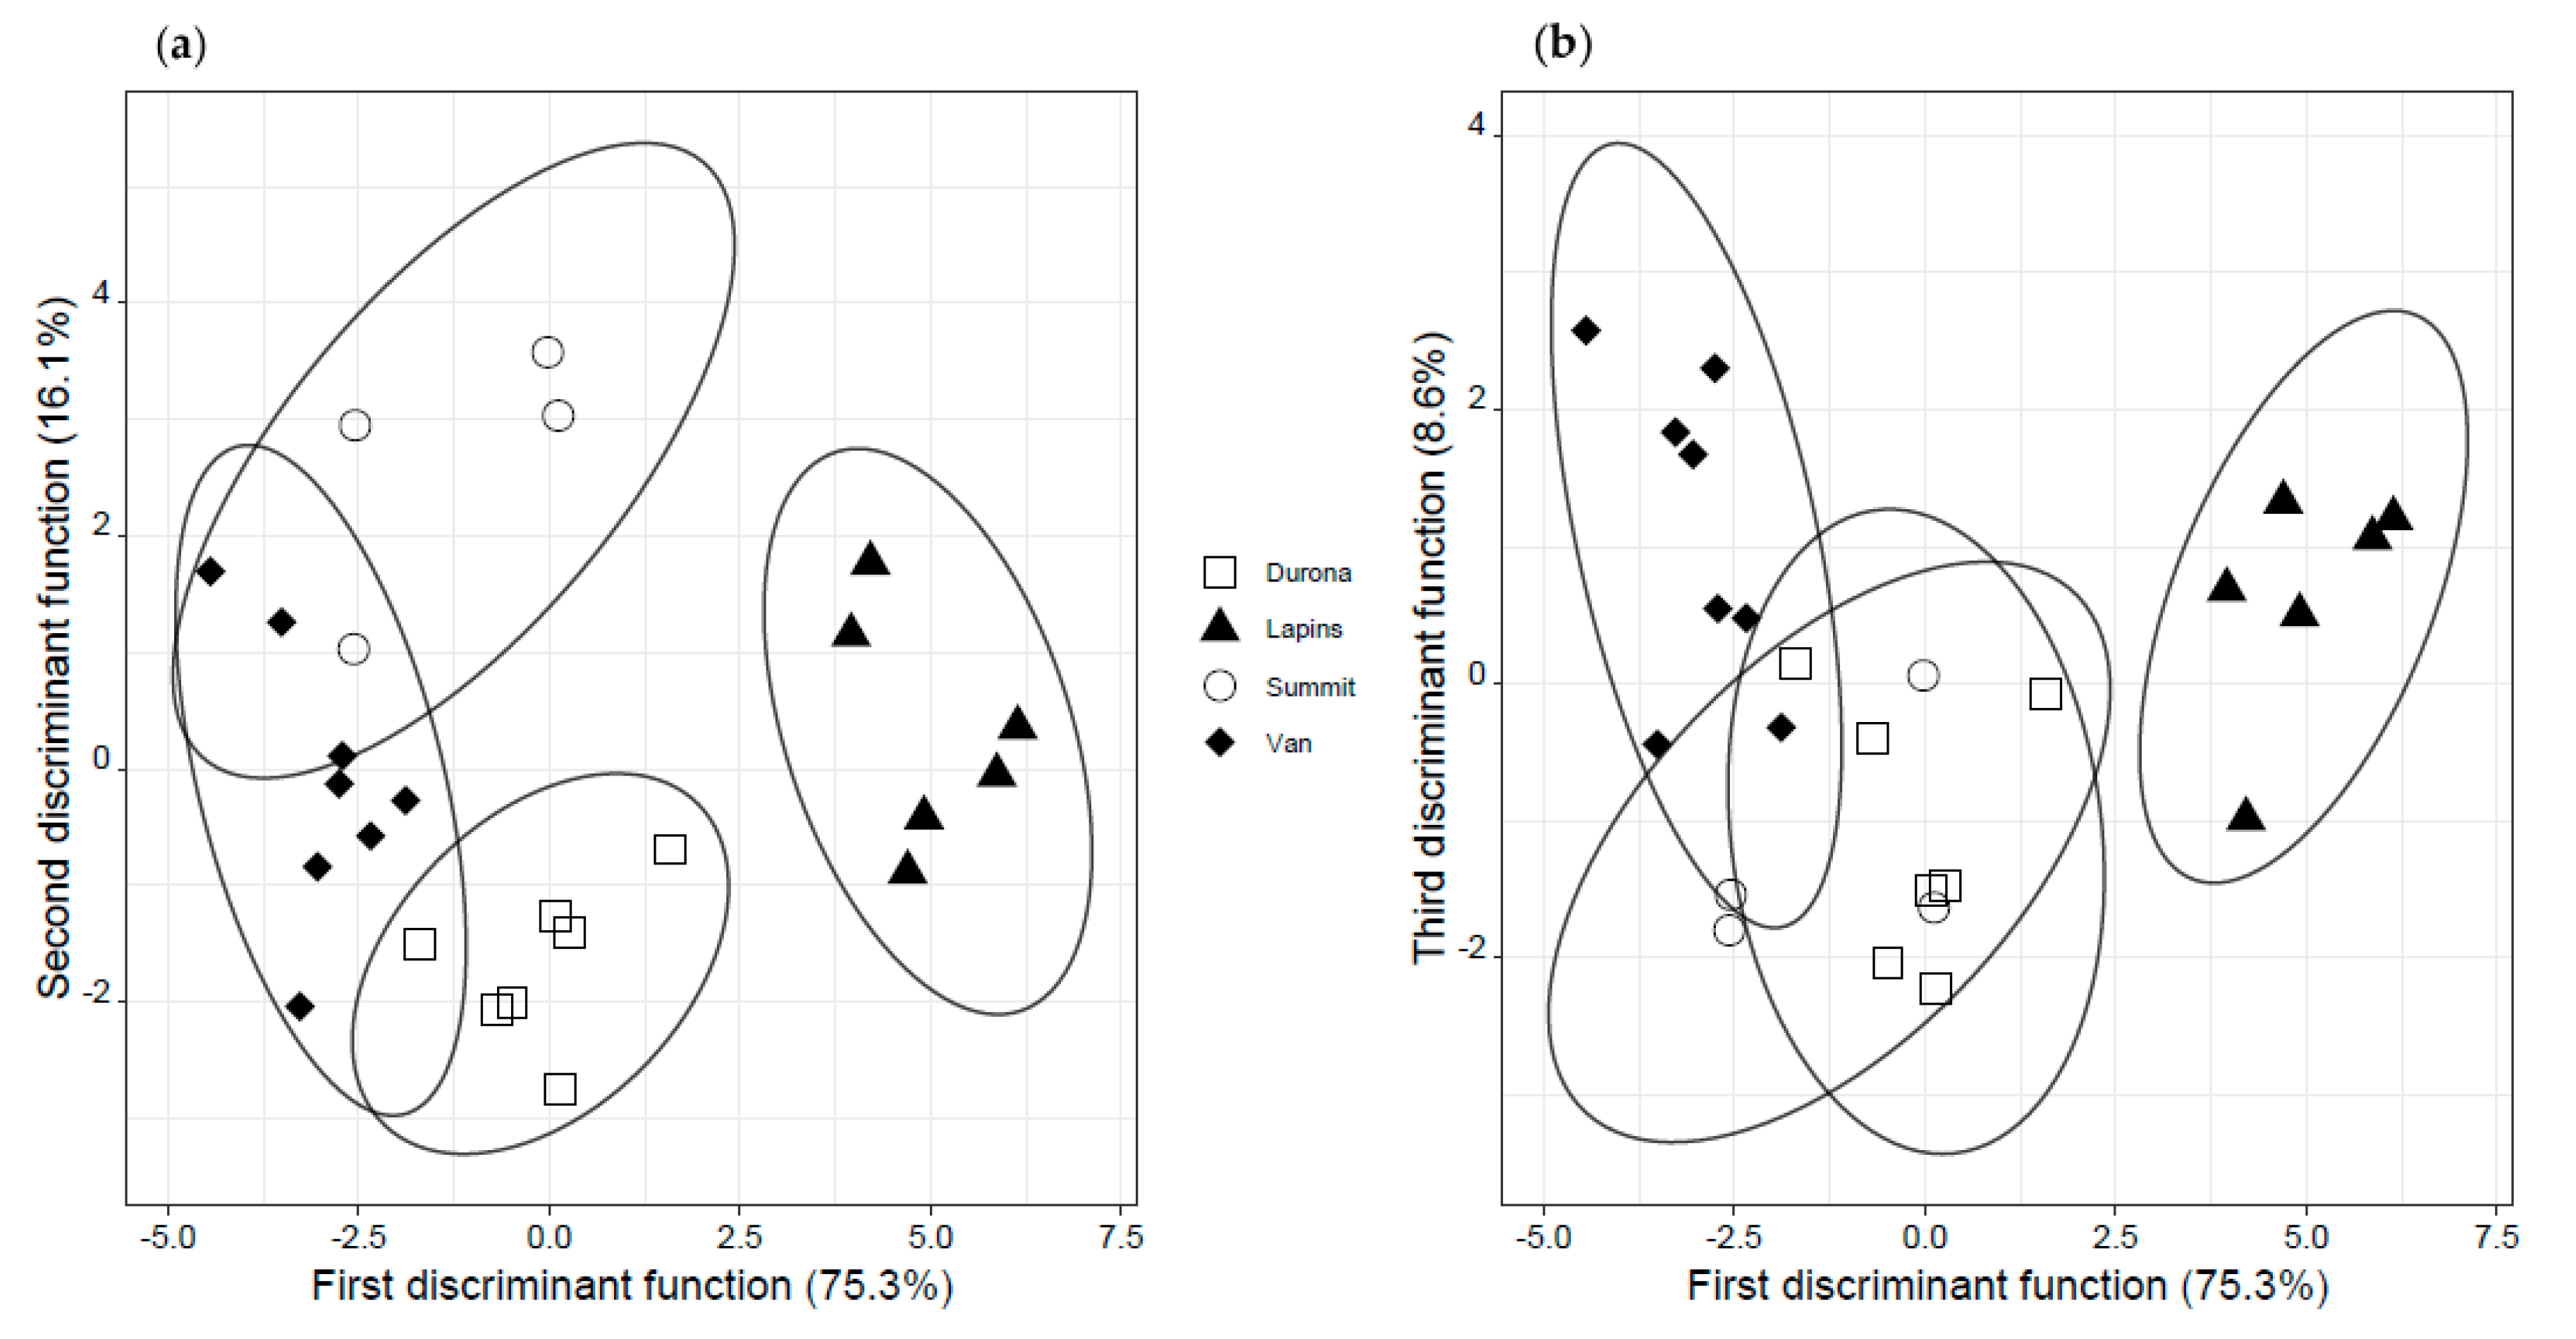
3.2. Discrimination of Cherry Cultivar Using Biometric or Physicochemical Data or a Low Level Data Fusion

The discrimination power of the biometric and physicochemical parameters was assessed using a supervised multivariate pattern recognition method (LDA) coupled with a meta-heuristic variable selection algorithm (SA). Different LDA approaches have been reported for sweet cherry cultivar discrimination, based on physicochemical, spectroscopic, and/or chromatographic data, the success of which depended on the type of data and the number of cultivars studied [6,9,11]. Thus, LDA-SA models were developed using, initially, only biometric or physicochemical parameters. The study revealed that using only one type of data did not allow a satisfactory discrimination of the cultivars. The LDA-SA model, based on five biometric parameters, enabled correct classifying of 84% and 76% of the original grouped data and LOO-CV. Similarly, a LDA-SA model, based on five physicochemical parameters, showed sensitivities of 84% and 68% for the original grouped data and LOO-CV. Therefore, a low-level data fusion abstraction level technique was implemented, allowing concatenating of the two data sets without a prior preprocessing of either of them [59]. The strategy allowed developing of a LDA-SA model with a slightly improved classification performance. The model comprised three discriminant functions based on nine selected biometric-physicochemical parameters (L*, a*, TA, penetration force, length, maximum and minimum diameter, stone weight, and pulp/stone mass ratio). Sensitivities of 100% (Figure 3), 72%, and 75 ± 15% were achieved for the original grouped data, LOO-CV, and repeated K-fold-CV, respectively. These results showed that the biometric and physicochemical parameters evaluated had a discrimination power (mainly for discriminating Lapins cherries form the others). However, other parameters should be considered, namely chemical composition (e.g., mineral profile, volatile profile, and/or phenolic compounds) and antioxidant activity, to improve the predictive classification performance. However, this strategy would require a huge experimental and technical effort, which may turn out into an expensive and time-consuming task.

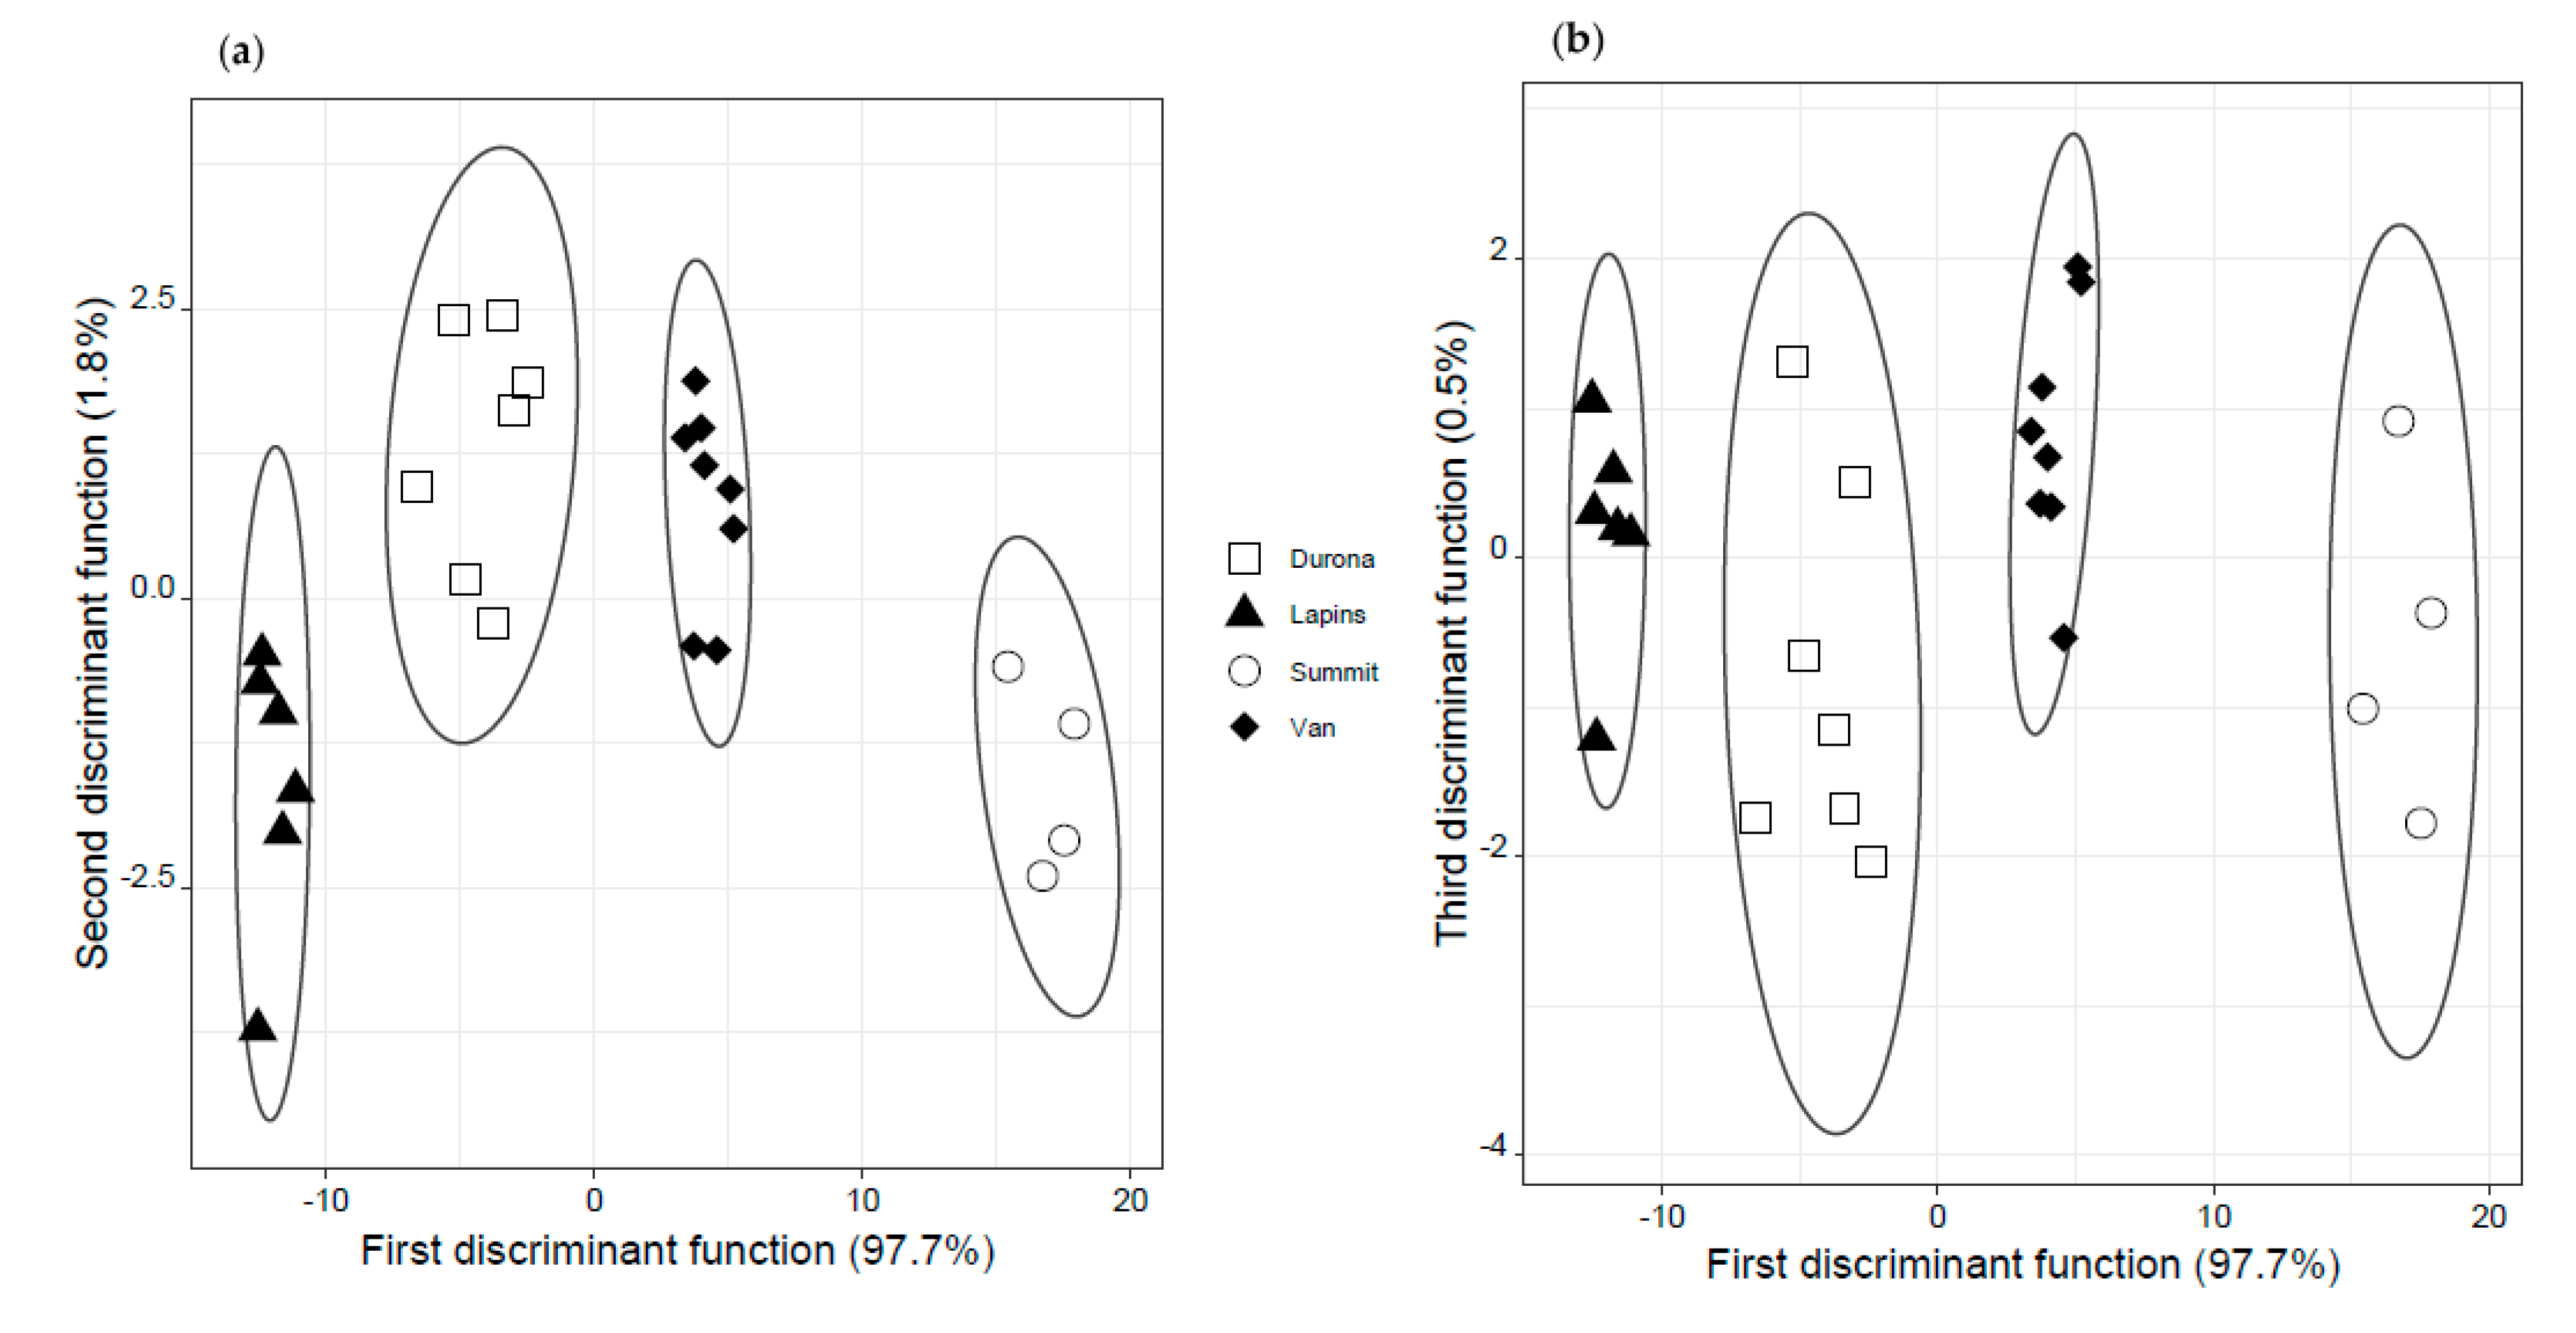
3.3. Discrimination of Cherry Cultivar Using E-Tongue Potentiometric Profiles

The E-tongue sensors recorded 40 potentiometric signals during the analysis of the aqueous cherry pastes, which varied between 106.5 and 354.8 mV (coefficients of variation from 0.2 to 7.2%) for the several independent cherry samples evaluated per cultivar studied. The average potentials recorded for the four cultivars (Durona, Lapins, Summit, and Van) were of the same magnitude. resulting in similar potentiometric signal profiles. Nevertheless, the slight differences observed were further explored to test the discrimination power of the E-tongue. These electrochemical devices have been widely used as taste-sensors. For example, potentiometric multisensor devices with lipid membranes (non-specific and cross-sensitivity sensors) were used by the research team for assessing sensory sensations or sensory-related chemical compounds in soft beverages and mineral waters [60,61], table olives and sweet peppers [23,24,25,26], and olive oil [31,32,33,34,35]. In this work, for the first time, the capability of applying a lab-made potentiometric E-tongue to discriminate sweet cherries according to the cultivar was investigated. An E-tongue-LDA-SA model, with three discriminant functions (explaining 100% of the data variability), was developed based on signals of 11 non-redundant sensors (1st array: S1:4, S1:5, S1:6, S1:7, S1:11, S1:13, and S1:17; 2nd array: S2:2, S2:15, S2:18, and S2:20). The supervised classification had sensitivities of 100%, 92%, and 88 ± 7% for the original grouped data (Figure 4), LOO-CV, and repeated K-fold-CV, respectively. In general, Summit and Van cherries were correctly classified. Misclassifications were mainly observed for Durona or Lapins cherries. The results also showed the superiority predictive cultivar classification performance of the E-tongue compared with the biometric-physicochemical data fusion strategy. On the other hand, this simpler, fast, and single-run technique had predictive correct classification rates, similar to those reported in the literature (sensitivities varying from 86.6 to 97.4%) when more extensive physicochemical, spectroscopic, and chromatographic analysis was performed [6,9,11].

4. Conclusions

This study confirmed that biometric (fruit and stone weight, the pulp/stone mass ratio, length, and maximum and minimum diameter) and typical physicochemical characteristics (penetration force, CIELAB scale color, total soluble solids, and titratable acidity) of cherries are greatly influenced by the cultivar. However, the results pointed out that the studied biometric and physicochemical parameters had a low discriminant power and that the low-level data fusion abstraction level strategy used did not allowed a satisfactory classification performance. Indeed, based on the literature, a more detailed chemical characterization is needed. On the other hand, the potentiometric data recorded by the lab-made electronic tongue allowed a satisfactory discrimination of the four cherry cultivars, which could be tentatively attributed to the device capacity to act as a taste sensor. Thus, it was demonstrated that the electronic tongue could be used as a practical tool for a preliminary routine identification of the cherry cultivar, avoiding the use of more expensive and complex analytical techniques.

Author Contributions

Conceptualization, N.R., A.M.P., and J.A.P.; methodology, Í.M.G.M., N.R., A.M.P., and J.A.P.; investigation, all authors; resources, A.M.P., A.C.A.V., A.C.R., and J.A.P.; writing—original draft preparation, I.R., N.R., Í.M.G.M., A.M.P., and J.A.P.; writing—review and editing A.C.A.V., A.M.P., A.C.R., and J.A.P. All authors have read and agreed to the published version of the manuscript.

Funding

The authors are grateful to the Foundation for Science and Technology (FCT, Portugal) for financial support by national funds FCT/MCTES to CIMO (UIDB/00690/2020) and to CEB (UIDB/04469/2020) units, as well as BioTecNorte operation (NORTE-01-0145-FEDER-000004), funded by the European Regional Development Fund under the scope of Norte2020—Programa Operacional Regional do Norte. Nuno Rodrigues also thanks the national funding by FCT–Foundation for Science and Technology, P.I., through the Institutional scientific employment program contract.

Conflicts of Interest

The authors declare no conflict of interest.

References

  1. Ganopoulos, I.; Tsaballa, A.; Xanthopoulou, A.; Madesis, P.; Tsaftaris, A. Sweet Cherry Cultivar Identification by High-Resolution-Melting (HRM) Analysis Using Gene-Based SNP Markers. Plant Mol. Biol. Report. 2013, 31, 763–768. [Google Scholar] [CrossRef]
  2. Faienza, M.F.; Corbo, F.; Carocci, A.; Catalano, A.; Clodoveo, M.L.; Grano, M.; Wang, D.Q.-H.; D’Amato, G.; Muraglia, M.; Franchini, C.; et al. Novel insights in health-promoting properties of sweet cherries. J. Funct. Foods 2020, 69, 103945. [Google Scholar] [CrossRef]
  3. Li, X.; Wei, Y.; Xu, J.; Feng, X.; Wu, F.; Zhou, R.; Jin, J.; Xu, K.; Yu, X.; He, Y. SSC and pH for sweet assessment and maturity classification of harvested cherry fruit based on NIR hyperspectral imaging technology. Postharvest Biol. Technol. 2018, 143, 112–118. [Google Scholar] [CrossRef]
  4. Ceccarelli, D.; Talento, C.; Favale, S.; Caboni, E.; Cecchini, F. Phenolic compound profile characterization by Q-TOF LC/MS in 12 Italian ancient sweet cherry cultivars. Plant Biosyst. 2018, 152, 1346–1353. [Google Scholar] [CrossRef]
  5. Jia, C.; Waterhouse, G.I.N.; Sun-Waterhouse, D.; Sun, Y.G.; Wu, P. Variety–compound–quality relationship of 12 sweet cherry varieties by HPLC-chemometric analysis. Int. J. Food Sci. Technol. 2019, 54, 2897–2914. [Google Scholar] [CrossRef]
  6. Papapetros, S.; Louppis, A.; Kosma, I.; Kontakos, S.; Badeka, A.; Kontominas, M.G. Characterization and differentiation of botanical and geographical origin of selected popular sweet cherry cultivars grown in Greece. J. Food Compos. Anal. 2018, 72, 48–56. [Google Scholar] [CrossRef]
  7. Safarzadeh, Z.; Sharifani, M.; Shakeri, A.; Hemmati, K.; Dinary, M. Discrimination of two early and late ripening cherry cultivars, using chemical indices and gel permeation chromatography (GPC). Acta Hortic. 2020, 1275, 69–74. [Google Scholar] [CrossRef]
  8. Martini, S.; Conte, A.; Tagliazucchi, D. Phenolic compounds profile and antioxidant properties of six sweet cherry (Prunus avium) cultivars. Food Res. Int. 2017, 97, 15–26. [Google Scholar] [CrossRef]
  9. Papapetros, S.; Louppis, A.; Kosma, I.; Kontakos, S.; Badeka, A.; Papastephanou, C.; Kontominas, M.G. Physicochemical, spectroscopic and chromatographic analyses in combination with chemometrics for the discrimination of four sweet cherry cultivars grown in northern Greece. Foods 2019, 8, 442. [Google Scholar] [CrossRef] [Green Version]
  10. Pérez-Sánchez, R.; Gómez-Sánchez, M.Á.; Morales-Corts, M.R. Description and quality evaluation of sweet cherries cultured in Spain. J. Food Qual. 2010, 33, 490–506. [Google Scholar] [CrossRef]
  11. Matos-Reyes, M.N.; Simonot, J.; Lopez-Salazar, O.; Cervera, M.L.; De La Guardia, M. Authentication of Alicante’s Mountain cherries protected designation of origin by their mineral profile. Food Chem. 2013, 141, 2191–2197. [Google Scholar] [CrossRef] [PubMed]
  12. Lafuente, V.; Val, J.; Negueruela, A.I. Non-destructive determination of the optimum harvest time of the sweet cherry cultivar ‘Cashmere’ through CIELab colour coordinates and the principal component analysis (PCA). Acta Hortic. 2018, 1194, 1099–1102. [Google Scholar] [CrossRef]
  13. Shao, Y.; Xuan, G.; Hu, Z.; Gao, Z.; Liu, L. Determination of the bruise degree for cherry using Vis-NIR reflection spectroscopy coupled with multivariate analysis. PLoS ONE 2019, 14, e0222633. [Google Scholar] [CrossRef] [PubMed]
  14. Hayaloglu, A.A.; Demir, N. Phenolic Compounds, Volatiles, and Sensory Characteristics of Twelve Sweet Cherry (Prunus avium L.) Cultivars Grown in Turkey. J. Food Sci. 2016, 81, C7–C18. [Google Scholar] [CrossRef] [PubMed]
  15. Di Matteo, A.; Russo, R.; Graziani, G.; Ritieni, A.; Di Vaio, C. Characterization of autochthonous sweet cherry cultivars (Prunus avium L.) of southern Italy for fruit quality, bioactive compounds and antioxidant activity. J. Sci. Food Agric. 2017, 97, 2782–2794. [Google Scholar] [CrossRef]
  16. Wiersma, P.A.; Erogul, D.; Ali, S. DNA fingerprinting of closely related cultivars of sweet cherry. J. Am. Soc. Hortic. Sci. 2018, 143, 282–288. [Google Scholar] [CrossRef] [Green Version]
  17. Ivanovych, Y.; Volkov, R. Genetic relatedness of sweet cherry (Prunus avium L.) cultivars from Ukraine determined by microsatellite markers. J. Hortic. Sci. Biotechnol. 2018, 93, 64–72. [Google Scholar] [CrossRef]
  18. Ünsal, S.G.; Çiftçi, Y.Ö.; Eken, B.U.; Velioğlu, E.; Di Marco, G.; Gismondi, A.; Canini, A. Intraspecific discrimination study of wild cherry populations from North-Western Turkey by DNA barcoding approach. Tree Genet. Genomes 2019, 15, 16. [Google Scholar] [CrossRef]
  19. Lvova, L.; Jahatspanian, I.; Mattoso, L.H.C.; Correa, D.S.; Oleneva, E.; Legin, A.; Natale, C.D.; Paolesse, R. Potentiometric E-tongue system for geosmin/isoborneol presence monitoring in drinkable water. Sensors 2020, 20, 821. [Google Scholar] [CrossRef] [Green Version]
  20. Ouyang, Q.; Yang, Y.; Wu, J.; Chen, Q.; Guo, Z.; Li, H. Measurement of total free amino acids content in black tea using electronic tongue technology coupled with chemometrics. LWT-Food Sci. Technol. 2020, 118, 108768. [Google Scholar] [CrossRef]
  21. Patel, H.K.; Patel, P.H.; Patel, H. Innovative application electronic nose and electronic tongue techniques for food quality estimation. Int. J. Recent Technol. Eng. 2019, 8, 318–323. [Google Scholar]
  22. Ciosek, P.; Wróblewski, W. Sensor arrays for liquid sensing—Electronic tongue systems. Analyst 2007, 132, 963–978. [Google Scholar] [CrossRef]
  23. Marx, Í.; Rodrigues, N.; Dias, L.G.; Veloso, A.C.A.; Pereira, J.A.; Drunkler, D.A.; Peres, A.M. Sensory classification of table olives using an electronic tongue: Analysis of aqueous pastes and brines. Talanta 2017, 162, 98–106. [Google Scholar] [CrossRef] [PubMed] [Green Version]
  24. Marx, Í.M.; Rodrigues, N.; Dias, L.G.; Veloso, A.C.A.; Pereira, J.A.; Drunkler, D.A.; Peres, A.M. Quantification of table olives’ acid, bitter and salty tastes using potentiometric electronic tongue fingerprints. LWT Food Sci. Technol. 2017, 79, 394–401. [Google Scholar] [CrossRef] [Green Version]
  25. Rodrigues, N.; Marx, Í.M.G.; Dias, L.G.; Veloso, A.C.A.; Pereira, J.A.; Peres, A.M. Monitoring the debittering of traditional stoned green table olives during the aqueous washing process using an electronic tongue. LWT Food Sci. Technol. 2019, 109, 327–335. [Google Scholar] [CrossRef] [Green Version]
  26. Guilherme, R.; Rodrigues, N.; Marx, Í.M.G.; Dias, L.G.; Veloso, A.C.A.; Ramos, A.C.; Peres, A.M.; Pereira, J.A. Sweet peppers discrimination according to agronomic production mode and maturation stage using a chemical-sensory approach and an electronic tongue. Microchem. J. 2020, 157, 105034. [Google Scholar] [CrossRef]
  27. Apetrei, C.; Apetrei, I.M.; Villanueva, S.; de Saja, J.A.; Gutierrez-Rosales, F.; Rodriguez-Mendez, M.L. Combination of an e-nose, an e-tongue and an e-eye for the characterisation of olive oils with different degree of bitterness. Anal. Chim. Acta 2010, 663, 91–97. [Google Scholar] [CrossRef]
  28. Apetrei, C.; Gutierez, F.; Rodriguez-Mendez, M.L.; de Saja, J.A. Novel method based on carbon paste electrodes for the evaluation of bitterness in extra virgin olive oils. Sens. Actuators B Chem. 2007, 121, 567–575. [Google Scholar] [CrossRef]
  29. Apetrei, I.M.; Apetrei, C. Detection of virgin olive oil adulteration using a voltammetric e-tongue. Comput. Electron. Agric. 2014, 108, 148–154. [Google Scholar] [CrossRef]
  30. Rodriguez-Mendez, M.L.; Apetrei, C.; de Saja, J.A. Evaluation of the polyphenolic content of extra virgin olive oils using an array of voltammetric sensors. Electrochim. Acta 2008, 53, 5867–5872. [Google Scholar] [CrossRef]
  31. Borges, T.H.; Peres, A.M.; Dias, L.G.; Seiquer, I.; Pereira, J.A. Application of a potentiometric electronic tongue for assessing phenolic and volatile profiles of Arbequina extra virgin olive oils. LWT Food Sci. Technol. 2018, 93, 150–157. [Google Scholar] [CrossRef]
  32. Harzalli, U.; Rodrigues, N.; Veloso, A.C.A.; Dias, L.G.; Pereira, J.A.; Oueslati, S.; Peres, A.M. A taste sensor device for unmasking admixing of rancid or winey-vinegary olive oil to extra virgin olive oil. Comput. Electron. Agric. 2018, 144, 222–231. [Google Scholar] [CrossRef] [Green Version]
  33. Veloso, A.C.A.; Dias, L.G.; Rodrigues, N.; Pereira, J.A.; Peres, A.M. Sensory intensity assessment of olive oils using an electronic tongue. Talanta 2016, 146, 585–593. [Google Scholar] [CrossRef] [PubMed] [Green Version]
  34. Veloso, A.C.A.; Silva, L.M.; Rodrigues, N.; Rebello, L.P.; Dias, L.G.; Pereira, J.A.; Peres, A.M. Perception of olive oils sensory defects using a potentiometric taste device. Talanta 2018, 176, 610–618. [Google Scholar] [CrossRef] [Green Version]
  35. Bobiano, M.; Rodrigues, N.; Madureira, M.; Dias, L.G.; Veloso, A.C.A.; Pereira, J.A.; Peres, A.M. Unmasking sensory defects of olive oils flavored with basil and oregano using an electronic tongue-chemometric tool. J. Am. Oil Chem. Soc. 2019, 96, 751–760. [Google Scholar] [CrossRef] [Green Version]
  36. Zhang, X.; Wang, X.; Xing, S.; Ma, Y.; Wang, X. Multi-sensors enabled dynamic monitoring and quality assessment system (DMQAS) of sweet cherry in express logistics. Foods 2020, 9, 602. [Google Scholar] [CrossRef]
  37. NP-1421, 1977. Géneros Alimentícios Derivados De Frutos e Produtos Hortícolas. Determinação Da Acidez. Portuguese Regulation NP-1421. Available online: https://lojanormas.ipq.pt/product/np-1421-1977 (accessed on 20 May 2020).
  38. Vlasov, Y.; Legin, A.; Rudnitskaya, A.; Di Natale, C.; D’Amico, C. Nonspecific sensor arrays (“electronic tongue”) for chemical analysis of liquids: (IUPAC technical report). Pure Appl. Chem. 2005, 77, 1965–1983. [Google Scholar] [CrossRef]
  39. Kobayashi, Y.; Habara, M.; Ikezazki, H.; Chen, R.; Naito, Y.; Toko, K. Advanced taste sensors based on artificial lipids with global selectivity to basic taste qualities and high correlation to sensory scores. Sensors 2010, 10, 3411–3443. [Google Scholar] [CrossRef] [Green Version]
  40. Dias, L.G.; Peres, A.M.; Veloso, A.C.A.; Reis, F.S.; Vilas Boas, M.; Machado, A.A.S.C. An electronic tongue taste evaluation: Identification goat milk adulterations with bovine milk. Sens. Actuators B Chem. 2009, 136, 209–217. [Google Scholar] [CrossRef]
  41. Dias, L.G.; Peres, A.M.; Barcelos, T.P.; Sá Morais, J.; Machado, A.A.S.C. Semi-quantitative and quantitative analysis of soft drinks using an electronic tongue. Sens. Actuators B Chem. 2011, 154, 111–118. [Google Scholar] [CrossRef]
  42. Rodrigues, N.; Dias, L.G.; Veloso, A.C.A.; Pereira, J.A.; Peres, A.M. Monitoring olive oils quality and oxidative resistance during storage using an electronic tongue. LWT Food Sci. Technol. 2016, 73, 683–692. [Google Scholar] [CrossRef] [Green Version]
  43. Bertsimas, D.; Tsitsiklis, J. Simulated annealing. Stat. Sci. 1993, 8, 10–15. [Google Scholar] [CrossRef]
  44. Cadima, J.; Cerdeira, J.O.; Minhoto, M. Computational aspects of algorithms for variable selection in the context of principal components. Comput. Stat. Data Anal. 2004, 47, 225–236. [Google Scholar] [CrossRef]
  45. Kirkpatrick, S.; Gelatt, C.D.; Vecchi, M.P. Optimization by simulated annealing. Science 1983, 220, 671–680. [Google Scholar] [CrossRef] [PubMed]
  46. Bishop, C.M. Pattern Recognition and Machine Learning, 1st ed.; Springer: New York, NY, USA, 2006. [Google Scholar]
  47. Venables, W.N.; Ripley, B.D. Modern Applied Statistics with S (Statistics and Computing), 4th ed.; Springer: New York, NY, USA, 2002. [Google Scholar]
  48. Ballistreri, G.; Continella, A.; Gentile, A.; Amenta, M.; Fabroni, S.; Rapisarda, P. Fruit quality and bioactive compounds relevant to human health of sweet cherry (Prunus avium L.) cultivars grown in Italy. Food Chem. 2013, 140, 630–638. [Google Scholar] [CrossRef] [PubMed]
  49. Radunić, M.; Jukić Špika, M.; Strikić, F.; Ugarković, J.; Čmelik, Z. Pomological and chemical characteristics of sweet cherry cultivars grown in Dalmatia, Croatia. Acta Hortic. 2014, 1020, 385–388. [Google Scholar] [CrossRef]
  50. Santos, A.C.A.; Palma, V.; Rato, A.E.; Machado, G.; Lozano, M.; González-Gómez, D. Quality of ‘Sweetheart’ cherry under different storage conditions. Acta Hortic. 2014, 1020, 101–110. [Google Scholar] [CrossRef] [Green Version]
  51. Hayaloglu, A.A.; Demir, N. Physicochemical characteristics, antioxidant activity, organic acid and sugar contents of 12 sweet cherry (Prunus avium L.) cultivars grown in Turkey. J. Food Sci. 2015, 80, C564–C570. [Google Scholar] [CrossRef]
  52. Skrzyński, J.; Leja, M.; Gonkiewicz, A.; Banach, P. Cultivar effect on the sweet cherry antioxidant and some chemical attributes. Folia Hortic. 2016, 28, 95–102. [Google Scholar] [CrossRef] [Green Version]
  53. Velardo-Micharet, B.; Peñas Díaz, L.; Tapia García, I.M.; Nieto Serrano, E.; Campillo Torres, C. Effect of irrigation on postharvest quality of two sweet cherry cultivars (Prunus avium L). Acta Hortic. 2017, 1161, 667–672. [Google Scholar] [CrossRef]
  54. Chiabrando, V.; Giacalone, G. Factors affecting the quality of fresh-cut sweet cherry. Acta Hortic. 2018, 1209, 103–107. [Google Scholar] [CrossRef]
  55. Correia, S.; Queirós, F.; Ribeiro, C.; Vilela, A.; Aires, A.; Barros, A.I.; Schouten, R.; Silva, A.P.; Gonçalves, B. Effects of calcium and growth regulators on sweet cherry (Prunus avium L.) quality and sensory attributes at harvest. Sci. Hortic. 2019, 248, 231–240. [Google Scholar] [CrossRef]
  56. Iurea, E.; Corneanu, M.; Militaru, M.; Sîrbu, S. Assessment of new sweet cherry cultivars released at RSFG Iaşi, Romania. Not. Bot. Horti Agrobot. Cluj Napoca 2019, 47, 729–733. [Google Scholar] [CrossRef] [Green Version]
  57. Iurea, E.; Sîrbu, S.; Corneanu, M.; Butac, M.; Titirică, I.; Militaru, M. Assessment of some sweet cherry cultivars in comparison with their genitors under the conditions of the north-eastern area of Romania. Not. Bot. Horti Agrobot. Cluj Napoca 2019, 47, 207–212. [Google Scholar] [CrossRef] [Green Version]
  58. Martínez-Hernández, G.B.; Blanco, V.; Blaya-Ros, P.J.; Torres-Sánchez, R.; Domingo, R.; Artés-Hernández, F. Effects of UV–C on bioactive compounds and quality changes during shelf life of sweet cherry grown under conventional or regulated deficit irrigation. Sci. Hortic. 2020, 269, 109398. [Google Scholar] [CrossRef]
  59. De Juan, A.; Tauler, R. Data fusion by multivariate curve resolution. In Data Handling Science Technology; Elsevier: Amsterdam, The Netherlands, 2019; pp. 205–233. [Google Scholar]
  60. Dias, L.G.; Sequeira, C.; Veloso, A.C.A.; Sousa, M.E.B.C.; Peres, A.M. Evaluation of Healthy and Sensory Indexes of Sweetened Beverages using an Electronic Tongue. Anal. Chim. Acta 2014, 848, 32–42. [Google Scholar] [CrossRef] [Green Version]
  61. Dias, L.G.; Alberto, Z.; Veloso, A.C.A.; Peres, A.M. Electronic tongue: A versatile tool for mineral and fruit-flavored waters recognition. J. Food Meas. Charact. 2016, 10, 264–273. [Google Scholar] [CrossRef] [Green Version]
Figure 1. Sweet cherries: (a) Durona, (b) Lapins, (c) Summit, and (d) Van cultivars.
Applsci 10 07053 g001
Figure 2. (a) E-tongue sensor arrays (cylindrical acrylic body with 20 circular lipid sensor membranes). (b) Datalogger.
Applsci 10 07053 g002
Figure 3. Discrimination of sweet cherries according to four cultivars (□ Durona; ▲ Lapins; ◦ Summit; or, ♦ Van) using a LDA-SA model based on nine selected biometric-physicochemical characteristics (L* and a* CIELAB color scales, titratable acidity, penetration force, length, maximum and minimum diameter, stone weight, and pulp/stone mass ratio): (a) 2D-plot of the first and second discriminant functions; (b) 2D-plot of the first and third discriminant functions. The full ellipses represent the confidence region boundaries determined based on the posterior probabilities calculated for each class membership.
Applsci 10 07053 g003
Figure 4. Discrimination of sweet cherries according to four cultivars (□ Durona; ▲ Lapins; ◦ Summit; or ♦ Van) using a LDA-SA model based on 11 E-tongue potentiometric profiles (1st sensor array: S1:4, S1:5, S1:6, S1:7, S1:11, S1:13, and S1:17; 2nd sensor array: S2:2, S2:15, S2:18, and S2:20): (a) 2D-plot of the first and second discriminant functions; (b) 2D-plot of the first and third discriminant functions The full ellipses represent the confidence region boundaries determined based on the posterior probabilities calculated for each class membership.
Applsci 10 07053 g004
Table 1. Fruit biometric and physicochemical parameters (mean value ± standard deviation) of the four sweet cherry cultivars studied (Durona, Lapins, Summit, and Van) and statistical differences (one-way ANOVA).
ParametersCherry Cultivar
DuronaLapinsSummitVanp-Value 1
Biometric
Fruit mass (g)6.25 ± 0.96 b6.78 ± 1.38 a7.15 ± 1.06 a6.79 ± 1.08 a<0.0001
Length (mm)19.1 ± 1.2 d20.6 ± 1.7 b21.4 ± 1.4 a19.7 ± 1.6 c<0.0001
Maximum diameter (mm)22.6 ± 1.6 d23.2 ± 1.2 c24.8 ± 1.4 a24.2 ± 1.7 b<0.0001
Minimum diameter (mm)20.4 ± 1.320.5 ± 1.520.7 ± 1.220.6 ± 1.40.2000
Stone mass (g)0.36 ± 0.06 a,b0.37 ± 0.06 a0.35 ± 0.04 b0.31 ± 0.04 c<0.0001
Pulp/stone ratio 16.8 ± 3.8 b17.8 ± 4.2 b19.7 ± 3.0 a20.8 ± 3.4 a<0.0001
Physicochemical
Force (N)2.58 ± 0.46 b2.91 ± 0.60 a2.50 ± 0.34 b3.01 ± 0.51 a<0.0001
L* (CIELAB scale)32.3 ± 3.1 c35.6 ± 4.7 a,b37.2 ± 4.1 a35.0 ± 4.6 b<0.0001
a* (CIELAB scale)27.8 ± 5.6 c33.8 ± 6.8 a,b34.7 ± 4.6 a31.6 ± 6.2 b<0.0001
b* (CIELAB scale)10.4 ± 3.6 c14.8 ± 5.4 a,b16.3 ± 4.0 a13.5 ± 4.6 b<0.0001
Titratable acidity (TA, g gallic acid/100 g fw)0.17 ± 0.010.17 ± 0.040.21 ± 0.010.21 ± 0.040.0312
Total soluble solids (TSSs, °Brix)14.1 ± 1.5 b14.1 ± 2.3 b12.6 ± 1.5 c15.5 ± 3.0 a<0.0001
1 For each line, a p-value < 0.05 means that, for each cherry cultivar, the mean value of the evaluated parameter of at least one of the four cultivars studied differs from the others, according to the one-way ANOVA results (in this case, multiple-comparison tests were performed). Different letters mean significant statistical differences of the parameter under evaluation at a 5% significance level (p-value < 0.05), according to a multiple comparison Tukey’s HSD test.

