Defragmenting Research Areas with Knowledge Visualization and Visual Text Analytics


VisUSAL Research Group, Universidad de Salamanca, 37008 Salamanca, Spain
*
Authors to whom correspondence should be addressed.
Appl. Sci. 2020, 10(20), 7248; https://0-doi-org.brum.beds.ac.uk/10.3390/app10207248
Submission received: 27 September 2020
/
Revised: 14 October 2020
/
Accepted: 14 October 2020
/
Published: 16 October 2020
(This article belongs to the Special Issue Applications of Cognitive Infocommunications (CogInfoCom))
Abstract
:The increasing specialization of science is motivating the fragmentation of traditional and well-established research areas into interdisciplinary communities of practice that focus on cooperation between experts to solve problems in a wide range of domains. This is the case of problem-driven visualization research (PDVR), in which groups of scholars use visualization techniques in different application domains such as the digital humanities, bioinformatics, sports science, or computer security. In this paper, we employ the findings obtained during the development of a novel visual text analytics tool we built in previous studies, GlassViz, to automatically detect interesting knowledge associations and groups of common interests between these communities of practice. Our proposed method relies on the statistical modeling of author-assigned keywords to make its findings, which are demonstrated in two use cases. The results show that it is possible to propose interactive, semisupervised visual approaches that aim at defragmenting a body of research using text-based, automatic literature analysis methods.
1. Introduction
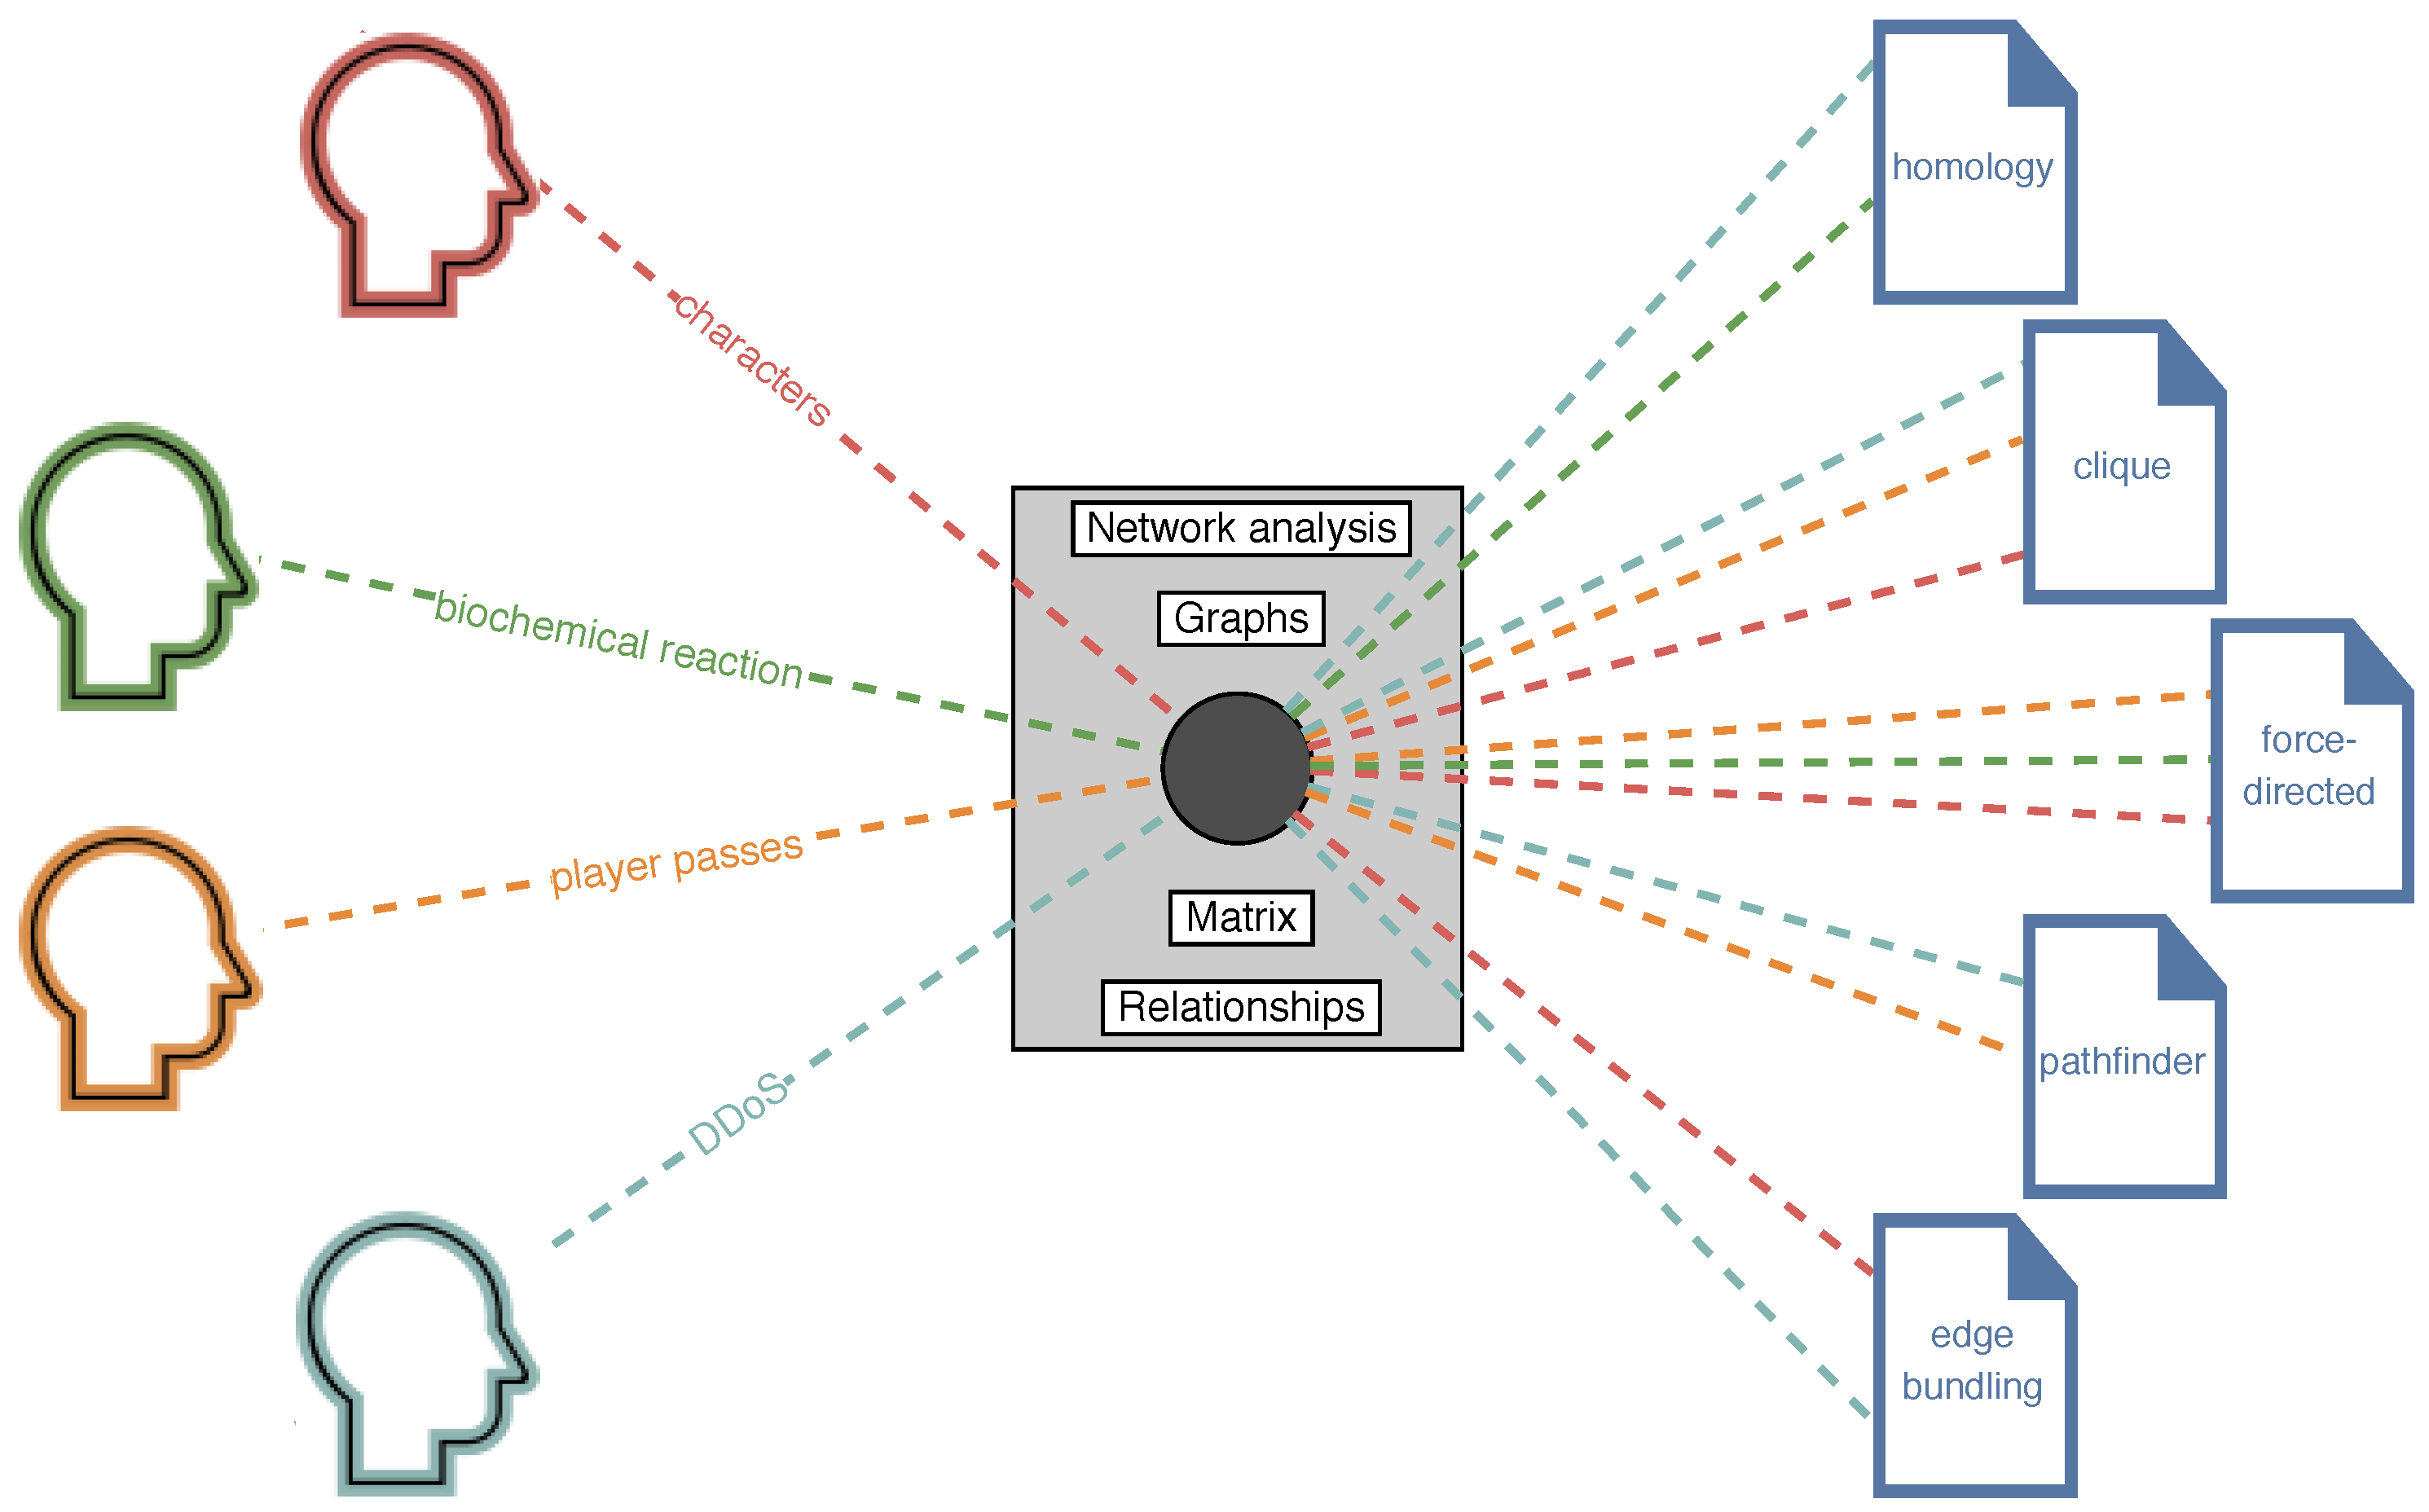
The increasing specialization of science has motivated the surge of different novel interdisciplinary collaborations between research communities in a wide range of domains. This is particularly the case for problem-driven visualization research (PDVR) [1], a type of interdisciplinary practice that connects domain and visualization experts to solve non-trivial, specific domain problems in diverse areas such as biology, city planning, or sports science. In this regard, it is usual that scholars involved in these kinds of collaborations gather in workshops and micro-conferences to discuss each area’s particularities, fragmenting visualization research into communities of practice. Resulting from their activity, these communities often produce reference publication datasets in a wide variety of focused areas, a fact that reflects the need of these visualization practitioners to obtain information that is tailored to their particular research aims. However, and despite the absolute utility value of these collections, they may also be indicative of the creation of isolated communities within the visualization practice, a fact that could lead to an excess of redundant visualization solutions for generic, domain-agnostic tasks (establishing comparisons, creating summaries, or searching for specific elements) that are replicated across collaborations [2]. Thus, this risk calls for novel approaches that allow a fluid exchange of ideas among practitioners from different knowledge domains to avoid wasting time and human resources that is potentially harming visualization research. To this aim, in recent times, certain authors have started to introduce proposals to facilitate this desirable transfer of knowledge across communities [3], which is known in HCI and visualization research as methodology transfer (MT) [4]. In our recent work, GlassViz [5], we contributed a visual text analytics (VTA) tool (built in the Vega-Lite grammar [6] and its Python API Altair [7]) that aims at supporting problem-driven visualization researchers in the task of exploring large collections of scientific papers by visualizing automatically extracted candidate MTs fit to the researcher’s interests, which are represented by an auxiliary collection. To achieve this aim, GlassViz finds entry points, which are groups of distributionally related keywords that introduce the user to the corpus, offering a reading order of discovered documents, among other advantages, effectively reducing the cognitive gap involved in the exploration task. This is based on the idea that typically, interdisciplinary researchers employ general keywords to browse a collection of papers to find unknown, potentially interesting techniques that can be used to solve domain-specific problems, which are generally novel and cannot be found in the collection. This idea is depicted in Figure 1, in which four interdisciplinary visualization researchers seek visualization solutions for four different problems in their respective domains. To achieve their goal, these researchers will employ intermediate general terms that these problems are commonly related to (e.g., “network analysis”, “graphs”, “matrix”, or “relationships”). An extensive search employing these terms might unveil visualizations and algorithms in the target collection that they may use to solve the problems at hand.
Reflecting on the theory for an interdisciplinary search methodology that we introduced in our previous studies [5,8], we formed the new hypothesis that these groups of shared interests could be automatically detected by analyzing domain-specific literatures on each of the implied areas of knowledge. This hypothesis is the starting point of the work described in this paper, whose main contributions are (1) a set of domain-specific metadata datasets of research papers in three typical kinds of PDVR. These collections are combined with two others compiled by us [9] and other researchers [10] in previous studies in the field and are the input data of our study (described in Section 3); (2) an analysis based on keywords that measures coincidences and differences between keyword sets extracted from the aforementioned collections (Section 4.1); (3) a method to measure distributional similarity between these keywords (Section 4.2 and Section 4.3); (4) an analysis of inter-collection similarities as found by our method (Section 4.4); and (5) an enhanced version of our VTA tool, GlassViz, to allow the interactive navigation of distributionally-affine sets of domain-specific terms (Section 5 and Section 6).
2. Related Work
Our contribution is inspired by other works in visualization design, visual analytics, information science, and text mining that we introduce in this section.
2.1. Visual Text Analytics of Research Paper Collections
Visual text analytics (VTA) is a novel, text-centered specialization of a broader research discipline known as visual analytics (VA) [11,12] that aims at augmenting the user’s analytical capabilities and promoting analytical reasoning on textual data by exploiting the visual pattern recognition mechanisms of the human brain. Concretely, VTA tools deal with unstructured or semistructured text, and they have been typically demonstrated using diverse collections of research papers. In this regard, many authors have combined visualization of multivariate research paper metadata with text mining techniques applied to the papers’ contents to create browsable spatializations of a collection. For example, this is the case of Berger et al. [13], who modified the popular word2vec model to provide a joint bidimensional representation of keywords and documents based on citation contexts. In a similar approach to ours, Fried and Kobourov in Maps of Computer Science [14] and Shahaf et al. in Metro Maps of Science [15] employ different graph-based clustering techniques and force-directed layout algorithms to explore a similarity matrix obtained from comparing vectors derived from paper titles and abstracts in the DBLP database.
2.2. Cognitive Data Visualization
Cognitive data visualization refers to the area of multidisciplinary visualization research that aims to augment the capabilities of the human cognitive system [16]. Researchers in this field employ knowledge originating in cartography, statistics, neuroscience, and ergonomics to design visualizations that accelerate knowledge acquisition. Examples of contributions in this field can typically be found in the proceedings of the IEEE International Conference on Cognitive Infocommunications (CogInfoCom) [17], among other venues. There are several examples in the literature of cognitive data visualizations aiming to support the sense-making process of scientific documents collections worth mentioning (see, e.g., in [18]). Specifically, we rely on previous work by Chen, who employs a psychometric graph scaling method, pathfinder networks (PFNETs), to represent semantic spaces found in a collection of conference proceedings [19,20] that were derived from a similarity matrix of co-authorship occurrences using latent semantic analysis (LSA) and singular value decomposition (SVD). This approach was further explored in more recent contributions [21,22] to build complete systems aiming to support the literature review process. In our past work [8], we employed SVD to propose a similar analysis based on author-assigned keywords that we adapted to this study (see Section 4). In particular, we used shortest paths to partition a graph of distances between vector representations of keywords, which in turn served to detect cross-domain affinities between two collections of research papers. The solution is extended and complemented with our recent findings in GlassViz [5] to propose an interactive system that enables the exploration of affinities between several communities of practice, as we show in Section 5.
2.3. Literature-Based Discovery
Literature-Based Discovery (LBD) is a knowledge extraction technique that aims at making scientific discoveries by connecting what is already available in the literature [23]. The term was coined in the 1980s by Don R. Swanson, an information scientist who followed this method to unveil a relationship between dietary fish oil and Raynaud’s disease, a circulatory disorder [24]. To this end, he used the ABC model, a method that follows a syllogism to connect terms in two disjoint bodies of literature A and B: if a concept A, exclusive to Literature A, is related to an intermediate concept B that appears in both Literatures A and B, and in turn, this concept B is related to another concept C which is exclusive to literature C, then there is a relationship between the concept A (known by the user) and the concept C (new to the user) that is characterized by the concept B. The ABC model supports two modes of discovery (open and closed, see Figure 2), and it is currently in the process of being applied to other domains, such as computer science, employing word embeddings [25] extracted from online databases of scientific documents [26]. Our method extends and adapts these ideas to obtain distributional embeddings from author-assigned keywords (see next section), which are used to detect affinities between terms found exclusively on one of the interdisciplinary visualization research areas that we centered our study around (see Section 3).
2.4. Distributional Similarity
Distributional similarity refers to the idea that linguistic items presenting similar distributions in a corpus, which usually appear in the same contexts, have similar meanings [27]. This concept is implemented in different available vector space models that produce vector representations of the words in a corpus. The obtained representations are usually employed to conduct different linguistic tasks, such as similarity or analogy detection and evaluation, or classification. Concerning LBD, similarity evaluation with word embeddings has been tested to automate the LBD workflows presented in the previous section [5,8,23]. Given that word embeddings can capture high order co-occurrence, they seem to be an excellent alternative to discover hidden connections in the scientific literature. This idea is exemplified in Figure 3. The chart shows a starting concept describing a problem found in a body of literature. This concept is connected to two techniques described in a different body of literature by co-occurrence relationships (represented by the edges) between these three concepts and a number of intermediate concepts. By looking at the distribution of the edges in the network, it is easy to see that the c-concept describing the second technique is more related to the problem described by the a-concept than the other c-concept, as the number of high-level co-occurrences between these two concepts is higher for the second c-concept than it is for the first one. Theoretically, this kind of similarity could be detected with arithmetic operations performed on the implied concepts’ vector representations of a model trained with this data. Our embeddings are inspired by the proposal by Levy et al. [28], which requires minimal hyperparameter tuning, and it is known to excel at word similarity tasks [28,29]. To detect affinities between concepts in different areas of interdisciplinary research, we rely on a cosine metric, which is the preferred option for conducting similarity-based tasks, as seen in other works [30,31].
2.5. Methodology Transfer
Methodology Transfer (MT) refers to the practice of reusing available models to provide solutions for novel, unsolved problems. The practice was first introduced into the visualization domain by Burkhard in 2004 [4], who, inspired by previous work by Eppler [32] and standard practices in the domain of architecture, advocated for transferring knowledge between different stakeholders and communities of practice. To this end, he defined a framework of knowledge visualization (as opposed to information visualization), which is defined as “the use of visual representations to improve the transfer of knowledge between at least two persons or groups of persons”. Since then, the own Burkhard and others have applied the framework to different areas of interdisciplinary visualization practice such as urban planning [33], decision-making support in the medical domain [34], or education [35]. In more recent times, Miller et al. elaborated on Burkhard’s ideas to frame a novel research field (visual musicology) as per the principles of methodology transfer [3] using their methodology transfer model (MTM). In our previous work [9], we augmented this model with concepts drawn from LBD to automate the discovery of potential MTs in PDVR [5]. In Section 4, we explain how this model is evolved and adapted to detect concept associations between different areas of interdisciplinary visualization research.
3. Data Description
To demonstrate the advantages of our approach, we employ five different collections of research papers in the context of four typical areas of PDVR (VIS4DH, BioVis, SportsVis, and VizSec). The main collection, VIS, is the body of literature that connects the other four collections by providing a large set of keyword associations that augments and extends those found on each of the domain-specific collections. Specific details about each collection are provided below, which can be found as supplemental materials to this paper.
3.1. Domain-Specific Literatures
3.1.1. VIS4DH
This domain-specific collection comprises 221 papers on visualization for the Digital Humanities (VIS4DH) between the years 2016–2019 that were compiled in our previous study [9]. The publications were obtained from two primary sources: The first one, the VIS4DH workshop, is a collocated event with the IEEE VIS set of conferences that gathers researchers working at the intersection of visualization and the humanities to discuss new research directions in visualization and digital humanities research (https://vis4dh.dbvis.de/). The second source was obtained from visualization papers located at the humanities side of the collaboration, namely, those published in the ADHO (https://adho.org/) Digital Humanities Conference and its peer journal Digital Humanities Quarterly (DHQ) (http://www.digitalhumanities.org/dhq/).
3.1.2. BioVis
The second domain-specific collection was specifically compiled for this study and holds publications by researchers interested in biological data visualization. The symposium’s main aims are “to educate, inspire, and engage visualization researchers in problems in biological data visualization, as well as bioinformatics and biology researchers in state-of-the-art visualization research”. The workshop started in 2011 as a parallel event with the IEEE Visualization conference but has since then moved to other venues as well: currently, it is a dual meeting taking place at the IEEE VIS Conference and the Conference on Intelligent Systems for Molecular Biology (ISMB). In total, we obtained 69 publications presented at the BioVis (http://biovis.net/) symposium between the years 2011–2019.
3.1.3. SportsVis
We wanted to include another important typical area of PDVR in this study: sports data visualization. Although this type of collaboration is also well-established in the visualization practice, and as opposed to the approach we followed to collect the previous datasets that drew publications from discipline-specific venues, such gathering did not exist in this case. The only attempt to hold an event on sports data visualization occurred in 2013 during the IEEE VIS conference in Atlanta with the celebration of the 1st IEEE VIS Workshop on Sports Data Visualization (http://workshop.sportvis.com/). Unfortunately, this was the only edition of the event, which did not continue since. Instead, to build a representative dataset of the discipline, we relied on previous work by Perin et al. [36], who created a survey of the state of the art of sports data visualization in 2018. The authors also built a website as companion material of the paper (https://sportsdataviz.github.io/) in which they list all works cited in the survey and keep updating regularly. Thus, we built the fourth dataset with all papers appearing in this website that contained author-assigned keywords, which were completed with works presented at the first edition of the VIS Workshop on Sports Data Visualization. In the end, we could collect 59 documents related to this specialty.
3.1.4. VizSec
Finally, and following a similar method as in the first two cases, the fourth collection represents publications in visualization for cybersecurity, which is also a long-established area of interdisciplinary visualization research. The main venue that has been regularly capturing contributions in this field since 2004 is the International Workshop/Symposium on Visualization for Cyber Security (VizSec) (https://vizsec.org/), from which we obtained 175 papers presented at all its past editions (2004–2019).
3.2. Visualization Literature
The visualization literature (VIS) is a set of 2259 visualization research papers presented at the IEEE set of conferences InfoVis, SciVis, VAST, and Vis between the years 1991 and 2019 that was compiled by other authors [10]. The collection includes a great variety of different algorithms, techniques, problems, and tasks typically related to visualization research in different and diverse application domains. This collection is used to connect the different communities of practice represented by the domain-specific literatures introduced in the previous sections.
4. Method
Our method aims to implement a standard visual text mining pipeline that is often seen in many VTA tools. Generally, these pipelines employ diverse well-known text mining algorithms whose results are presented to the user in an interactive graphical interface. To obtain deeper insight into text mining techniques commonly employed for text visualization, we refer the reader to the recent survey by Liu et al. [37], which offers a highly didactic introduction to the topic. Additionally, the work in [38] provides a general introduction to machine learning methods for text analysis.
As explained in previous sections, our implementation aims to detect significant inter-collection distributional similarities between exclusive terms appearing in each literature. To this end, we rely on a distance matrix S that is obtained from comparing dense vector representations of keyword tokens in a vector space model (VSM) using a cosine metric. The process to obtain the vectors from the keyword tokens generated in Section 4.1 is replicated here from our previous work in the field [8], which was inspired by other authors [28]. Figure 4 captures the steps we followed to build the embeddings, which are detailed in this section.
4.1. Data Processing
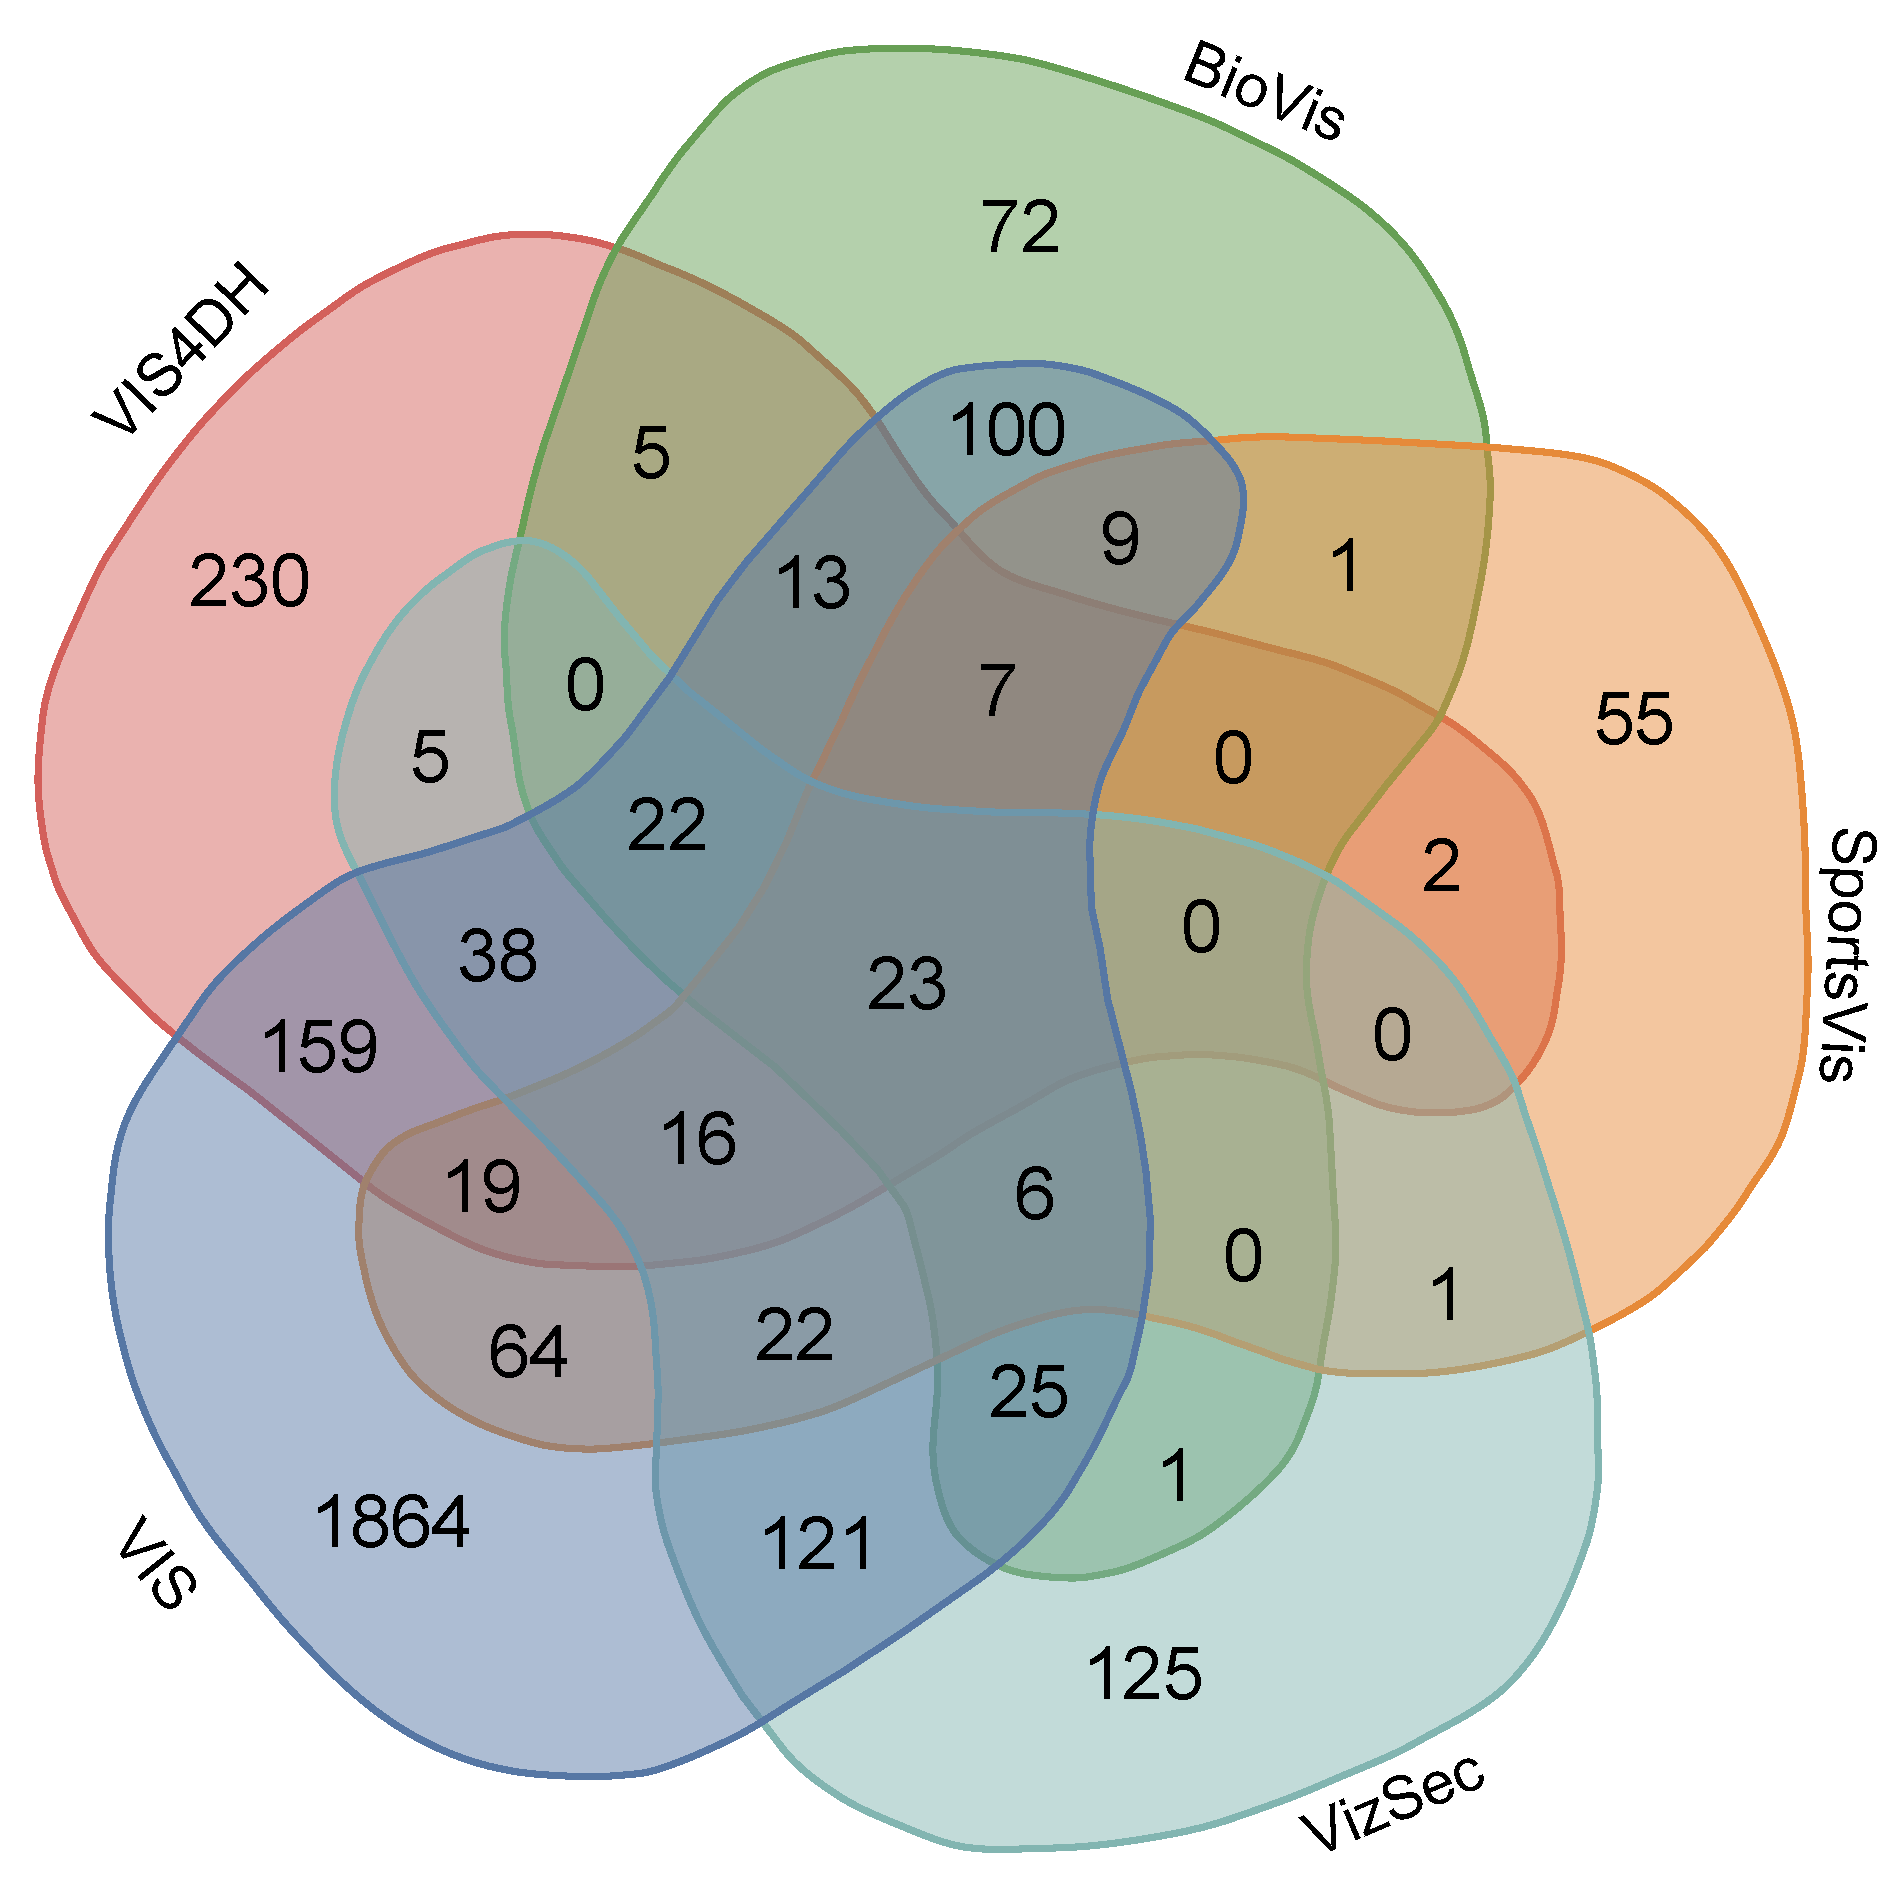
Before attempting to create vector representations from the keywords found in the collections presented in the previous section, we prepared the data in the same manner as in our previous studies: first, we built a document-term matrix with keywords extracted from each document (documents with less than two keywords were discarded), tokenized and translated into their American English forms. Tokens matching NLTK’s list of English stop words (e.g., “and” or “of”) were removed from the analysis, which yielded a total of 3005 different tokens. Next, each token was light-stemmed using the Porter algorithm. As author-assigned keywords are a very sparse feature, the stemming procedure had the positive effect of compressing the input vocabulary by linking related lexical forms together under the same root. The number of extracted unique tokens for each collection is shown in Table 1. Intersection sets between the five collections are displayed in Figure 5.
4.2. Embedding Generation
The process starts by building a document-term matrix (Figure 4(1)) that contains all documents and keywords in the five collections. This matrix was compressed (Figure 4(2)) by tokenizing multi-term keywords and stemming all 1-grams, as explained in f1s4.1 (Figure 4(3)). Next, we built a pointwise mutual information (PMI) matrix (Figure 4(4)) that encoded the probability for a pair of tokens to be seen together in a document with respect to seeing those terms separately in the whole corpus. In this approach, each document is treated as a bag-of-words in which the probabilities inf1eq:pmi can be empirically calculated from the corpus in the following manner; a keyword w appearing in a set of documents D with other keywords (its context c) can be counted, giving a number . This number is divided by the product of the number of times that keyword appears in the whole corpus () and the number of times all the other context keywords appear in the corpus (). As it is customary [29], we apply a smoothing factor to the distribution of each token’s context (Equation (3)), obtaining , which aims to counteract PMI bias towards very infrequent events. During the experiments described in this paper, we employed , which seems to work well for keyword similarity tasks and small-sized vocabularies like ours according to our past findings [5,8] (note that and the number of dimensions k are corpus-dependent factors).
Finally, and as the matrix SPMI can take infinite negative values when two tokens are never seen in the corpus since , we employ a positive version that takes 0 in such cases (Equation (4)).
Then, we annotated the provenance for rows in the matrix (Figure 4(5)) and recorded whether they appeared exclusively in one of the collection, or in several. The provenance was employed in a later step to detect similarities between elements in different collections (see the next section). The resulting square matrix is then factorized into the product of three matrices employing singular value decomposition (SVD) (Figure 4(6)), which is a popular algebraic method among NLP scholars that was first employed in the 1990s by the authors behind latent semantic analysis (LSA) [27]. The number of dimensions k was adjusted to 50, although we obtained similar results with values of k in the range. The vector representations of keyword tokens are the left singular values U of the decomposition from which we built a distance matrix D, which we searched for significant inter-collection similarities as we explain the next section.
4.3. Distance Matrix
We calculated pairwise distances between keyword embeddings employing a cosine metric (Equation (5)). This distances were later captured in a distance matrix D. In turn, the matrix D was converted into a distance graph G that was later pruned by removing nodes that were not on the shortest paths connecting domain-specific terms in the different literatures.
Keyword vectors with pairwise cosine distance equal to or less than 0.01 were considered to be the distributionally identical for this task and were therefore combined into a single representation (509 in total). From this distance matrix, we generated a graph G that was explored to find interesting interdisciplinary connections. The exploration method we employed is discussed in the next section.
4.4. Finding Interdisciplinary Connections
As discussed in previous sections, this study aimed to capture and visualize interesting interdisciplinary knowledge associations between the different domains represented in the collected sample data. To this end, we partitioned the graph G using Dijkstra’s algorithm to discover least-cost paths connecting every domain-specific term in the four different domain-specific literatures to their closest exclusive tokens in every other literature. After running the algorithm, we obtained 563 shortest paths (note that ) for which we annotated their distances and the collections their originating tokens belonged to. Average inter-collection distances are represented in the plot in Figure 6 as orange lines. From these depictions, some information can be decoded: for example, the collections pair presenting the highest average distance between their terms was formed by the VIS4DH and SportsVis datasets, whereas this last one showed the highest similarity of all with the VizSec dataset.
At this point, we wondered whether the size of each collection (and thus their number of overlapping tokens with other collections) had any influence on the distances obtained. To answer this question, we calculated three metrics: (1) the average path distance obtained for all tokens on each collection, (2) the Jaccard index between two sets of tokens (defined as ), and (3) the combined Jaccard index between the two sets of tokens and the VIS collection (which would help us clarify whether the number of overlapping items of both sets with VIS was also influencing the distances in any manner). These two variables were plotted in blue in the charts of f1f6.
A Spearman correlation () test verified what can also be observed in the charts: we could not find any evidence that supported that the average proximity between collections was influenced by the number of overlapping tokens between the collections, and thus neither by the size of each collection, nor by the size of their intersections with the main VIS dataset. A plausible explanation for this fact may be that the similarity score is more influenced by how specific keywords on each collection associate with others in the rest of the dataset. Investigating the exact causes for this observation, however, is something that we considered exceeded the aims of this paper and was left for future studies.
We continued our study by analyzing inter-collection path distances in the histogram in Figure 7. By inspecting the charts, it can be seen that the distances of paths in the four collections approximately follow a Weibull distribution (KS test: ). In light of these results, we decided to use a cut-off value from the distribution head to filter longer, less interesting connections before moving to the visualization stage.
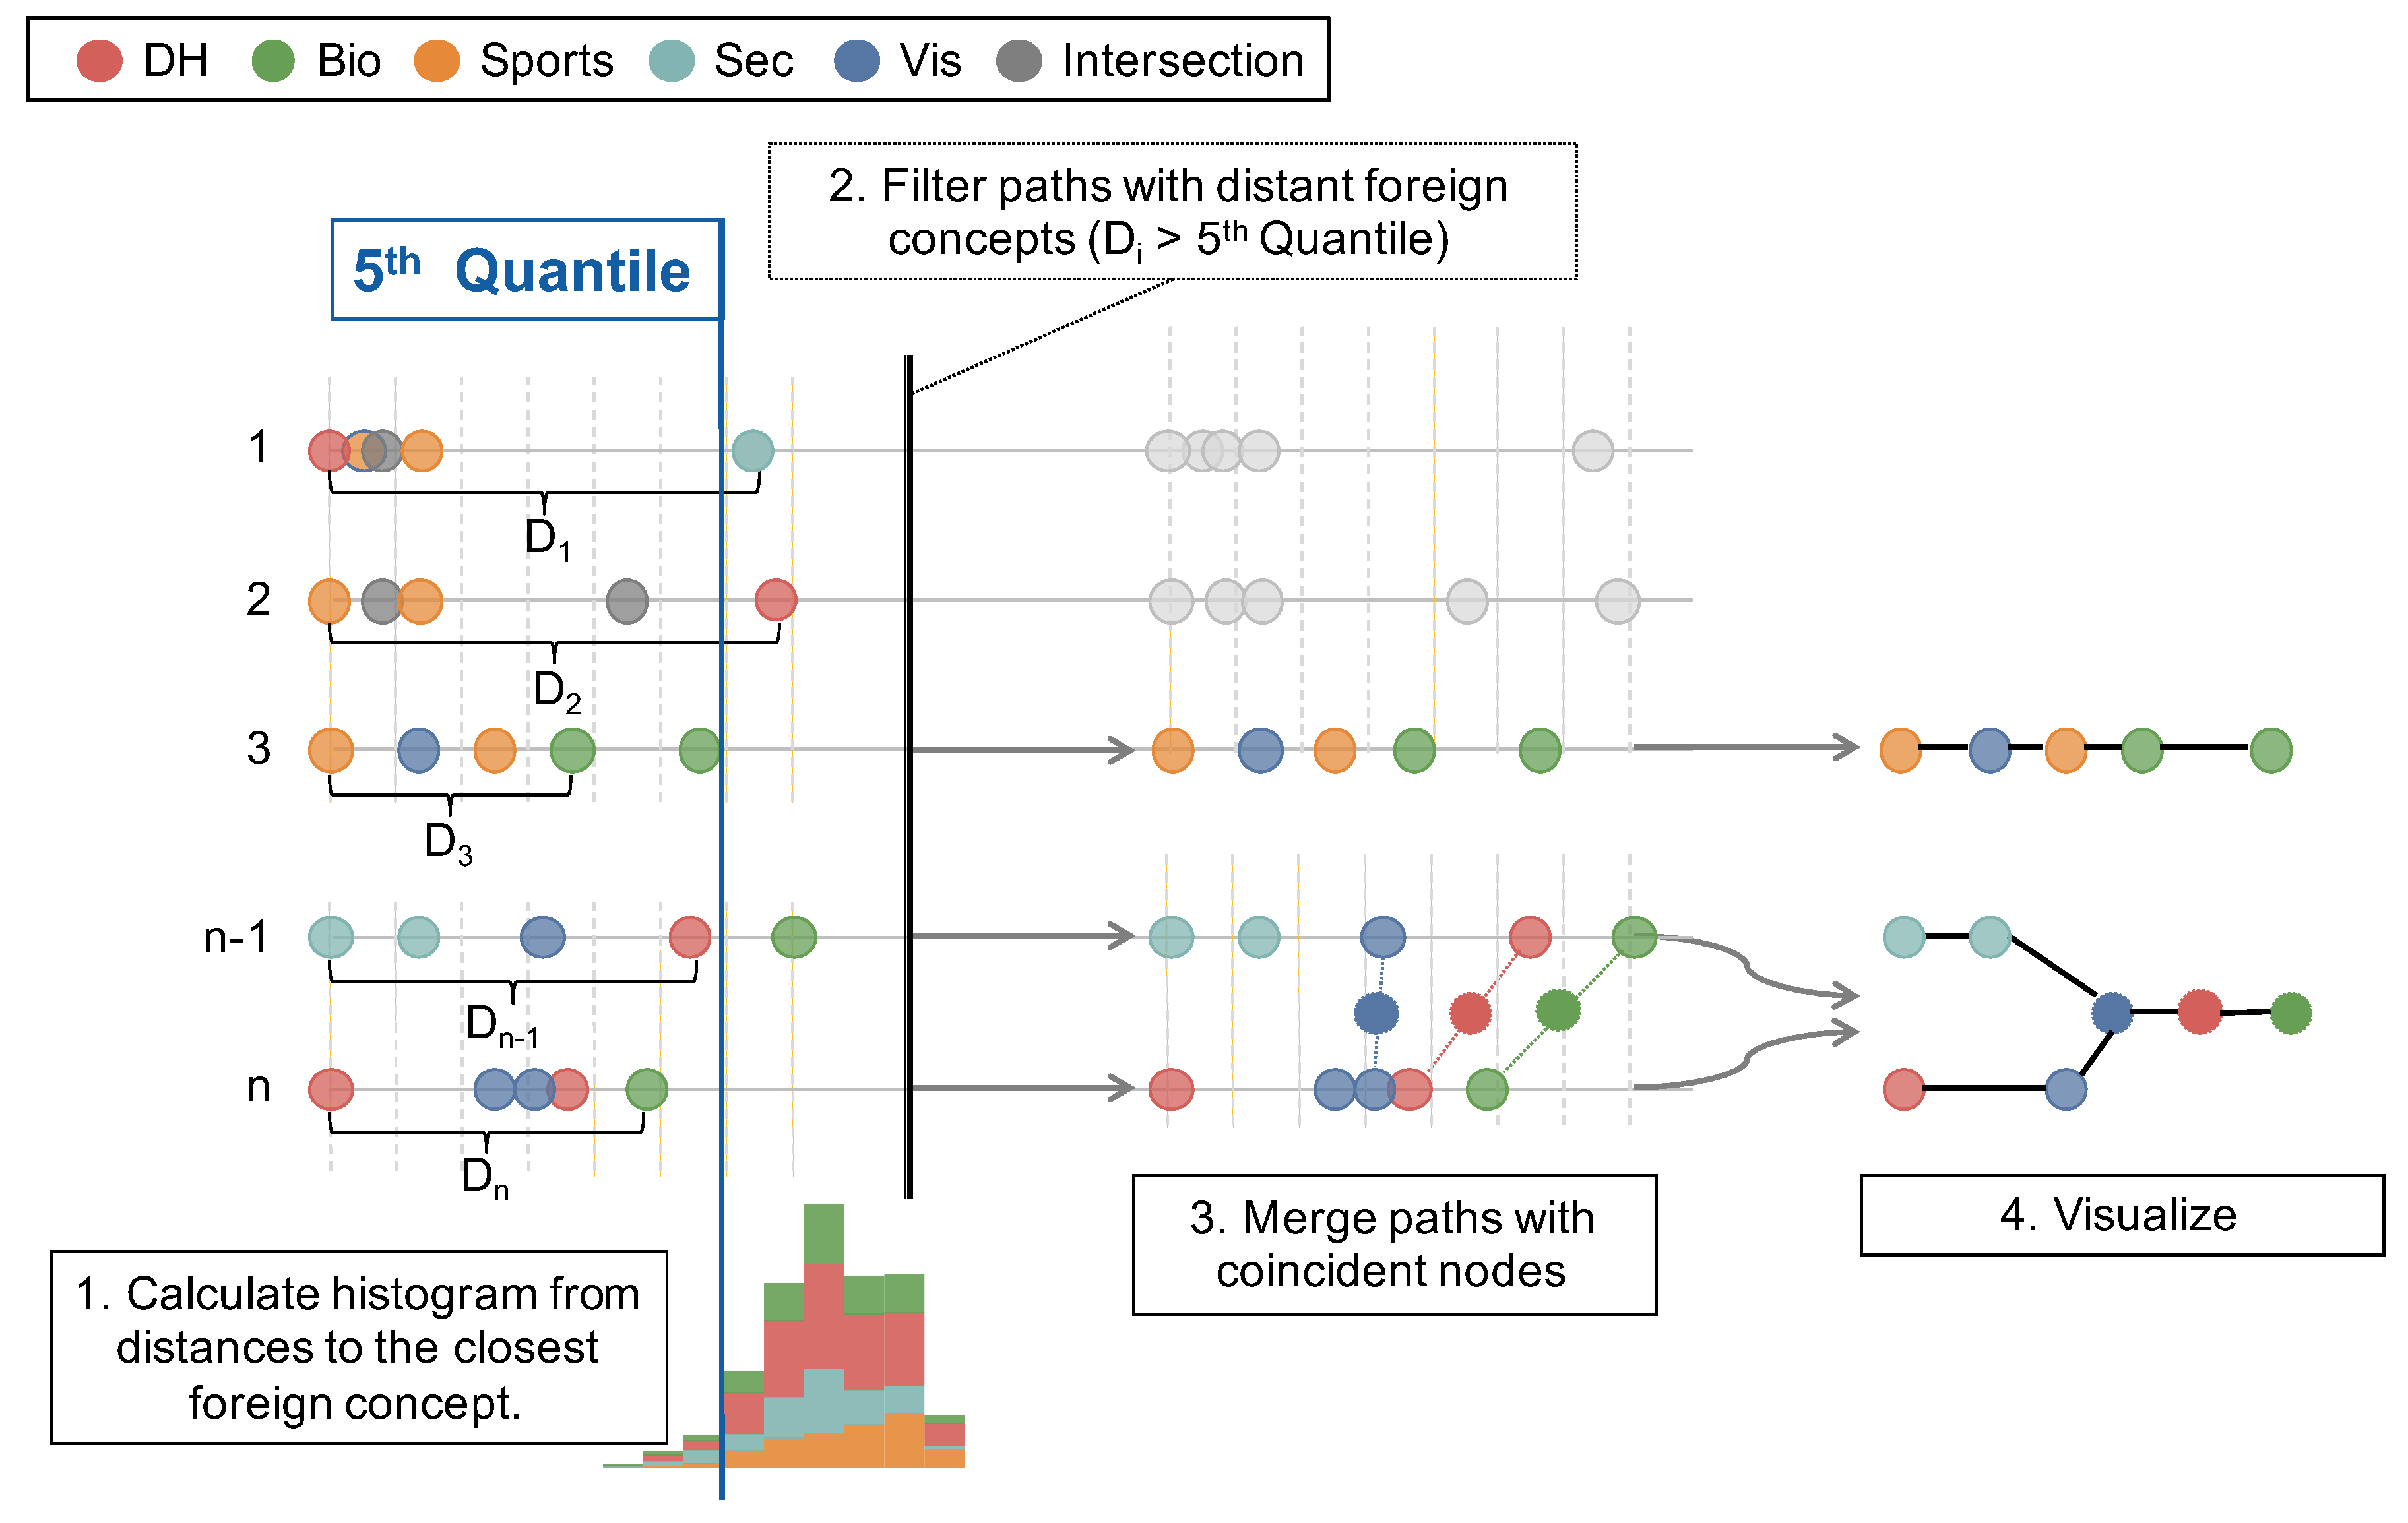
To filter out paths and terms presenting long distances to other terms, we purposely selected a highly restrictive cut-off value (5th percentile, ) to focus the visualization on representative connections only. Given that, we assessed that (1) the distribution of distances was similar in the four collections, and (2) the size of each collection did not influence these found distances; this cut-off would obtain a sample of high inter-collection similarities in which all the collections would be evenly represented according to their original sizes. The whole process to select these similarities is shown in Figure 8. After merging paths with coincident nodes, we continued to the next stage in which we employed our tool GlassViz to visualize the terms captured in the shortest paths and related documents.
5. Visualization
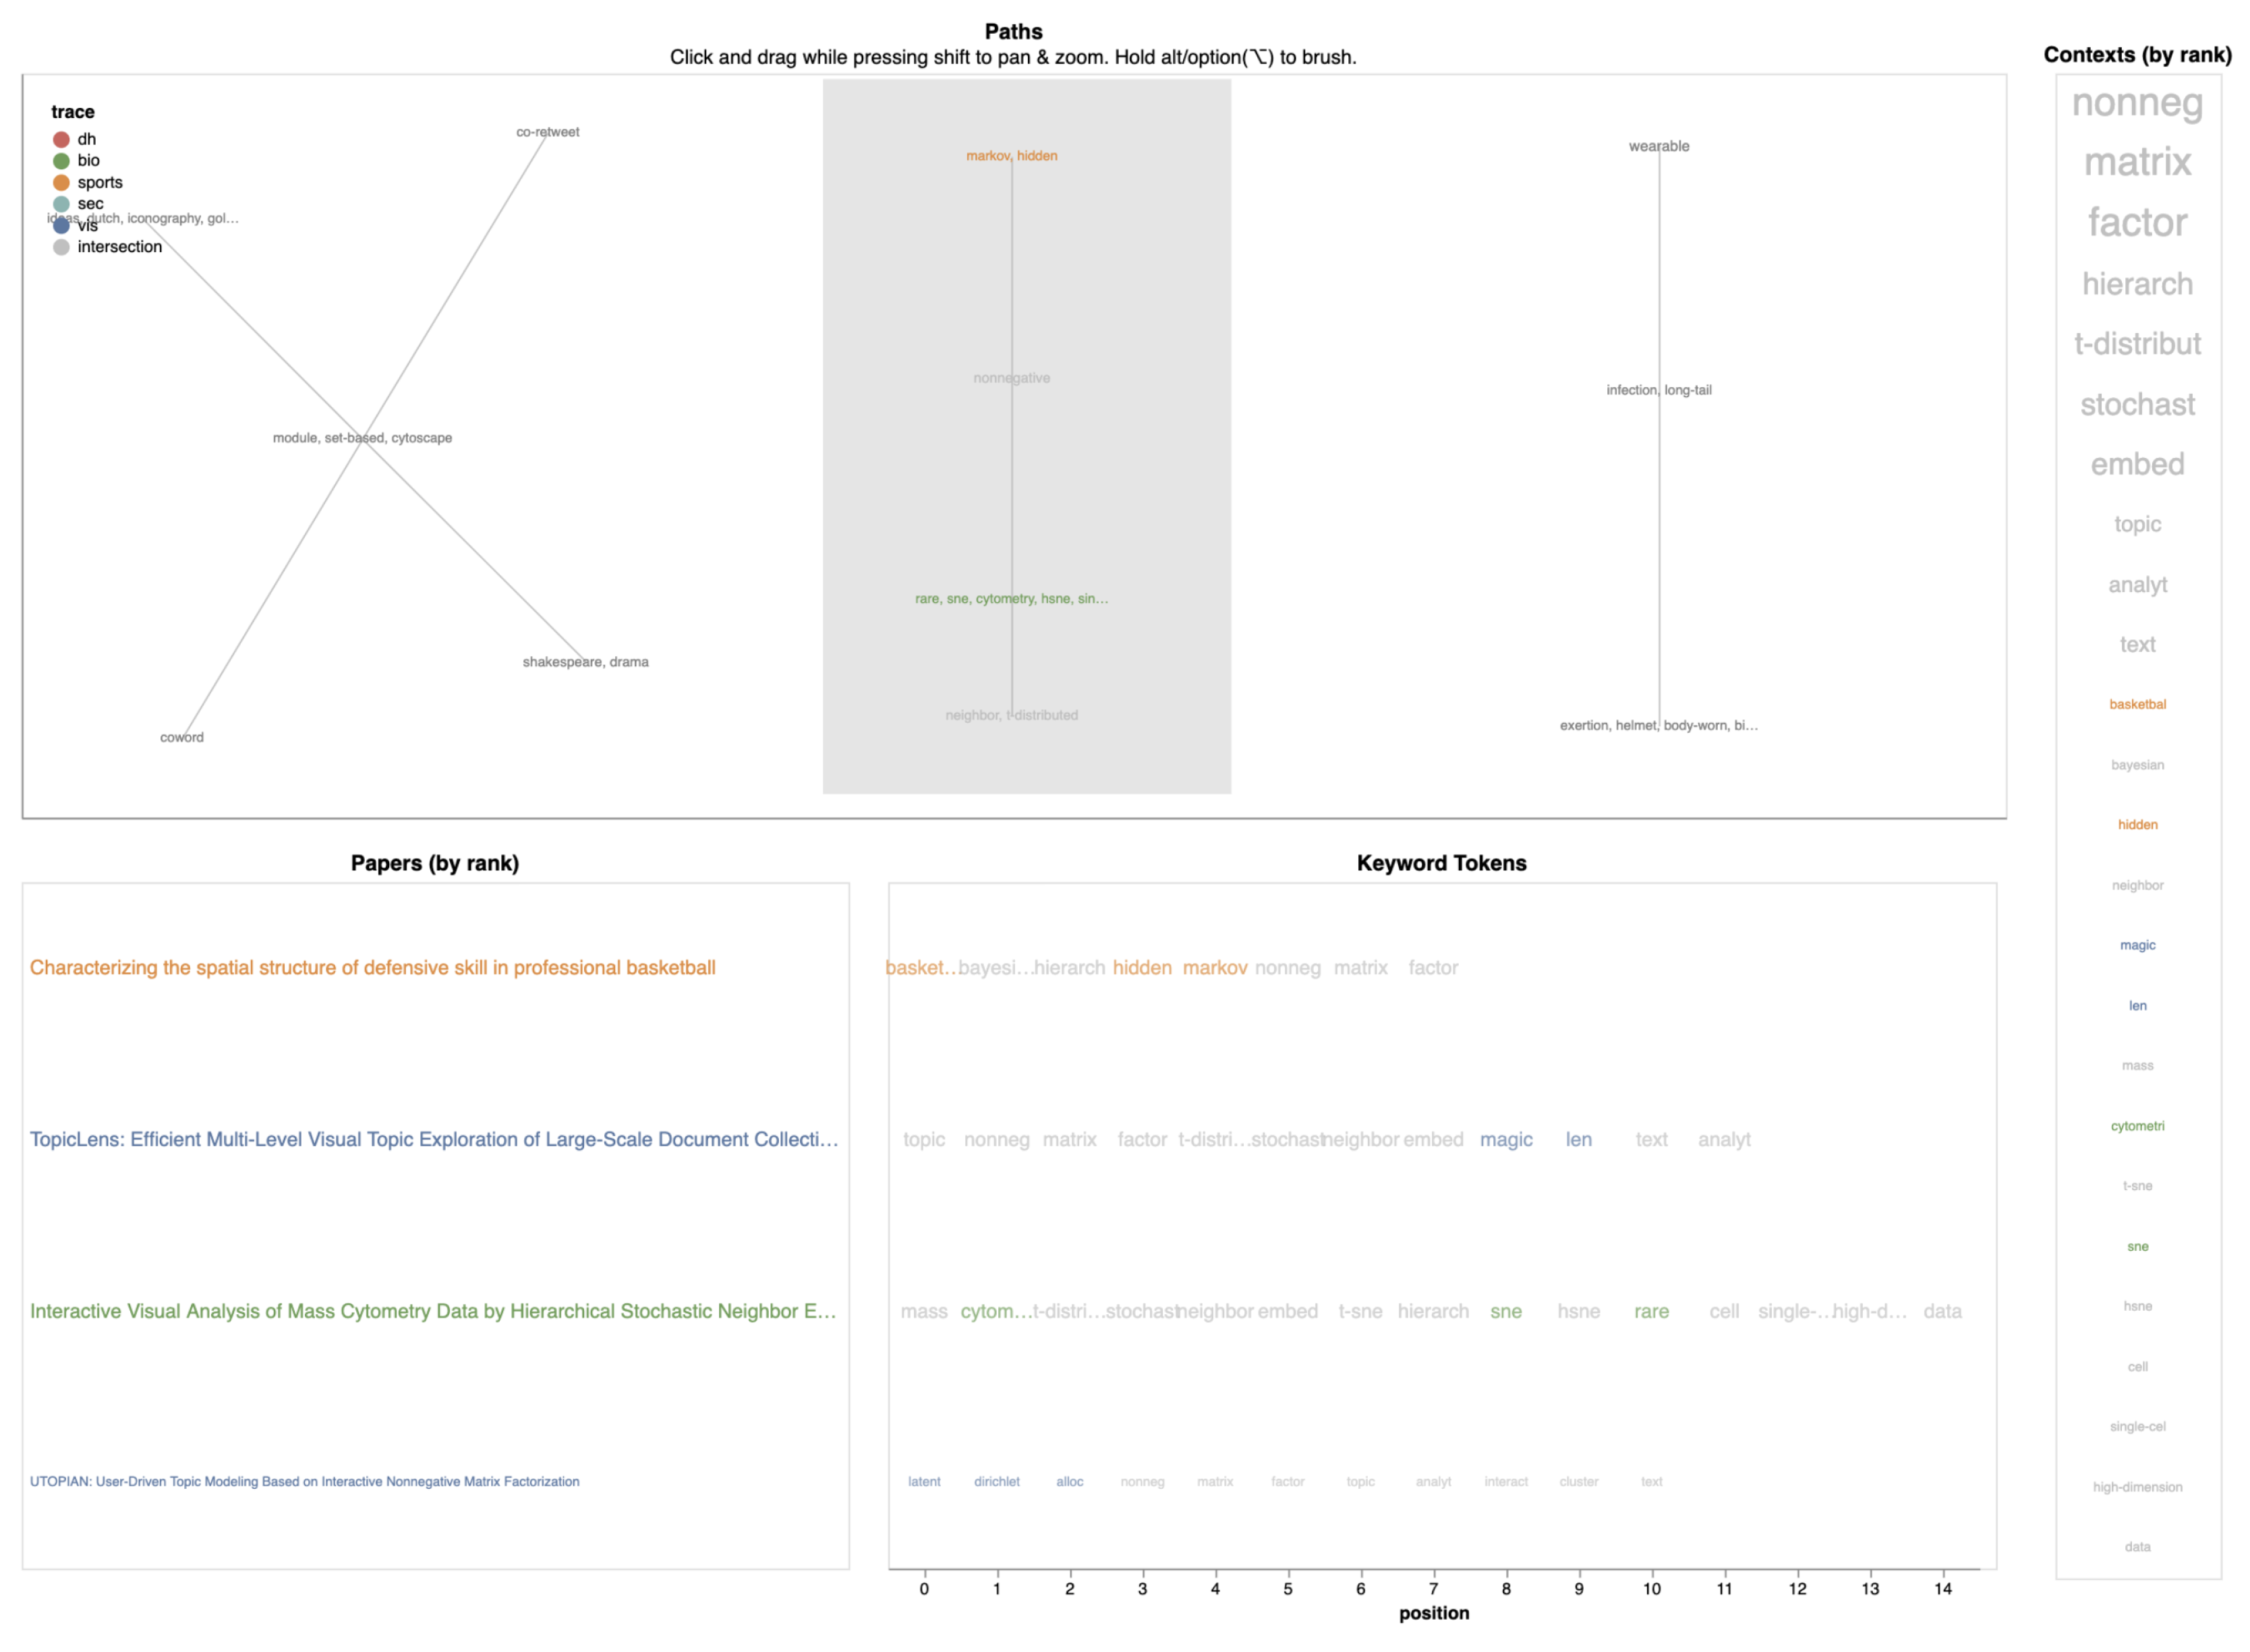
After filtering, we obtained 29 paths originating at the VIS4DH, BioVis, SportsVis, and VizSec collections, respectively. After merging paths with coincident tokens, we could identify 50 unique tokens distributed across 16 different components. Using the document-term matrix constructed in Section 4.2, these terms could be mapped to 64 different papers (21 VIS4DH, 10 BioVis, 11 SportsVis, 14 VizSec, and eight VIS). The 16 components were plotted in GlassViz’s main view using a node-link graph representation and a force-directed layout algorithm [39] in which the edges capture pairwise similarity (note that ) and nodes are tokens in the identified paths (label size is log-scaled to the absolute frequency of the token in the combination of the five corpora). The captured data were plotted in the GlassViz interface, which we modified to show paths and related documents detected by our method (shown in Figure 9).
The components were plotted on a designated area of View A, showing labels colored as per the categorical scheme employed throughout this paper, depending on the collection they can be found on (VIS4DH: red; BioVis: green; SportsVis: orange; VizSec: teal). Besides, whenever a token was found in multiple collections, it was colored in gray. Views B, C, and D are rank-frequency lists that show documents and keyword tokens that can be traced to the items selected in view A (in the image, the default selection, all, is applied). Specifically, view B lists documents according to the number of matching tokens with the current selection, meaning that documents that are more relevant to the user’s current selection are shown at the top. View C displays keyword tokens for each document in view B in the same order as they were originally processed. Finally, view D provides a visual aggregation of the tokens in C, in which higher-ranked tokens are shown in larger font sizes and are placed closer to the top of the list.
As we have mentioned, the 16 components of Figure 9 represent different inter-domain associations that can be explored with the aid of GlassViz. Although in some cases, such as in components #2 or #3, the main underlying themes can be partially guessed by reading the labels in the graphs, GlassViz offers the user the possibility to zoom and brush each component separately to get specific details about a component in the other three auxiliary views. For example, the relation between “sonic” and “histone/hebbian” in component #12 is certainly not obvious and hard to interpret directly. However, if the user brushes this component, the relationship is immediately revealed in view D which, in this case, is “signatures” because the two terms can be mapped to papers in the BioVis and VIS4DH collections that mention it. A compilation of documents, keywords, and contexts for each of the 16 components, as shown in GlassViz, is provided in Table S2 of Supplemental Materials.
6. Use Cases
In this section, we exemplify the advantages of our method in two use cases in which we explore interesting associations of terms and documents. Concretely, we selected those cases in which more documents from distinct collections were captured, namely, components 2 and 4.
6.1. Case Study #1: Games and Virtual Reality
Component #2 links together six different terms appearing in distinct collections (“office”, “pool”, and “narration” in SportsVis; “flag” and “trainee” in VizSec; purpose/serious in “BioVis”; and “spectating” in VIS) which are linked through the term “game/games/gaming” that appears in all listed documents and it is central to the theme, as it can be observed by its position at the top of view D in Figure 10.
Further reading of the tokens in view D helps identify other sub-themes that can be found among the documents, the first one being “comput.” for “computational biology” or “computer” for “computer vision” or “computer game”. In relation to this stem, there are four documents included in the list: the first two refer to games applied in the context of “computational biology” (documents 1.3 and 1.11, from collections BioViS and VIS, respectively), whereas the other two documents are associated to computers, as in “computer vision,” and “computer game.” (documents 1.4 and 1.10, both found in the SportsVis collection). Finally, another important sub-theme can also be identified, formed by the tokens “augment” and “realiti”. If we inspect documents containing these terms, we find document 1.4 again, and also 1.8, this last one pertaining to the VIS4DH collection. The papers describe two research experiences with augmented reality that are highly related as found by our model: the first one was built to assist novices in the game of pool, whereas the second one describes different pedagogical experiences in the humanities domain, forming a potentially interesting pair for knowledge transfer.
6.2. Case Study #2: Topic Models and Interaction Techniques
The next example is derived from examining component #4, and comprises fewer elements (only four in this case) which form a smaller and more concise theme than in the previous case. Again, the general composition of the theme is revealed in view D (Figure 11), whose top items refer to different topic modeling (e.g., “non-negative matrix factorization” and “latent dirichlet allocation”) and dimensionality reduction techniques (“t-SNE” and “h-SNE”) often employed in visualization approaches conceived to support classification tasks.
The inspection of the documents captured under this component shows four documents pertaining to three different collections (SportsVis, document 4.1; BioVis, document 4.3; and VIS, documents 4.2 and 4.4) that are centered around the aforementioned main concepts. Using the graph representation of the component, more information can be decoded: for example, it can be seen that the domain-specific keywords shown in green (“rare”, “sne”, and “cytometry”) are placed closer to the terms “neighbor” and “t-distributed” in the lower part of the chart. This effect can be understood by manually inspecting the documents and keywords in views B and C: there, it can be seen that the authors of paper 4.3 employ a variation of t-sne, h-sne, to visualize mass cytometry data. Relatedly, the authors of paper 4.2 propose an interaction technique based on t-sne and the magic lens metaphor [40] to inspect topic models in textual data. These authors also employ the topic modeling technique “non-negative matrix factorization” to conduct their study, which is in turn used by the authors in publications 4.4 and 4.1 and serves as the connecting theme of the component.
7. Future Work
In previous sections, we have presented a proposal for automatically detecting shared interests between different communities of practice in PDVR. The results presented in Section 4.1, Section 5, and Section 6 show that keywords carry great implicit knowledge by the authors that deserves being studied and analyzed in full. Although we are aware that the study of the language of keywords has many beneficial implications in science, in this paper we have seen how it can be used to determine important points of confluence between a priori unrelated groups of researchers, which represents an advancement towards addressing the critical problem of knowledge fragmentation in modern science. Not only knowing the number, but also understanding the manner in which the fundamental semantic components of keywords are combined, may open up novel ways to obtain holistic panoramas of science that may help overcome some of science’s current difficulties. In this contribution, we proposed a model and a VTA tool to capture and explore rare conceptual associations between research areas that would be hard to find for a human actor. Although we consider the work presented in this paper to be still ongoing, and despite the development of GlassViz still is in its early stages, in light of the results, we are positive about the results and aim to keep improving the system in future research to cover more datasets and support more complex use cases. In this regard, we aim to improve GlassViz’s interactivity, which at the moment is rather limited. For example, it is currently not possible to obtain information on how the different components in view A are related to each other, and also how they relate to other parts in the different collection. To address this issue, we are currently conducting experiments on our data employing a novel dimensionality reduction technique, uniform manifold approximation and projection (UMAP) [41], that is showing very promising results. This would allow us to obtain a joint projection of documents and keywords, which should be preferred to our linked views approach due to its reduced cognitive load. In addition, a combination of UMAP with hierarchical density-based clustering (HDBSCAN) [42] could offer an automatic way to cluster connected components into larger thematic areas, an addition that would yield great opportunities for implementing direct manipulation interaction techniques [43]. This would in turn allow us to receive fine-grained information from the user to, for example, denormalize certain terms that were linked together by the stemming algorithm and that the user may want to split. These cases are usually hard to detect by automatic means, as they much depend on the user’s own aims of the exploration. By adopting direct manipulation principles, the user could drive the execution of the algorithm at each step to obtain personalized results seamlessly.
8. Summary
In this paper, we have presented a study on keywords to identify thematic similarities and potential methodology transfers between different areas of PDVR. Our approach was supported by the collection and composition of four different datasets that represented keyword associations made by authors of research papers in diverse interdisciplinary visualization research areas. In addition, we proved that there is evidence to support the hypothesis that text-based, automatic methods to accomplish the aim of connecting communities of practice within a body of research may be proposed. Beyond that, we believe our approach could be further extended to other areas experiencing the same fragmentation. In this regard, we desire that our work serves to inspire future researchers to build more complex VTA tools that address this issue of modern science.
Supplementary Materials
The following are available online at https://0-www-mdpi-com.brum.beds.ac.uk/2076-3417/10/20/7248/s1, Table S1: Keyword intersections, Table S2: Components, Dataset D1: publications datasets with keywords.
Author Contributions
Conceptualization, A.B.-S.; formal analysis, A.B.-S.; investigation, A.B.-S.; writing—original draft preparation, A.B.-S.; writing—review and editing, A.B.-S. and R.T.S.; supervision, R.T.S.; project administration, R.T.S.; funding acquisition, R.T.S. All authors have read and agreed to the published version of the manuscript.
Funding
This work has received funding within the CHIST-ERA programme under the following national grant agreement PCIN-2017-064 (MINECO Spain).
Conflicts of Interest
The authors declare no conflict of interest.
Abbreviations
The following abbreviations are used in this manuscript.
| PDVR | Problem-Driven Visualization Research |
| LBD | Literature-Based Discovery |
| MT | Methodology Transfer |
| MTM | Methodology Transfer Model |
| VTA | Visual Text Analytics |
| DH | Digital Humanities |
References
- Simon, S.; Mittelstädt, S.; Keim, D.A.; Sedlmair, M. Bridging the Gap of Domain and Visualization Experts with a Liaison. In Proceedings of the Eurographics Conference on Visualization (EuroVis); The Eurographics Association: Cagliari, Italy, 2015; Volume 2015. [Google Scholar]
- Brehmer, M.; Munzner, T. A Multi-Level Typology of Abstract Visualization Tasks. IEEE Trans. Vis. Comput. Graph. 2013, 19, 2376–2385. [Google Scholar] [CrossRef] [PubMed] [Green Version]
- Miller, M.; Schäfer, H.; Kraus, M.; Leman, M.; Keim, D.A.; El-Assady, M. Framing Visual Musicology through Methodology Transfer. In Proceedings of the 4th Workshop on Visualization for the Digital Humanities (VIS4DH), Vancouver, BC, Canada, 20 October 2019. [Google Scholar]
- Burkhard, R. Learning from Architects: The Difference between Knowledge Visualization and Information Visualization. In Proceedings of the Eighth International Conference on Information Visualisation, London, UK, 16 July 2004; pp. 519–524. [Google Scholar] [CrossRef]
- Benito-Santos, A.; Therón, R. GlassViz: Visualizing Automatically-Extracted Entry Points for Exploring Scientific Corpora in Problem-Driven Visualization Research. 2020 IEEE Visualization Conference (VIS), 2020, p. To appear in IEEE VIS 2020 Conference Proceedings. Available online: https://arxiv.org/abs/2009.02094 (accessed on 16 October 2020).
- Satyanarayan, A.; Moritz, D.; Wongsuphasawat, K.; Heer, J. Vega-Lite: A Grammar of Interactive Graphics. IEEE Trans. Vis. Comput. Graph. 2017, 23, 341–350. [Google Scholar] [CrossRef] [Green Version]
- VanderPlas, J.; Granger, B.; Heer, J.; Moritz, D.; Wongsuphasawat, K.; Lees, E.; Timofeev, I.; Welsh, B.; Sievert, S. Altair: Interactive Statistical Visualizations for Python. J. Open Source Softw. 2018, 3, 1057. [Google Scholar] [CrossRef]
- Benito-Santos, A.; Therón Sánchez, R. Cross-Domain Visual Exploration of Academic Corpora via the Latent Meaning of User-Authored Keywords. IEEE Access 2019, 7, 98144–98160. [Google Scholar] [CrossRef]
- Benito-Santos, A.; Therón Sánchez, R. A Data-Driven Introduction to Authors, Readings and Techniques in Visualization for the Digital Humanities. IEEE Comput. Graph. Appl. 2020, 40, 45–57. [Google Scholar] [CrossRef]
- Isenberg, P.; Heimerl, F.; Koch, S.; Isenberg, T.; Xu, P.; Stolper, C.D.; Sedlmair, M.; Chen, J.; Möller, T.; Stasko, J. Vispubdata.Org: A Metadata Collection About IEEE Visualization (VIS) Publications. IEEE Trans. Vis. Comput. Graph. 2017, 23, 2199–2206. [Google Scholar] [CrossRef]
- Thomas, J.J.; Cook, K.A. A Visual Analytics Agenda. IEEE Comput. Graph. Appl. 2006, 26, 10–13. [Google Scholar] [CrossRef]
- Keim, D.A.; Mansmann, F.; Schneidewind, J.; Thomas, J.; Ziegler, H. Visual Analytics: Scope and Challenges. In Visual Data Mining: Theory, Techniques and Tools for Visual Analytics; Lecture Notes in Computer Science; Simoff, S.J., Böhlen, M.H., Mazeika, A., Eds.; Springer: Berlin/Heidelberg, Germany, 2008; pp. 76–90. [Google Scholar] [CrossRef] [Green Version]
- Berger, M.; McDonough, K.; Seversky, L.M. Cite2vec: Citation-Driven Document Exploration via Word Embeddings. IEEE Trans. Vis. Comput. Graph. 2017, 23, 691–700. [Google Scholar] [CrossRef]
- Fried, D.; Kobourov, S.G. Maps of Computer Science. In Proceedings of the 2014 IEEE Pacific Visualization Symposium, Yokohama, Japan, 4–7 March 2014; pp. 113–120. [Google Scholar] [CrossRef]
- Shahaf, D.; Guestrin, C.; Horvitz, E. Metro Maps of Science. In Proceedings of the 18th ACM SIGKDD International Conference on Knowledge Discovery and Data Mining; ACM: New York, NY, USA, 2012; pp. 1122–1130. [Google Scholar] [CrossRef]
- Török, Z.G.; Török, Á. Cognitive Data Visualization—A New Field with a Long History. In Cognitive Infocommunications, Theory and Applications; Topics in Intelligent Engineering and Informatics; Klempous, R., Nikodem, J., Baranyi, P.Z., Eds.; Springer International Publishing: Cham, Switzerland, 2019; pp. 49–77. [Google Scholar] [CrossRef]
- Shakhnov, V.; Zinchenko, L.; Makarchuk, V.; Verstov, V. Visual Analytics Support for the SOI VLSI Layout Design for Multiple Patterning Technology. In Proceedings of the 2015 6th IEEE International Conference on Cognitive Infocommunications (CogInfoCom), Gyor, Hungary, 19–21 October 2015; pp. 67–70. [Google Scholar] [CrossRef]
- Soós, S.; Vida, Z. Topic Overlay Maps and the Cognitive Structure of Policy-Related SSH. In Proceedings of the 2014 5th IEEE Conference on Cognitive Infocommunications (CogInfoCom), Vietri sul Mare, Italy, 5–7 November 2014; pp. 413–418. [Google Scholar] [CrossRef]
- Chen, C. Visualising Semantic Spaces and Author Co-Citation Networks in Digital Libraries. Inf. Process. Manag. 1999, 35, 401–420. [Google Scholar] [CrossRef] [Green Version]
- Chen, C.; Kuljis, J.; Paul, R.J. Visualizing Latent Domain Knowledge. IEEE Trans. Syst. Man Cybern. Part Appl. Rev. 2001, 31, 518–529. [Google Scholar] [CrossRef] [Green Version]
- Chen, T.T. The Development and Empirical Study of a Literature Review Aiding System. Scientometrics 2012, 92, 105–116. [Google Scholar] [CrossRef]
- Godwin, A. Visualizing Systematic Literature Reviews to Identify New Areas of Research. In Proceedings of the 2016 IEEE Frontiers in Education Conference (FIE), Erie, PA, USA, 12–15 October 2016; pp. 1–8. [Google Scholar] [CrossRef]
- Thilakaratne, M.; Falkner, K.; Atapattu, T. A Systematic Review on Literature-Based Discovery. Acm Comput. Surv. (CSUR) 2019, 5, e235. [Google Scholar] [CrossRef] [Green Version]
- Swanson, D.R. Fish Oil, Raynaud’s Syndrome, and Undiscovered Public Knowledge. Perspect. Biol. Med. 1986, 30, 7–18. [Google Scholar] [CrossRef] [PubMed]
- Mikolov, T.; Sutskever, I.; Chen, K.; Corrado, G.S.; Dean, J. Distributed Representations of Words and Phrases and Their Compositionality. In Advances in Neural Information Processing Systems 26; Burges, C.J.C., Bottou, L., Welling, M., Ghahramani, Z., Weinberger, K.Q., Eds.; Curran Associates, Inc.: Red Hook, NY, USA, 2013; pp. 3111–3119. [Google Scholar]
- Thilakaratne, M.; Falkner, K.; Atapattu, T. Automatic Detection of Cross-Disciplinary Knowledge Associations. In Proceedings of the ACL Student Research Workshop; Association for Computational Linguistics: Stroudsburg, PA, USA, 2018; pp. 45–51. [Google Scholar]
- Deerwester, S.; Dumais, S.T.; Furnas, G.W.; Landauer, T.K.; Harshman, R. Indexing by Latent Semantic Analysis. J. Am. Soc. Inf. Sci. 1990, 41, 391–407. [Google Scholar] [CrossRef]
- Levy, O.; Goldberg, Y. Neural Word Embedding as Implicit Matrix Factorization. In Advances in Neural Information Processing Systems 27; Ghahramani, Z., Welling, M., Cortes, C., Lawrence, N.D., Weinberger, K.Q., Eds.; Curran Associates, Inc.: Red Hook, NY, USA, 2014; pp. 2177–2185. [Google Scholar]
- Levy, O.; Goldberg, Y.; Dagan, I. Improving Distributional Similarity with Lessons Learned from Word Embeddings. Trans. Assoc. Comput. Linguist. 2015, 3, 211–225. [Google Scholar] [CrossRef]
- Heimerl, F.; Han, Q.; Koch, S.; Ertl, T. CiteRivers: Visual Analytics of Citation Patterns. IEEE Trans. Vis. Comput. Graph. 2016, 22, 190–199. [Google Scholar] [CrossRef]
- Günther, F.; Dudschig, C.; Kaup, B. Latent Semantic Analysis Cosines As a Cognitive Similarity Measure: Evidence from Priming Studies. Q. J. Exp. Psychol. 2016, 69, 626–653. [Google Scholar] [CrossRef]
- Eppler, M.J. Visuelle Kommunikation—Der Einsatz von graphischen Metaphern zur Optimierung des Wissenstransfers. In Wissenskommunikation in Organisationen: Methoden · Instrumente · Theorien; Reinhardt, R., Eppler, M.J., Eds.; Springer: Berlin/Heidelberg, Germany, 2004; pp. 13–31. [Google Scholar] [CrossRef]
- Burkhard, R.A. Strategy Visualization: A New Research Focus in Knowledge Visualization and a Case Study. Proc. Know 2005, 5, 1–8. [Google Scholar]
- Elouni, J.; Ltifi, H.; Ayed, M.B. Knowledge Visualization Model for Intelligent Dynamic Decision-Making. Hybrid Intelligent Systems; Advances in Intelligent Systems and Computing; Abraham, A., Han, S.Y., Al-Sharhan, S.A., Liu, H., Eds.; Springer International Publishing: Cham, Swizterland, 2016; pp. 223–235. [Google Scholar] [CrossRef]
- Fadiran, O.A.; van Biljon, J.; Schoeman, M.A. How Can Visualisation Principles Be Used to Support Knowledge Transfer in Teaching and Learning? In Proceedings of the 2018 Conference on Information Communications Technology and Society (ICTAS), Durban, South Africa, 8–9 March 2018; pp. 1–6. [Google Scholar] [CrossRef] [Green Version]
- Perin, C.; Vuillemot, R.; Stolper, C.D.; Stasko, J.T.; Wood, J.; Carpendale, S. State of the Art of Sports Data Visualization. Comput. Graph. Forum 2018, 37, 663–686. [Google Scholar] [CrossRef] [Green Version]
- Liu, S.; Wang, X.; Collins, C.; Dou, W.; Ouyang, F.; El-Assady, M.; Jiang, L.; Keim, D. Bridging Text Visualization and Mining: A Task-Driven Survey. IEEE Trans. Vis. Comput. Graph. 2018, 25, 2482–2504. [Google Scholar] [CrossRef] [PubMed] [Green Version]
- Aggarwal, C.C. Machine Learning for Text; Springer International Publishing: Cham, Switzerland, 2018. [Google Scholar] [CrossRef]
- Fruchterman, T.M.J.; Reingold, E.M. Graph Drawing by Force-Directed Placement. Softw. Pract. Exp. 1991, 21, 1129–1164. [Google Scholar] [CrossRef]
- Bier, E.A.; Stone, M.C.; Pier, K.; Buxton, W.; DeRose, T.D. Toolglass and Magic Lenses: The See-through Interface. In Proceedings of the 20th Annual Conference on Computer Graphics and Interactive Techniques; Association for Computing Machinery: New York, NY, USA, 1993; pp. 73–80. [Google Scholar] [CrossRef]
- McInnes, L.; Healy, J.; Saul, N.; Grossberger, L. UMAP: Uniform Manifold Approximation and Projection. J. Open Source Softw. 2018, 3, 861. [Google Scholar] [CrossRef]
- McInnes, L.; Healy, J.; Astels, S. Hdbscan: Hierarchical Density Based Clustering. J. Open Source Softw. 2017, 2, 205. [Google Scholar] [CrossRef]
- El-Assady, M.; Kehlbeck, R.; Collins, C.; Keim, D.; Deussen, O. Semantic Concept Spaces: Guided Topic Model Refinement Using Word-Embedding Projections. IEEE Trans. Vis. Comput. Graph. 2020, 26, 1001–1011. [Google Scholar] [CrossRef] [Green Version]
Figure 1.
Document exploration model for four different interdisciplinary visualization researchers in the humanities (red), bioinformatics (green), sports science (orange), and security (teal) domains accessing a large collection of research papers containing unknown, potentially interesting techniques (right, in blue) that could be applied to solve their domain-specific problems (e.g., characters, biochemical reaction). Each problem is typically related to the same intermediate concepts (shown at the center), which are the users’ entry points to the collection. This idea is employed in our study to detect similarities between the different communities of practice and bring them together.

Figure 2.
Swanson’s LBD ABC Model in its open (left) and closed (right) discovery modes (figure from our previous work [8]). The model relates concepts found in two disjoints bodies of scientific literature by identifying connecting b-concepts found in both collections. In the open discovery mode, an initial, user-provided term is used to find related c-concepts. This mode is purely exploratory, and it is typically employed in the task of hypothesis generation. Differently, in the closed discovery mode, the user provides an a-concept and a c-concept to detect intermediate related b-concepts, generally to validate hypotheses. Our approach employs both modes to explore inter-domain affinities between elements in different bodies of literature.

Figure 3.
Co-occurrence network between a problem found in literature A and two potentially interesting techniques found in literature B. High-order co-occurrence of terms found in the two literatures can be measured to obtain evidence that supports technique 2 as a better option for solving the problem at hand, according to the ABC model.

Figure 4.
Diagram depicting the generation of distributional embeddings from keywords found in research papers. (1) Term-document matrix containing documents in the source (S-) and target (T-) literatures. (2) Keywords are tokenized and stemmed, (3) effectively reducing the number of columns in the term-document matrix. (4) An SPPMI matrix is built from annotating co-occurring keyword tokens in the corpus. (5) Rows in the resulting square matrix are sorted according to each token’s provenance. Finally, the matrix is decomposed into the product of three matrices employing singular value decomposition (SVD). Vectors representing each keyword token are obtained from the left singular vectors of the factorization, U (6). Finally, we derive a distance matrix D employing a cosine metric (7) and that we use to extract inter-domain similarities.

Figure 5.
Venn Diagram (generated with the online tool at http://bioinformatics.psb.ugent.be/webtools/Venn/) displaying intersections between the five datasets that were employed in our study. The specific keyword sets found on each intersection can be consulted in Table S1 of Supplemental Materials.

Figure 6.
Diagrams showing possible interactions between intersection sizes between two collections (top) or two collections and the VIS collection (bottom) and average path distance between elements in those collections.
Figure 6.
Diagrams showing possible interactions between intersection sizes between two collections (top) or two collections and the VIS collection (bottom) and average path distance between elements in those collections.

Figure 7.
Left: histogram showing the distribution of distances for the found 563 shortest paths connecting domain-specific terms (notice that values on the Y-axis are doubled given that ). The blue line shows the 5th percentile (), which was later used as a cut-off value for filtering out longer, and thus less interesting paths that were not visualized in the last stage of the study (see Figure 8). To the right, the same data are disaggregated into four charts, showing similar distance distributions for paths originating at the four collections.

Figure 8.
Chart depicting the process to compose inter-domain paths. The method relies on calculating a histogram of distances to find a cut-off value used to remove long paths from the final visualization.
Figure 8.
Chart depicting the process to compose inter-domain paths. The method relies on calculating a histogram of distances to find a cut-off value used to remove long paths from the final visualization.

Figure 9.
Screen capture of GlassViz showing the 16 components (view A) extracted in the previous stage Section 4.4 and related documents (view B), along with their keyword tokens (view C) and co-occurring terms with nodes on each component (contexts, view D). We encourage readers to download the high-resolution images companion to this paper which can be zoomed and explored to get a better understanding of how GlassViz works.

Figure 10.
Close view of component #2 in GlassViz’s main view. We encourage readers to download the high-resolution images companion to this paper which can be zoomed and explored to get a better understanding of how GlassViz works.
Figure 10.
Close view of component #2 in GlassViz’s main view. We encourage readers to download the high-resolution images companion to this paper which can be zoomed and explored to get a better understanding of how GlassViz works.

Figure 11.
Close view of component #4 in GlassViz’s main view. We encourage readers to download the high-resolution images companion to this paper which can be zoomed and explored to get a better understanding of how GlassViz works.
Figure 11.
Close view of component #4 in GlassViz’s main view. We encourage readers to download the high-resolution images companion to this paper which can be zoomed and explored to get a better understanding of how GlassViz works.


Table 1.
Number of documents and keyword tokens per collection after processing. Among the four domain-specific collections, VIS4DH held the largest number of unique tokens (different tokens in a collection) and also had the highest ratio of exclusive (not found in any other collection) vs. unique tokens. In total, 659 different tokens could be found in two or more collections.
| Dataset | # Documents | # Unique Tokens | Avg. Keyword Tokens per Doc. | # Exclusive Tokens |
|---|---|---|---|---|
| VIS4DH | 221 | 539 | 230 (42.7%) | |
| BioVis | 69 | 284 | 72 (25.4%) | |
| SportsVis | 59 | 225 | 55 (24.4%) | |
| VizSec | 175 | 405 | 125 (30.9%) | |
| VIS | 2253 | 2508 | 1864 (74.3%) |
Publisher’s Note: MDPI stays neutral with regard to jurisdictional claims in published maps and institutional affiliations. |
© 2020 by the authors. Licensee MDPI, Basel, Switzerland. This article is an open access article distributed under the terms and conditions of the Creative Commons Attribution (CC BY) license (http://creativecommons.org/licenses/by/4.0/).
Share and Cite
MDPI and ACS Style
Benito-Santos, A.; Therón Sánchez, R. Defragmenting Research Areas with Knowledge Visualization and Visual Text Analytics. Appl. Sci. 2020, 10, 7248. https://0-doi-org.brum.beds.ac.uk/10.3390/app10207248
AMA Style
Benito-Santos A, Therón Sánchez R. Defragmenting Research Areas with Knowledge Visualization and Visual Text Analytics. Applied Sciences. 2020; 10(20):7248. https://0-doi-org.brum.beds.ac.uk/10.3390/app10207248
Chicago/Turabian StyleBenito-Santos, Alejandro, and Roberto Therón Sánchez. 2020. "Defragmenting Research Areas with Knowledge Visualization and Visual Text Analytics" Applied Sciences 10, no. 20: 7248. https://0-doi-org.brum.beds.ac.uk/10.3390/app10207248
Note that from the first issue of 2016, this journal uses article numbers instead of page numbers. See further details here.