1. Introduction
Significant loss of life and property after each earthquake brings the importance of the works in this field and the precautions to be taken. Determining the seismic risk of a region encountered as an inseparable part of pre-earthquake disaster management is among the preventions that can be performed. The destructive power of seismic events reveals some weaknesses in urban environments [
1,
2,
3,
4,
5]. The amount of the damage increases generally due to the characteristics of the earthquake, soil, and structures.
The importance of earthquake–soil–structure interaction becomes evident when the damages caused by past earthquakes are considered. Building design and evaluation become more meaningful by determining the relationship between these three parameters. The recent earthquake and building regulations reached a very advanced point in this regard. Thus, earthquake-resistant building rules may be renewed or updated. The 2018-Turkish Earthquake Building Code (TBEC-2018) [
6] is the best example for this instance.
The first regulation about disasters based on edict was issued by Bayezid II after the earthquake that caused approximately 13.000 deaths in Istanbul on 14.09.1509 [
7]. However, the first regulation was prepared after the 26 December 1939 earthquake that occurred in Erzincan and caused significant destruction [
8]. It was first published in the 1940 as “Italian Building Instruction for Construction in Earthquake Region” [
9]. In parallel with the development of technology, to minimize the earthquake-led losses, the rules of construction to be followed in building construction have been tried to be created, and these rules have been imposed as standards and regulations. This code has been continuously updated, taking into account the developments in engineering technologies and significant losses in earthquakes. Ten seismic design codes came into force in 1940, 1944, 1949, 1953, 1962, 1968, 1975, 1998, 2007, and 2018. The first four regulations contain only the rules about earthquakes. The 1962–1998 regulations include rules on all types of disasters such as flood, fire, and earthquake. The need for renewal of the code in 1998 emerged, after the major losses in 1999 Gölcük (Mw = 7.4) and Düzce (Mw = 7.2) earthquakes. Only earthquake-related rules were included with the code in 2007 for the first time [
10]. Lastly, the loss of life and property in the 2011 Van earthquakes (Mw = 7.2 and Mw = 5.6) revealed the need to update the latest regulation. The latest seismic code was updated in 2018 and has been put into force since January 2019. It is called the Turkey Building Earthquake Code (TBEC-2018).
The seismic hazard must be known correctly to determine the earthquake behavior of engineering structures and to reduce earthquake damage. In Turkey, seismic hazard maps have been produced so far due to the devastating earthquakes that caused significant life and property losses. These maps clearly provide significant data for engineers to obtain the possible risk level and determine the reliable design of structures affected by earthquakes. Turkey’s first seismic hazard map was produced in 1945 and has been updated many times to date [
11]. The previous earthquake hazard map was prepared based on the 475-year Peak Ground Acceleration (PGA) values and suggested acceleration ranges by Gülkan et al. 1993 [
12]. The earthquake hazard was divided into five different seismic zones in this map, gradated from 1 to 5. The same effective ground acceleration coefficient was proposed for each zone. Effective ground acceleration coefficient takes values of 0.4, 0.3, 0.2, and 0.1 for 1st, 2nd, 3rd, and 4th degree seismic zones, respectively [
13]. This map came into force in 1996 and is known as the Turkey Earthquake Zone Map. All calculations related to the earthquake were performed on a regional basis in the previous code. The map using the probability method, which has an important place in terms of being the first prepared map, was used until 2019. However, with the development of methods related to seismic hazard calculations, the way of handling the uncertainties in ground motion, and seismic source modeling, it has become inevitable to update this map [
11,
14,
15]. With this obligation, different working groups have been established within the scope of the research programs carried out by the Disaster and Emergency Management Presidency. Seismic sources, earthquake catalogs, earthquake recurrence models, ground motion prediction equations, model uncertainties, and seismic hazard calculations were examined separately, and parametric information required in earthquake hazard assessments was obtained. In the study, the Active Fault Map of Turkey renewed by the Mining Exploration and Research [
16] as seismic sources and earthquake catalogs compiled by different organizations from the historical and instrumental period (before and after 1900) earthquakes were used. Area source and linear and spatially smoothed seismic source models are combined with equal weight while creating seismic source models. The earthquake hazard maps in the reference rock environment were produced for 43-, 72-, 475-, and 2475-year recurrence periods by using all the data obtained [
11,
14,
17,
18,
19]. As a result, the Turkey Earthquake Zone Map evolved into the name of Turkey Earthquake Hazard Maps in 1996.The Turkish Earthquake Hazard Map started to be used in the recently updated code instead of defined seismic zones. The site-specific seismic hazard evaluation is the main advantage of the new seismic code. The earthquake parameters obtained from regions differentiated via large-scale zoning by previous code are selected locally through the new code. It is worth to mention that this update yields more reasonable evaluations in structural performance.
The Turkish Earthquake Hazard Map was updated based on the building code came into force in 2019. In general, parameters such as seismicity elements, fault and fault groups in the region, characteristics of faults, the distance of the structure to faults, earthquake history of the studied region, and characteristics of earthquakes are considered [
11,
14,
15]. It is well known that these parameters vary according to geographic locations. In addition, local ground conditions were included in the new code with different names. It is clear that local soil conditions directly affect the seismic behavior of buildings. Another parameter that should be considered in earthquake-resistant structure design is the structural characteristics. Earthquake damages show that these three parameters should be used together to reduce the damage level. The design spectrum can be obtained by combining local soil conditions and seismicity elements of the region. Local ground conditions significantly affect the design spectrum. Additionally, changes in the spectrum also affect the target displacements of structures [
20,
21,
22,
23]. The building performance and damage estimate better reflect the buildings’ values, which did not meet the target displacement [
24]. To perform building design and evaluation, the region’s local soil conditions and seismicity elements should be known accurately. Turkish Earthquake Hazard Map Interactive Web Application (TEHMIWA) has become available for the computation of earthquake parameters used in structural analyses for any geographic location since the beginning of 2019 [
6,
25]. These parameters are obtained through this web application by choosing the region’s local ground conditions and earthquake ground motion level in interest.
The effect of local soil conditions on the design spectra according to the previous and updated earthquake regulations for eight provincial centers in the Aegean region was examined by Seyrek (2020) [
26]. Koçer et al. [
27] made a comparison of the design spectra for different soil classes for four different provinces, taking into account the last two regulations and maps. Akkar et al., 2018 [
11] evaluated the seismic hazard maps of Turkey. The comparison of the spectral acceleration coefficient for all cities in Turkey was performed by Bozer (2020) [
28] using two regulations. Şeşetyan et al., 2019 [
29] performed seismic hazard analysis for Marmara Region according to new data. Sianka et al. [
30] performed seismic analysis for Marmara Region, and they determined a good agreement with the updated Turkish Earthquake Hazard Map. They made the comparisons for five major cities of the region. The studies generally include seismic hazard analysis and comparison of design spectrum in the light of updated data. There are no structural analyses in any of these studies according to the updated hazard map. This study differs from others in terms of both the calculation of seismicity parameters for the entire region and the structural analysis for different story numbers. Additionally, we reveal and draw attention to the effects of structures with similar characteristics in residential areas that are in danger of large and destructive earthquakes. We also aimed at determining the effect of the same local soil conditions and earthquake ground motion level for different geographical locations in the Marmara Region (NW Turkey), which is under the highest earthquake risk. The region is an essential strategic transition corridor between the Asian and European continents. The population of the region is approximately 30% of Turkey’s population. Here, we determined the effects of the updated seismic design code and seismic hazard maps on both earthquake and structural parameters on a regional basis. Moreover, the differences between previous and current regulations of the country were investigated. To this end, we considered eleven provinces in the region to reveal earthquake–ground–structure interaction. Using the earthquake ground motion levels for each province for earthquakes with 2%, 10%, 50%, and 68% probability of being exceeded within a 50-year period, Peak Ground Acceleration (PGA) and Peak Ground Velocity (PGV) were calculated. Short period mapping, spectral acceleration coefficient, local ground effect coefficients, design spectral acceleration coefficients, and horizontal and vertical elastic spectrum curves were obtained individually for each province. The earthquake ground motion level (DD-2) is 10% probability of exceedance (repetition period 475 years) in 50 years, and the ground type ZC was taken into consideration. These two parameter values were used for all provinces. The geographic location was selected as the only variable. In this context, the spectrum curves required for the structural analysis were obtained. Static adaptive pushover analyses were performed using these curves in the selected reinforced-concrete (RC) buildings. These analyses were chosen considering the local soil conditions. Displacement values, base shear force, stiffness, and performance criteria values were obtained for each province.
2. Seismicity of Marmara Region
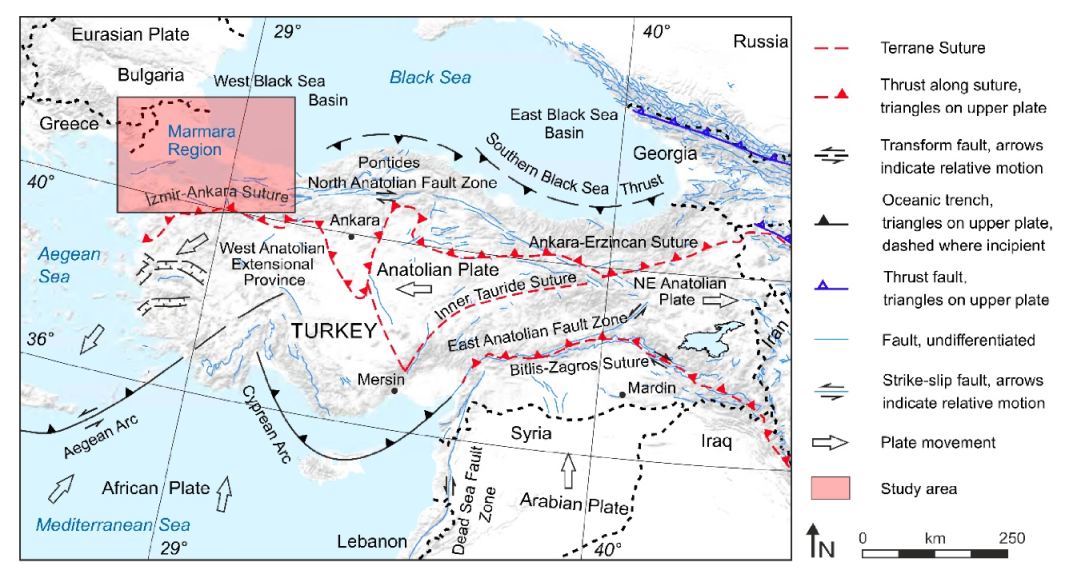
Turkey is an E-W trending part of the tectonically very active Alpine-Himalayan orogenic belt, and hosts one of the most actively deforming regions in the world [
31]. The neotectonics of the country are controlled by three primary structures that are North Anatolian Fault Zone (NAFZ), East Anatolian Fault Zone (EAFZ), and Aegean-Cyprian Arcs (
Figure 1).
The Marmara Region is located at the western end of the NAFZ. This right lateral fault is about 1600 km long and has produced significant earthquakes throughout history. Its general character is the presence of stress transfer, which starts from Karlıova (Bingöl) and progresses due to tectonic thrust towards the west. Large and devastating earthquakes (Mw > 7.0) occurred between 1939 and 1944 in the eastern part and between 1957 and 1999 in the western part on the NAFZ. After the last two earthquakes (Gölcük Mw = 7.4 and Kaynaşlı Mw = 7.2) that occurred in the east of Marmara in 1999, the place where the stress is transferred was in the Marmara Sea and the Middle Marmara Depression [
36,
37]. Occasional small and medium-sized earthquakes in this area are observed as proof of this situation. This means that the earthquake sequence along the NAFZ is in the western Marmara. By examining the earthquakes occurring on systematic faults, it has been observed that earthquakes act as triggers of new earthquakes. This phenomenon, called stress transfer, is clearly observed on NAFZ. The stress transfer from east to west between 1939 and 1999 was considered as the source of earthquakes occurring at more frequent intervals in the eastern part of the NAFZ and with longer intervals in the western part. After the last two earthquakes (Gölcük Mw = 7.4 and Kaynaşlı Mw = 7.2) that occurred in the east of Marmara in 1999, the place where the stress is transferred was in the Marmara Sea and the Middle Marmara Depression. Considering the history of the NAFZ earthquake, it is clearly seen that the new breaking point is the interior of the Marmara Sea.
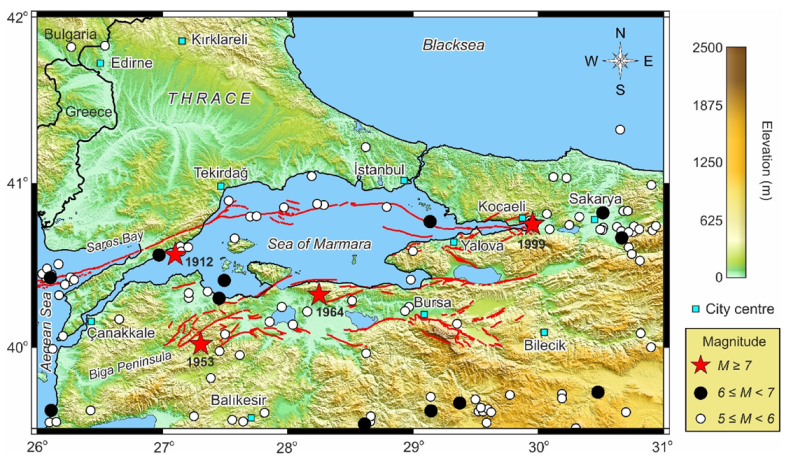
The region has high earthquake potential and has experienced six significant earthquakes (M > 7.0) between 1912 and 1999. Considering larger events, the northern Marmara Sea branch of the NAFZ seems less active during the instrumental period than the historical period [
38]. On the other hand, 1912 and 1999 earthquakes occurred in the west and east of the regions, respectively. The area in the Marmara Sea located between the two-earthquake rupture has remained silent since the earthquake of 1766 [
39]. A significant earthquake is also expected in the region in the near future [
40,
41,
42]. The magnitude of this possible earthquake is still a subject of debate in the country. Seventy-seven earthquakes (3.5 ≤ ML ≤ 5.2) occurred between 2004 and 2018 [
39]. The instrumental period earthquake distribution map is illustrated in
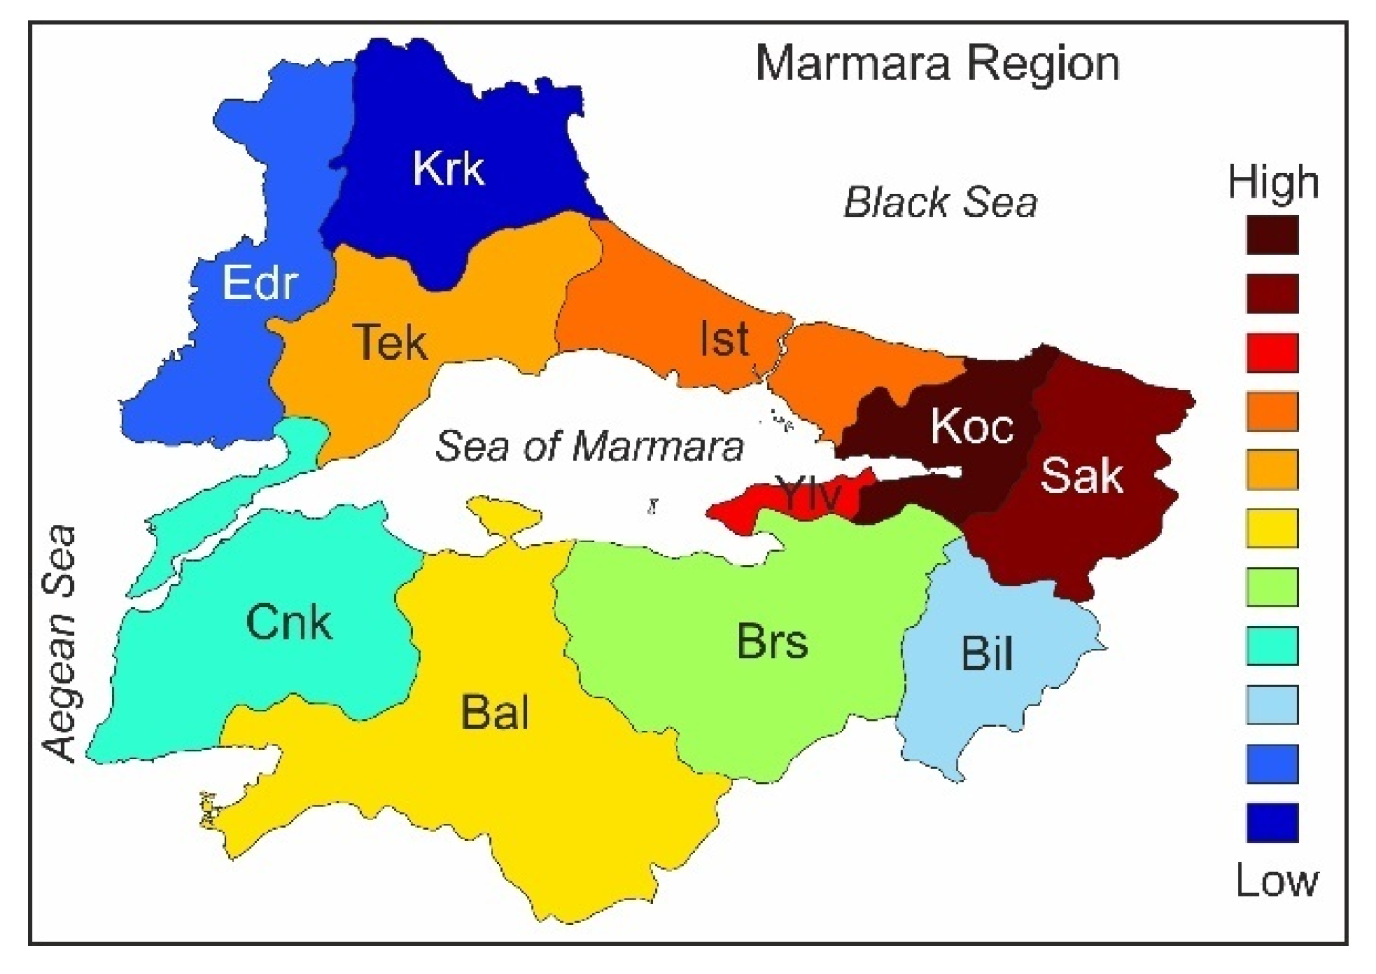
Figure 2. An important earthquake source with multiple segments emerges in the Marmara Sea. The Thrace provinces (Edirne and Kırklareli in
Figure 1) have very low seismicity. On the other hand, the seismicity of the south of a line starting from Saros Bay in the west, crossing the Marmara Sea, and extending to the eastern part of Kocaeli and Sakarya provinces is quite high (
Figure 3). Among the most devastating earthquakes of the country (M = 7.3, 1912) occurred in the Marmara Sea. This region, where the most important industrial associations and trade centers are located, is the most densely populated part of the country. Thus, any earthquake occurrence will have serious consequences. Analyses of the earthquake sources show that two segments appear to move independently in the Marmara Sea [
36]. The granitic intrusion on the Marmara side of the Bosporus acts as a barrier and constitutes an obstacle for fracture progression in this area, which causes a northward rotation [
43]. The focal depths of earthquakes that occurred at the western segment of the fault in the Marmara Sea are shallower than 20 km. On the other hand, shallow focal depths of 15 km or more are observed in the eastern segment. The Yenice-Gönen (M = 7.2) and the Bandırma (M = 7.0) earthquakes occurred in 1953 and 1964, respectively, and they caused the loss of many lives and properties. The most massive earthquake in Turkey in terms of its effects (M = 7.4) occurred in the eastern Marmara Region (Gölcük) in 1999 and caused a loss of about 25,000 human lives. It affected the whole region and caused severe destruction. In 1957 and 1999, two other significant earthquakes occurred very close to the easternmost part of the Marmara Region, with magnitudes of 7.1 and 7.2, respectively. Another destructive earthquake occurred very close to the southernmost part of the Biga Peninsula occurred in 1919 with a magnitude of M = 7.0. These last three earthquakes are not shown in
Figure 2 since they occurred outside the Marmara region. In recent years, earthquakes (M = 5.0 and 5.4) that occurred in the south-western part of the Biga Peninsula (
Figure 2) caused significant damage, especially to old and rural buildings. Additionally, there are some high potential earthquake-prone areas in the east and southeast of the Marmara Region. The faults that are optimally oriented in the stress field are mostly strike-slip with some normal faults in the region. The loose soil problem in the region poses a danger. Stress changes along the Princes Islands segment may be up to more than 3.0 bar. Increased stress is also found for the middle part of the Yalova region, varying between about 0.5 and 2.0 bar [
20].
3. Comparison of Earthquake Parameters
There are many significant parameters for structural analysis under earthquake risk [
45]. Seismicity elements are among these parameters. Briefly, these elements are defined as local soil conditions, fault/fault groups and their characteristics, and earthquakes at historical and instrumental periods [
46,
47,
48,
49,
50,
51]. These parameters vary based on different geographic locations. It is possible that an earthquake will cause more damage to structures under a soft or weak soil condition [
52,
53,
54]. Seismic sources, seismic records, and far and near-fault records have a significant role in the seismic vulnerability of structures [
55,
56,
57]. The reverse seismic source produces higher vulnerability than the vulnerability of the structures subjected to seismic records from strike slip fault [
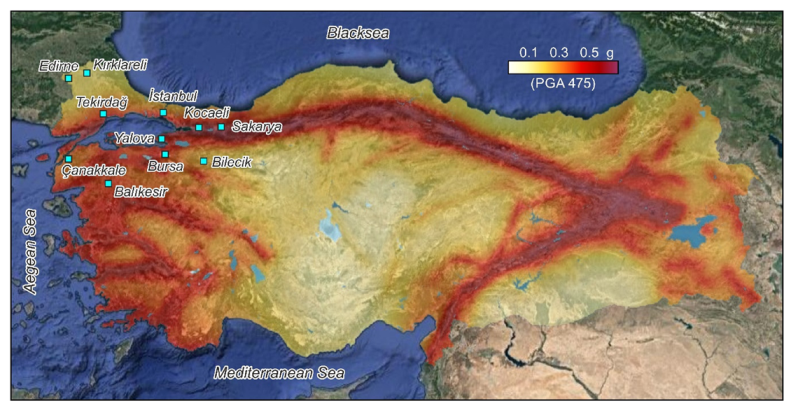
58]. Hence, the determination of these mentioned-above parameters is vital for near-future plans of engineering structures in the Marmara Region due to the active tectonic existence of high industrial facilities, population density, and high earthquake potential of the region. The Turkish Earthquake Hazard Map obtained from the updated TBEC-2018 is shown in
Figure 3. Additionally, the studied provinces are also given. This image map indicates the PGA values, which are expected to be reached or exceeded with a probability of 10% within 50 years, equivalent to the return period of 475 years. PGA is the most widely used parameter for intensity measures (IMs) [
59,
60]. The IMs parameters of ground motion are presented as a function of magnitude, distance from the source to the recording station, faulting mechanism, and site class [
61]. The PGA values where the yellow colors are dominant show relatively low-risk regions (below 0.1 g), while moderate-risk zones (0.1–0.25 g) are identified from yellow to orange colors, and a red scale represents high-risk zones (more than 0.3 g). The high earthquake potential of the Marmara Region mentioned previously is seen on the map. Four different earthquake ground motion levels identified in the TBEC-2018are listed in
Table 1. PGA and PGV values that were calculated based on TEHMIWA for different exceedance probabilities in 50 years for all provinces are presented in
Table 2.
In the study, ZC local soil class that given in TBEC-18 was chosen as the local soil class to determine the earthquake and structural parameters. The characteristics of this soil type (ZC) are given in
Table 3.
Among the innovations in TBEC-2018 is the local soil coefficients. The local soil effect coefficient F
S and the local soil effect coefficient for a 1.0 s period (F
1) for the ZC soil type are given in
Table 4 and
Table 5, respectively.
Information about selected local soil class (ZC), earthquake ground motion level (DD-2), and geographic location were entered as input data in TEHMIWA. This process was carried out separately, and earthquake parameters were obtained for each geographic location. Two dimensionless map spectral acceleration values started to be used with the updated code such as short period map spectral acceleration coefficient for the period of 0.2 s (S
S) and map spectral acceleration coefficient for the period of 1.0 s (S
1) which were obtained from TEHMIWA. Map spectral acceleration coefficients are obtained separately for different ground motion levels. The map spectral acceleration coefficients S
S and S
1 were converted into design spectral acceleration coefficients such as short period design spectral acceleration coefficient (S
DS) for 0.2 s and design spectral acceleration coefficient (S
D1) for 1.0 s using the following equations:
The design spectral acceleration coefficients were obtained by multiplying the map spectral acceleration coefficients (S
S, S
1) with the local ground effect coefficients (F
S, F
1) as can be seen from the above two Equations [
6].
Horizontal elastic design acceleration spectrum corner period (T
A and T
B) and vertical elastic design acceleration spectrum corner period (T
AD, and T
BD) were also obtained. The spectrum corner periods, T
A and T
B, varied only depending on the soil classes in TSDC-2007. Since the same soil class (ZC) was chosen for each settlement, T
A and T
B values were 0.15 and 0.40, respectively. These periods are different from each other for each geographical location and were calculated using the following equations in the TBEC-2018:
S
s, S
1, PGA, PGV, F
s, F
1, T
A, T
B, T
AD, T
BD, horizontal, and vertical elastic design spectra were obtained from TEHMIWA [
14] for each province by using DD-2 earthquake ground motion level and ZC local soil type. The comparison of these earthquake parameters obtained for all provinces is given in
Table 6.
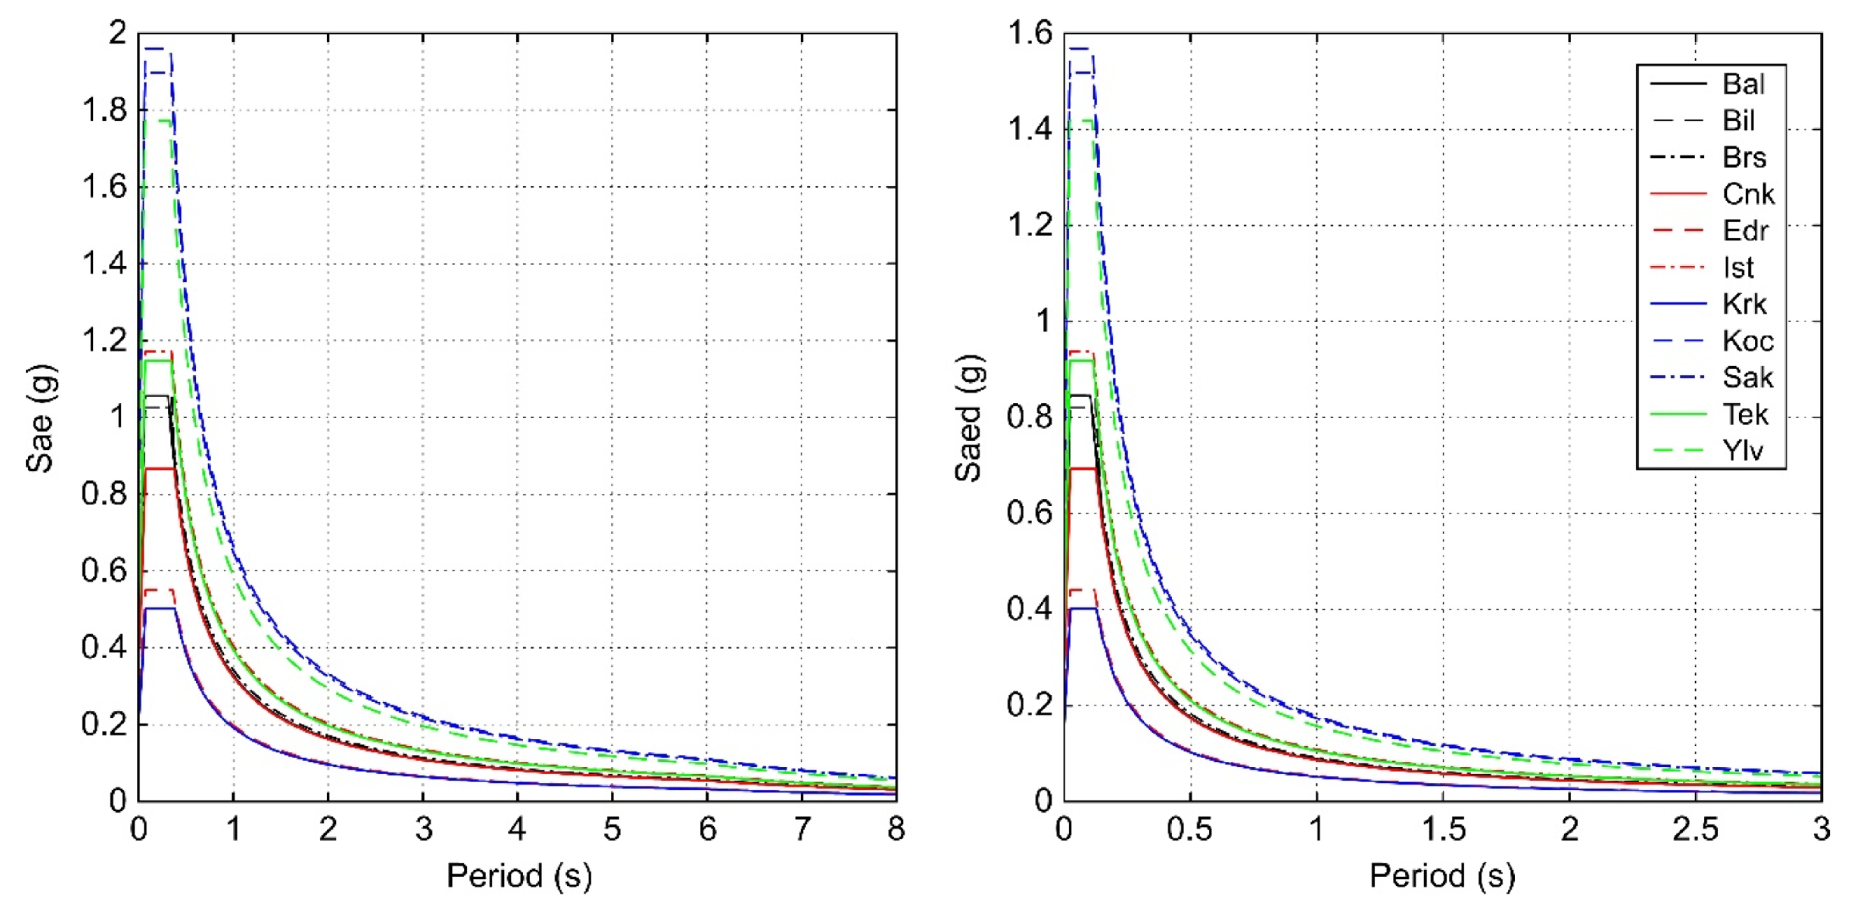
The design spectrum described in the earthquake regulations were used to determine the earthquake loads that will affect an engineering structure [
10]. The comparison of horizontal and vertical elastic design spectra obtained for all provinces through TEHMIWA [
25] are shown in
Figure 4. The horizontal and vertical elastic design spectra are completely different for all provinces. The highest spectral acceleration value was obtained for Kocaeli, and the lowest one was obtained for Kırklareliin in both the vertical and horizontal direction.
4. Comparison of Structural Analyses
Structural analyses for the provinces were performed using the Seismostruct software [
62]. The software considers the geometric and materially nonlinear behavior of structural systems under static and dynamic loads. Structural elements are discretized using beam-column models based on the fiber element approach [
63]. A displacement-based adaptive pushover (DAP) procedure introduced developed by Antoniou and Pinho [
63] was used in structural analysis. In the DAP procedure, the sections are modelled with fiber elements. Additionally, compatible lateral displacements are used instead of lateral forces in static pushover analysis. This procedure’s main advantage is that the applied lateral displacements are directly determined by a modal analysis [
63,
64,
65,
66,
67,
68,
69]. This procedure can be expressed under four main headings: (i) definition of nominal load vector and inertia mass, (ii) computation of load factor, (iii) calculation of normalized scaling vector, and (iv) update of loading displacement vector [
70]. There are many studies in the literature that proposed adaptive pushover analysis [
71,
72,
73,
74,
75,
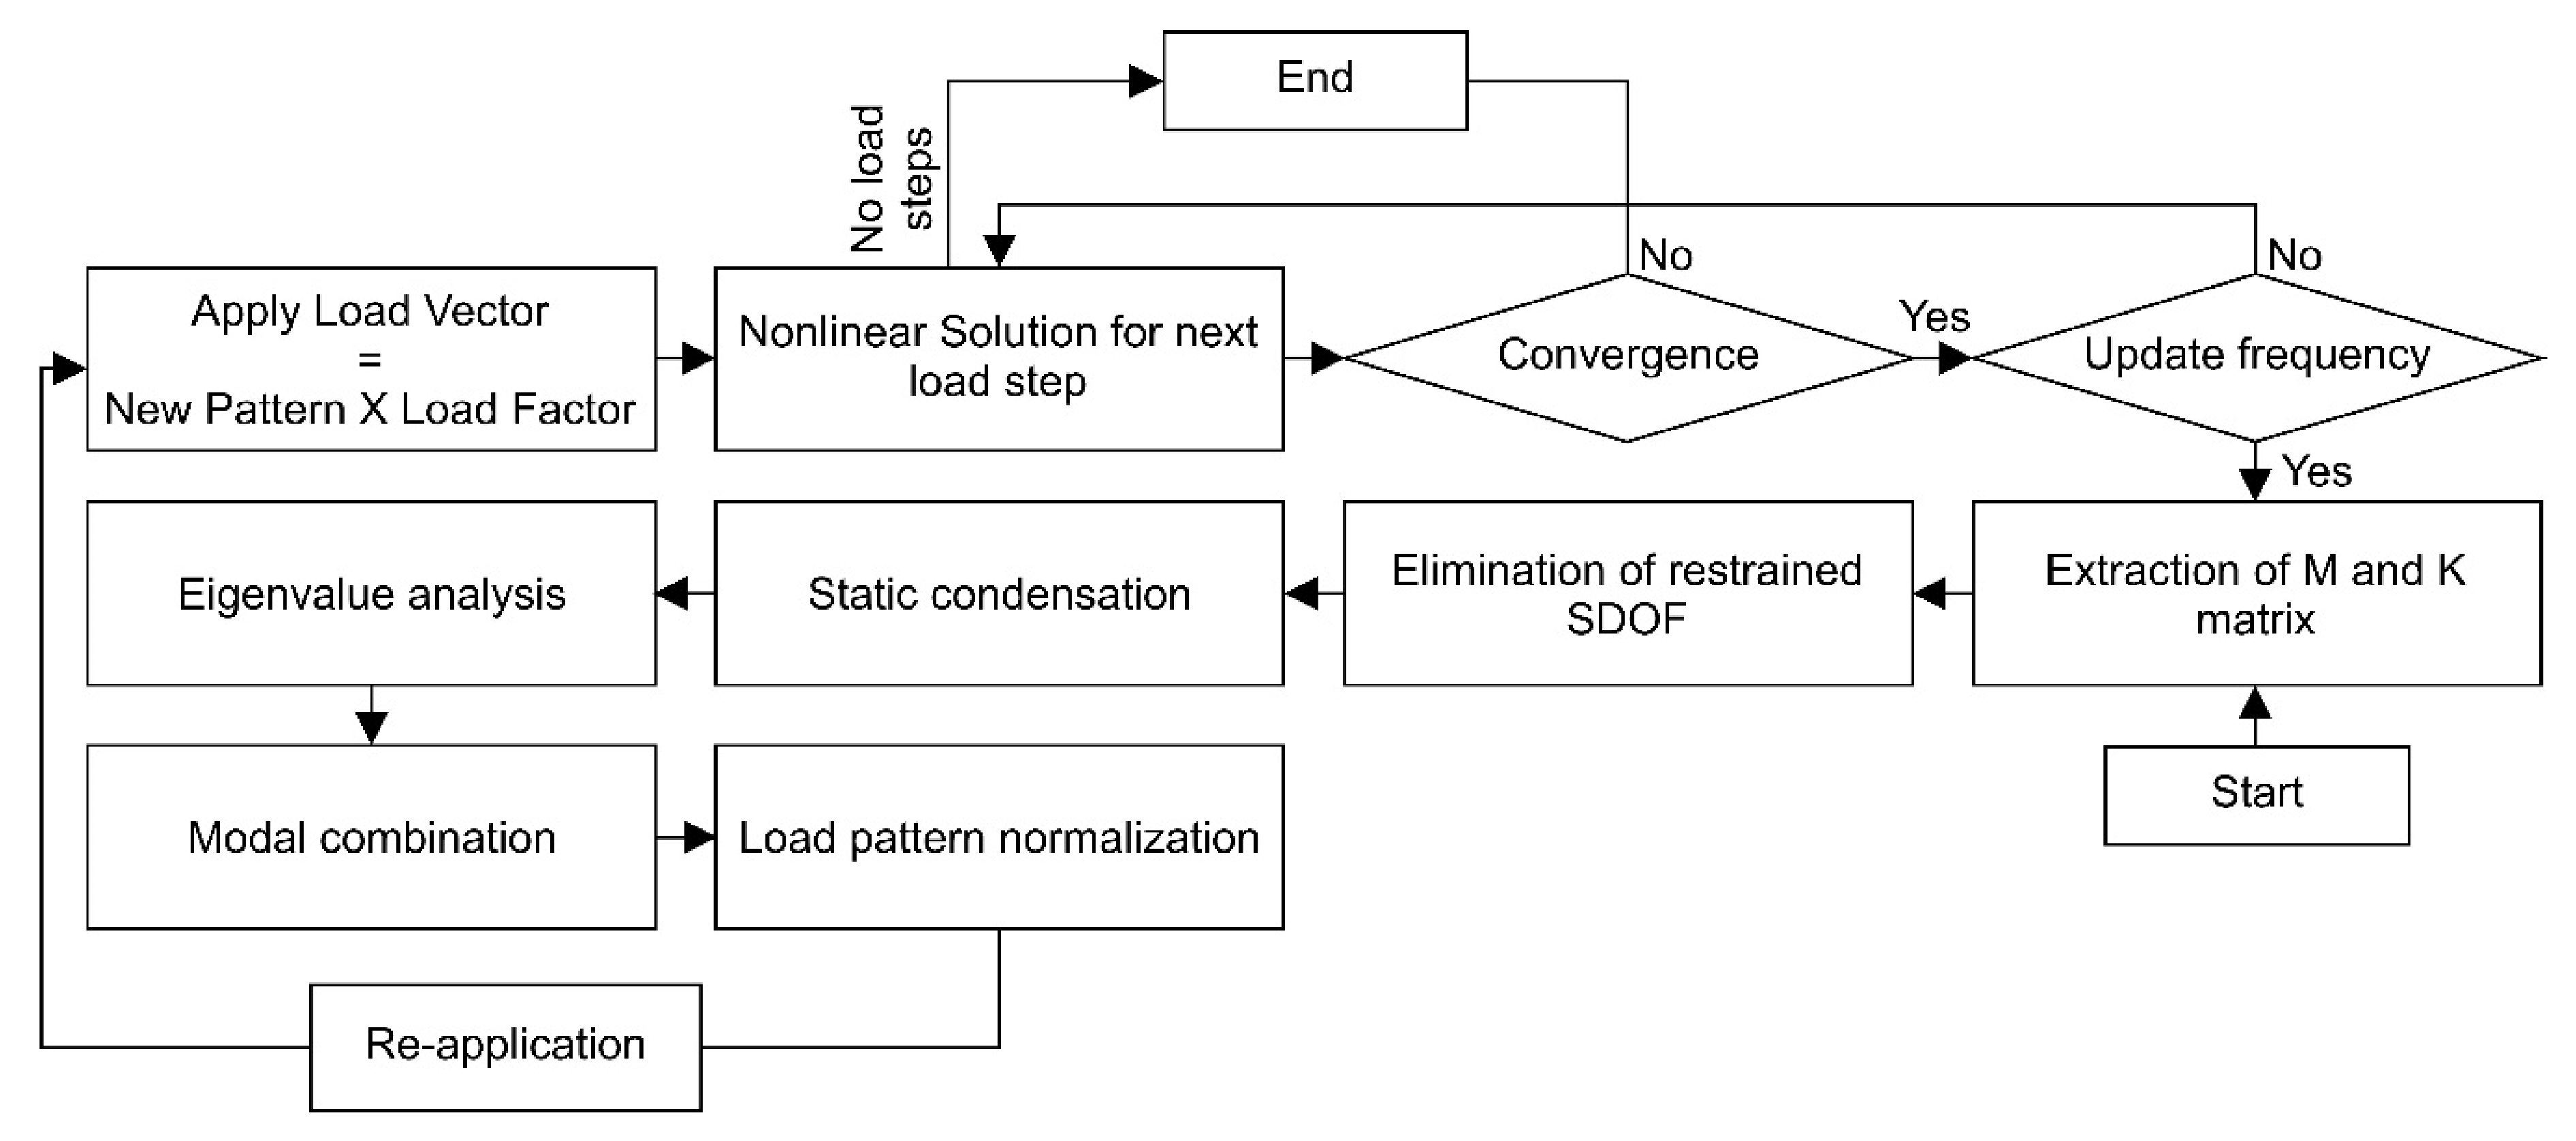
76]. The adaptive pushover analysis, which is applied in predicting the horizontal capacity of a structure, taking full account of the effect that the deformation of the latter and the frequency content of input motion have on its dynamic response characteristics, was used. Here, analyses were performed by considering the mode shapes and participation factors obtained from the eigenvalue analyses in each step during the adaptive pushover analysis. This method allows the use of a site-specific spectrum, in particular, where local soil conditions are taken into account. The load control types used here are similar to conventional pushover analysis [
63,
64,
70,
77]. The loading vector shape is automatically defined and updated at each analysis step in adaptive pushover analysis [
70]. The flow chart of the adaptive pushover analyses is given in
Figure 5.
The 3-story and 6-story RC buildings with the same structural characteristics (material strength, dimensions of structural members, span lengths, story heights, damping ratio, applied loads, material model, reinforcement in columns and beams, target displacement, and important class) were modelled. Local soil class was selected as ZC for all structural models. The PGA value and design spectrum obtained specifically for each province were selected as variables. According to inputs, base shear forces, displacements, stiffness values, pushover curves, and limit states were calculated for each province in the region as a result of structural analyses. Both the blueprint and all structural characteristics were the same for both numbers of stories. Analyses were performed in only one direction since the selected building model is symmetrical. Important class II and 5% damping ratio were taken into consideration for the selected RC building.
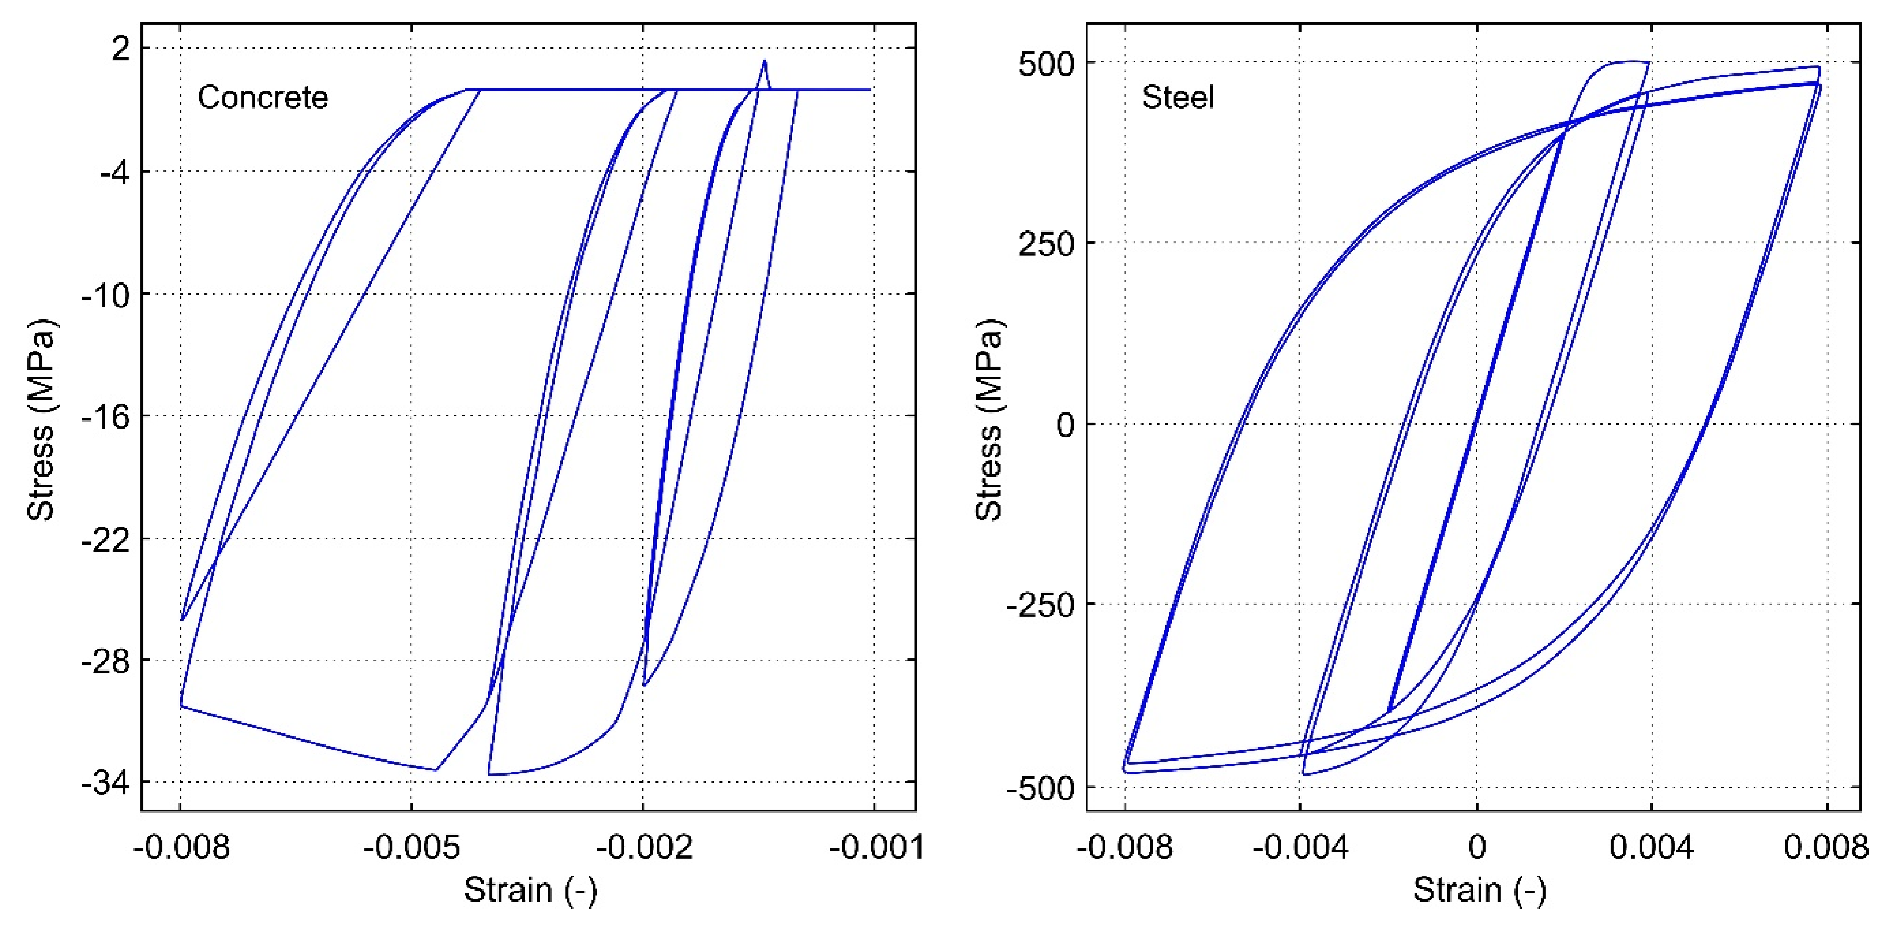
It is a fact that the behavior of building materials under load can be determined using some mathematical models, which is vital in building design and evaluation [
79]. The nonlinear concrete model [
80] and steel model [
81] were used for concrete and steel material. The stress–strain relationship of the material models considered for these models is demonstrated in
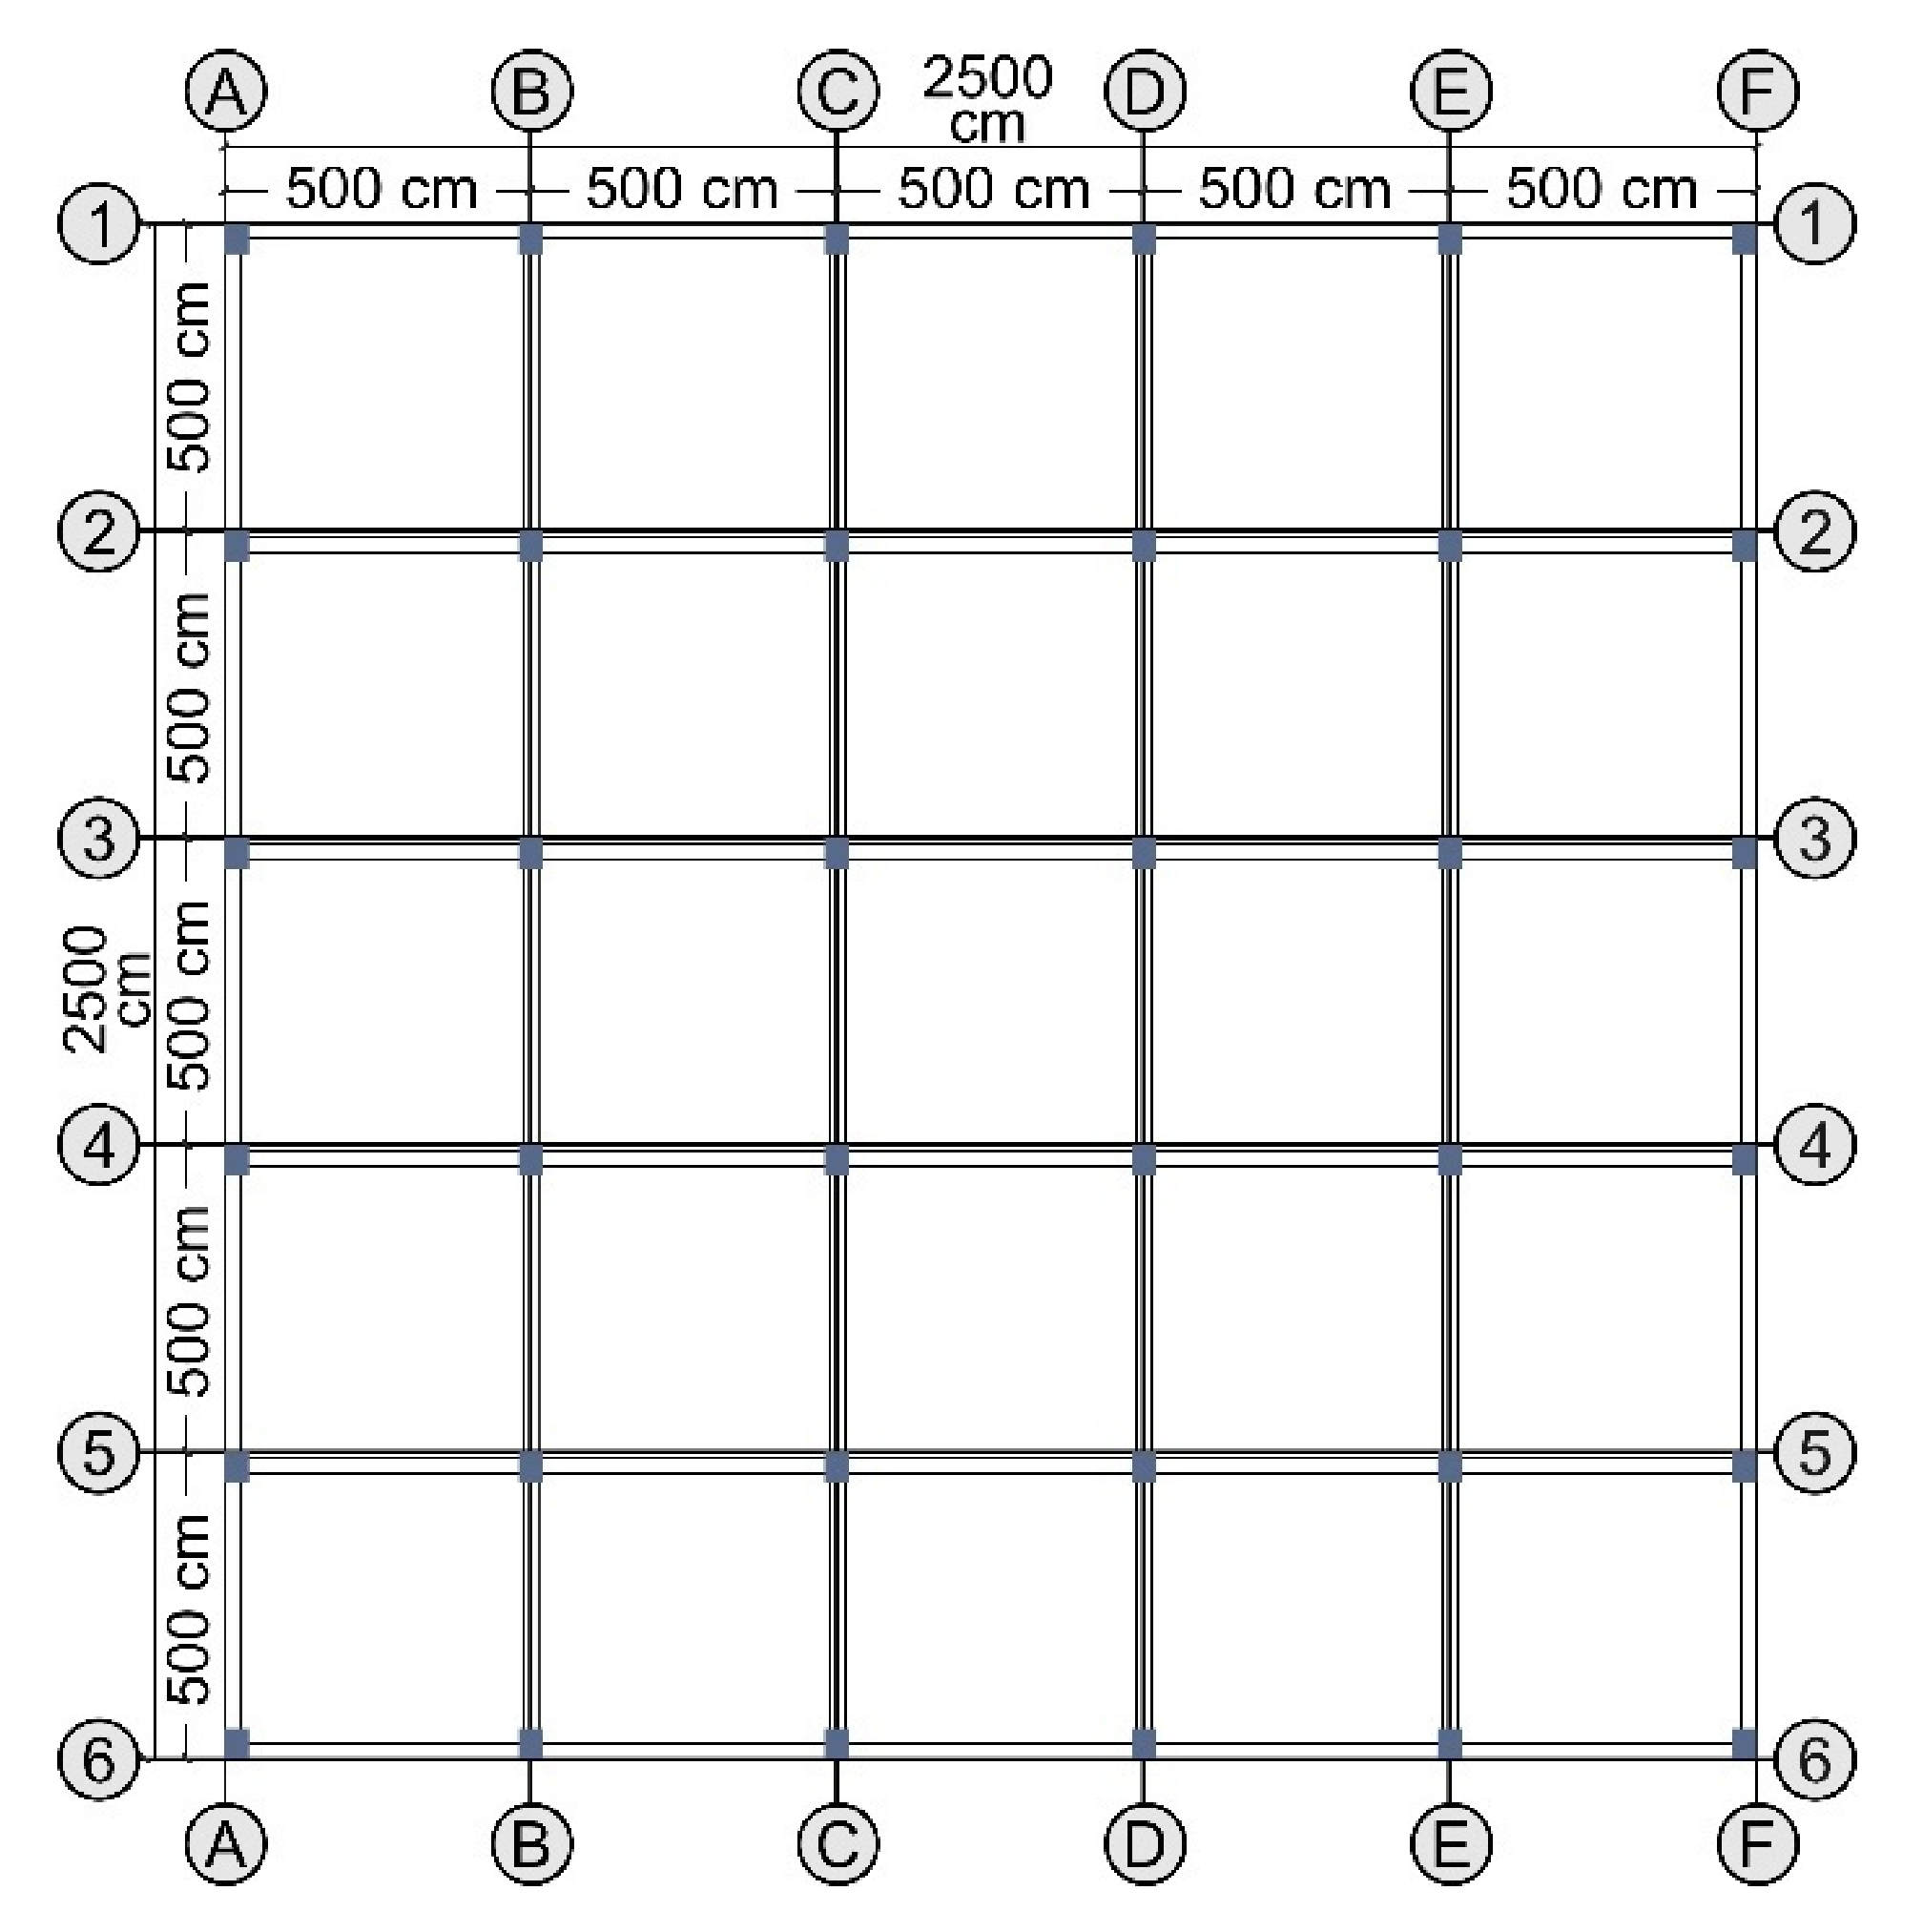
Figure 6. The blueprint of the selected RC building is also shown in
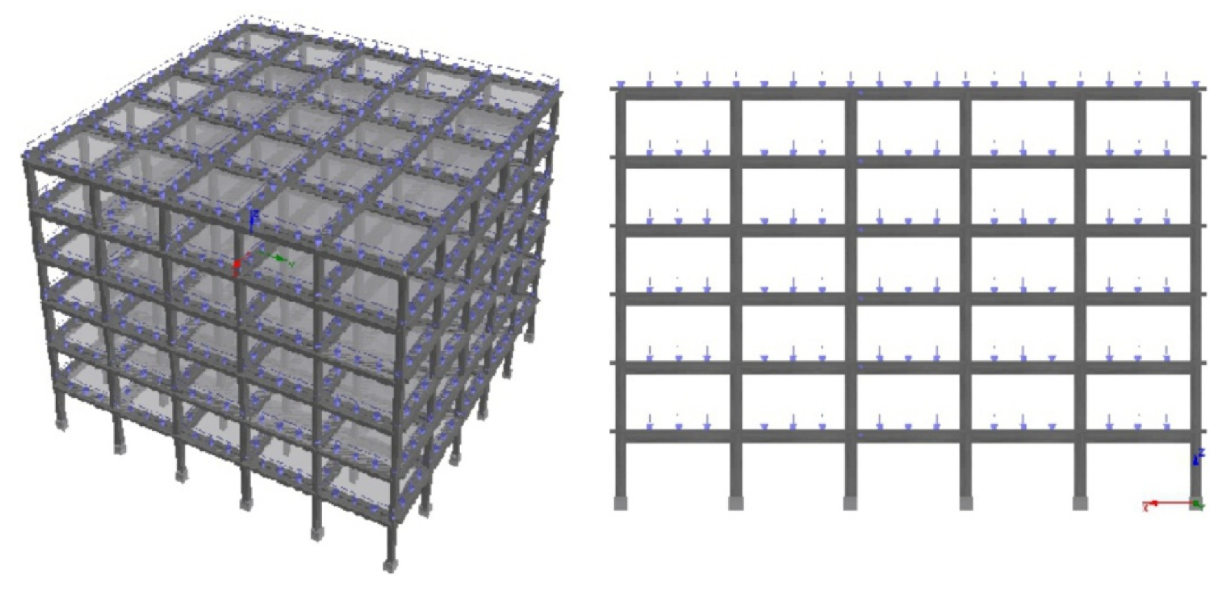
Figure 7. The two- and three-dimensional structural models obtained and the representation of the applied loads are given in
Figure 8 for a three-story building and in
Figure 9 for a six-story. Permanent and incremental loads were applied to the building model. Incremental load values were selected as displacement load, and a permanent load value of 5.00 kN was used. The target displacement was selected as 0.40 m. All these values were taken as the same in all models. Each story has an equal height of 3 m.
C25-S420 was taken into consideration for all RC building models. Yield strength (f
s) value was taken as 483 MPa, and concrete compressive strength (f
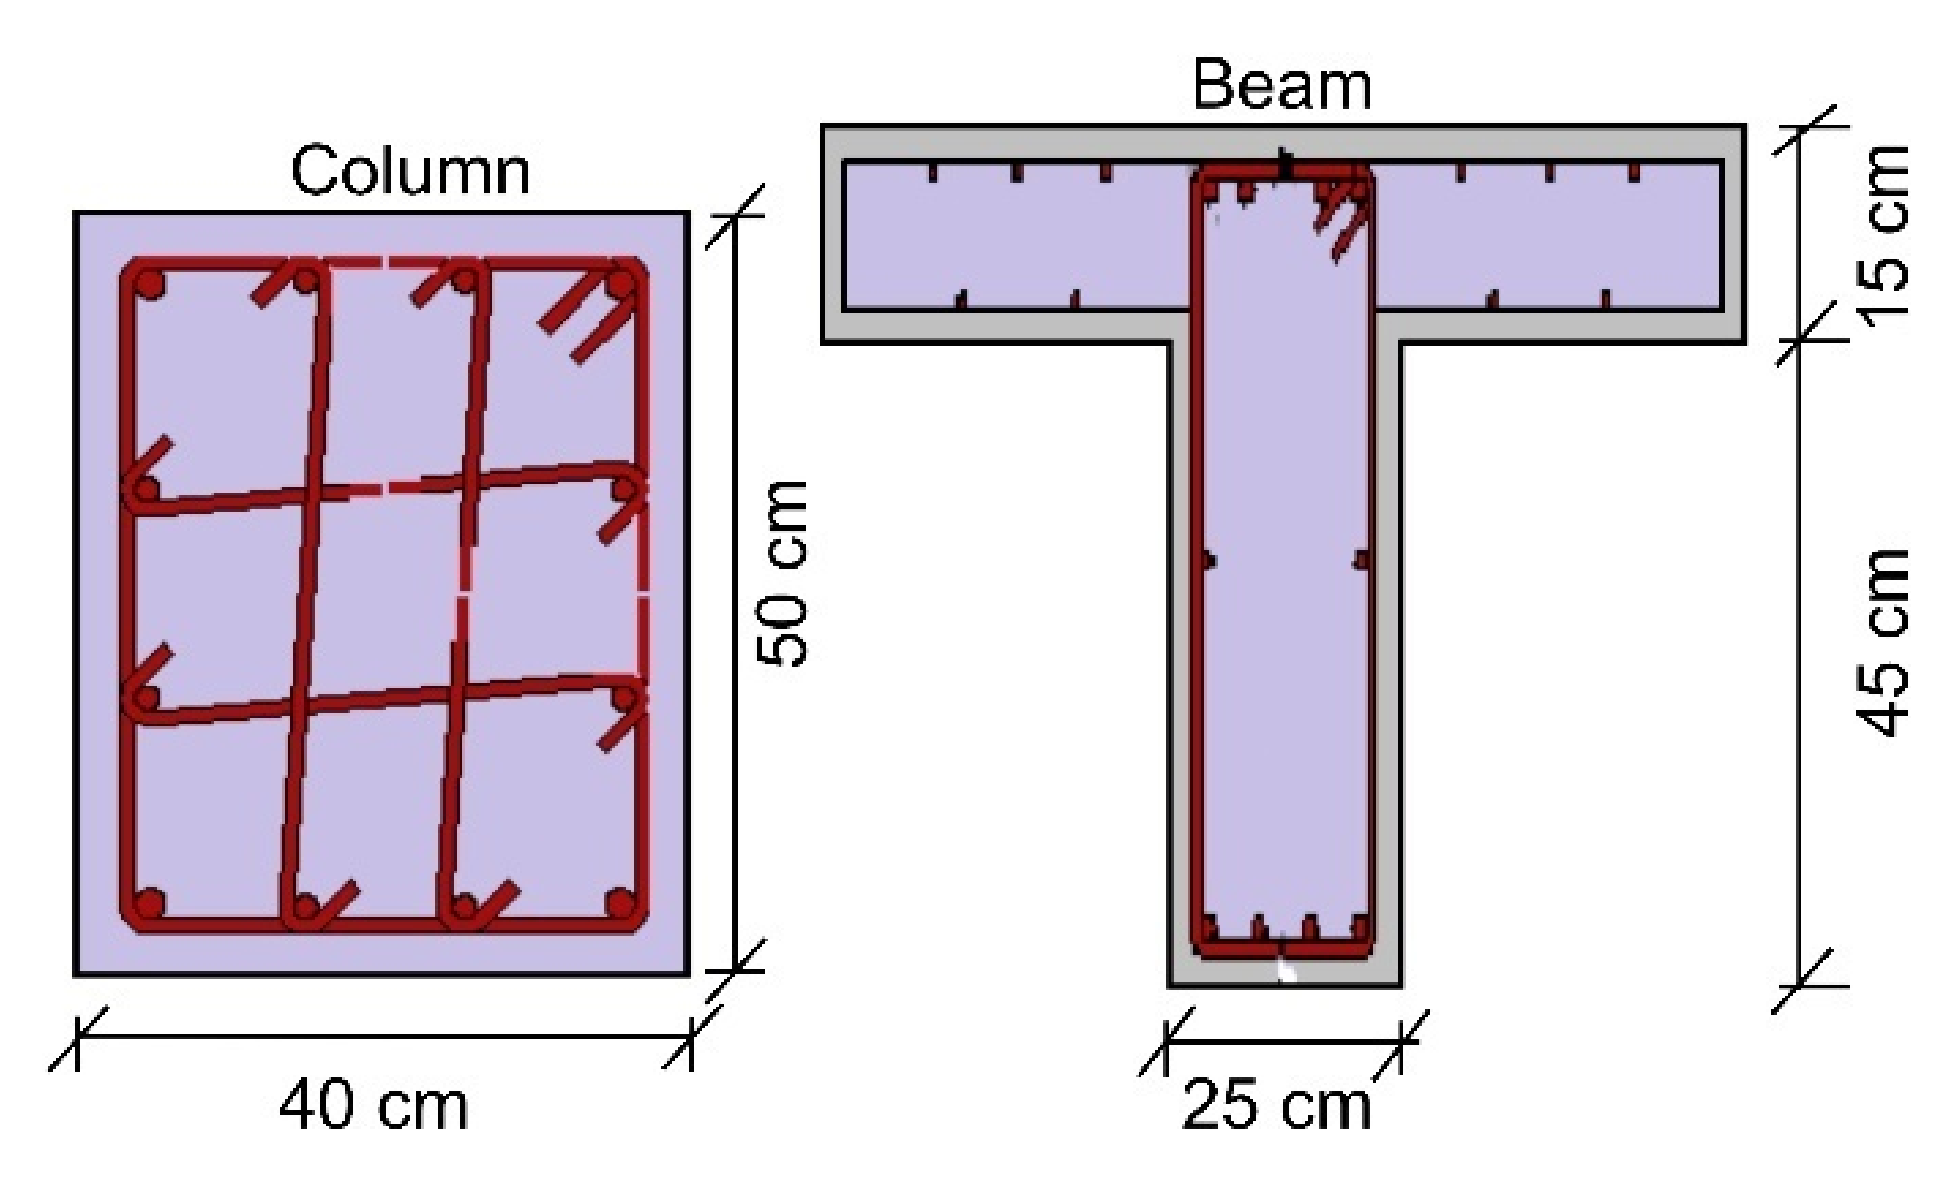
c) was taken as 33 MPa according to material models used in this study. The transverse reinforcements were selected as ϕ10/10 in columns and ϕ10/15 in beams in all stories. The reinforcements used in all columns were selected as 4ϕ20 in corners, 4ϕ16 in top-bottom sides, and 4ϕ16 in left–right sides. The reinforcements used in all beams were selected as 4ϕ16 in lower, 5ϕ18 in upper, 2ϕ12 in sides, 4ϕ10 in lower-slab, and 6ϕ10 in upper-slab. Column and beam cross-sections used in the RC buildings are given in
Figure 10. The selected RC building was analyzed using horizontal design spectrum curves, which were obtained from DD-2 since it is the standard design earthquake ground motion level. The base shear forces were obtained for each province. Three different points on the idealized curve as displacement values were calculated.
While creating all structural models, force-based plastic hinge frame elements (infrmFBPH) were used for columns and beams. These elements model the spread inelasticity based on force and only limit the plasticity to a finite length. The ideal number of fibers in the cross section should be sufficient to model the stress–strain distribution in the cross section [
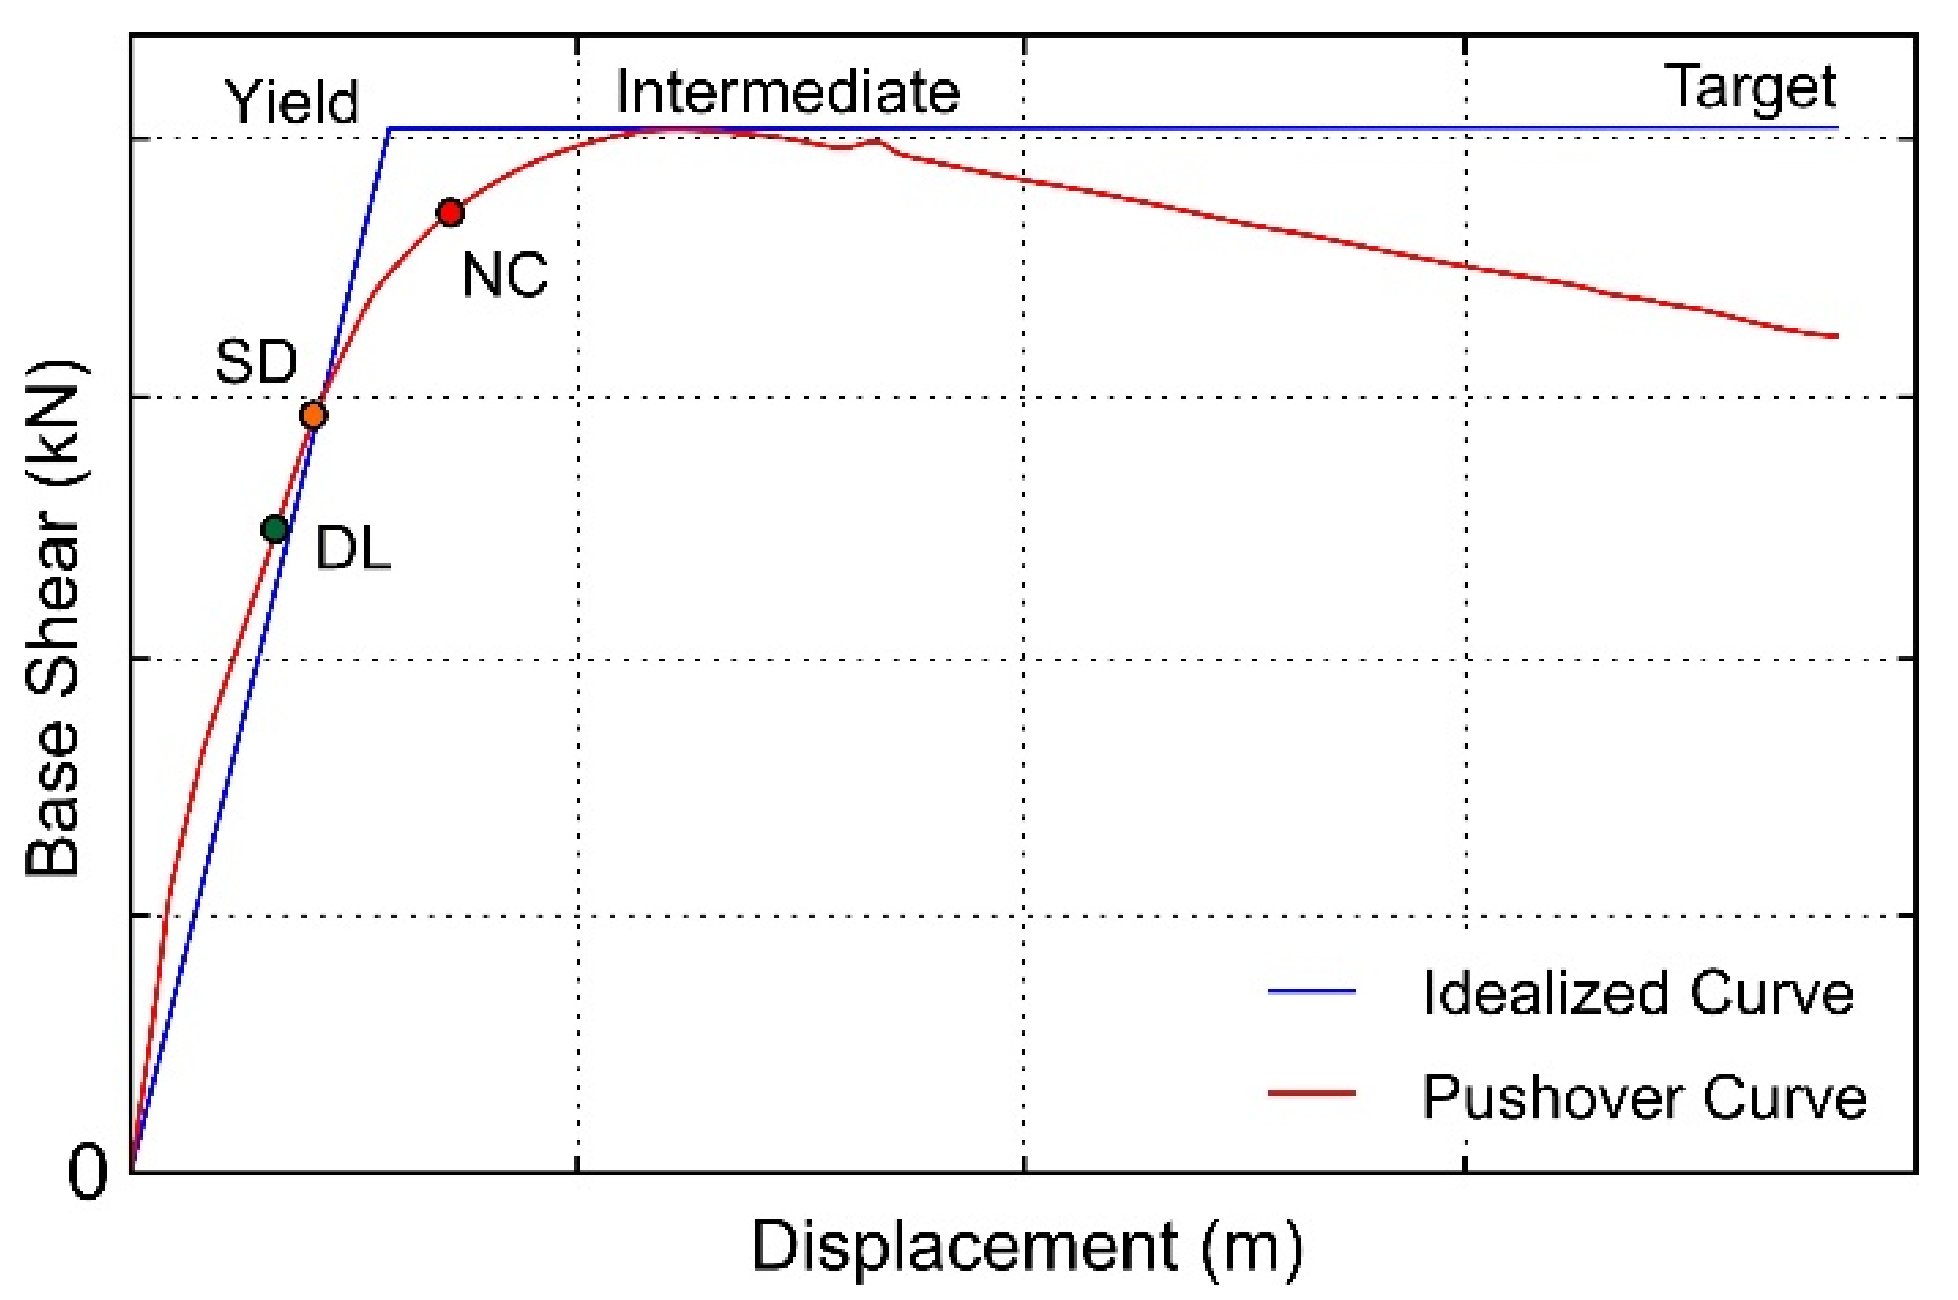
82]. In total, 100 fiber elements are defined for the selected sections. This value is sufficient for such sections. Plastic-hinge length (Lp/L) was chosen as 16.67%. The base shear force, which occurs at the ground level of the buildings due to the earthquake and is equal to the total lateral load acting along the building height, was calculated separately for each province. The displacements were obtained for three different points on the idealized curve. The first value refers to yield displacement (d
y), while the second and third values refer to the intermediate displacement (d
int) and the target (or ultimate) displacement (d
t), respectively. The stiffness values of RC structural elements differ from the predicted stiffness values under the effect of an earthquake. Therefore, effective cross-sectional stiffness values are used in the design and analysis of these structural elements. The stiffness of cracked sections is taken into account to determine RC structural systems’ performance under earthquake loads. The effective stiffness of cracked sections was obtained by using the prescribed stiffness reduction coefficients of the elastic stiffness value [
83,
84,
85]. The elastic stiffness value (K_elas) and effective stiffness (K_eff) values for each structural model were obtained directly using the stiffness reduction coefficients predicted in the algorithm. It is crucial to determine the target displacements for damage estimation when certain performance limits of structural elements are reached in performance-based earthquake engineering. In the structural analysis, the limit states given in Eurocode-8 (Part 3) [
86,
87] were taken into consideration for damage estimation used worldwide. The limit states for damage estimation are presented in
Table 7, according to Eurocode-8. All displacements calculated for structural analysis are shown in
Figure 11.
The natural vibration period of buildings is an important parameter in earthquake resistant design and performance evaluation. The equivalent seismic lateral force is determined from a design spectrum which is a function of the fundamental vibration period of a building in the static design method [
88,
89]. Building models with two different periods are considered one with a higher fundamental natural period, and another with a lower fundamental natural period. The fundamental natural periods can be obtained by using eigenvalue analysis [
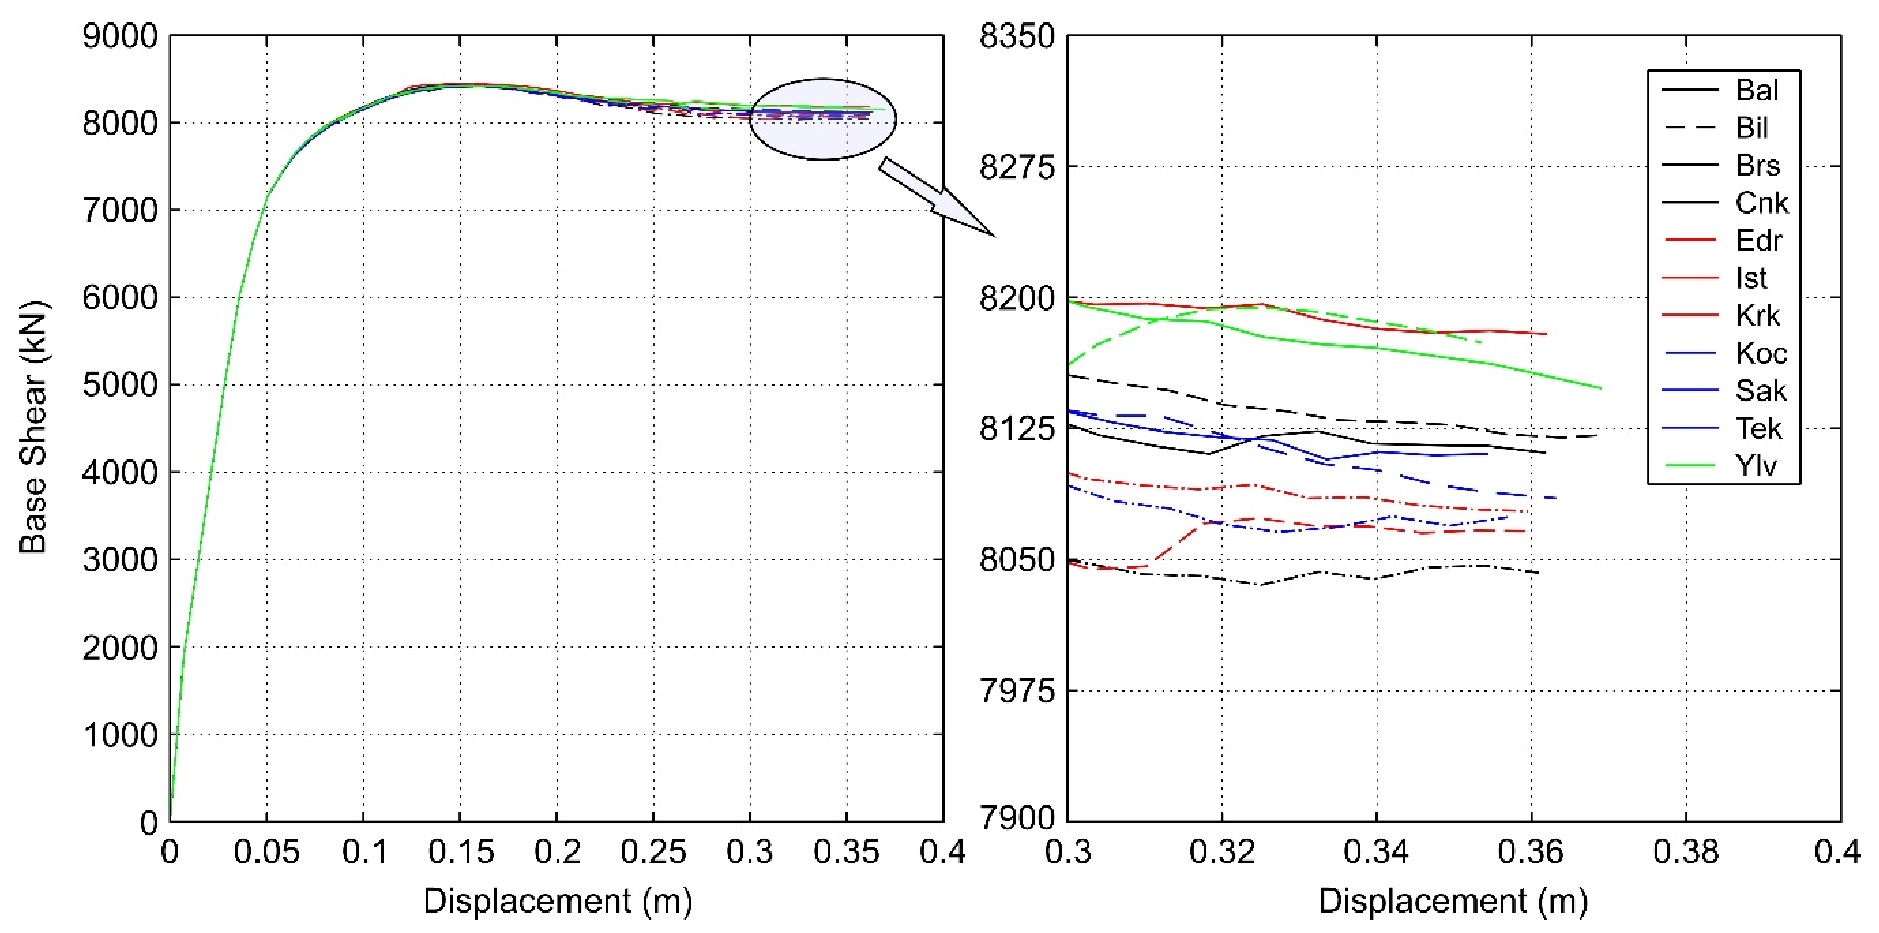
82]. Based on the eigenvalue analysis, the natural periods were calculated as 0.24175 s for 3-story and 0.47353051 s for 6-story. Natural period values were obtained the same for all provinces. Base shear forces for each structural model for each province were calculated separately through adaptive pushover analyses. The comparison of the pushover curves for 3-story is given in
Figure 12. The base shear forces increased as the number of floors increased.
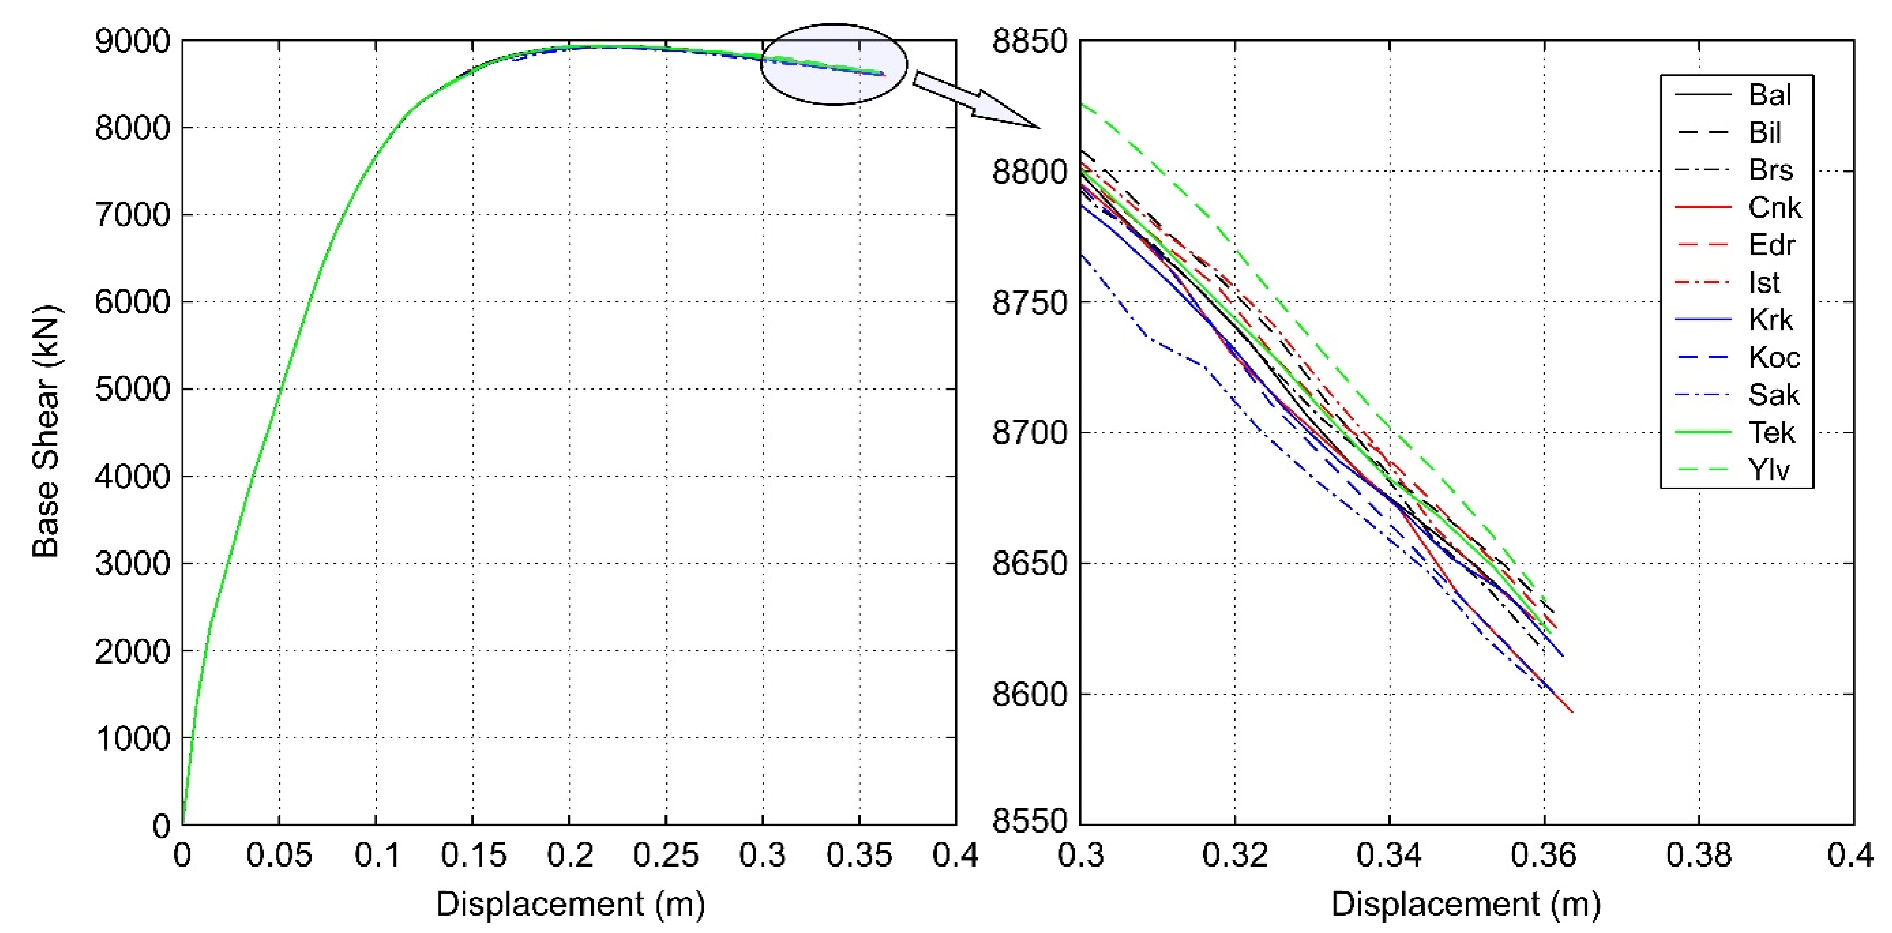
The comparison of the pushover curves for 6-story is given in
Figure 13.
Table 8 and
Table 9 show all values obtained in the X direction for 3-story and 6-story, respectively.
The earthquake-structural analysis results are presented in
Table 10. Additionally, an illustration indicating the risk status of studied provinces obtained from the parameters given in
Table 10 is shown in
Figure 14. Risk priorities were made based on PGA, PGV, and target displacement demands for DD-2 earthquake ground motion level since both earthquake and structural parameters are performed according to this earthquake level. The risk priorities were determined in a descending order. It is clearly seen that a complete agreement was observed between the earthquake-structural analysis results by using the site-specific design spectrum. Higher target displacement demand was obtained for higher PGA and PGV values.
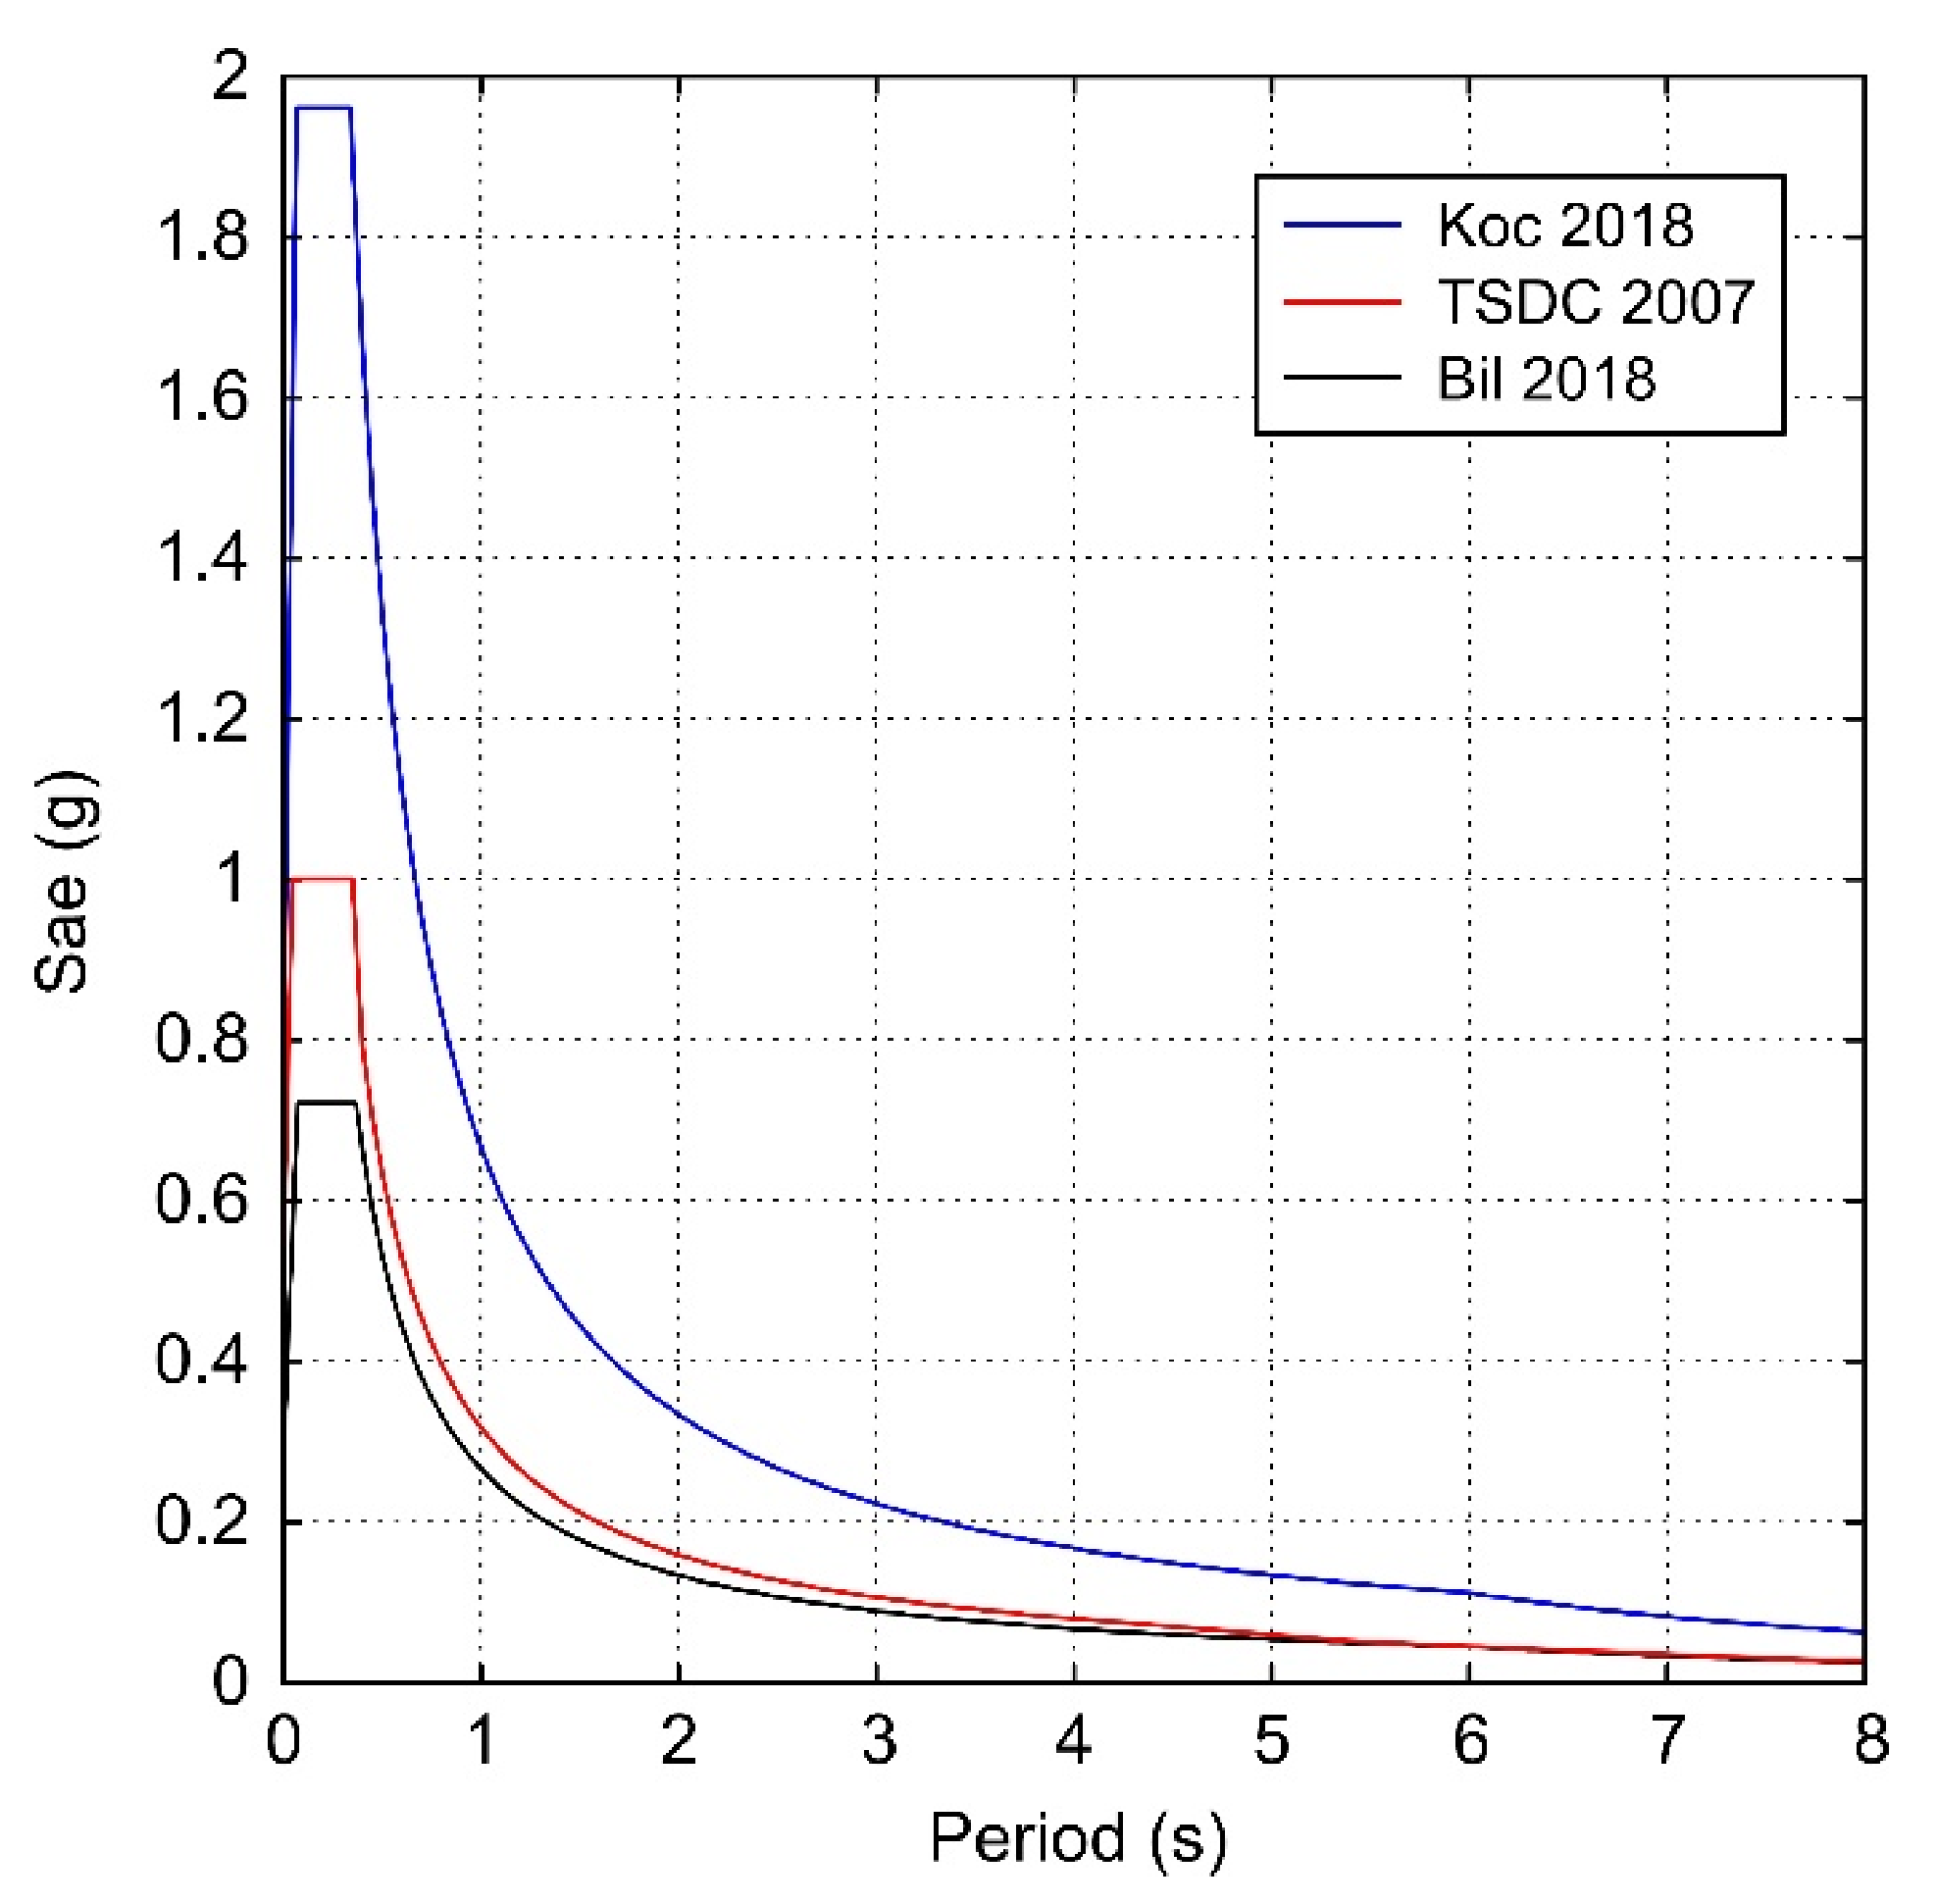
To compare the results obtained through the updated earthquake regulation with the previous one, Kocaeli and Bilecik provinces were selected since they produced the highest and the lowest PGA values, respectively. The spectrum curves for these provinces are shown in
Figure 14. As the previous regulation does not include vertical design spectrum curves, horizontal elastic design spectrums were used for the comparison. The site-specific spectrum started to be used for each geographical location with the TBEC-2018. In contrast, a single spectrum was used for all of the provinces located in the same earthquake hazard zone in the previous regulation. The comparison was made for the earthquake ground motion level using a 10% probability of exceedance (repetition period 475 years) in 50 years since it is the only one in the previous code. Therefore, a single spectrum curve is shown for TSDC-2007 [
10] for Kocaeli and Bilecik. The horizontal elastic design spectrum curves foreseen for some geographical locations may differ according to the previous regulation, as clearly seen from
Figure 15.
It was observed that updated spectrum curves are quite different from the previous spectrum curve. This situation significantly changes the displacement demands. Damage estimates and building performance will diverge from real values in structures whose displacement demands are not met. The comparison of target displacements for damage estimation values obtained via the design spectrum for TSDC-2007 for 3- and 6-story RC buildings with the values obtained for the updated regulation is shown in
Table 11.
5. Results and Discussion
Structural earthquake damages and advances in engineering technologies require constant updating of the rules of earthquake-resistant structural design and seismic hazard risk of the regions. There have been some updates in Turkey due to the significant losses of life and property caused by earthquakes. Both rules and seismic hazard maps were updated in 2018 in Turkey. In this study, earthquake-structural parameter variations were analyzed on a regional basis using the Turkish Earthquake Hazard Map (2018). The Marmara Region, including eleven provinces, is an excellent example due to its characteristics such as high seismicity, population, and industrial facilities density. PGA and PGV values were calculated for different probabilities of exceedance for each provincial center. According to the findings obtained in this study, the provinces of Kocaeli and Kırklareli are under the highest and lowest earthquake risks, respectively.
With the new regulation, the concept of the earthquake zone is no longer used. The design spectrum was in use on a regional basis, and this spectrum was valid for all provinces within the same earthquake zone in the previous regulation. The same effective ground acceleration coefficient is used in the same earthquake zone for the design spectrum that given inTSDC-2007. This situation is especially changed in TBEC-2018 specific for each geographical location. The spectral acceleration coefficients are used instead of the effective ground acceleration coefficient in the updated regulation. The spectral acceleration coefficients vary according to the coordinate and proximity to the fault with the new regulation. In order to reveal the effect of local soil conditions more clearly, local soil impact coefficients (Fs and F1) were included in TBEC-2018. Four different earthquake ground motion levels are taken into account with the TBEC-2018, while only one earthquake ground motion level was taken into account in theTSDC-2007. In addition, while only the horizontal elastic design spectrum was used in TSDC-2007, both horizontal and vertical elastic design spectra started to be used with TBEC-2018.
Analyses were carried out using the same design spectrum curve for Bilecik, Bursa, Çanakkale, İstanbul, Kocaeli, Sakarya, Tekirdağ, and Yalova, which are in the first-degree earthquake hazard zone in the previous regulation. Therefore, the obtained values take the same values for these provinces in the same earthquake hazard zone. It was determined that the values obtained separately for each province are quite different from the previous ones by using the site-specific design spectrum. Target displacements are lower than the values predicted in TSDC-2007 for Bilecik, Bursa, Çanakkale, Istanbul, and Tekirdağ. The values obtained for Kocaeli, Sakarya, and Yalova are higher than the values of TSDC-2007. Five of the eight provinces which use the same design spectrum are sufficient, while the others are insufficient, according to TSDC-2007. This finding shows that the updates will yield more realistic displacement demands for the structures. The same target displacements were obtained for these eight provinces located in the same earthquake hazard zone in the previous regulation. However, the values obtained through the updated regulation are different for all of these provinces. This reveals the necessity of a site-specific design spectrum instead of a regional-based design spectrum used in TSDC-2007.
Structural analyses were carried out for two different stories (three-story and six-story). Only the site-specific design spectrum was considered as a variable for both stories. A complete agreement was achieved between all results obtained from both stories for different provinces. The natural vibration period has the same value in all structural models for both stories since the structural characteristic do not change in all provinces. The displacement values calculated on the idealized curve are close to each other. Additionally, seismic capacities obtained for different stories for different provinces have very close values to each other. The elastic stiffness value of the structure increases when the number of stories increases. Moreover, the elastic stiffness values obtained for different provinces take constant values in both stories. The most crucial difference in the structural analysis was obtained in the target displacements. The expected target displacement from the building decreases when the number of stories decreases. Displacement values increase when the design spectrum increases according to higher PGA values. This means that the building’s expected earthquake movement capability is higher due to the higher values of the PGA. Structural analyses were also performed for the design spectra foreseen in the previous code. The same values were obtained for different story numbers in the same earthquake zone. In the previous code, calculations were made on a regional basis, and the concept of earthquake zones was expressed only for ground motion level with a repetition period of 475 years. Thus, Bilecik Bursa, Çanakkale, İstanbul, Kocaeli, Sakarya, Tekirdağ, and Yalova were considered as the first-degree earthquake hazard regions, while Edirne and Kırklareli were the fourth-degree earthquake regions. The effective ground acceleration coefficient for first-degree regions was 0.40 g, while it was 0.10 g for fourth-degree regions. However, PGA values were calculated as 0.36 to 1.12 g for the probability of exceedance 2%; 0.16 to 0.67 g for 10% probability of exceedance; 0.06 to 0.27 g for 50% probability of exceedance; and 0.04 to 0.14 g for 68% probability of exceedance in 50 years for provincial centers according to the updated earthquake hazard map. It was determined that the highest value obtained due to the ground motion level predicted by the previous regulation increased with the new regulation.
Earthquake parameters were calculated for all provinces, and horizontal and vertical design spectrum curves were obtained for each province center, and comparisons were made. Although the local soil conditions and earthquake ground motion level are constant values, we determined that earthquake parameters significantly differ from each other. The seismicity elements of the region, such as fault/fault groups and their characteristics, the distance from the determined geographical locations to fault/fault groups, and the region’s earthquake history are most likely the reason for these differences. We conclude that obtaining the design spectrum by considering the site-specific earthquake hazard estimations in the new earthquake regulations is a significant gain. This demonstrates the importance of the site-specific design spectrum that was missing in the previous regulations. Static adaptive pushover analyses were performed for the selected RC buildings with the same structural characteristics by using the design spectrum obtained for each province. We found that contrary to the base shear forces, the significant differences are seen in the performance level’s target displacement. Thus, it is worth mentioning that the site-specific design spectrum curve directly and significantly affects displacement requirements. A complete agreement was obtained between the target displacements for the damage estimation and the highest PGA value. As the PGA value increases, the demands for target displacement expected from the structure also increase when ground motion increases; more significant displacement of the structure is expected.

 ,
, 


