Article

Improvement of Radiant Heat Efficiency of the Radiant Tube Used for Continuous Annealing Line by Application of Additive Manufacturing Technology

1
Research Institute of Science and Technology, 67, Cheongam-ro, Nam-gu, Pohang-si, Gyeongsangbuk-do 37673, Korea
2
POSCO, 6261, Donghaean-ro, Nam-gu, Pohang-si, Gyeongsangbuk-do 37859, Korea
3
Department of Mechanical Engineering, Chung-Ang University, 84, Heukseok-ro, Dongjak-gu, Seoul 06974, Korea
*
Author to whom correspondence should be addressed.
Submission received: 24 October 2020 / Revised: 10 November 2020 / Accepted: 13 November 2020 / Published: 17 November 2020
(This article belongs to the Special Issue Additive Manufacturing and System: From Methods to Applications)

Abstract

:
This study presents the application of additive manufacturing (AM) technology to a W-type INCONEL radiant tube (RT) used to improve its radiant heat efficiency. Appropriate dimensions of honeycomb structure were determined from finite element (FE) analysis and the resulting increase in radiant heat was computed. The honeycomb patterns on the RT surfaces were printed using the directed energy deposition (DED) method. Radiant heat efficiency of a prototype RT with a honeycomb pattern printed was examined in a pilot furnace emulating the continuous annealing line (CAL). Finally, soundness of the prototype RT was tested on-site on the actual the CAL of No. 3 CGL in POSCO Gwangyang Steel Works. The results revealed that partial FE analysis, which predicts the amount of radiant heat by partially modeling the RT structure rather than modeling the entire RT structure, is suitable for overcoming the limitation of the computer memory capacity and calculating the design parameters of honeycomb patterns. The DED is suitable for printing honeycomb patterns on RT with large and curved surfaces. The average amount of gas consumed to maintain 780 °C and 880 °C for 1440 min was reduced by 10.42% and 12.31%, respectively. There were no cracks and no gas leaks on the RT surface in an annual inspection over three years.

Graphical Abstract

1. Introduction

Additive manufacturing (AM) has emerged as a breakthrough processing technology owing to its various advantages, such as ease of fabrication of complex geometry parts, improvement of expensive raw materials’ yield [1,2,3,4,5]. AM has a short lead time, but not always. AM parts (made from the AM process) can be applied in diverse fields and contribute in various ways to the system to which they belong. For example, the total performance of the system is increased by high-performance AM parts, while lightweight AM parts can reduce energy consumption [6,7,8,9,10].
The final product of the continuous annealing process is a finished cold-rolled steel strip. In this process, the strips are annealed in a reheating furnace, with an atmosphere stabilized and maintained without chemical change. This type of annealing is done in a continuous annealing line (CAL), commonly referred to as CAL in the steelmaking industry.
POSCO has been searching processes that could reduce fuel consumption by applying AM because of the implementation of stricter regulations on the air environment [11]. The CAL consumes a large amount of fuel to maintain pre-set heat treatment temperatures (approximately 800~1000 °C). Depending on the size of the CAL, approximately 100~500 radiant tubes are in operation in the CAL, and about 300 million m3 of coke oven gas (COG) and liquefied natural gas (LNG) are consumed every year. Radiant heat is continuously released from the outside surface of radiant tubes, whereas combustion heat is charged and then continuously released through the inside surface radiant tubes.
A radiant tube (RT) consists of a burner, recuperator, and tube made of either high-temperature steel or nickel-based alloys. In the burner, the fuel (LNG or COG) ignites and quickly enters the inlet of the RT. The generated high-temperature heat in the tube is transmitted by radiation from the outer surface of the tube to the steel strip. Lastly, the heat is exhausted through the outlet. The hot exhaust gas recovered by the recuperator is then used to reheat the cold air flowing through the burner. RTs appear in diverse shapes: double P, straight, W, and U [12].
Many studies have focused on improving the radiant heat efficiency of the burner and reheating system of the RT. Flamme et al. in 2010 argued that increasing fuel efficiency depends on an effective reheating of the cold air flowing through the burner [12]. Thus, they emphasized on the importance of RT designs that can use internal air preheating technologies, such as plug-in recovery, and regenerative and recuperative burners. Zhong et al. in 2015 used a double regenerative RT burner to improve the unstable combustion, gas pressure, and flow changes that often occur in conventional burners [13]. They reported that using low heat gases capable of burning at lower temperatures could reduce fuel costs, thus increasing fuel efficiency. Scribano et al. in 2006 tried to find the best operating conditions of RT in terms of optimum equivalence ratio, thermal power, and lower pollutant emissions [14]. They introduced a self-induced exhaust gas recirculation mechanism and reduced NOx emissions by up to 50%, for a wide range of thermal power and equivalence ratios, compared to the original burner design without compromising the thermal efficiency, CO emissions, and surface temperature uniformity of the RT.
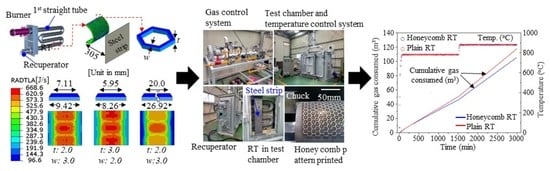
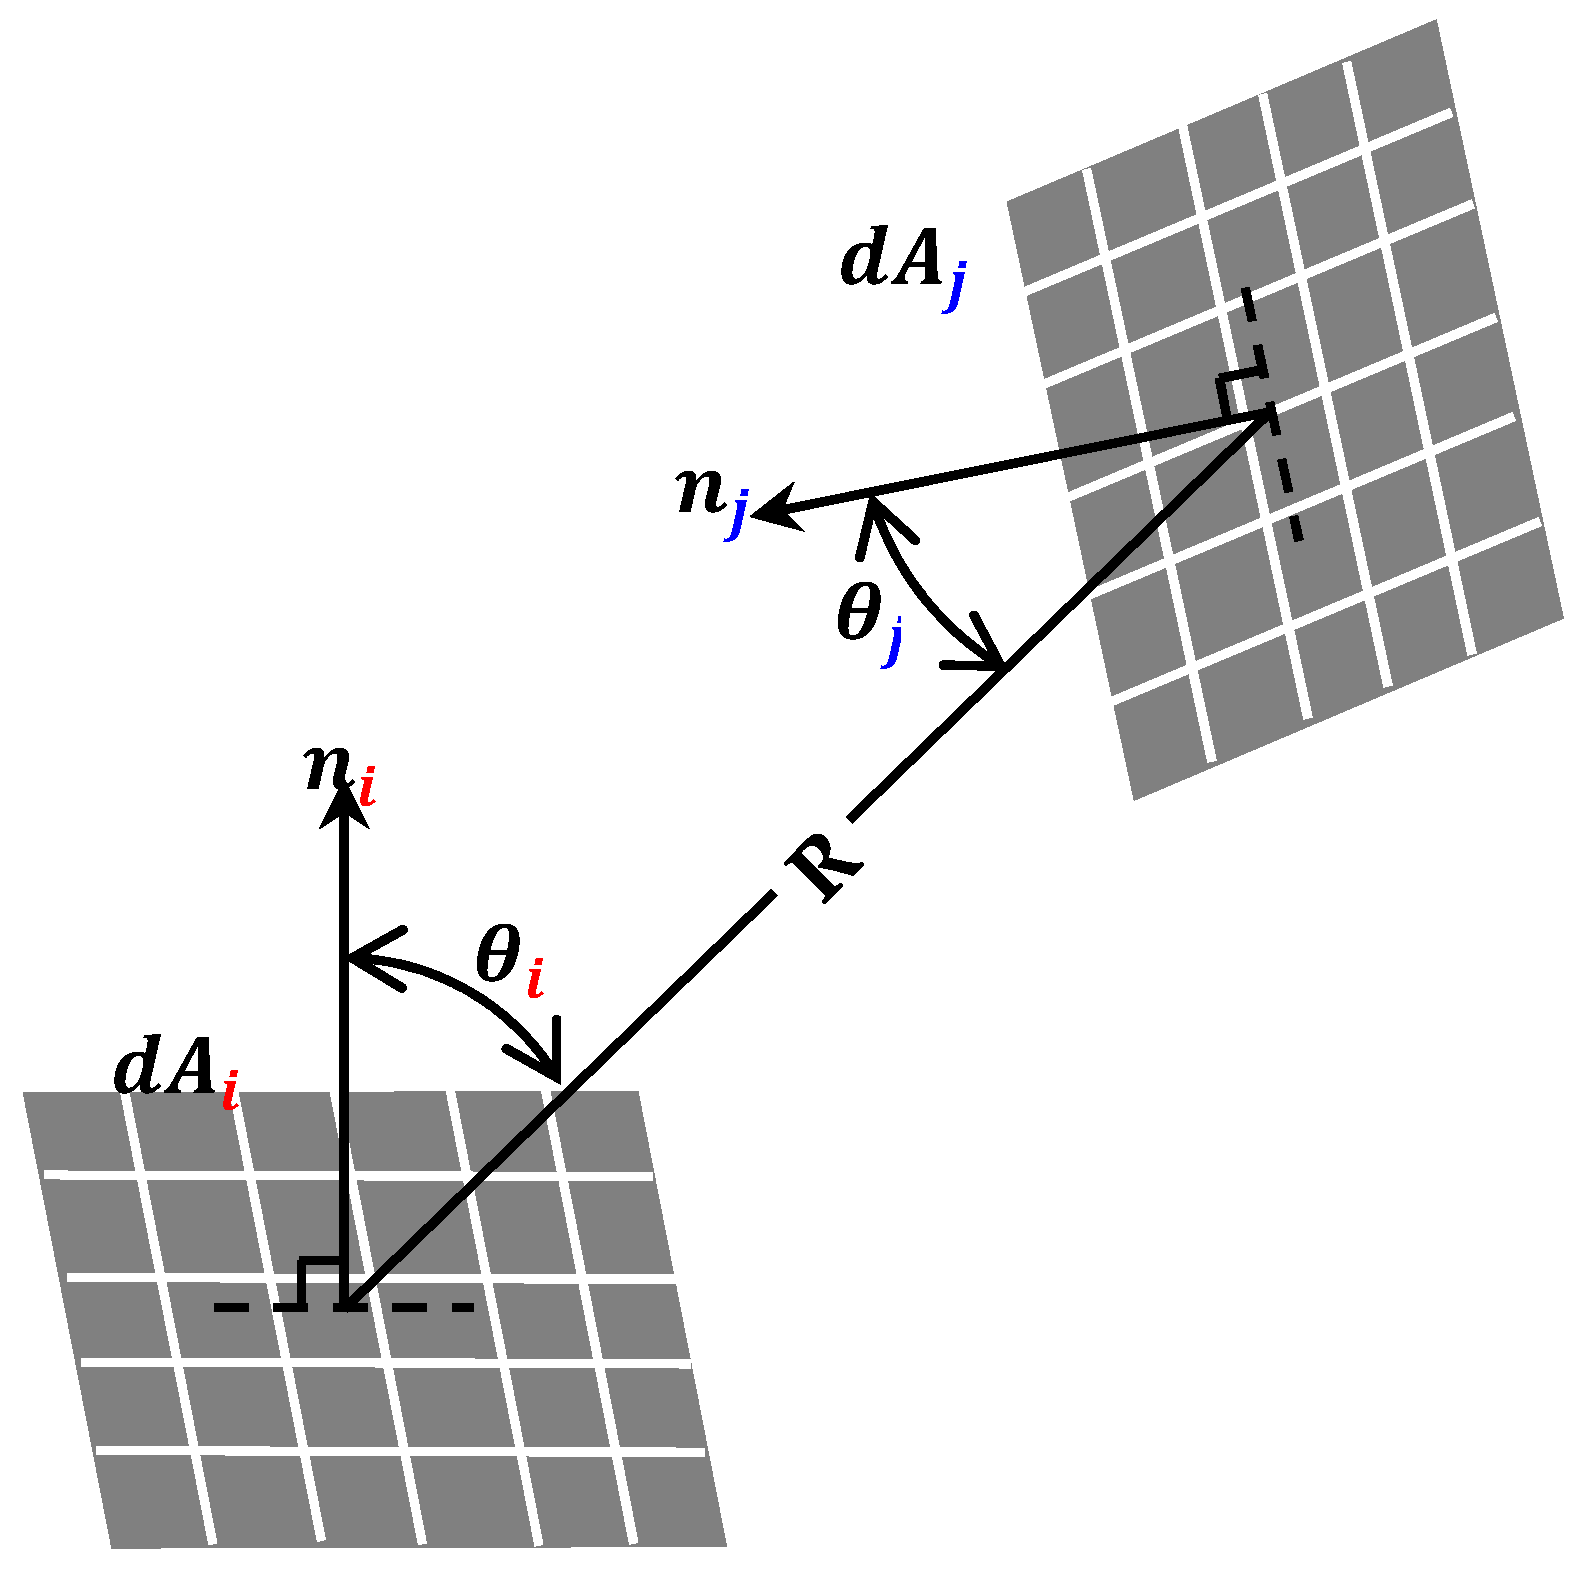
This paper presents a way to improve the radiant heat efficiency of W-type RT in CAL using AM. The RT surface area was increased by printing a series of honeycomb patterns on the RT surface. A three-dimensional (3D) elastic-thermal finite element (FE) analysis was carried out to calculate the time-integrated radiation per unit area (hereafter, referred to as radiant heat (J/s) and determine the appropriate dimensions (width, length, and thickness) of the honeycomb printed on the RT surface.
An RT is large (the size of a straight tube is Φ190 × 2000 mm) and has a curved surface. Consequently, the printing of a set of honeycomb patterns is impossible using the powder bed fusion (PBF) method. Therefore, in this study, the directed energy deposition (DED) method was selected. This method can be used even on objects with large and curved surfaces. Commercially available DED printers and powders (INCONEL 718 alloy) were used.
The radiant heat efficiency of an RT with honeycomb patterns printed was evaluated in the pilot furnace. The RT was supported by the refractory support at the far-off end of the test furnace, while two ambient temperatures (780 °C and 880 °C) commonly adopted in the CAL are maintained. For comparison purposes, RTs with and without honeycomb patterns were sequentially mounted in the pilot furnace. Instead of measuring the radiant heat, the variations in the amount of gaseous fuel consumed to maintain specified ambient temperature in the pilot furnace were measured. Finally, the soundness of the prototype RT with honeycomb patterns printed was tested on-site on the actual CAL of No. 3 CGL in POSCO Gwangyang Steel Works, Korea.

2. FE Analysis of the RT and the Strip

2.1. Design Variables of the Honeycomb Pattern

Figure 1a shows an image of an actual W-type RT structure consisting of four straight tubes, three U-bends, a burner, and a recuperator. The tubes were made of 3 mm thick cold-rolled INCONEL 601 strips. The burner was mounted at the inlet of the first straight tube, and the recuperator redirecting a portion of the exhaust heat into the burner was installed at the outlet of the fourth straight tube. Figure 1b,c represent a set of pratt truss patterns and that of honeycomb patterns generated on the RT surface for FE analysis. We calculated the radiant heat efficiency of the pratt truss and honeycomb shape, and their radiant heat efficiencies were compared. We chose the honeycomb structure (shape) because its radiant heat efficiency was better and its emissivity reaches up to 0.98 theoretically [15] Figure 1d shows a schematic of the honeycomb pattern and its design variables. The variable ‘t’ denotes the height of the honeycomb grid in the tube radius direction.

2.2. Heat Transfer Model of the RT

A pre-conceptual CAD design, including a set of honeycomb patterns printed on the RT, served as the basis for its heat transfer model of the RT. The following modes of heat transfer were considered.
-
Radiative exchange between the RT surface and the steep strip.
-
Conduction through the tube thickness and the set of honeycombs printed on it.
The heat transfer by convection was neglected due to the very small amount of fluid moving through the RTs during operation. A 200 mm long straight tube was modeled and analyzed to shorten the calculation time and overcome the limitation of the computer memory capacity. The FE model of its longitudinal direction half (Y-Z plane) is presented in Figure 1c. Hereafter, this type of FE model is called ‘partial FE model’ for convenience.
The radiant heat exchange between the partial FE model surface and steel strip surface is considered a cavity thermal radiation problem with a gray body, and diffuse reflections between the surfaces were assumed. A Cavity is defined in Abaqus/Standard as a collection of surfaces composed of facets [16]. Cavity radiation problems are intrinsically nonlinear due to the T4 dependence of the flux. Further nonlinearity can be introduced by describing the emissivity (ε) as a function of temperature. The radiative heat flux ( q i C ) on the surface of the cavities is defined by Equation (1).
q i C = σ ε i j = 1 N ε j k = 1 N F i j C j i 1 ( ( T j T i ) 4 ( T i T j ) 4 )
where N is the number of facets forming the cavity, Fij the geometrical view factor matrix, σ the Stefan–Boltzmann constant, and ε j the emissivity. Ti and Tj denote the temperature of the facet i and j, respectively. Cji is the reflection matrix defined by Equation (2).
C j i = δ i j ( 1 ε i ) F i j
with δ i j representing the Kronecker delta function.
The heat transfer of radiation between the opposing surfaces strongly depends on the geometry and orientation, as well as on their radiative properties and temperatures [17]. The amount of radiative heat transfer on any other two sides is defined through the view factor Fij [18,19]. Figure 2 is a schematic of the view factor, which is defined as the fraction of the radiation leaving the surface (dAi) intercepted by the surface (dAj). Equation (3) defines the view factor between two surfaces with a distance of R [20].
F i j = 1 A i A i A j cos θ i cos θ j π R i j 2 d A i d A j
where Rij is the distance between surface dAi and dAj, and θi and θj are the polar angles between Rij and the normal surface. For a closed cavity problem, the view factor satisfies the reciprocity relation ( A i F i j = A j F j i ). The sum of the view factors calculated in each cavity is 1 (Equation (4)).
j = 1 N F i j = 1
The element type C3D8T (8-node thermally coupled brick, trilinear displacement, and temperature) was used for temperature–displacement coupled FE analysis. A mesh convergence test was performed to determine the proper element size. The aspect ratio of the elements used for geometric modeling over the partial FE model was 1.5 (width, w): 1.0 (length, l1): 1.5 (height, t), and 100,788 elements were used.

2.3. Initial Condition, Boundary Condition, and View Factor Curve

Figure 3 shows an isometric view of the partial FE model. The elements in the honeycomb pattern are marked in blue and the elements in the steel strip are marked in gray. The initial temperatures of the partial FE model and the steel strip were set to be 20 °C.
In an actual CAL process, the temperature profile along the entire RT in operation is not uniform, and the temperature drops as the distance from the burner increases, as shown in Figure 4. This temperature profile was measured by Ifran et al. in 2010 [21], and was adopted in this study. The average temperature (905 °C) of four points A, B, C, and D (dots marked in black in Figure 4) of a straight tube was set as the boundary condition for the partial FE model, and thus the temperature (905 °C) was applied to the interior surface of the partial FE model.
The view factor varies as the distance between tube surface and steel strip surface changes. The view factor curve used in the FE analysis are shown in Figure 5. The distance between the strip and the center of the tube is 305 mm. In the cavity radiation, the infinitesimal facet area ratio was 84, Gaussian integration points per edge were 3, and lumped area-distance square value was 5. The emissivity of the master surface and slave surface was set to be 0.77. The ambient temperature between the partial FE model with a honeycomb pattern and the strip was set to be 800 °C.

2.4. Material

The mechanical and thermal properties of the RT material (INCONEL 601 at 900 °C) are listed in Table 1. The Stefan Boltzmann constant is 5.669 × 10⁻¹⁴ W/mm2/K4 and the absolute zero is set at 273.15 °C below zero.

2.5. Determination of the Design Variables of a Honeycomb Pattern

FE analyses were carried out to compute radiant heat (J/s) when the RT surface printed with honeycomb pattern faces the steel strip (Figure 6a). The ratio of 200 mm (tube width in the length direction) over 300 mm (steel strip width) in the partial FE model was set to be coincident with the ratio of the length of average straight tube of the actual RT on which the honeycomb pattern was printed over the width of the actual steel strip being annealed in the actual CAL. The distance between RT and the steel strip is 305 mm, which is usually applied in actual operation. The steel strip thickness was 3 mm. The FE analyses were performed using the partial FE model to reduce the computation time.
Three different honeycomb structures as shown in Figure 6b–d were considered in FE analysis to determine the design variables of a honeycomb structure. Figure 6b is the honeycomb structure of the smallest printable size in this study. Figure 6c,d are representative of the honeycomb structures. Other sizes of honeycomb structures were also considered.
Figure 6e–g compares the computed radiant heat of three honeycomb patterns with varying dimensions (width, length, and thickness). The change in radiant heat was significant along the central longitudinal nodes of the strip. Hence, the radiant heat was taken as the average of the radiant heat calculated along the middle longitudinal (y-direction) nodes of the strip. The radiant heat in Figure 6e–g were 548.6 (J/s), 564.5 (J/s), and 527.8 (J/s), respectively. Note the radiant heat was 519.6 (J/s) when the RT surface without the honeycomb pattern faces the strip. The radiant heat increased by approximately 8.64% compared to the radiant heat of RT without the honeycomb pattern when the honeycomb design variables shown in Figure 6f were applied. Hence, in this study, the honeycomb design variables in Figure 6f were selected for DED printing.
RT deflections induced by the weight of the honeycomb pattern were also investigated. Difference in the maximum deflection of RT induced by the addition of the honeycomb pattern was only 0.0021 mm (0.14%). Therefore, it was judged that the weight increase caused by the addition of the honeycomb pattern on the RT had a negligible effect on the deflection of RT.

3. Experiment

3.1. Material Used to Print the Honeycomb Pattern

The INCONEL 718 alloy powder (CarTech® 718, UNS N07718), with its chemical composition given in Table 2 (supplied by Carpenter Technology Corporation), was used to print a set of honeycomb patterns on the RT made of INCONEL 601. Ideally, the pattern’s metal should be the same as the RT metal to achieve high bonding strength between the pattern and the RT’s surface and prevent the separation of patterns from the RT when the pattern-printed RTs are heated and cooled repeatedly. However, the selected pattern material was the INCONEL 718 as an alternative because INCONEL 601 powder for 3D printing is not commercially available.
Table 3 shows that INCONEL 718 has higher tensile and yield strength than INCONEL 625 at elevated temperatures. A higher strength pattern can support the RT and prevent collapse at high temperatures. Table 4 shows that the difference between the thermal expansion coefficients of INCONEL 601 and INCONEL 718 is smaller than that between INCONEL 601 and INCONEL 625. Therefore, INCONEL 718 is more effective in preventing the separation of the patterns from the RT when the pattern-printed RTs is heated and cooled repeatedly.
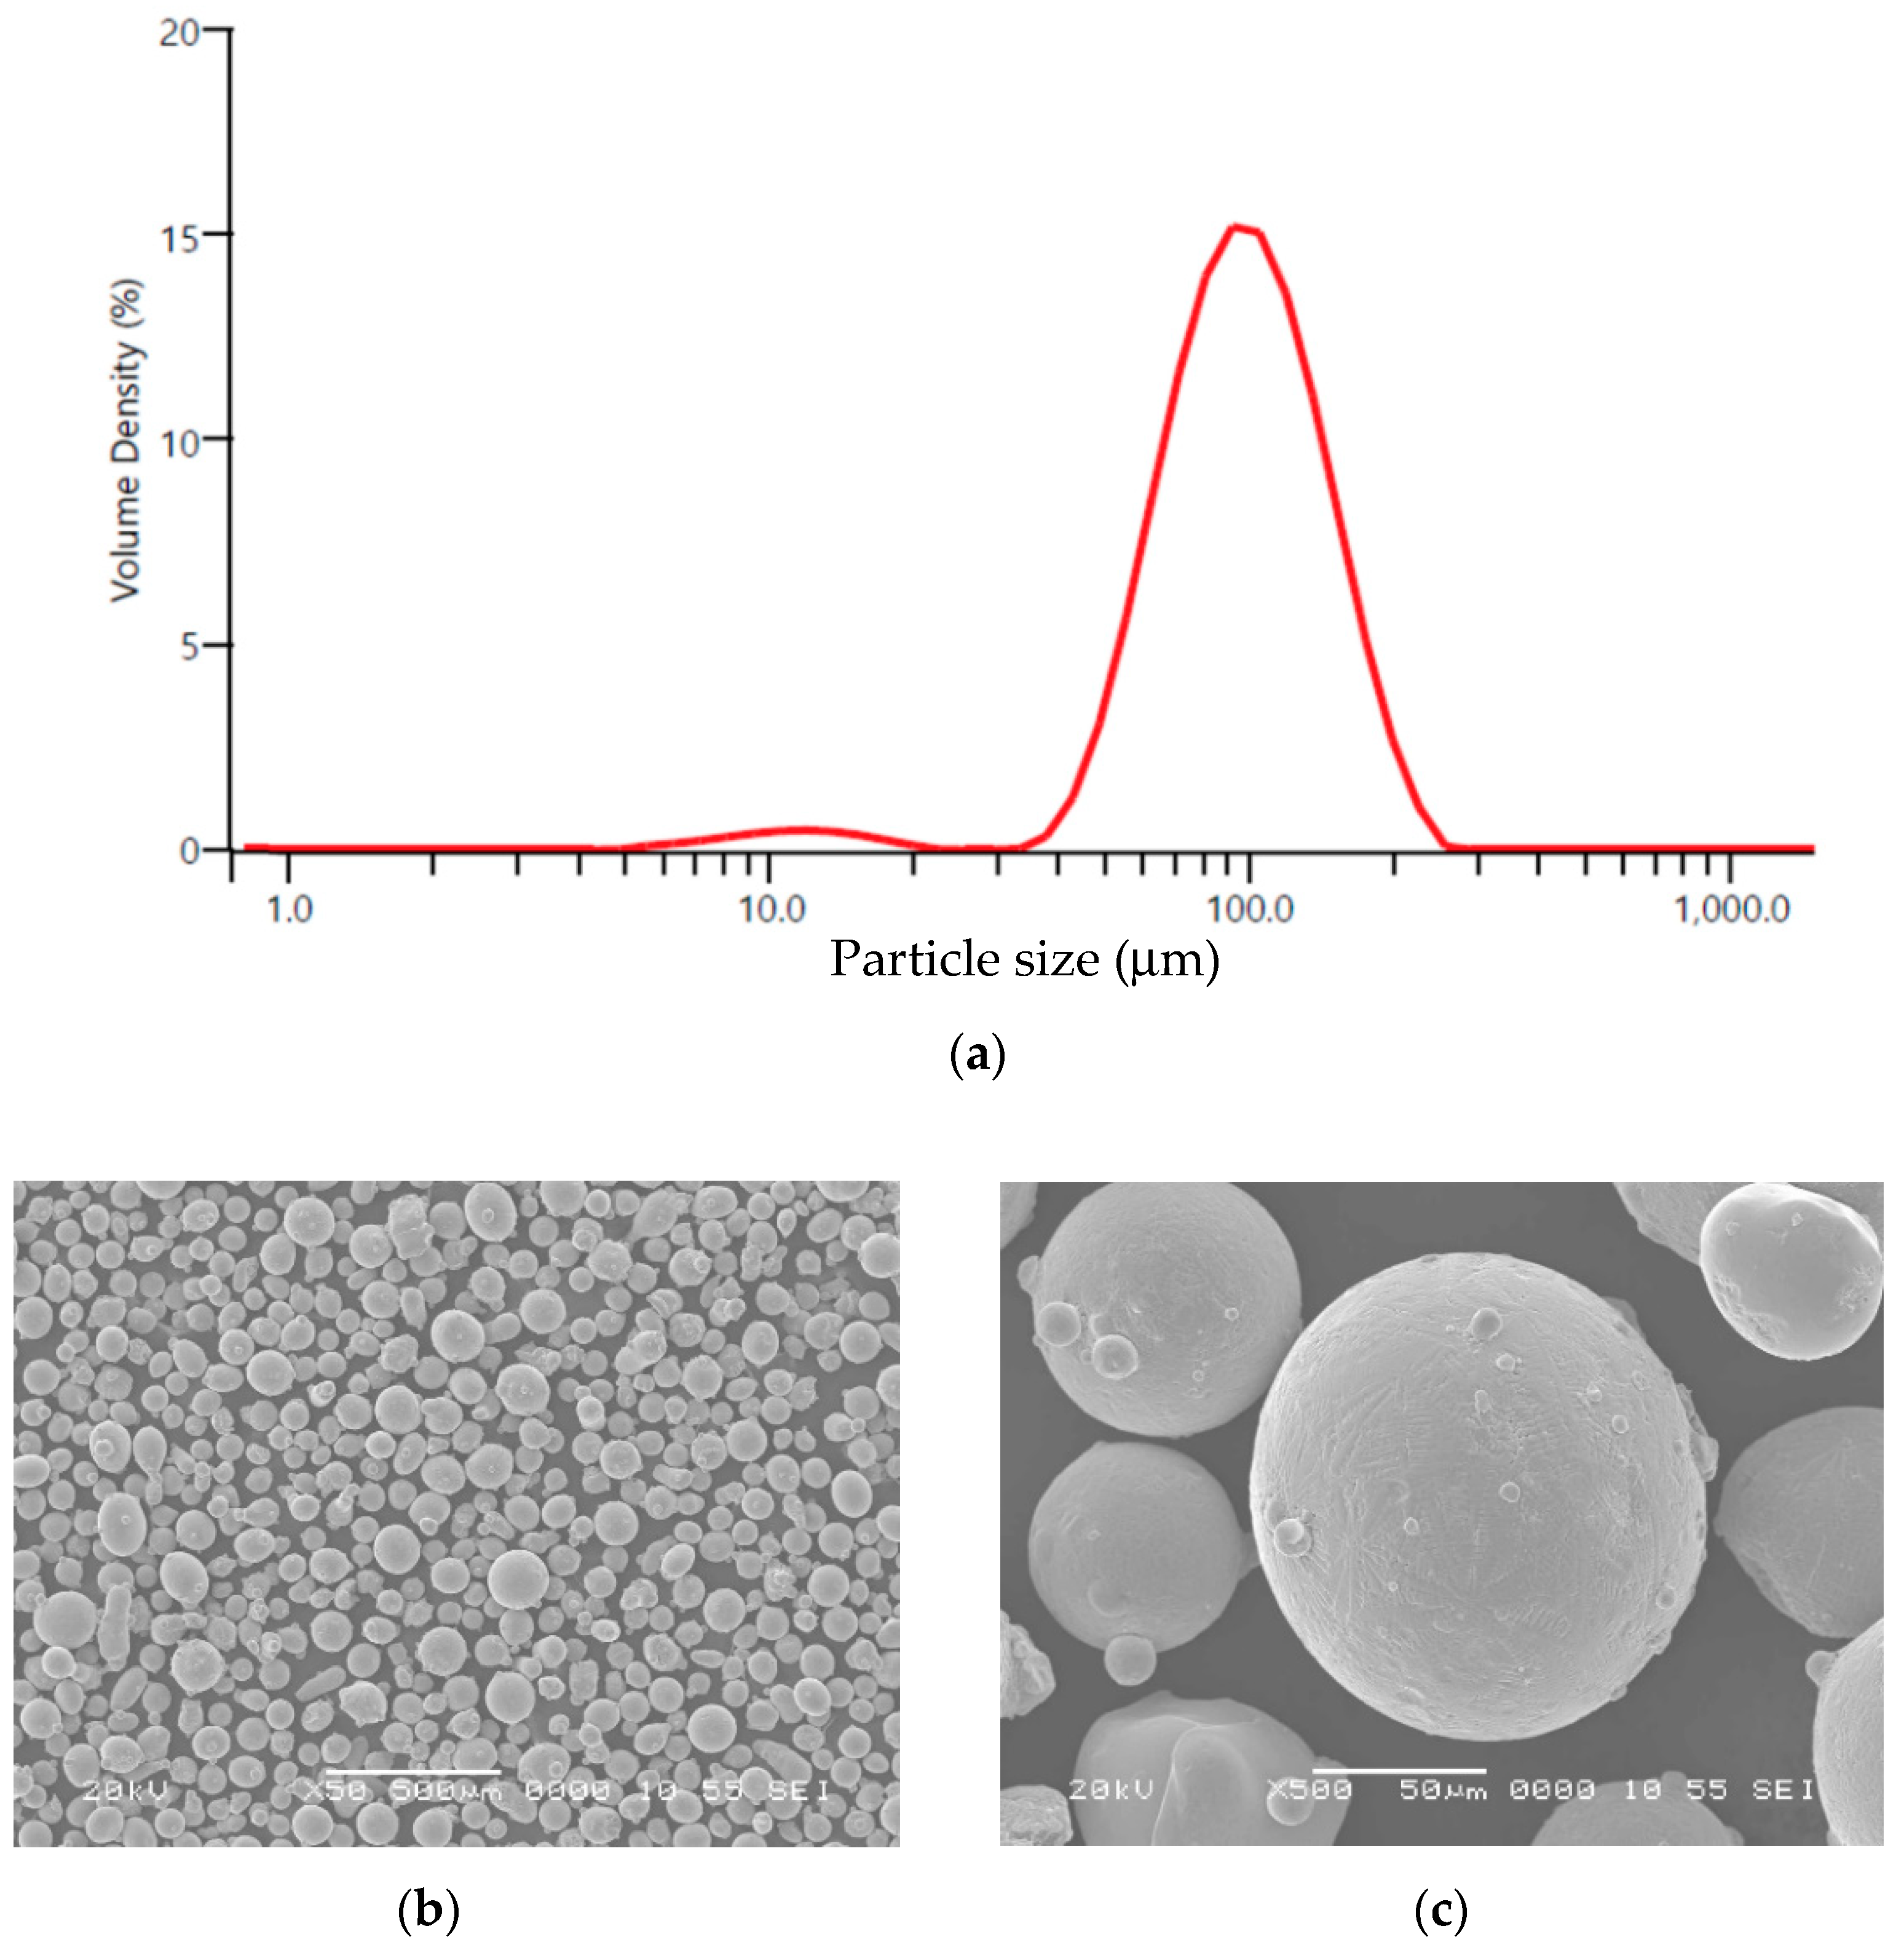
The particle size distribution of INCONEL 718 powder was performed using a Malvern Mastersizer 3000, and the particle morphology was observed via scanning electron microscopy (SEM). Figure 7a shows the particle size distributions for D10, D50, and D90 are 57.1 μm, 95.5 μm, and 155 μm, respectively. Unlike in PBF method, powders with a wide range of particle sizes can be used in the DED process, which is an advantage contributing to the reduction of DED’s manufacturing cost. The powder particle sizes for DED method are similar to those used in powder metallurgy processes, 50–150 μm, and the powder used has a comparable size.
Figure 7b shows SEM images of the INCONEL 718 powders. The overall shape is nearly spherical (Figure 7c), and individual powder particles have a dendritic microstructure, typical results of rapid solidification while some satellites are sticking on the surface of larger particles (Figure 7c).

3.2. DED Printing Machine

Directed energy deposition (DED) is one of AM processes in which a focused energy source (laser beam, electron beam, and plasma arc) is used to form a deposit layer with metal powder or wire. DED offers faster building speed and larger printing size compared to powder bed fusion (PBF) and can bond additional material directly to existing parts.
An InssTek MX-Grande machine (Korea) was used to print the honeycomb patterns. The process parameters required to operate the machine given in Table 5. The laser power was adjusted automatically between 500 and 800 W. The height of the melt pool was analyzed and controlled in real-time using two cameras mounted on the nozzle head. Printing was confined to the surface of the four straight tubes of the RT except for 20 mm at the end of each straight tubes to secure the space needed to weld the straight tubes and U-bends.

3.3. Printing of the Honeycomb Patterns on Prototype (Actual) RT

A commercially available DED printer was used since it can print them on the straight tube with large and curved surfaces. In DED process, powder is laid down in successive layers on the surfaces and melted by varied heat source of powder to produce any shape. In this study, a layer is defined as an individually generated planar and a thin honeycomb shape.
There are two ways to print a set of honeycomb patterns on the surfaces. The first way divides the target height of the honeycomb shapes on the straight tube into a certain number of layers and then each layer is sequentially stacked on top of the printed layers. In this study, the thickness of one layer of the honeycomb shape was 500 μm and therefore, six layers were stacked sequentially to build a 3 mm-high honeycomb. Each layer adhered to the previous layer repeatedly until the target height (3 mm) of the honeycomb was reached. Hereafter, this method is referred to as the ‘layer-priority method’.
The other way divides the straight tube into a certain number of rings in the circumferential direction. The area of outer ring is referred to as section. In this study, the straight tubes were partitioned into 16 sections. The 3 mm-high honeycomb patterns were printed at once in the first section and then the next section’s honeycomb pattern was printed in order. In this fashion, the honeycomb patterns in 16 sections were printed. Hereafter, this way is referred to as the ‘section-priority method’.
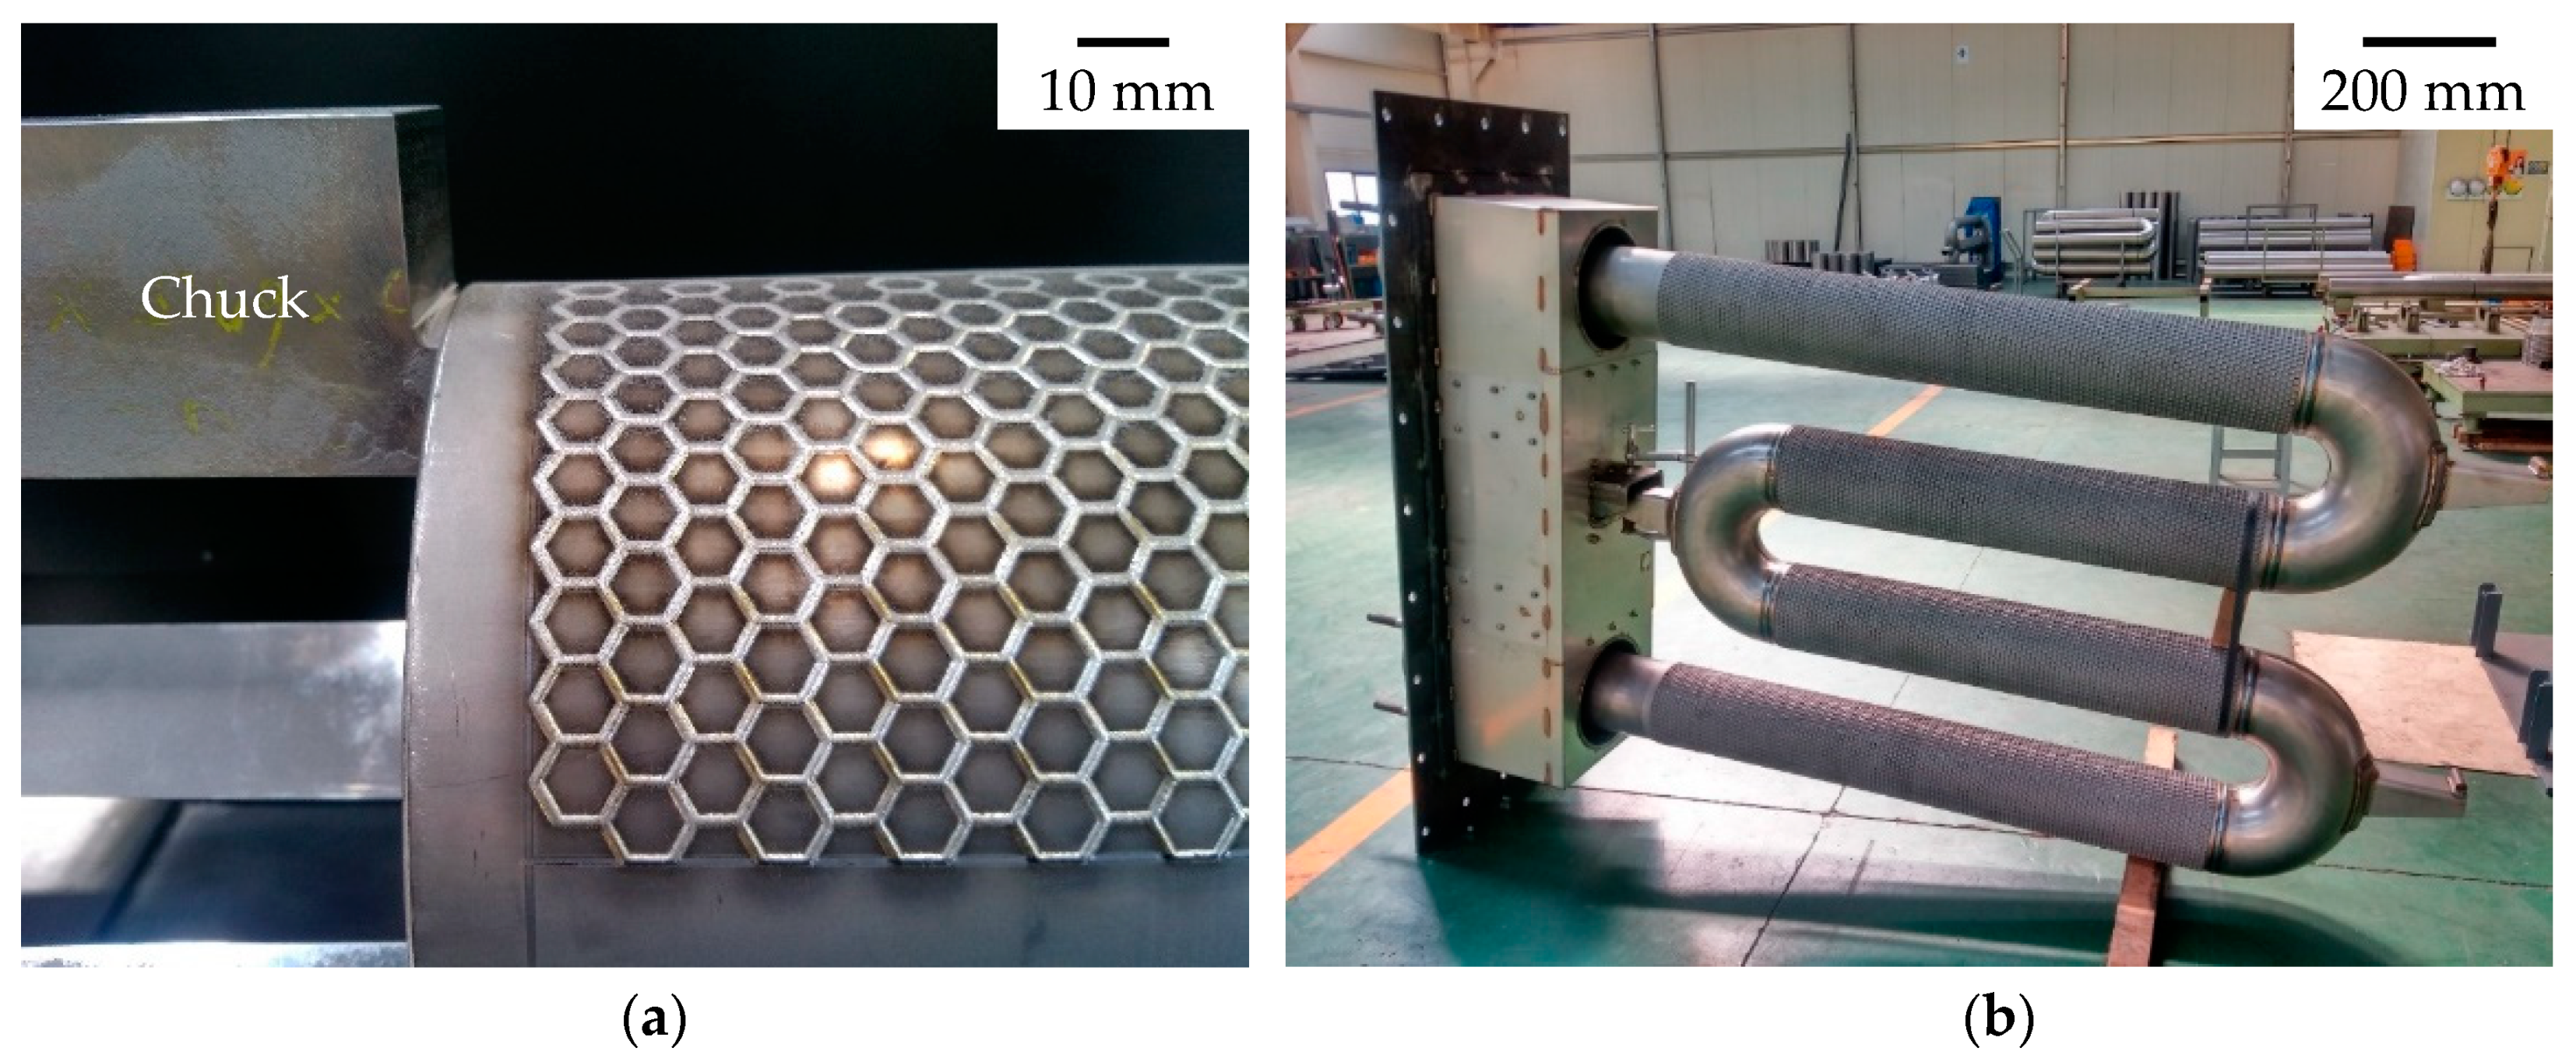
The honeycomb pattern shown in Figure 8a,b was made by the section-priority method. Figure 8a shows the first layer of the honeycomb pattern of the edge section of a 2000 mm long straight tube with a diameter of 190 mm fixed with a rotating chuck, for example. The printer’s head and the chuck move at the same time to print the honeycomb pattern. Figure 8b shows overall view of the prototype RT with the honeycomb pattern printed, which will be installed in the pilot furnace.

3.4. Measurement of Temperature and Fuel Consumption of the Prototype RT

The radiant heat efficiency of the prototype RT with the honeycomb pattern printed was tested using a pilot furnace. Figure 9a shows a schematic of the pilot furnace emulating the actual CAL. This pilot furnace reproduces the situation in which the radiant heat generated by the prototype RT is absorbed by the steel strip. Two full-size (prototype) RTs with and without honeycomb patterns are supported by refractory support at the far end of the chamber and the chamber, i.e., the pilot furnace has an observation window made of heat-resistant glass and an adjustable valve at the air inlet and outlet. The chamber is made of thermal insulation bricks, and its walls are covered with heat-resistant wools. Figure 9b represents each part of the pilot furnace. The ambient temperature inside the test chamber was measured at four positions (#1, 2, 3, 4) 200 mm away from the straight tube where the steel strip is located in the actual CAL. The temperature value at position #2 was used for fuel consumption control during the test. The temperature and gas control system control the ambient temperature by adjusting the amount of fuel consumed by the burner.
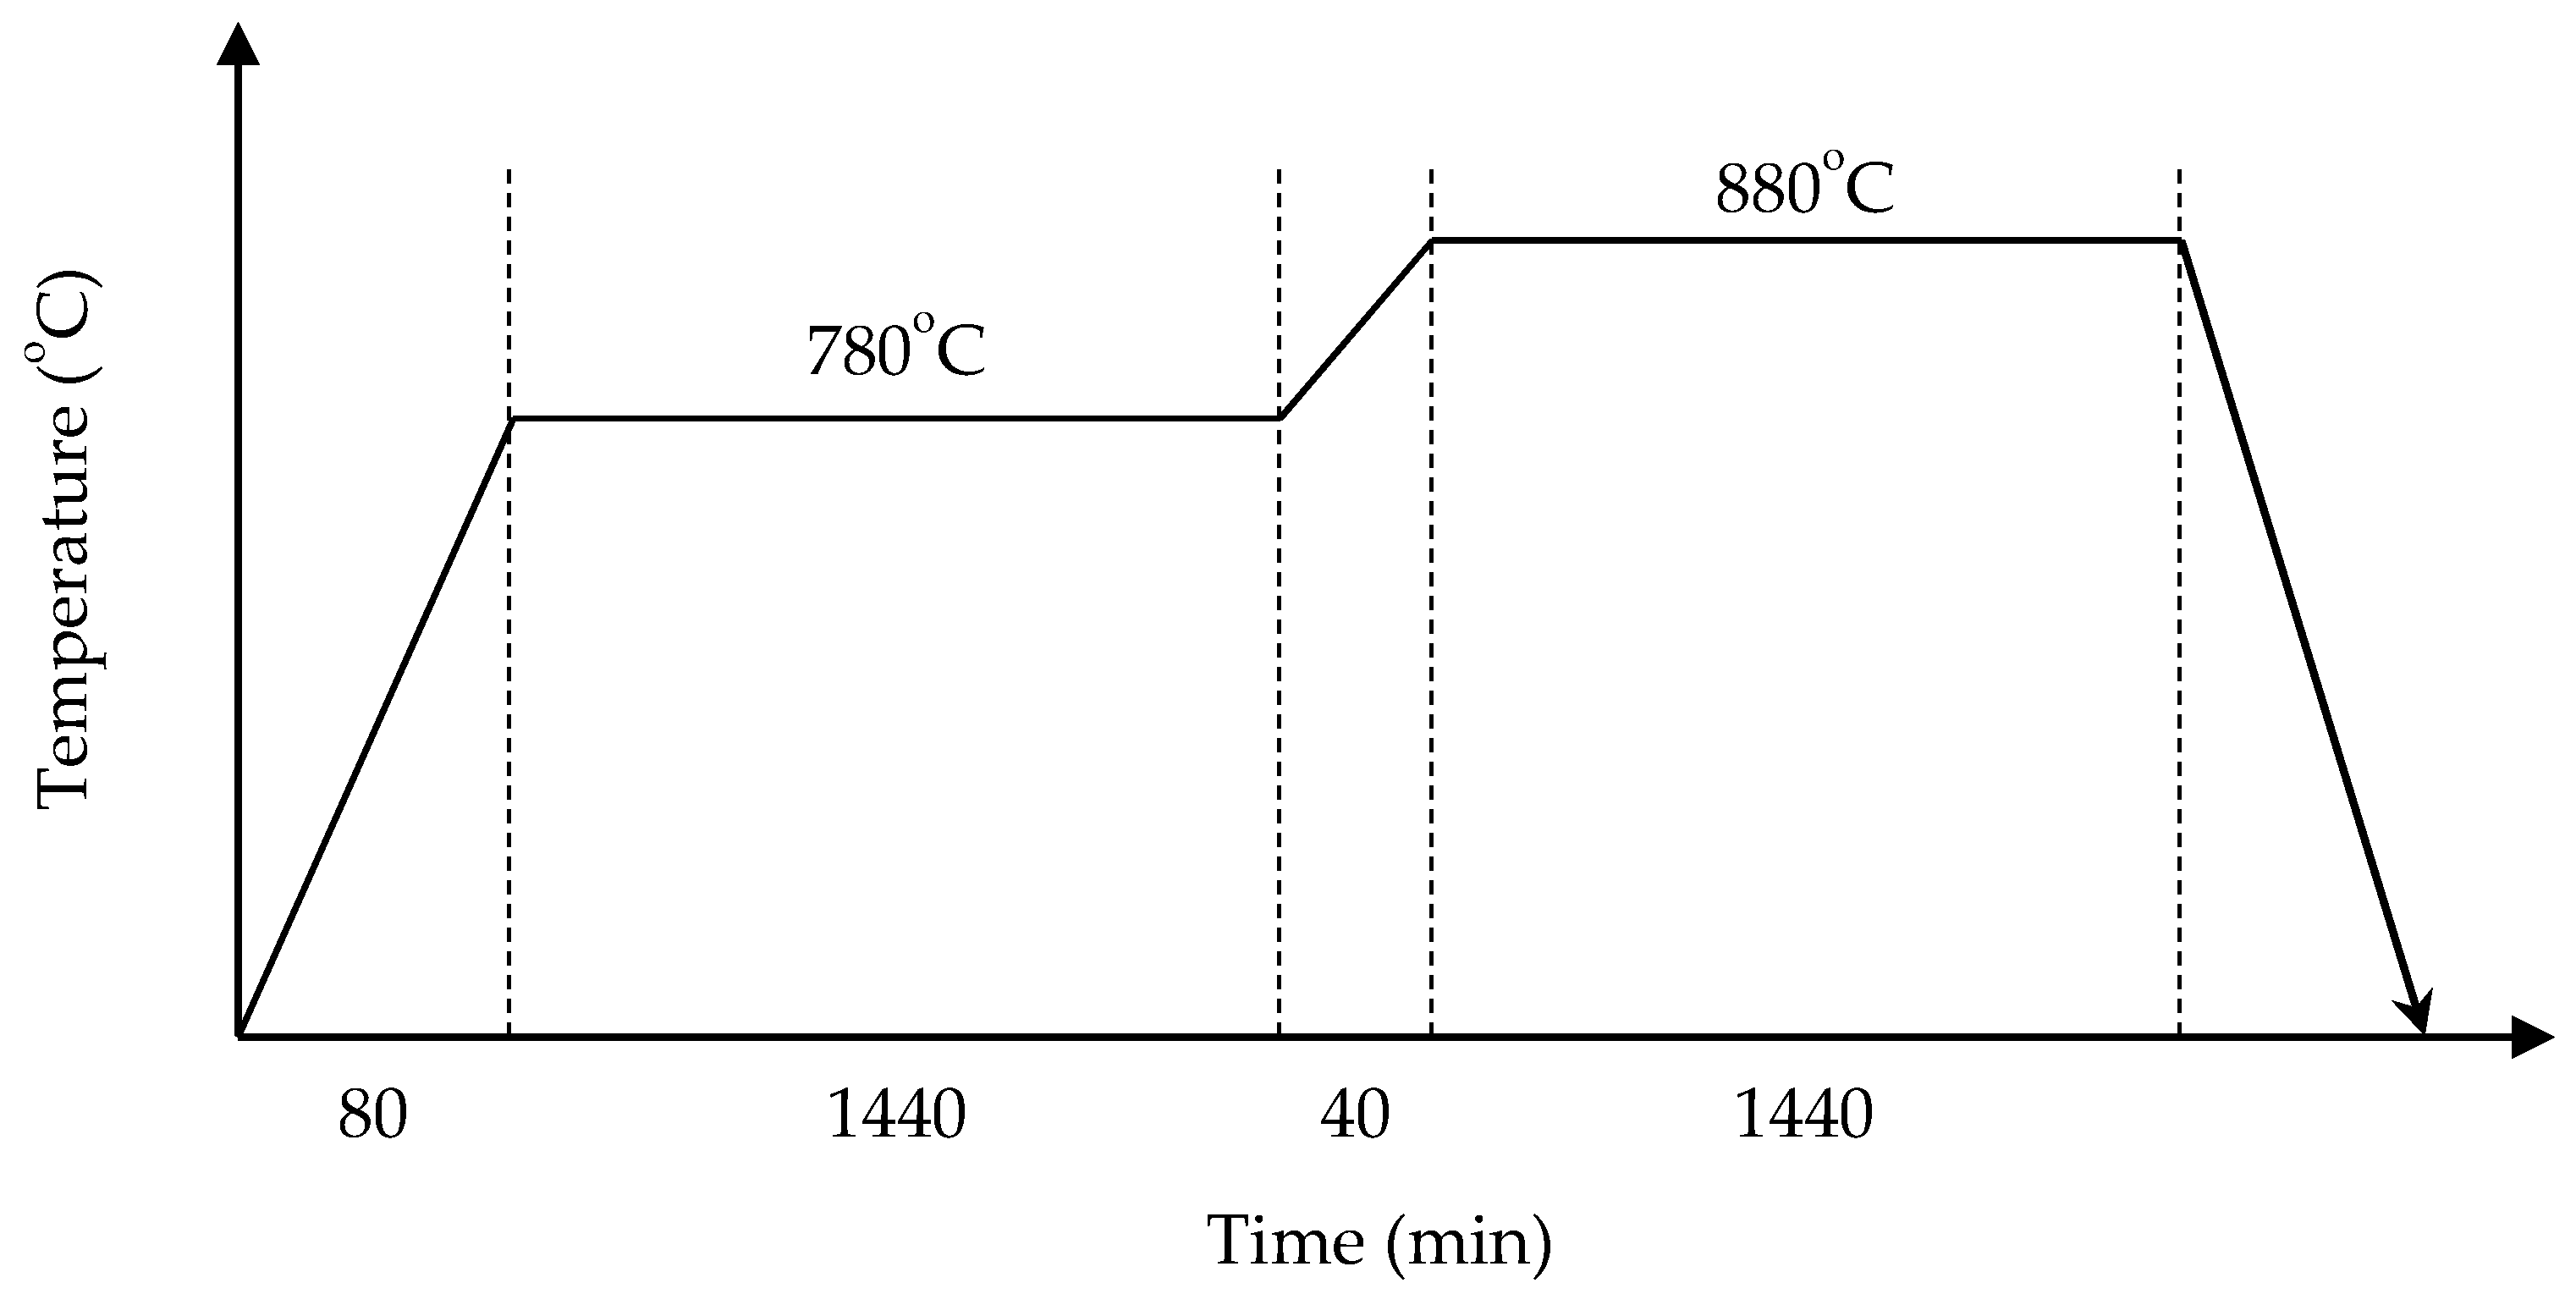
Two prototype RTs with and without honeycomb patterns were operated at the heat cycle, as shown in Figure 10. The two soaking temperatures in the heat cycle are 780 °C and 880 °C, which are two major heat treatment temperatures commonly used in the actual CAL and the soaking time at both 780 and 880 °C was 1440 min (24 h). The variations in fuel consumption were measured while the pilot furnace ambient temperature was maintained for 24 h.

4. Results and Discussion

4.1. 3D Printed Pattern

As mentioned above, when printing a set of the honeycomb structures using the DED printer, two methods were used to prevent the thermal deformation of the thin tube (3 mm thickness) during printing.
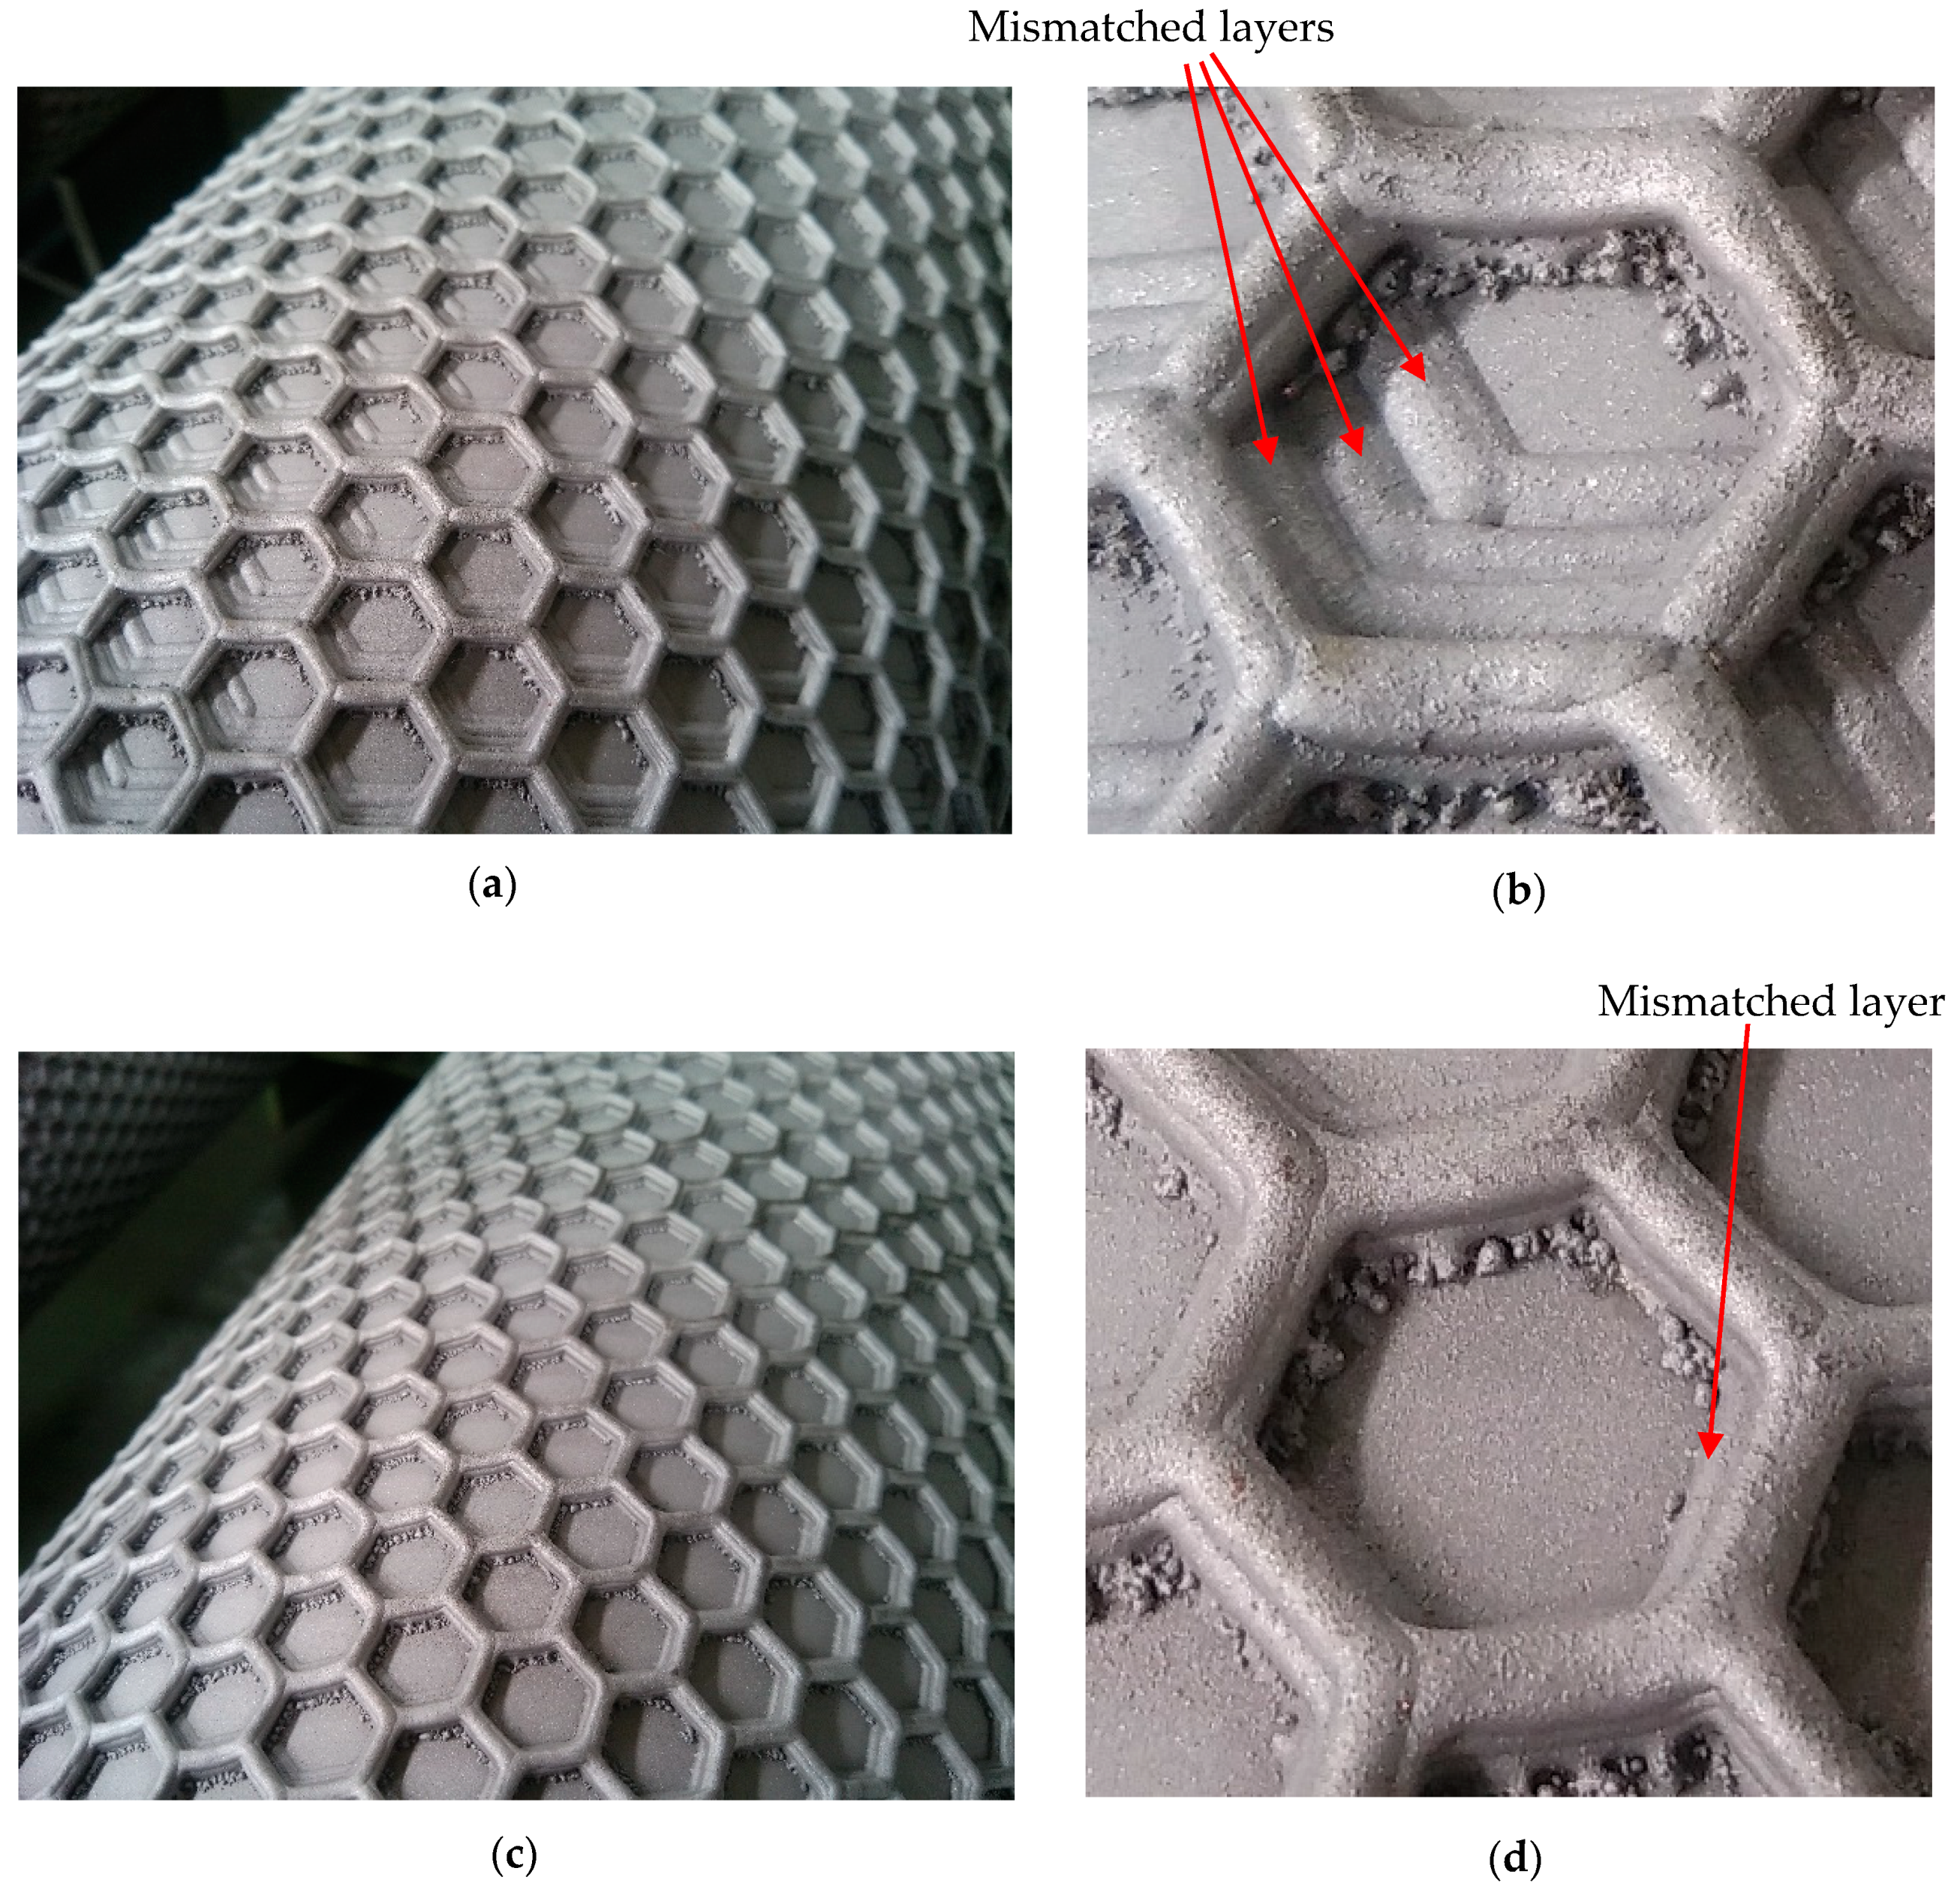
Figure 11a shows the pattern printed by the layer-priority method. The layer-priority method prints each layer section-by-section. Each section is printed far from the previously printed section to prevent thermal concentration. This method was effective for heat dispersion; however, it caused deviations in the position of the later printed layer from the previously printed layer because the entire printing area was heated, and the tube was thermally expanded. Figure 11b is an enlarged picture of the printed pattern using the layer-priority method. Some spatters were observed on the edge. A terraced layer structure was obtained instead of a clear honeycomb structure. This is attributable to the stacking of the printed layer at different times. The amount of thermal expansion of each layers increased as the pattern layer number increased.
Figure 11c shows the honeycomb pattern printed using the section-priority method. Figure 11d is an enlarged picture of the pattern printed by the section-priority method. Although a slight mismatch between the first and the second layer was observed, the whole honeycomb pattern was well printed. In this method, the heat was concentrated on a relatively small area. Therefore, only the heated section was expanded. In the layer-priority method, however, the entire 16 sections were heated for the printing the first layer on all sections; these all 16 sections were expanded. Although the heat input of one section in the section-priority method is higher than that in the layer-priority method, the heated area is smaller, and the layer after the third layer is printed on a fully heated and expanded section. Consequently, the layer mismatch in the section-priority method was smaller than that in the layer-priority method.

4.2. Spatters on the Pattern

The weld spatters at the edge are shown in Figure 11b,d. The weld spatter is a droplet of molten metal that is scattered from the melt pool during the printing. The spatter is attached to the build plate at the initial stage of printing because the position of the melt pool is close to the build plate and the scattered melt droplets are still in a liquid (outside the oxide film and inside the liquid metal) or semi-liquid state when they stick to the build plate. As the printing progresses, the position of the melt pool increases due to the stacking of the printed layer. The scattered melt droplets are solidified before they stick to the build plate as the flying distance of the melt droplets is increased. Therefore, the spatter does not present a severe problem for printing a large independent part because the spatter-attached build plate is removed once the printing is completed.
In the case of printing additional structures or repairing damaged areas on existing parts, however, the position of the melt pool is very close to the parts, and the spatter-attached parts cannot be removed after printing. In this study, the height of a single-layer of the honeycomb pattern is 500 μm and therefore the pattern height is only 3 mm. Furthermore, the preprinted layer near the printing position acts as a barrier and blocks the flying spatters. The short flying distance of the melt droplets due to the low melting position and the blocking caused by the preprinted layer seems to be the main reasons for the spatters inside the honeycomb patterns. Remaining spatters, which are not strongly attached to the tube’s surface, might be detached during operation. The detached spatters can cause dent or scratch defects on the strip due to RTs’ location. The number of spatters can be reduced by controlling process variables, such as laser power and printing speed. The spatters on the tube were removed by sandblasting and manual grinding before the final assembly.

4.3. Temperature and Fuel Consumption Measurement in the Pilot Furnace

Figure 12 shows the measured temperature and cumulative gas (fuel) consumed during the entire heat cycle as shown in Figure 10. The hollow circles indicate the temperatures at position #2 in Figure 9b recorded to control the fuel consumption, and the solid lines denote the amount of cumulative gas consumed. The symbols and lines marked in red are for the plain RT (RT without honeycomb pattern) and those marked in blue are for the honeycomb pattern-printed RT. The temperature changes for both plain RT and honeycomb pattern printed RT follow almost the same evolution because the temperature control system worked correctly. The amount of cumulative gas consumed to maintain a given temperature, however, was different. The amount of cumulative gas consumed for the honeycomb pattern-printed RT is clearly smaller than that of the plain RT. The difference in the amount of cumulative gas consumed between plain and honeycomb pattern printed RT increased with time and soaking temperature.
Table 6 summarizes the values of the set-up temperatures, measured temperatures, gas consumed for the soaking time, and gas consumed for the entire heat cycle. When the plain surface RT was run, the average amount of gas consumed to maintain the set-up temperature (780 °C and 880 °C) for the soaking time (14,400 min) was 48 m3 and 65 m3, respectively. The gas consumed for the entire heat cycle (3000 min) was 118 m3.
By contrast, when the RT with honeycomb pattern printed was run, the amount of gas consumed to maintain the set-up temperature (780 °C and 880 °C) for 14,400 min was 43 m3 and 57 m3, respectively. It was observed that the gas usage for each soaking time was reduced. The gas consumed for the entire heat cycle was 105 m3. When the gas consumption for each soaking time of the two types of RTs was compared, the RT with honeycomb pattern printed consumed 10.42% at 780 °C and 12.31% at 880 °C less gas than the plain RT, respectively. The averaged gas usage was reduced by 11.02% when comparing the gas consumption of the two RTs on the entire heat cycle basis. Both results show that the radiant heat efficiency of the RT is increased by the addition of the honeycomb patterns.

4.4. Soundness Test of the Prototype RT with Honeycomb Patterns Printed

The actual CAL consists of three zones: heating, soaking, and cooling. Hence, the metal powder used to create the honeycomb patterns should be able to maintain a high bond strength between the pattern and the RT’s surface, and prevent the separation of honeycomb patterns from the RT surface when the RTs are heated and cooled repeatedly. Each zone has tens of RTs, and almost 200 RTs are in the No. 3 CAL in POSCO Gwangyang Steel Works. To investigate soundness of the prototype RT with honeycomb patterns printed, it was installed in the No. 3 CAL in POSCO Gwangyang Steel Works and remained operational for over three years.
The separation of printed patterns and the honeycomb pattern shape were checked in an annual inspection over three years. The shapes of every honeycomb pattern at four straight tubes remained intact, and no separation of the honeycomb pattern from the prototype RT surface was observed. No pressure loss occurred during operation, and no combustion gas leaked from the inside to the outside of the RT. Thus, the integrity of prototype RT has been verified and the DED method adopted in this study for printing the honeycomb pattern on RT surface proves to be acceptable.

5. Conclusions

In this study, a method and procedure for applying AM technology to reduce the fuel consumption of a W-type RT installed on a CAL has been presented. The design variables of the honeycomb pattern printed on the RT surface were calculated by FE analysis of radiant heat transfer. The actual size prototype honeycomb pattern was printed on the RT surface by the DED. The thermal performance evaluation of the RT with honeycomb pattern printed was done at the pilot furnace and the RT was installed in the actual CAL in POSCO Gwangyang Steel Works to examine its practical applicability and soundness. Following are the main conclusions of this study:
(1) The radiant heat efficiency of the RT with honeycomb pattern printed was increased by 10.42% and 12.31% compared to that of plain RT for each soaking time, which indicates that honeycomb pattern printed RT proposed in this study is good enough to be used in the actual CAL in steelmaking industry. (2) The DED method adopted for printing the honeycomb pattern on RT surface was appropriate for objects with large and curved surfaces. (3) Since the honeycomb pattern created by the DED has sufficient adhesion strength between the pattern and the RT surface, the DED has no problem in applying it to the RT being used in repeated heating and cooling environments.

Author Contributions

Conceptualization and investigation, W.H. and Y.L.; formal analysis and validation, Y.R. and Y.L. writing—original draft preparation, W.H.; writing—review and editing, Y.L.; visualization, Y.R.; supervision, Y.L.; project administration, J.H.; funding acquisition, J.H. All authors have read and agreed to the published version of the manuscript.

Funding

This research was funded by POSCO, grant number 2015A036.

Conflicts of Interest

The authors declare no conflict of interest.

References

  1. DebRoy, T.; Wei, H.L.; Zuback, J.S.; Mukherjee, T.; Elmer, J.W.; Milewski, J.O.; Beese, A.M.; Wilson-Heid, A.; De, A.; Zhang, W. Additive manufacturing of metallic components—Process, structure and properties. Prog. Mater. Sci. 2018, 92, 112–224. [Google Scholar] [CrossRef]
  2. Niaki, M.K.; Torabi, S.A.; Nonino, F. Why manufacturers adopt additive manufacturing technologies: The role of sustainability. J. Clean. Prod. 2019, 222, 381–392. [Google Scholar] [CrossRef]
  3. Ngo, T.D.; Kashani, A.; Imbalzano, G.; Nguyen, K.T.Q.; Hui, D. Additive manufacturing (3D printing): A review of materials, methods, applications and challenges. Compos. Part B Eng. 2018, 143, 172–196. [Google Scholar] [CrossRef]
  4. Hosseini, E.; Popovich, V.A. A review of mechanical properties of additively manufactured Inconel 718. Addit. Manuf. 2019, 30, 100877. [Google Scholar] [CrossRef]
  5. Wang, X.; Chou, K. Electron Backscatter Diffraction Analysis of Inconel 718 Parts Fabricated by Selective Laser Melting Additive Manufacturing. JOM 2017, 69, 402–408. [Google Scholar] [CrossRef]
  6. Additive, G.E. New Manufacturing Milestone: 30,000 Additive Fuel Nozzles. 2018. Available online: https://www.ge.com/additive/stories/new-manufacturing-milestone-30000-additive-fuel-nozzles (accessed on 16 November 2020).
  7. Andrew, J.J.; Ubaid, J.; Hafeez, F.; Schiffer, A.; Kumar, S. Impact performance enhancement of honeycombs through additive manufacturing-enabled geometrical tailoring. Int. J. Impact Eng. 2019, 134, 103360. [Google Scholar] [CrossRef]
  8. Großmann, A.; Weis, P.; Clemen, C.; Mittelstedt, C. Optimization and re-design of a metallic riveting tool for additive manufacturing—A case study. Addit. Manuf. 2020, 31, 100892. [Google Scholar]
  9. Merulla, A.; Gatto, A.; Bassoli, E.; Munteanu, S.I.; Gheorghiu, B.; Pop, M.A.; Bedo, T.; Munteanu, D. Weight reduction by topology optimization of an engine subframe mount, designed for additive manufacturing production. Mater. Today Proc. 2019, 19, 1014–1018. [Google Scholar] [CrossRef]
  10. Shi, G.; Guan, C.; Quan, D.; Wu, D.; Tang, L.; Gao, T. An aerospace bracket designed by thermo-elastic topology optimization and manufactured by additive manufacturing. Chin. J. Aeronaut. 2019, 33, 1252–1259. [Google Scholar] [CrossRef]
  11. [worldsteel] Air Quality Management. Available online: https://newsroom.posco.com/en/worldsteel-air-quality-management/ (accessed on 16 November 2020).
  12. Flamme, M.; Milani, A.; Wünning, J.; Blasiak, W.; Yang, W.; Szewczyk, D.; Sudo, J.; Mochida, S. Radiant Tube Burners. In Industrial Combustion Testing; Taylor & Francis Group: Abingdon, UK, 2010; pp. 487–504. [Google Scholar]
  13. Zhong, G.; Wang, D.; Wu, D. Application of Double-regenerative Radiant Tube Technology on Roller Hearth Normalizing Furnace. Phys. Procedia 2015, 66, 201–204. [Google Scholar] [CrossRef] [Green Version]
  14. Scribano, G.; Solero, G.; Coghe, A. Pollutant emissions reduction and performance optimization of an industrial radiant tube burner. Exp. Therm. Fluid Sci. 2006, 30, 605–612. [Google Scholar] [CrossRef]
  15. Zhang, H.; Zhu, H. Design and experimental test of a novel surface blackbody with honeycombs. In Proceedings of the 2010 International Forum on Strategic Technology (IFOST 2010), Ulsan, Korea, 13–15 October 2010; pp. 361–364. [Google Scholar]
  16. Manual, A.U. Abaqus Theory Guide. Version 6.14; Dassault Systemes SIMULIA Corporation: Boulder, CO, USA, 2014. [Google Scholar]
  17. Končar, B.; Draksler, M.; Costa Garrido, O.; Meszaros, B. Thermal radiation analysis of DEMO tokamak. Fusion Eng. Des. 2017, 124, 567–571. [Google Scholar] [CrossRef]
  18. Jang, J.Y.; Guo, J.W.; Chang, C.C. The heat transfer analysis of an acting-type heat retention panel used in a hot rolling process. Appl. Sci. 2019, 9, 189. [Google Scholar] [CrossRef] [Green Version]
  19. Bergman, T.L.; Incropera, F.P.; DeWitt, D.P.; Lavine, A.S. Fundamentals of Heat and Mass Transfer; John Wiley & Sons: Hoboken, NJ, USA, 2011; ISBN 0470501979. [Google Scholar]
  20. Končar, B.; Costa Garrido, O.; Draksler, M.; Brown, R.; Coleman, M. Initial optimization of DEMO fusion reactor thermal shields by thermal analysis of its integrated systems. Fusion Eng. Des. 2017, 125, 38–49. [Google Scholar] [CrossRef]
  21. Irfan, M.; Chapman, W. Thermal stresses in radiant tubes: A comparison between recuperative and regenerative systems. Appl. Therm. Eng. 2010, 30, 196–200. [Google Scholar] [CrossRef]
Figure 1. (a) Appearance and size of an actual radiant tube (RT). (b) A set of pratt truss patterns generated on a part of straight tube surface. (c) A set of honeycomb patterns generated on a part of straight tube surface. (d) Schematic of a honeycomb and design variables. ‘w’ represents the width of honeycomb grid. l 1 and l 2 stands for the inner and outer length of the honeycomb.
Applsci 10 08132 g001
Figure 2. Schematic representation of the view factor.
Applsci 10 08132 g002
Figure 3. (a) Isometric view of the partial FE model (b) Steel trip (c) Front view of the partial FE model.
Applsci 10 08132 g003
Figure 4. Measured temperature profile in the length direction of the actual RT.
Applsci 10 08132 g004
Figure 5. View factor curve used in the FE analysis.
Applsci 10 08132 g005
Figure 6. (a) Honeycomb design variables (left). The partial FE model with honeycomb patterns printed (right). (bd) denotes the dimensions of the honeycomb structures used in the FE analysis. ‘t’ denotes the height of honeycomb grid in the tube radius direction. (eg) indicate the contour of RADTLA, time integrated radiation heat per unit area (J/s) for three honeycomb structures right above.
Applsci 10 08132 g006
Figure 7. (a) Volume based particle size distribution of INCONEL 718 powders (b) SEM image of INCONEL 718 powder with low magnification (c) SEM image of INCONEL 718 powder with high magnification.
Applsci 10 08132 g007
Figure 8. (a) The first printed layer of honeycomb pattern of the edge section of a 2000 mm long straight tube. (b) The honeycomb patterns were printed on the surface of the straight tube of the prototype RT to be installed in the pilot furnace.
Applsci 10 08132 g008
Figure 9. (a) Schematic of the pilot furnace that evaluates radiant heat efficiency of full-size RTs with and without honeycomb patterns. (b) Description of each component in the pilot furnace.
Applsci 10 08132 g009
Figure 10. The variations in the heat treatment temperature and holding time (heat cycle) commonly adopted in the pilot furnace.
Applsci 10 08132 g010
Figure 11. Honeycomb patterns printed by the layer-priority method. (a) Full view and (b) enlarged view. Honeycomb patterns printed by the section-priority method. (c) Full view and (d) enlarged view.
Applsci 10 08132 g011
Figure 12. Measured temperature and cumulative gas consumed for plain (no honeycomb pattern printed) and honeycomb pattern printed RT.
Applsci 10 08132 g012
Table 1. Mechanical and thermal properties of INCONEL 601 at 900 °C.
PropertiesValues
Elastic modulus (GPa)140
Poisson’s ratio0.3
Mass density (kg/ m 3 )8050
Yield strength (MPa)105
Tensile strength (MPa)125
Elongation (%)120
Thermal expansion coefficient, α (1/°C)17.1   × 10 6
Thermal conductivity (W/m⋅°C)11.2
Specific heat (J/kg⋅°C)460
Table 2. Chemical composition (% mass) of INCONEL 718 alloy powder provided by Carpenter Technology Corporation.
FeNi + CoCrNb + TaMoTiCoAlSiMnCuCSPB
Bal.50.00–55.0017.00–21.004.75–5.502.80–3.300.65–1.15≤1.000.35–0.80≤0.35≤0.35≤0.15≤0.08≤0.015≤0.0150.001–0.006
Table 3. High temperature strength of INCONEL alloy candidates.
Temperature (°C)Tensile Strength (MPa)Yield Strength (0.2% Offset) (MPa)
INCONEL 625INCONEL 718INCONEL 625INCONEL 718
6491010.1-734.3-
704-1006.6-930.8
760584.7851.5544.7799.8
816-723.9-689.5
871284.1-275.8-
Table 4. Thermal expansion coefficient of INCONEL alloy candidates.
Temperature (°C)Thermal Expansion Coefficient (1/°C)
INCONEL 601INCONEL 625INCONEL 718
60015.62--
649-14.815.1
70016.11--
760-15.316
80016.67--
Table 5. DED process parameters used for printing INCONEL 718.
MaterialLaser Power (W)Powder Supply Rate (g/min)Printing Speed (mm/min)Shield Gas (Ar) Supply Rate (L/min)Layer Thickness (μm)
INCONEL 718500–80059005500
Table 6. The average amount of gas consumed to maintain 780 °C and 880 °C for 1440 min and for an entire heat cycle (3000 min).
Honeycomb PatternSet-up TemperatureMeasured TemperatureGas Consumed for the Soaking TimeGas Consumed for the Whole Heat Cycle
Without780 °C782 °C48 m3118 m3
880 °C882 °C65 m3
With780 °C783 °C43 m3105 m3
880 °C882 °C57 m3
Publisher’s Note: MDPI stays neutral with regard to jurisdictional claims in published maps and institutional affiliations.

