Article

Measuring the Lighting Quality in Academic Institutions: The UPM Faculty of Aerospace Engineering (Spain)

by
María Zamarreño-Suárez
1,
Daniel Alcala-Gonzalez
2,
Daniel Alfonso-Corcuera
1 and
Santiago Pindado
1,*
1
Instituto Universitario de Microgravedad “Ignacio Da Riva” (IDR/UPM), ETSI Aeronáutica y del Espacio, Universidad Politécnica de Madrid, Pza. del Cardenal Cisneros 3, 28040 Madrid, Spain
2
Departamento de Ingeniería Civil: Hidráulica y Ordenación del Territorio, ETSI Civil, Universidad Politécnica de Madrid, Alfonso XII 3, 28014 Madrid, Spain
*
Author to whom correspondence should be addressed.
Submission received: 21 October 2020 / Revised: 11 November 2020 / Accepted: 19 November 2020 / Published: 24 November 2020

Abstract

:
This article analyzes the current status of the lighting quality at the Escuela Técnica Superior de Ingeniería Aeronáutica y del Espacio (ETSIAE), the aerospace engineering faculty at the Universidad Politécnica de Madrid (UPM), and evaluates possible improvement actions based on the use of DIALux® lighting simulation software together with measured data. The results show rather low levels of measured illuminance on classroom desks and blackboards in one of the buildings comprising the faculty. The improvements proposed (a new coat of paint on the walls and replacement of luminaires) were simulated in four individual classrooms representing all rooms in two of the ETSIAE buildings (where the lower illuminance levels were measured). In order to study these improvements, the current situation of the four selected classrooms was simulated using DIALux® and fine-tuning attenuation of the luminaires to take into account their wear and tear. The correlation between the DIALux® simulation and the test results was analyzed with quite good results. The results clearly reveal a need to fully replace the classroom lighting systems in ETSIAE building A (the oldest building, dating back to 1955). According to the results from the selected classrooms, the average lighting over the desks can be greatly improved by using LED technology in order to meet UNE 12464-1 standard (that is, 500 lx, from an initial situation with much lower illuminance values: 129 lx to 295 lx). This article represents an innovative way to perform lighting improvement projects as real measured lighting data is used as initial input for the lighting simulations.

1. Introduction

The importance of proper lighting conditions (i.e., visual comfort) at academic institutions has been emphasized at all levels, from elementary, primary, and secondary education schools [1,2,3,4,5,6] to university faculties [7,8,9,10,11,12,13,14,15,16]. In general, it can be said that comfort in academic environments has been widely analyzed as it has important effects on learning. On this subject and attending to the available literature, three main different aspects can be underlined in first place: thermal comfort, noise comfort, and visual comfort [12,14,17]. After them, other less relevant aspects such as wall colors, furniture, spatial arrangements, ventilation, etc. can also be added when analyzing the aforementioned comfort in academic institutions [4,10,12,13,15]. Visual comfort mainly depends on lighting. However, it is somehow affected by thermal and noise levels [14,17].
In the available literature, some examples were found of lighting analysis in classrooms and other academic environments [8,18,19,20,21,22,23]. Some of these focused mainly on energy costs and efficiency [18,20,21,23], as lighting represents about 20% of the world’s demand for electrical energy production [23]. On the other hand, many analyses on visual comfort and the effects of lighting seem to be based on surveys/interviews rather than measuring the illuminance levels [5,6,11,12,15]. Even those works that reflect lighting measurements include surveys [13,16,24,25], adding subjective (and statistical) factors to the study.
Many of the studies on lighting similar to the present one found in the available literature were conducted using DIALux® [8,19,20,21,22,23], although it seems that there are many possibilities when it comes to lighting simulation tools [26,27,28,29]. However, leaving aside some works related to validation of lighting analysis software [30,31,32,33], there seems to be a lack of studies evaluating the accuracy in the prediction of actual lighting results. Finally, it is worth mentioning the quite high accuracy in artificial lighting simulations (0.5% average error) reported by Maamari et al. [33].
This paper discusses the results of research conducted on the current lighting in the classrooms of the Universidad Politécnica de Madrid (UPM) Faculty of Aerospace Engineering (Escuela Técnica Superior de Ingeniería Aeronáutica y del Espacio (ETSIAE), see Section 2) without daylight (that is, during evening/night periods and with the window blinds lowered) and analyzes different proposals for improving it. To this end, illuminance was measured on student desks and blackboards in 39 classrooms, including those used for exams. This study excludes other areas of the faculty with special characteristics, such as the library, computer rooms, laboratories, and other common areas. It was considered relevant to focus on this group of classrooms, where students and instructors spend most of their time and where lighting quality is most crucial. Measurements were carried out by measuring the illuminance levels on the selected surfaces (blackboards and desks) with a lux meter. This is a quite direct and simple technique that allowed a first evaluation of a quite relevant problem. However, it is somehow limited when compared to High Dynamic Range (HDR) imaging technology [24,25,34,35], as it does not give other interesting variables such as glare.
In addition, it should also be said that the selection of illuminance as a lighting-quality variable has some drawbacks, as it might not correlate well with perceived brightness or visual comfort. Cuttle [36] suggested the use of the Perceived Adequacy of Illumination (PAI) as an alternative to minimum illuminance levels in standards, this concept of lighting being quantified by Mean Room Surface Exitance (MRSE) as a control variable. Besides, some studies show limitations of illuminance as the proper variable to define the adequacy of indoor lighting [37,38] and others show new lighting-quality metrics being required if health is taken into account when designing work environments [39], whereas other studies propose that the proper illumination on artwork needs to be specifically defined [40,41].
The aim of the present work is to propose a lighting analysis technique that may ensure the compliance of lighting upgrade projects with UNE 12464-1 standard, which regulates lighting projects in working environments. Taking into account that, based on this standard, visual quality is only quantitatively ensured by
  • the illuminance value,
  • the color rendering index,
  • the illuminance uniformity index, and
  • the Universal Glare Rating value,
illuminance was selected as a control variable in the present work.
Leaving aside the illuminance measurements taken in the classrooms, the most original contribution from the present work is the DIALux® calibration/tuning carried out by comparison between the data from the simulation of the present situation and the measurements. After this calibration and validation, three different lighting improvement actions were studied. To the best of the authors’ knowledge, no study of this type had ever been conducted at ETSIAE or any other faculties at the Universidad Politécnica de Madrid (UPM). It is worth emphasizing the lack of renovation with regard to lighting quality in the oldest building at ETSIA (building A, dating back to 1955), despite the importance of lighting maintenance as one of the categories which influence building environment condition [42].
The paper is organized as follows: Section 2 describes the instrumentation and methodology used in the measurement campaign and subsequent simulations. Section 3 discusses the results and shows the actual current situation of the classroom lighting, along with the expected situation after implementing the proposed improvements. Finally, Section 4 summarizes the conclusions.

2. Materials and Methods (Testing and Simulation Methodologies)

The Escuela Técnica Superior de Ingeniería Aeronáutica y del Espacio (ETSIAE) at the Universidad Politécnica de Madrid (UPM) is the university’s aerospace engineering faculty. It was created by merging two older engineering schools within the same university: the Escuela Técnica Superior de Ingenieros Aeronáuticos (ETSIA) and the Escuela Universitaria de Ingeniería Técnica Aeronáutica (EUITA). This followed the university’s implementation of the new degree programs regulated by Royal Decree 1393/2007, within the framework of the European Higher Education Area. The available data, from academic year 2016–2017, indicate a total of 3468 students. This makes the ETSIAE one of the UPM’s largest faculties, with a surface area of 36,500 m2, 240 professors and researchers, and 140 service and administrative staff.
Following the renovations undertaken in recent years, ETSIAE has four buildings dedicated to teaching, known as buildings A, B, C, and E (see Figure 1). Due to the high number of students at the school and the degree programs offered and depending on the time of year, it is normal for many students to spend all or part of their school day using only artificial lighting, with the visual fatigue that this entails. For this reason, it is essential for classroom lighting to meet regulatory requirements [43] in order to be suitable for the tasks performed at this faculty.
This study comprises several successive steps, starting with measurement of the present illumination levels (i.e., illuminance, E) of a significant number of ETSIAE classrooms. Four different types of classrooms were then selected as representative of the entire set, and the current situation was reproduced using DIALux® lighting simulation software. Once the current situation in the selected classrooms was properly simulated, three proposals for improvement were analyzed, using as reference the simulation of the current situation.

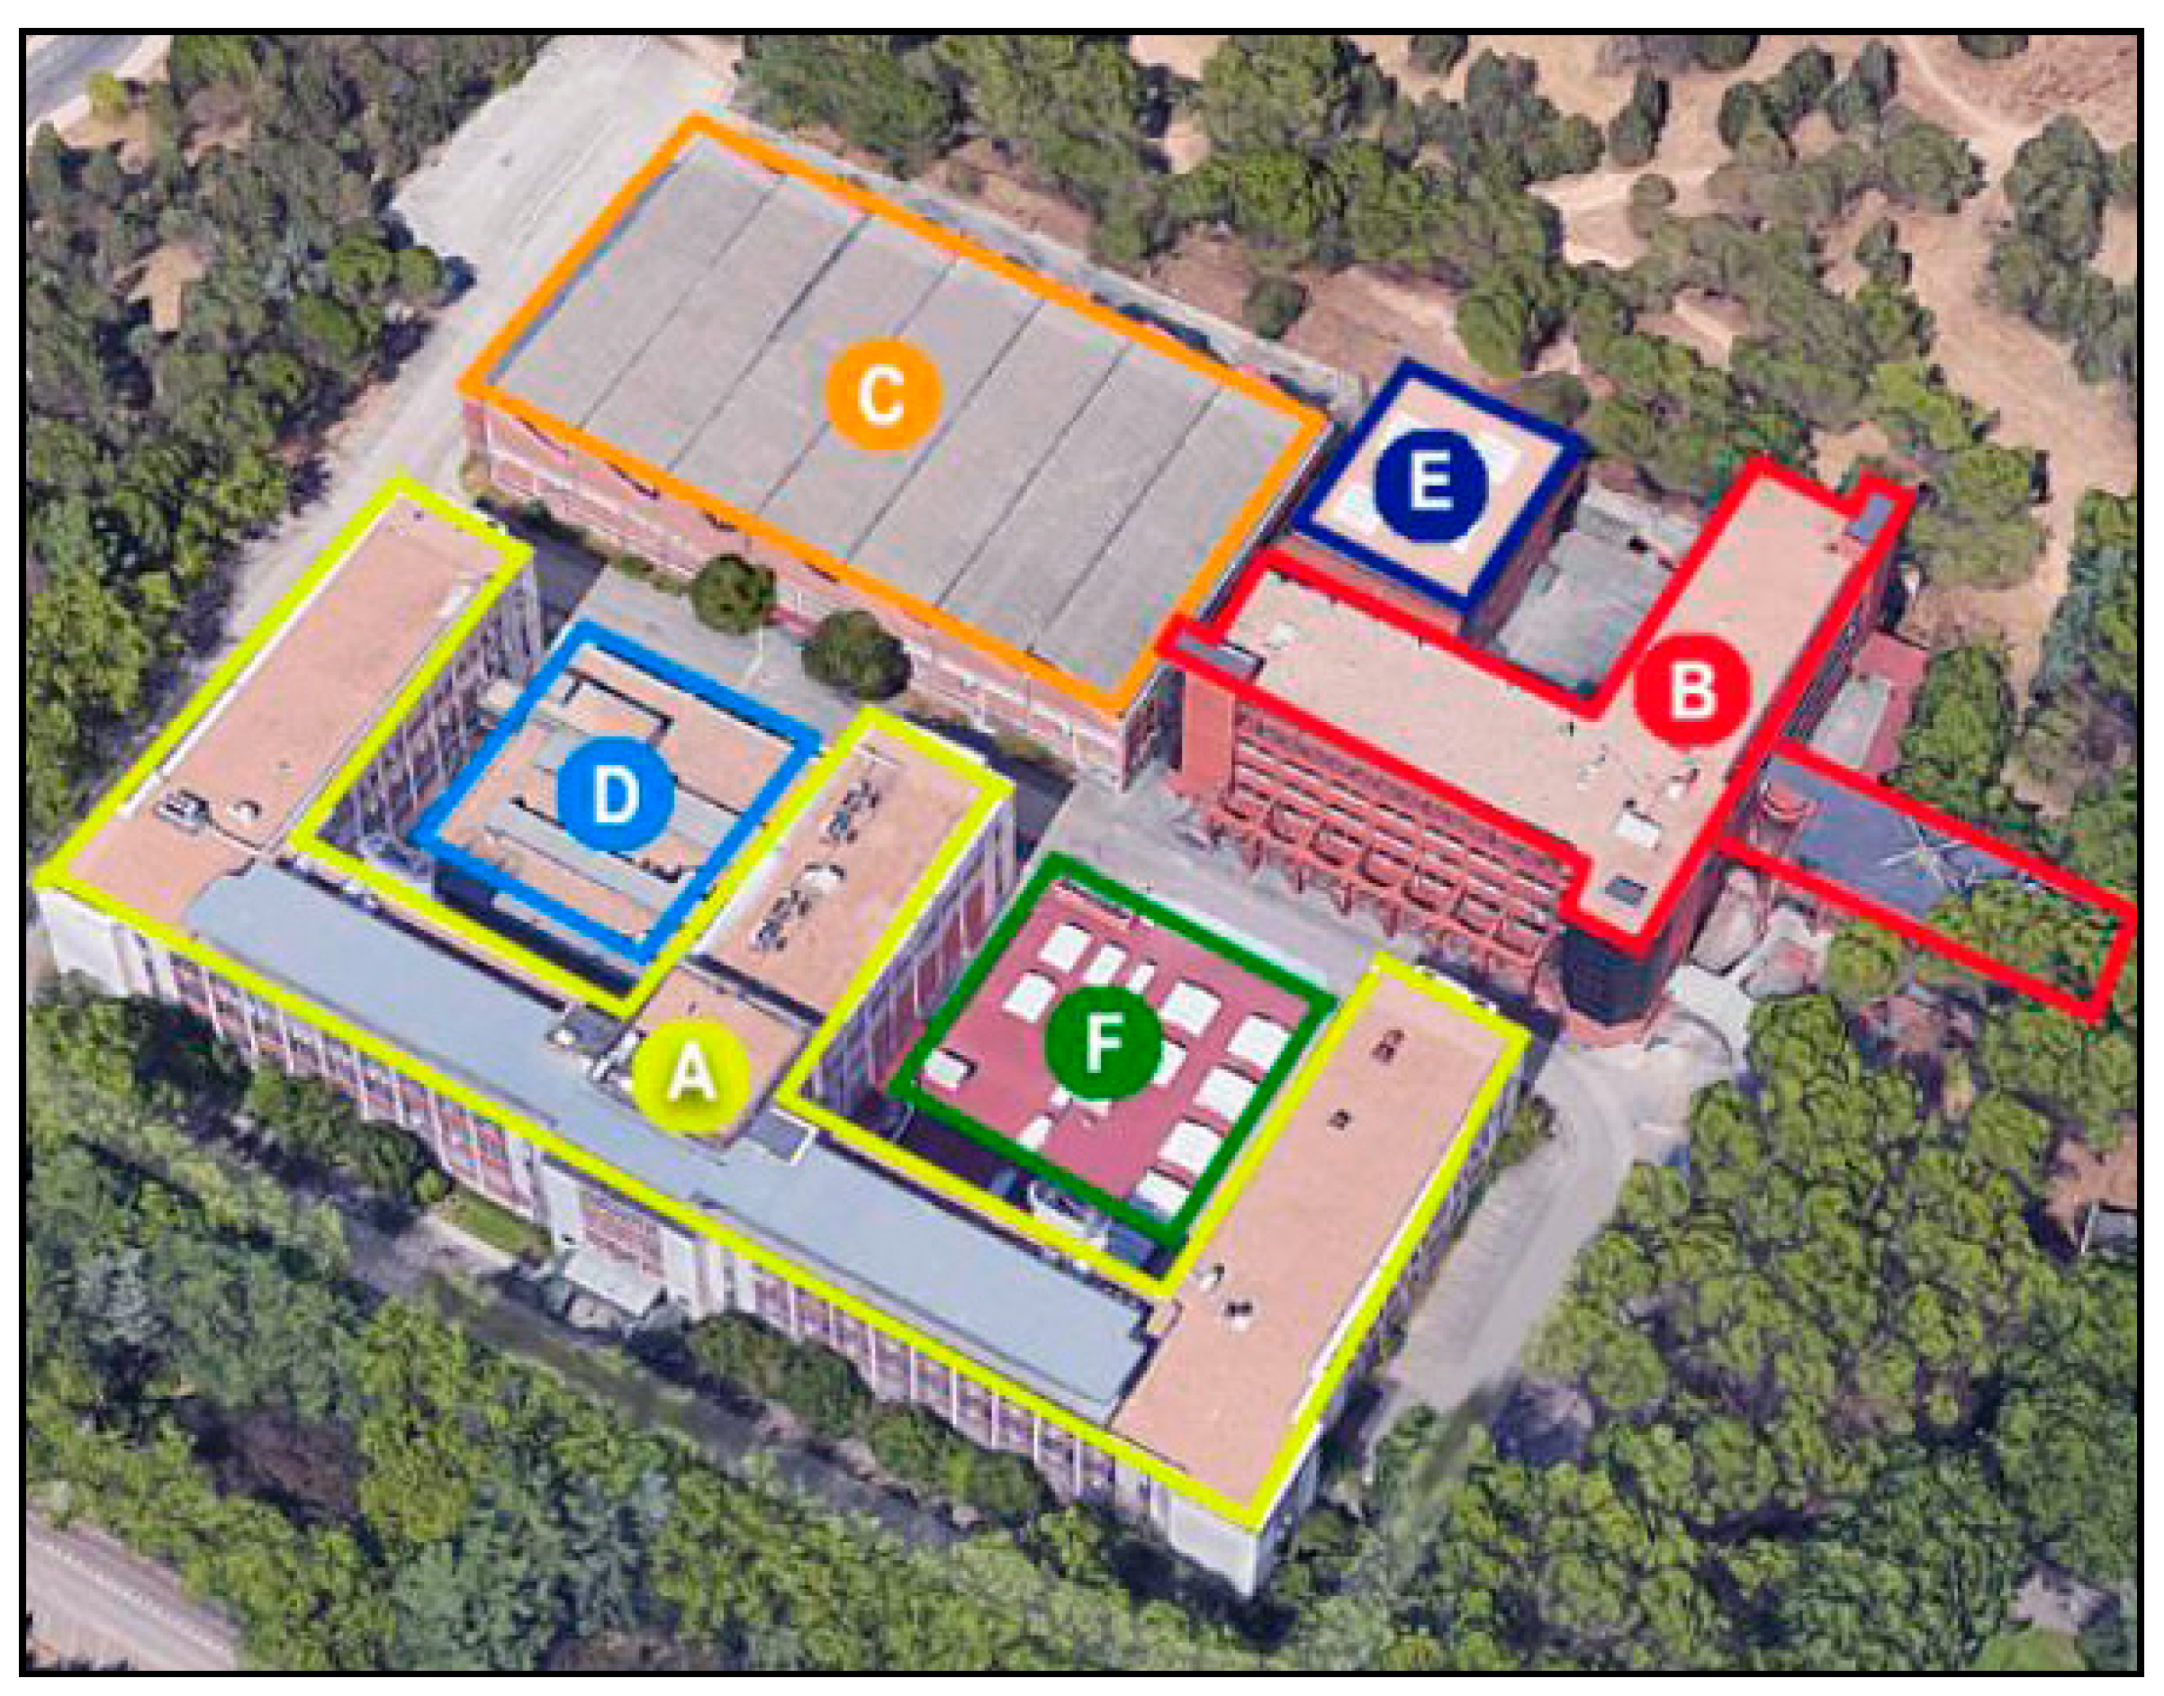
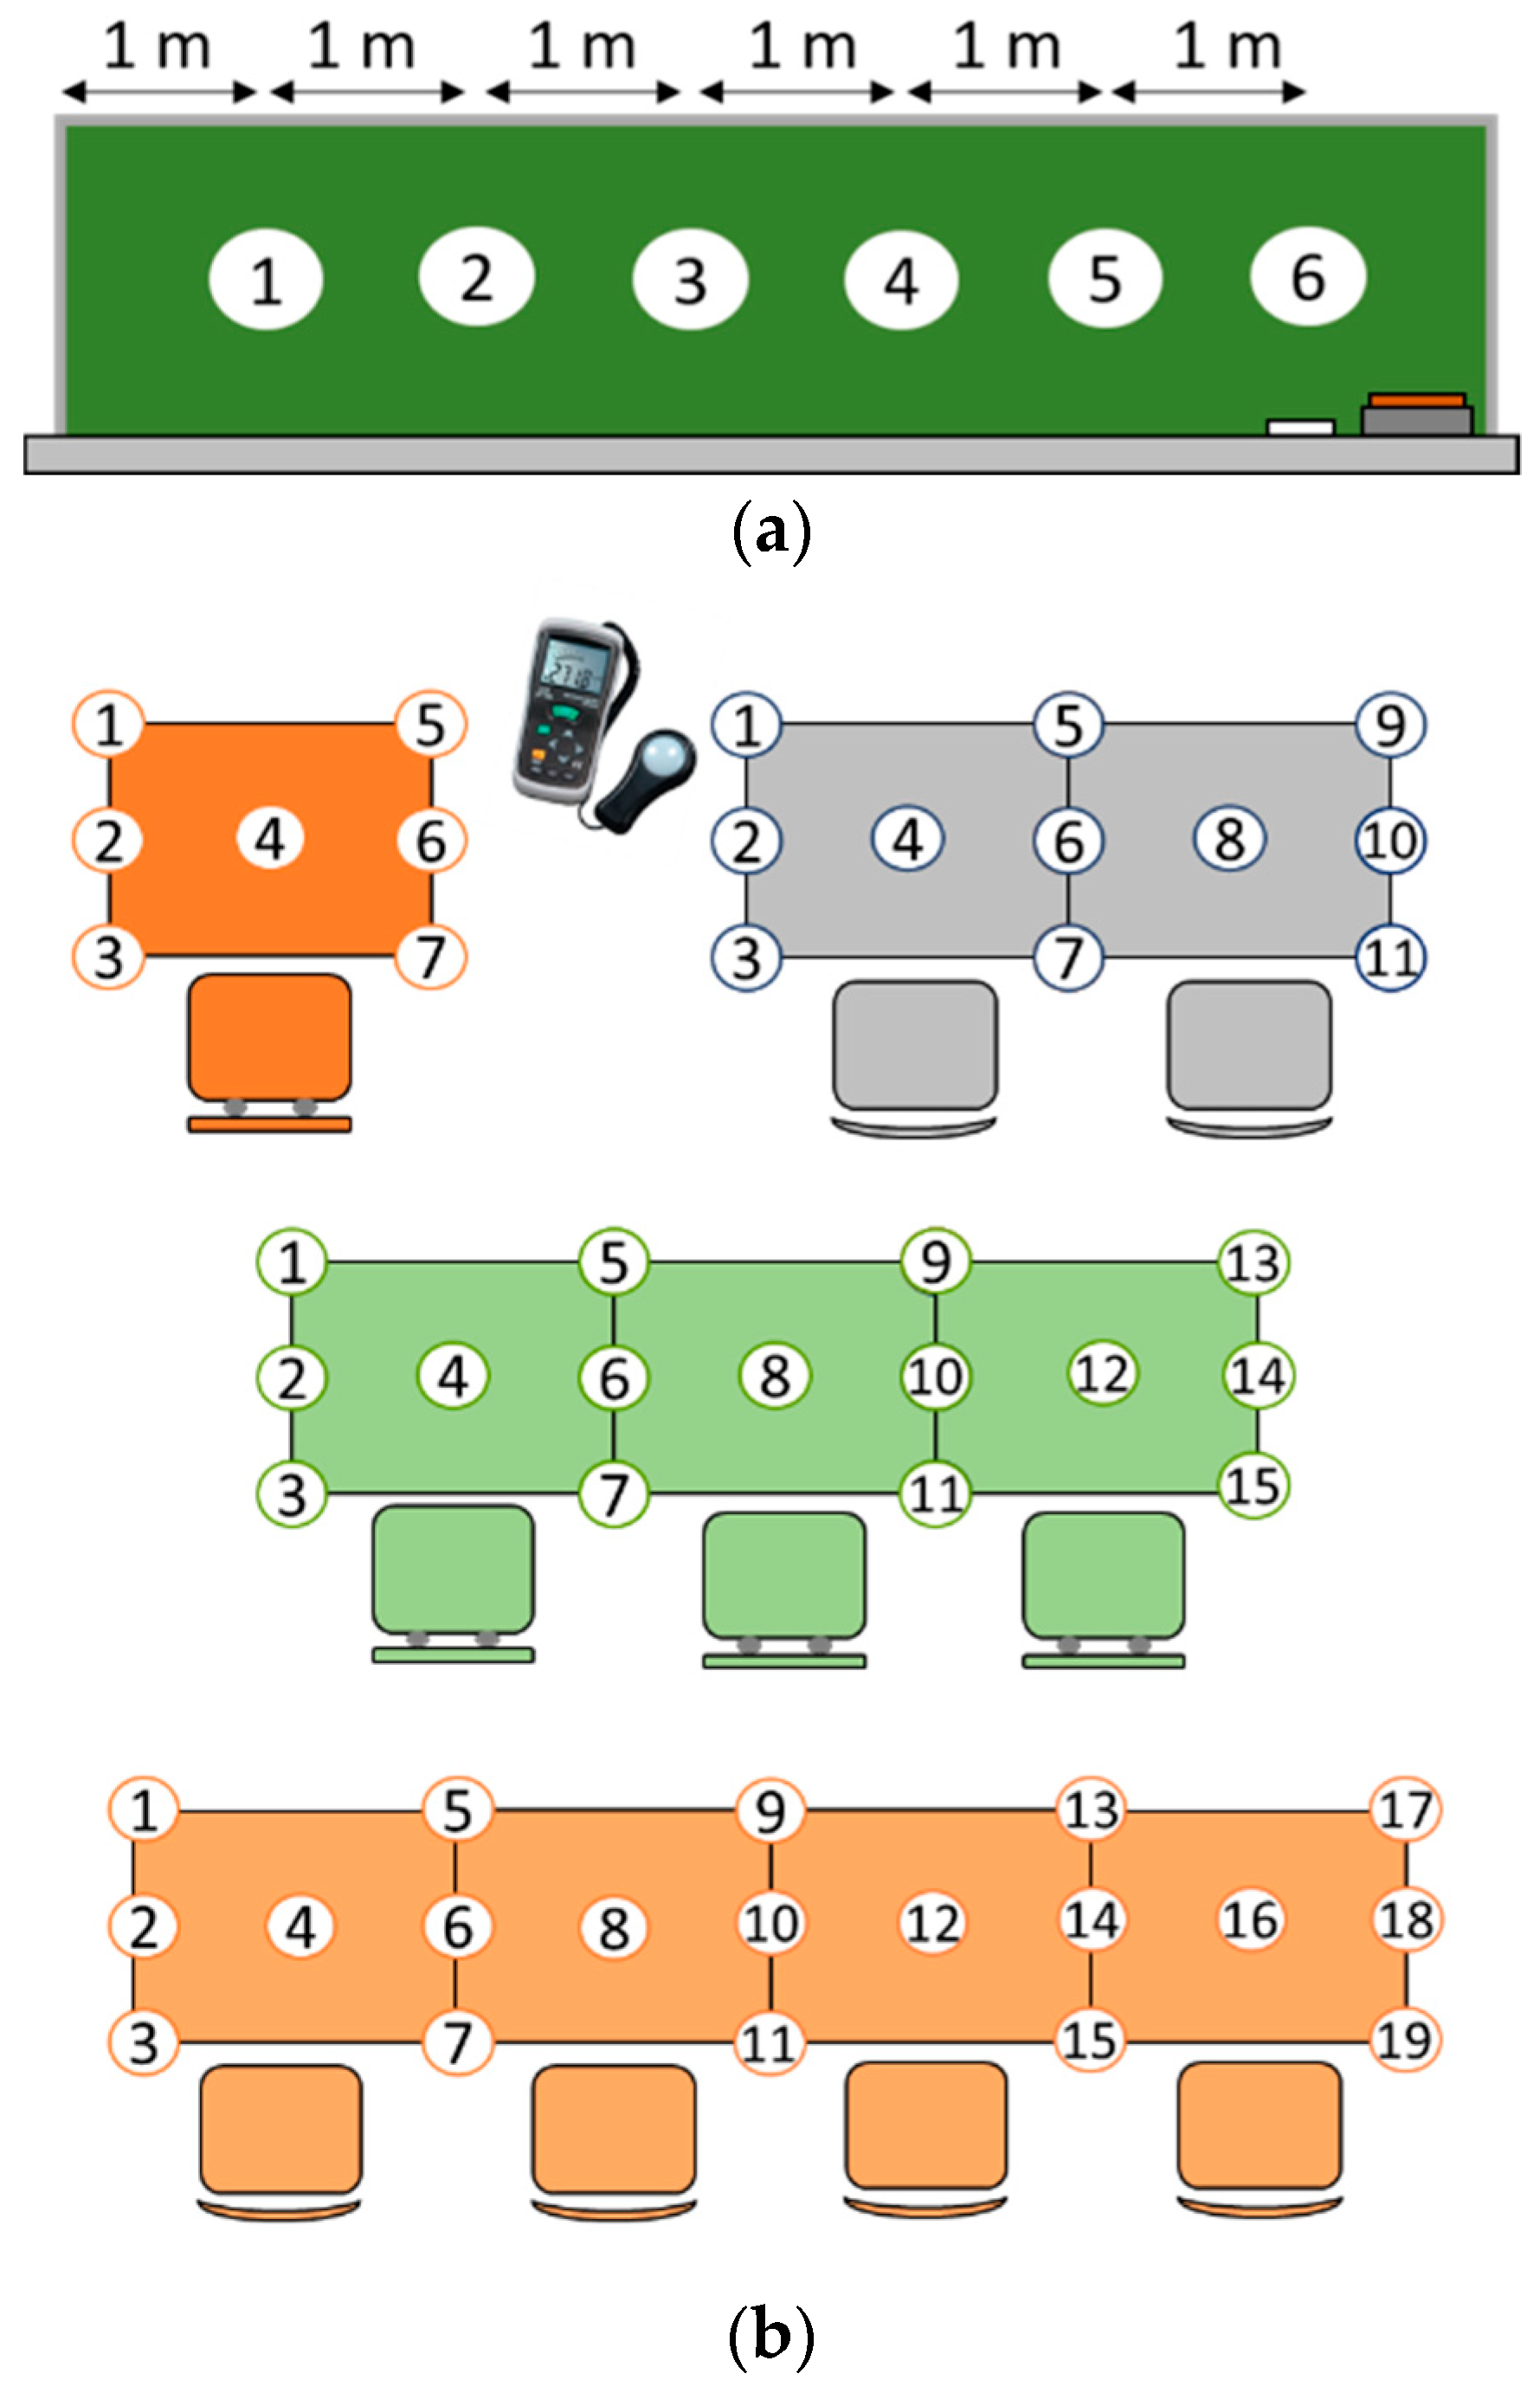
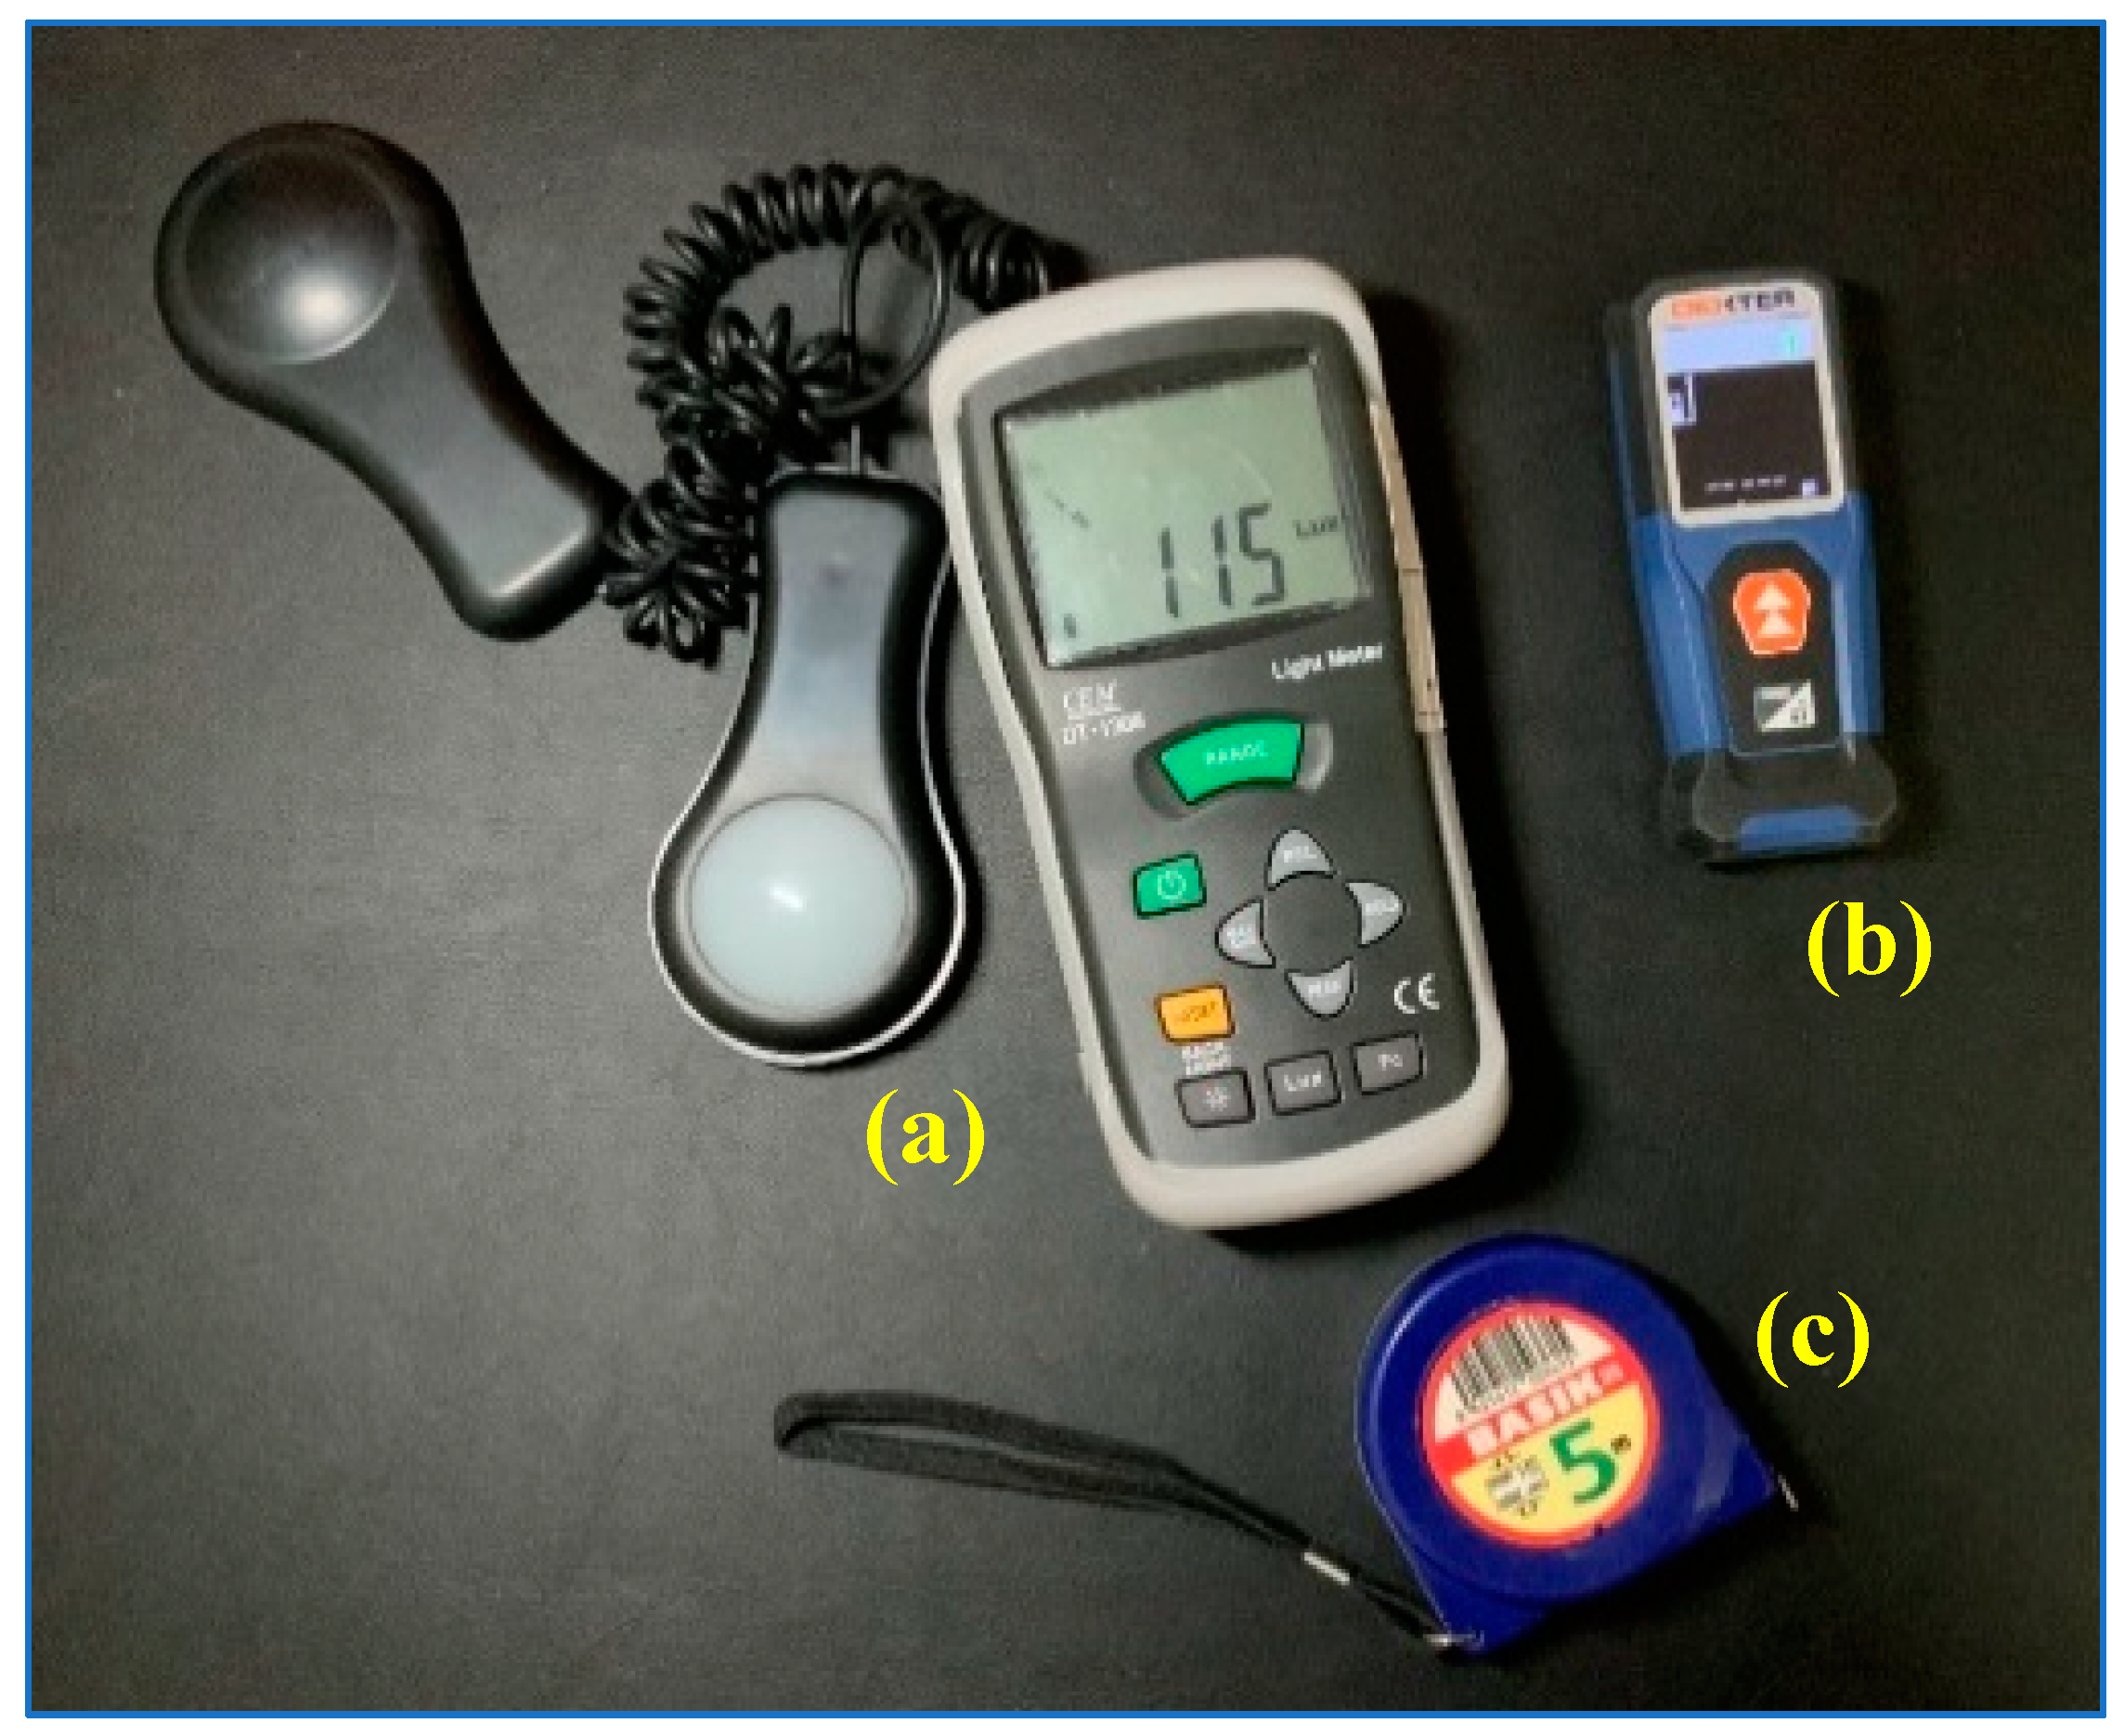
2.1. Testing Campaign
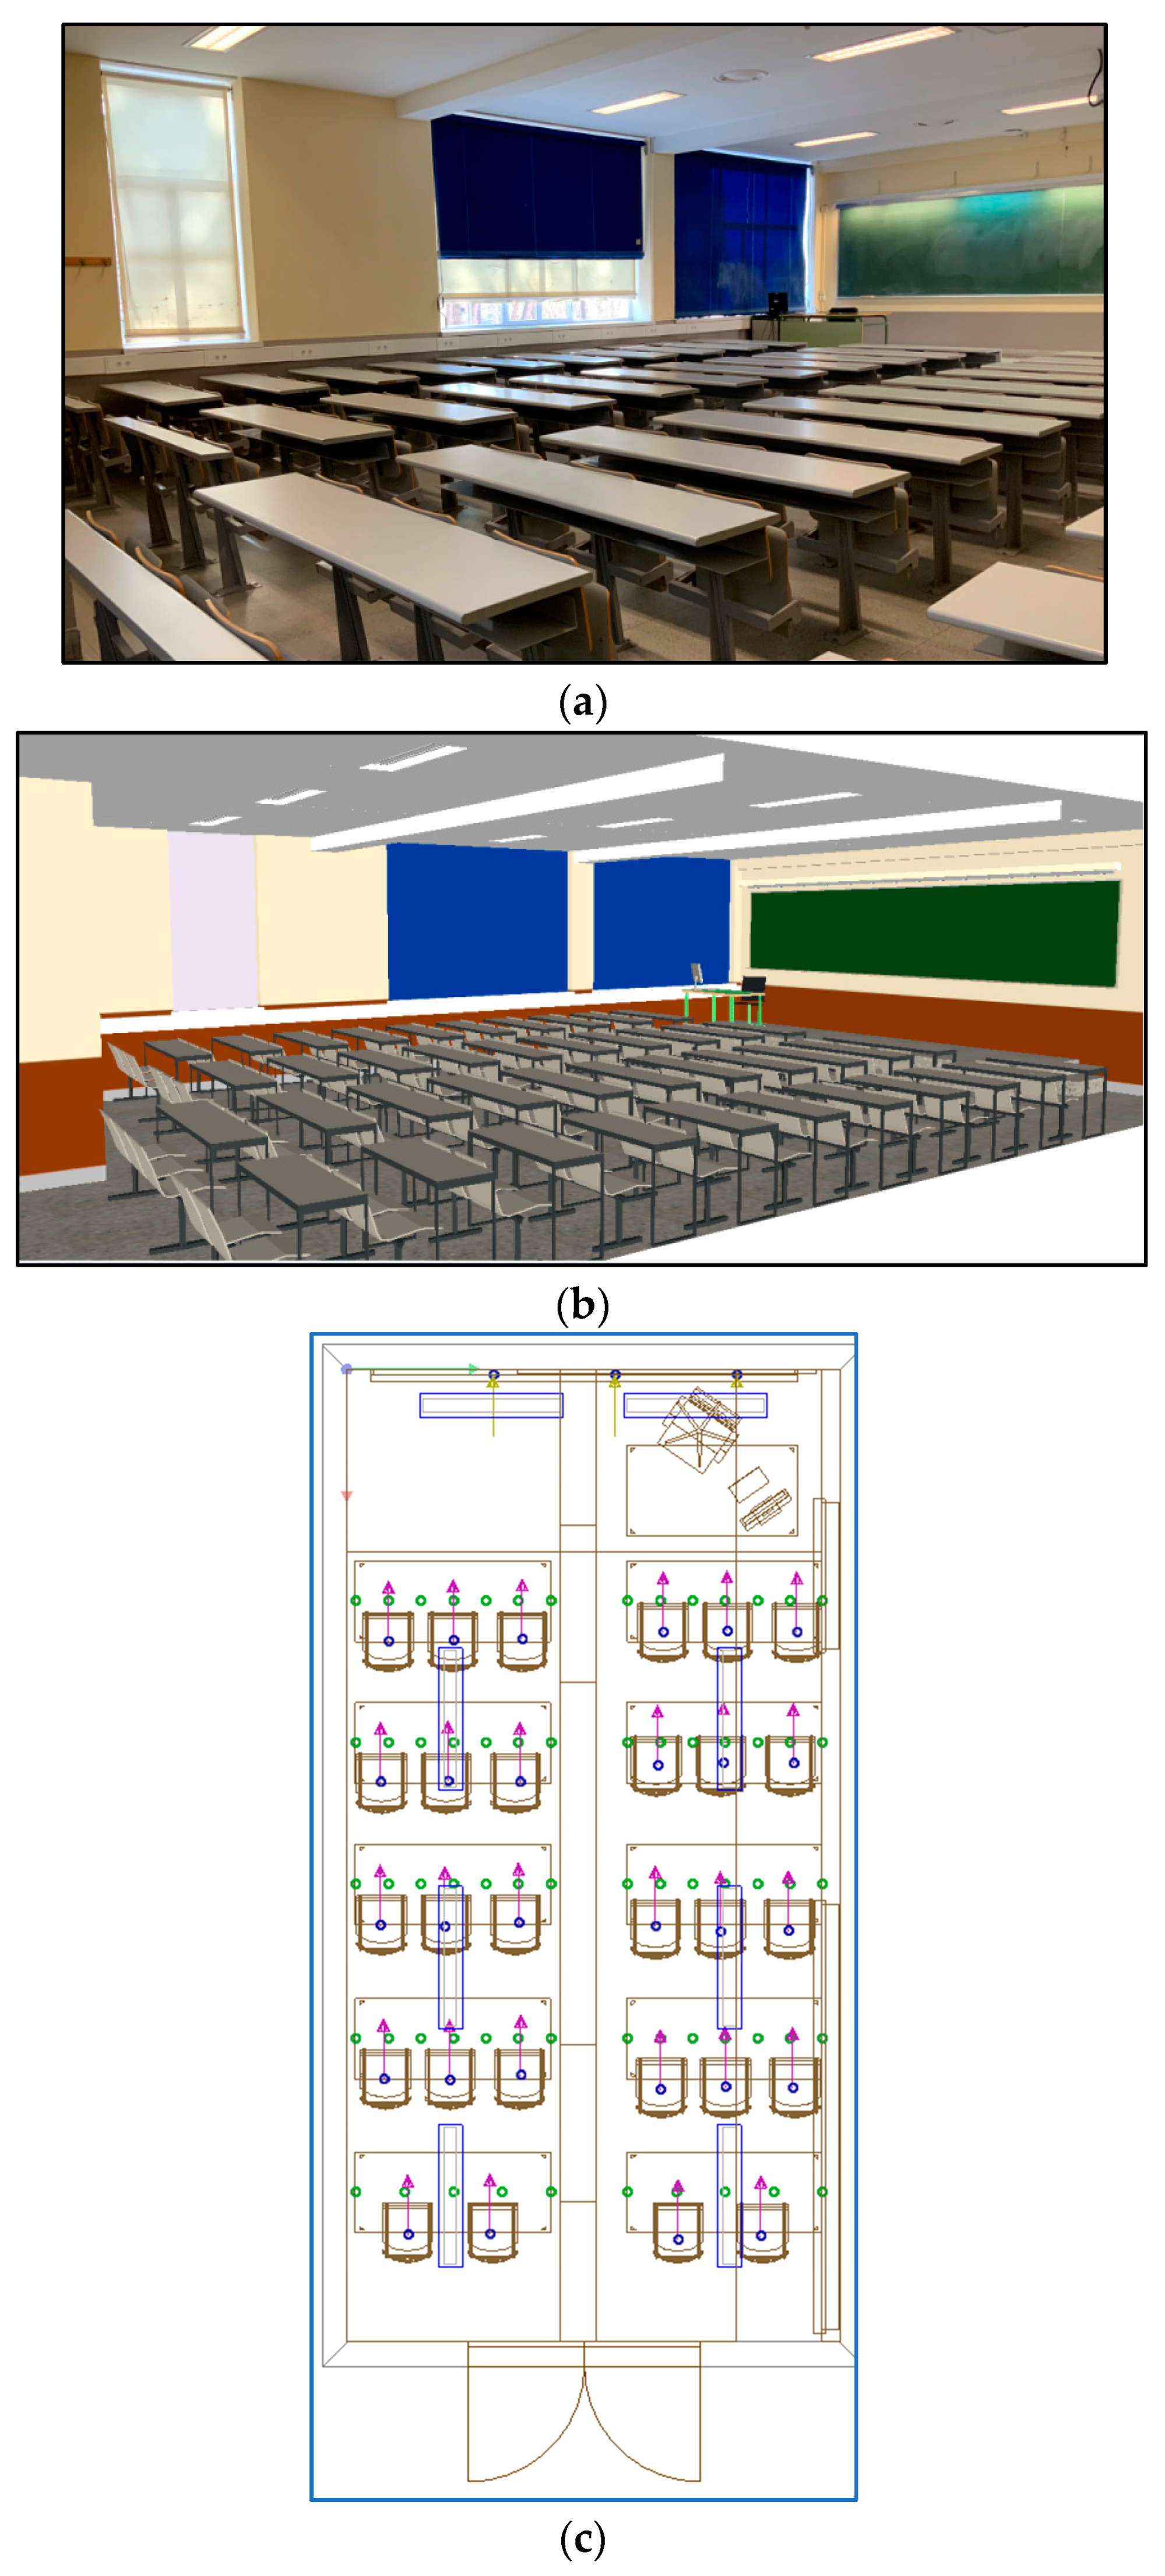
The first step in the proposed methodology was the design of the testing campaign, where it was necessary to define the scope of the research and to establish a schedule for measuring the lighting levels in the chosen classrooms. When creating the schedule, it was important to define the times of day during which the data should be collected, as these data might be greatly affected by sunlight. Thus, it was determined that the measurements should be taken in the most unfavorable case in terms of illumination, which is between sunset and sunrise (when there is less outside light and the classroom lighting reaches the minimum possible value). It should be emphasized that there is still academic activity at ETSIAE after sunset. It was also necessary to plan the manpower and time needed to properly conduct the testing campaign, as the measurements in a single classroom can take a significant amount of time (between 30 min and several hours). Finally, it should be highlighted that the measurements were taken in winter, when there are more hours of darkness for measuring, and with all window blinds lowered.
This study includes measurements of the lighting levels on student desks and blackboards in 39 ETSIAE classrooms (see Figure 2), distributed among buildings A, B, and E. It includes all ETSIAE classrooms dedicated to traditional teaching (i.e., not multimedia classrooms). A CEM-DT 1308 lux meter and a DEXTER CM30 distance meter were used in this testing campaign (see Figure 3). In addition to the geometry of the classrooms, the arrangement of lights, desks, blackboards, and other elements that might interfere with lighting (such as platforms, cabinets, columns, pillars, beams, etc.) were precisely identified. This was done in order to reproduce both the geometry and the lighting conditions of the classrooms as accurately as possible in the subsequent simulation. Similarly, the brand and model of each light in the classrooms were also identified.
Once the geometry of the classrooms was determined, the illuminance values, E, were measured on the surfaces of interest (blackboards, tables, and student desks). Blackboards are elements of great importance to the educational process, as students use them to take notes and to understand the professors’ explanations. In fact, UNE 12464-1 gives them special importance in terms of lighting, with an average illuminance reference value of 500 lx. (This value may vary according to national regulations [20].) In order to measure the illumination distribution, it was chosen to measure points one meter apart on the average line of the blackboard (see Figure 2). These points were measured at mid-height, since direct classroom observations revealed that most of the professors’ notes on the blackboard were made in this area.
With regard to student desks, it was noted that students rarely place paper in the center of the desk to write, but tend to tilt it toward one side depending on their dominant hand. Bearing this in mind, the four corners of the desk as well as the central point were defined as measurement points. For long desks with more than one seat, the part corresponding to each seat was treated as an individual desk and the two corners in contact with each other were treated as a single point (see Figure 2).
A significant number of measurement points was obtained in each classroom, ranging from 134 points in the smallest classroom to 2275 points in one of the examination rooms. The measurements were collected on cards such as the one shown in Figure 4. Each group of desks is identified in one color according to the level of lighting achieved (the closer the desks are to the dark red color, the poorer the lighting).

2.2. Simulation

Once the rooms representative of all other ETSIAE classrooms were selected (see Section 3 of this paper), their lighting situation was represented as accurately as possible using DIALux® simulation software (see Figure 5). Thanks to the data collected in the testing campaign, the simulations were carried out taking into account precise details from
  • the geometry of the classes;
  • the layout of the luminaires;
  • the arrangement of desks, chairs, blackboards, and elements that affect lighting; and
    the textures of the walls and floor.
The geometry of the classes was reproduced using the data obtained in the test campaign. As explained in Section 2.1, with the aid of the distance meter DEXTER CM30, an accurate geometry of the classes was obtained. For the luminaires, a complete inventory of which luminaires were in use in all the classrooms was performed in the test campaign. With this information, DIALux® ready-to-use data was obtained from the manufacturers’ data catalogues. This allowed to directly implement the luminaires and their performance in the simulation, with only a need to adjust their attenuation to take into account wear and tear. In the testing campaign, together with the geometry of the classrooms, an extensive set of data regarding the position and shape of all desks, chairs, blackboards, and elements that may affect lighting was measured. Using the aforementioned data, the necessary objects were created and arranged to be taken into account in the simulation. With regard to the windows, as the lighting analysis is based on the results obtained in the most unfavorable scenario (at night), no light was set to be transmitted through them, with the blinds being lowered. Finally, taking into account the importance that surface textures have in light reflection, the colors of the walls, ceiling, blackboard, chairs, and tables were reproduced in the simulation. Furthermore and in relation to the floors, as their texture was not uniform, customized textures were created with the aid of imported photos of the present floors at the simulated classrooms.
The different points of interest with regard to the lighting on student desks and blackboards as well as the Unified Glare Rating (UGR) were established in the simulations. The UGR calculation points were placed in the center of each chair where the eyes of an average-sized student would be sited.

3. Results and Discussion

The results of this study are described and discussed in this section. First, the results of the ETSIAE classroom lighting measurement campaign are analyzed. Second, the improvements applied to four representative classrooms using the DIALux® software are analyzed. This section begins with a comparison between the experimental lighting results measured on the student desks in the selected classrooms and those extracted from the direct simulation of the current situation conducted using DIALux®. An accuracy estimation of the simulated results is then established. After this calibration/tuning, three proposed improvements are studied: (1) changing the color of the walls; (2) replacing the luminaires with new ones (of the same model); and (3) replacing the luminaires with new ones but employing LED technology.

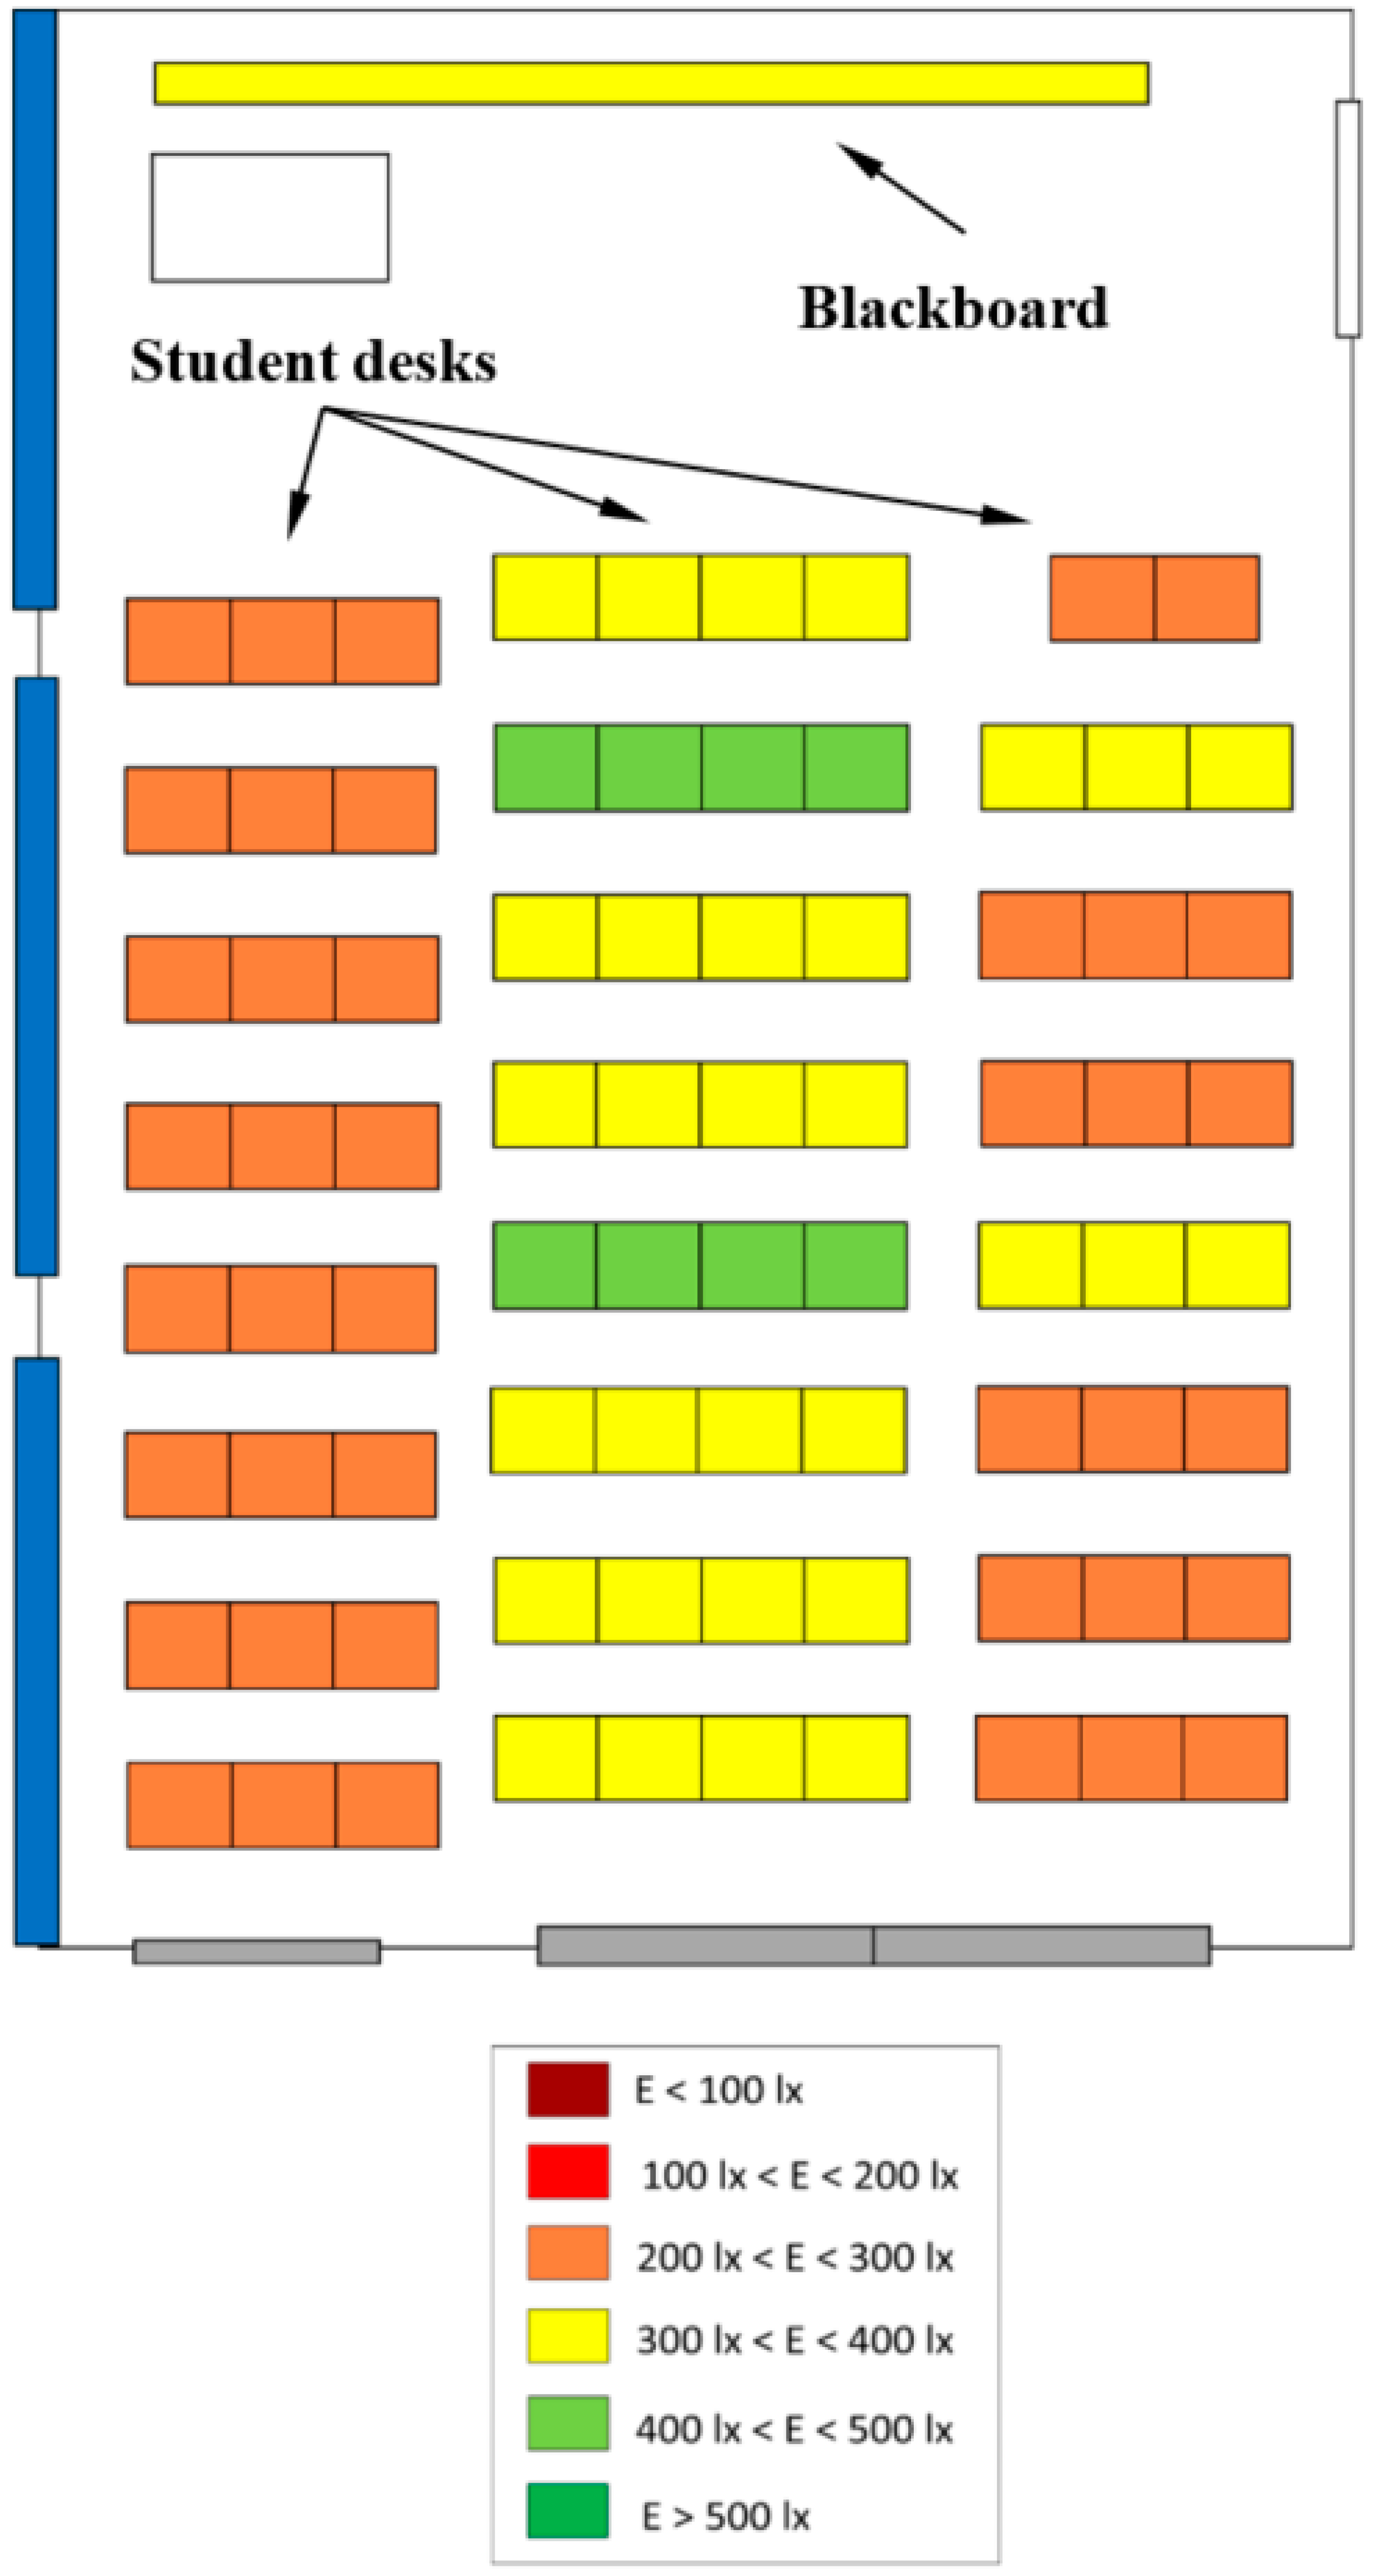
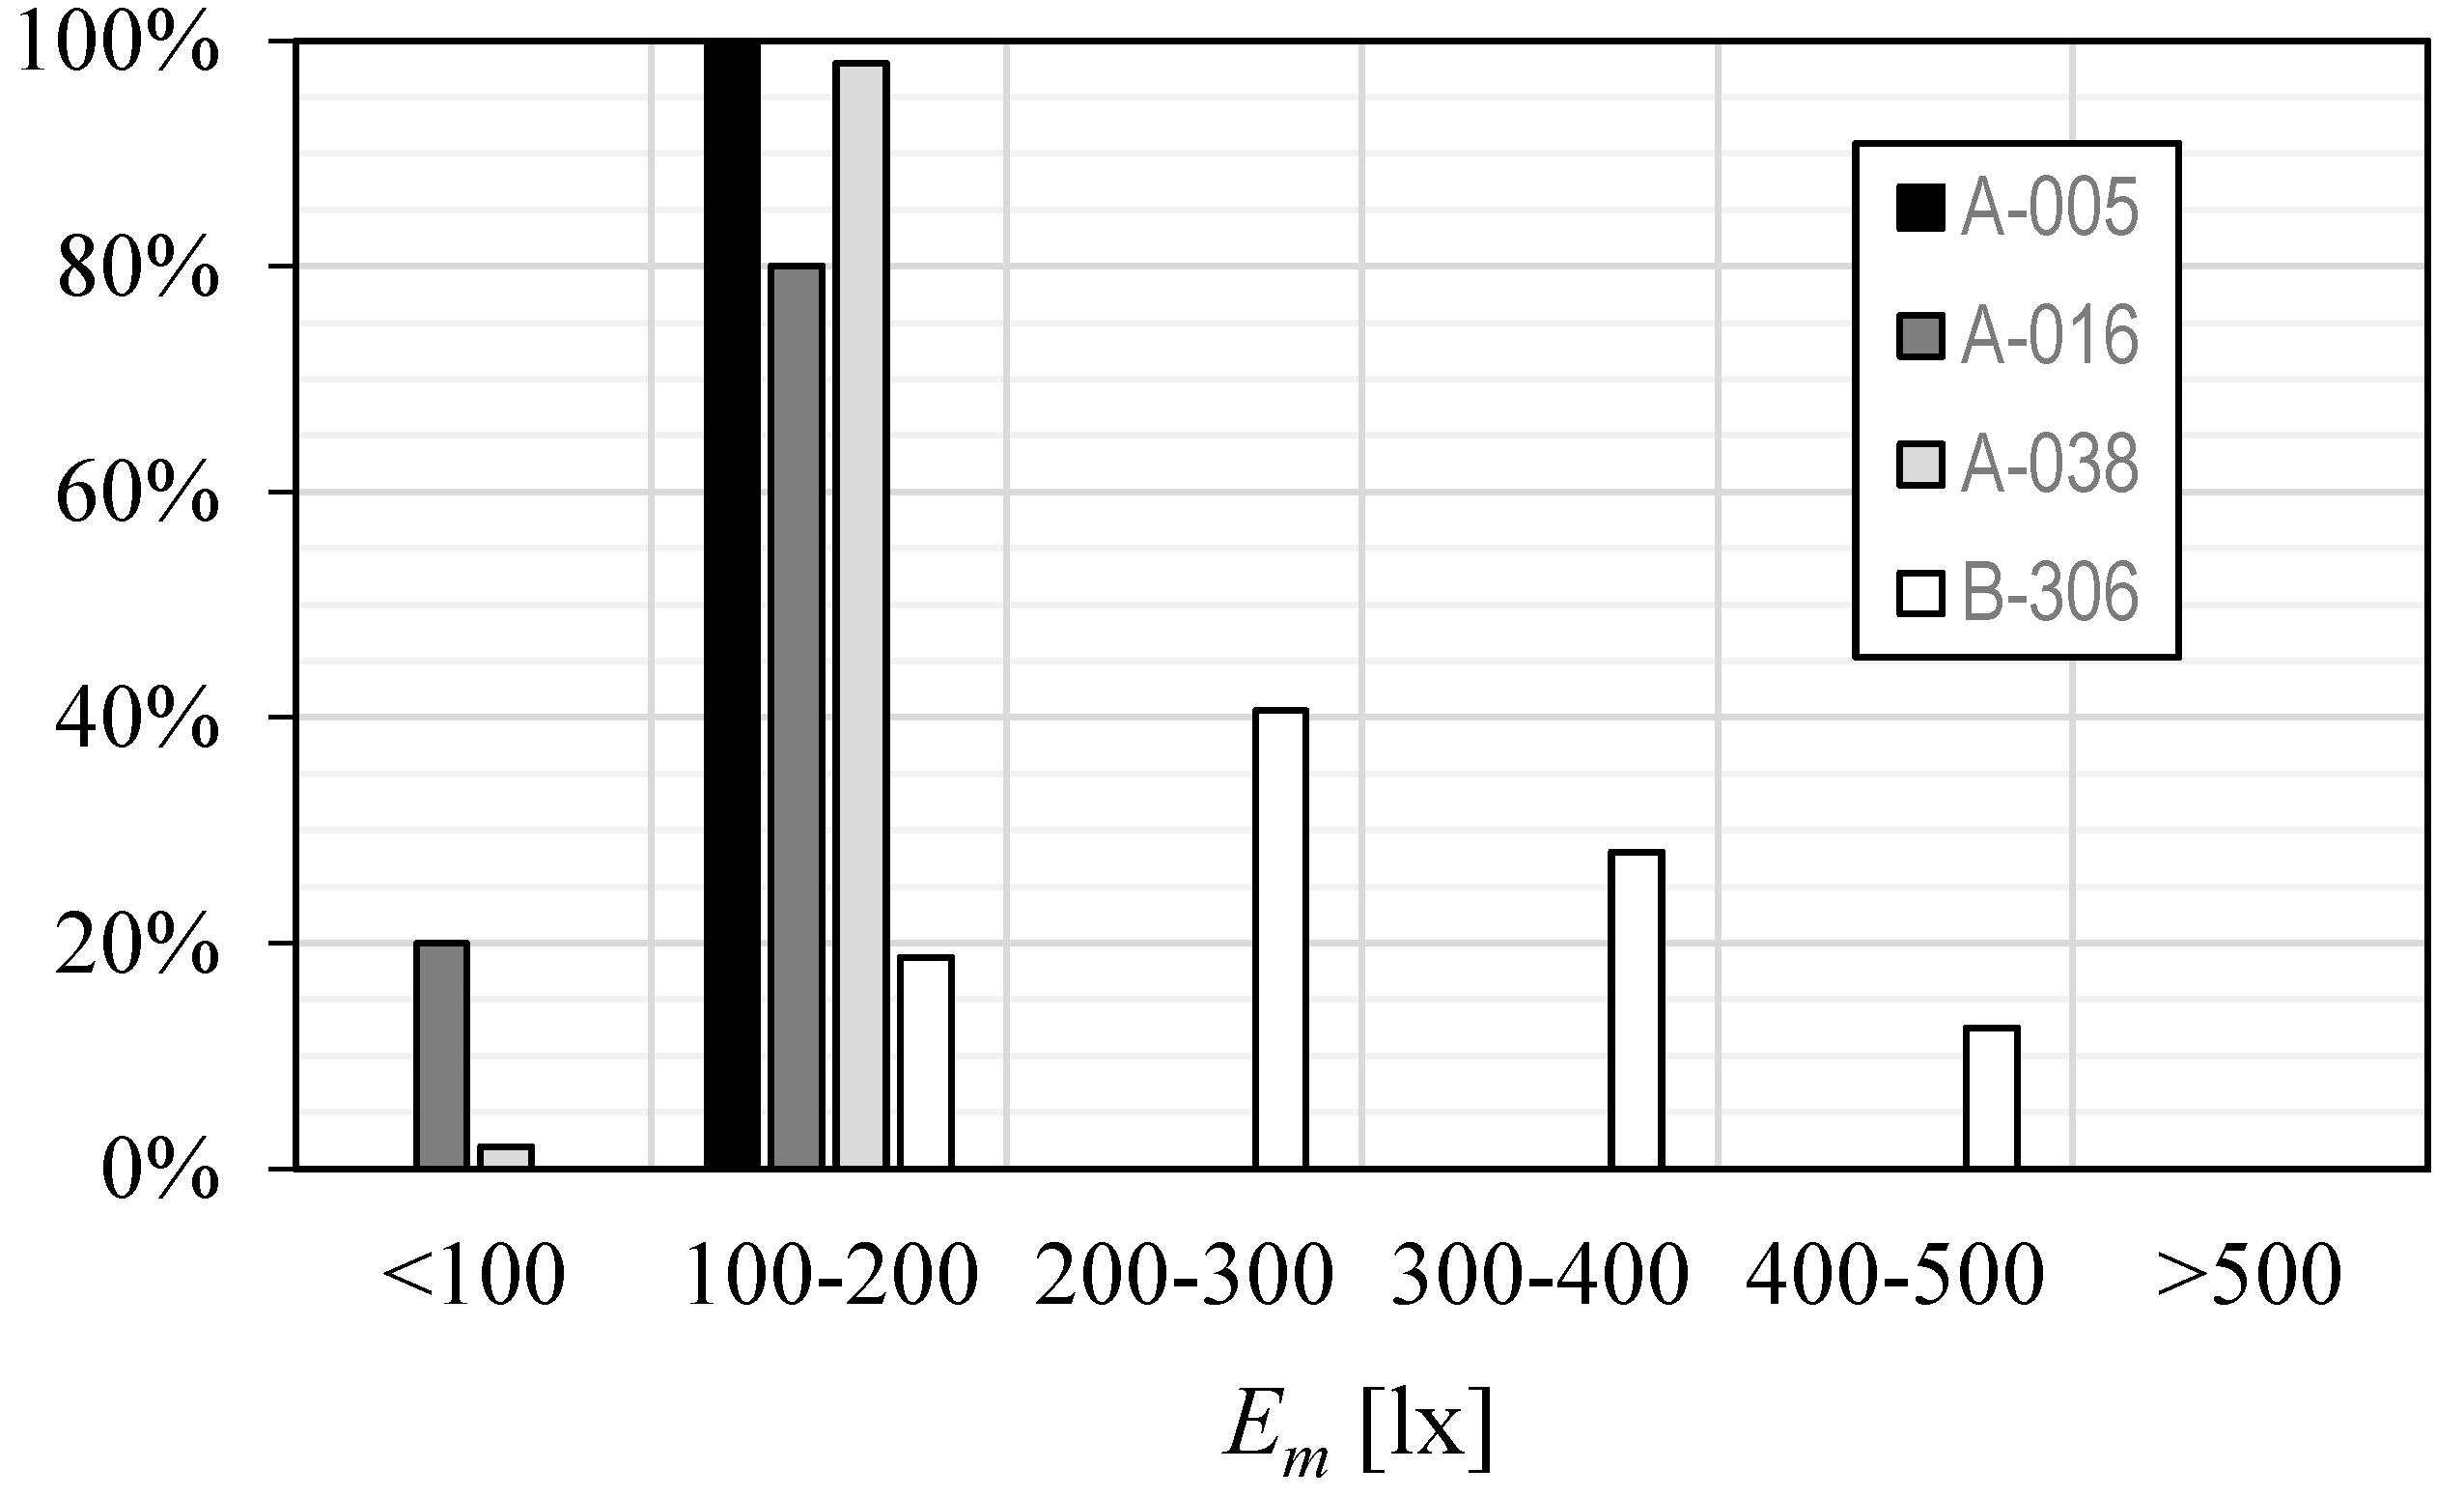
3.1. Testing Results

As mentioned above, the testing campaign included measurements from 39 classrooms in three different ETSIAE buildings (buildings A, B, and E). Table 1 shows the average illuminance values measured on student desks and blackboards in each of these classrooms, along with the surface areas of the classrooms. A first look at these results reveals rather low values in all classrooms in building A and in nearly all in building B, much lower than the 500 lx level stablished by the standards [43]. In some building A classrooms, the average lighting is below 200 lx. As expected, the situation is much better in building E.
In building A, most of the classrooms have very poor lighting, with only three rooms recording a measured illuminance, Em, higher than 200 lx and none recording higher than 300 lx. The average illumination value on all desks measured in building A was 169 lx, well below the recommended 500 lx. In building B, better results were obtained, with 30% of the classrooms achieving the illuminance values recommended by regulations. In 50% of the classrooms, illuminance values of 300 lx to 400 lx were obtained, with only one classroom recording a value below 300 lx. Finally, all classrooms in the newest building, building E, had acceptable levels of lighting on the study desks. Based on the above results, it is clear that the improvements to be proposed should focus on increasing the average illuminance levels in the classrooms in buildings A and B while keeping the UGR glare index below the maximum level (maximum value of UGR should be below 19, according to UNE 12464-1).

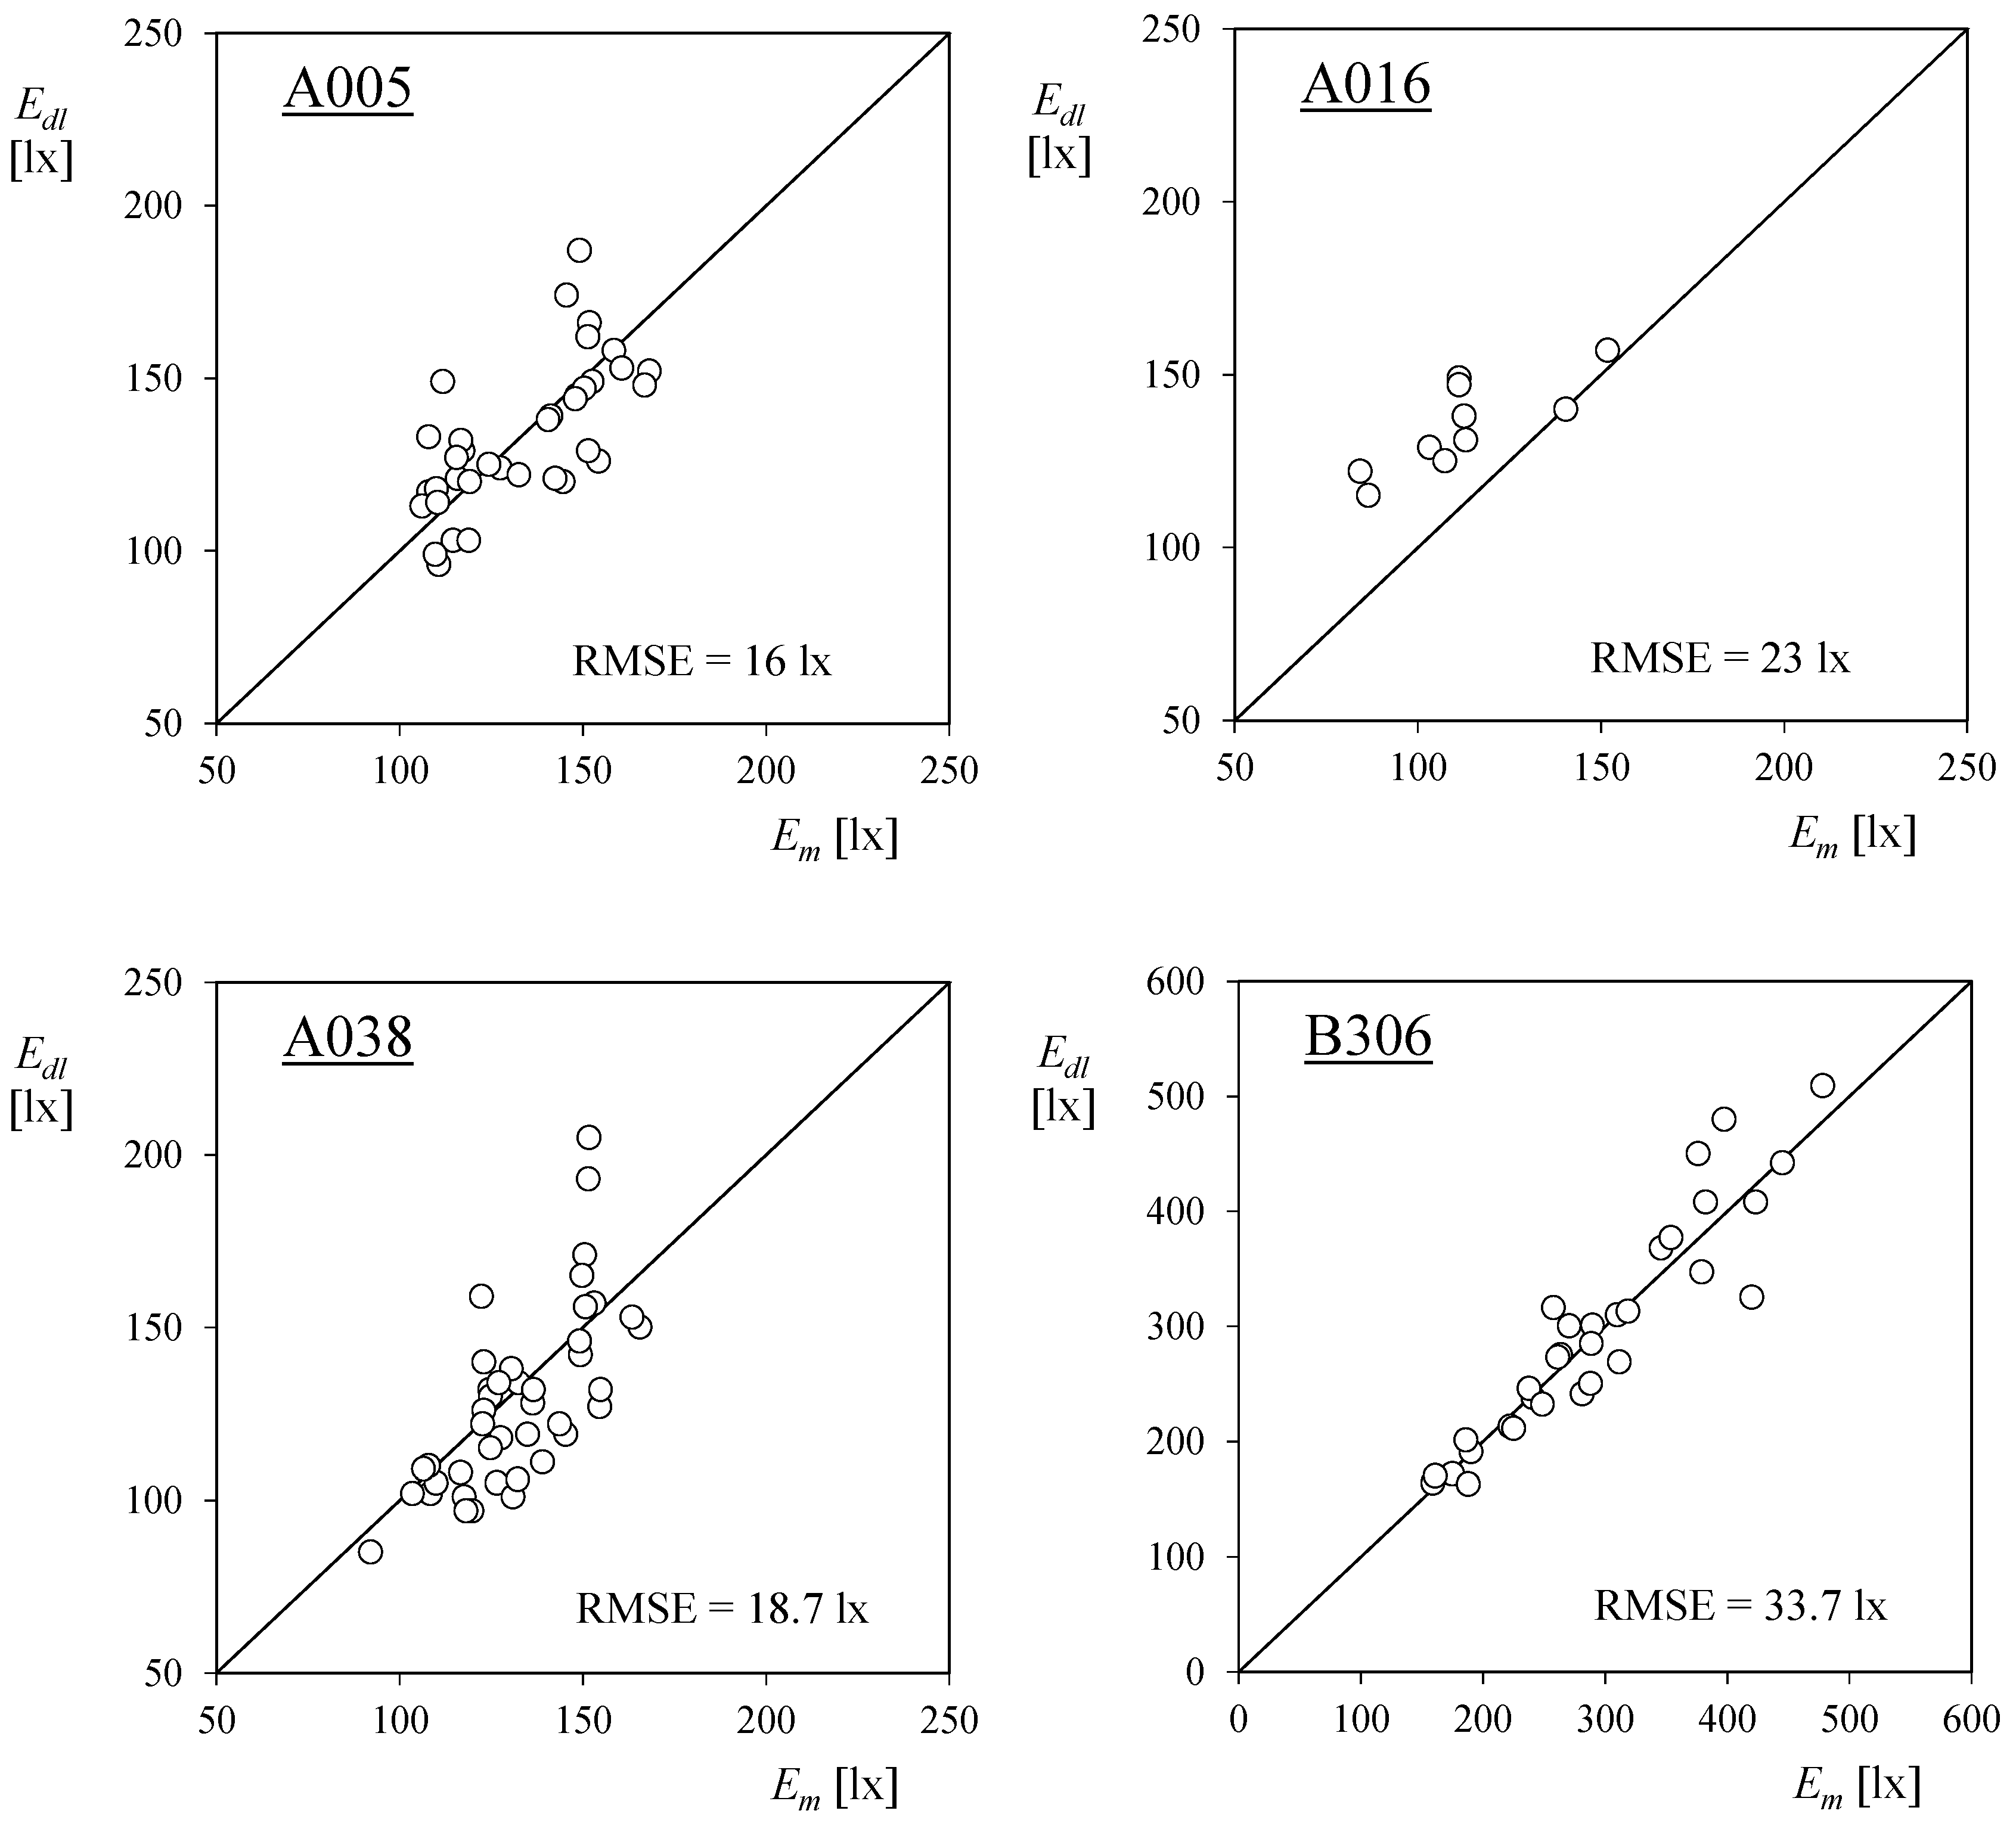
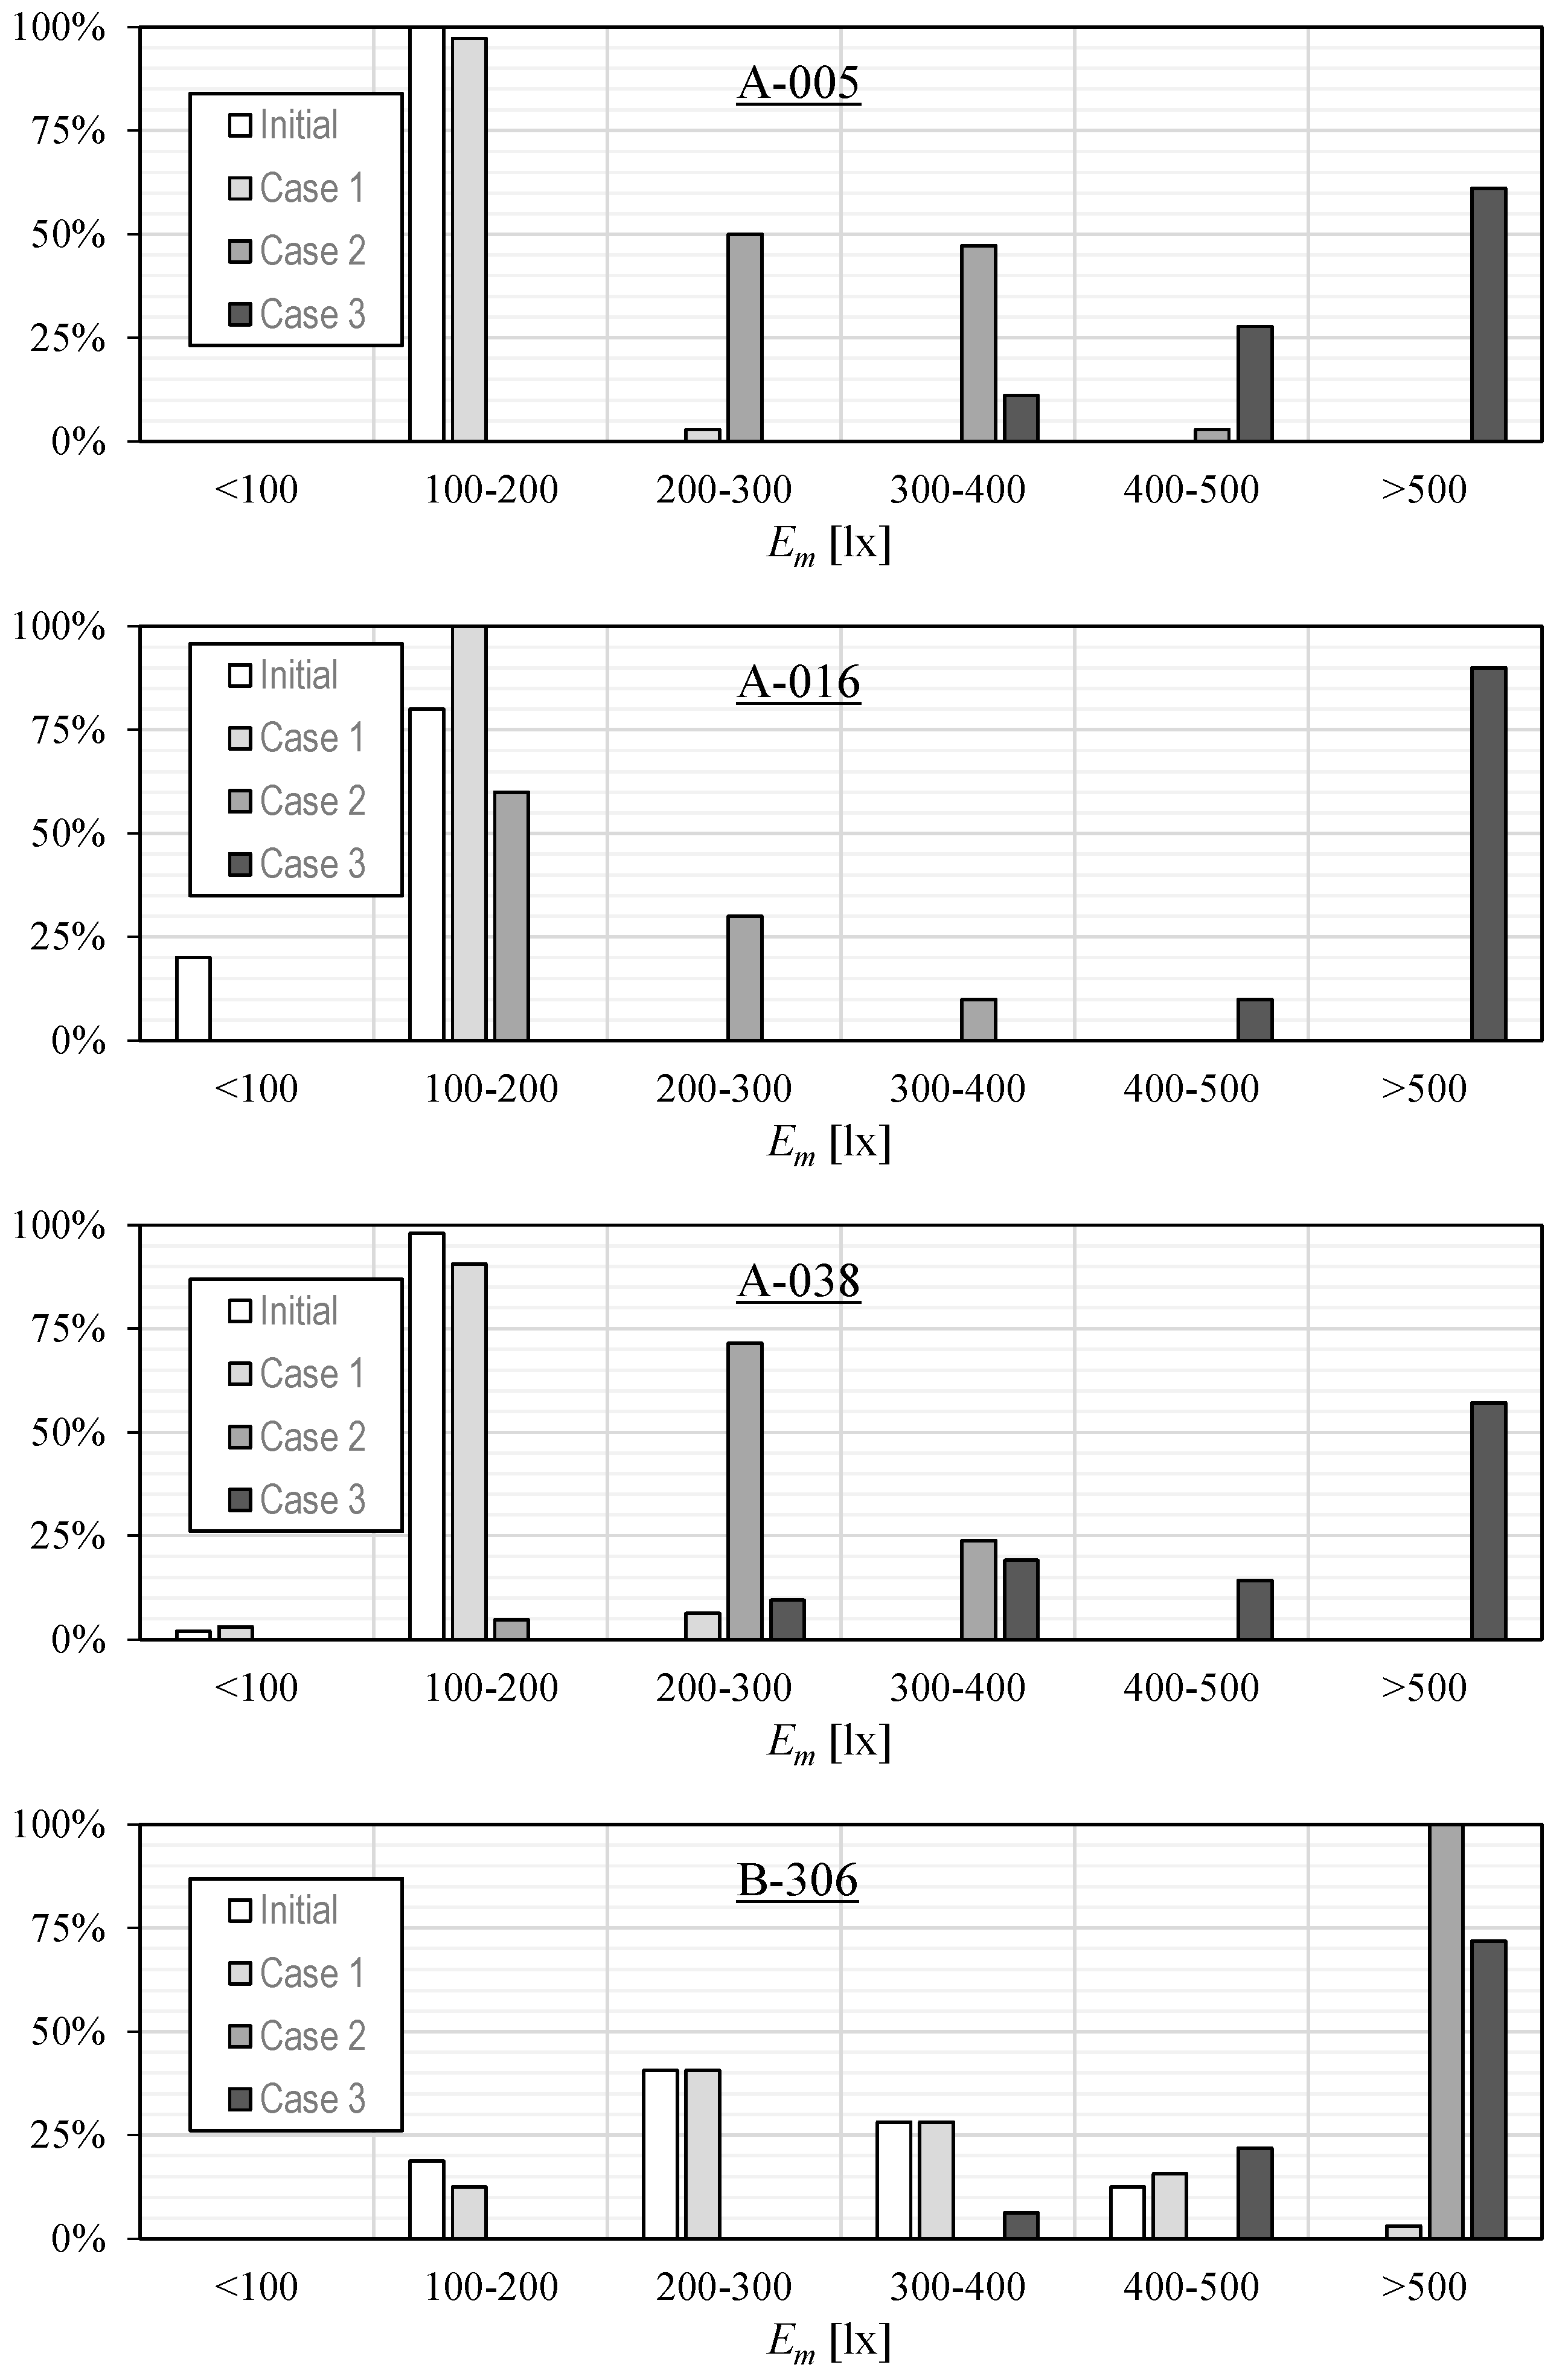
3.2. DIALux® Analysis Results

As stated in the methodology described in Section 2, four model classrooms were selected as representative of the different types of poorly illuminated classrooms, three of which were in building A and one was in building B (see Figure 6):
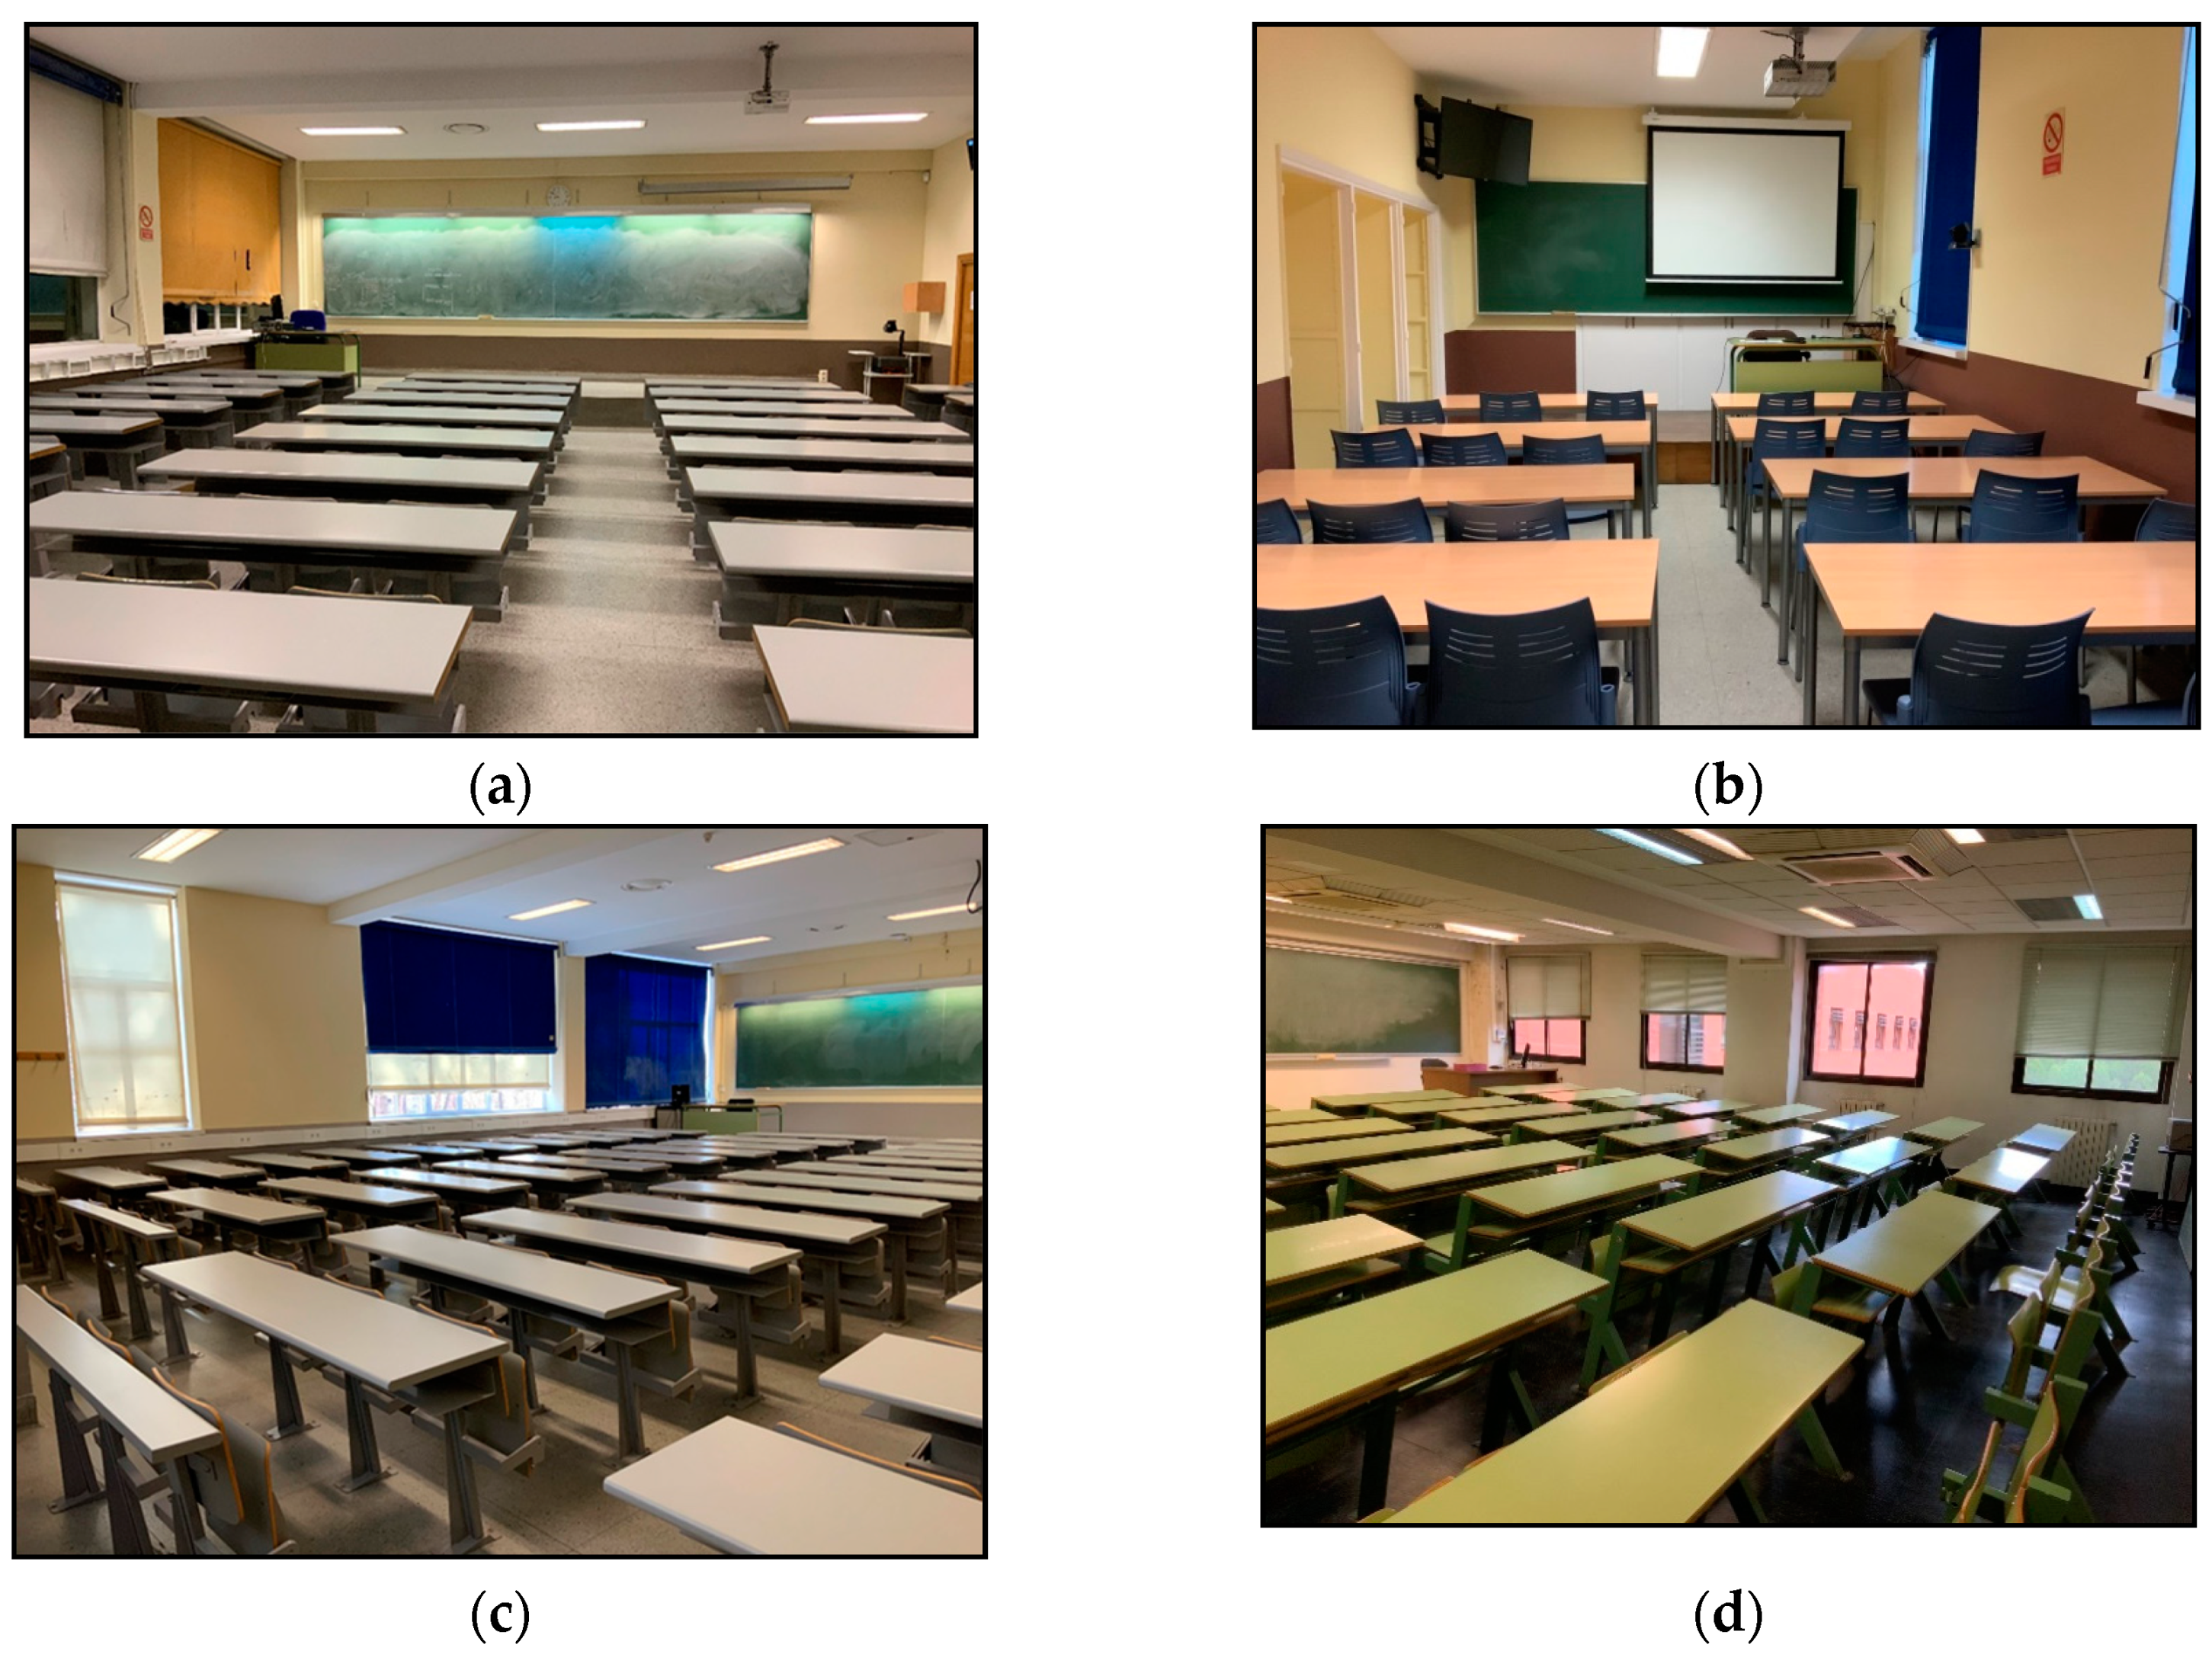
  • A-005 (medium-sized classroom model)
  • A-016 (smaller classroom model)
  • A-038 (large classroom model)
  • B-306 (classroom with the worst lighting result in building B)
The heterogeneous classroom sizes in building A prompted the selection of a higher proportion of cases from this building. In contrast, the classrooms in building B are much more homogeneous with regard to their geometry.
To get a better idea of the current status of the illumination levels in the selected classrooms (in addition to the results from Table 1), the percentage distribution of the individual desks with regard to the measured illuminance, Em, was plotted (see Figure 7). This histogram clearly indicates the poor lighting conditions in the building A classrooms.
Before analyzing any possible improvement, the current situation of the selected classrooms was simulated as accurately as possible using DIALux®. As shown in Figure 4, the geometry and conditions of the classrooms were simulated, including the furnishings and position of all luminaires. Finally, the attenuation of these luminaires was adjusted to bring the results of the simulation as close as possible to the measurements taken (see Table 2 for the average and maximum values of measured and simulated lighting on the desks and blackboards in the selected classrooms). Figure 8 compares the illumination from the testing campaign, Em, and the DIALux® simulation, Edl, on each individual desk. The quality of the correlation between the two results can be appreciated compared to the ideal simulation indicated by the continuous line included on the graphs.
This correlation can also be quantified by means of the Root Mean Square Error (RMSE). For each classroom, assuming data is reasonably distributed according a Gaussian process (data from the A005, A016, and B036 classrooms are Gaussian according to the Shapiro–Wilk test with 0.05 significance level; data from A038 do not; however, this last result changes if the two points—from a 42-point sample—representing the larger difference between simulated and testing data are not taken into account), the RMSE represents the limit encompassing 66% of the differences between the simulated and measured illuminances (i.e., the limit marking 66% of the desks displaying a minor difference between those illuminances. This difference is reflected by the vertical distance between the points and the unit slope line on the graphs in Figure 8). The RMSE values obtained from the simulations are as follows: 16.0 lx (A-005), 26.3 lx (A-016), 18.7 lx (A-038), and 33.7 lx (B-306). Bearing in mind that the above data show a difference between the simulated and measured data of 3.2% to 6.7% of the reference value of the recommended illuminance level, 500 lx [43], the accuracy of the simulation performed with DIALux® was assumed to be reasonable.
After studying the reasonable suitability of DIALux® simulations, 3 different case studies were proposed in order to improve the current situation:
  • Case 1: The proposal consists of painting the walls of the classrooms white. In this case, the luminaires (and lamps) and their distribution are maintained.
  • Case 2: Installation of new lamps (in the luminaires), using the same model as before, should increase their luminous flux. This improvement was programmed in DIALux® by applying a 0% attenuation value to all simulated control groups.
  • Case 3: Replacement of the current luminaires with a different model employing LED technology, PHILIPS SM134V PSD W20L120 1 xLED37S/840 OC, was chosen to maintain the current arrangement of the luminaires in order to simplify the installation process. Because of the project size, it was decided to choose a single luminaire model in order to achieve two fundamental advantages: to simplify maintenance and to reduce the investment by increasing the purchase volume and by possibly obtaining additional discounts. The following numbers of luminaires were used in each of the classrooms studied: 18 (A-005), 8 (A-016), 19 (A-038), and 17 (B-306). Most of the lamps currently installed (PHILIPS) have a luminous flux of 3350 lm. Since the aim is also to increase the current average illuminance value, it was decided to choose lamps with a higher luminous flux: 3700 lm. Because the ceilings in the building A classrooms are very high, it was advantageous to choose luminaires that can be hung (or installed directly on the ceiling, which is necessary in the building B classrooms due to their lower ceiling height). In addition, an “OC” diffuser was chosen. Regarding the color temperature of the luminaires, 4000 K was selected (current situation and recommended by the regulations). On the technical data sheet provided by the manufacturer, it should be emphasized that the color reproduction index is greater than or equal to 80, thus complying with European standards.
Table 2 includes the average and maximum illumination on the desks and blackboards in the selected classrooms for the cases studied, along with the maximum UGR glare values obtained in each case:
  • Current Case (represented by the experimental measures)
  • Current Case Simulation
  • Case 1 (change of paint on the walls)
  • Case 2 (replacement of the lamps using the same models)
  • and Case 3 (replacement of the lamps with LED models)
In addition and due to their special importance, Figure 9 shows the percentage distributions of the desks in the selected classrooms, classified according to their illuminance in cases 1, 2, and 3 and with regard to the initial case (current case simulation). The results of this study clearly indicate the need for a change in the lighting of the ETSIAE classrooms, as a real and true approach to the minimum conditions (500 lx) is not achieved unless the luminaires and lamps are replaced. More specifically, it can be said that changing the color of the walls and replacing the existing luminaires would both have positive effects but are not sufficient to provide adequate lighting for the classrooms. Therefore, for the purposes of the case study, changing the lighting technology is considered the best option in order to meet the standard [43] in the building A and B classrooms.
As it can be observed in Table 2, for the option chosen as the appropriate improvement action (case 3), the UGR or glare values are below the limits established by the UNE 12464-1, which means no further action is needed to comply with the standards in terms of glare.
However, if other options were to be implemented (as in case 2 for the B-306 classroom), technologies for glare reduction should be considered and tested via simulations in order to reduce the maximum UGR value to comply with the standards (maximum UGR value of 19). Such technologies include translucent or polarizing covers or reflectors to prevent light spreading horizontally. In addition, focusing on case 2 for the B-306 classroom, this particular case could be evaluated with some of the luminaires turned off, as there is a wide margin for illuminance reduction that could lead to meeting the glare standards.

4. Conclusions

This study analyzes the quality of the lighting in the classrooms at the Escuela Técnica Superior de Ingeniería Aeronáutica y del Espacio (ETSIAE) at the Universidad Politécnica de Madrid (UPM). The main motivation for this work is the lack of lighting maintenance and improvement on ETSIAE classrooms in the last decades. The work was carried out
  • by measuring the illuminance in a large number of classrooms from this faculty and
  • by simulation.
The results of measurements carried out in 39 classrooms of ETSIAE revealed deficient lighting in evening/night conditions.
Three possible improvements were studied:
  • white painting on the walls,
  • replacement of the existing luminaires with the same models, and
  • replacement of the existing luminaires with different models employing LED technology.
These improvements were analyzed using the simulation program DIALux® after performing a prior simulation of the current measured situation in order to calibrate/tune the attenuation of the lamps and to achieve the same lighting levels.
Analysis of the correlation between the results from the simulation and the data obtained from the measurements revealed acceptable results, showing the aforementioned method of tuning the lamp attenuation in the DIALux® software suitable for obtaining a simulation of the actual lighting situation for its use in improvement action evaluation.
The results clearly indicate that the current luminaires must be replaced with different ones in most of the classrooms from the oldest building of the faculty if compliance with current standards is to be ensured. In this sense, replacing the luminaires with others based on LED technology has proven to be the best option. According to the results from the selected classrooms, the average lighting over the desks can be improved from 133 lx (classroom A-005), 135 lx (classroom A-016), 129 lx (classroom A-038), and 295 lx (classroom B-306) to 536 lx, 614 lx, 506 lx, and 564 lx, respectively.
Future works that follow this study should focus on
  • improving the lighting analysis by using more sophisticated tools and procedures such as High Dynamic Range (HDR) imaging technology;
  • including daylight in the lighting analysis, as some classrooms might have glare problems at certain periods of the day; and
  • including new lighting design, as according to the new social situation caused by covid-19, classrooms might need to combine in-class and online teaching.
Finally, the importance of this study must be emphasized as it reveals a serious problem that could also exist at other UPM schools and faculties and at other Spanish universities.

Author Contributions

Conceptualization, S.P.; methodology, S.P.; software, M.Z.-S. and D.A.-C.; validation, M.Z.-S., S.P., and D.A.-C.; formal analysis, S.P. and D.A.-C.; investigation M.Z.-S.; data curation, M.Z.-S.; writing—original draft preparation, S.P. and D.A.-G.; writing—review and editing, S.P. and D.A.-G.; supervision, S.P. All authors have read and agreed to the published version of the manuscript.

Funding

This research received no external funding.

Acknowledgments

Authors are indebted to Tania Tate for her kind help with the style of the text. Authors are also grateful to the reviewers whose wise comments helped us in improving this work.

Conflicts of Interest

The authors declare no conflict of interest.

References

  1. De Giuli, V.; Zecchin, R.; Corain, L.; Salmaso, L. Measured and perceived environmental comfort: Field monitoring in an Italian school. Appl. Ergon. 2014, 45, 1035–1047. [Google Scholar] [CrossRef] [PubMed]
  2. Winterbottom, M.; Wilkins, A. Lighting and discomfort in the classroom. J. Environ. Psychol. 2009, 29, 63–75. [Google Scholar] [CrossRef]
  3. Mott, M.S.; Robinson, D.H.; Walden, A.; Burnette, J.; Rutherford, A.S. Illuminating the effects of dynamic lighting on student learning. SAGE Open 2012, 2. [Google Scholar] [CrossRef]
  4. Samani, S.A.; Samani, S.A. The Impact of Indoor Lighting on Students’ Learning Performance in Learning Environments: A knowledge internalization perspective University of Applied Sciences. Int. J. Bus. Soc. Sci. 2012, 3, 127–136. [Google Scholar]
  5. Barrett, P.; Davies, F.; Zhang, Y.; Barrett, L. The impact of classroom design on pupils’ learning: Final results of a holistic, multi-level analysis. Build. Environ. 2015, 89, 118–133. [Google Scholar] [CrossRef] [Green Version]
  6. Bluyssen, P.M.; Zhang, D.; Kurvers, S.; Overtoom, M.; Ortiz-Sanchez, M. Self-reported health and comfort of school children in 54 classrooms of 21 Dutch school buildings. Build. Environ. 2018, 138, 106–123. [Google Scholar] [CrossRef]
  7. Hui, S.C.M.; Cheng, K.K.Y. Analysis of Effective Lighting Systems for University Classrooms. In Proceedings of the Henan-Hong Kong Joint Symposium, Zhengzhou, China, 30 June–1 July 2008; pp. 53–64. [Google Scholar]
  8. Wang, R.; He, X.Y.; Liu, S.; Liu, L.C.; Liu, B.; Wang, Z.-S.; Yang, Y.; Yu, L. Investigation and analysis on the illumination of the university classroom. In Proceedings of the 5th International Conference on Machinery, Materials and Computing Technology 2017 (ICMMCT 2017), Beijing, China, 25–26 March 2017; Volume 126, pp. 430–438. [Google Scholar]
  9. Yang, Z.; Becerik-Gerber, B.; Mino, L. A study on student perceptions of higher education classrooms: Impact of classroom attributes on student satisfaction and performance. Build. Environ. 2013, 70, 171–188. [Google Scholar] [CrossRef]
  10. Castilla, N.; Llinares, C.; Bravo, J.M.; Blanca, V. Subjective assessment of university classroom environment. Build. Environ. 2017, 122, 72–81. [Google Scholar] [CrossRef] [Green Version]
  11. Castilla, N.; Llinares, C.; Bisegna, F.; Blanca-Giménez, V. Affective evaluation of the luminous environment in university classrooms. Build. Environ. 2018, 58, 52–62. [Google Scholar] [CrossRef]
  12. Ricciardi, P.; Buratti, C. Environmental quality of university classrooms: Subjective and objective evaluation of the thermal, acoustic, and lighting comfort conditions. Build. Environ. 2018, 127, 23–36. [Google Scholar] [CrossRef]
  13. Tahsildoost, M.; Zomorodian, Z. Indoor environment quality assessment in classrooms: An integrated approach. J. Build. Phys. 2018, 42, 1–27. [Google Scholar] [CrossRef]
  14. Yang, W.; Moon, H.J. Combined effects of acoustic, thermal, and illumination conditions on the comfort of discrete senses and overall indoor environment. Build. Environ. 2019, 148, 623–633. [Google Scholar] [CrossRef]
  15. Yildiz, Y.; Koçyiğit, M. Evaluation of indoor environmental conditions in university classrooms. Proc. Inst. Civ. Eng. Energy 2019, 172, 148–161. [Google Scholar] [CrossRef]
  16. Leccese, F.; Salvadori, G.; Rocca, M.; Buratti, C.; Belloni, E. A method to assess lighting quality in educational rooms using analytic hierarchy process. Build. Environ. 2020, 168, 106501. [Google Scholar] [CrossRef]
  17. Wu, H.; Wu, Y.; Sun, X.; Liu, J. Combined effects of acoustic, thermal, and illumination on human perception and performance: A review. Build. Environ. 2020, 169, 1–19. [Google Scholar] [CrossRef]
  18. Liang, Y.; Zhang, R.; Wang, W.; Xiao, C. Design of energy saving lighting system in university classroom based on wireless sensor network. Commun. Netw. 2013, 5, 55–60. [Google Scholar] [CrossRef] [Green Version]
  19. Dessi, V.; Fianchini, M. Lights and shadows in university classrooms. In Proceedings of the International Conference Arquitectonics Network: Architecture, Education and Society, Barcelona, Spain, 3–5 June 2015; Final papers. GIRAS. Universitat Politècnica de Catalunya. 2015; pp. 1–10. [Google Scholar]
  20. Wang, S. The view of classroom light design optimization simulation. In Proceedings of the International Conference on Information Sciences, Machinery, Materials and Energy (ICISMME 2015), Chongqing, China, 11–13 April 2015; pp. 1768–1772. [Google Scholar]
  21. Kamaruddin, M.A.; Arief, Y.Z.; Ahmad, M.H. Energy Analysis of Efficient Lighting System Design for Lecturing Room Using DIAlux Evo 3. Appl. Mech. Mater. 2016, 818, 174–178. [Google Scholar] [CrossRef]
  22. Sielachowska, M.; Tyniecki, D.; Zajkowski, M. Measurements of the Luminance Distribution in the Classroom Using the SkyWatcher Type System. In Proceedings of the 7th Lighting Conference of the Visegrad Countries (Lumen V4), Trebic, Czech Republic, 18–20 September 2018; Institute of Electrical and Electronics Engineers (IEEE): New York, NY, USA, 2018; pp. 1–5. [Google Scholar]
  23. Sathya, P.; Natarajan, R. Energy Estimation and Photometric measurements of LED lighting in Laboratory. In Proceedings of the 2014 International Conference on Advances in Electrical Engineering (ICAEE), Vellore, India, 9–11 January 2014; IEEE: New York, NY, USA, 2014; pp. 1–5. [Google Scholar]
  24. Bellia, L.; Spada, G.; Pedace, A.; Fragliasso, F. Methods to evaluate lighting quality in educational environments. Energy Procedia 2015, 78, 3138–3143. [Google Scholar] [CrossRef] [Green Version]
  25. Yacine, S.M.; Noureddine, Z.; Piga, B.E.A.; Morello, E.; Safa, D. Towards a new model of light quality assessment based on occupant satisfaction and lighting glare indices. Energy Procedia 2017, 122, 805–810. [Google Scholar] [CrossRef] [Green Version]
  26. Ochoa, C.E.; Aries, M.B.C.; Hensen, J.J. State of the art in lighting simulation for building science: A literature review. J. Build. Perform. Simul. 2012, 5, 209–233. [Google Scholar] [CrossRef] [Green Version]
  27. Baloch, A.A.; Shaikh, P.H.; Shaikh, F.; Leghari, Z.H.; Mirjat, N.H.; Uqaili, M.A. Simulation tools application for artificial lighting in buildings. Renew. Sustain. Energy Rev. 2018, 82, 3007–3026. [Google Scholar] [CrossRef]
  28. Fernandez-Prieto, D.; Hagen, H. Visualization and analysis of lighting design alternatives in simulation software. Appl. Mech. Mater. 2017, 869, 212–225. [Google Scholar] [CrossRef] [Green Version]
  29. Davoodi, A.; Johansson, P.; Laike, T.; Aries, M. Current Use of Lighting Simulation Tools in Sweden. In Proceedings of the 60th SIMS Conference on Simulation and Modelling SIMS 2019, Västerås, Sweden, 12–16 August 2019; Linkoping University Electronic Press: Linkoping, Sweden, 2020; pp. 206–211. [Google Scholar]
  30. Houser, K.W.; Tiller, D.K.; Pasini, I.C. Toward the accuracy of lighting simulations in physically based computer graphics software. J. Illum. Eng. Soc. 1999, 28, 117–129. [Google Scholar] [CrossRef]
  31. Maamari, F.; Fontoynont, M. Analytical tests for investigating the accuracy of lighting programs. Light. Res. Technol. 2003, 35, 225–239. [Google Scholar] [CrossRef]
  32. Maamari, F.; Fontoynont, M.; Tsangrassoulis, A.; Marty, C.; Kopylov, E.; Sytnik, G. Reliable datasets for lighting programs validation—benchmark results. Sol. Energy 2005, 79, 213–215. [Google Scholar] [CrossRef]
  33. Maamari, F.; Fontoynont, M.; Adra, N. Application of the CIE test cases to assess the accuracy of lighting computer programs. Energy Build. 2006, 38, 869–877. [Google Scholar] [CrossRef]
  34. Ibañez, C.A.; Zafra, J.C.G.; Sacht, H.M. Natural and artificial lighting analysis in a classroom of technical drawing: Measurements and HDR images use. Procedia Eng. 2017, 196, 964–971. [Google Scholar] [CrossRef]
  35. Pierson, C.; Wienold, J.; Jacobs, A. Luminance maps from High Dynamic Range imaging: Calibrations and adjustments for visual comfort assessment. In Proceedings of the 13th European Lighting Conference (Lux Europa 2017), Ljubjana, Slovenia, 18–20 September 2017; pp. 147–151. [Google Scholar]
  36. Cuttle, C. A new direction for general lighting practice. Light. Res. Technol. 2013, 45, 22–39. [Google Scholar] [CrossRef]
  37. Duff, J.; Kelly, K.; Cuttle, C. Spatial brightness, horizontal illuminance and mean room surface exitance in a lighting booth. Light. Res. Technol. 2017, 49, 5–15. [Google Scholar] [CrossRef] [Green Version]
  38. Duff, J.; Kelly, K.; Cuttle, C. Perceived adequacy of illumination, spatial brightness, horizontal illuminance and mean room surface exitance in a small office. Light. Res. Technol. 2016, 49, 133–146. [Google Scholar] [CrossRef] [Green Version]
  39. Hwang, T.; Kim, J.T. Effects of indoor lighting on occupants’ visual comfort and eye health in a green building. Indoor Built Environ. 2011, 20, 75–90. [Google Scholar] [CrossRef]
  40. Durmus, D.; Davis, W. Blur perception and visual clarity in light projection systems. Opt. Express 2019, 27, A216–A223. [Google Scholar] [CrossRef] [PubMed]
  41. Smith, A.K.; Sedgewick, J.R.; Weiers, B.; Elias, L.J. Is there an artistry to lighting? The complexity of illuminating three-dimensional artworks. Psychol. Aesthetics Creativity Arts 2019. [Google Scholar] [CrossRef]
  42. Faqih, F.; Zayed, T.; Soliman, E. Factors and defects analysis of physical and environmental condition of buildings. J. Build. Pathol. Rehabil. 2020, 5, 1–15. [Google Scholar] [CrossRef]
  43. Comité Europeo de Normalización. UNE-EN 12464.1: Iluminación. Iluminación de los Lugares de Trabajo. Parte 1: Lugares de Trabajo en Interiores; AENOR: Madrid, Spain, 2003. [Google Scholar]
Figure 1. Aerial view of Escuela Técnica Superior de Ingeniería Aeronáutica y del Espacio (ETSIAE): there are four buildings dedicated to teaching (A,B,C,E), and two buildings housing the library, laboratories, offices, cafeteria, and common areas (D,F). Source: Universidad Politécnica de Madrid.
Applsci 10 08345 g001
Figure 2. Diagram of the position and distribution of the points selected for illumination measurements on the blackboards (a) and desks (b) in the classrooms.
Applsci 10 08345 g002
Figure 3. Equipment used in the testing campaign: (a) CEM-DT 1308 lux meter, (b) DEXTER CM30 distance meter, and (c) measuring tape.
Applsci 10 08345 g003
Figure 4. Illuminance measurements on the desks and blackboard in one of the classrooms studied.
Applsci 10 08345 g004
Figure 5. Comparison between an actual image of classroom A-038 (a) and the simulation carried out using DIALux® software (b), and calculation points for the illuminance and Unified Glare Rating (UGR) in the DIALux® simulation of classroom A-016 (c).
Applsci 10 08345 g005
Figure 6. Pictures of classrooms A-005 (a), A-016 (b), A-038 (c), and B-306 (d) selected for this study as representative of all classrooms at the Escuela Técnica Superior de Ingeniería Aeronáutica y del Espacio (ETSIAE) at the Universidad Politécnica de Madrid (UPM).
Applsci 10 08345 g006
Figure 7. Percentage distribution of the individual desks with regard to the measured illuminance, Em, in the classrooms selected for this study (A-005, A-016, A-038, and B-306).
Applsci 10 08345 g007
Figure 8. Illuminances calculated by DIALux®, Edl, on each of the desks in classrooms A-005, A-016, A-038, and B-306, compared to the measurements taken in each case, Em: A line indicating the ideal simulation is included on each graph. The Root Mean Square Error (RMSE) of Edl in relation to Em is included in each graph.
Applsci 10 08345 g008
Figure 9. Distribution of desks by lighting levels and improvement cases (case 1, case 2, and case 3) from the initial illuminance levels in each of the selected classrooms.
Applsci 10 08345 g009
Table 1. Average illuminance measured on student desks, Emdk, and blackboards, Embd, in the ETSIAE classrooms studied: the table also includes the surface areas of these classrooms, A, and the number of desks, n.
ClassroomA
[m2]
nEmdk
[lx]
Embd
[lx]
ClassroomA
[m2]
nEmdk
[lx]
Embd
[lx]
A-003102.5736133212A-139399.22276182107
A-004103.536133251A-242455.22325304183
A-005103.5336133224BSS-02341.3224740794
A-006114.4342129236B-0038623356443
A-013103.5336138174B-0048632336145
A-01468.324148244B-00590.2132307339
A-015114.1542124205B-202196.4950662270
A-01631.210132112B-205146.9140759315
A-025103.5336134224B-30587.4032336429
A-026103.5336138224B-30686.9432293456
A-027104.437145195B-31987.4032338404
A-02974.8819163271B-32487.4032350473
A-036105.0236218439E-00469.4415688458
A-03766.7519146203E-00569.7615744593
A-038111.5942132246E-00636.808987787
A-03931.1610188142E-10467.5216907780
A-113105.1724299373E-10569.7616913764
A-114104.1724309336E-10770.0816759571
A-115114.3339134206E-303323.13180875987
A-120102.9637150188-----
Table 2. Average and maximum illuminance on the desks (Eav,dk and Emax,dk) and blackboards (Eav,b and Emax,b) in the classrooms studied in the following cases: current (measured by lux meter), current case simulation by DIALux®, case 1, case 2, and case 3. The average and maximum UGR glare values obtained in the simulations have been also included.
ClassroomEav,dk [lx]Emax,dk [lx]Eav,b [lx]Emax,b [lx]UGR
(Average)
UGR
(max)
Current
Case
A-005133168224242--
A-016112152112120--
A-038132166246275--
B-306293478456509--
Current
Case
Simulation
A-0051331872222372425
A-0161351571131181820
A-0381292052432562425
B-3062955094675012123
Case 1A-0051482022352492324
A-0161521761261321719
A-0381412182542652325
B-3063115314835202123
Case 2A-0053044034314512325
A-0162133403543602325
A-0382673724134402325
B-306973108897410442224
Case 3A-0055366985707951319
A-0166146865936961619
A-0385068095557451419
B-3065648555275811519
Publisher’s Note: MDPI stays neutral with regard to jurisdictional claims in published maps and institutional affiliations.

